Article

Removal Mechanism of Mineral Impurities in Molybdenum Concentrate Treatment Process

1
School of Metallurgical Engineering, Xi’an University of Architecture and Technology, Xi’an 710055, China
2
Metallurgical Engineering Technology Research Center of Shaanxi Province, Xi’an 710055, China
3
Technical Centre, Jinduicheng Molybdenum Co., Ltd., Xi’an 710077, China
*
Author to whom correspondence should be addressed.
Minerals 2023, 13(1), 35; https://doi.org/10.3390/min13010035
Submission received: 26 October 2022 / Revised: 23 December 2022 / Accepted: 23 December 2022 / Published: 26 December 2022
(This article belongs to the Section Mineral Processing and Extractive Metallurgy)

Abstract

:
The removal of impurities in molybdenum concentrate has become a new challenge for enterprises due to the cancellation of pickling. Whether impurity minerals can be converted into soluble ions during roasting is important for the impurity removal by current water washing. In this work, the interaction between various impurity elements in the treatment process of molybdenum concentrate was studied by process simulation experiments combined with X-ray fluorescence (XRF) and X-ray diffraction (XRD), inductively coupled plasma-optical emission spectrometer (ICP-OES), ion chromatography (IC), scanning electron microscope-energy dispersive spectrometry (SEM-EDS), the use of FactSage7.0 modeling and the mineral liberation analyzer (MLA). The results show that most of the impurity elements such as K, Si and Al exist in the form of alkaline minerals with large molecular weight. In the roasting process of molybdenum concentrate, K-containing minerals, such as muscovite and orthoclase, can be transformed into K+, Al3+ and other soluble ions, and then can be removed by water washing. Humidification increased the conversion degree of orthoclase to soluble ions, which was conducive to the removal of impurities by the washing process. The results of MLA microscopic analysis confirmed that impurities such as FeS2, CaSO4, SiO2, and especially FeS2, would form a high density mixture with MoO3 during the high temperature roasting process, and thus reduced the leaching rate of Mo. Therefore, the humidification and control of the molybdenum concentrate is an effective measure to remove impurities.

1. Introduction

Molybdenum is a metal with a high melting point, high wear resistance and good electrical and thermal conductivity, which is widely used in alloys, electrodes, catalysts, composite materials and other fields [1,2]. Impurity elements such as K, Si and Al have a serious impact on the quality of molybdenum products. In recent years, enterprises have paid more and more attentions to the content of impurities, especially K, in molybdenum products. When the potassium content of industrial grade molybdenum trioxide exceeds 1000–1500 mg/kg, it is unsuitable for use in special raw materials such as catalysts and reducing agents for petrochemical and organic synthesis. It is also ineffective for making alkaloid reagents and organic synthesis intermediates directly [3,4,5]. Under high temperature and high pressure, potassium impurities in the target material of very large scale integration circuit (VLSI) and liquid crystal display (LCD) are easily broken down and become defective pixels, affecting their service life [6,7,8,9].
The actual production process showed that in ammonium molybdate solution with molybdenum content greater than 250 g/L, the quality of ammonium molybdate produced by controlling potassium content to less than 60 mg/L was basically acceptable, but potassium content in actual production was usually more than 100 mg/L [10,11,12,13]. In addition, Ca, Fe, Si, Na and other impurity elements also affect the extraction of Mo and the content of K in the product during ammonium molybdate production. Therefore, it is necessary to study the thermodynamic behavior and solubility changes of typical impurity elements during ammonium molybdate production.
Pickling molybdenum calcine can effectively remove impurity elements such as K, Si, Na etc., however the pickling liquid leads to Mo loss and is difficult to treat to prevent it from causing environmental harm. Using this method to remove impurities in production is currently prohibited in China [14,15,16]. Presently, the major method for removing impurity elements during ammonium molybdate manufacturing is to wash calcined molybdenum concentrate with water; this approach is good for the removal of soluble ions. Production showed that impurities, especially K, in the ammonium molybdate product were mainly released from the water-insoluble potassium minerals [17]. Therefore, being able to convert impurity elements into water-soluble ionic forms in the roasting process is very important for the production of low potassium and high purity molybdenum products [18,19,20,21,22].
Wang et al. [23] studied the effect of impurity elements such as Ca, Fe, Al, etc., on the sintering phenomenon of molybdenum concentrate during the roasting process. In order to improve the quality of molybdenite, Tumen-Ulzii et al. [24] studied the selective dissolution of copper and iron by acidic sodium nitrate for molybdenite concentrate containing chalcopyrite and pyrite leached. Wang et al. [25] proposed that the agglomeration of molybdenite is often accompanied by caking in the process of oxidation roasting, and reducing the content of impurity elements such as Fe can effectively reduce the occurrence of agglomeration. However, there is still no report on whether particle size affects the removal of impurity elements or the Mo extraction. In addition, traditional methods such as X-ray diffraction (XRD), scanning electron microscope-energy dispersive spectrometer (SEM-EDS), X-ray photoelectron spectroscopy (XPS) etc., have been used in most studies to analyze the effect of impurity elements on the Mo leaching process [26]. The impurity elements mostly exist in the form of minerals such as muscovite, orthoclase, pyrite, quartz, etc. This is actually not completely consistent with the geological survey results of molybdenum ore, mainly because the content of potassium minerals in molybdenum concentrate is very low (10−3~10−5), which cannot be quantitatively analyzed by these analytical methods. Therefore, more advanced analytical methods are needed to analyze the transformation mechanism of impurity minerals.
Mineral liberation analyzer (MLA) technology, which contains a high-speed automatic mineral parameter analysis system, is mainly used for the quantitative analysis of phases in geoscience, mining and other fields [27]. There is no report on the application of MLA technology to the analysis of impurity minerals in the production process of ammonium molybdate. Based on the combination of advanced MLA quantitative analysis results and the Factsage software, this work analyzes the interaction and thermodynamic behavior of impurity elements in the roasting process of molybdenum concentrate. The results provide theoretical support for the production of low potassium and high purity molybdenum products.

2. Experimental Method

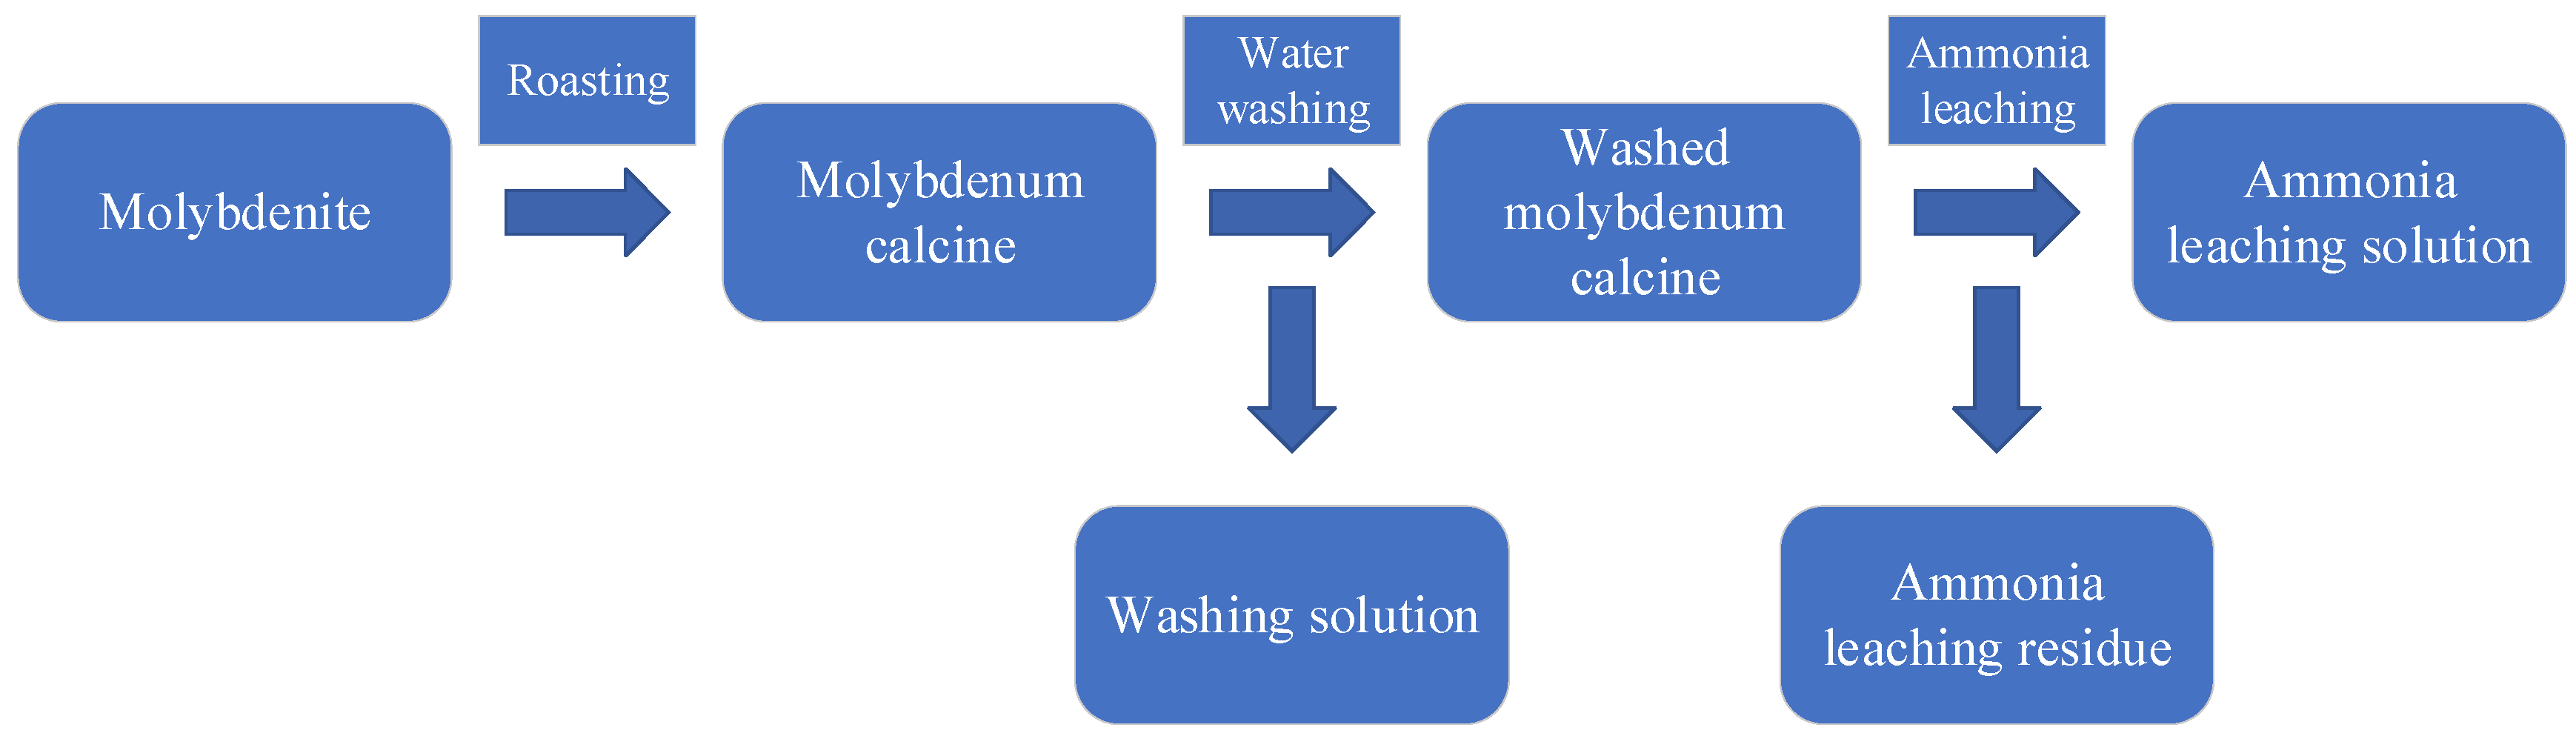
2.1. Experiment of Roasting-Water Washing-Ammonia Leaching

The molybdenum concentrate used in this experiment came from a molybdenum processing enterprise in Shaanxi, China. Molybdenum concentrate with different particle sizes was processed by simulating the production process of ammonium molybdate (as shown in Figure 1). The molybdenum concentrate was screened at 48 μm, 75 μm and 106 μm. The screened molybdenum concentrate was divided into coarse molybdenum concentrate with size range 75~106 μm and fine molybdenum concentrate with size range 48~75 μm. Unscreened molybdenum concentrate, coarse molybdenum concentrate and fine molybdenum concentrate of the same mass (100 g) were each roasted in a tube furnace with atmosphere control.
The heating rate was controlled at 10 °C/min in the simulation of the actual production process. When the temperature reached 580 °C, it was kept for 4 h. After roasting, the calcined samples were cooled by natural cooling. Then, the samples were soaked in distilled water with liquid-solid ratio of 5:4 at room temperature for 1 h. After that, the samples were collected on filter paper, and put into the electric blast air constant temperature drying oven at 110 °C for 4 h. Finally, the ammonia leaching experiment was carried out on the dried molybdenum calcine. Samples were taken from each of the dried products and placed into beakers. Ammonia solution with a concentration of 28% (w/w) was added with a liquid-solid ratio of 3:1, and the ammonia leaching residue was filtered after soaking for 250 min. The mass of samples before and after roasting, washing and ammonia leaching was recorded.
The experiment to examine humidification of molybdenum concentrate during roasting was also carried out in a tube furnace. The molybdenum concentrate sample was heated at the rate of 10 °C/min; when the temperature reached 580 °C, it was kept for 3.5 h. Then the roasting temperature was set to 500 °C, water vapor and air were mixed in a ratio of 1:2 and passed into the tube furnace. Finally, the samples were slowly cooled and removed to be soaked in 200 mL deionized water for 5 h and then filtered and dried. After drying, the contents of impurity elements and compounds were determined by X-ray fluorescence spectrometry (XRF: ZSX100e, Rigaku Corporation, Akishima-shi, Japan) and mineral liberation analyser (MLA, Bruker, Massachusetts, The United States of America).

2.2. Chemical Composition Analysis of Different Products

10 g of the molybdenum concentrate, molybdenum calcine, washed molybdenum calcine and ammonia leaching residue produced as described in Section 2.1 were taken and ground in a mortar to pass 75 μm. The ion contents of these samples were determined by inductively coupled plasma-optical emission spectrometry (ICP-OES: Aglient 5110, Agilent Technologies Inc., Santa Clara, CA, USA), ion chromatography (IC: ICS-1100, DIONEX, Sunnyvale, CA, USA) and the chemical composition was analyzed by X-ray fluorescence spectrometry (XRF: ZSX100e, Rigaku Corporation, Akishima-shi, Japan).

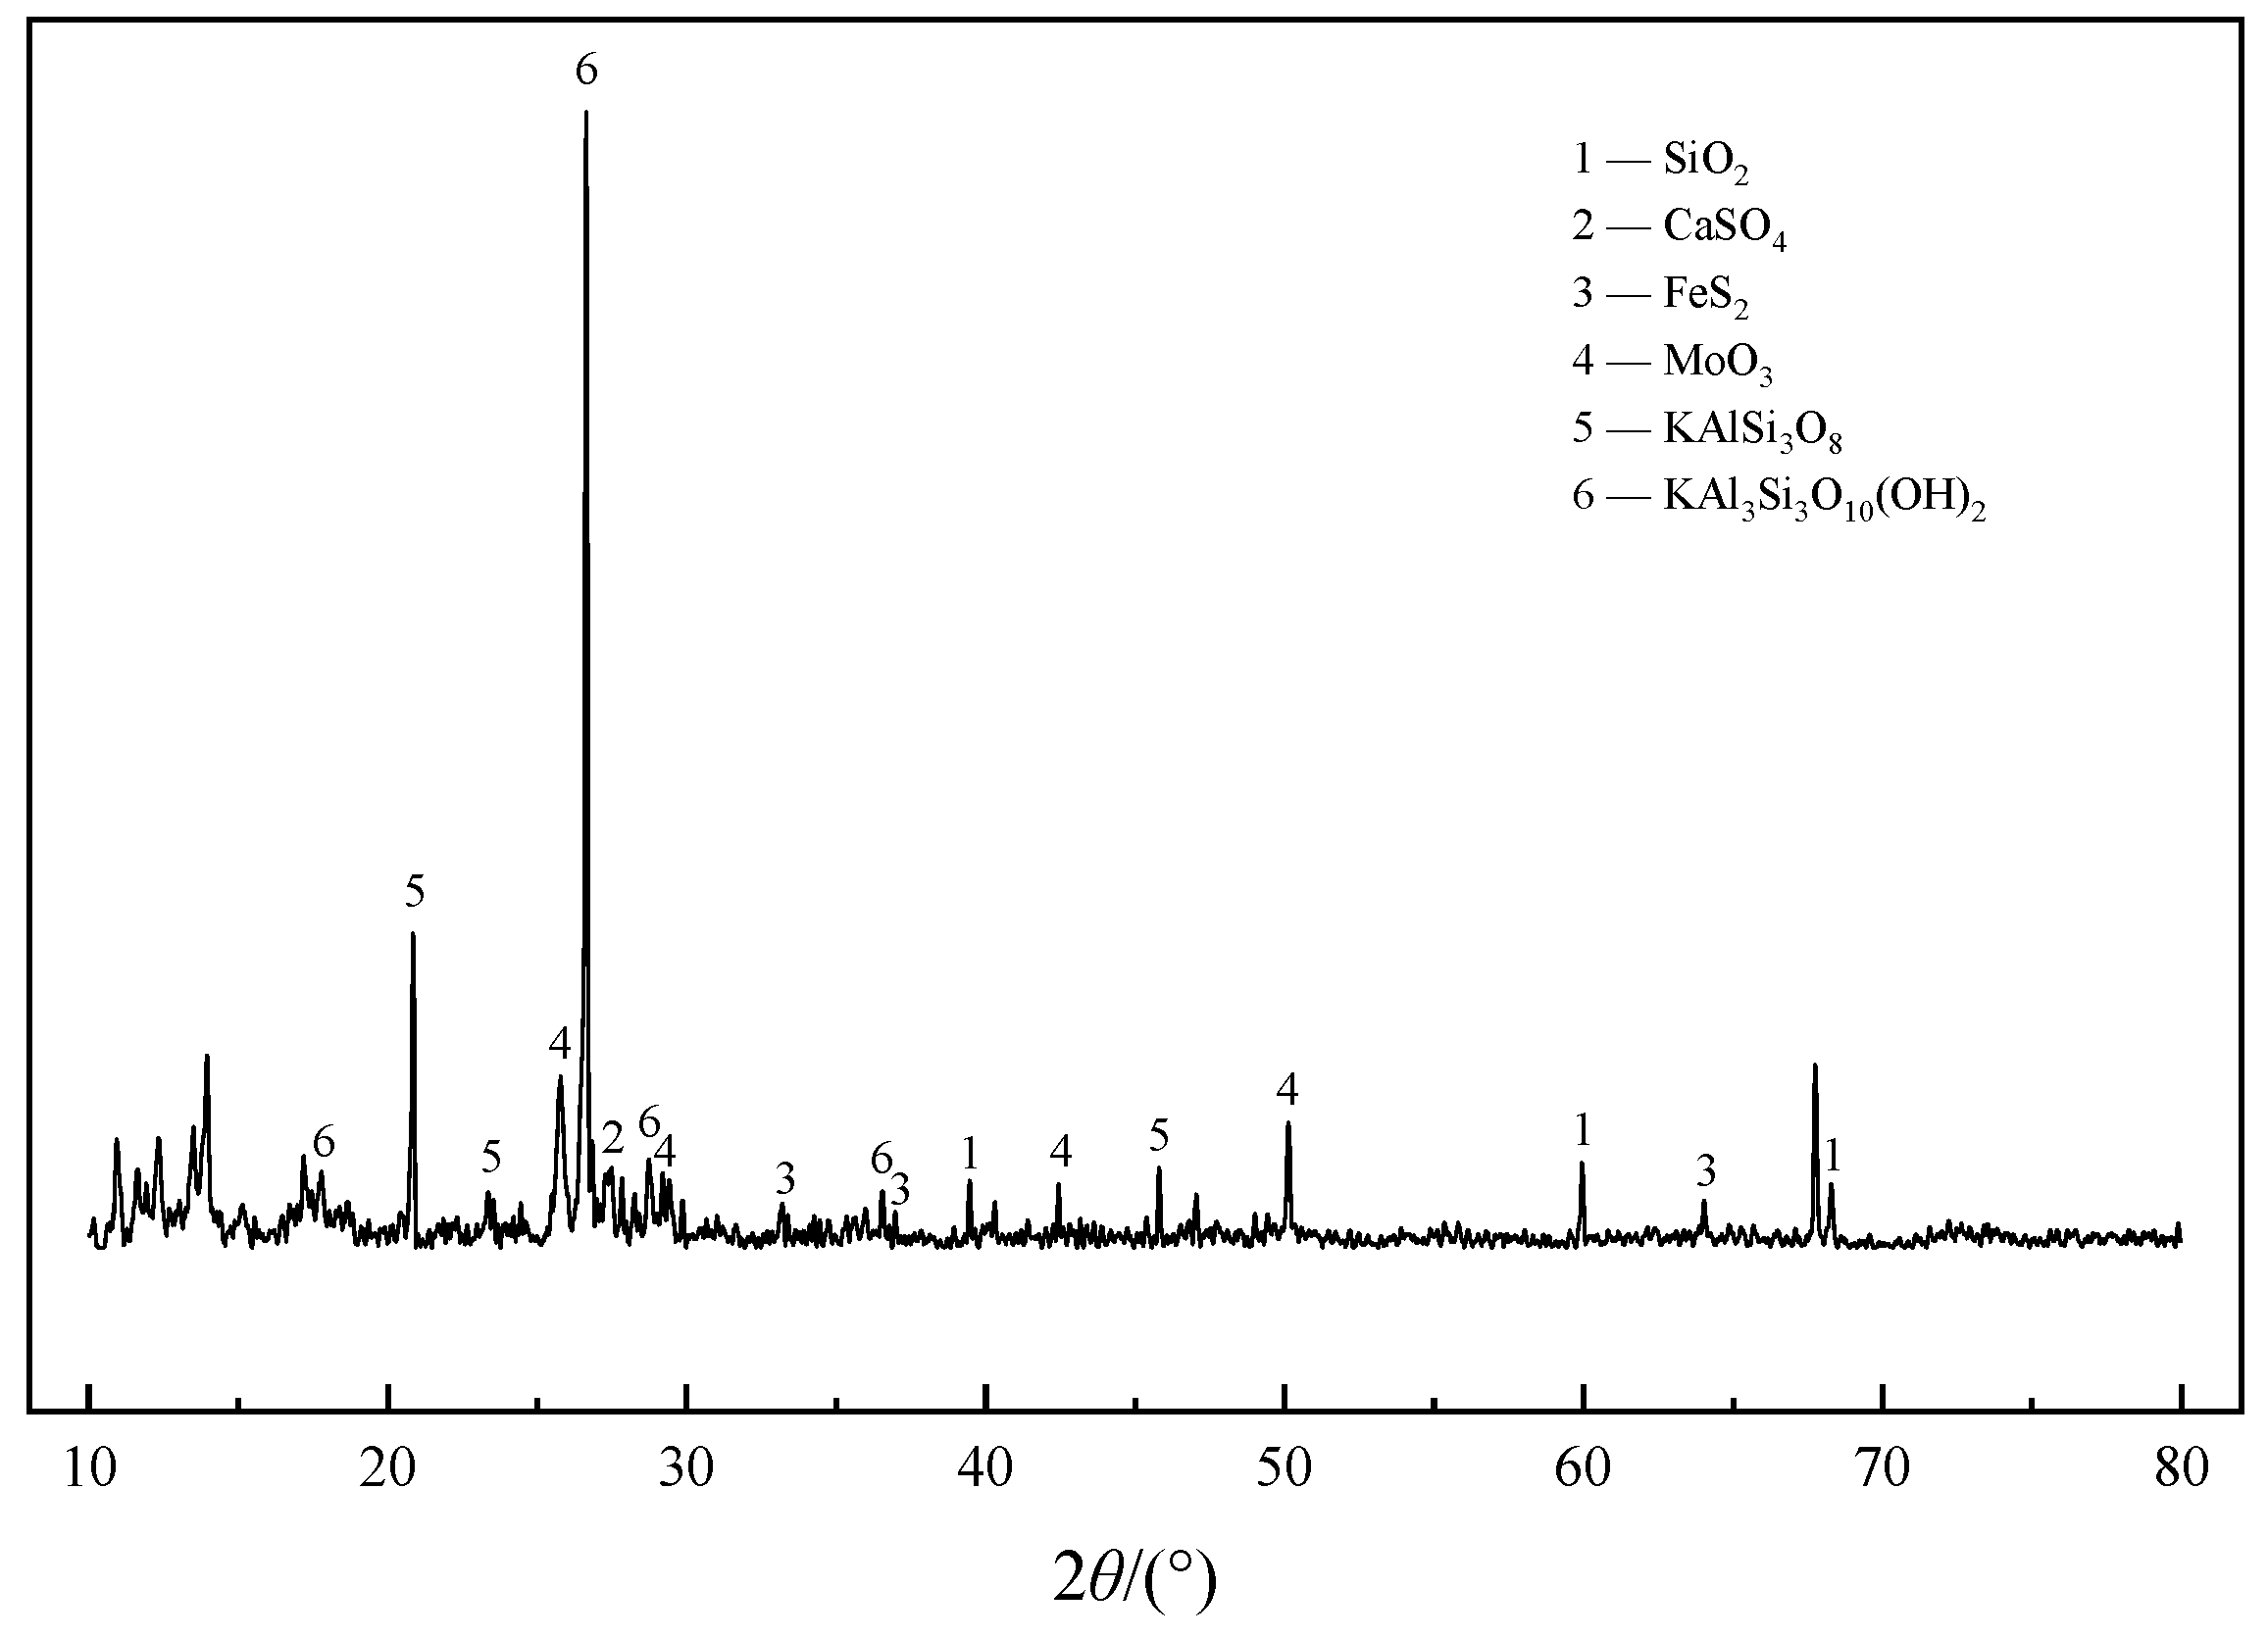
2.3. Phase Analysis of Different Products

The phases present in the product samples were analyzed by XRD (X’Pert Pro MPD, PANalytical B.V., Heracles Almelo, Almelo, The Netherlands), SEM-EDS (JSM-5610LV, JEOL, Akishima-shi, Japan) and mineral liberation analyzer (MLA, Bruker, Massachusetts, The United States of America). The working distance of SEM-EDS was 4.94 μm, the test magnification was 10 kx, the measurement was 10 μm, the voltage was 10 keV, and the field of view was 12.7 μm. The MLA system was composed of scanning electron microscope (Sigma 300, Carl Zeiss AG, Oberkochen, Germany), Bruker's energy spectrometer (Quantax 400, Bruker, MA, The USA) and Bruker’s AMICS mineral analysis software (ESPRIT 1.9). The test temperature was 24 °C, the voltage was 20 kV, and the scanning resolution was 1.12 μm.

3. Results and Discussion

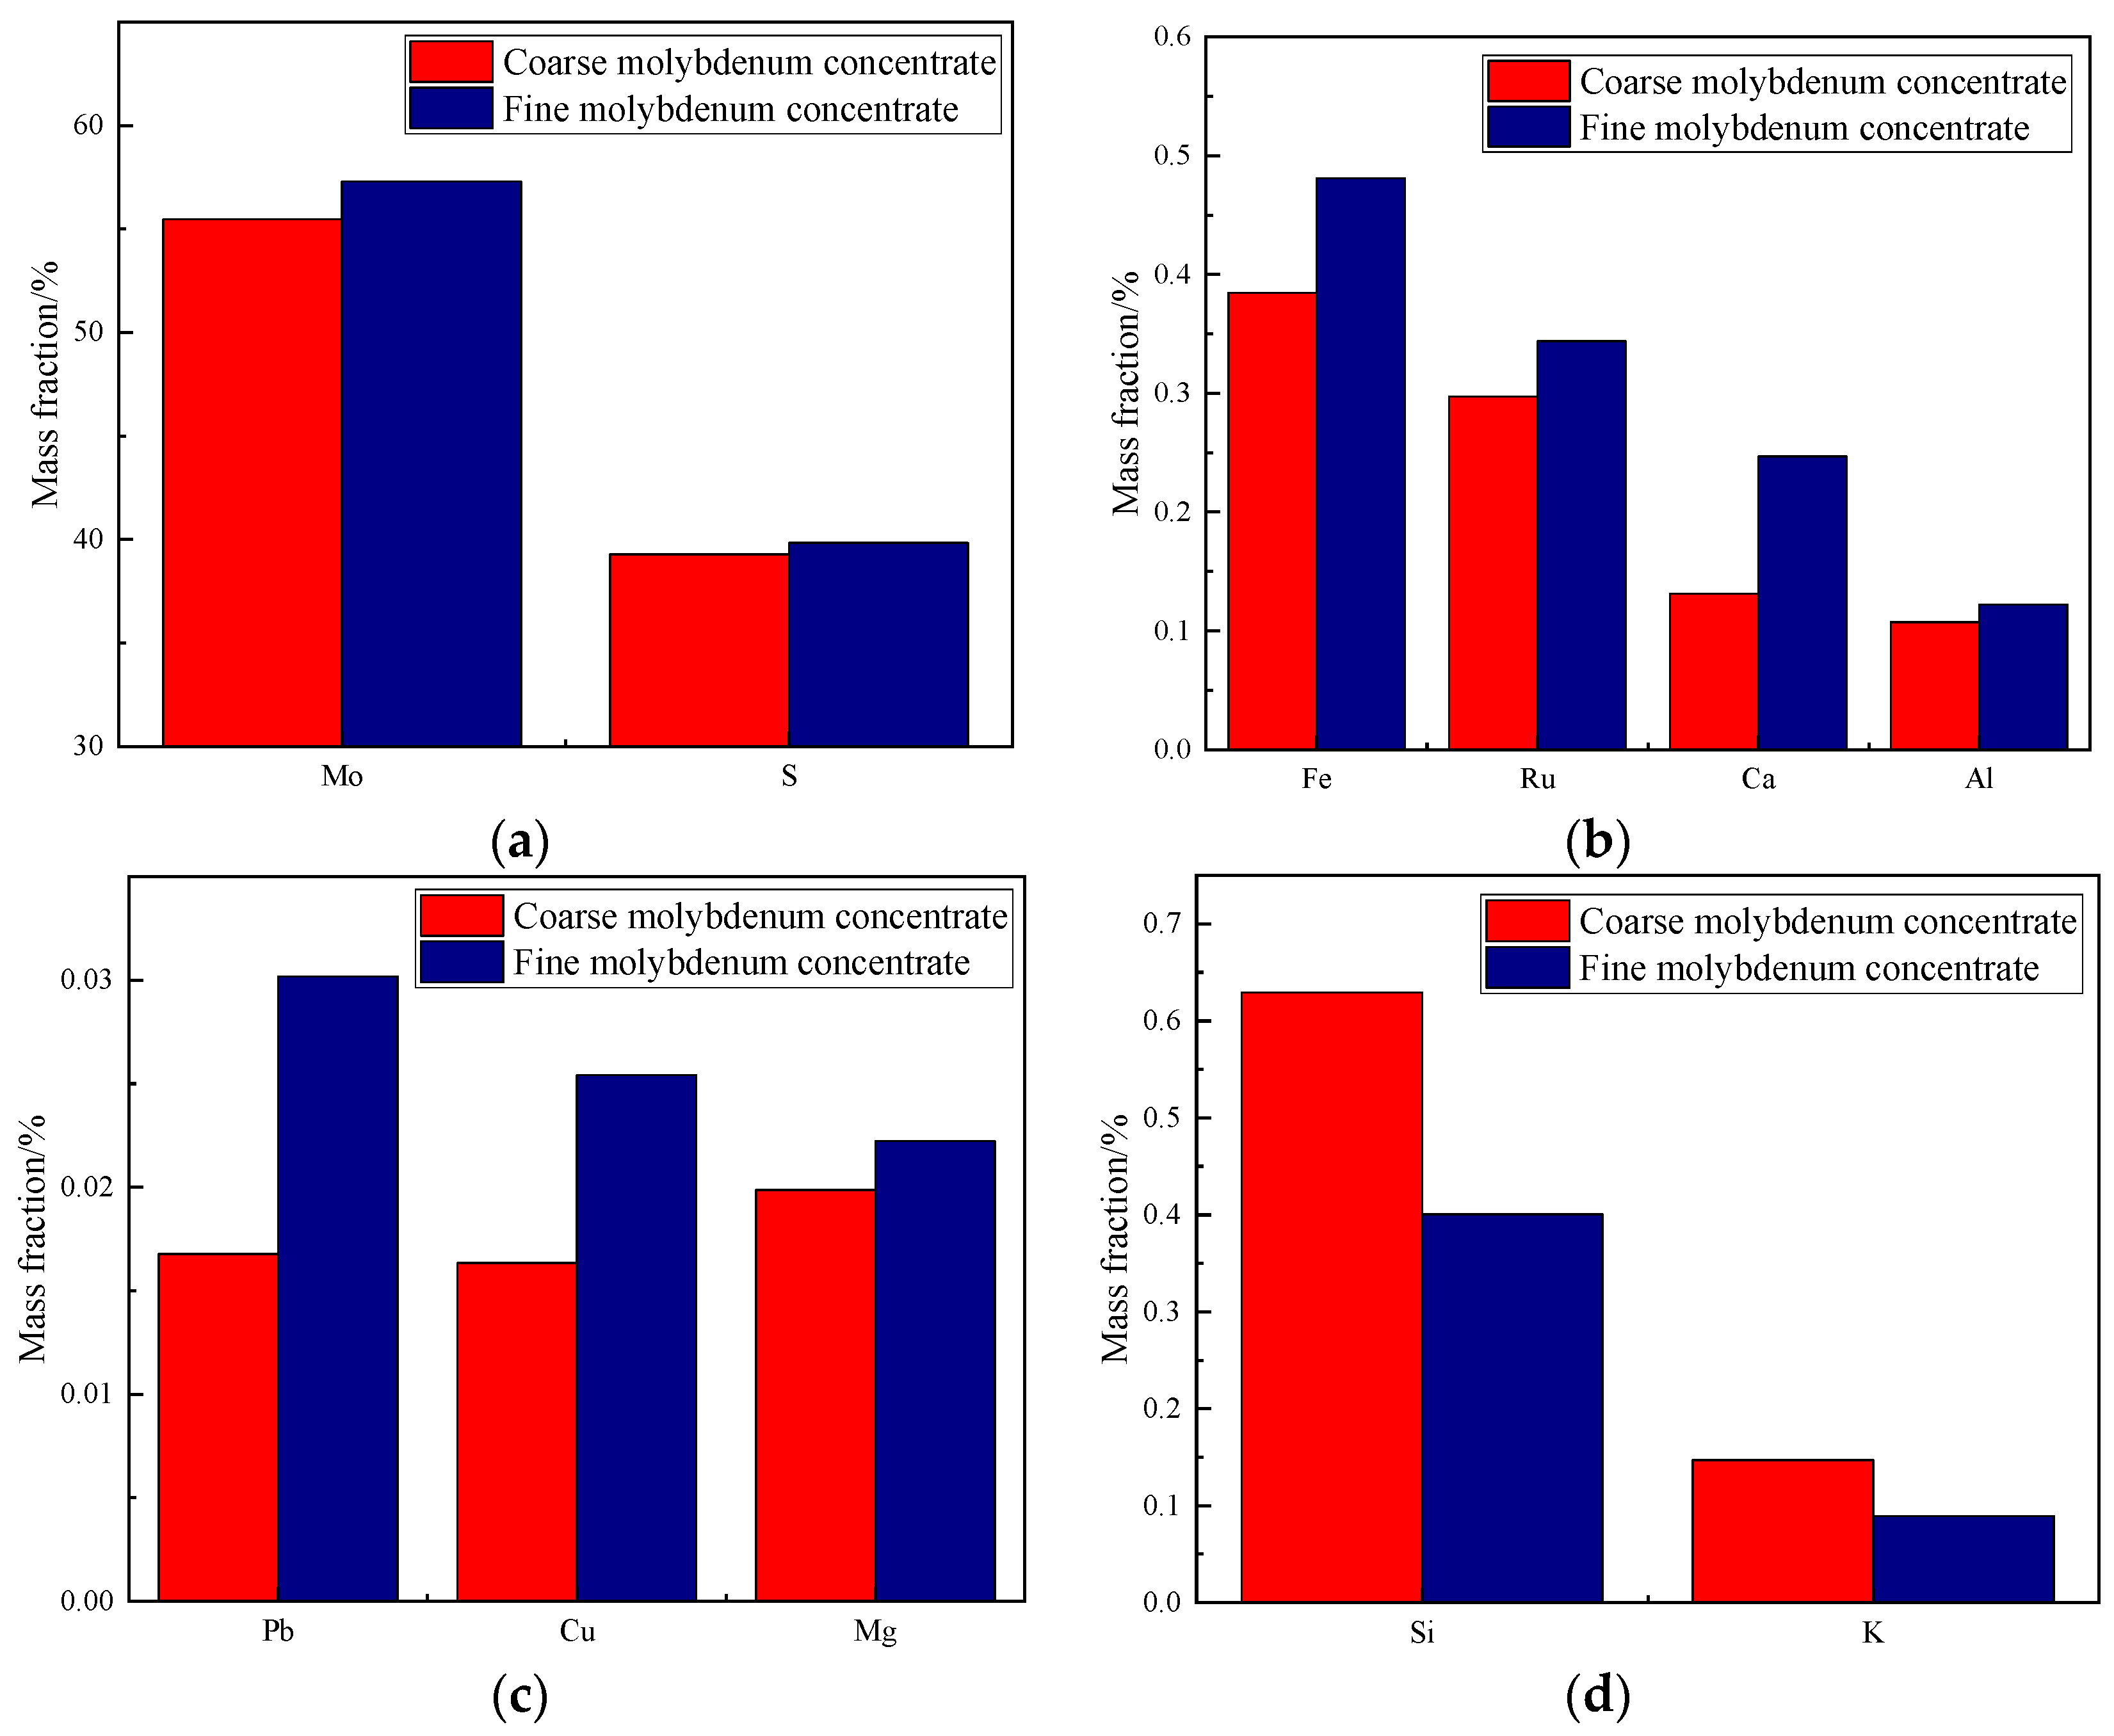
3.1. Main Elements in Molybdenum Concentrates with Different Particle Sizes

From the screening of concentrate as described in Section 2.1, the weight of finer molybdenum concentrates from 48 μm to 75 μm accounts for about 70% of the material in the 48 μm to 106 μm range. The contents of the main elements in the two samples are shown in Figure 2.
The main component of molybdenum concentrate is MoS2. According to the mass fraction of molybdenum and sulfur in Figure 2, it can be seen that the ratio of sulfur is still surplus after MoS2 is fully proportioned with molybdenum, which suggests the presence of other sulfur-containing minerals. It can also be seen from Figure 2 that MoS2 in molybdenum concentrate mainly exists in the finer particle size fraction, and metal impurities in fine molybdenum concentrate are significantly more, while potassium and silicon contents in coarse molybdenum concentrate are slightly higher than those in fine molybdenum concentrate.

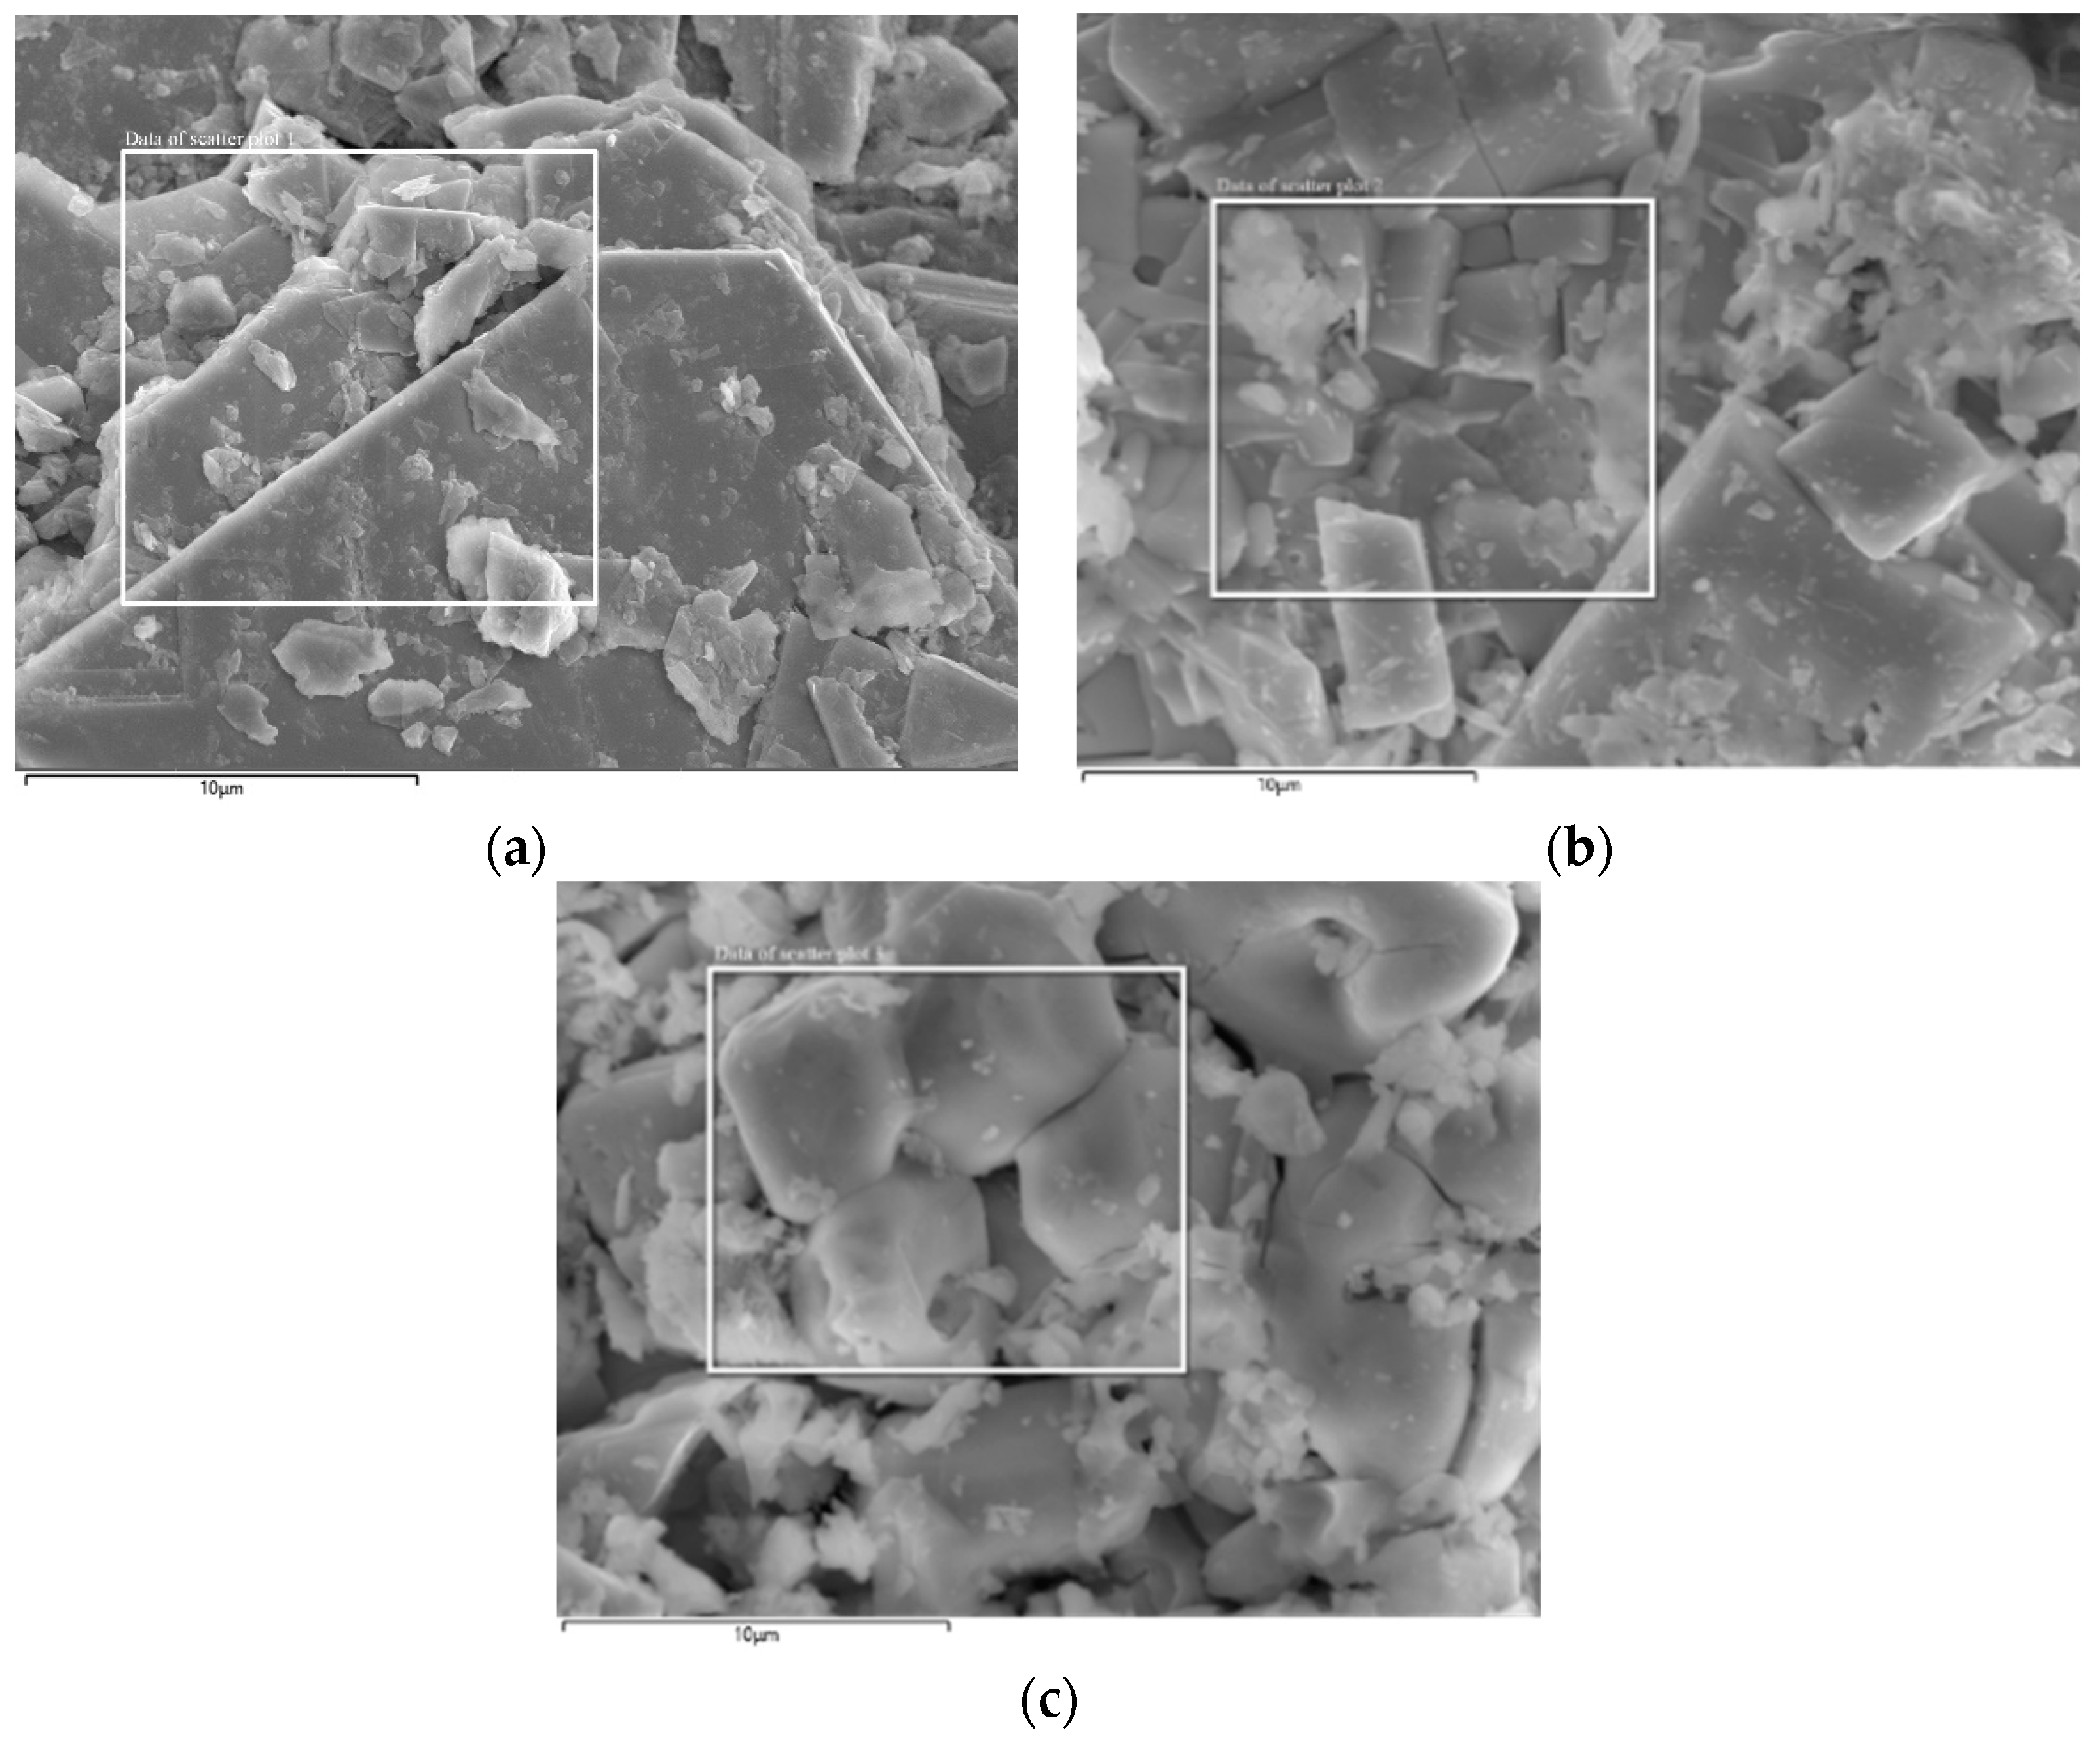
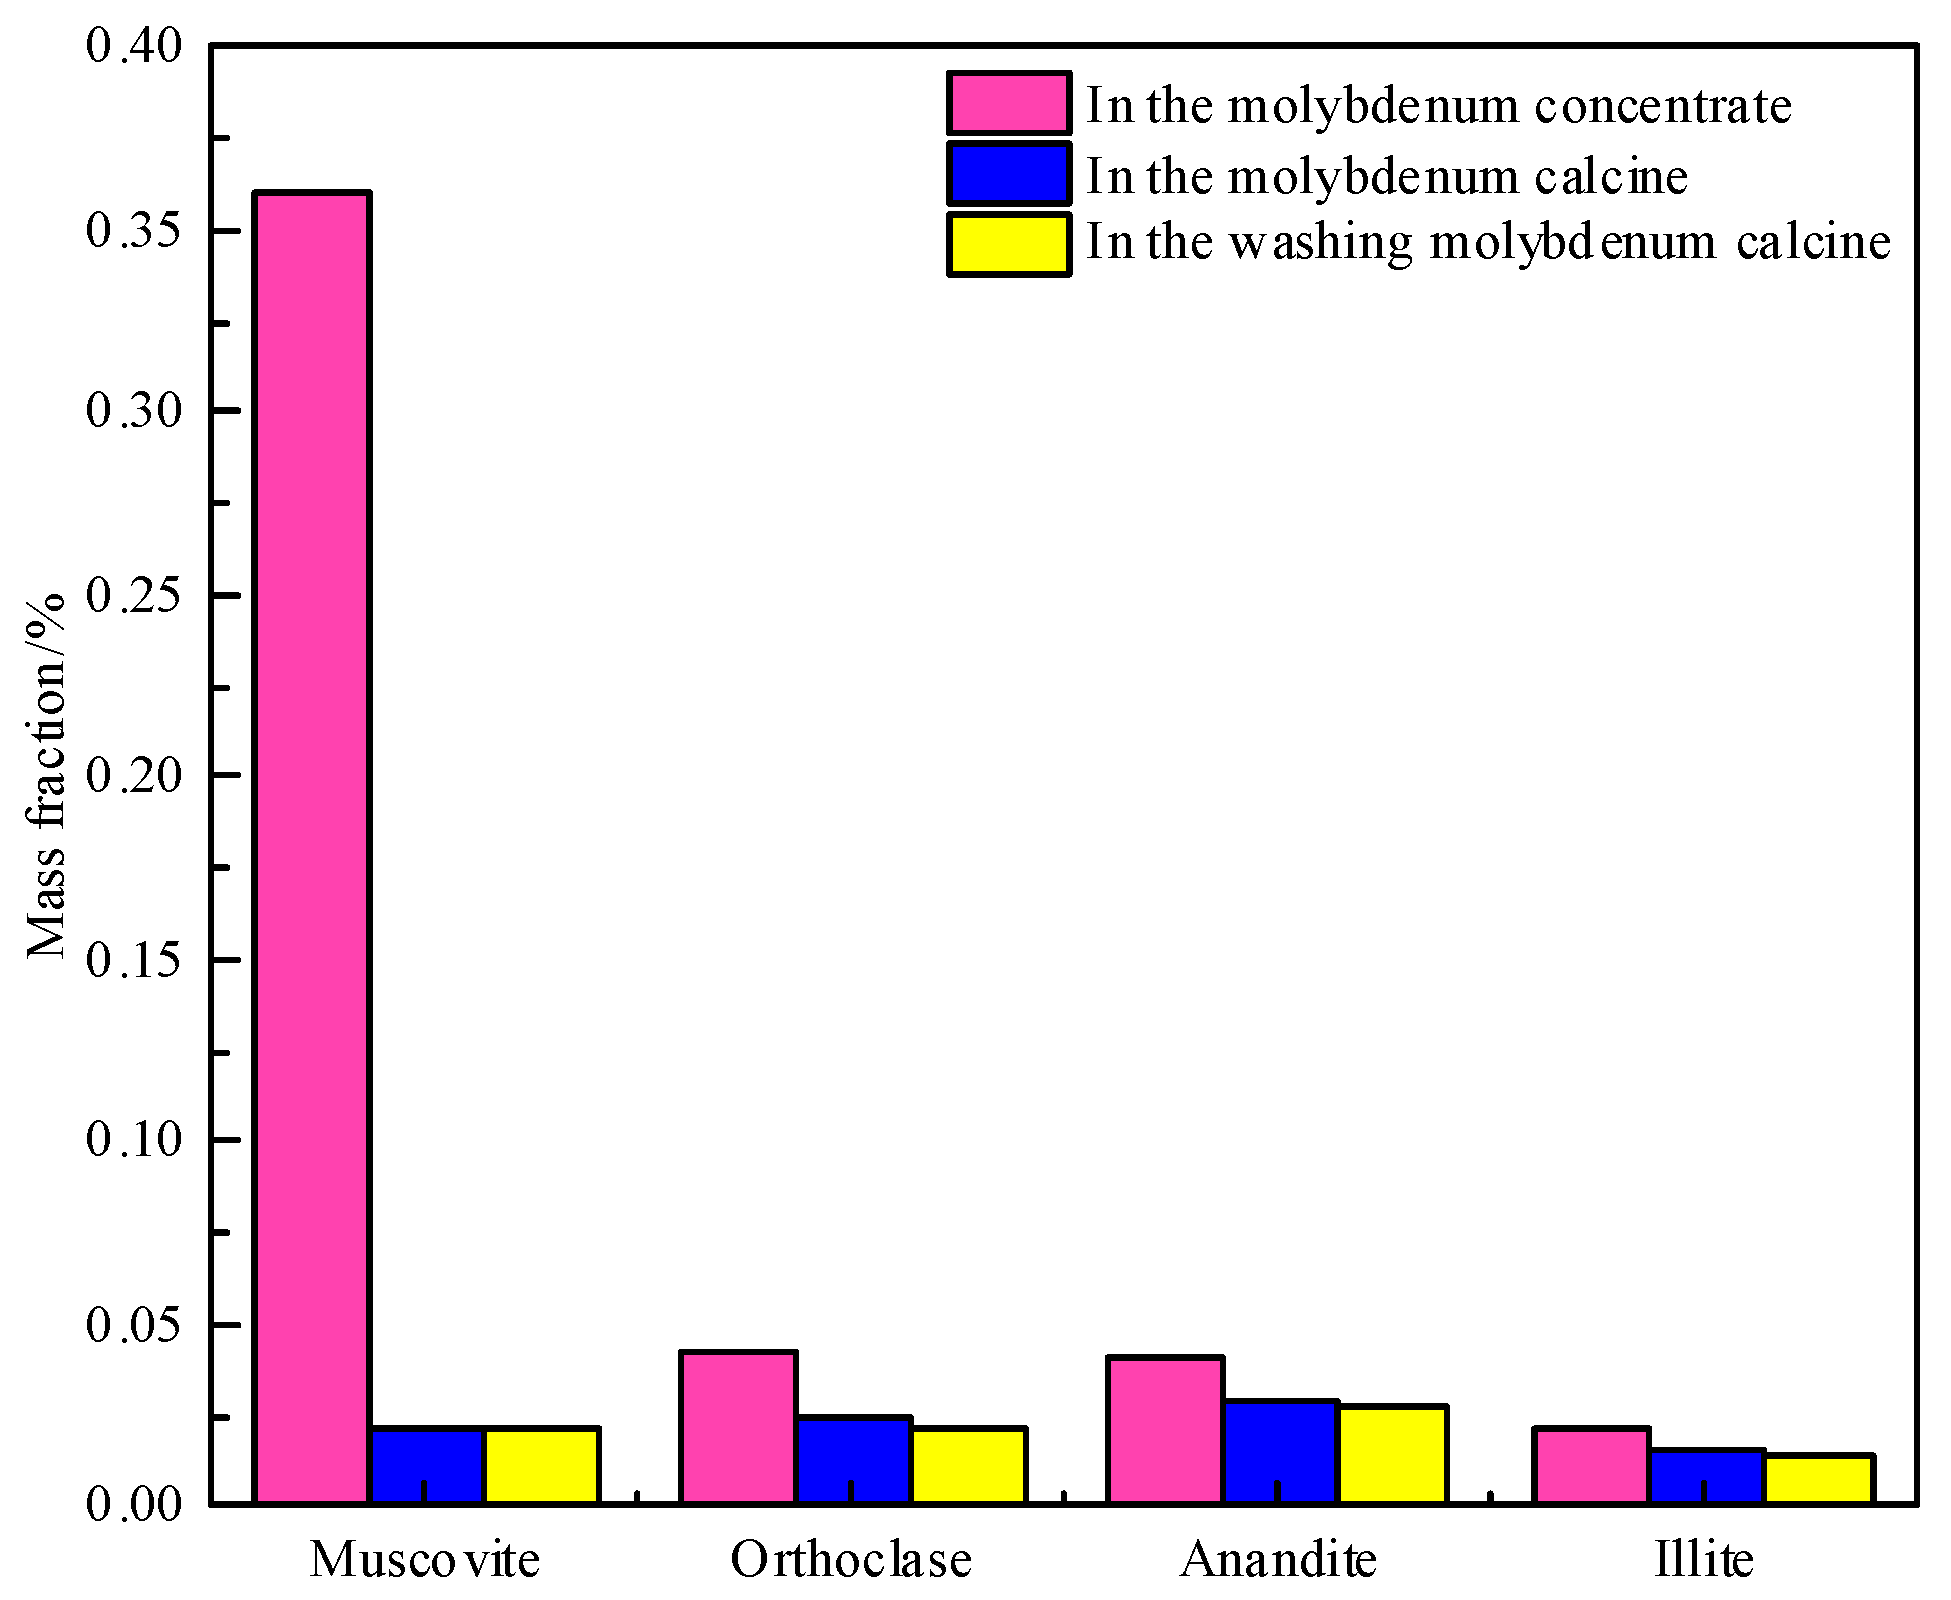
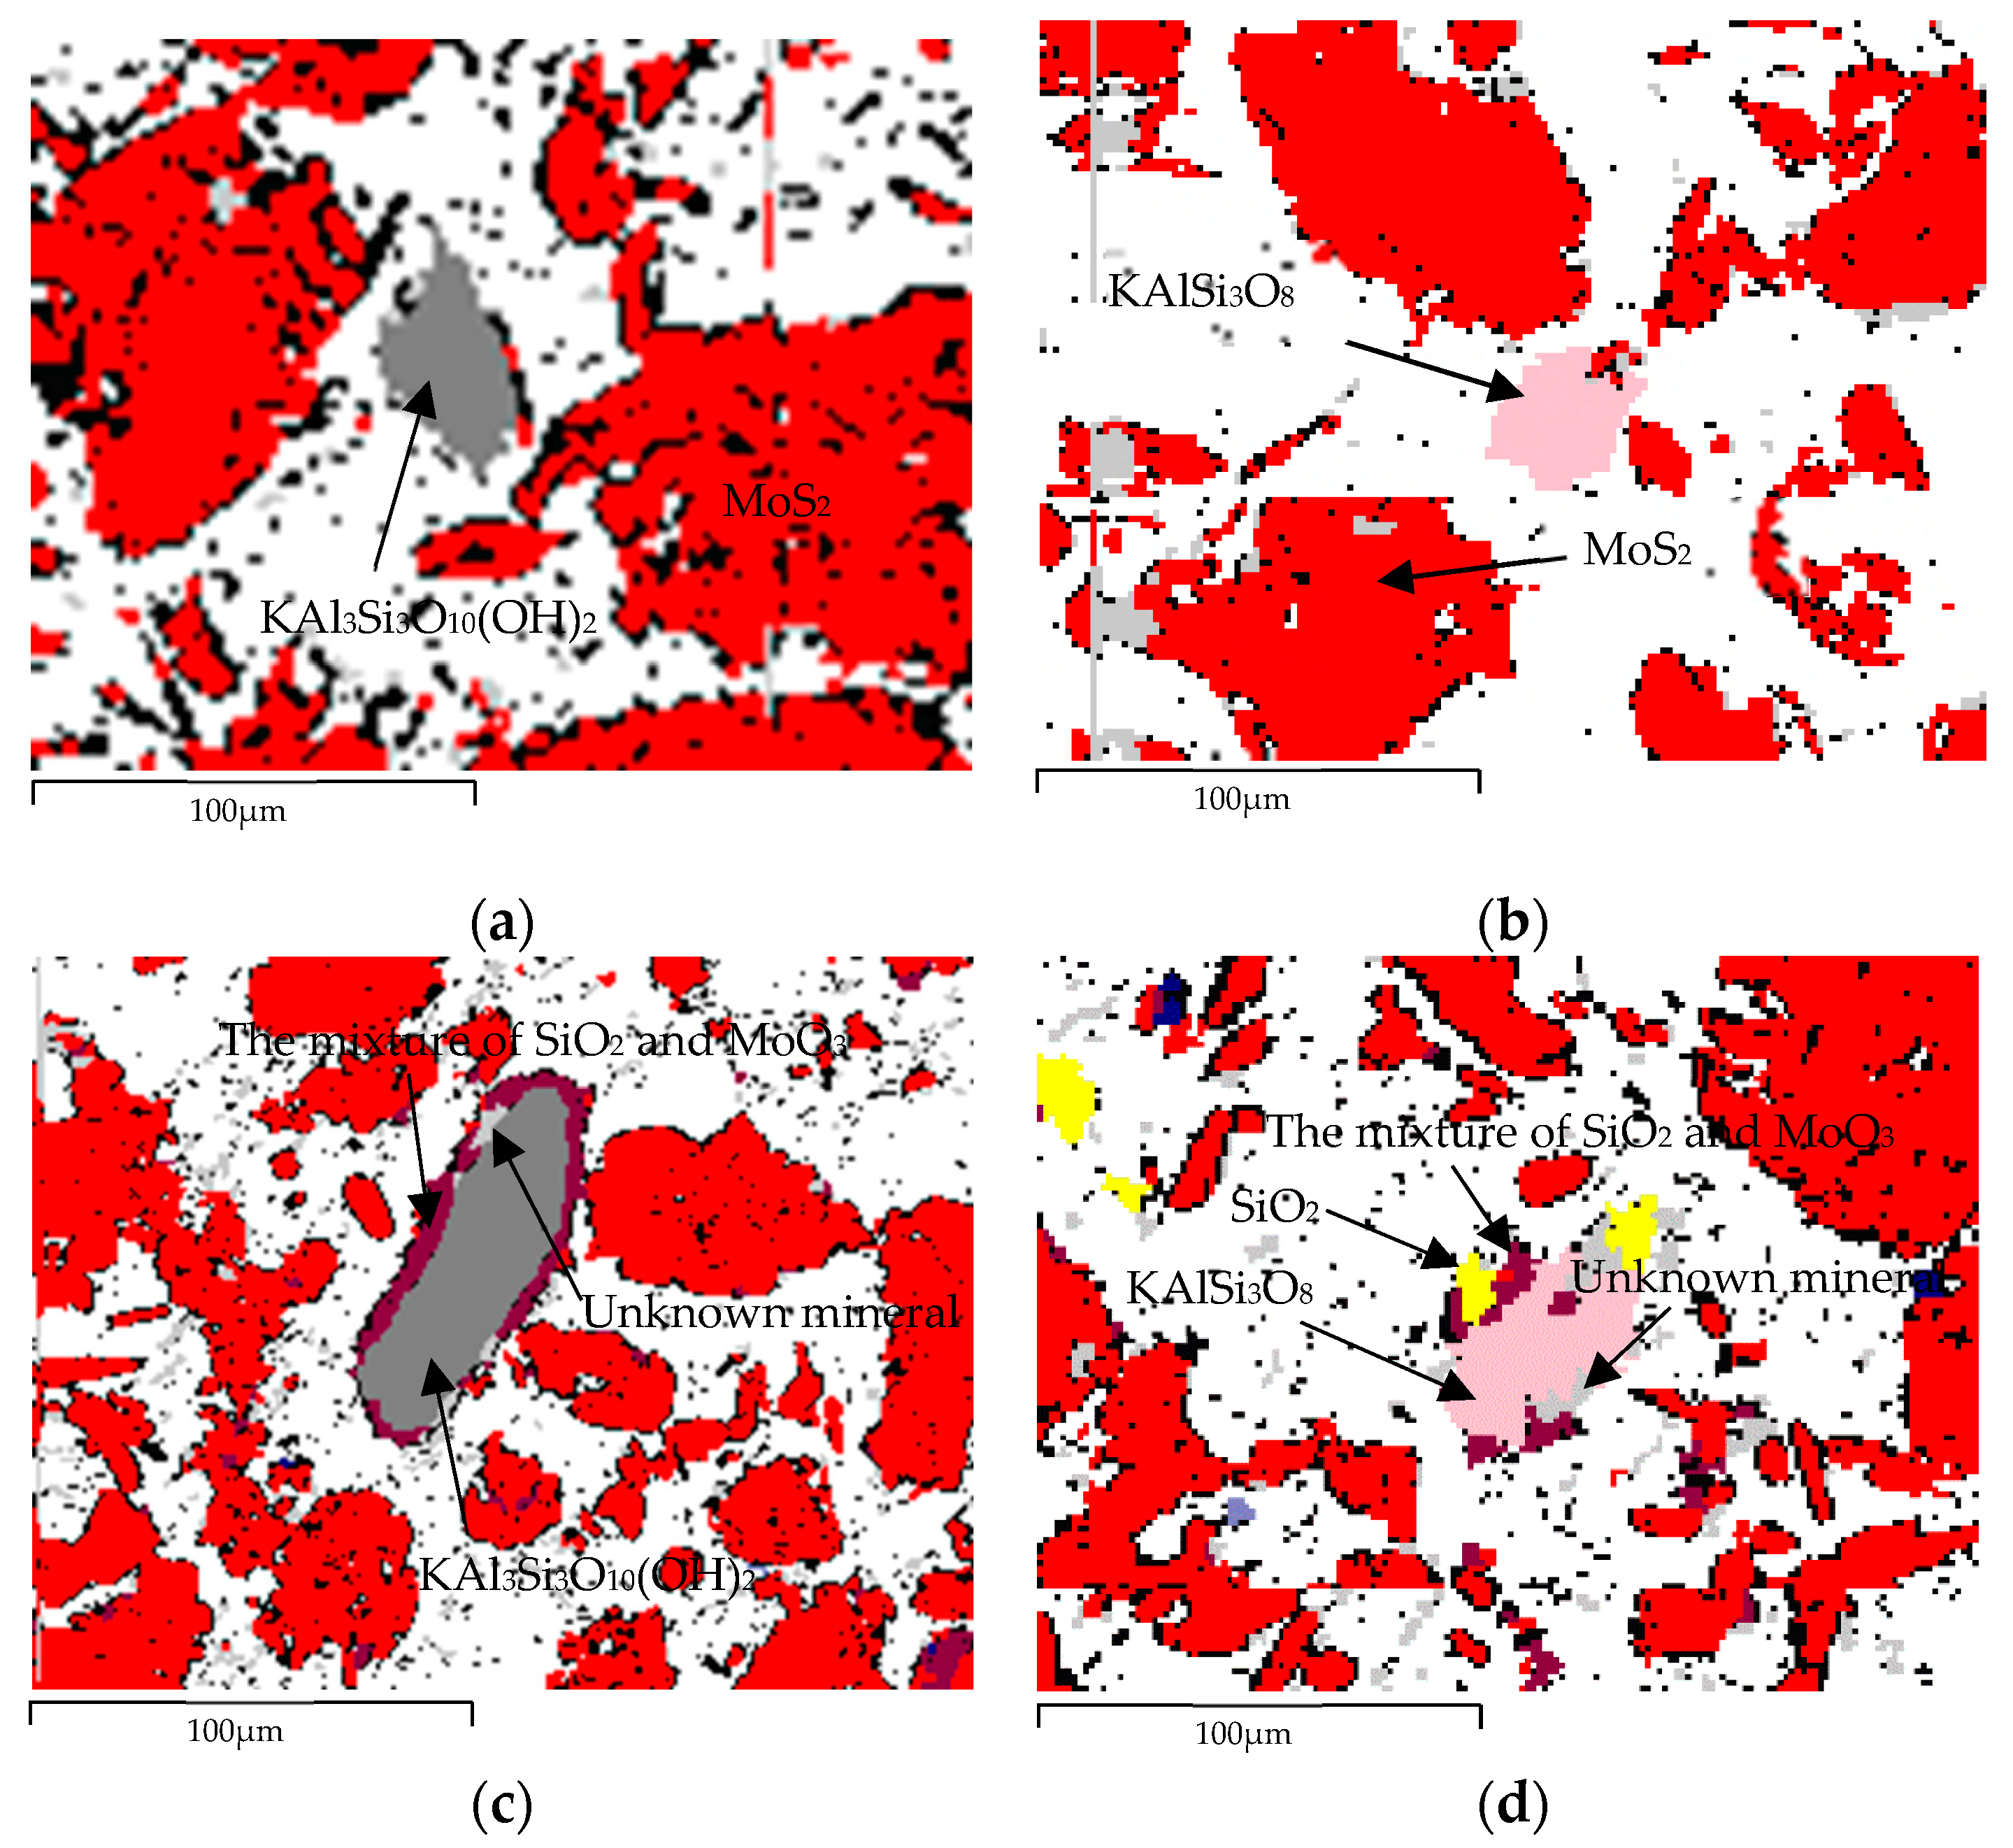
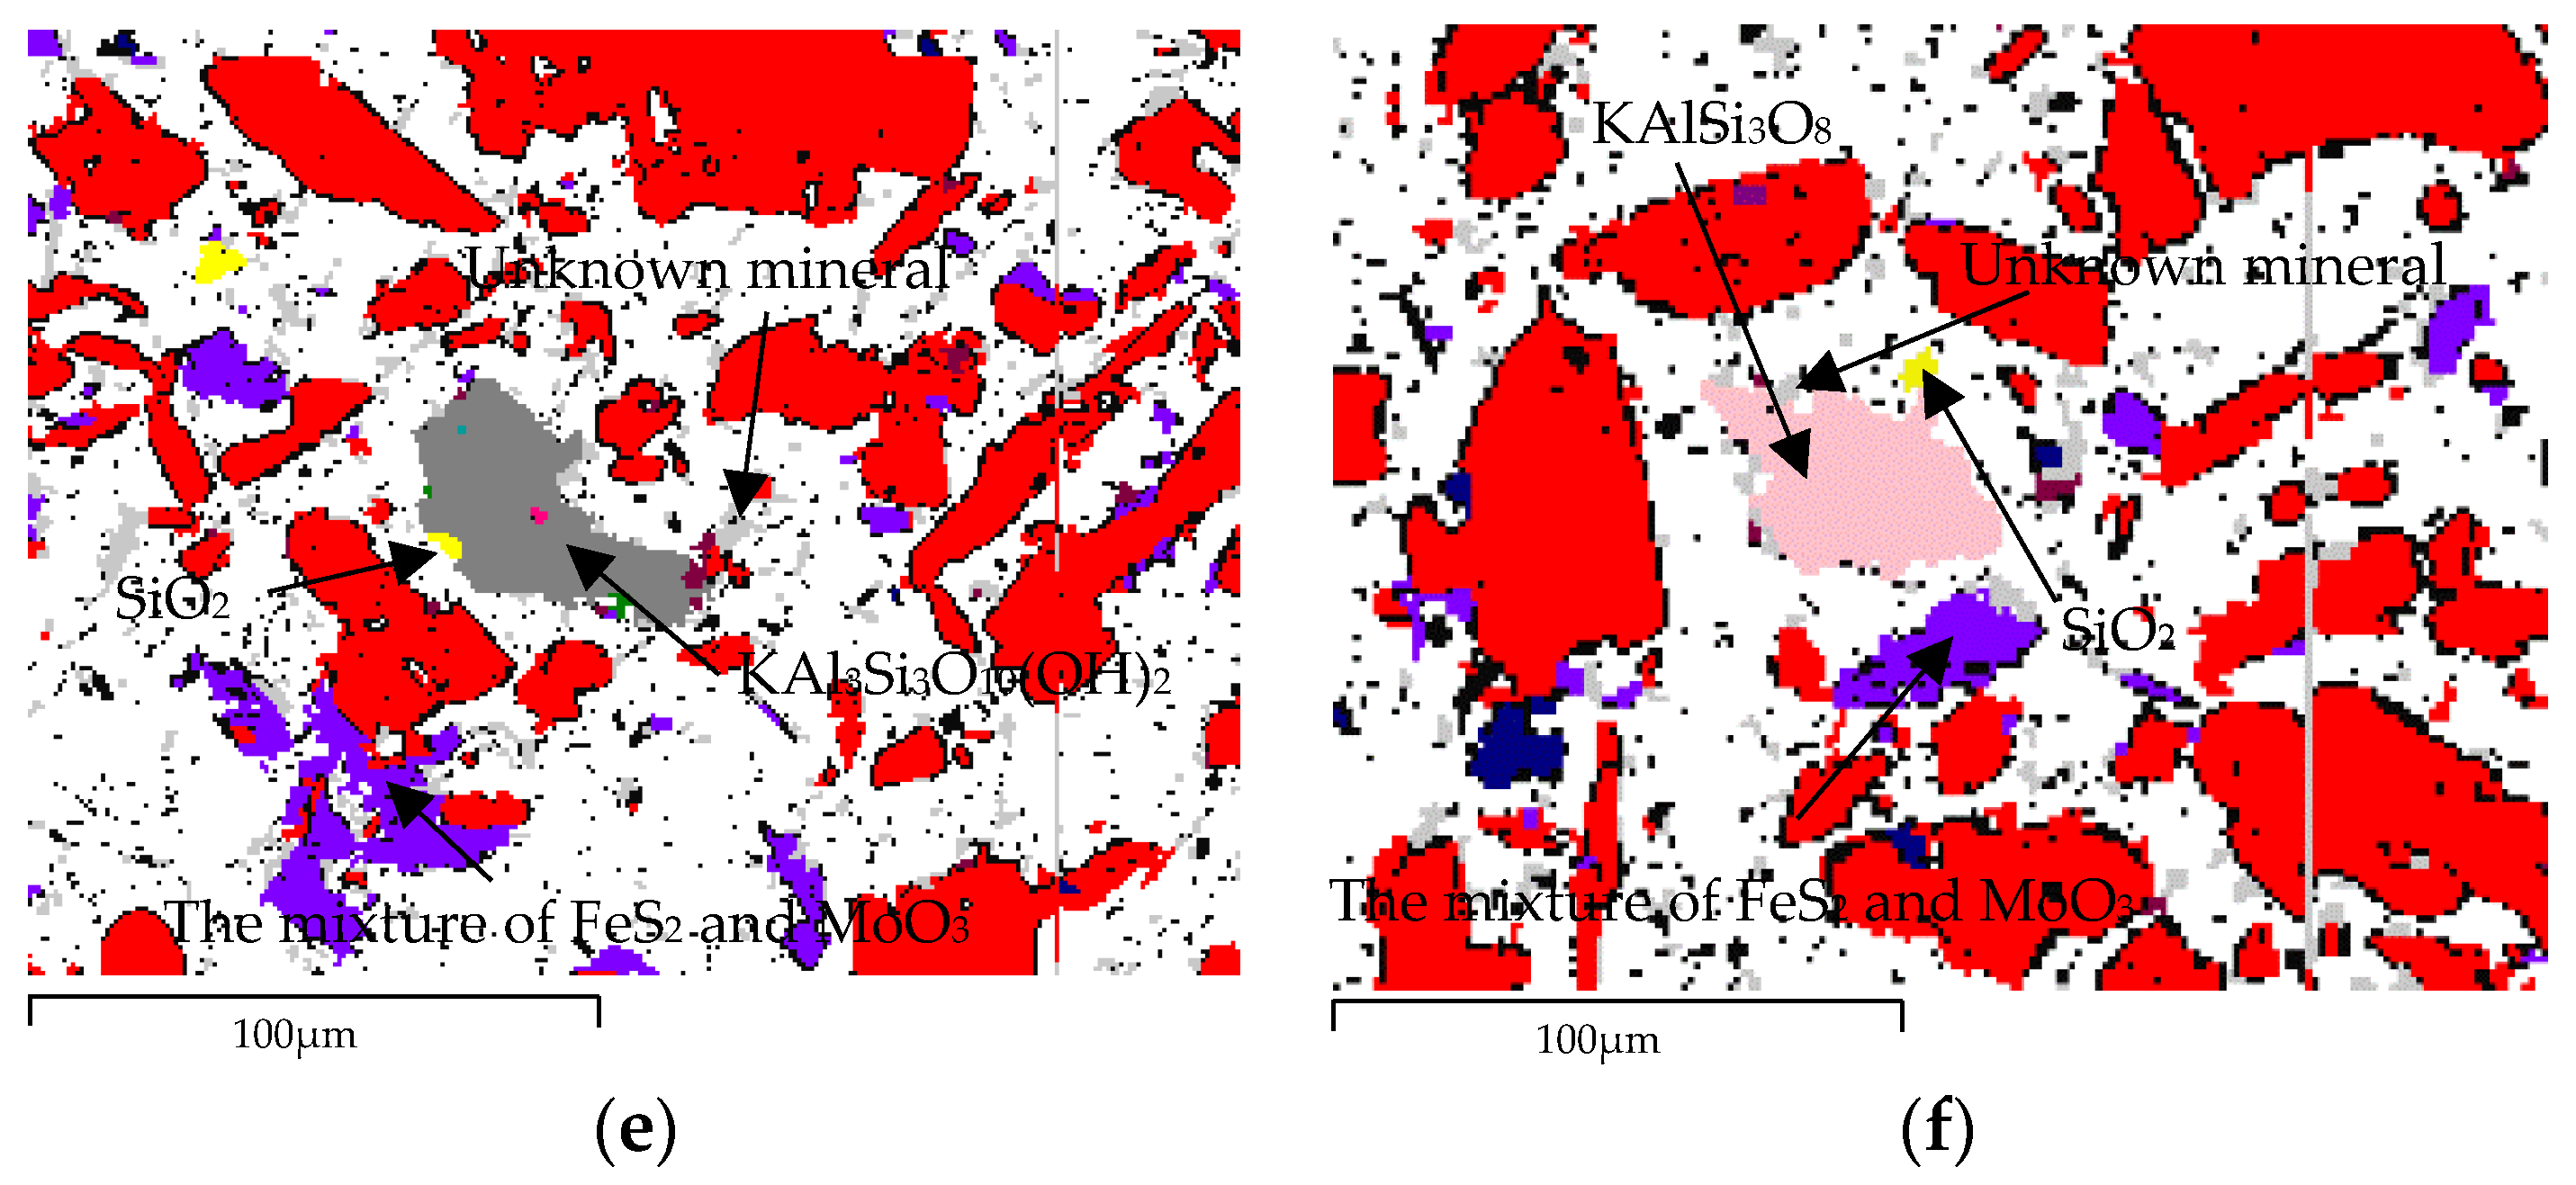
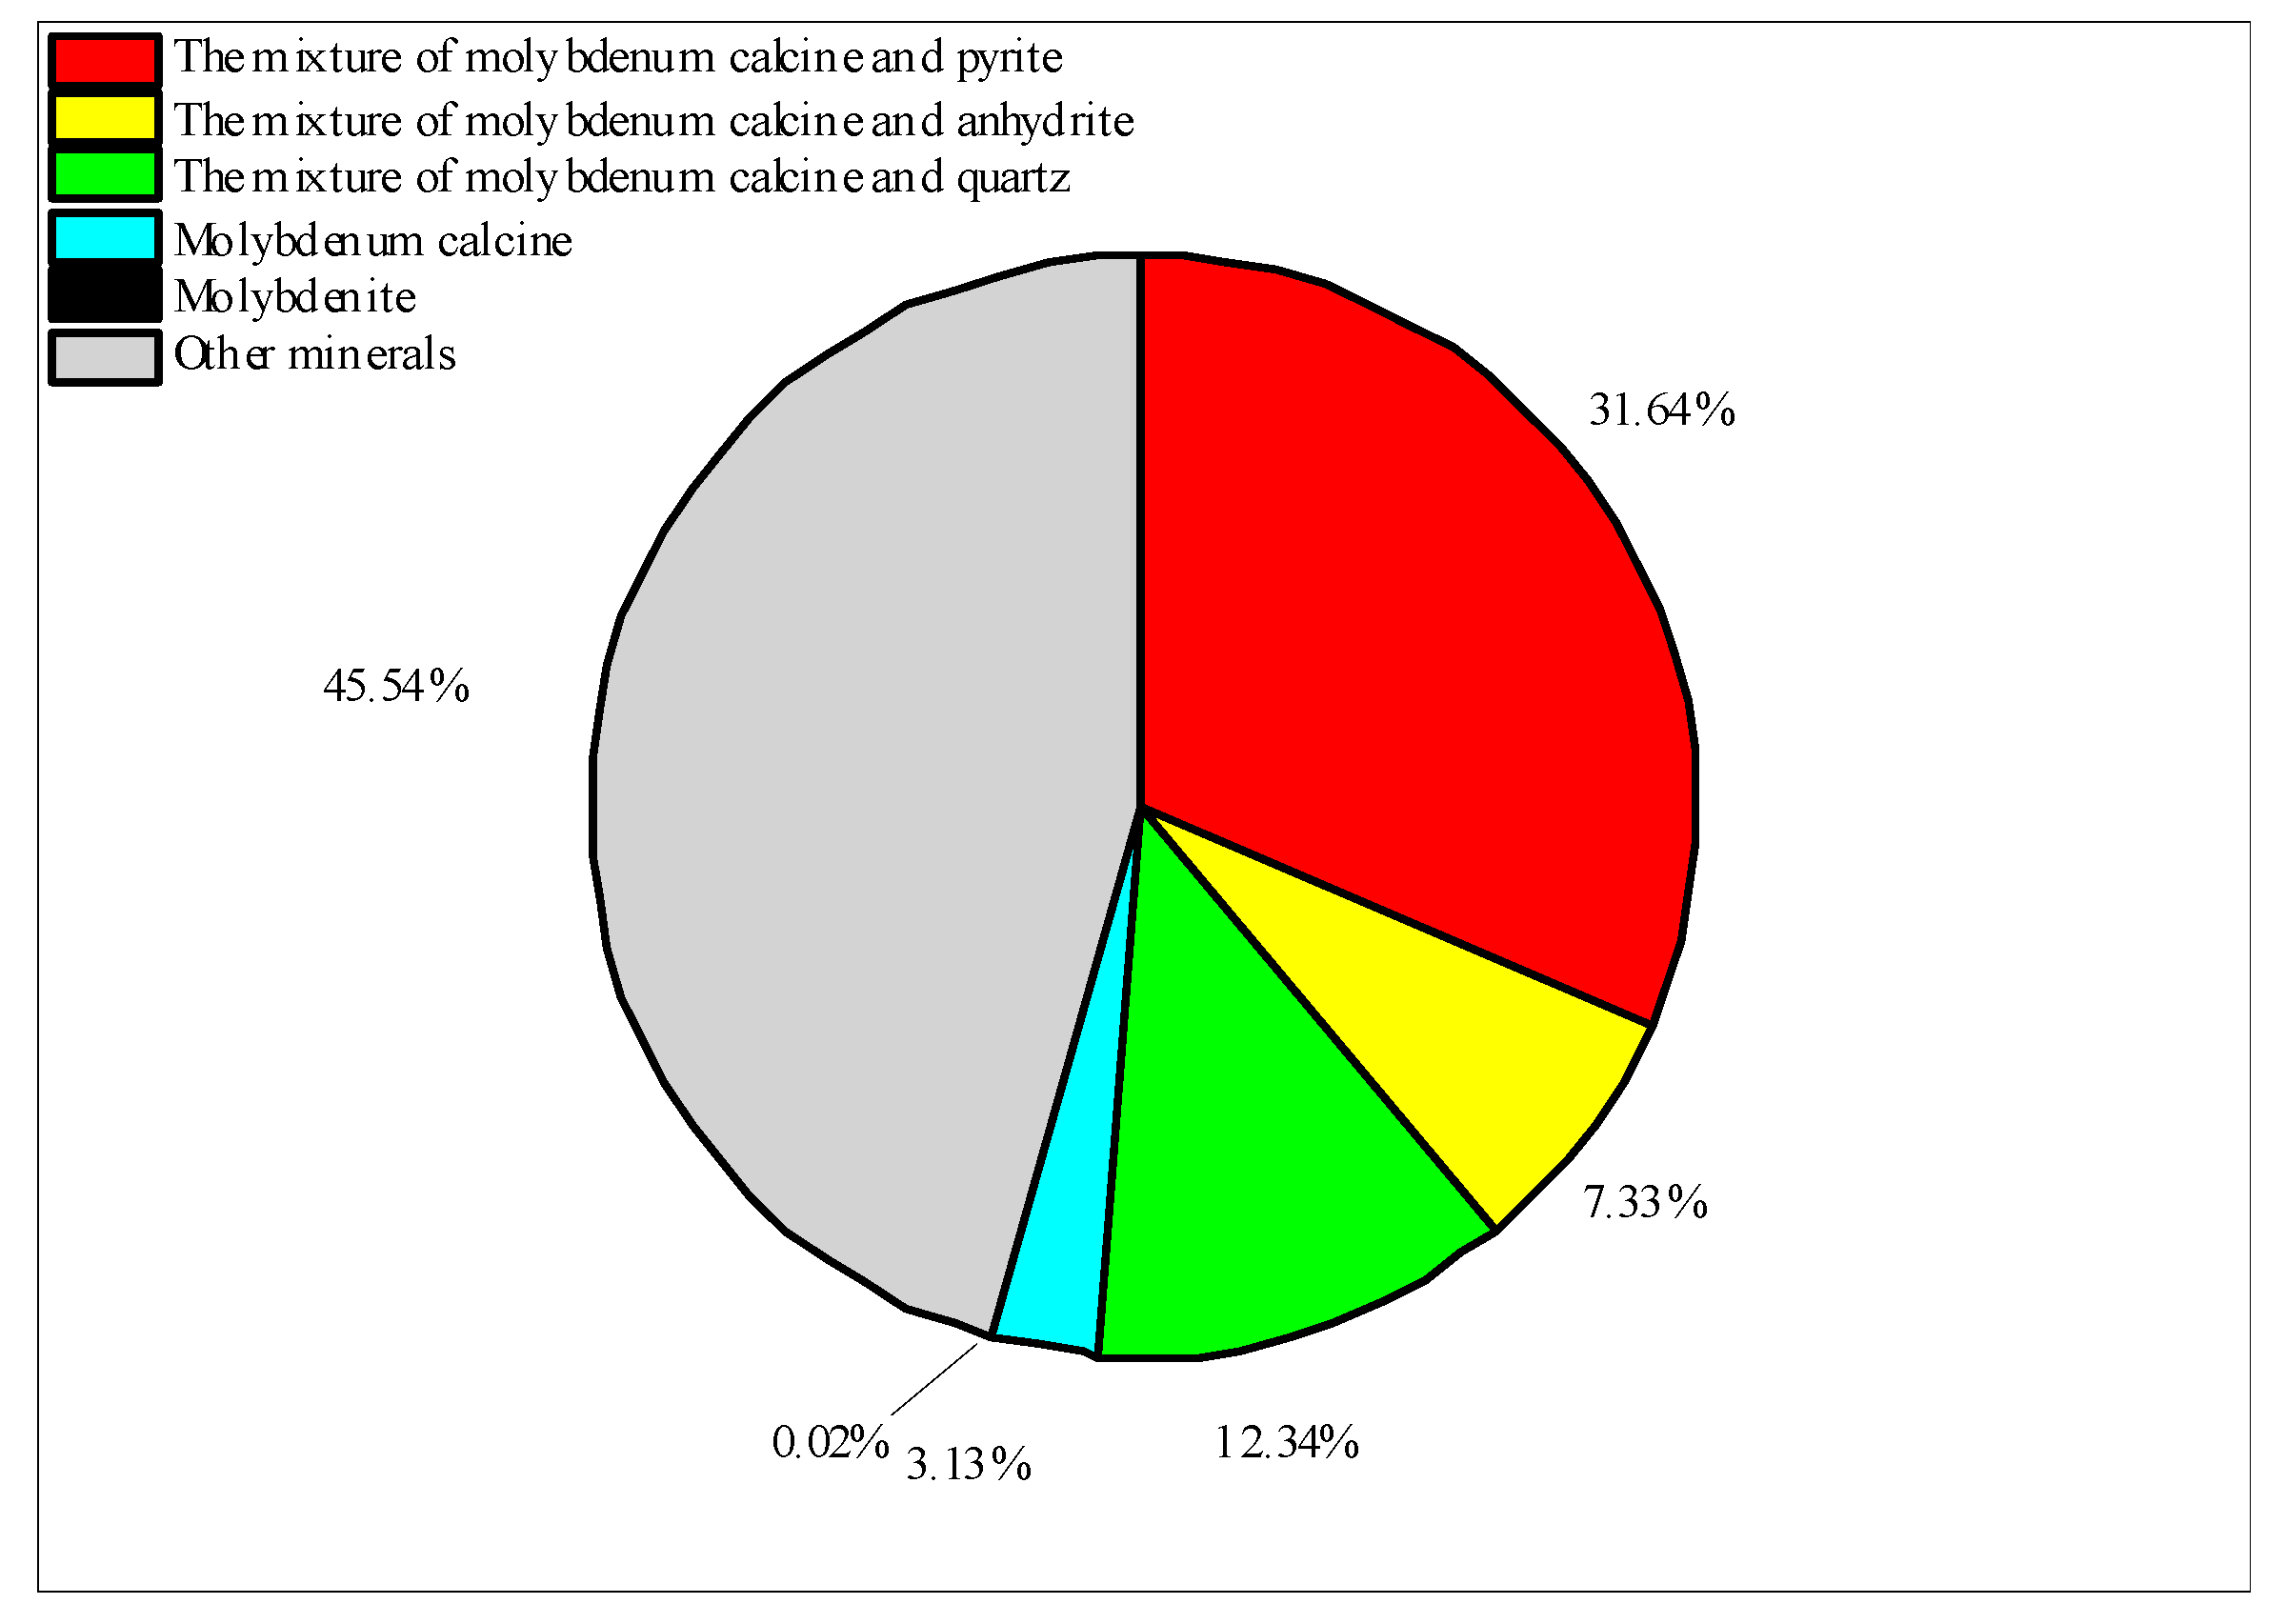
3.2. Speciation and Phase Analysis of Impurity Elements

XRD analysis results for the whole molybdenum concentrate and molybdenum calcine samples are shown in Figure 3.
According to the XRD results in Figure 3a, MoS2 is the primary component of molybdenum concentrate, and the diffraction peaks of other impurities are not visible due to their low contents, leaving only SiO2 and FeS2. After oxidative roasting, the main component MoS2 in the molybdenum concentrate is oxidized to MoO3 as shown in Figure 3b.
The main elements in the whole molybdenum concentrate, and its molybdenum calcine and ammonia leaching residue were analyzed by SEM-EDS. The semi-quantitative analysis results of different impurity elements can be obtained by SEM-EDS as shown in Figure 4 and Table 1. (Scatter plot 1, 2 and 3 are matched with the samples of molybdenum concentrate, molybdenum calcine and ammonia leaching residue, respectively).
Table 1 shows that the main elements of molybdenum concentrate are Mo and S, and the other main impurity elements are O, Al, K, etc. After high temperature roasting, the main component MoS2 in molybdenum concentrate was oxidized to MoO3, which increases the mass ratio of other impurity elements.
In order to further analyze the influence of impurity elements, the advanced mineral liberation analyzer (MLA) was introduced to examine samples from the production process of ammonium molybdate. This technology can quantitatively analyze the form and content of impurity elements, allowing the associations of impurity elements to be identified. Different samples including molybdenum concentrate, molybdenum calcine, water-washed molybdenum calcine, ammonia leaching residue, etc., were analyzed by MLA, among which the analysis results of molybdenum concentrate are shown in Table 2.
It can be seen from Table 2 that in addition to MoS2, sulfur in molybdenum concentrate also exists in the pyrite and chalcopyrite. The potassium minerals in molybdenum concentrate are muscovite, orthoclase, anandite and illite, and the content of muscovite is several times higher than that of the other three minerals. The MLA statistical deviations (confidence degree for 95%) of these four minerals are about 20%, 40%, 60% and 60%. The main iron-containing impurity is pyrite, and the main calcium-containing impurities are anhydrite and fluorite.

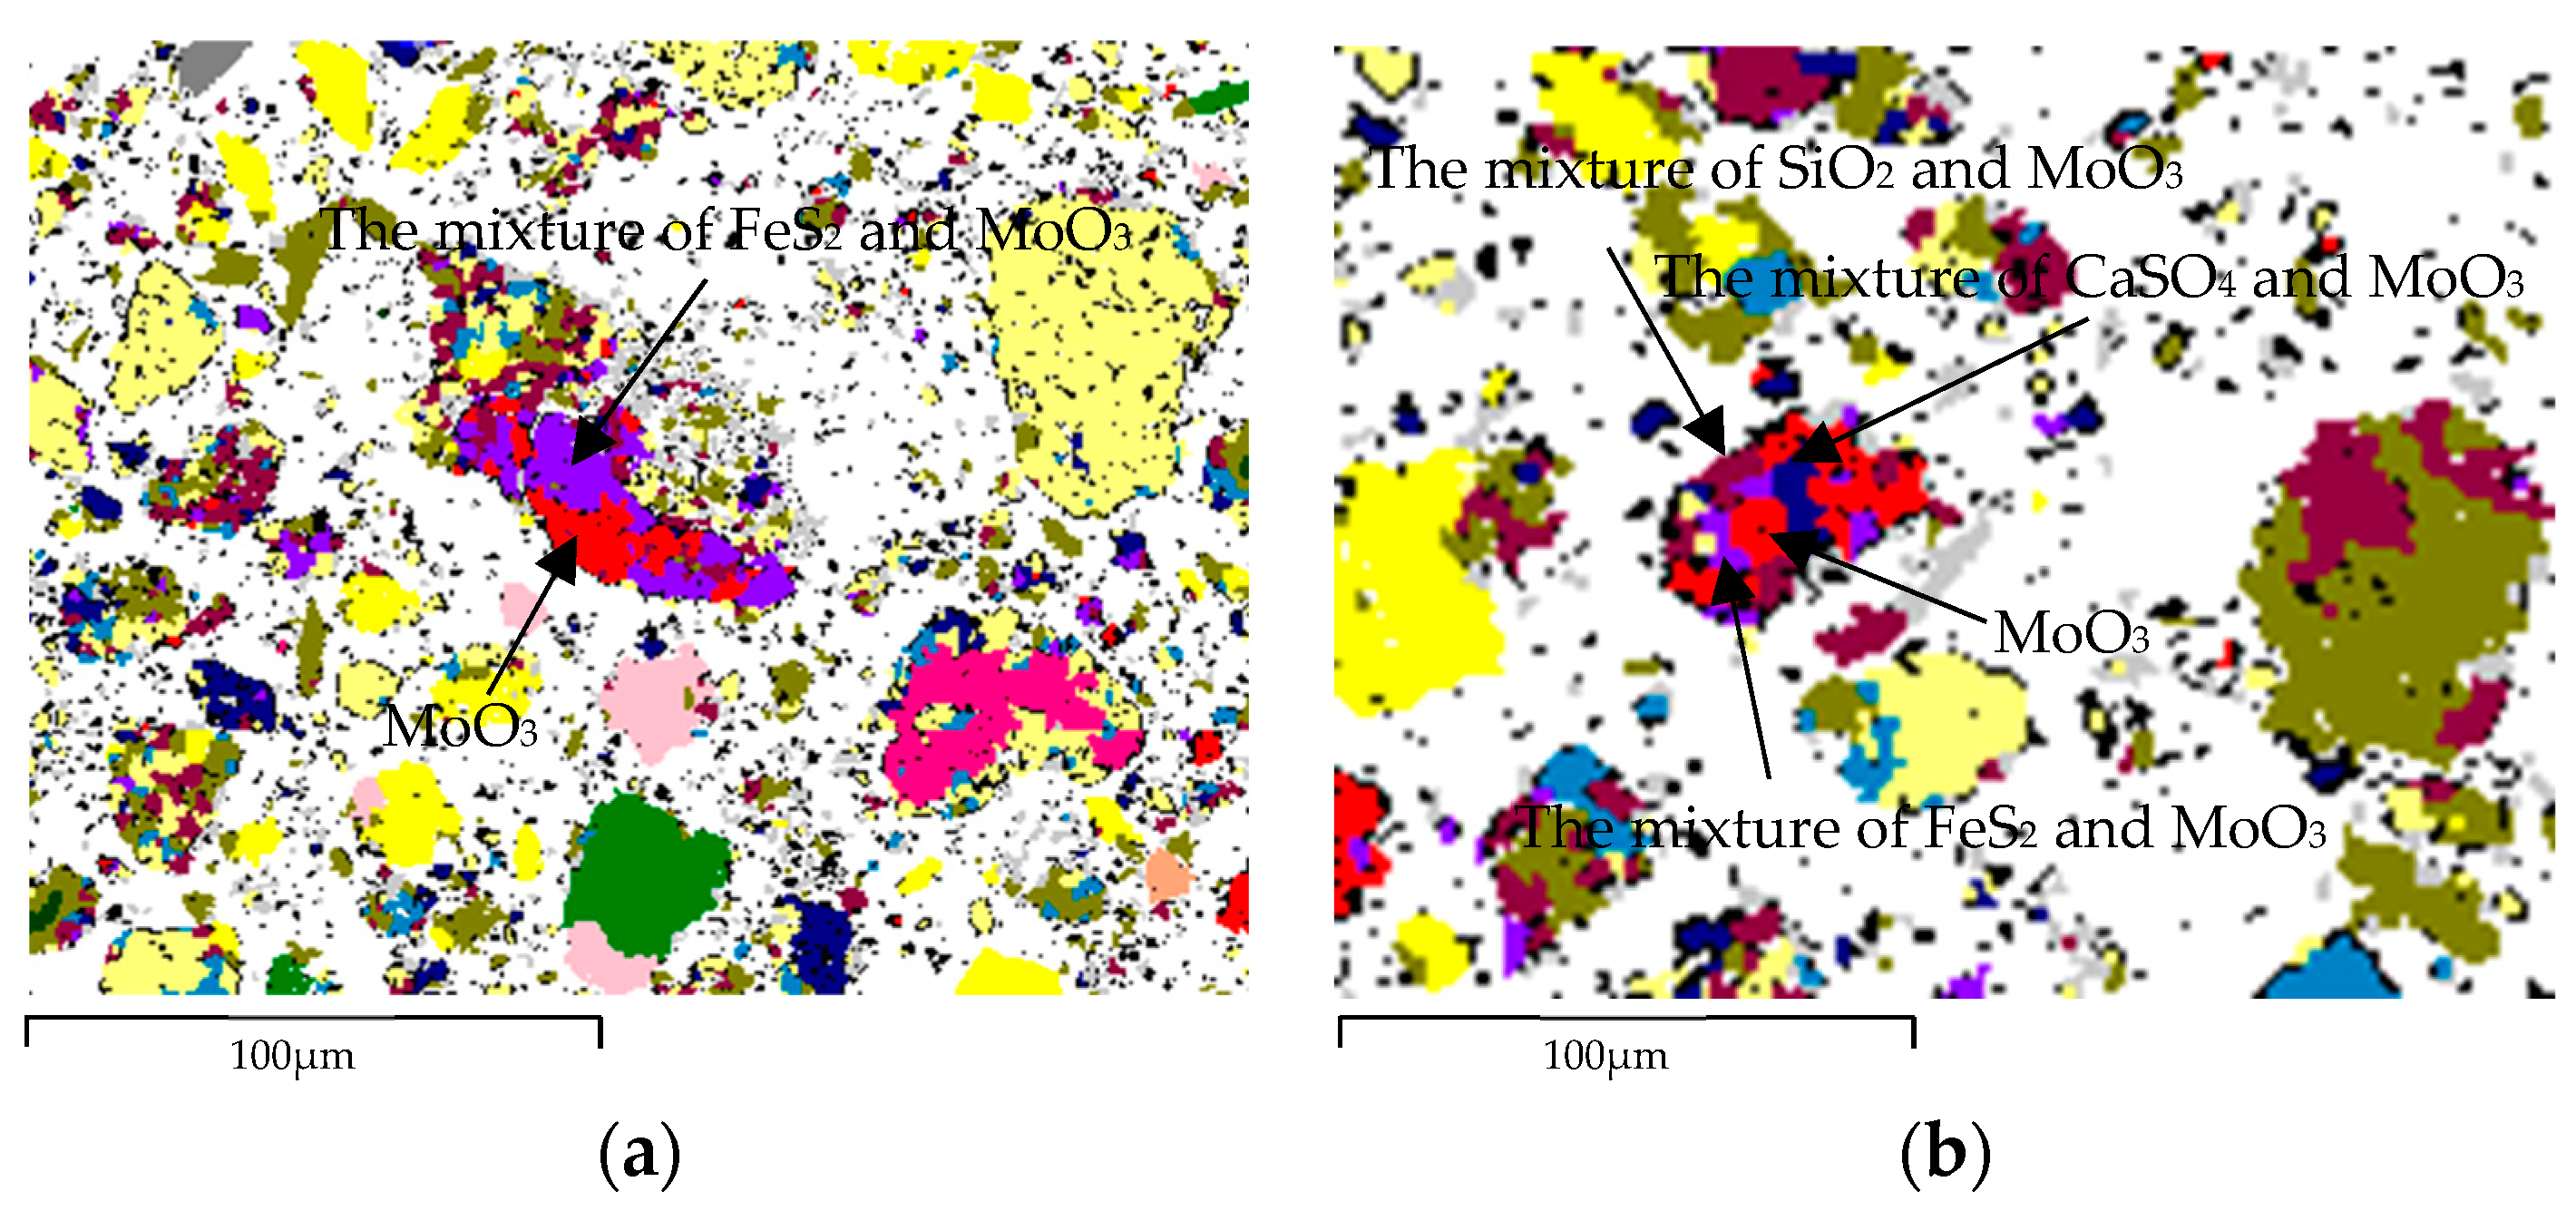
3.3. Transformation Mechanism of Impurities during Roasting Process

In order to explore the changes in potassium mineralogy during the roasting process, the mineral liberation analyzer was used to conduct phase analysis of each solid phase product from the molybdenum concentrate in the normal production process. The mass fractions of potassium-containing minerals in products from the roasting-washing stages are shown in Figure 5.
According to the results in Figure 5, it is necessary to calculate the mass changes of potassium minerals during roasting and washing so that the changes of potassium occurrence forms can be accurately analyzed:
M i 1 = M 1 ω i 1 M 2 ω i 2
M i 2 = M 2 ω i 2 M 3 ω i 3
where M i 1 is the mass change of a mineral during roasting, M i 2 is the mass change of a mineral during washing, M 1 is the mass of molybdenum concentrate, M 2 is the mass of molybdenum calcine in, M 3 is the mass of washed molybdenum calcine in, ω i 1 is the mass fraction of a mineral in molybdenum concentrate, ω i 2 is the mass fraction of a mineral in molybdenum calcine, and ω i 3 is the mass fraction of a mineral in washed molybdenum concentrate.
Since roasting and washing are both processes causing mass loss, M 1 > M 2 > M 3 . As can be seen from Figure 5, the molybdenum concentrate contains muscovite, orthoclase, anandite and illite, and the mass fraction of muscovite and orthoclase decrease obviously after roasting, while the mass fraction of anandite and illite change slightly. According to the study of Tang et al. [20], high-temperature roasting can transform part of insoluble potassium into soluble potassium. Combining with the results calculated from Equation (2), it can be concluded that K-containing minerals are insoluble and not removed by washing, while these minerals could react in the roasting process, so they are the main source of soluble potassium in molybdenum calcine. Additionally, the contents of muscovite and orthoclase change more during roasting. Two minerals are analyzed as examples.
The temperature of roasted molybdenum concentrate is much lower than the melting point of these minerals [28,29,30]. According to the existing research results [31,32,33,34,35,36], H2SO4 promotes the reaction of these K-containing minerals during roasting to destroy the lattice structure, so that potassium and other valuable elements form soluble salts. MoS2 is oxidized to generate a large amount of SO2 at high temperature. And there may be some crystal H2O in the minerals and steam in the air. Therefore, SO2 reacts with O2 and H2O to form gaseous H2SO4 during the roasting process of molybdenum concentrate. It is proposed that muscovite and orthoclase react during roasting as follows:
2 H 2 O ( g ) + 2 S O 2 ( g ) + 8 O 2 ( g ) = 2 H 2 S O 4 ( g )
2 KAl 3 S i 3 O 10 ( O H ) 2 + 10 H 2 SO 4 ( g ) = K 2 S O 4 + 3 A l 2 ( S O 4 ) 3 + 6 S i O 2 + 12 H 2 O ( g )
2 KAlSi 3 O 8 + 4 H 2 SO 4 ( g ) = 6 S i O 2 + K 2 SO 4 + A l 2 ( SO 4 ) 3 + 4 H 2 O ( g )
The thermodynamic software Factsage7.0 was used to predict the feasibility of the chemical reaction, and the Gibbs free energy of each reaction at various temperatures was calculated by the following formula:
Δ G T Θ = Δ H T Θ T Δ S T Θ
where Δ G T Θ is standard molar Gibbs free energy for reaction at various temperatures, MJ·mol−1; Δ H T Θ is standard molar enthalpy of formation for reactions at various temperatures, MJ·mol−1; T is thermodynamic temperature for reaction, K; Δ S T Θ is standard molar entropy for reactions at various temperatures, MJ·mol−1·K−1. Thermodynamic analysis of Equations (3)–(5) was carried out by thermodynamic software Factsage7.0, and the functional relationship between Δ G T Θ and T of each reaction in the roasting process was obtained after calculation. The results are as shown in Figure 6.
As can be seen from Figure 6, the reaction of Equation (3) can occur spontaneously below 824 K, respectively ( Δ G T Θ = 0 ), so the specific mechanism of producing soluble potassium in roasting process is as follows:
The SO2 produced by the oxidation of MoS2 can react with H2O to form gaseous H2SO4. The K2O and Al2O3 components of muscovite and orthoclase react with H2SO4 to produce soluble sulfates and release SiO2. Soluble sulfates which are Al2(SO4)3 and K2SO4 can be removed by washing with water. These reactions in reality may only occur to a partial extent.
In order to verify the results of thermodynamic analysis, the contents of K+, Al3+ and SO42- in the washing solution were determined by ICP and IC. The results are shown in the Table 3.
It can be seen from Table 3 that soluble potassium is produced in the roasting process of molybdenum concentrate. SO42- in the washing solution can be determined, and there is no SO32- in the washing solution. SO42- can be coordinated with K+ and Al3+ to form K2SO4 and Al2(SO4)3. The mole of Al3+ is slightly below three times that of K+. It indicates that muscovite and orthoclase could be decomposed by H2SO4 to produce soluble potassium and aluminum salts during roasting. The backscattered electron (BSE) images of the mineral liberation analyzer (MLA) were used to further predict whether muscovite and orthoclase reacted during roasting. The enhanced backscattered electron (BSE) images of muscovite and orthoclase in molybdenum concentrate, molybdenum calcine, and washed molybdenum calcine are shown in Figure 7.
As shown in Figure 7a,b, there are no other substances or minerals around muscovite and orthoclase in molybdenum concentrate before roasting. However, after roasting, all muscovite and orthoclase are surrounded by mixtures of MoO3 and SiO2 in molybdenum calcine, and each example is shown in Figure 7c,d. Hence, these seemed to have partially reacted to generate SiO2 during roasting. Furthermore, there are some unknown minerals on the surface; one of which could be arcanite (K2SO4). Most of these minerals can be removed after washing as shown Figure 7e,f. Therefore, it can be concluded that the unknown minerals are K2SO4 and Al2(SO4)3 generated by the reaction of the muscovite and orthoclase with gases during roasting leaving residual SiO2. Thus, the specific reactions for producing soluble potassium in roasting process can be verified.

3.4. Effect of Humidification on the Removal of Impurity Elements

In order to further verify the mechanism proposed in Section 3.3 and to put forward effective suggestions for removing impurity elements, the experiment on humidification of molybdenum concentrate during roasting was carried out. It has been known that molybdenum concentrate begins to oxidize at 450 °C and rapidly oxidizes above 500 °C [28]. Half an hour before the end of the roasting, the roasting temperature was set to 500 °C, and water vapor and air were mixed in a ratio of 1:2 and passed into the tube furnace. After the humidification and roasting, the cooled samples were washed with water three times. The washed samples were then analyzed by XRF and MLA, respectively, and compared with the normal non-humidified samples as shown in Table 4 and Table 5.
It can be seen from Table 4 that the contents of impurity elements Al and K in the humidified sample have decreased significantly compared with the normal non-humidified sample, which indicates that humidification may increase the conversion of impurity minerals to soluble ions. To further explain the mechanism of humidification, advanced MLA was again used to quantitatively analyze impurity minerals in different samples as shown in Figure 8 and Table 5.
It can be seen from the results in Table 5 that the orthoclase content of the humidified sample is 0.03%, which is significantly lower than that of the normal sample without humidification (0.17%). The main reason is that the humidification can facilitate more of the SO2 oxidized from molybdenum concentrate adhering to the surface of molybdenum concentrate particles in the form of H2SO4. Combined with the analysis results in Section 3.3, most of the impurity elements in molybdenum concentrate exist in the form of alkaline minerals or compounds. Therefore, the reaction degree of Equations (4) and (5) increases due to the increase of H2SO4 content, that is, more alkaline minerals are converted into soluble ions at high temperature, and then removed by water washing, resulting in a reduced content of impurity elements. Therefore, the conversion of alkaline mineral impurities to soluble ions can be increased by humidifying, which is beneficial to the production under the current water washing process conditions. In addition, it can be seen from Table 5 that different sintering mixtures such as the mixture of MoO3 and FeS2, the mixture of MoO3 and CaSO4, etc., were formed after roasting. This is consistent with Wang et al.’s research [25].

3.5. Influence Mechanism of Impurities on Molybdenum Leaching

The phases of the ammonia leaching residue in Section 2.2 were analyzed by XRD, and the results are shown in Figure 9.
After ammonia leaching, there is still molybdenum in the solid phase, which cannot be extracted into the ammonium molybdate solution, resulting in the loss of molybdenum. XRD results show that the main minerals in ammonia leaching residue are MoO3, SiO2, CaSO4, FeS2, orthoclase and muscovite, among which the content of MoO3 is relatively high. In order to further analyze the reasons affecting the Mo extraction, the mineral liberation analyzer (MLA) was used for the quantitative analysis of the phase composition of ammonia leaching residue, and different forms and contents of molybdenum in ammonia leaching residue were obtained, as shown in Figure 10 and Figure 11.
It can be seen from Figure 10 and Figure 11 that MoO3 in ammonia leaching residue mostly exists in the mixtures formed with FeS2, CaSO4 and SiO2. It has been known that pyrite is present in the concentrate. It is unclear how much CaF2 reacts during roasting to form CaSO4. Additionally, we cannot be certain how much of the SiO2 encapsulation is due to quartz or formed from the reaction of K-containing minerals. The content of MoO3 alone is low (3.13%), and the unoxidized MoS2 only accounts for 0.02%. In addition, the proportions of the mixture of MoO3 and FeS2, CaSO4, SiO2 accounted for 31.6%, 7.33%, 12.3%, respectively. This indicates that the impurities FeS2, CaSO4 and SiO2 encapsulates MoO3 and hinders the leaching of Mo, especially FeS2 which has the greatest influence on the leaching of Mo.
Through the detection and analysis of the mineral liberation analyzer (MLA) as shown in Table 5, it was found that the mixture containing MoO3 was formed in the process of high-temperature roasting. According to the analysis results in Section 3.3, the specific mechanism can be concluded as follows:
The main calcium substances in molybdenum concentrate are CaSO4 and CaF2. As the temperature reached 673K, MoS2 was oxidized to generate MoO3, which is an exothermic reaction. A large amount of exothermic reaction increases the local surface temperature, leading to the appearance of molten MoO3 [37]. The released SO2 and O2 could convert CaF2 into CaSO4, which is an endothermic reaction. Therefore, a large amount of CaSO4 contacted with the surrounding molten MoO3 and formed a mixture after cooling. Part of the MoO3 encapsulated in the interior is not easy to extract in the ammonia leaching process.
As the oxidation of FeS2 begins slowly at least above 673 K [38,39,40], the alkaline oxides such as FeO, Fe3O4 and Fe2O3 which produce a thin layer on the surface of FeS2 can undergo solid phase reaction with MoO3, and the generated sintered phase firmly connects FeS2 and MoO3 [25]. The remaining FeS2 was encapsulated inside the particle before oxidation, preventing the contact between FeS2 and O2, and explaining the formation of a mixture of FeS2 and MoO3. In addition, during the roasting process, SiO2 will also come into contact with locally melted MoO3 at high temperature and form dense sintered particles after cooling, so that the MoO3 encapsulated in the sinter cannot be leached.
In summary, impurities such as CaSO4, FeS2 and SiO2 will be sintered with MoO3 in the roasting process. Then a solid sinter will be formed to encapsulate a portion of the MoO3, which will hinder the leaching of MoO3, thus reducing the extraction of Mo.

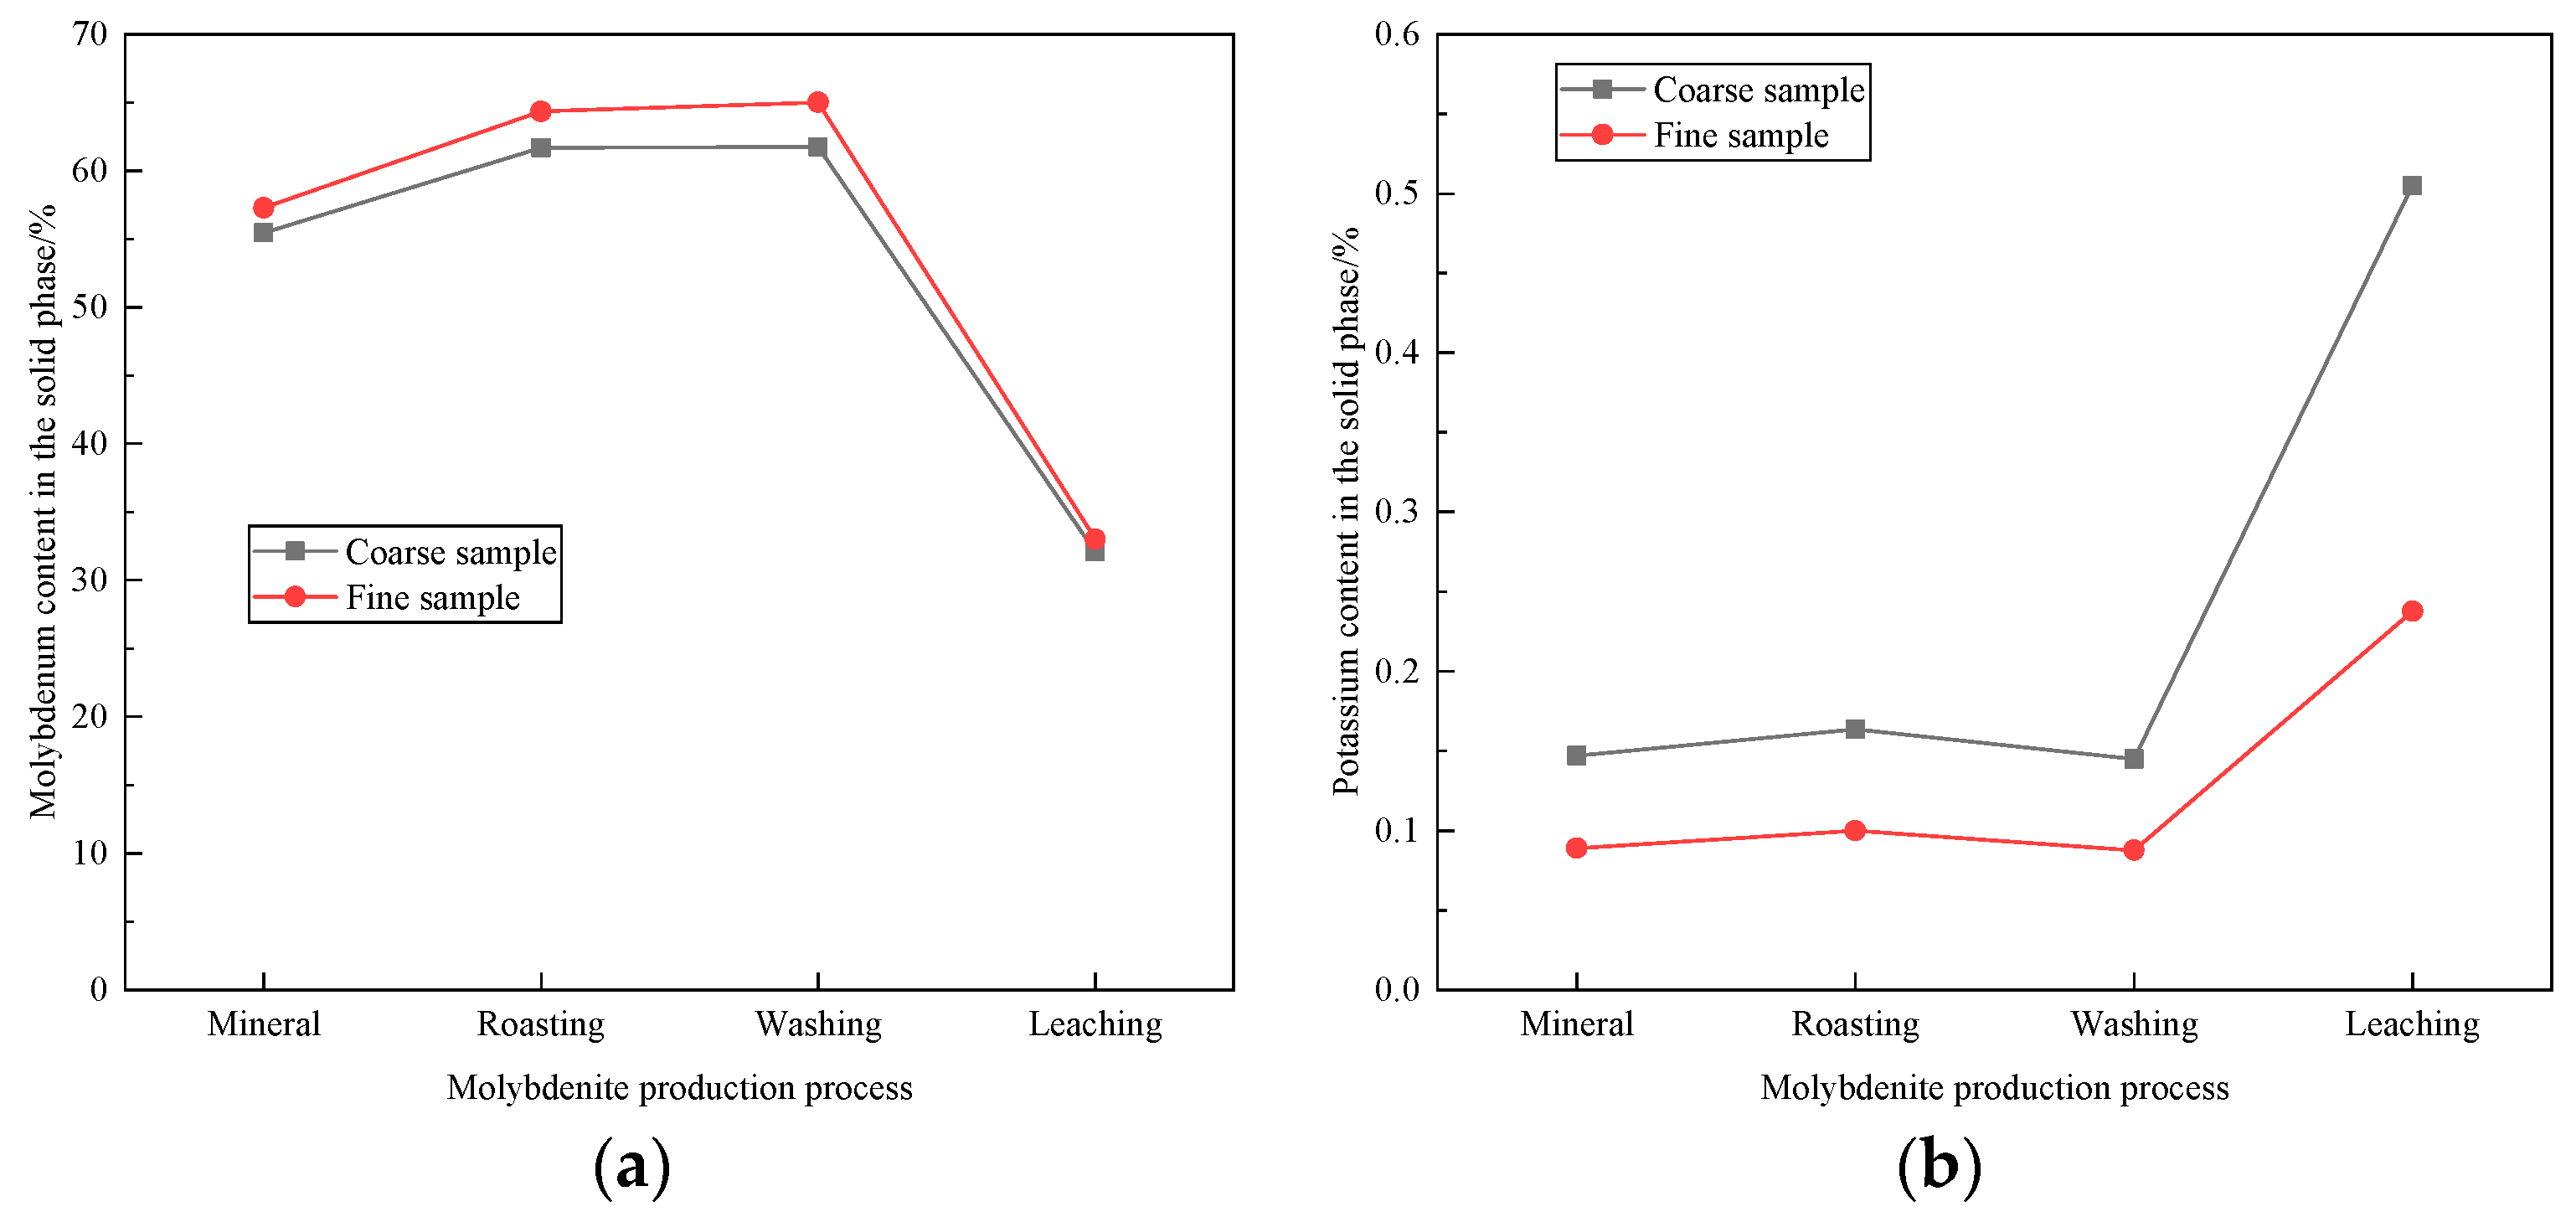
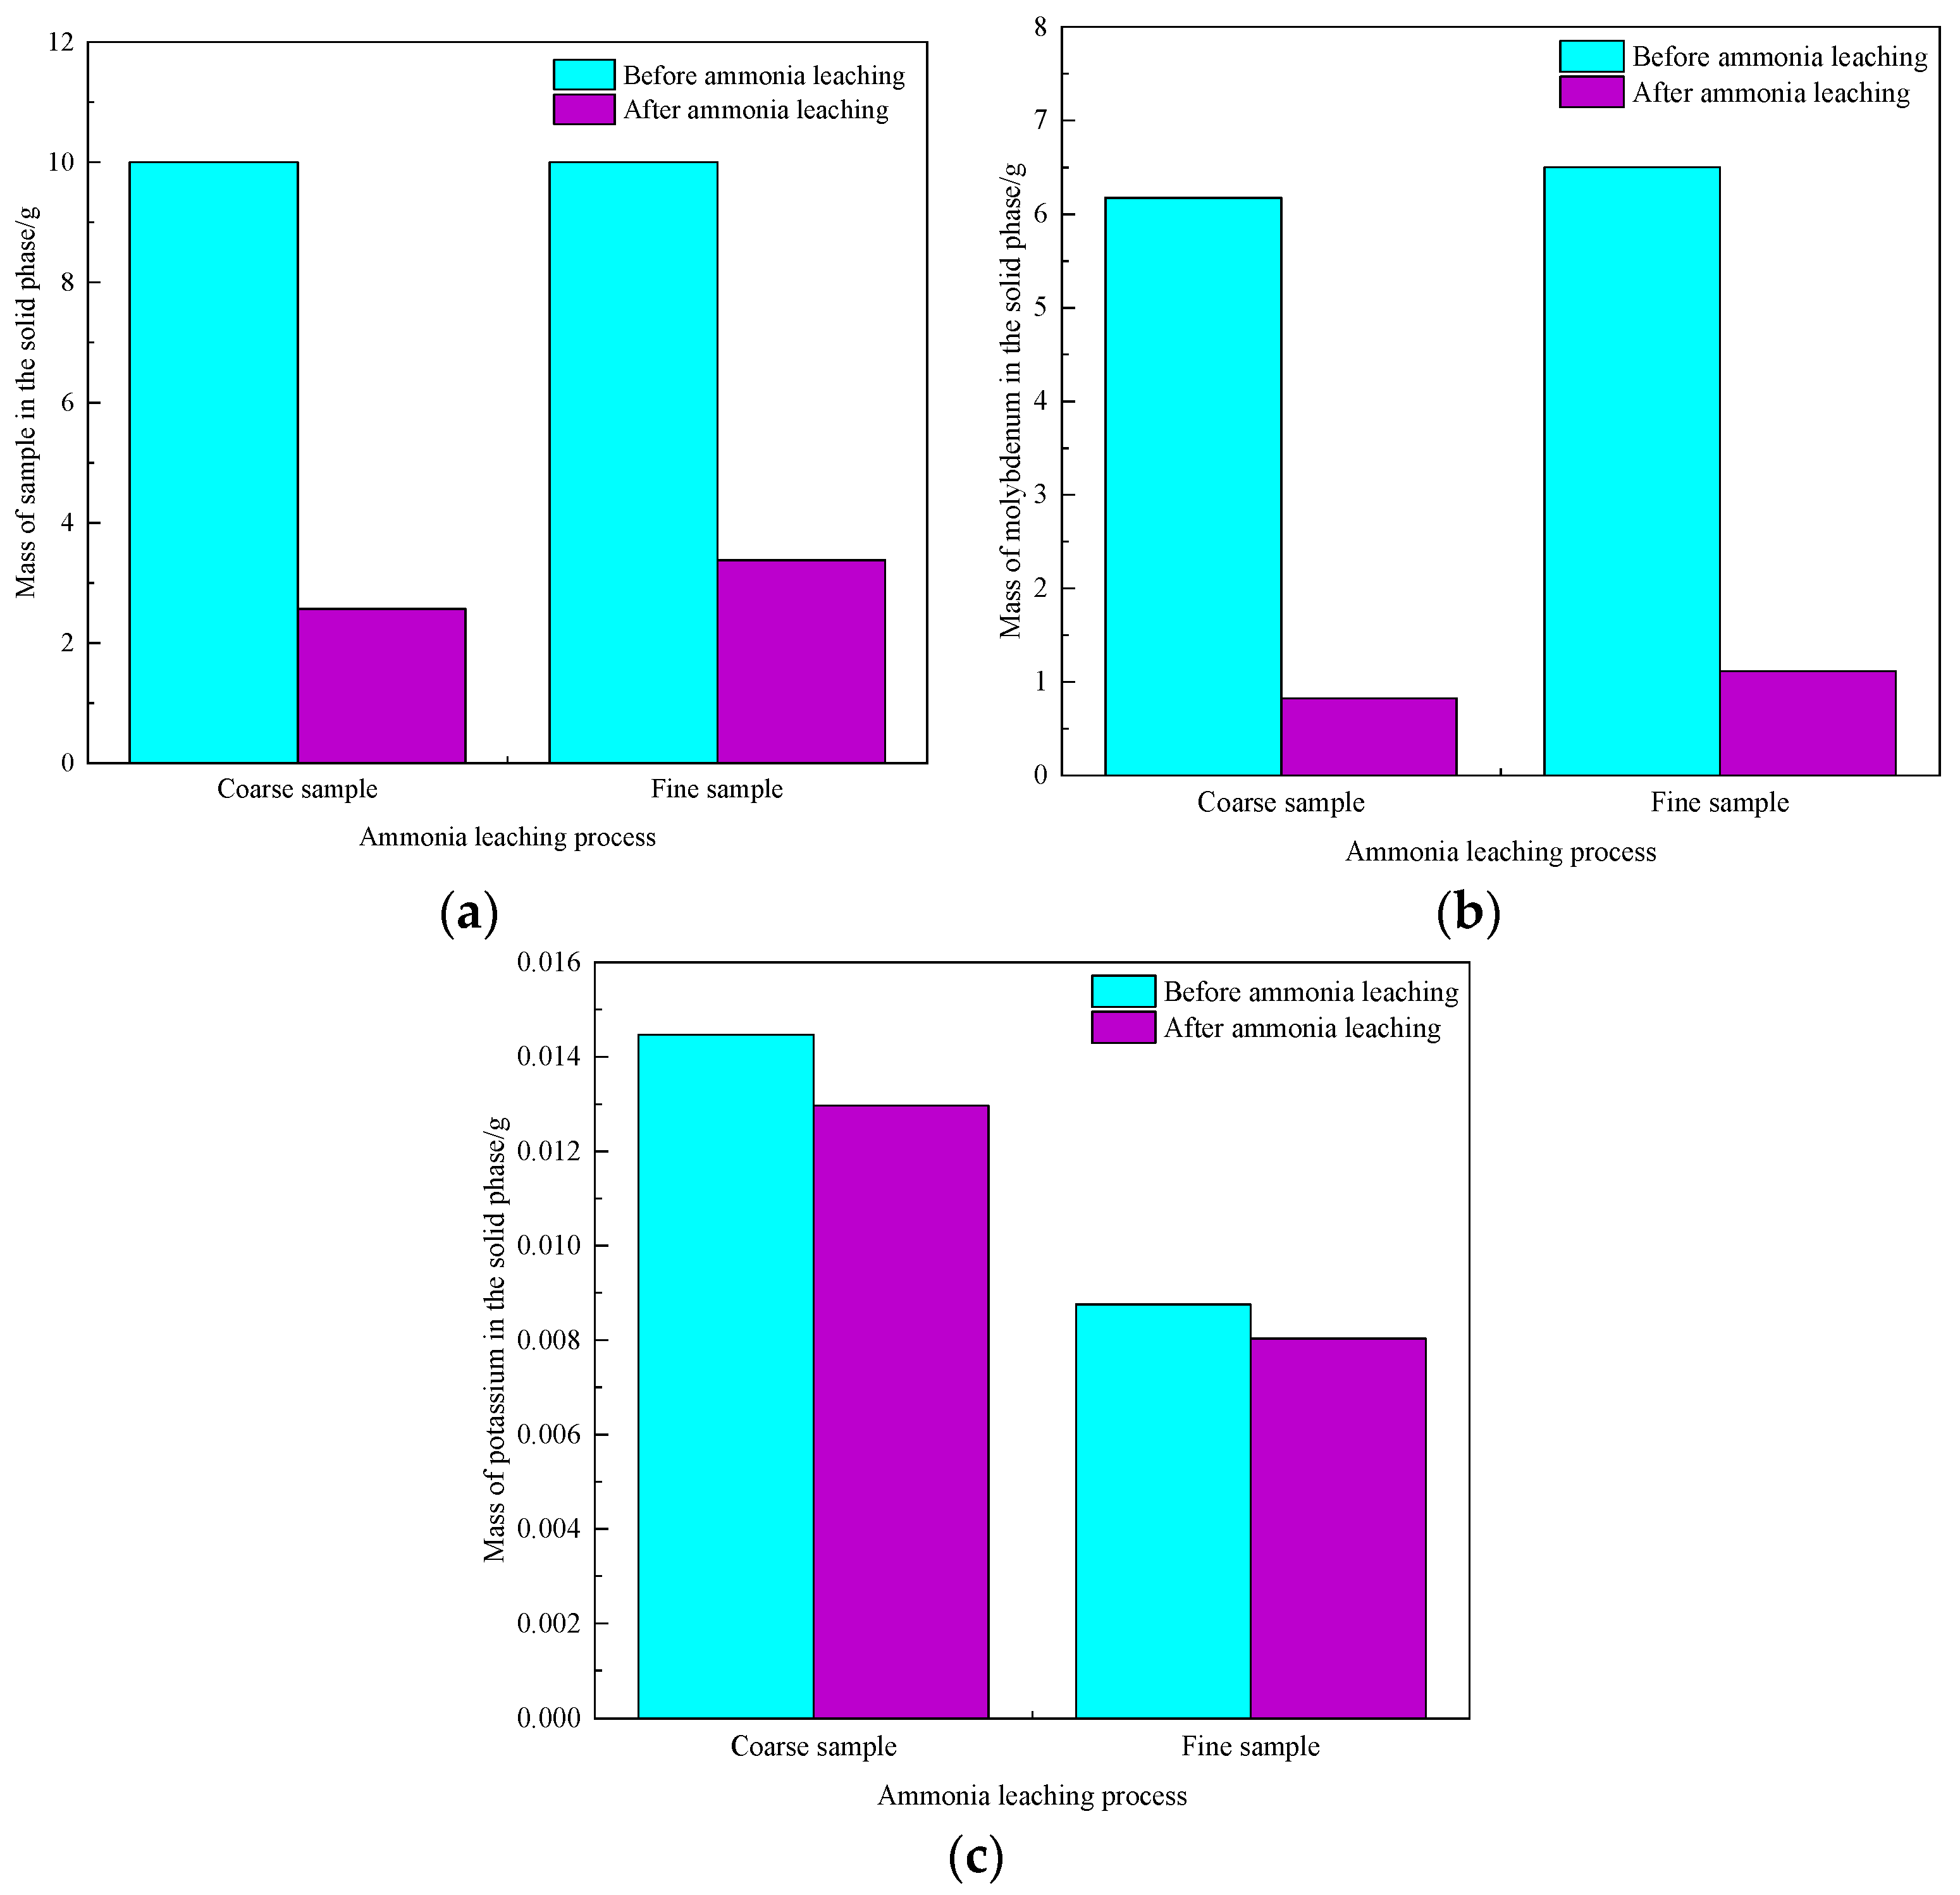
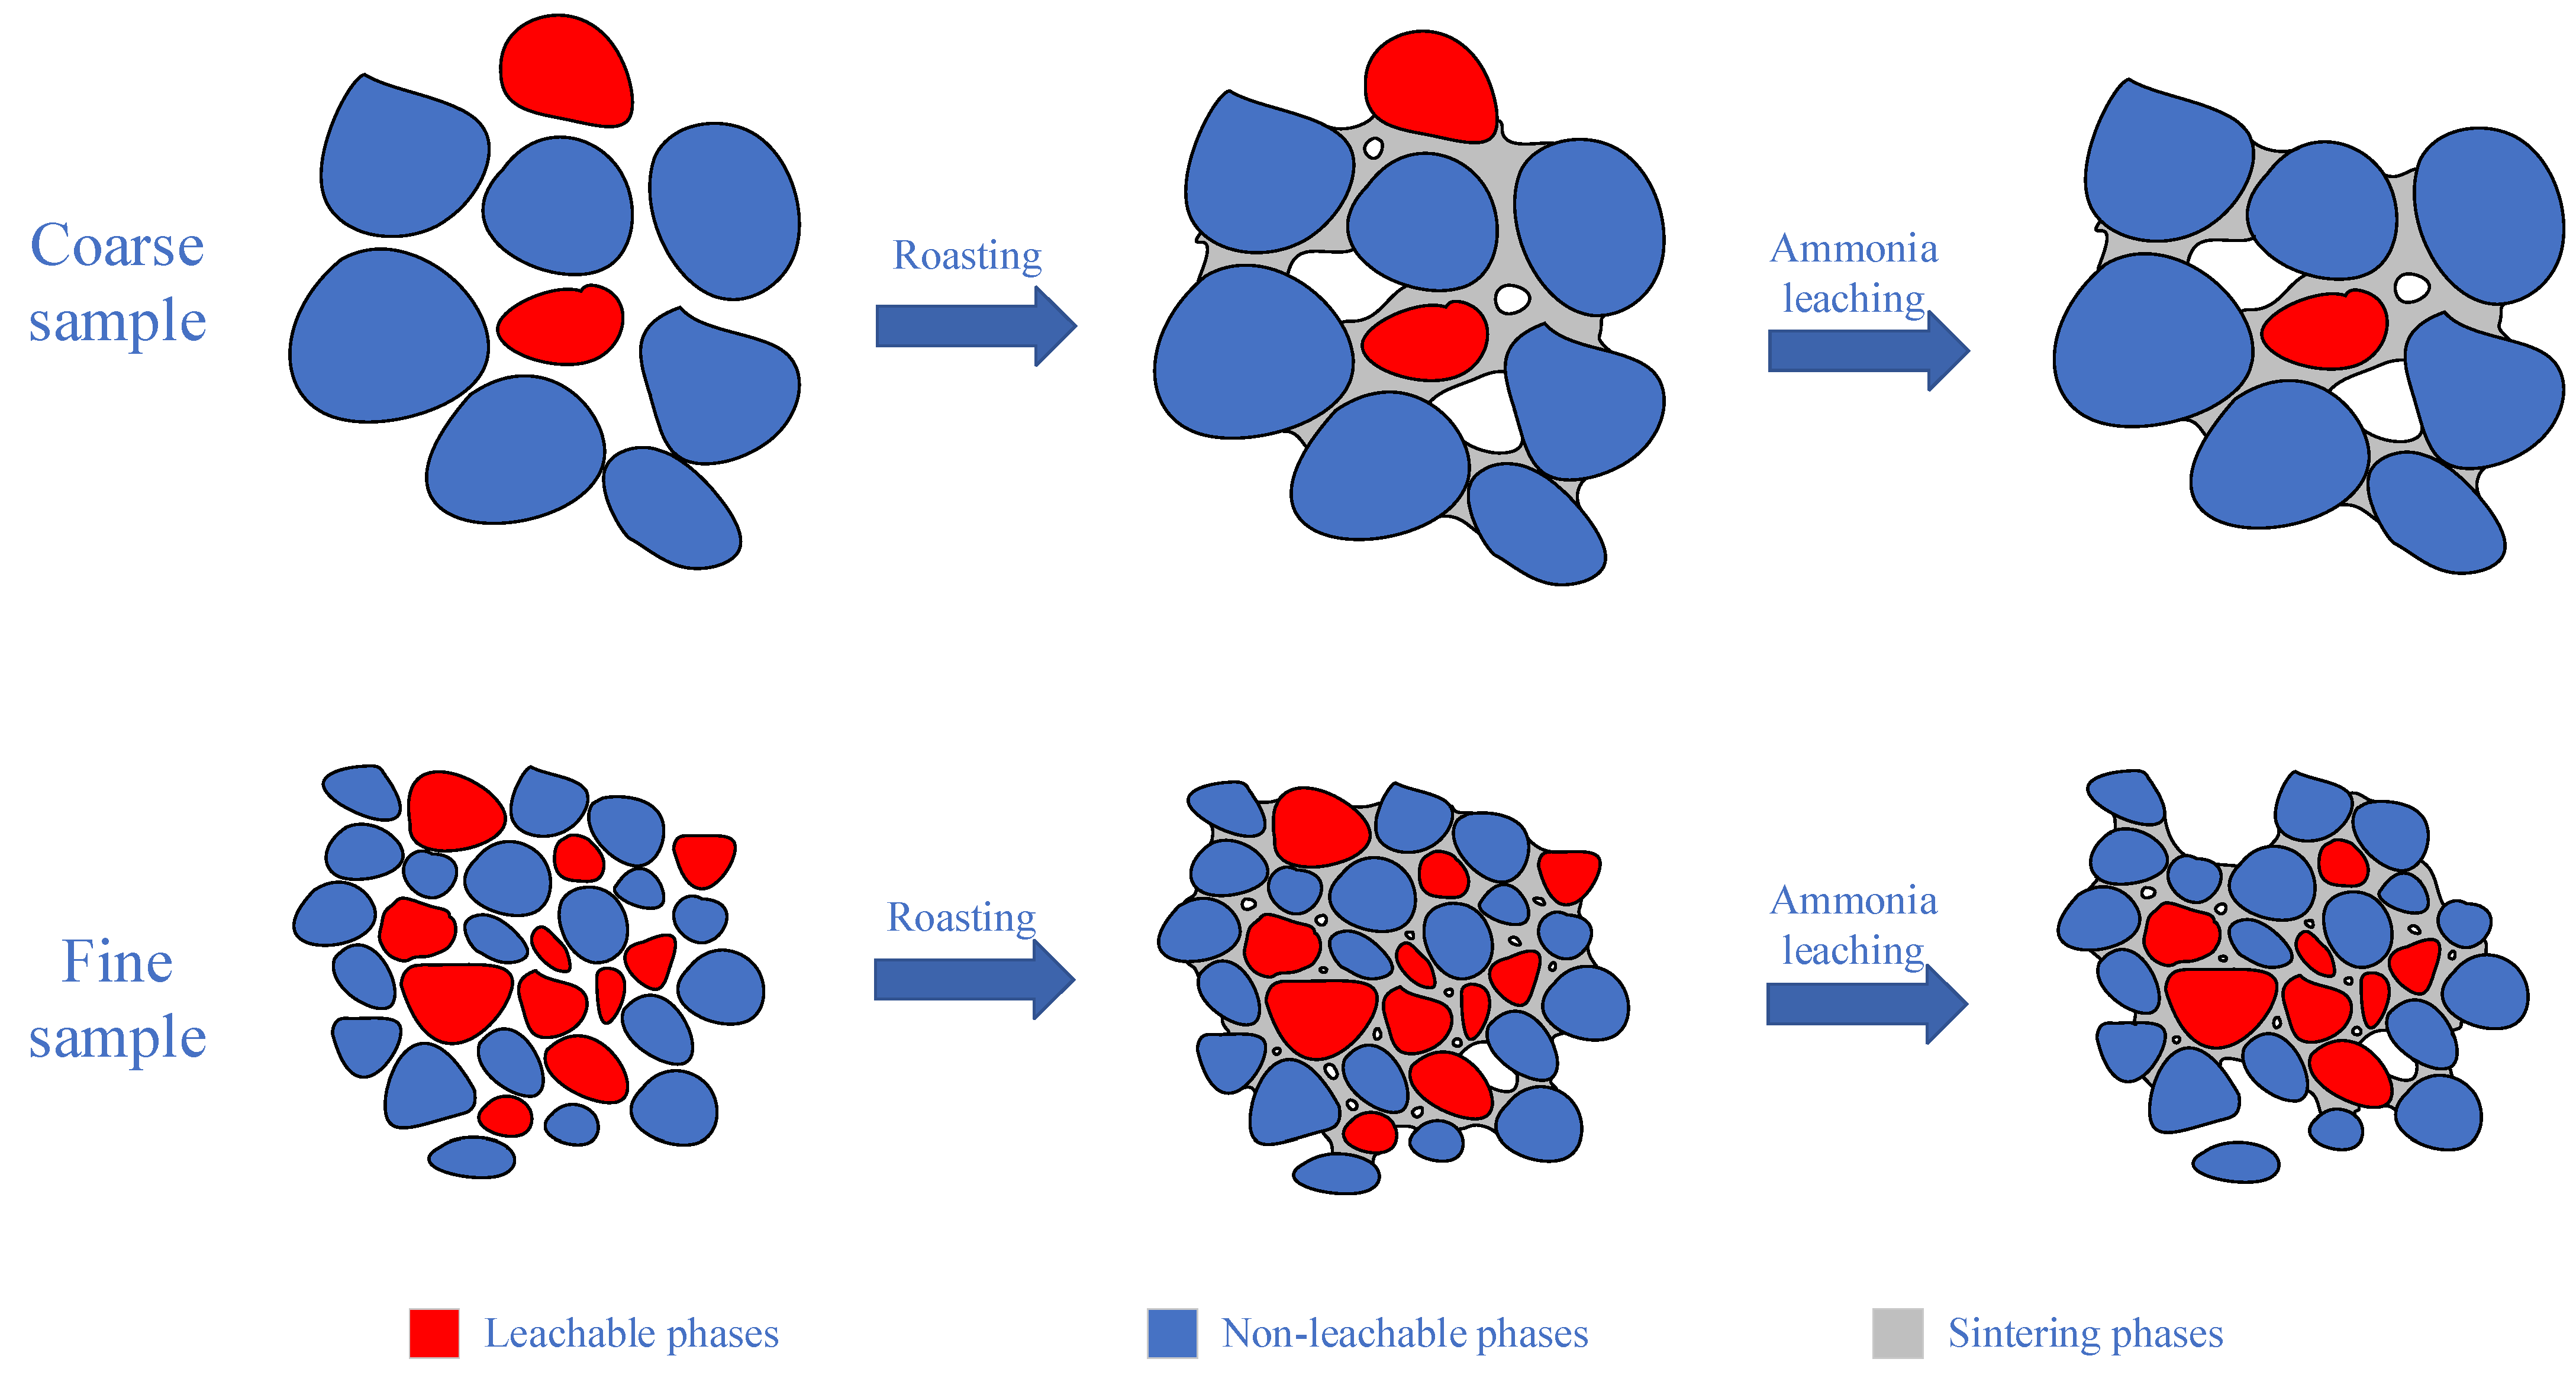
3.6. Effect of Particle Size on Leaching of Molybdenum and Potassium

The changes of mass fractions of Mo and K in samples with different particle sizes in the production process were obtained by the experimental method of Section 2.2. The X-ray fluorescence spectrometry (XRF) test results were verified by ICP test results, and the X-ray fluorescence spectrometry (XRF) test results were shown in Figure 12.
According to the test results in Figure 12, the change of element mass in each process is calculated respectively so that the influence of potassium and molybdenum content in samples with different particle sizes during roasting, washing and ammonia leaching is accurately analyzed:
m i 1 = m 1 ω i 1 m 1 ω i 2
m i 2 = m 2 ω i 2 m 2 ω i 3
m i 3 = m 3 ω i 3 m 3 ω i 4
where m i 1 , m i 2 and m i 3 are the mass loss of an element during roasting, water washing and ammonia leaching respectively, g; m 1 and m 1 are, respectively, the mass of samples before and after roasting in Section 2.1, g; m 2 and m 2 are, respectively, the mass of sample before and after washing in Section 2.1, g; m 3 and m 3 are, respectively, the mass of sample before and after ammonia leaching in Section 2.1, g; ω i 1 , ω i 2 , ω i 3 and ω i 4 are the mass fractions of an element in the samples before roasting, after roasting, after washing and after ammonia leaching, respectively.
According to the results of Figure 12 and the calculation of Equations (7) and (8), Mo has little mass loss during roasting and washing. The mass loss of K in the roasting process is very small, but the mass loss in the washing process is very large, mainly because soluble K+ is removed in the washing process.
Using the data from Figure 12 and calculations using Equation (9), the change in solid phase masses of Mo and K that are during the ammonia leaching process can be calculated. In order to fully express the extraction efficiency of molybdenum and potassium for the two samples in the ammonia leaching process, 10 g each of washed molybdenum calcine were taken for ammonia leaching, and mass changes of the solids, and contents of Mo and K were calculated and shown in Figure 13.
As shown in Figure 13, elements in the coarse sample are more conducive to extracting into ammonia solution. The extraction of molybdenum in the fine samples is slightly higher than that in the coarse sample. Potassium in the fine sample is more difficult to extract into ammonia solution. Therefore, the particle size of the molybdenum concentrate sample has noticeable impact on the extraction of molybdenum and potassium. The extractions can be calculated by the following formula:
μ i = m 3 ω i 3 m 3 ω i 4 m 3 ω i 3 100 %
where μ i is the extraction of an element in the sample during ammonia leaching, %. The extractions of molybdenum and potassium are 86.7% and 10.3%, respectively, in the coarse sample, and 82.8% and 8.35% respectively in the fine sample.
Production experience shows that molybdenum concentrate roasting is usually accompanied by sintering. After roasting and washing, most MoO3 can be leached into ammonia leaching solution, while the remaining small amount of MoO3 is not contacted by ammonia water because it forms the three mixtures analyzed in Section 3.5 with impurities during roasting (as shown in Figure 11). Based on the properties and characteristics of the products formed after roasting of molybdenum concentrate with different particle sizes in the above simulation experiment, and verified by the analysis of microstructure solid phase structure of BSE, the influence mechanism of sintered particles which forms from molybdenum concentrate with different particle sizes during roasting on the ammonia leaching effect can be obtained, and its schematic diagram is shown in Figure 14.
As can be seen from Figure 14, sintering necks can be formed between some adjacent substances, and part of MoO3 and K-containing minerals are encapsulated in the particles and cannot contact with the liquid phase. Compared with coarse particle size molybdenum concentrate, the sintered products generated by fine particle size molybdenum concentrate have higher density and smaller pore area. This reduces the contact area between the leachable components and ammonia water, thereby reducing the extractions of Mo and K.

4. Conclusions

(1) Typical impurity elements are mainly present in molybdenum concentrates in the form of large molecular weight potassium minerals and other minerals that include FeS2, CaSO4, SiO2, etc. FeS2, CaSO4, SiO2 and other impurities significantly promoted the formation of sintered aggregates during roasting process, and the sintered aggregates further hindered the extraction of Mo and K. Humidification during roasting was conducive to improving the conversion of impurity silicate minerals to soluble ions. Roasting fine molybdenum concentrate was helpful to reduce the impurity content in molybdenum products.
(2) The results of experimental and thermodynamic analysis show that K in molybdenum concentrate mainly comes from muscovite and orthoclase. During the roasting process, the H2SO4 formed by the contact between the water formed by the dehydration of minerals and the roasted gas product SO2 can promote the transformation of potassium minerals into soluble ions. Therefore, the amount of H2SO4 generated on the particle surface can be increased by increasing the dehydration rate of minerals or humidification, thus increasing the conversion of impurity minerals to soluble ions. This is conducive to improving the purity of ammonium molybdate products.
(3) The particle size of molybdenum concentrate impacts the extraction of Mo and K. Compared with coarse molybdenum concentrate, fine molybdenum concentrate was easier to form compact sintered particles with impurities such as FeS2, CaSO4, SiO2. MoO3 is encapsulated in the sintered agglomerates and cannot contact with ammonia water, hence only MoO3 on the outside of the sintered agglomerates can be dissolved in ammonia water, thus reducing the extraction of Mo.

Author Contributions

Conceptualization, Q.L. and W.F.; methodology, Q.L.; resources, Q.L.; software, R.L.; formal analysis, Q.L. and R.L.; investigation, R.L. and M.W.; data curation, R.L. and S.Y.; writing, Q.L. and R.L.; writing—review and editing, Q.L and R.L.; supervision, Q.L and S.Y.; project administration, Q.L. and S.Y.; funding acquisition, Q.L. All authors have read and agreed to the published version of the manuscript.

Funding

The authors would like to express their thanks for the support to this work by Natural Science Foundation of Shaanxi Province (2019JLM-34).

Data Availability Statement

Not applicable.

Conflicts of Interest

The authors declare no conflict of interest.

References

  1. Zhong, C.H.; Wang, H.H.; Zhang, L.Z.; Guo, M.C.; Feng, B. Flotation separation of molybdenite and talc by xanthan gum. Powder Technol. 2021, 388, 158–165. [Google Scholar] [CrossRef]
  2. Sheybani, K.; Paydar, M.H.; Shariat, M.H. Effect of mechanical activation on aluminothermic reduction of molybdenum trioxide. Int. J. Refract. Hard Met. 2019, 82, 245–254. [Google Scholar] [CrossRef]
  3. Shafiei Bafti, B.; Svojtka, M.; Abdolahi, M. Geochemistry of Rhenium and Other Trace Elements in Molybdenite; SarCheshmeh Porphyry Cu-Mo Deposit, Iran. Acta Geol. Sin. Engl. 2021, 95, 19. [Google Scholar] [CrossRef]
  4. Gan, M.; Fan, X.; Chen, X.; Wu, C. Reaction mechanisms of low-grade molybdenum concentrate during calcification roasting process. Trans. Nonferrous Met. Soc. China 2016, 26, 3015–3023. [Google Scholar] [CrossRef]
  5. Tyagi, P.; Choudhary, S. Tuning the electronic and optical properties of molybdenite (MoS2) by adsorption of alkali metals and halogens. Opt. Mater. 2021, 118, 111248.1–111248.8. [Google Scholar] [CrossRef]
  6. Keilholz, S.; Kohlmann, H.; Uhlenhut, H.; Gabke, A.; García-Schollenbruch, M. In situ X-ray diffraction studies on the production process of molybdenum. Inorg. Chem. 2022, 61, 10126–10132. [Google Scholar] [CrossRef]
  7. Zhu, Q.; Xie, M.X.; Shang, X.T.; An, G.; Sun, J.; Wang, N.; Xi, S.; Bu, C.Y.; Zhang, J.P. Research Status and Progress of Welding Technologies for Molybdenum and Molybdenum Alloys. Metals 2020, 10, 279. [Google Scholar] [CrossRef] [Green Version]
  8. Gui, D.; Hua, Y.N.; Xing, Z.X.; Zhao, S.P. Investigation of Potassium Contamination in SOI Wafer Using Dynamic SIMS. IEEE Trans. Device Mater. Reliab. 2007, 7, 369–372. [Google Scholar] [CrossRef]
  9. Hung, H.Y.; Lu, C.W.; Lee, C.Y.; Hsu, C.S.; Hsieh, Y.Z. Analysis of metal ion impurities in liquid crystals using high resolution inductively coupled plasma mass spectrometry. Anal. Methods 2012, 4, 3631–3637. [Google Scholar] [CrossRef]
  10. Shekhter, L.N.; Litz, J.E.; Shan, N.M.; Mchugh, L.F. Thermodynamic modelling of molybdenite roasting in a multiple-hearth furnace. JOM 2021, 73, 873–880. [Google Scholar] [CrossRef]
  11. Kan, S.; Benzeik, K.; Odabas, Ö.C.; Yvcel, O. Investigation of molybdenite Concentrate Roasting in Chamber and Rotary Furnaces. Min. Met. Explor. 2021, 38, 1597–1608. [Google Scholar] [CrossRef]
  12. Chen, Y.; Xie, J.; Chang, Q.; Ma, D. Research progress of preparation technology of molybdenum powder. Trans. Mater. Heat Treat. 2020, 41, 14–24. (In Chinese) [Google Scholar]
  13. Zhang, M.P.; Liu, C.H.; Zhu, X.J.; Xiong, H.B.; Zhang, L.B.; Gao, J.Y.; Liu, M.H. Preparation of ammonium molybdate by oxidation roasting of molybdenum concentrate: A comparison of microwave roasting and conventional roasting. Chem. Eng. Process 2021, 167, 108550. [Google Scholar] [CrossRef]
  14. Liu, J.; Qiu, Z.F.; Yang, J.; Cao, L.M.; Zhang, W. Recovery of Mo and Ni from spent acrylonitrile catalysts using an oxidation leaching–chemical precipitation technique. Hydrometallurgy 2016, 164, 64–70. [Google Scholar] [CrossRef]
  15. Li, X.Y.; Zhang, L.; Wang, G.H.; Qin, M.L.; Qu, X.H.; So, K.P. Influence of impurities on hot-rolled molybdenum for high temperature applications. Int. J. Refract. Met. Hard Mater. 2020, 92, 105294. [Google Scholar] [CrossRef]
  16. Cheng, L.; Zhao, Z.; Zhao, Y.; Ding, W.; Zhang, Y.; Huang, W. Preparation of high purity molybdenum disulfide by one stage purification from molybdenum concentrate. Chem. Eng. 2018, 32, 11–13. (In Chinese) [Google Scholar]
  17. Gao, Z.; Xie, X.; Hui, S. New method for producing impurity of molybdenum disulfide. China Molybdenum Ind. 2019, 43, 42–45. (In Chinese) [Google Scholar]
  18. Aracena, A.; Sanino, A.; Jerez, O. Dissolution kinetics of molybdite in KOH media at different temperatures. Trans. Nonferrous Met. Soc. China 2018, 28, 177–185. [Google Scholar] [CrossRef]
  19. Yang, L.Q.; Li, X.B.; Qi, T.G.; Liu, G.H.; Peng, Z.H.; Zhou, Q.S. Direct synthesis of pure ammonium molybdates from ammonium tetramolybdate and ammonium bicarbonate. ACS Sustain. Chem. Eng. 2020, 8, 18237–18244. [Google Scholar] [CrossRef]
  20. Tang, L.; Li, X.; Liu, D. Soluble potassium change mechanism analysis in the process of roasting molybdenum concentrate mineral. China Molybdenum Ind. 2016, 40, 42–43+49. (In Chinese) [Google Scholar]
  21. Yi, G.S.; Macha, E.; Dyke, J.V.; Macha, R.; Mckay, T.; Free, M.L. Recent progress on research of molybdenite flotation: A review. Adv. Colloid Interface Sci. 2021, 295, 102466. [Google Scholar] [CrossRef] [PubMed]
  22. Shalchian, H.; Khaki, J.V.; Babakhani, A.; Michelis, I.D.; Veglio, F.; Parizi, M.T. An enhanced dissolution rate of molybdenite and variable activation energy. Hydrometallurgy 2018, 175, 52–63. [Google Scholar] [CrossRef]
  23. Wang, L.; Zhang, G.H.; Dang, J.; Chou, K.C. Oxidation roasting of molybdenite concentrate. Trans. Nonferrous Met. Soc. China 2015, 25, 4167–4174. [Google Scholar] [CrossRef]
  24. Tumen-Ulzii, N.; Batnasan, A.; Gunchin, B. Selective dissolution of copper and iron from molybdenite concentrate using acidic sodium nitrate solution. Miner. Eng. 2022, 185, 107715. [Google Scholar] [CrossRef]
  25. Wang, L.; Zhang, G.H.; Wang, J.S.; Chou, K.C. Influences of different components on agglomeration behavior of MoS2 during oxidation roasting process in air. Metall. Mater. Trans. B 2016, 47, 2421–2432. [Google Scholar] [CrossRef]
  26. Popov, V.V.; Menushenkov, A.P.; Yastrebtsev, A.A.; Molokova, A.Y.; Pisarev, A.A.; Khramov, E.V.; Zubavichus, Y.V.; Shchetinin, I.V.; Ponkratov, K.V.; Tsarenko, N.A.; et al. The synthesis and studies of crystal/local structures and morphology of hydrated molybdenum oxides. J. Solid State Chem. 2021, 301, 122356. [Google Scholar] [CrossRef]
  27. Camalan, M.; Cavur, M. Development of a supervised classification method to construct 2D mineral maps on backscattered electron images. Turk. J. Electr. Eng. Comput. Sci. 2019, 28, 1030–1043. [Google Scholar] [CrossRef]
  28. Li, X.B.; Wu, T.; Zhou, Q.S.; Qi, T.G.; Peng, Z.H.; Liu, G.H. Kinetics of oxidation roasting of molybdenite with different particle sizes. Trans. Nonferrous Met. Soc. China. 2021, 31, 842–852. [Google Scholar] [CrossRef]
  29. Lv, L.; Li, C.; Zhang, G.H.; Hu, X.W.; Liang, B. Decomposition behavior of CaSO4 during potassium extraction from a potash feldspar-CaSO4 binary system by calcination. Chin. J. Chem. Eng. 2018, 26, 838–844. [Google Scholar] [CrossRef]
  30. Massonne, H.J.; Fockenberg, T. Melting of phengite-bearing eclogite at pressures of 4 and 9 GPa relevant to deep regions of a subduction zone. Earth Planet. Sci. Lett. 2022, 584, 117475. [Google Scholar] [CrossRef]
  31. Jena, S.K.; Mohanty, B.; Padhy, G.; Sahu, J.; Kandi, S.K. Potassium recovery from muscovite using NaCl-roasting followed by H2SO4-leaching. J. Cent. South Univ. 2022, 29, 1881–1894. [Google Scholar] [CrossRef]
  32. Yuan, J.Y.; Yang, J.; Ma, H.W.; Su, S.Q.; Chang, Q.Q.; Komarneni, S. Hydrothermal Synthesis of nano-kaolinite from K-feldspar. Ceram. Int. 2018, 44, 15611–15617. [Google Scholar] [CrossRef]
  33. Salimkhani, H.; Joodi, T.; Bordbar-Khiabani, A.; Dizaji, A.M.; Abdolalipour, B.; Azizi, A. Surface and structure characteristics of commercial K-Feldspar powders: Effects of temperature and leaching media. Chin. J. Chem. Eng. 2020, 28, 307–317. [Google Scholar] [CrossRef]
  34. Liu, C.J.; Ma, H.W. Hydrothermal decomposition process of K-feldspar in NaOH solution. Asia-Pac. J. Chem. Eng. 2020, 16, e2578. [Google Scholar] [CrossRef]
  35. Liu, J.N.; Zhai, Y.C.; Wu, Y.; Zhang, J.; Shen, X.Y. Kinetics of roasting potash feldspar in presence of sodium carbonate. J. Cent. South Univ. 2017, 24, 1544–1550. [Google Scholar] [CrossRef]
  36. Ma, J.Y.; Zhang, Y.F.; Qin, Y.H.; Wu, Z.K.; Wang, T.L.; Wang, C.W. The leaching kinetics of K-feldspar in sulfuric acid with the aid of ultrasound. Ultrason. Sonochem. 2017, 35, 304–312. [Google Scholar] [CrossRef]
  37. Wang, L.; Li, M.; Que, B.; Xue, Z.; Zhang, G.; Lan, W. Oxidation roasting of molybdenite concentrate. Chin. J. Nonferr. Metal. 2021, 31, 1952–1964. (In Chinese) [Google Scholar] [CrossRef]
  38. Gomes, T.; Rosa, R.; Cargnin, M.; Quadri, M.B.; Peterson, M.; Oliveira, C.M.; RosaRabelo, N.; Angioletto, E. Pyrite roasting in modified fluidized bed: Experimental and modeling analysis. Chem. Eng. Sci. 2022, 261, 117977. [Google Scholar] [CrossRef]
  39. Aracena, A.; Jerez, O.; Ortiz, R.; Morales, J. Pyrite oxidation kinetics in an oxygen–nitrogen atmosphere at temperatures from 400 to 500 °C. Can. Metall. Q. 2016, 55, 195–201. [Google Scholar] [CrossRef]
  40. Zhang, Y.; Li, Q.; Liu, X.L.; Xu, B.; Yang, Y.B.; Jiang, T. A Thermodynamic Analysis on the Roasting of Pyrite. Minerals 2019, 9, 220. [Google Scholar] [CrossRef]
Figure 1. Ammonium molybdate production process.
Minerals 13 00035 g001
Figure 2. Distribution of elements in molybdenum concentrates with different particle sizes. (a) Content of Mo, S; (b) Content of Fe, Ru, Ca, Al; (c) Content of Pb, Cu, Mg; (d) Content of Si, K.
Minerals 13 00035 g002
Figure 3. XRD analysis of molybdenum concentrate and molybdenum calcine. (a) molybdenum concentrate; (b) molybdenum calcine.
Minerals 13 00035 g003
Figure 4. SEM images of different samples. (a) Molybdenum concentrate; (b) Molybdenum calcine; (c) Ammonia leaching residue.
Minerals 13 00035 g004
Figure 5. Mass fractions of potassium minerals during roasting-washing process.
Minerals 13 00035 g005
Figure 6. Thermodynamic analysis of soluble potassium from orthoclase.
Minerals 13 00035 g006
Figure 7. Enhanced backscattered electron microscope images of molybdenum concentrate, molybdenum calcine and washed molybdenum calcine. (a) Muscovite in molybdenum concentrate; (b) Orthoclase in molybdenum concentrate; (c) Muscovite in molybdenum calcine; (d) Orthoclase in molybdenum calcine; (e) Muscovite in washed molybdenum calcine (f) Orthoclase in washed molybdenum calcine.
Minerals 13 00035 g007aMinerals 13 00035 g007b
Figure 8. MLA scan analysis images under different conditions. (a) MLA scan analysis image of humidified molybdenum calcine; (b) MLA scan analysis image of Non-humidified molybdenum calcine.
Minerals 13 00035 g008
Figure 9. XRD analysis of ammonia leaching residue.
Minerals 13 00035 g009
Figure 10. The existence form of molybdenum in ammonia leaching residue/%.
Minerals 13 00035 g010
Figure 11. Enhanced backscattered electron microscope images of mixtures and MoO3 in ammonia leaching residue. (a) position 1; (b) position 2.
Minerals 13 00035 g011
Figure 12. Variation of element content in samples with different particle sizes. (a) Mass fraction change of Mo; (b) mass fraction change of K.
Minerals 13 00035 g012
Figure 13. Mass change of elements in samples with different particle sizes during ammonia leaching. (a) Mass change of sample, (b) mass change of Mo, (c) mass change of K.
Minerals 13 00035 g013
Figure 14. Leaching mechanism of phases in samples with different particle sizes during ammonia leaching process.
Minerals 13 00035 g014
Table 1. EDS analysis of main elements in different samples/%.
ElementMolybdenum ConcentrateMolybdenum CalcineAmmonia Leaching Residue
O1.4940.5441.49
Al0.130.142.79
S40.671.070.86
K0.130.150.08
Fe0.460.4820.17
Mo56.4456.9112.24
Si0.680.7122.37
Table 2. Mineral phase and content of molybdenum concentrate determined by MLA.
NameChemical FormulaPercentage of Weight/%Percentage of Area/%Area/μm2Number of Mineral Particles
IronFe0.020.01479.271
RutileTiO20.010.01260.853
CalciteCaCO30.010.01419.369
ChloriteFe2+3Mg1.5AlFe3+0.5Si3AlO12(OH)60.020.041092.0916
HematiteFe2O30.040.03999.7318
KaoliniteAl2Si2O5(OH)40.040.061699.9216
IlliteK0.6(H3O)0.4Al1.3Mg0.3Fe2+0.1Si3.5O10(OH)0.020.041102.0818
FluoriteCaF20.080.133774.2819
OrthoclaseKAlSi3O80.040.072045.6520
ChalcopyriteCuFeS20.040.041253.120
AnanditeBa0.75K0.25Fe2+2.25Mg0.75Si3Al0.7Fe3+0.3O10S1.5(OH)0.50.040.041190.6926
MiniumPb2PbO40.110.072020.6958
MuscoviteKAl3Si3O10(OH)1.8F0.20.360.6318,799102
QuartzSiO20.270.5115,371.793
AnhydriteCaSO40.150.257366.33144
PyriteFeS21.230.2136,359.88297
MolybdeniteMoS295.5785.612,554,936.825,206
Unknown mineral 1.954.81143,533.615,992
Table 3. Ion contents in the washing solution.
Ion NameWashed SampleConcentration/(mmol·L−1)
K+Molybdenite concentrate0.0317
K+Molybdenum calcine0.2859
Al3+Molybdenum calcine0.7297
SO42-Molybdenum calcine1.1049
Table 4. Effect of humidification on the content of impurity elements in washed molybdenum calcine/%.
ElementAlKSSiFeMoCa
Humidified0.090.121.061.090.9856.40.23
Non-humidified0.140.151.081.121.0456.70.25
Table 5. MLA analysis results of washed molybdenum calcine under different conditions/%.
NameChemical FormulaPercentage of Weight/% (Humidified)Percentage of Weight/% (Non-Humidified)
Molybdenum OxideMoO386.4386.80
OrthoclaseKAlSi3O80.030.17
RutileTiO20.010.01
CorundumAl2O30.380.52
HematiteFe2O30.290.48
FerrotschermakiteCa2MgFe2Al3FeSi6O22(OH)20.010.07
IlliteK0.6(H3O)0.4Al1.3Mg0.3Fe2+0.1Si3.5O10(OH)0.010.02
FluoriteCaF20.070.09
FerrimolybditeFe3+2(MoO4)3·n(H2O)0.751.11
AnanditeBa0.75K0.25Fe2+2.25Mg0.75Si3Al0.7Fe3+0.3O10S1.5(OH)0.50.440.46
MuscoviteKAl3Si3O10(OH)1.8F0.20.050.10
QuartzSiO21.121.67
MolybdeniteMoS20.030.02
Mixture of molybdenum oxide and pyriteMoO3, FeS21.811.61
Mixture of molybdenum oxide and anhydriteMoO3, CaSO40.950.83
Mixture of molybdenum oxide and quartzMoO3, SiO21.661.53
Mixture of quartz and pyriteSiO2, FeS20.370.31
Disclaimer/Publisher’s Note: The statements, opinions and data contained in all publications are solely those of the individual author(s) and contributor(s) and not of MDPI and/or the editor(s). MDPI and/or the editor(s) disclaim responsibility for any injury to people or property resulting from any ideas, methods, instructions or products referred to in the content.

