Article

Research on the Overburden Movement Law of Thick Coal Seam Without-Support Gangue-Filling Mining

1
State Key Laboratory of Coal Resources and Mine Safety, China University of Mining & Technology, Xuzhou 221116, China
2
School of Mines, China University of Mining & Technology, Xuzhou 221116, China
*
Author to whom correspondence should be addressed.
Minerals 2023, 13(1), 53; https://doi.org/10.3390/min13010053
Submission received: 24 November 2022 / Revised: 21 December 2022 / Accepted: 24 December 2022 / Published: 28 December 2022
(This article belongs to the Section Environmental Mineralogy and Biogeochemistry)

Abstract

:
Filling mining technology is a feasible and effective means to build a green mine and protect the environment. In order to investigate the overlying rock movement law of gangue-filling mining under the condition of no support for thick coal seams, this paper takes the Sima mine as the research object and determines the relevant parameters of rock mechanics in the mine area through a uniaxial compression test, a uniaxial tensile test, and a uniaxial shear test, which lay the foundation for the numerical simulation and similar simulation experiments. The optimal solution was determined by the numerical simulation, the effects of mining width and mining sequence on the overlying rock stress and deformation were analyzed, and the accuracy of the results was further confirmed by combining with similar simulation experiments. The results show that the mining sequence of jump mining with large intervals adopted in this paper can make the backfill solidify fully and is more conducive to the working face support and roof management. The larger the mining width, the larger the deformation of the overlying rock seam and the surface. It shows that the smaller the mining width, the smaller the increase of stress caused by excavation and filling, which is more favorable to the stability of the coal column and filling body. This paper deals with coal mine solid waste, while realizing the effective control of surface subsidence and providing a theoretical basis for the construction of green mines.

1. Introduction

The mining of underground coal destroys the original stratigraphic structure of the mining area, which will cause the deformation of the rock stratum and the ground surface above the mined area [1,2]. In this process, the rock stratum and the ground surface will move, deform, fall, crack, etc., which is called “mining subsidence”. When the surface deformation caused by mining is too large, it will directly damage the surface of the building (structure), and even form a cave-in pit, causing serious accidents [3]. This kind of geological disaster has seriously affected people’s safe production and normal life, and its consequences have become a social focus, seriously threatening the harmony and stability of society.
Filling mining is a mining technology that uses the replacement of underground coal resources with filling materials, and when the coal is extracted, the filling body is filled into the mining area in time, which can effectively reduce the sinking space of the top rock layer, so as to achieve the purpose of control rock strata movement [4]. At present, many scholars have conducted research on the related problems of filling mining; Liu [5] established a simulation model of the irregular geometric shape of gangue grains by RGM model and simulated and analyzed the particle breakage and strain–stress relationship of gangue-filling materials with different lithologies. Huang [6], based on the elastic foundation theory, established the mechanical model of solid filling mining overburden thin slab and analyzed the critical condition of the top slab rock without breaking. The gangue lateral limit compression steel cylinder experiment was used to obtain the compression deformation and energy dissipation law of gangue with different particle sizes by changing the loading rate and initial loading rate conditions [7]. Karolina et al. used a numerical simulation to analyze the influence law of the size and quantity of ore pillars in deep mining on the damage of the surrounding rock in the extraction area and proposed an ore pillar scheme to control the stability of the surrounding rock in the quarry [8,9,10,11]. Guo and Li used the FLAC3D numerical simulation to study the influence range of movement angle and subsidence of rock movement under deep large dip mining conditions and analyzed the influence of different values of dip angle on the above factors [12,13]. Sun [14], based on the stratigraphic conditions of the Wanglou mine, simulated the surface deformation in deep mining with different combinations of mining widths and isolated coal pillar widths between working faces, and it was analyzed by et al. The filling mining mass ratio and solid waste material ratio of solid filling mining working face were designed for experiments, and the results all effectively controlled the ground strata movement and surface settlement [15,16]. Lu et al. studied the stress distribution of backfill materials under different particle size states and analyzed the stress distribution and deformation of backfill body [17,18]. The effect of filling mining on formation movement and sudden water was studied, and it was found that filling mining could effectively reduce the sudden water in the bottom slab [19]. By analyzing the main direction of groundwater migration change, Machowski studied the change law of surface subsidence in industrial urban areas caused by mining activities [20]. The study by Marian et al. explains and demonstrates the origin and development of subsidence basins caused by coal mining [21]. Solarski et al. took Bytom City as an example to evaluate the influence of underground mining activities for many years on the elevation change of the urban area [22]. Using a digital relief model, Maksymilian analyzed the effects of mining and metallurgical activities on land subsidence and dumps between 1883 and 1994 [23]. Stefan and Harald analyzed the differences in surface space under large-scale mining in the Ruhr region by comparing 100 years of digital surface models of the region [24]. Adam Nadudvari compared the surface data collected by DinSAR and SBAS methods to determine the most subsidence area of the surface and analyze its impact on the active mining area [25].
The gangue hill formed by the accumulation of a large amount of waste rock on the surface not only occupies the available land resources on the surface, but also causes problems such as spontaneous combustion, weathered and blow dust, leaching of heavy metals [26], pollution of the mine air and groundwater environment, and other problems. Therefore, how to effectively solve the gangue problem while ensuring the safety of mining is extremely important. A prediction model is proposed to accurately predict the surface dynamic sedimentation process of gangue-filling mining and assess the mining damage [27]. The characteristics of overburden rock strata movement when using gangue as solid waste filling material are analyzed [28]. Based on the equivalent mining height theory [29], the filling ratio is proposed as the theoretical control index of filling effect, and the control method of filling effect of solid gangue-filling mining is established [30]. A series of laboratory-based compression tests were conducted on gangue samples, and the hardening process of the filled gangue in the field test was analyzed [31]. The hydraulic properties of the cemented paste filling material were studied, and different specimens were made by controlling the amount of gangue for relevant tests, and the results controlled the top slab movement and surface subsidence effectively.
In this paper, gangue-filling mining under unsupported conditions in thick coal seams is studied, and the rock mechanical parameters of the analyzed mine area are determined by a uniaxial tensile test, a uniaxial compressive test, and a uniaxial shear test, and the stress and deformation changes of surrounding rocks under different options are analyzed by establishing numerical simulation models, and finally verified by similar simulation experiments. This article analyzes the movement law of the overlying strata during the mining process and realizes that, on the basis of extensive research on gangue-filling technology and subsidence control effects, it can effectively control surface subsidence while processing coal mine solid waste.

2. Geological Mining Conditions and Coal Rock Mechanics Parameters in the Mining Area

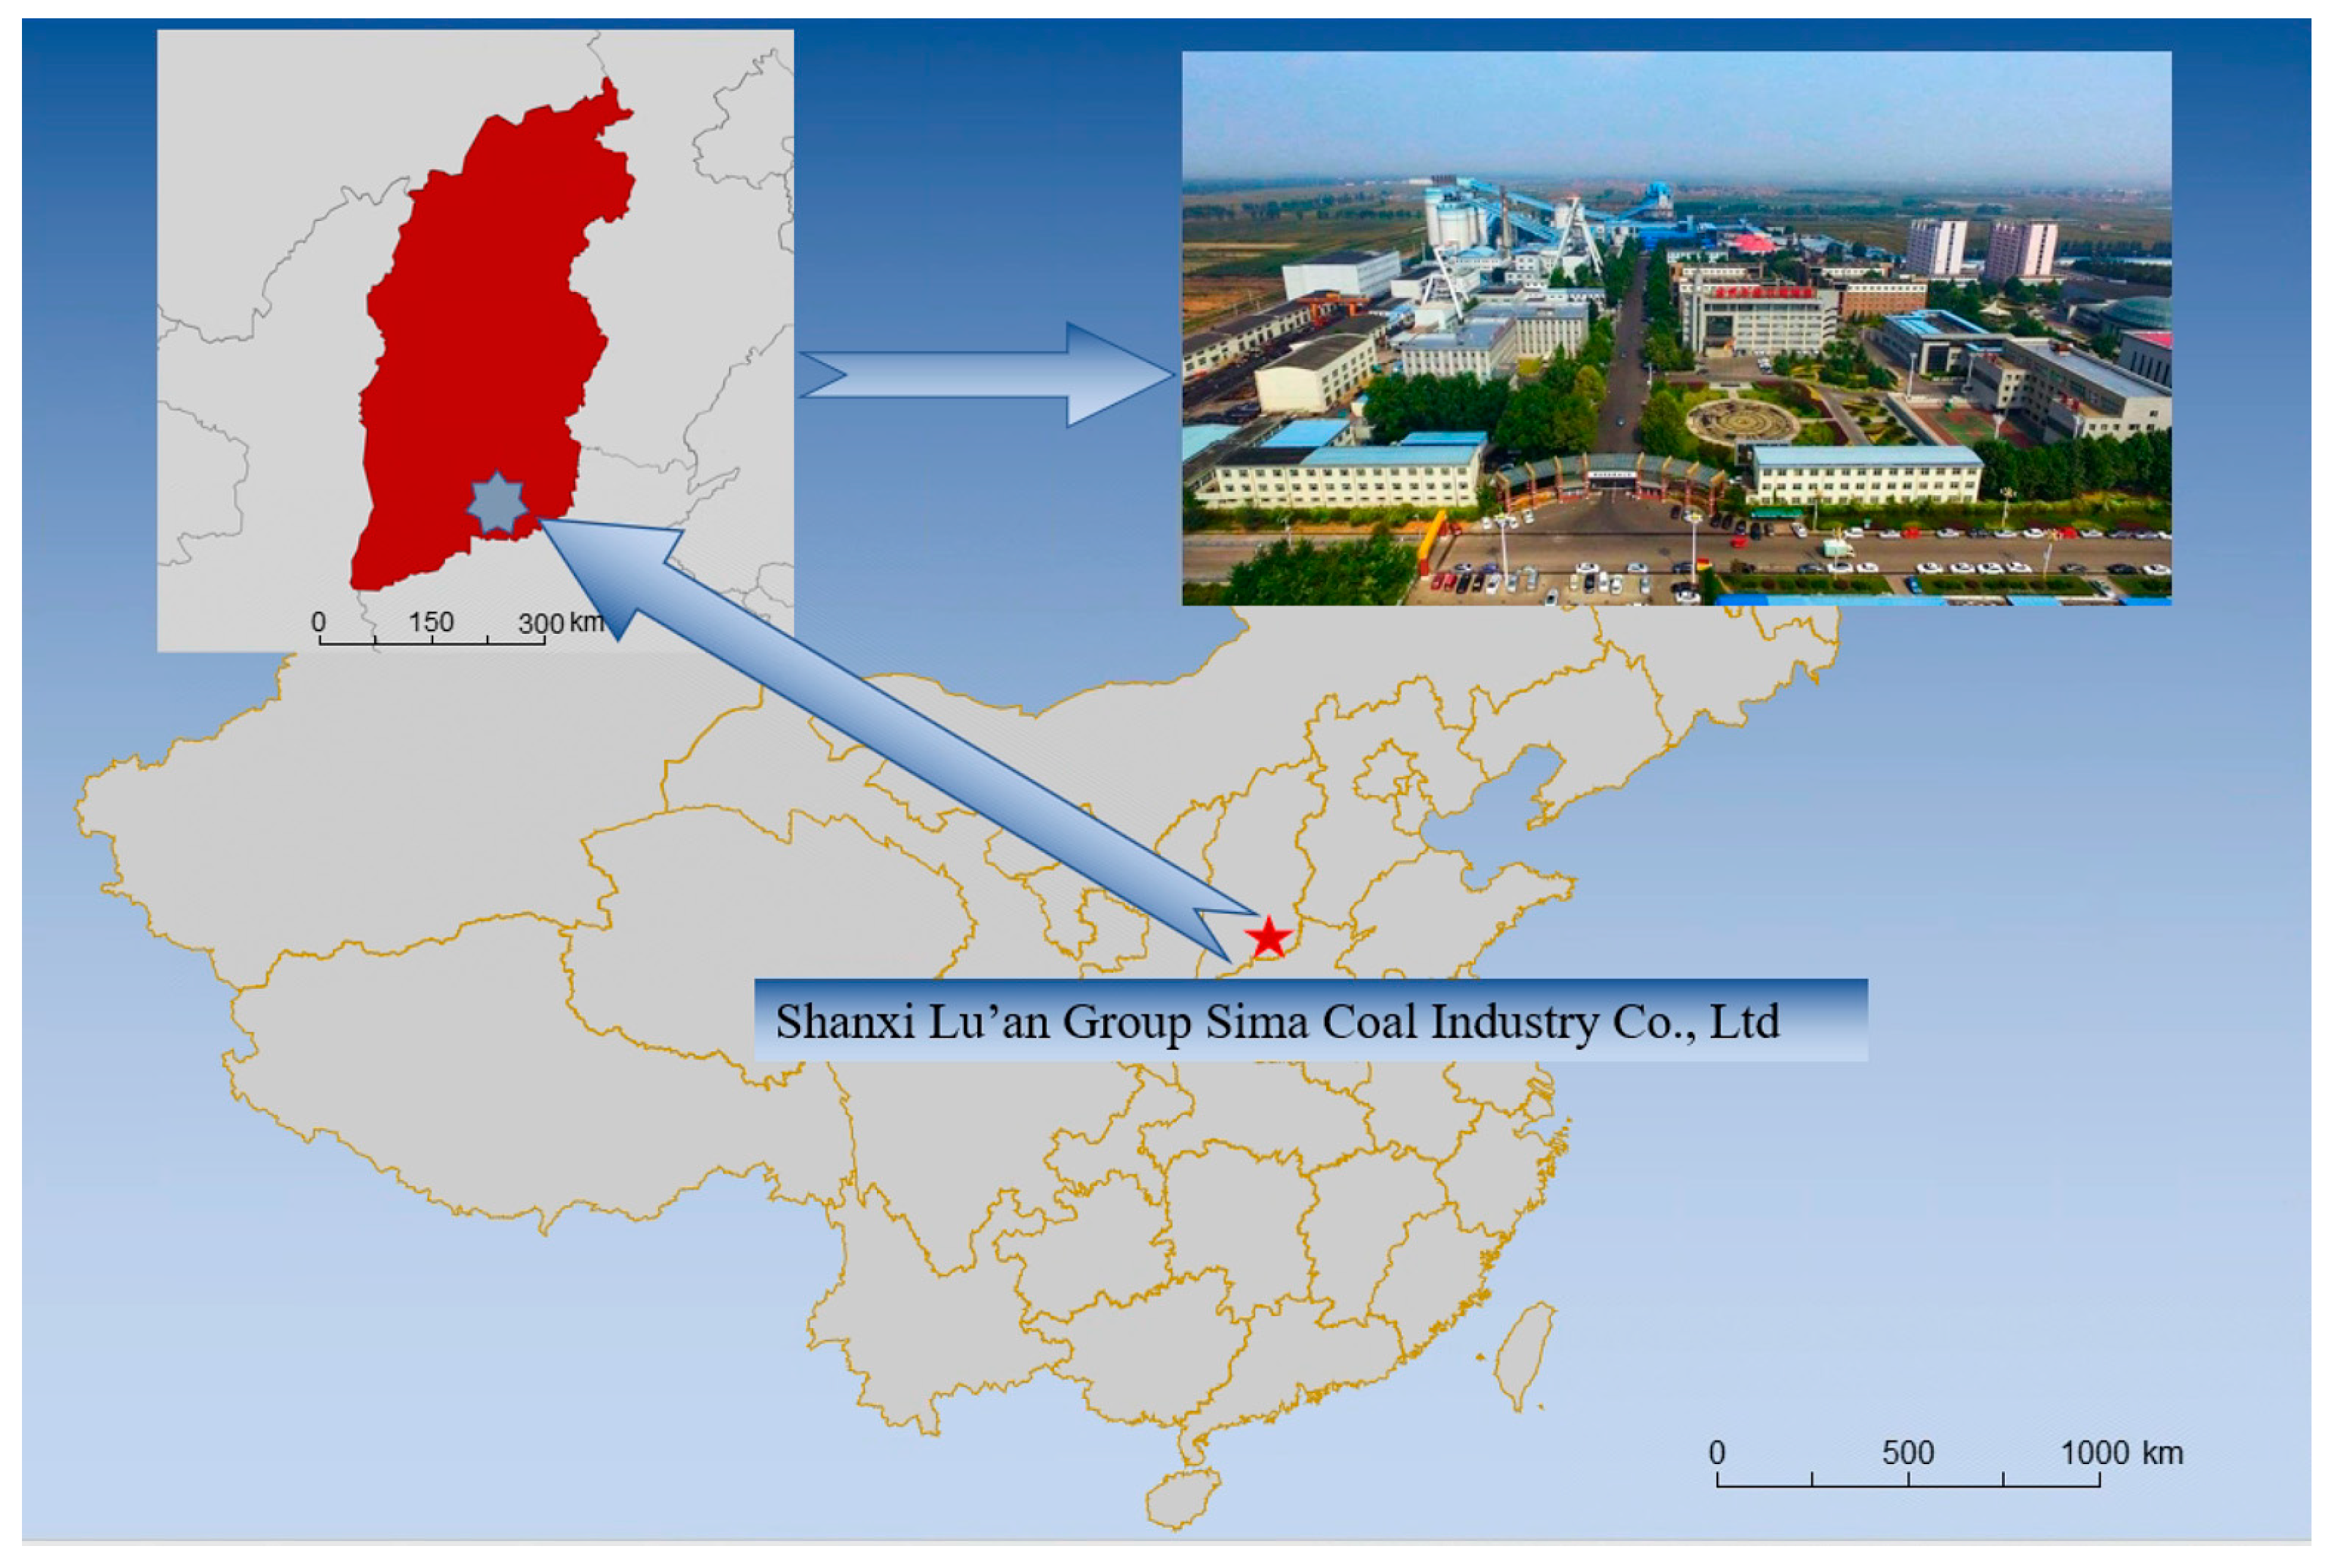
2.1. Overview of Geological Mining Conditions in the Mining Area

As shown in Figure 1, the Sima coal mine is located in Changzhi City, Shanxi Province, China. Its geographical location is 36°05′18″–36 °08′32″ north latitude and 113°00′33″–113°04′52″ east longitude. The mining area is located at the northeast boundary of the Sima mine field in the Changzhi District, and the surface is located at Chenggong Automobile Factory. The coal seam mined has a depth of 332 m, an average dip of 5°, and a topsoil layer thickness of 76.15 m. The immediate roof of the coal seam is 4.25 m grey-black mudstone, the old roof is 6.7 m grey-white fine-grained sandstone, and the floor of the coal seam is 3.55 m grey fine-grained sandstone with a muddy structure at the top. Some of the borehole columns are shown in Table 1.

2.2. Rock Mechanical Property Testing

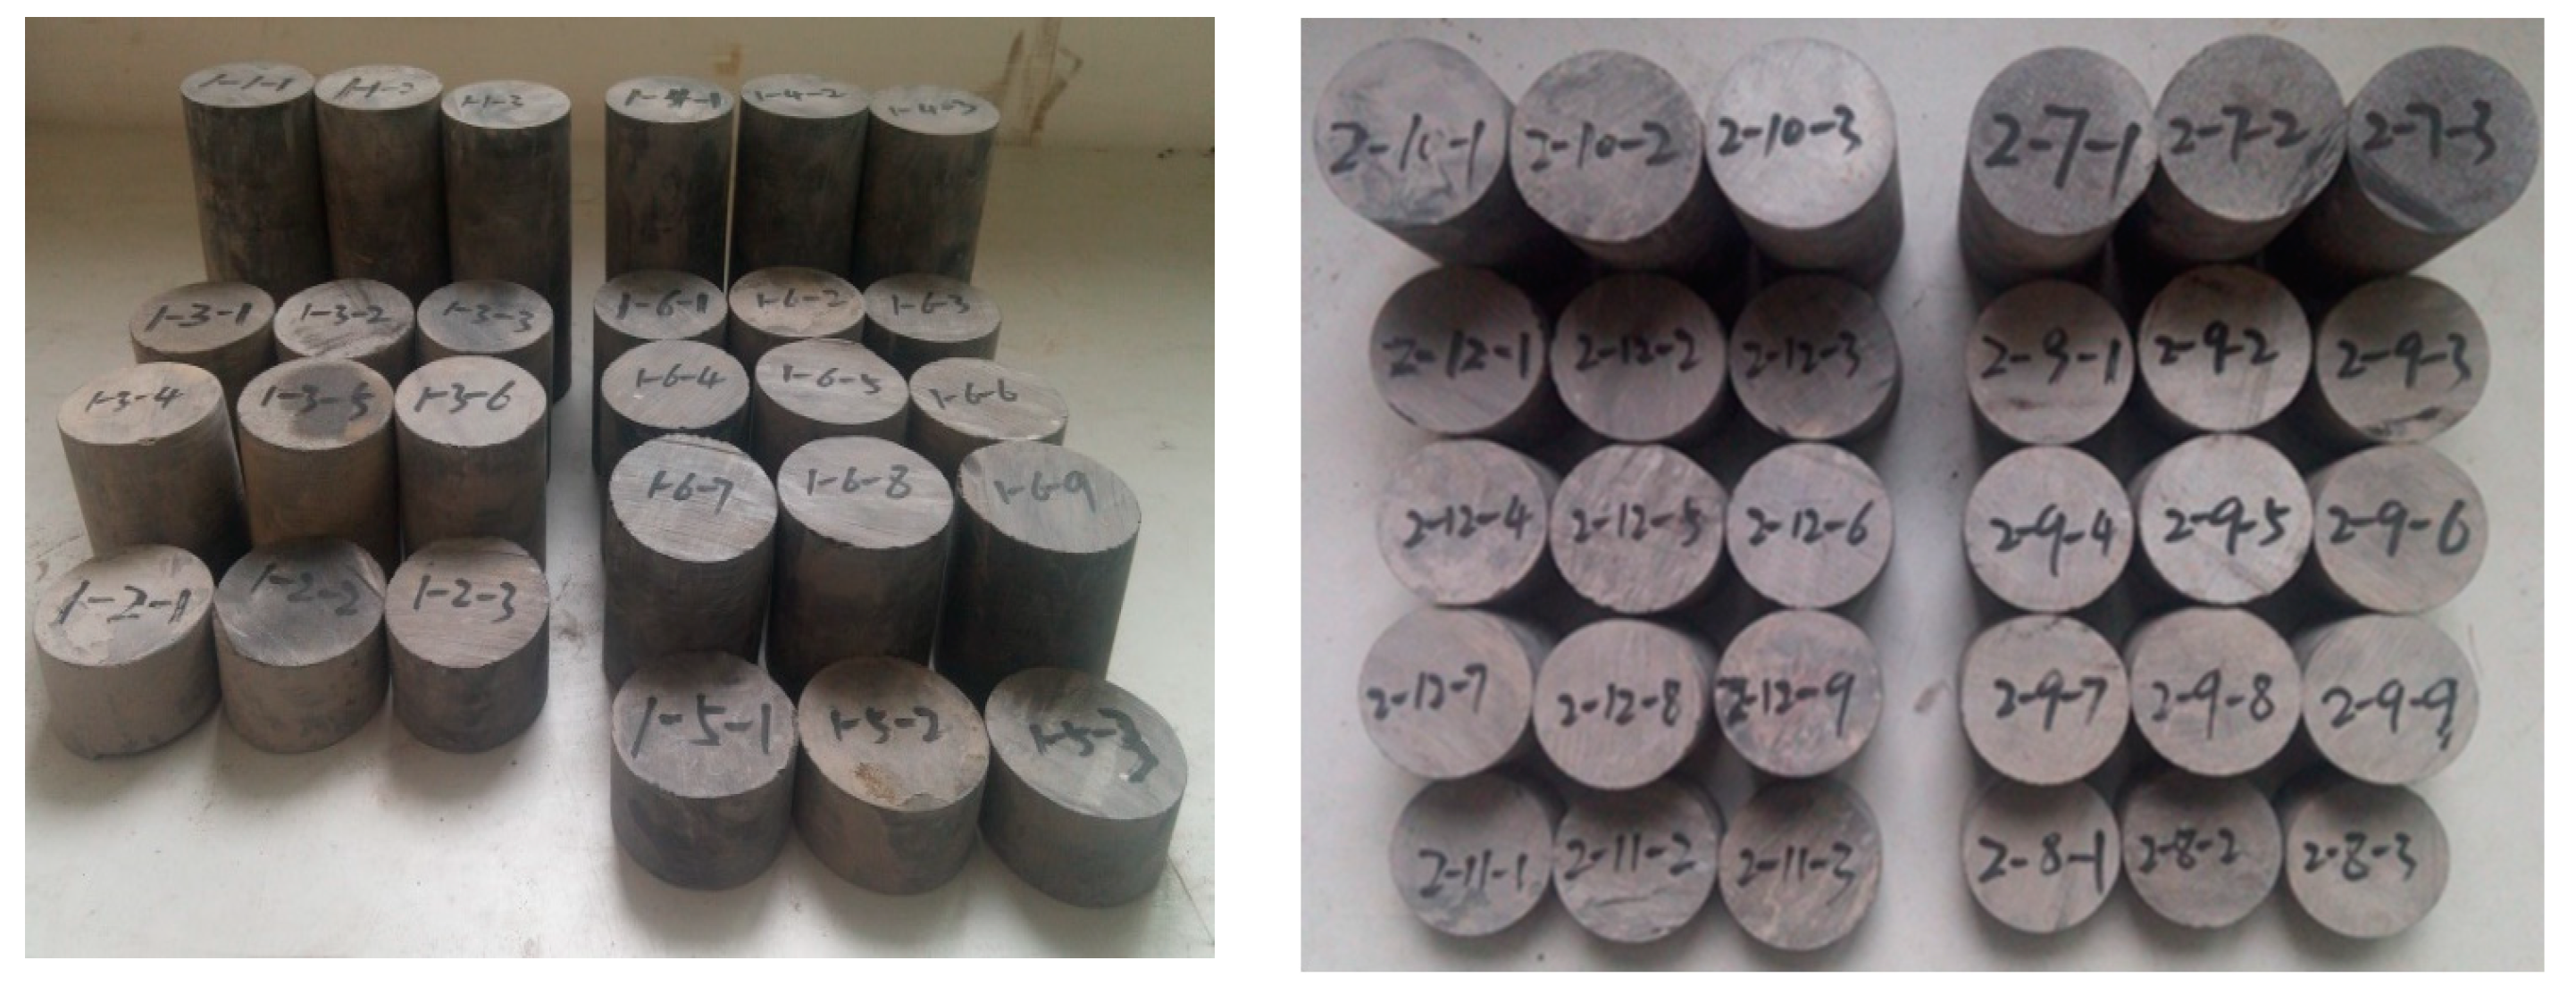
2.2.1. Experimental Specimens

The rock cores taken from the Sima coal mine were processed, and the uniaxial compression deformation tests were conducted using specimens with a diameter of 50 mm and a height of 100 mm. For the tensile strength test, a specimen with a diameter of 50 mm and a height of 25 mm was used. A cylindrical specimen with a diameter of 50 mm and a height of 100 mm was used for the compression-shear test. An example of the specimen used in this experiment is shown in Figure 2.

2.2.2. Experimental Process

(1)
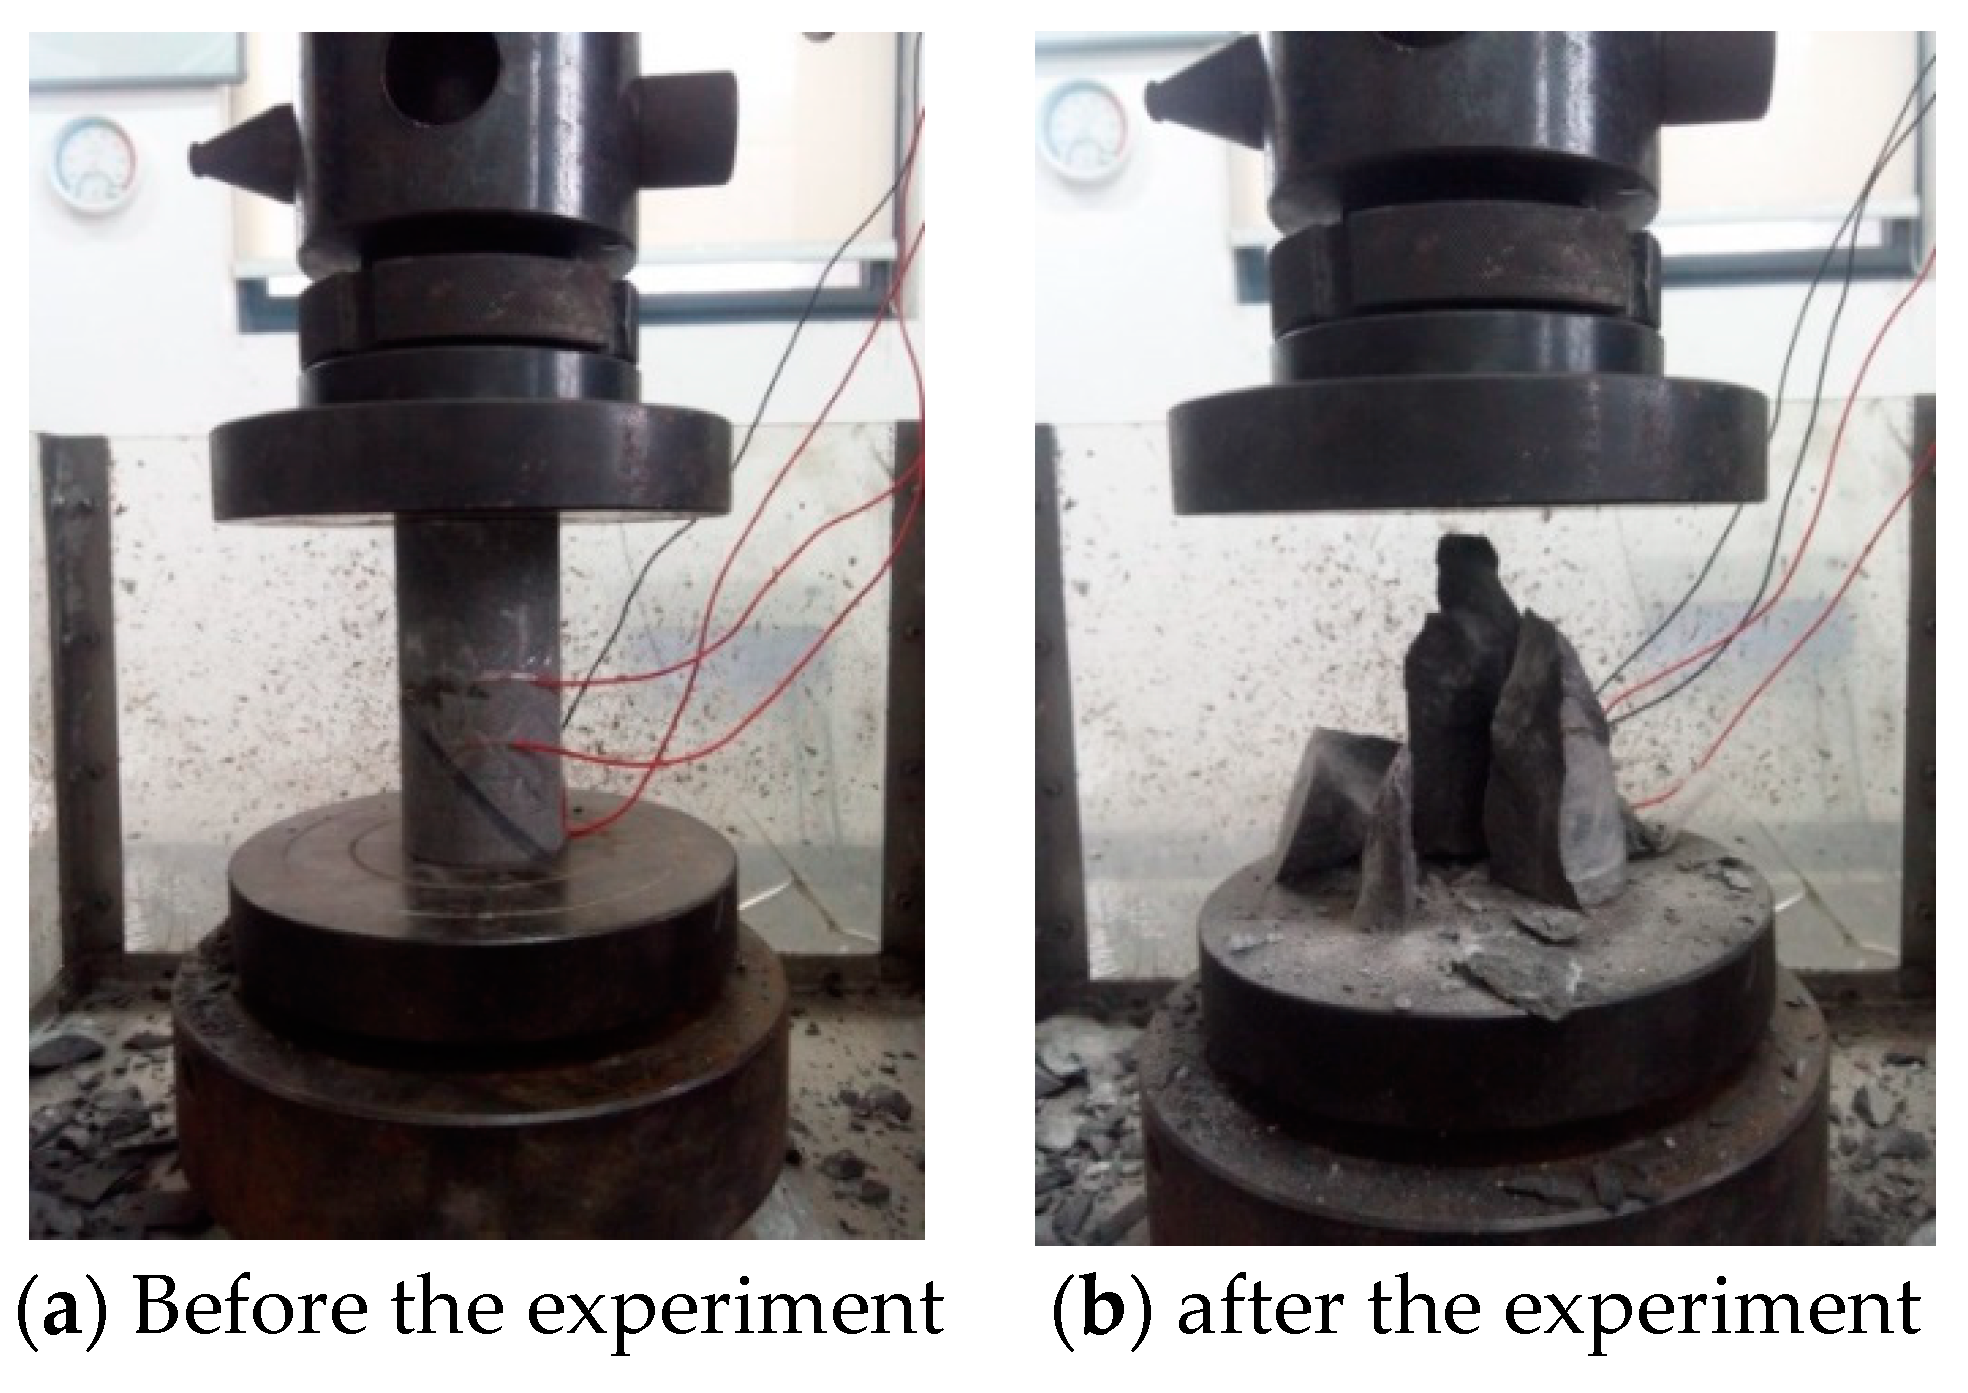
Uniaxial compression and deformation experiments on coal rock masses were conducted to measure the uniaxial compressive strength, elastic modulus, and Poisson’s ratio of coal rock masses. Before the measurement, the strain gauges attached to the specimens were connected to the resistance strain gauge and the half-bridge circuit was used to measure the transverse and longitudinal directions of the specimens during loading. Some examples of the field experiment are shown in Figure 3.
(2)
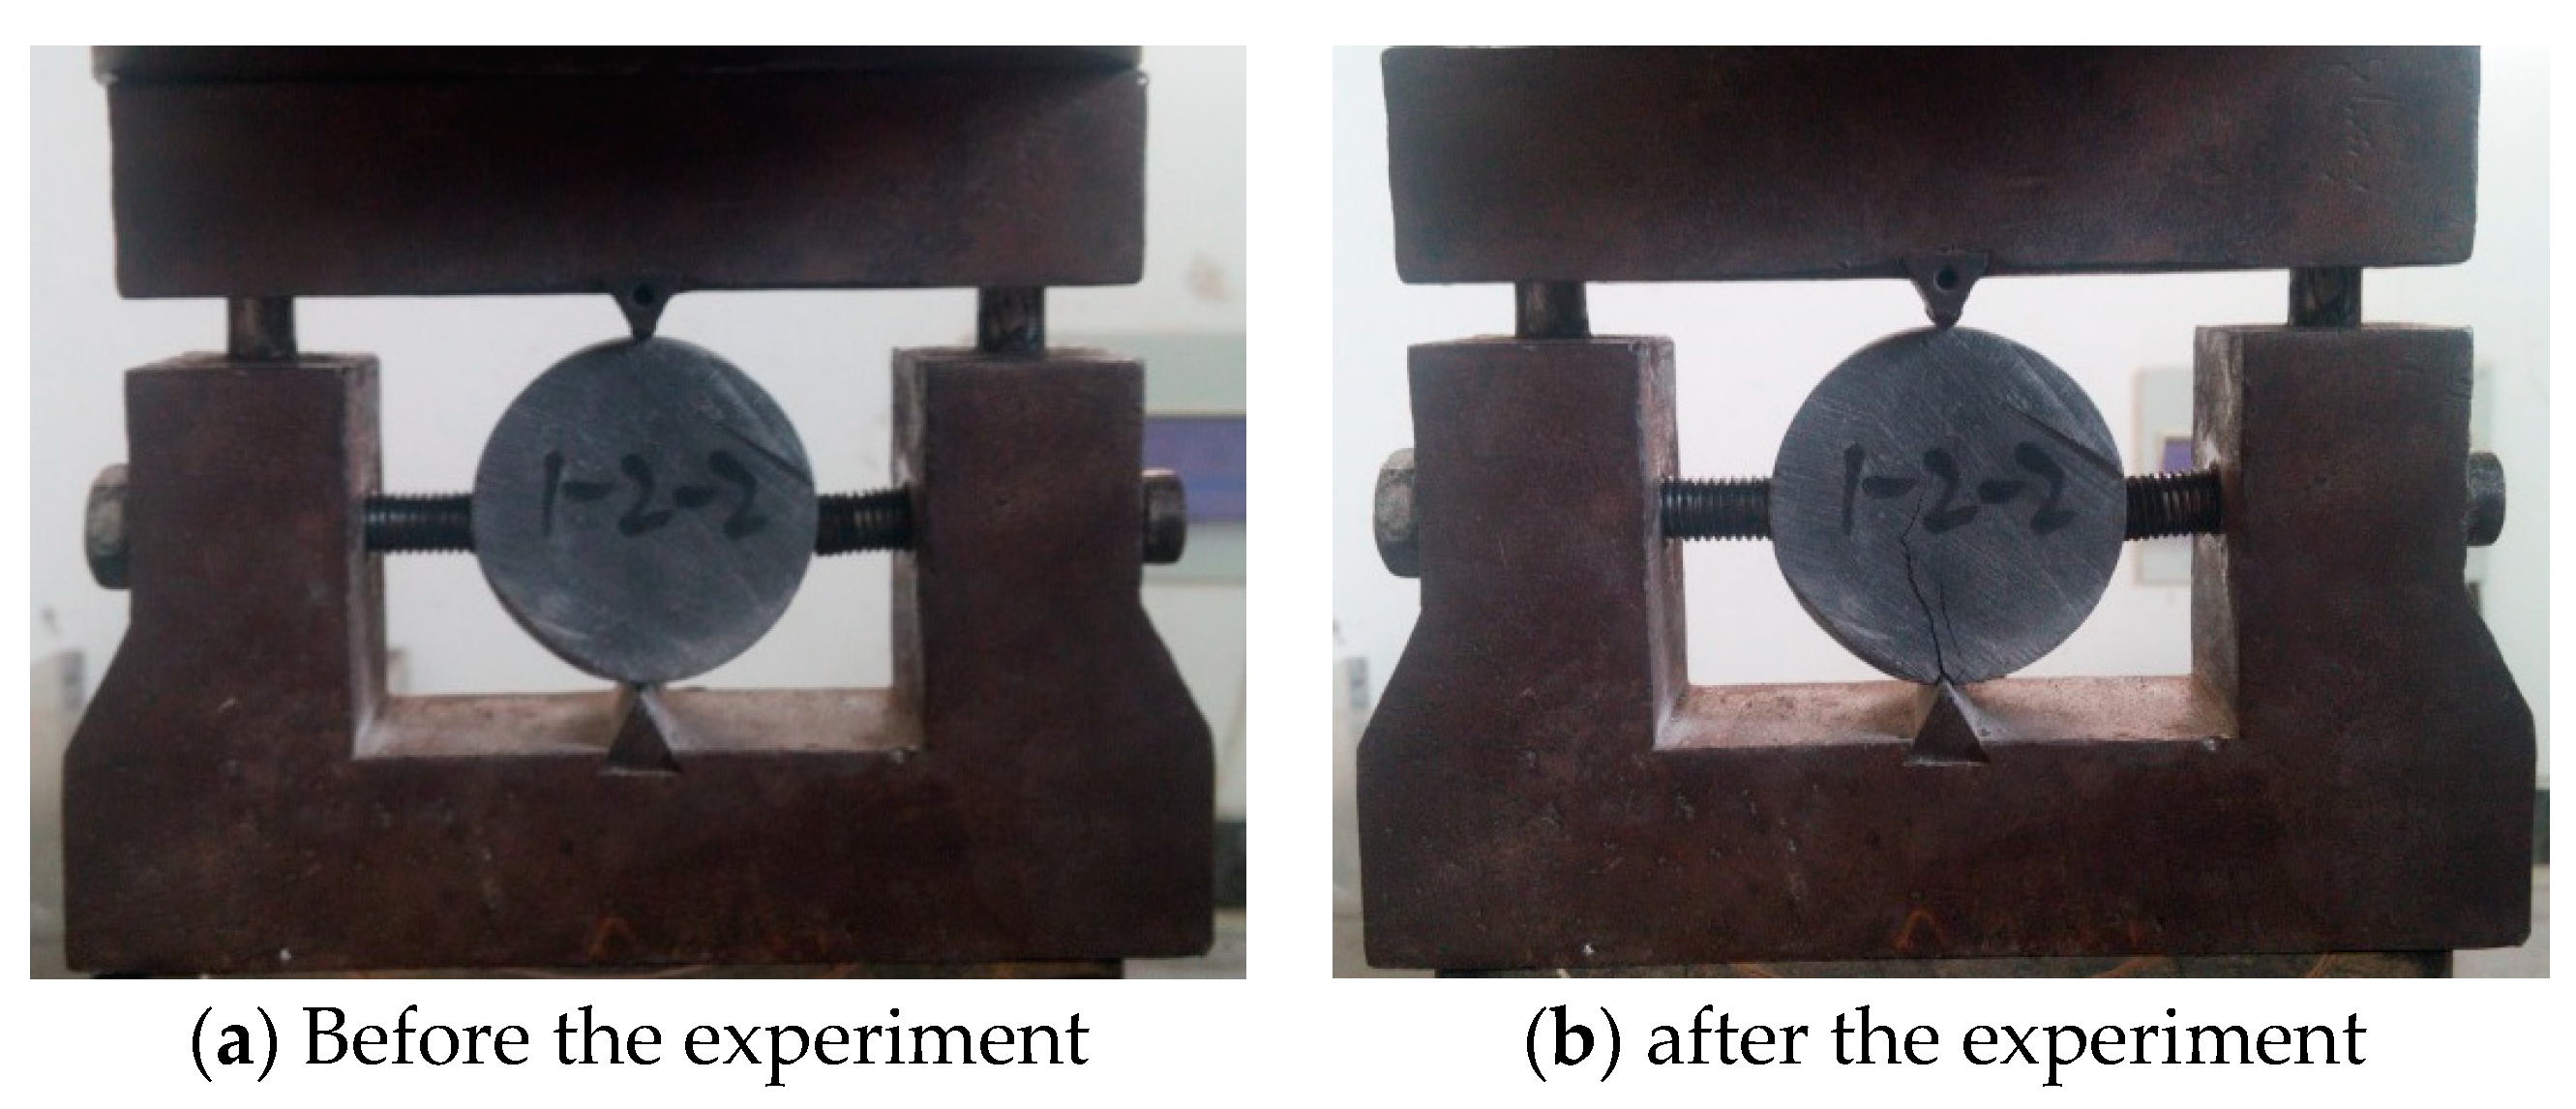
Uniaxial tensile strength experiments of the specimens were carried out by the splitting method. The diameter and height of the specimens were also measured before the experiment, and after the measurement was completed, each specimen was placed on the tensile jig and loaded until the specimen was damaged. An example of the field experiment is shown in Figure 4.
(3)
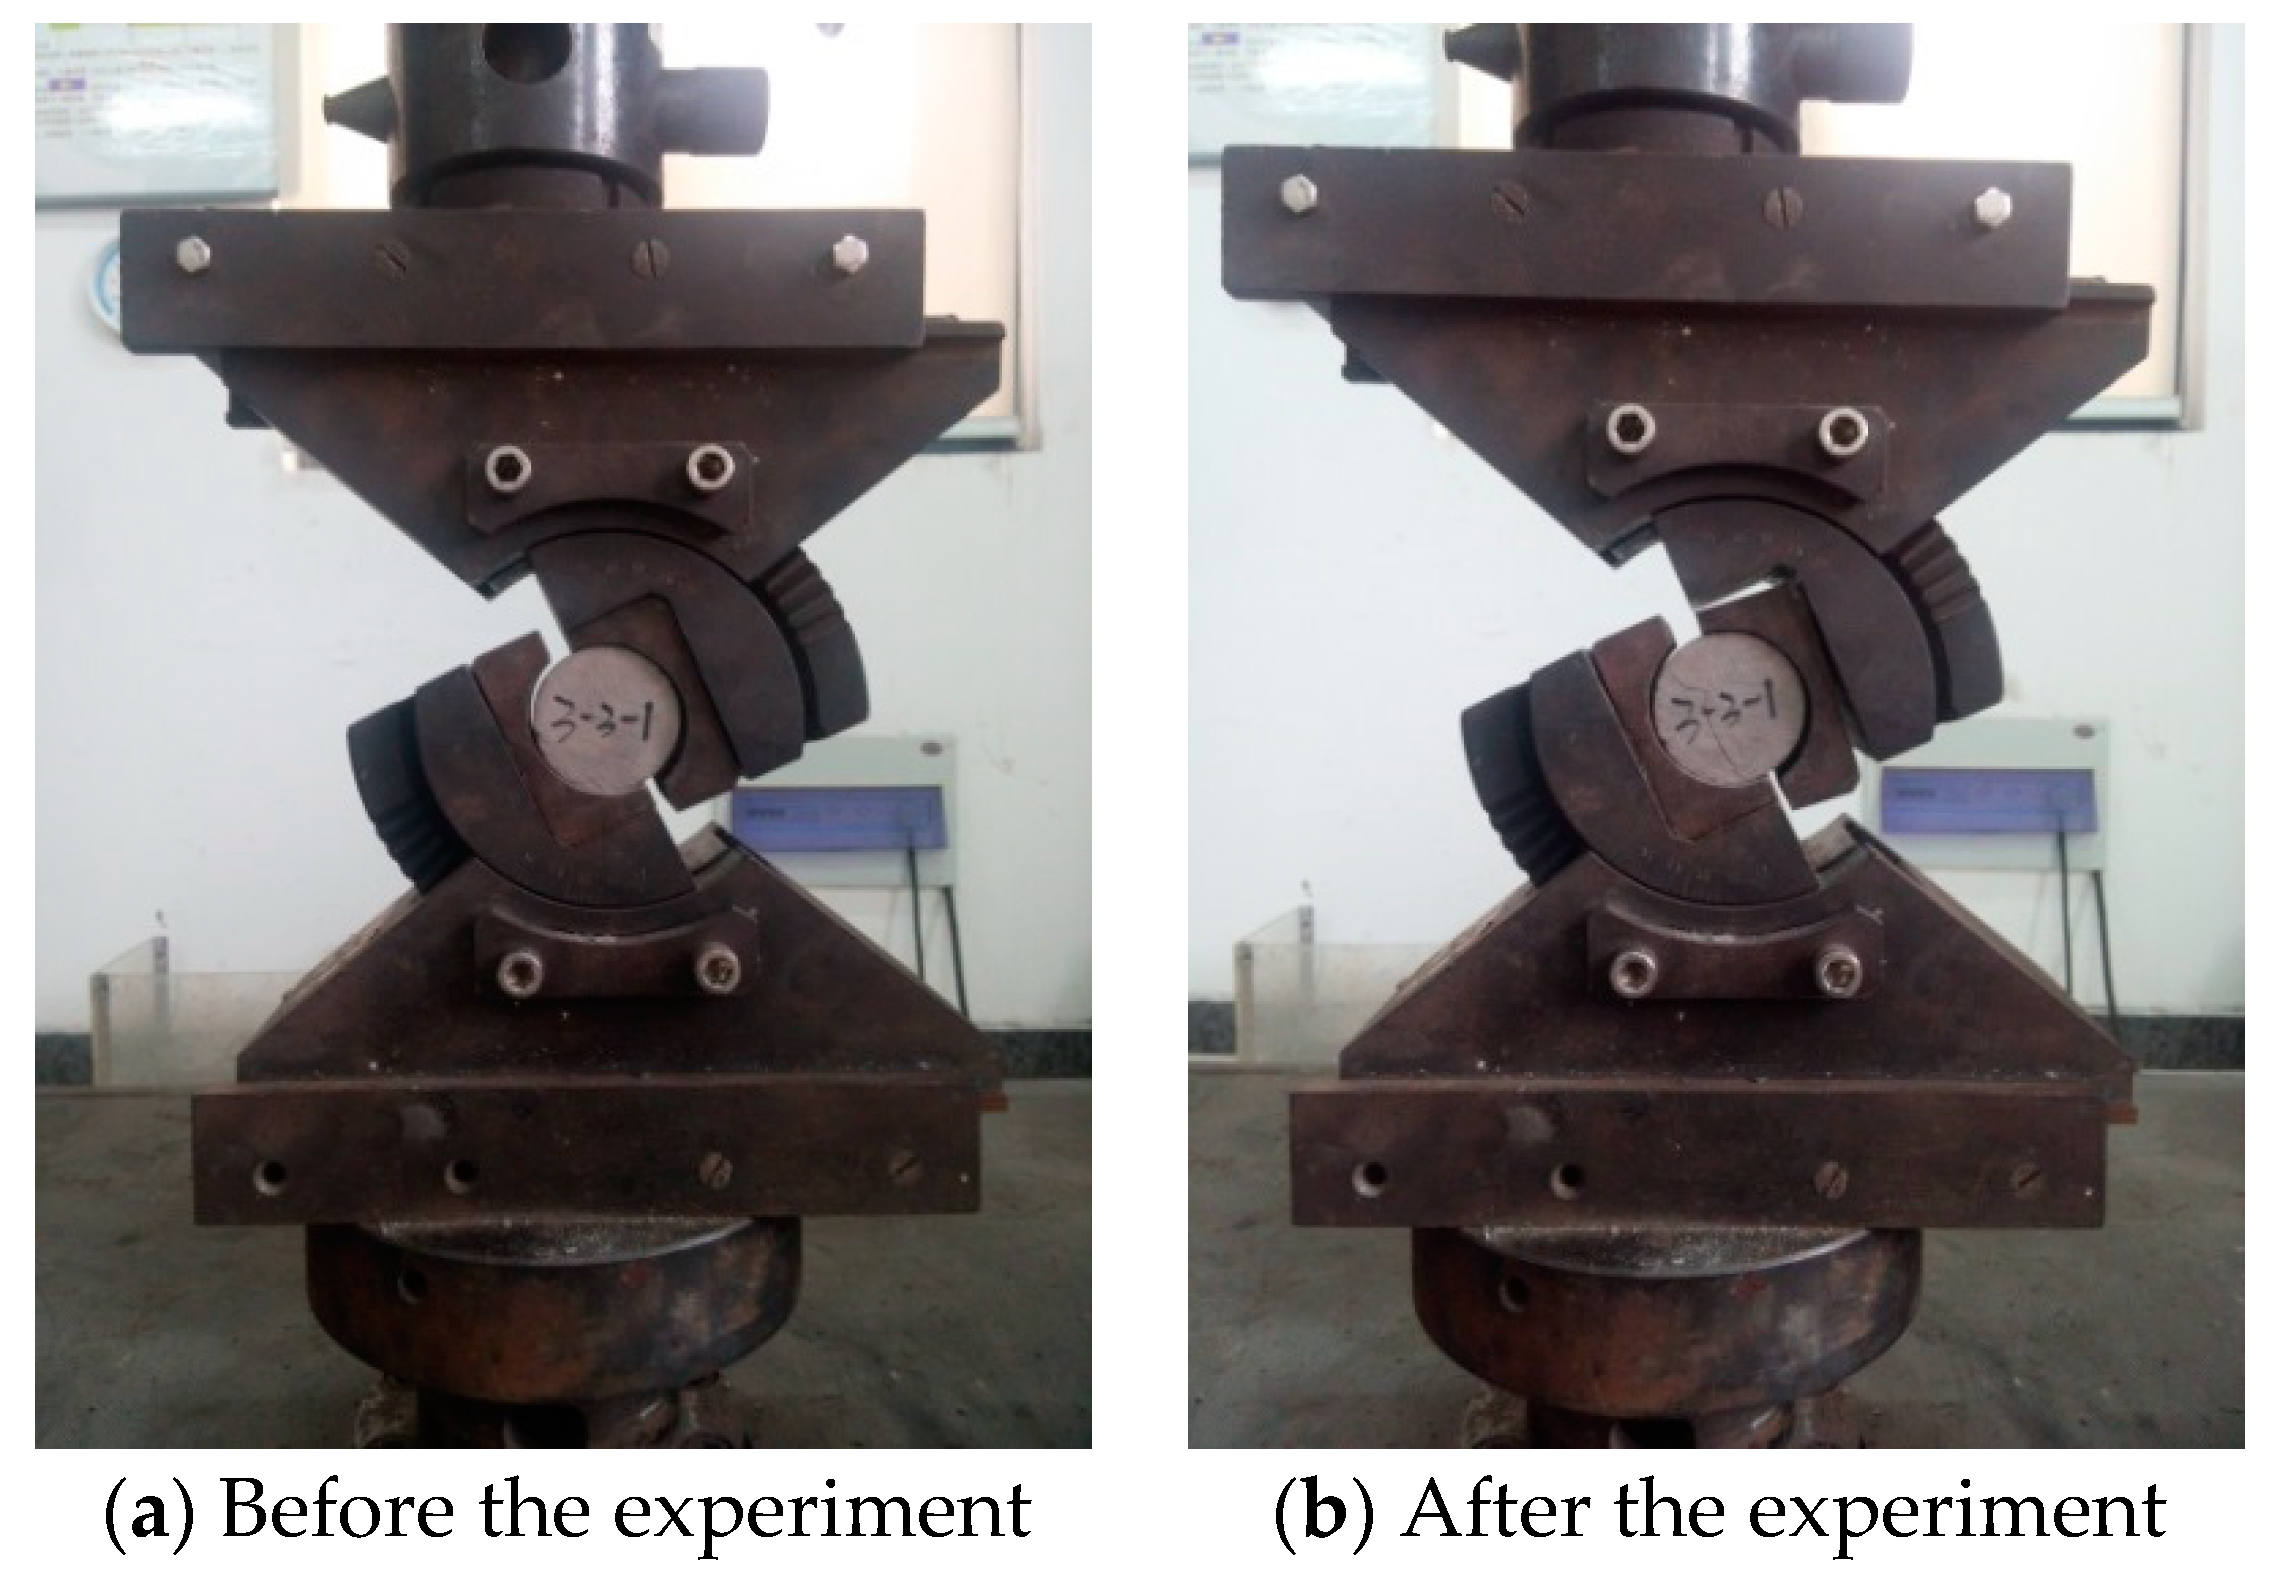
Shear strength experiments on the coal rock body can measure the cohesion and internal friction angle of the coal rock body. After measuring the height and diameter, the specimens were placed in a variable angle plate shear apparatus and shear experiments were conducted at three different angles, loading from 45°, 50°, and 55° until the specimens were destroyed. An example of the specimen shear test is shown in Figure 5.

2.2.3. Experimental Results

Based on the tests, the following experimental results were obtained. Table 2 shows a summary of the mechanical parameters about the roof and floor of the Sima mine, through which the mechanical parameters are used to provide data support for the following text.

2.3. Mining Width Design

Gangue storage space is excavated in the coal seam, and the roof rock layer is supported by the coal pillars on both sides of the gangue storage space, forming a structure similar to a “beam”. According to the constraints of the coal pillars on both sides of the gangue storage space on the roof rock beams, the roof rock beams can be analyzed as “simply supported beams” or “fixed beams”. According to the analysis, a reasonable mining width can be designed according to the beam theory, and the load on the roof rock beam must be determined first before the design.
(1)
Loads on the top rock beam
The roof is generally composed of more than one layer of rock. Therefore, the magnitude of the load chosen in calculating the ultimate span of the first layer should be determined by the interaction between the layers above the top slab, with the combined effect of the n layers forming a load ( W n ) 1 of
( W n ) 1 = E 1 h 1 3 ( γ 1 h 1 + γ 2 h 2 + + γ n h n ) E 1 h 1 3 + E 2 h 2 3 + + E n h n 3
  • where: E1, E2,…, En—modulus of elasticity of each rock layer of the roof slab.
  • h1, h2,…, hn—thickness of each rock layer in the roof slab.
  • γ1, γ2,…, γn—capacity of each rock layer of the roof slab.
When calculating ( W n 1 ) 1 < ( W n ) 1 , ( W n ) 1 is taken as the load applied to the first layer of rock, and the gravity of the n +1th layer and above will not exert influence on the first layer of rock. At this time, the result of Equation (1) can be used as the load on the rock beam to calculate the limit span of the mining width.
(2)
Analysis of simply supported beams
Taking a simply supported beam of unit width for analysis, the positive stress σ x and the shear stress τ x at any point A within the beam are
σ x = 12 M x y t 3
τ x = 3 V x ( t 2 4 y 2 ) t 3
  • where: M x , V x —the bending moment and shear force in the cross-section where point A is located, respectively.
  • y —the distance from point A to the neutral axis.
  • t —thickness of the beam.
The maximum bending moment occurs at the center of the beam, i.e., at the x = L / 2 cross-section
M max = W L 2 8
Therefore, the maximum tensile and compressive stresses occur at the top and bottom outer edges of this section, i.e., at y = t 2
σ max = ± 3 W L 2 4 t 2
where: W is the transverse mean load of the rock beam.
The maximum shear force occurs at both ends of the beam, i.e., at the cross-section of x = 0 and x = L.
V max = W L 2
The maximum shear stress occurs at the neutral axis of this section
τ max = 3 V max 2 t = 3 W L 4 t
Let the allowable and shear stresses of the rock beam be σ e and τ e , and the tensile and shear strengths be σ t and τ j , respectively, then
σ e = σ t F ,   τ e = τ j F
where: F is the safety factor, generally taken from 2 to 4.
(3)
Calculation of fixed beam
Taking a unit width solidly supported beam for analysis, the maximum bending moment and shear force in the beam occur at the coal wall at the end of the beam
M max = W L 2 12
V max = W L 2
Then, the maximum tensile and maximum shear stresses on this section are
σ max = W L 2 2 t 2
τ max = 3 W L 4 t
Substituting σ e for σ max in Equation (11) yields the ultimate span at which a rock beam can be damaged by a maximum tensile stress exceeding its tensile strength as
L 1 = 2 t 2 σ e W
Substituting τ e for τ max in Equation (12), the ultimate span of rock beam failure due to the maximum shear stress exceeding its shear strength is
L 2 = 4 t τ e 3 W
A comparison of two kinds of results in the smaller value can be derived from the mining face roof limit span of about 8 m. Combined with the actual situation and considering the support and gangue-filling equipment, the preliminary design mining width is 4~7 m.

3. Numerical Simulation Study of Without-Support Gangue-Filling Mining of Thick Coal Seams

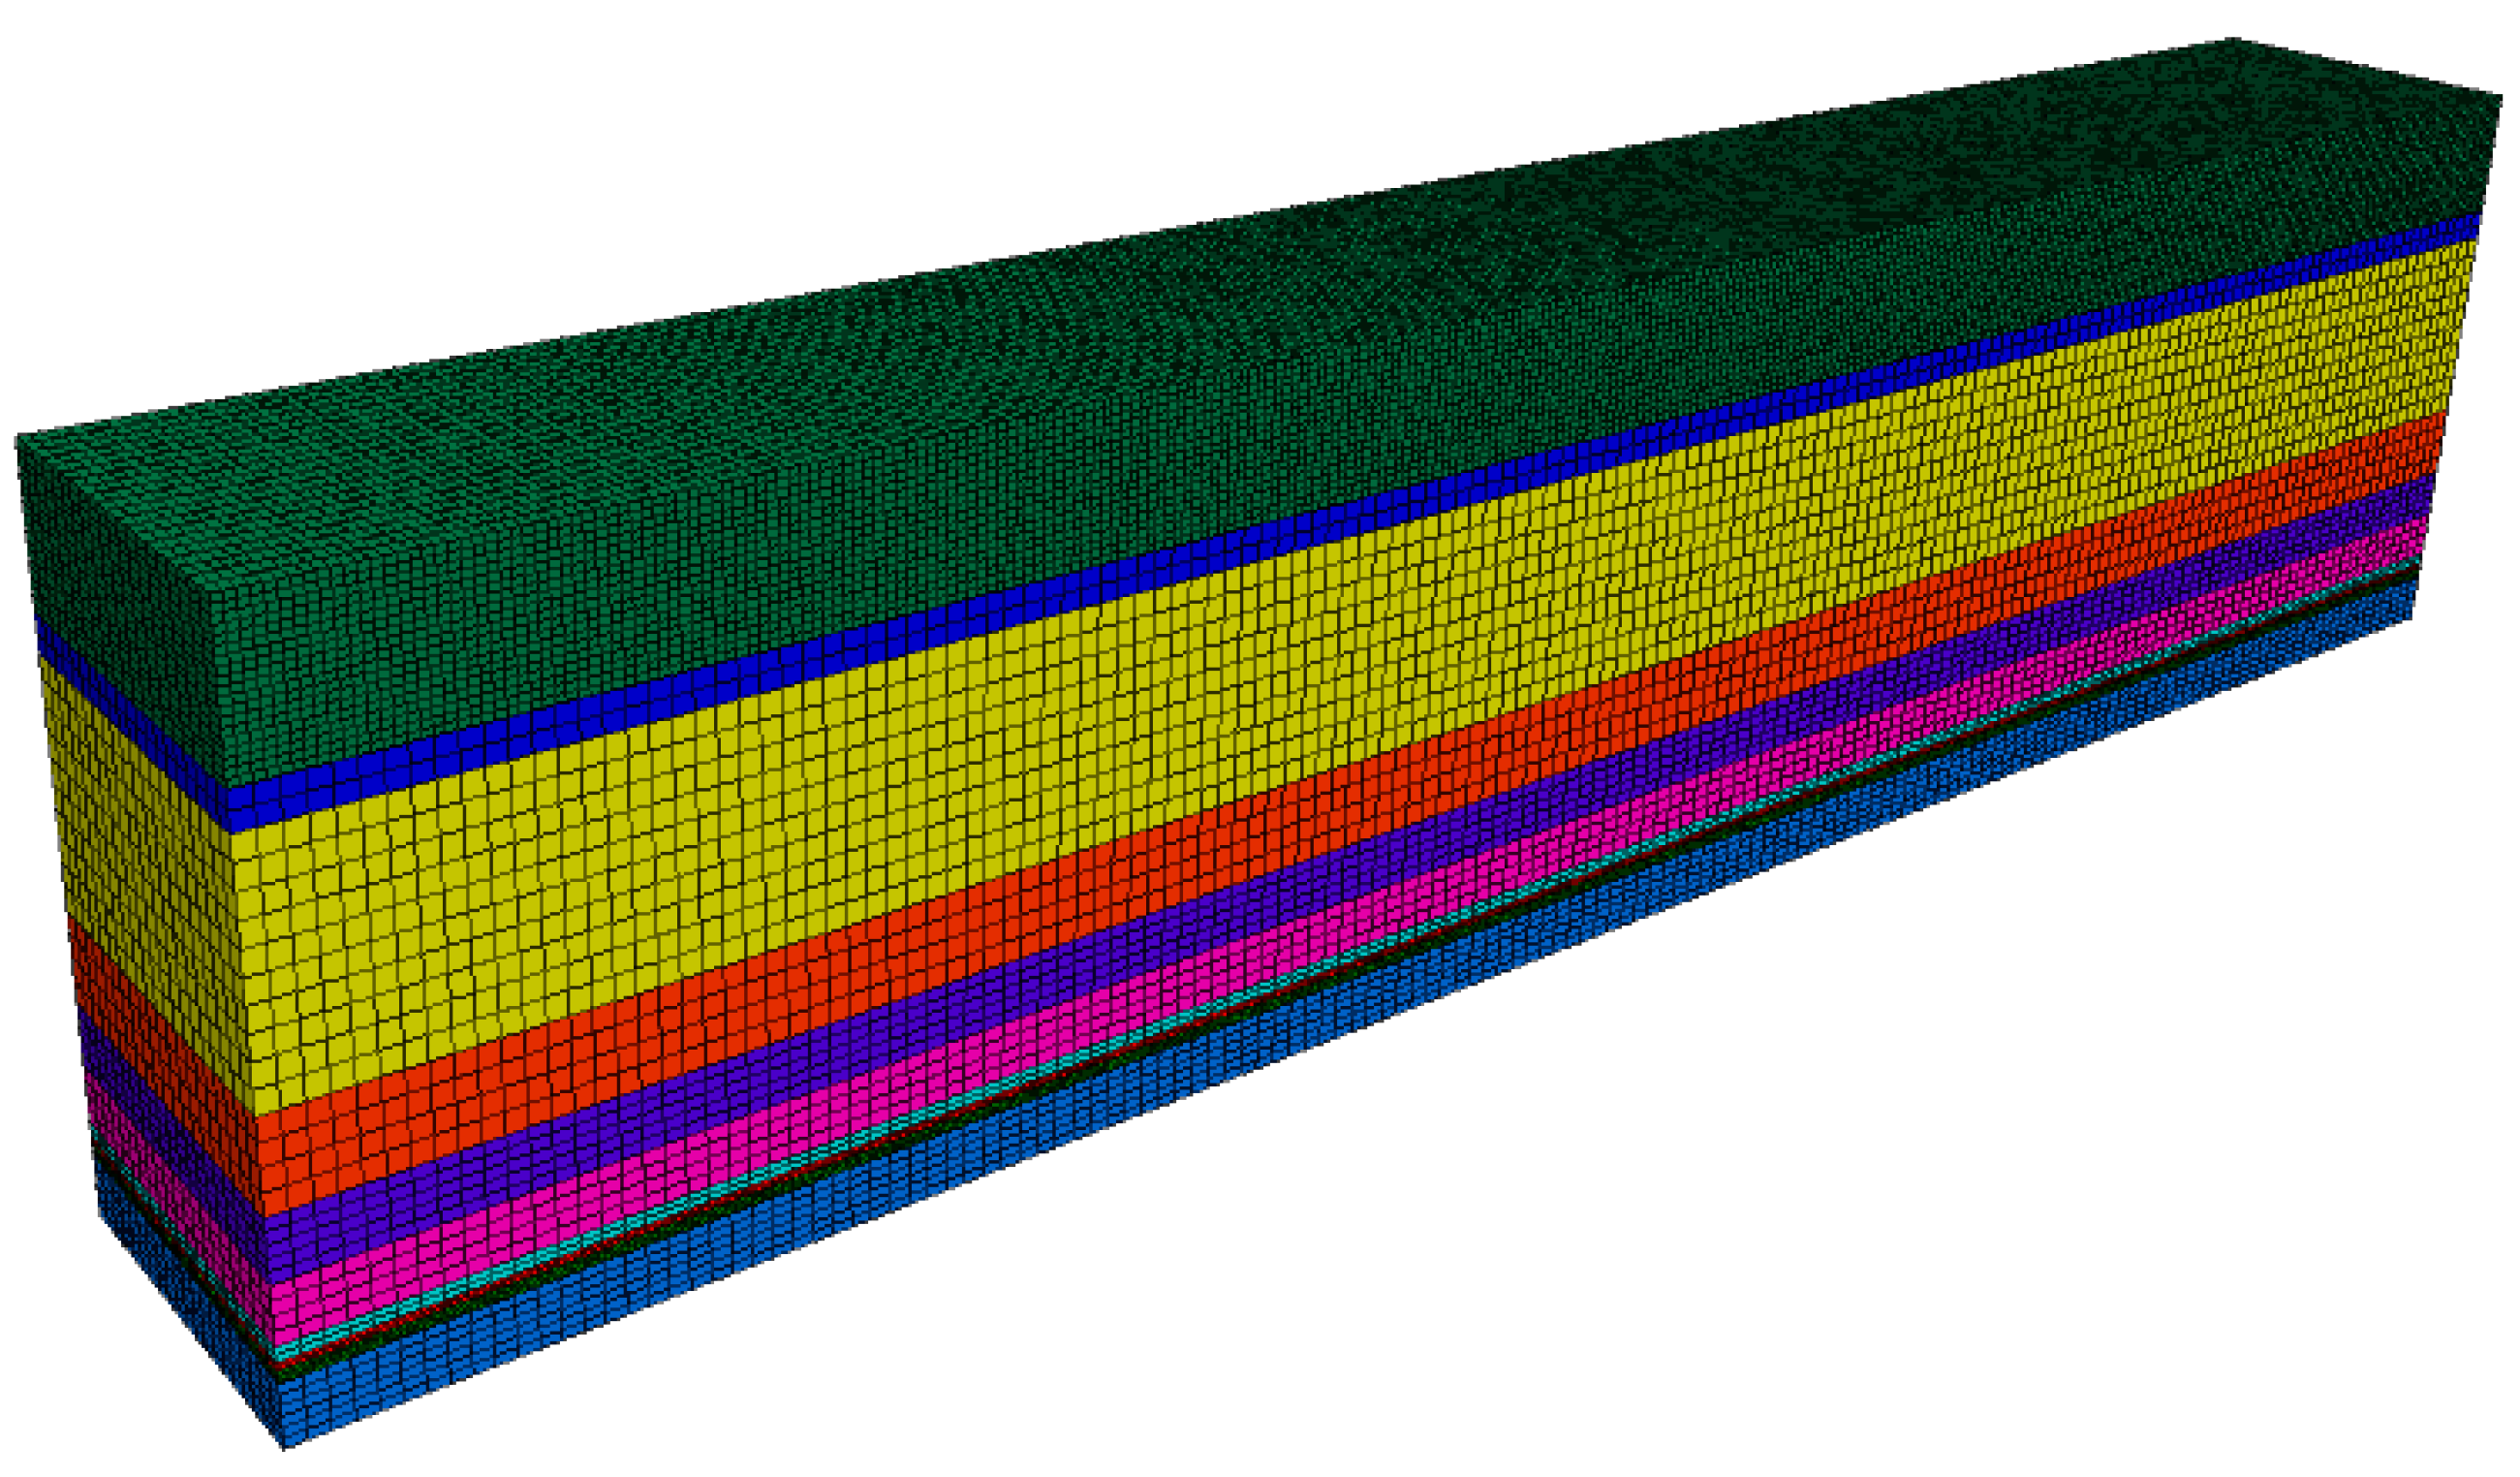
3.1. Establishment of Numerical Simulation Modeling

The Sima mine coal seam has a small dip angle and belongs to the near horizontal coal seam, so it is considered as a horizontal coal seam in the numerical simulation calculation. In order to analyze the movement and deformation law of the overlying rock seam and the ground surface more clearly, the model was built from the bottom 30 m of the coal seam to the ground surface. The model is divided into 399,000 units and 454,881 nodes, and the model is shown in Figure 6.
The model is taken as 1500 m in the x-direction and 200 m in the y-direction, and the model height is 361 m. The coal seam is 6 m thick and located in the z=30 m~36 m interval. In order to improve the operation speed, the key study area is divided more densely, and the other parts are more sparse. In the Figure 6, the topmost layer and the penultimate layer are the research focus, namely the surface and coal seam. They are the key research areas, so the grid is dense, and the grid of other rock strata is set as sparse.

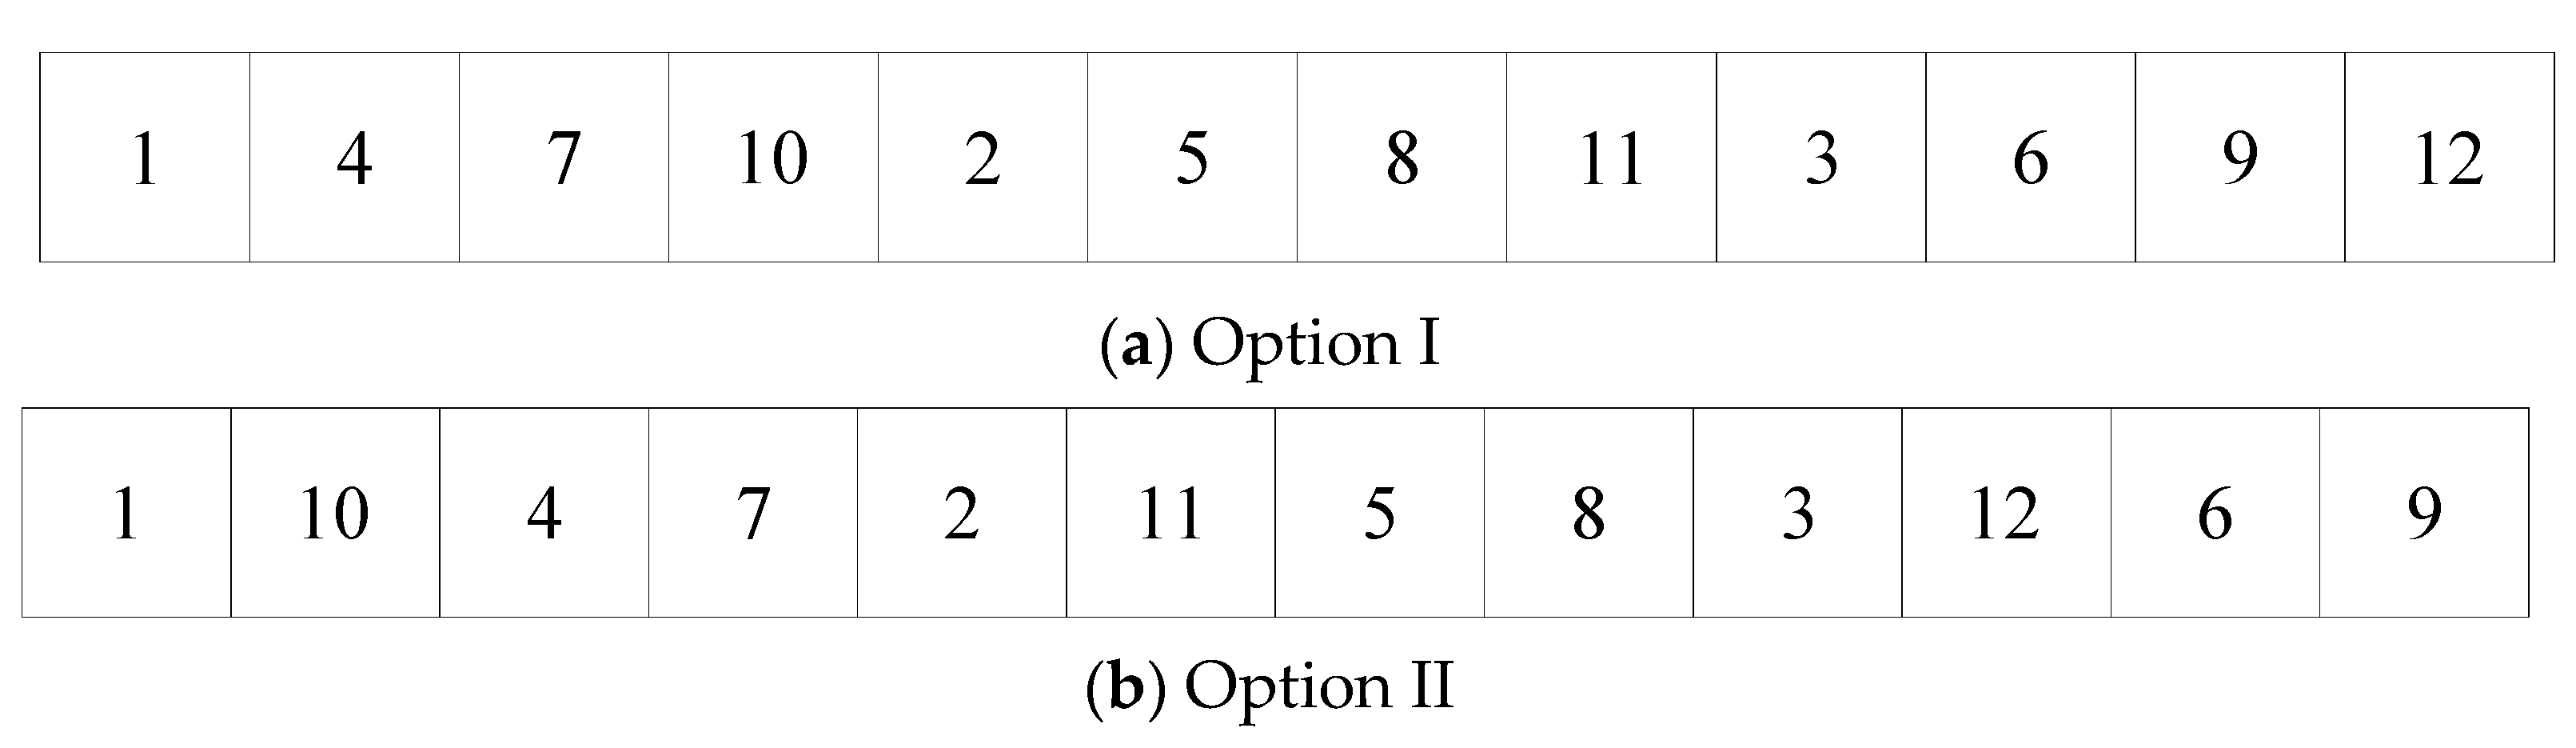
3.2. Numerical Simulation Scheme

In order to study the influence of the change of mining width on the deformation and stress distribution of the surrounding rock, and to obtain the law of surface movement and failure of the overlying rock, according to the theoretical calculations in the previous sections, the mining widths of 4 m, 5 m, 6 m, and 7 m were used for research in this study. In order to ensure smooth mining, facilitate construction, provide sufficient setting time for the filling body, and reduce the interaction between filling and excavation, two test options were set up according to the mining sequence. During mining, the 12 working faces were divided into groups, and the groups were sequentially mined. The simulation test options are shown in Figure 7, where the rock mechanics parameter design is obtained from the rock mechanics property test, and the specific parameter design is shown in Table 3 below.

3.3. Deformation Analysis of the Surrounding Rock at the Filling Working Face

3.3.1. Deformation Analysis of the Surrounding Rock for Option I

Figure 8 shows the horizontal displacement cloud map of the overall 12 working face mining area after the fourth round of digging and filling of option I. It can be seen in the Figure 8 that there are opposite horizontal deformations in the area on both sides of the basic top overburden rock, the two deformation areas are approximately symmetrically distributed, and the maximum horizontal deformation occurs on both sides of the mining area.
From the analysis of the deformation of the surrounding rock during the four rounds of option I, it can be seen that the movement deformation of the overburden rock and the ground surface under different mining width conditions are different. Figure 9 and Figure 10 and Table 4 show that the mining width is small, the overburden sinking is small, which is beneficial to the control of the roof; when the mining width reaches 7 m, the overburden sinking amount and sinking speed increase obviously, and the maximum sinking position is shifted from the center of the mining area to the interval coal column between working faces or the roof of the newly filled working face.

3.3.2. Deformation Analysis of the Surrounding Rock for Option II

Figure 11 is cloud images of the horizontal displacement of the mining area of 12 working faces after the fourth round of excavation and filling in option II. It can be seen from the Figure 11 that opposite horizontal deformations appear in the two sides of the basic overburden rock. The two deformation areas are approximately symmetrically distributed, and the maximum horizontal deformation occurs on both sides of the mining area.
According to the Figure 12 and Figure 13 and Table 5, the analysis of the deformation of the surrounding rocks during the four rounds of excavation and filling of option II shows that the excavation and filling of the working face will lead to the deformation of the overlying rocks and the surface, the deformation curve of the rocks tends to moderate with the increase of the height from the coal seam, the convergence speed of the sinking curve gradually decreases, and the influence range gradually expands. After four rounds of excavation and filling, the maximum sinking of the surface of option II is slightly smaller than that of option I, and the difference is not big, but the deformation of the two sides after the four rounds of option II is less than that of option I, and option II is more favorable to the stability of the surrounding rocks of the two gangs of the working face, plus the overall effect of option II is better.

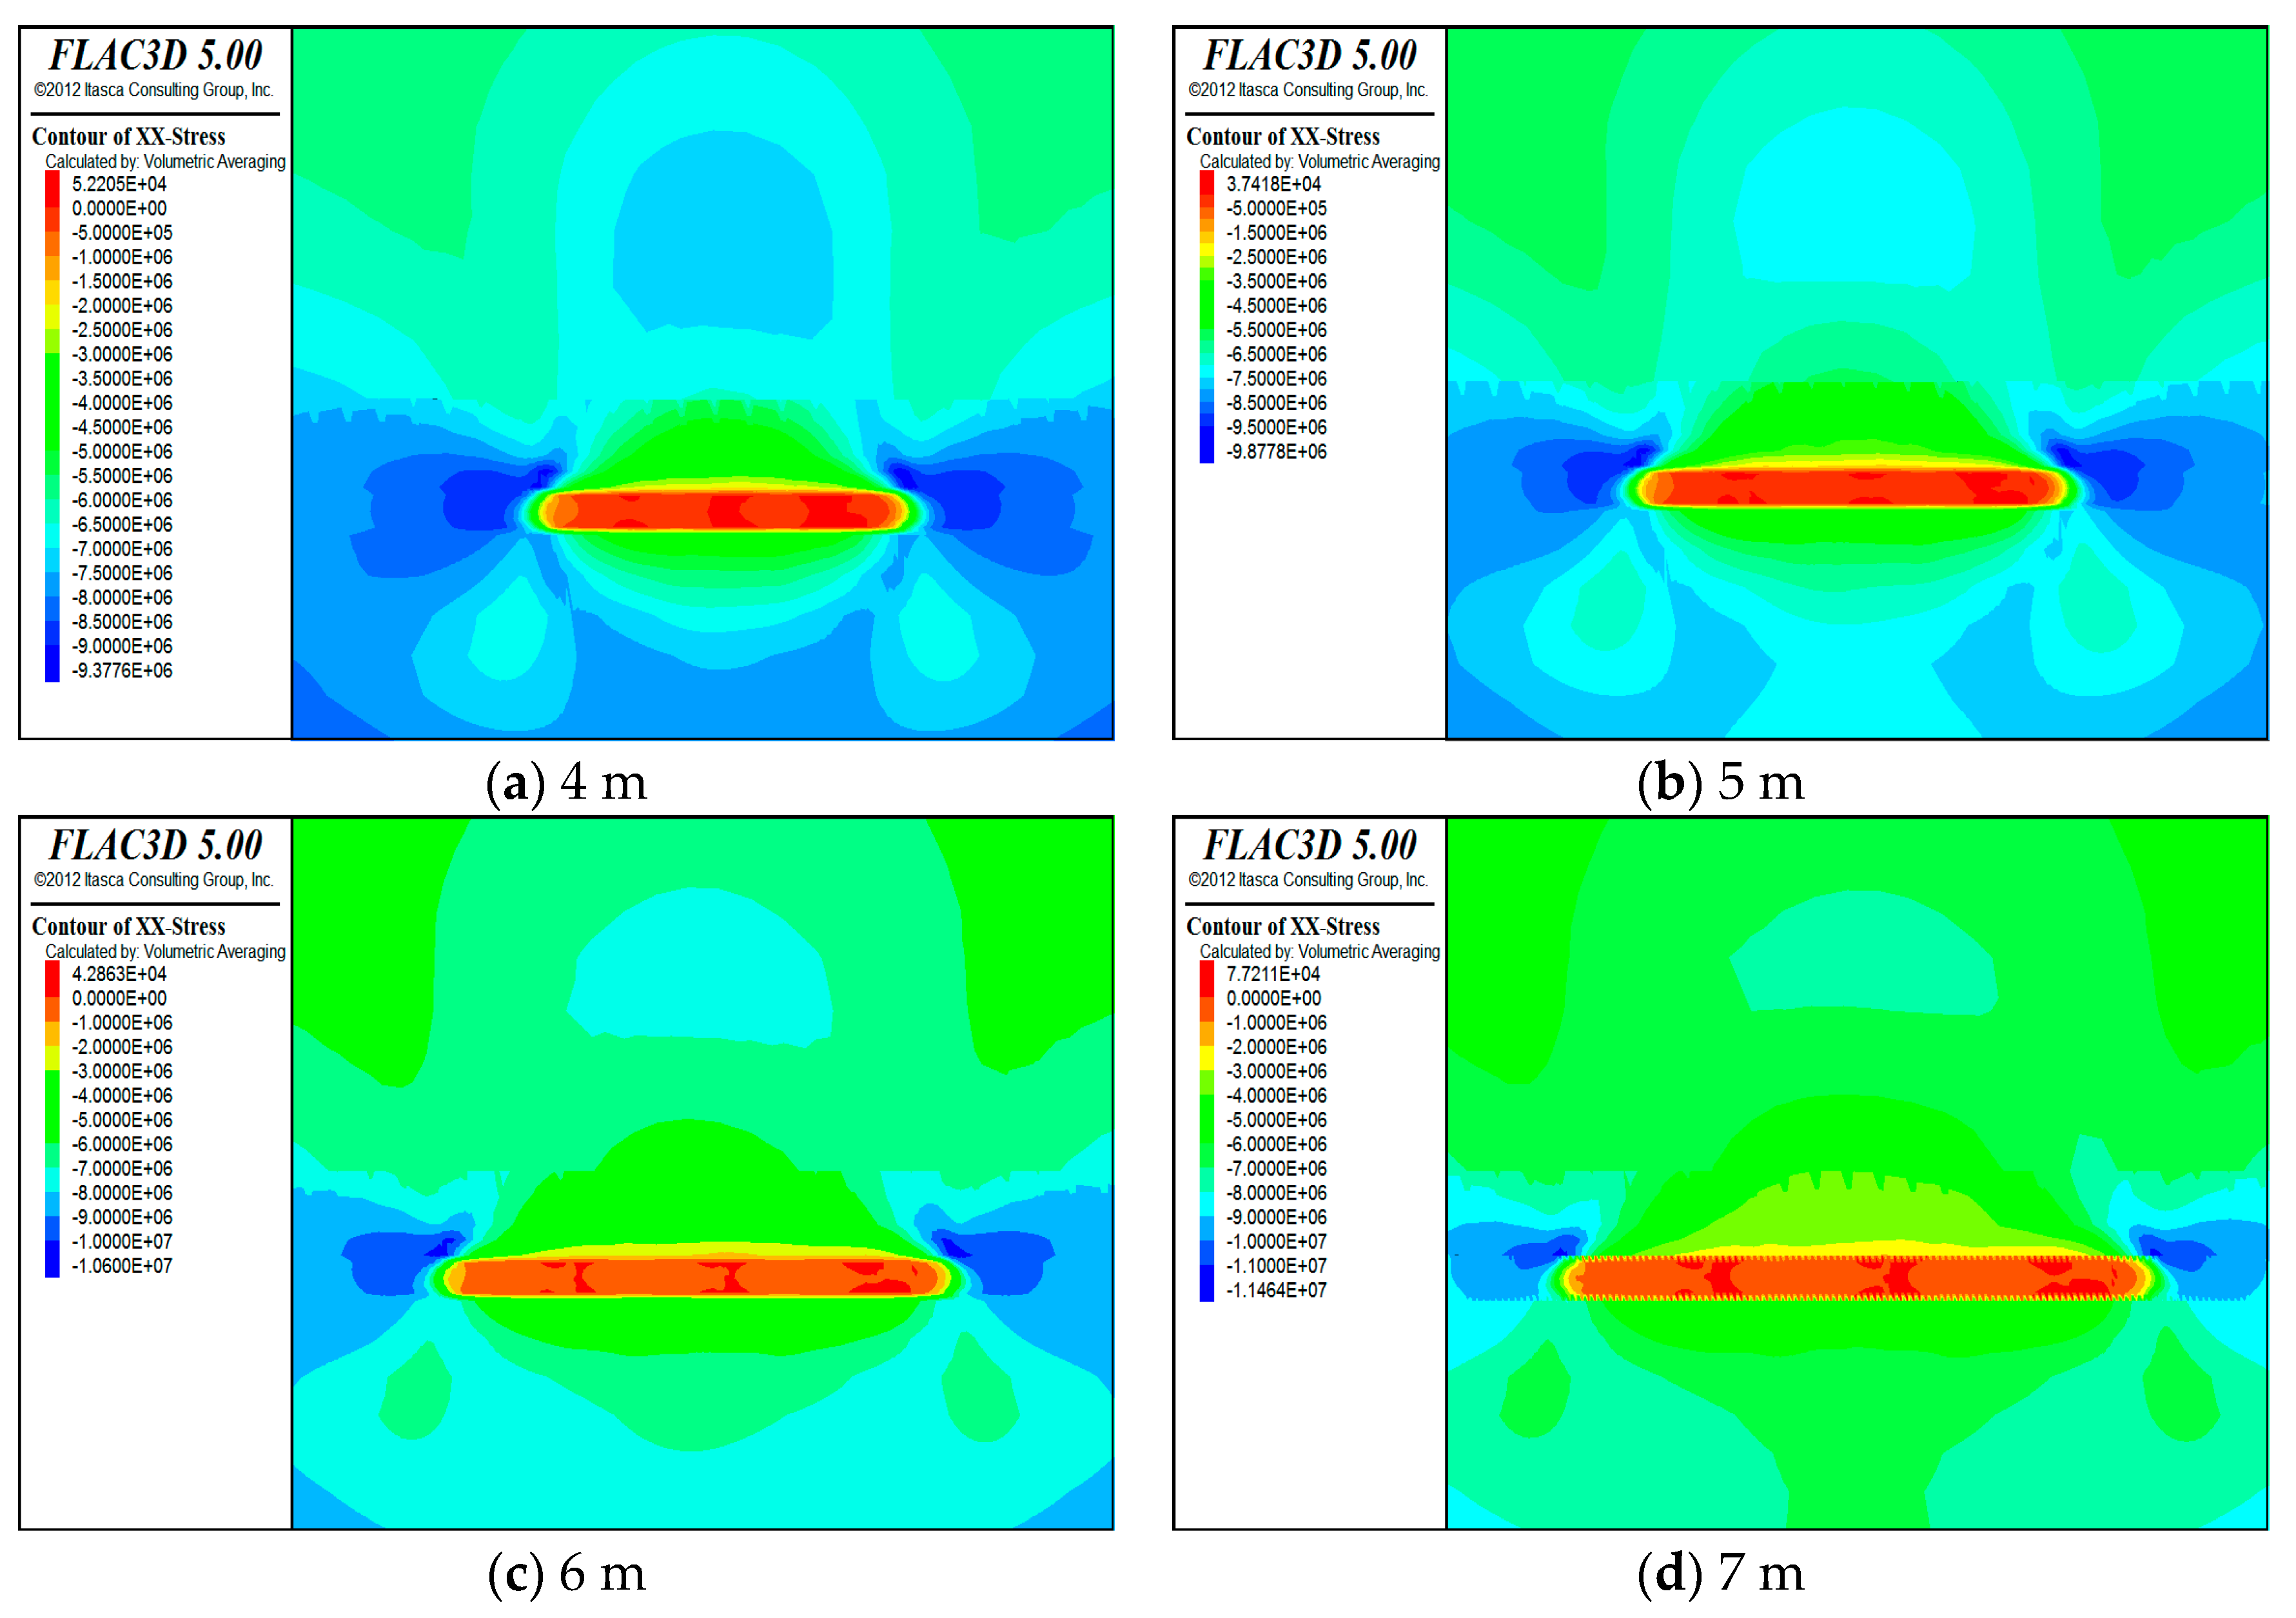
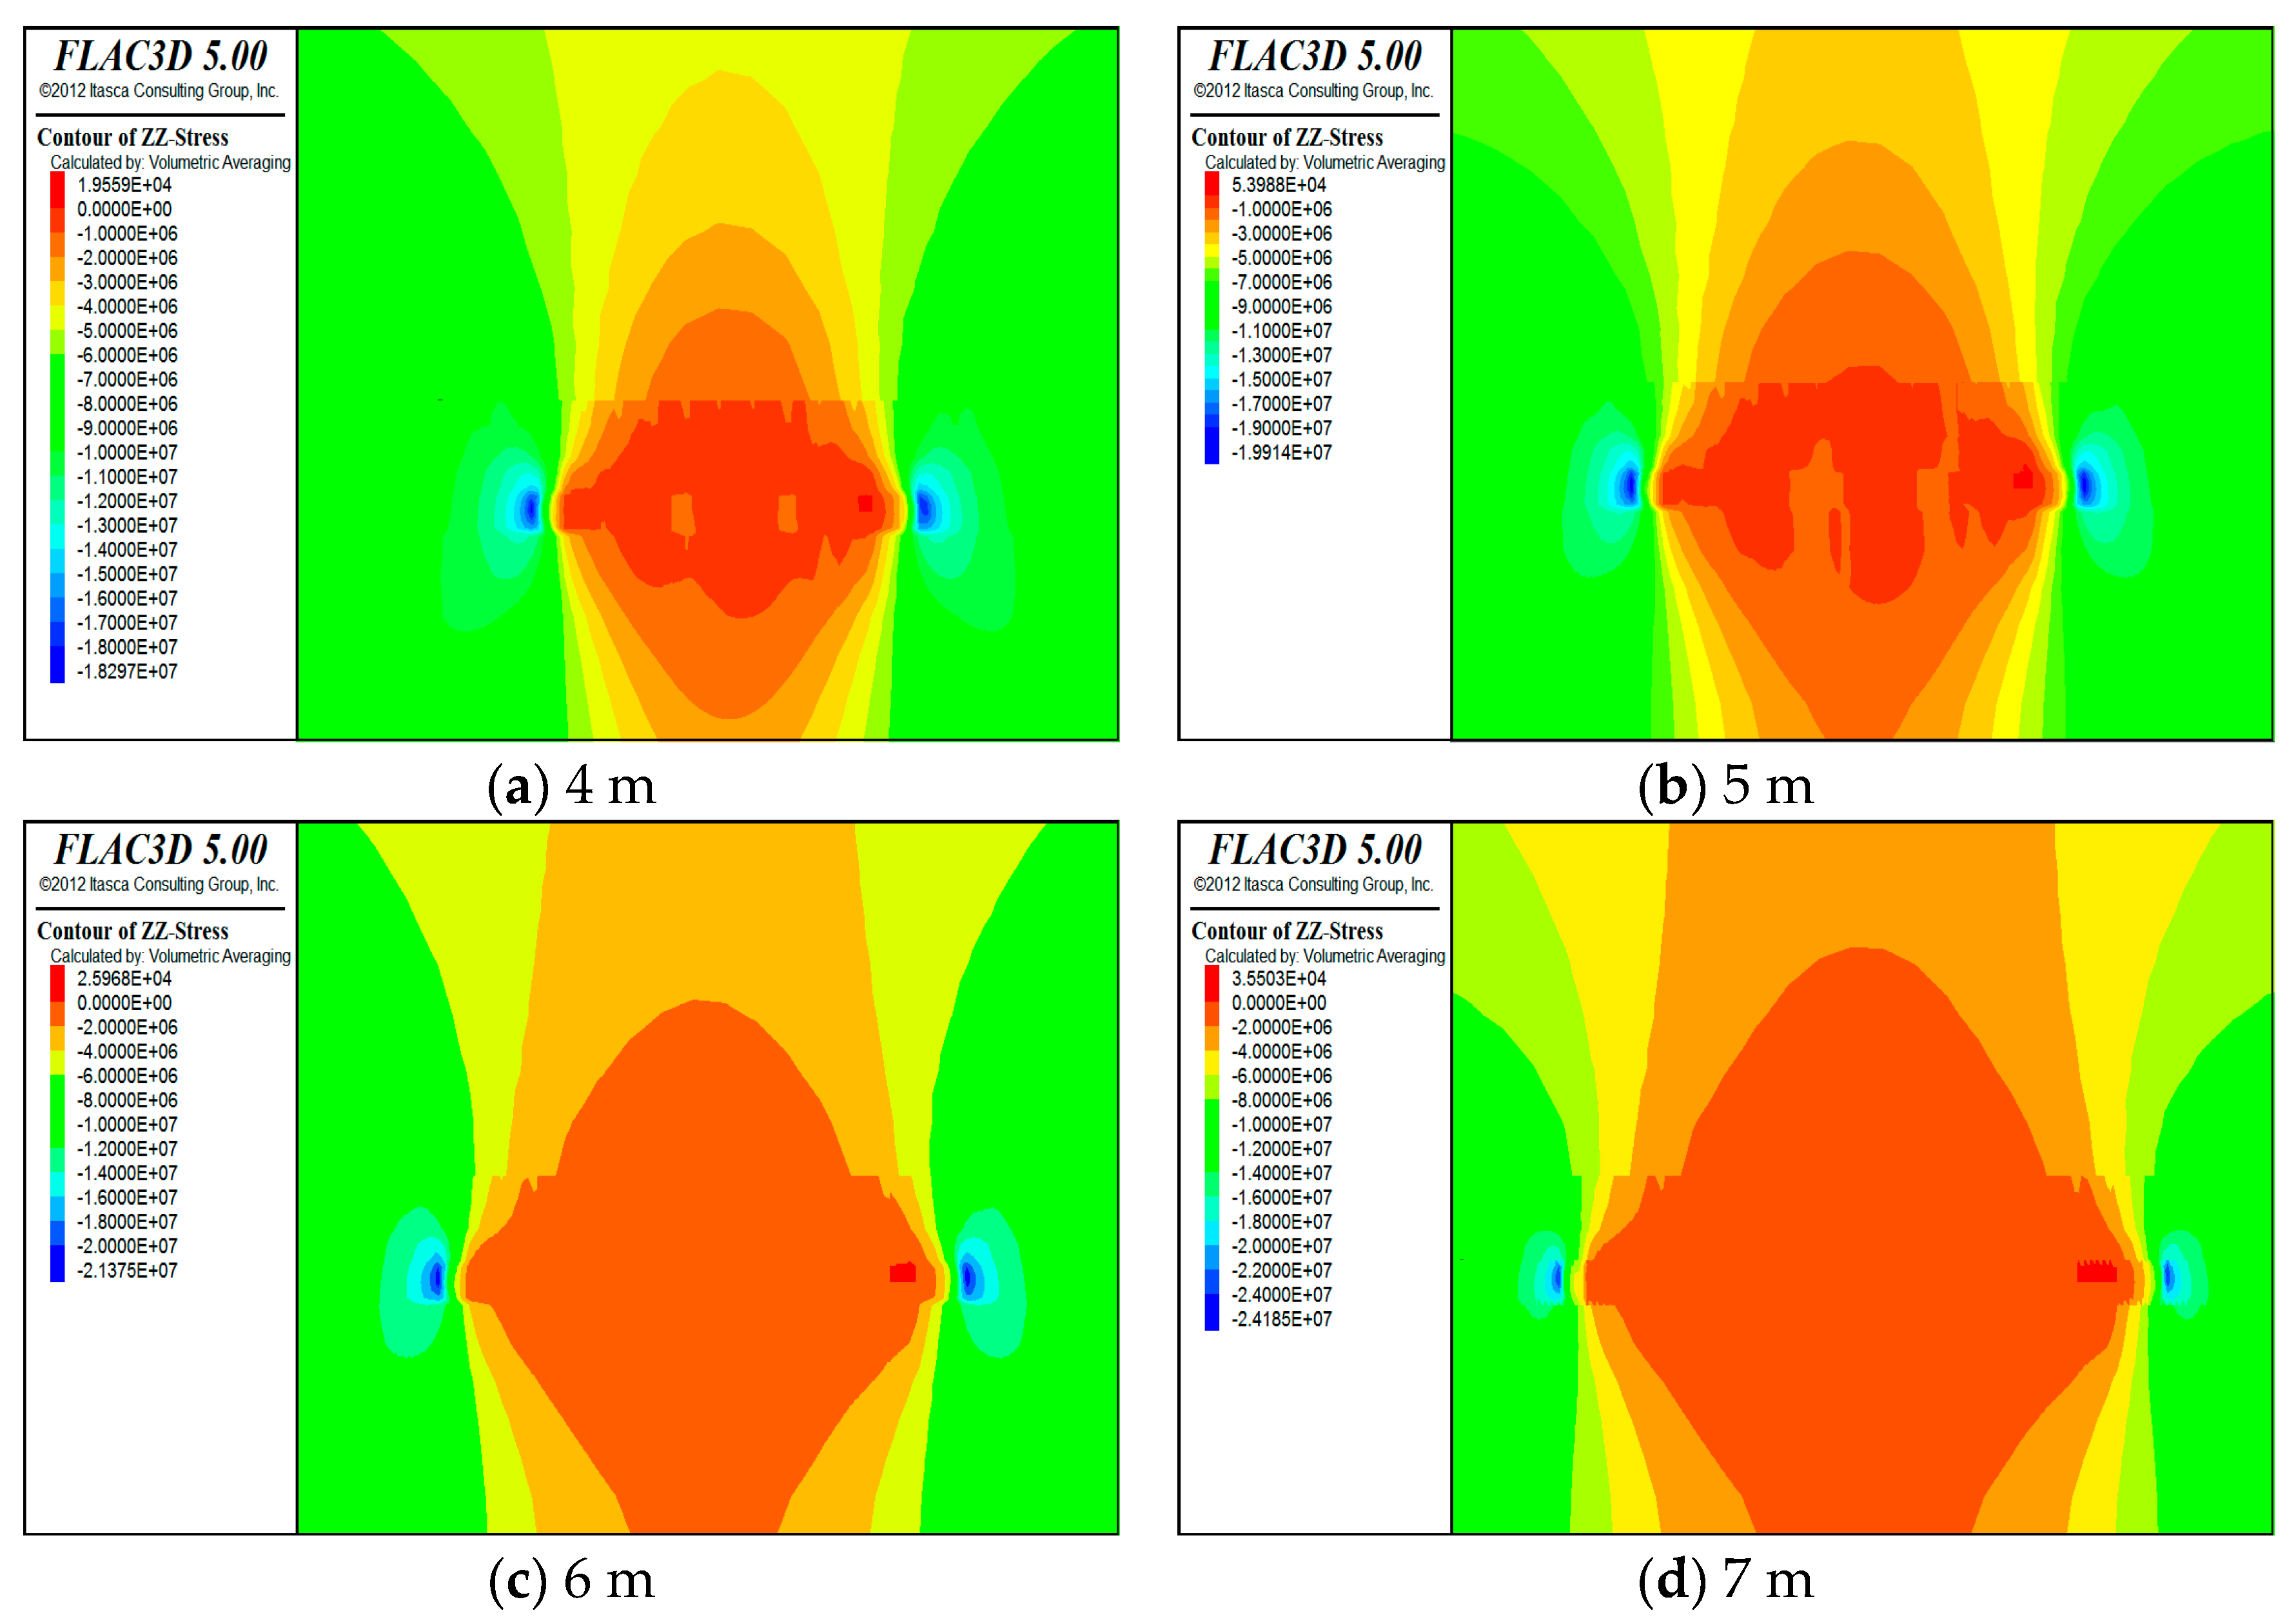
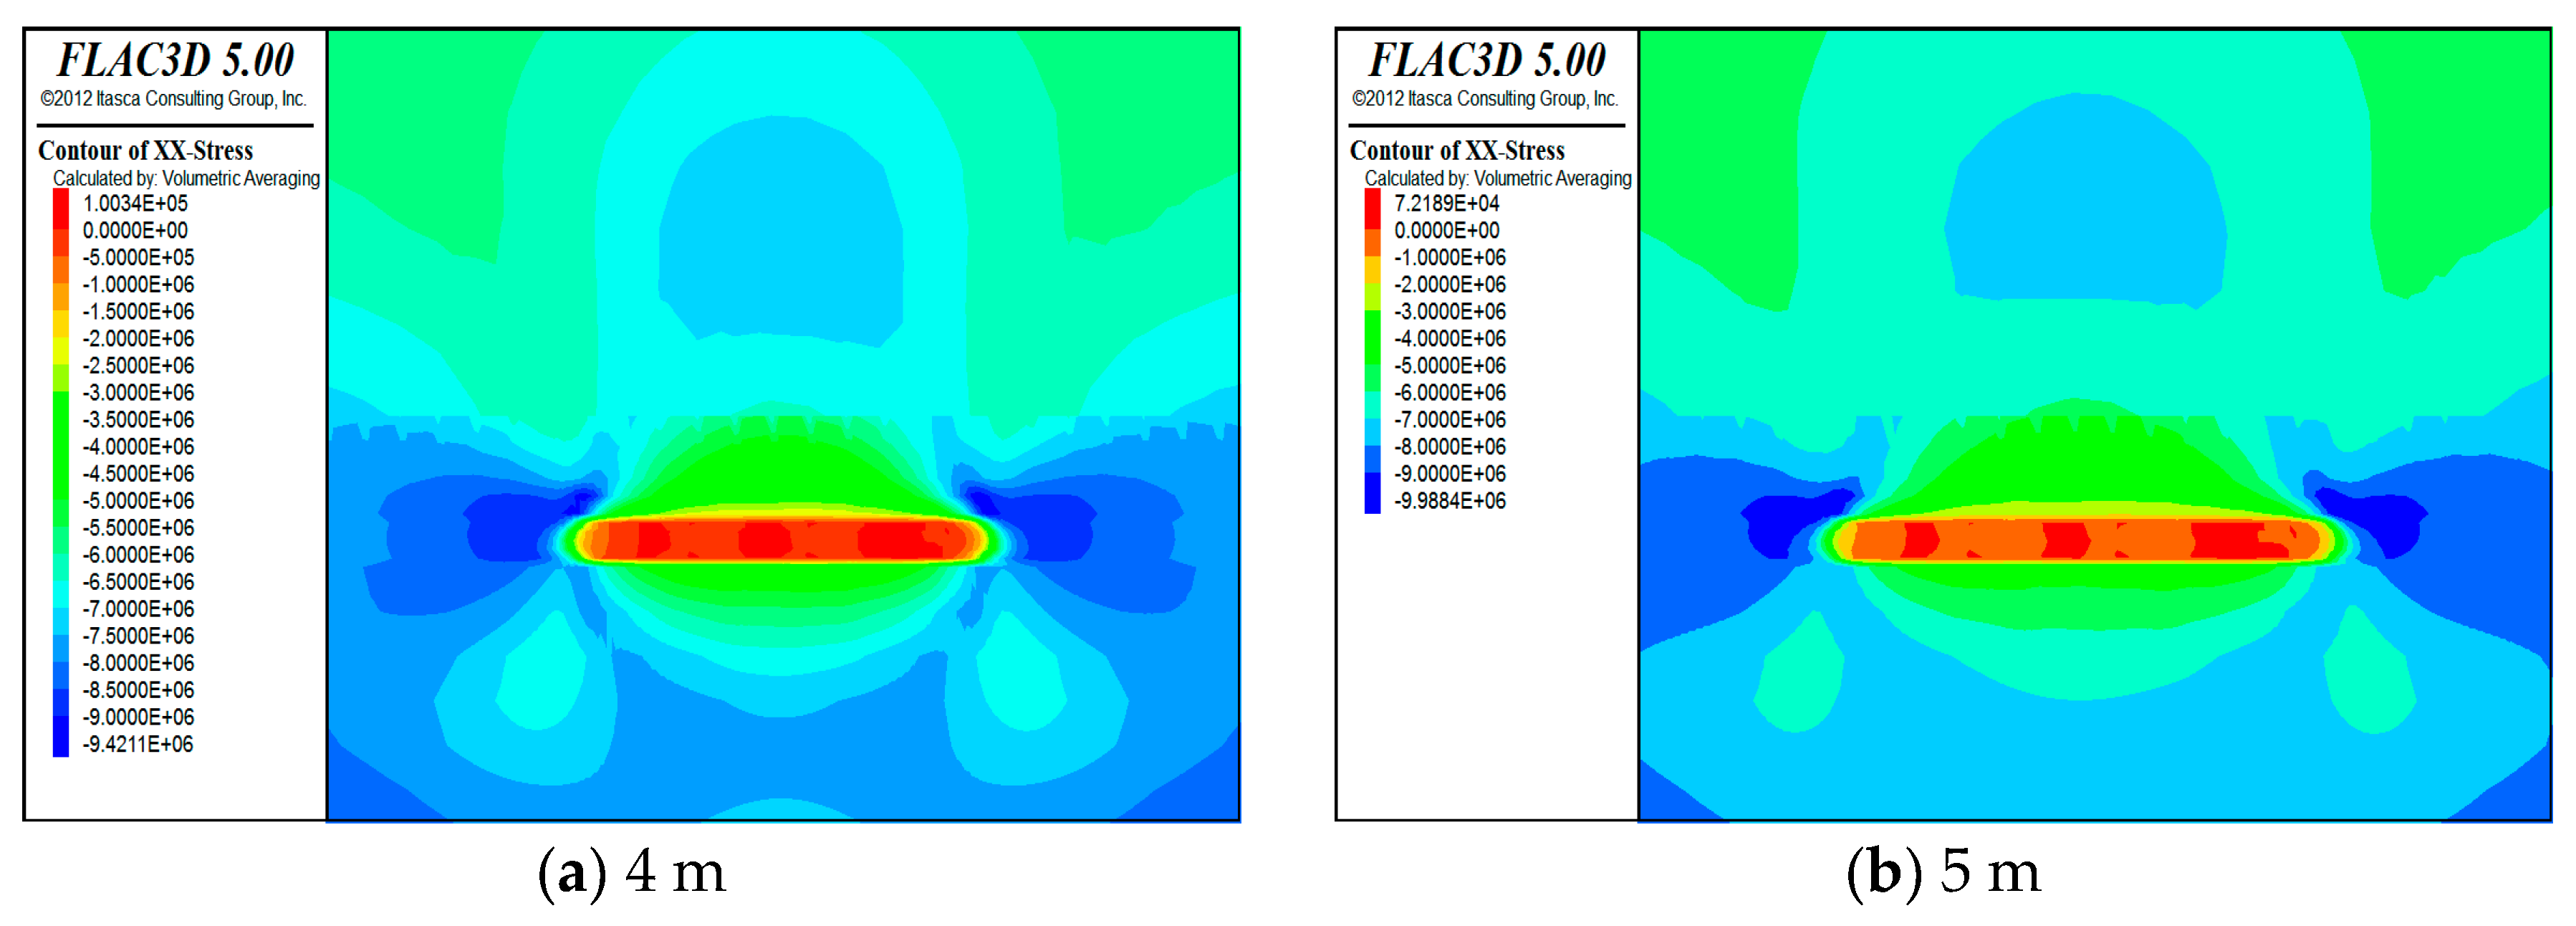
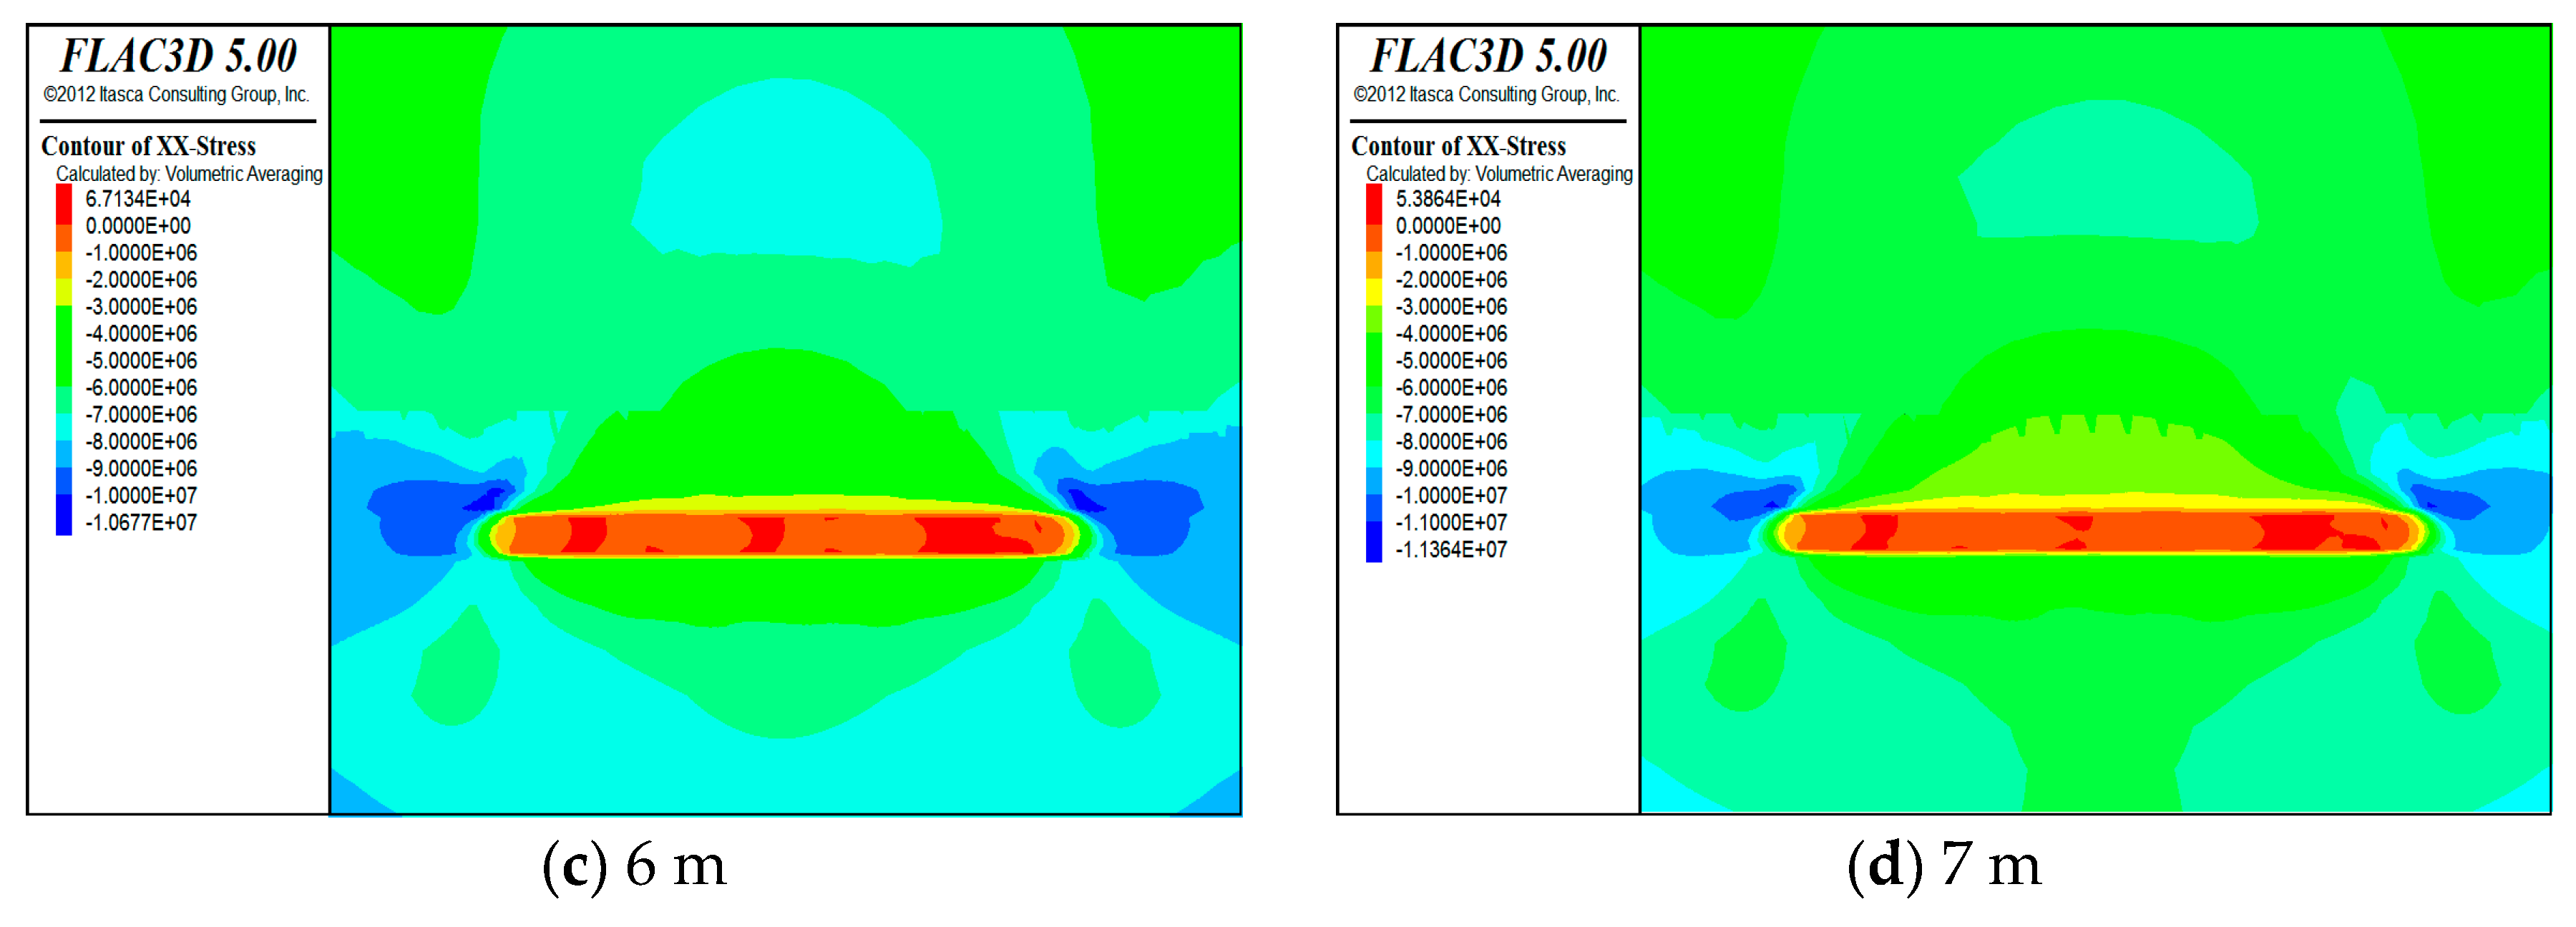
3.4. Stress Analysis of Surrounding Rock in Filling Face

3.4.1. Stress Analysis of the Surrounding Rock for Option I

Figure 14 is the cloud map of the horizontal stress distribution in the mining area after the fourth round of excavation and filling. The maximum horizontal stress in the mining area after the fourth round of digging and charging is concentrated in the position where the coal pillar intersects with the direct top on both sides of the mining area, and gradually decreases along the height direction; the maximum horizontal stress in the coal pillar increases very little, which coincides with the small increase of the horizontal deformation of the two sides after the four rounds of excavation and filling.
Figure 15 is the cloud diagram of the vertical stress distribution in the mining area after excavation and filling in the four-wheel working face. The maximum vertical stress is concentrated in the coal pillars on both sides of the mining area. The larger the mining width, the larger the mining area after completing four rounds of digging and charging, and the greater the vertical stresses in the coal pillars on both sides.

3.4.2. Stress Analysis of the Surrounding Rock for Option II

Figure 16 is the cloud diagram of the horizontal stress distribution in the mining area after the fourth round of excavation and filling. The maximum horizontal stress is concentrated at the intersection of the coal pillars and the immediate roof on both sides of the mining area, and gradually decreases along the height direction. The maximum horizontal stress of the column increases very little, which coincides with the little increase of the horizontal deformation of the two sides after four rounds of excavation and filling.
Figure 17 is the cloud diagram of the vertical stress distribution in the mining area after four rounds of excavation and filling. After the four rounds of excavation and filling, the maximum vertical stress is concentrated in the coal pillars on both sides of the mining area. The larger the mining width, the larger the mining area after four rounds of excavation and filling and the greater the vertical stress of the coal pillars on both sides, and the filling body has not been fully loaded after the excavation and filling of the working face.

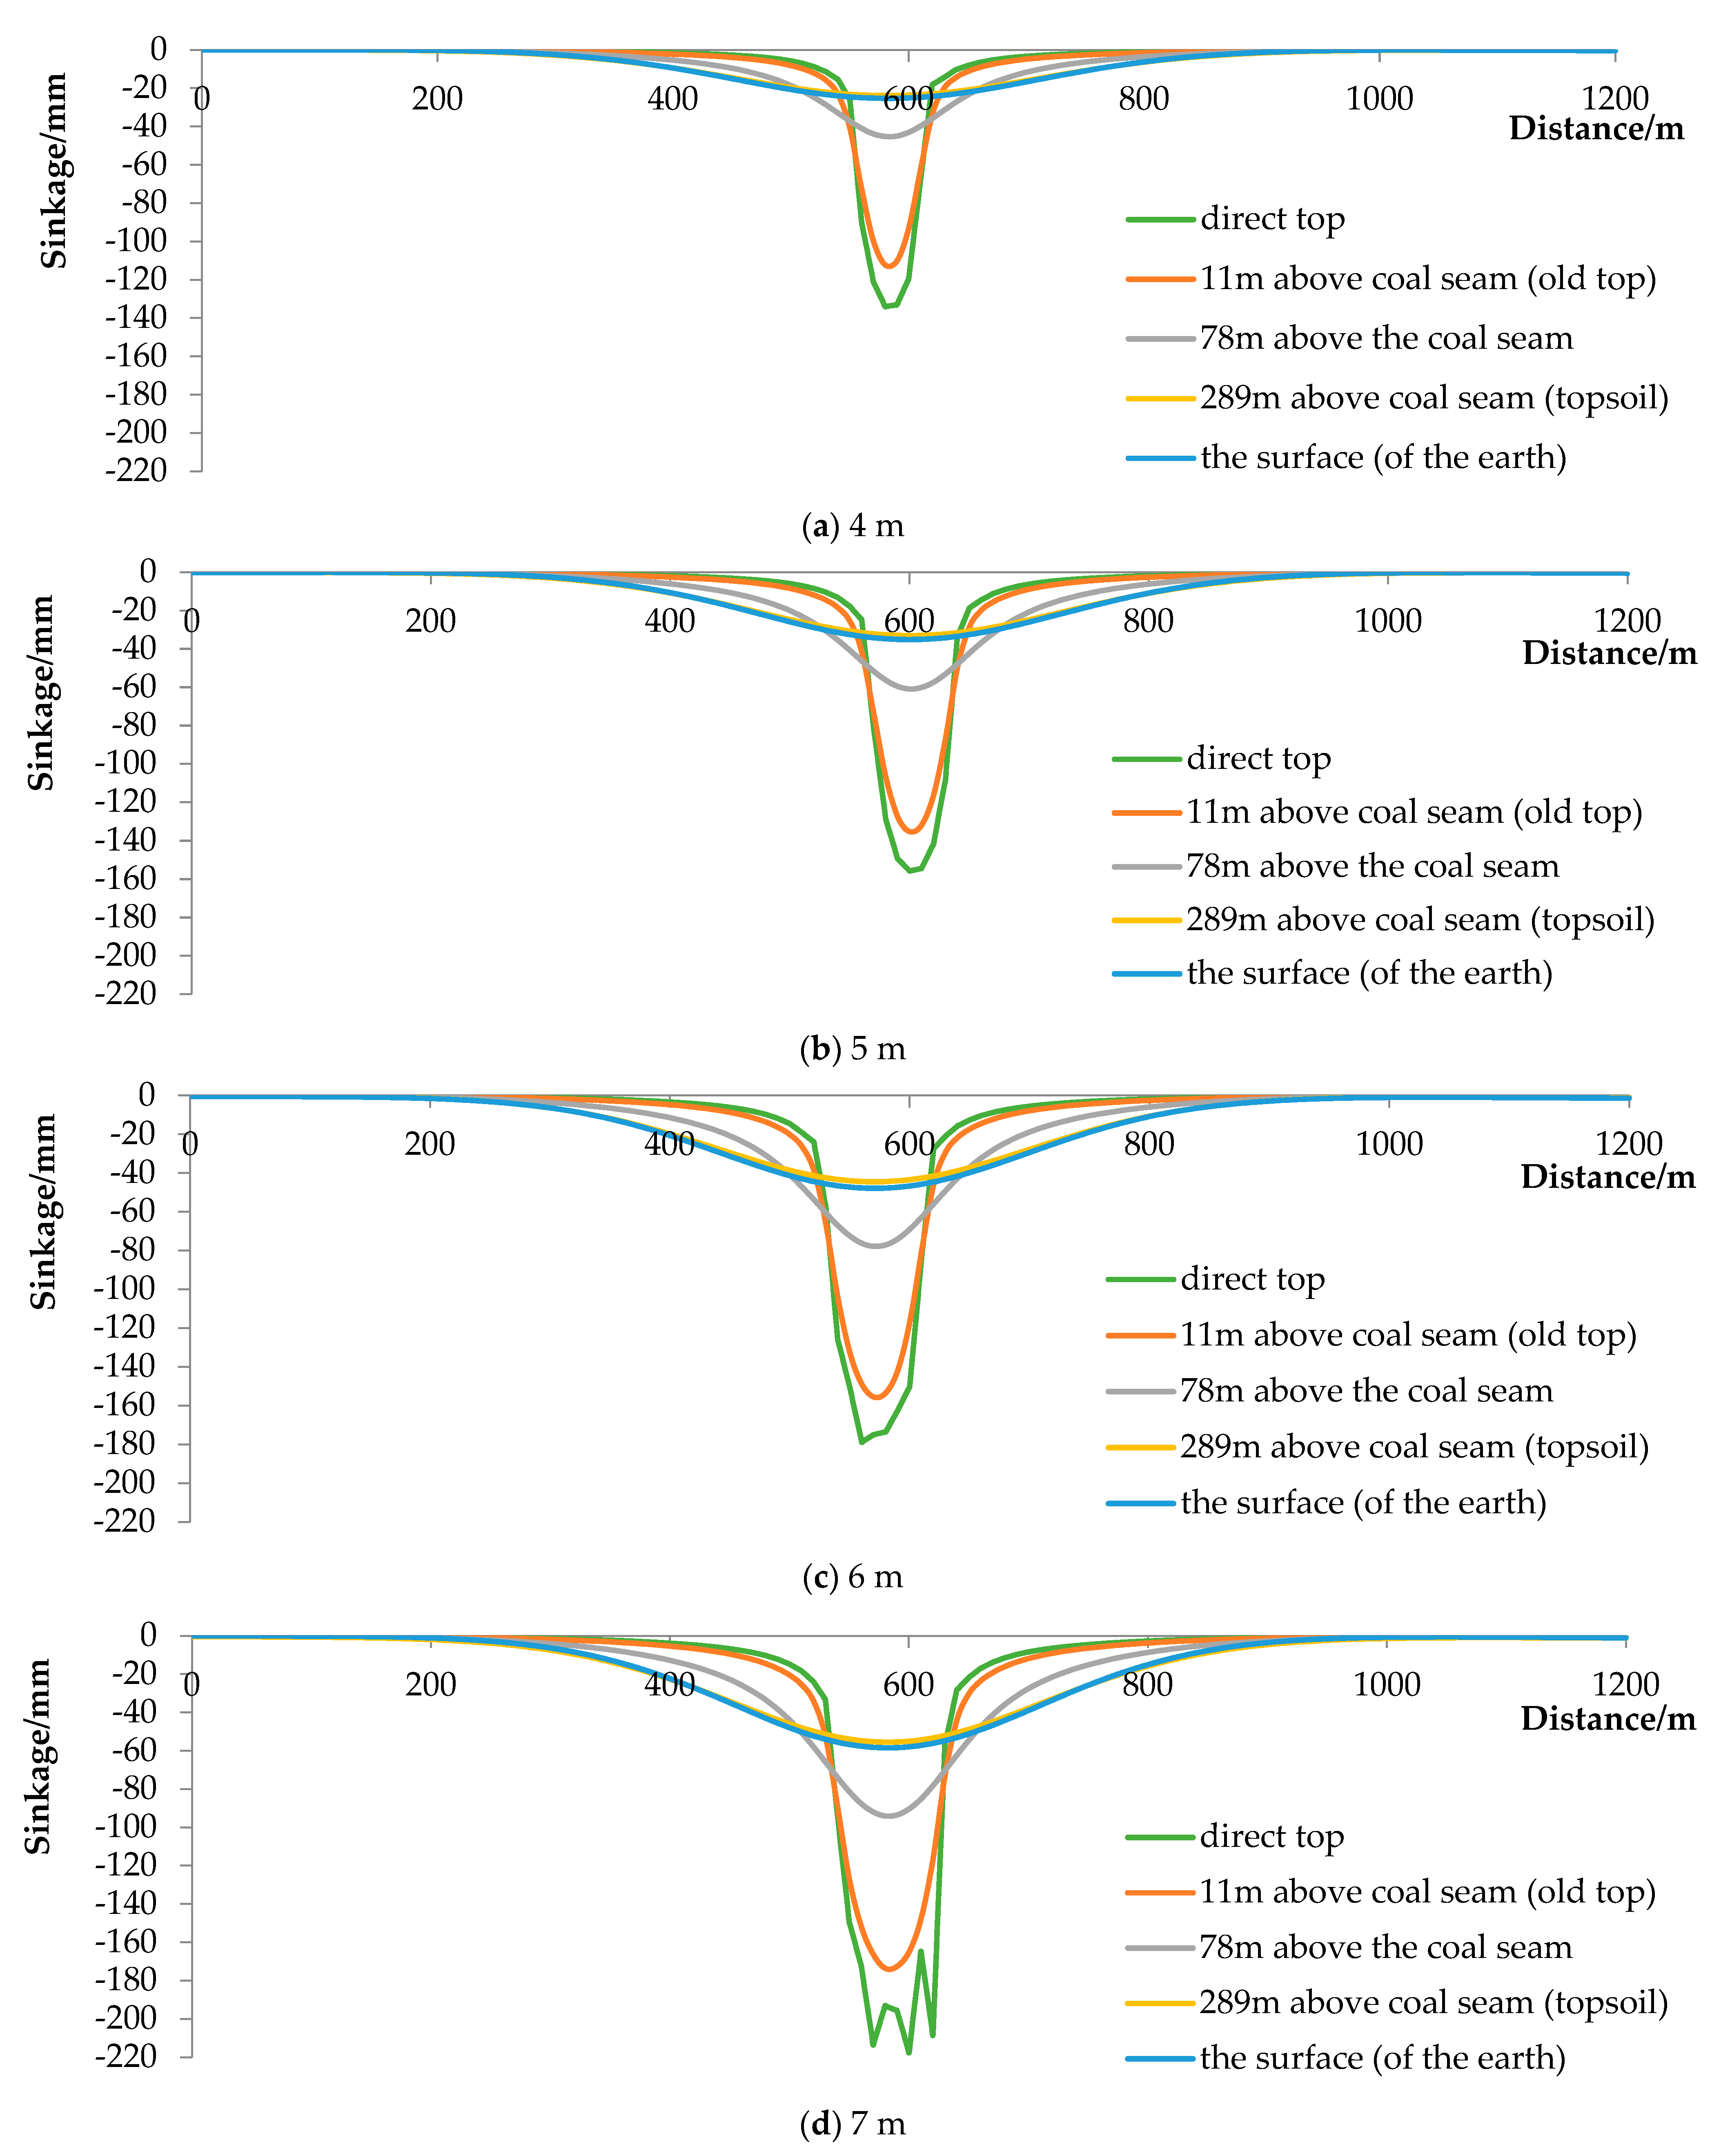
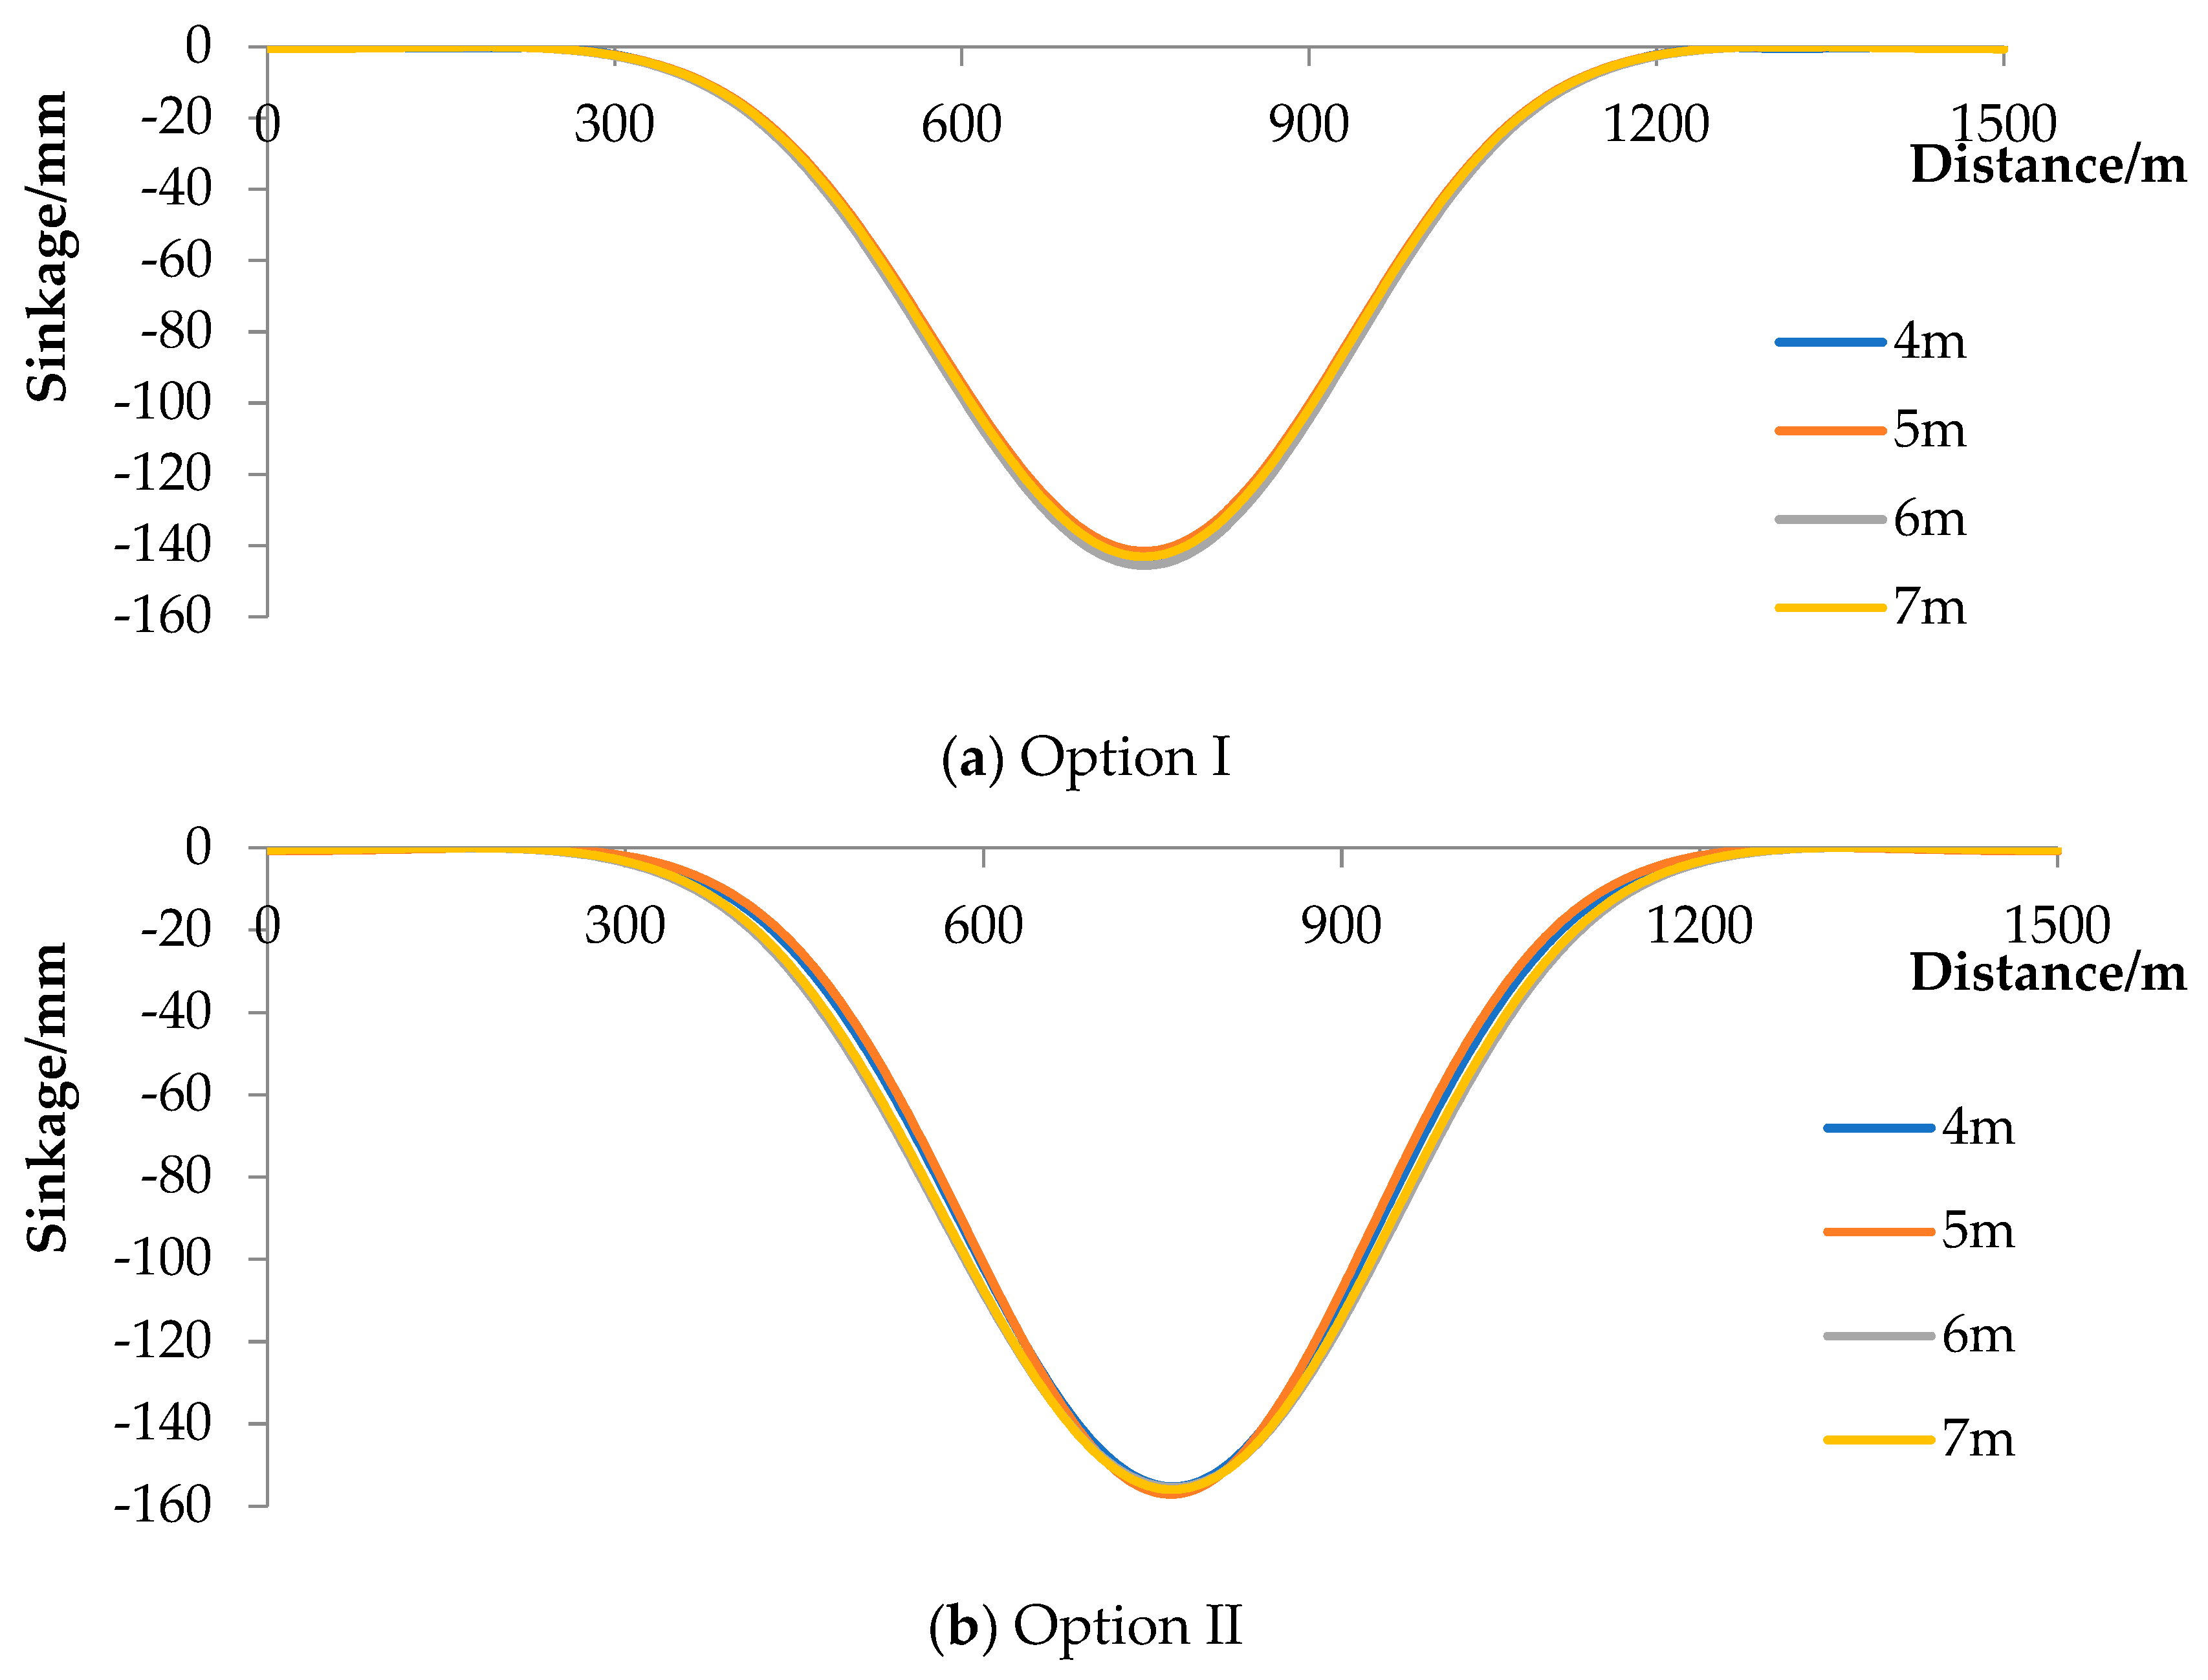
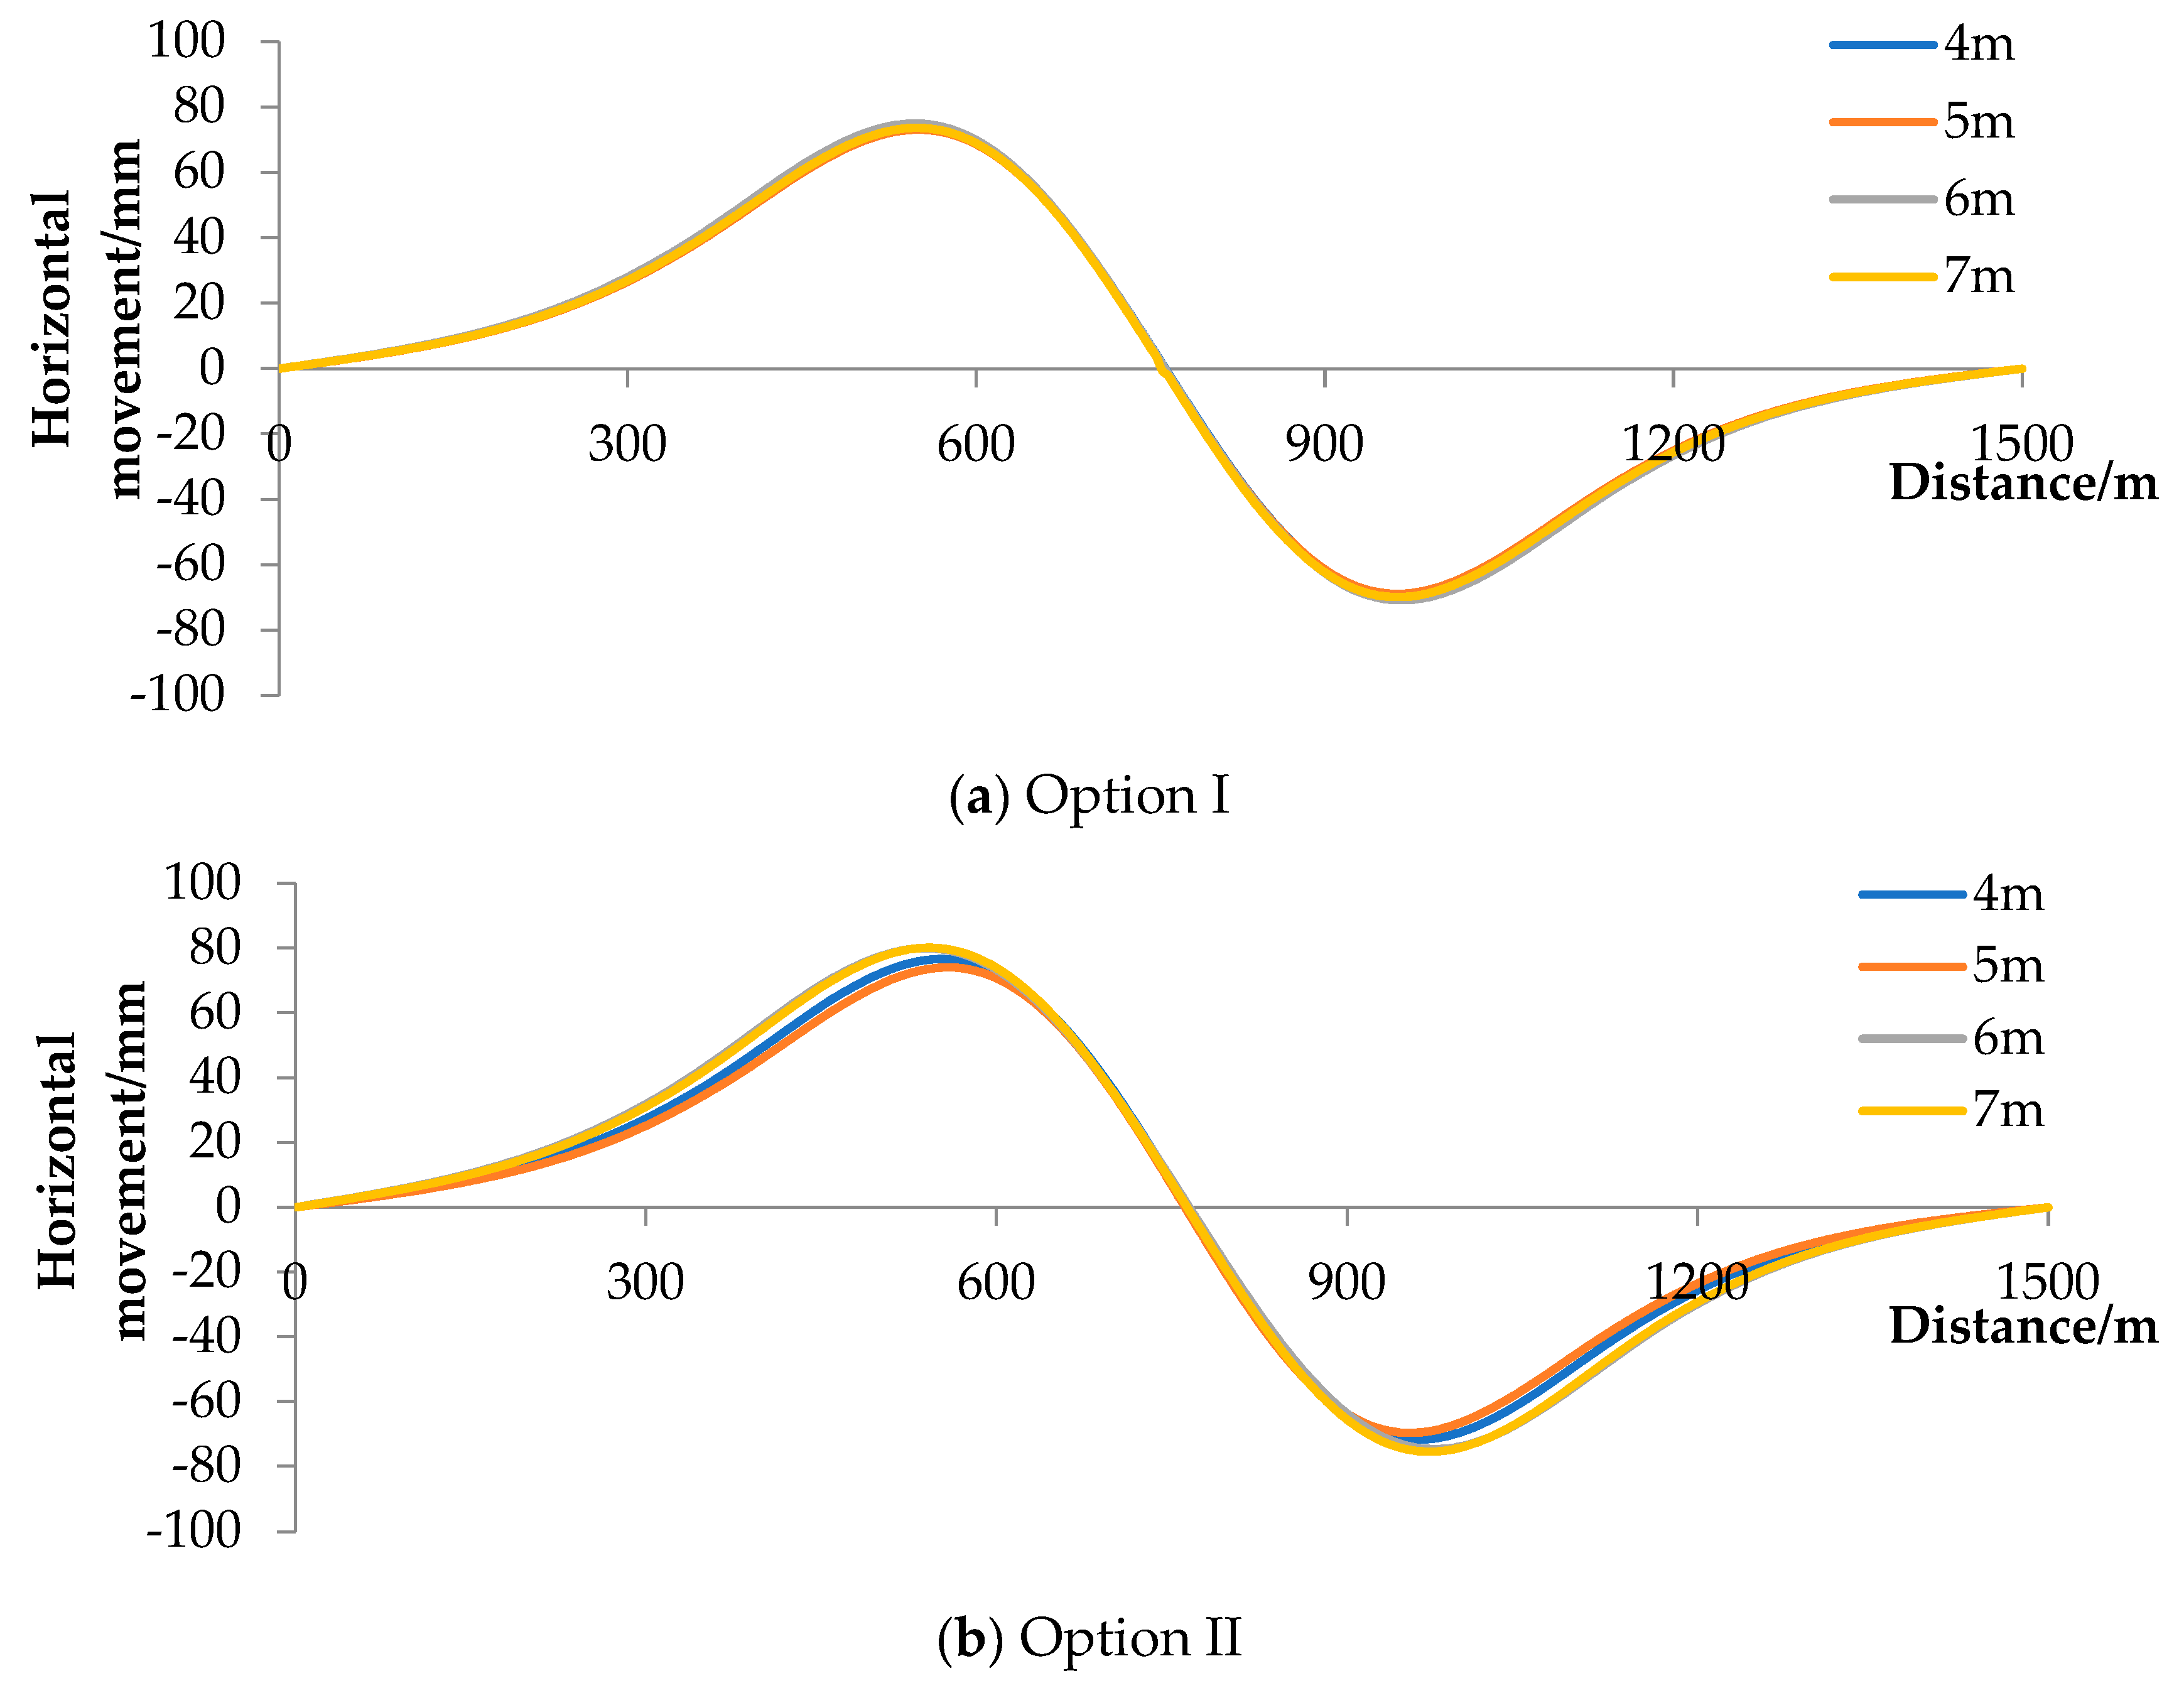
3.5. Surface Movement Analysis

In summary, the analysis of the surrounding rock deformation, surrounding rock stress, and surface movement at the filling face under different mining widths and different retrieval sequences shows that:
(1) From the perspective of controlling the deformation of the surrounding rocks, the mining sequence of option II is conducive to the support of the working face and more favorable to the management of the roof. The smaller the mining width, the more favorable it is to the support of the working face; when the mining width reaches 7 m, the roof is difficult to manage, thus the mining width is best controlled below 7 m.
(2) From the perspective of the stress distribution in the surrounding rock, the vertical stress and horizontal stress during the digging and filling process of option II are smaller than those of option 1. The smaller the mining width, the smaller the increase in stress caused by digging and filling, and the more conducive it is to the stability of the coal column and the filling body. However, under the conditions of too small a mining width, the number of working faces increases significantly, the number of moves of digging and filling equipment will increase, and the support costs of the working face will be greatly increased.
(3) The following conclusions can be drawn from Figure 18 and Figure 19 and Table 6. From the point of view of surface control, the control effect of option I is slightly better than that of option II, both of which can ensure that the impact of mining on surface structures after mining is controlled within the range of Class I. The smaller the mining width, the better the control of surface movement.
Therefore, considering the support effect, surface control effect, and economic benefits of the working face, the mining sequence is selected as option II. In order to determine a reasonable mining width more accurately, the movement deformation law of the overburden and surface under the mining width of 5 m and 6 m are analyzed by similar simulation experiments next.

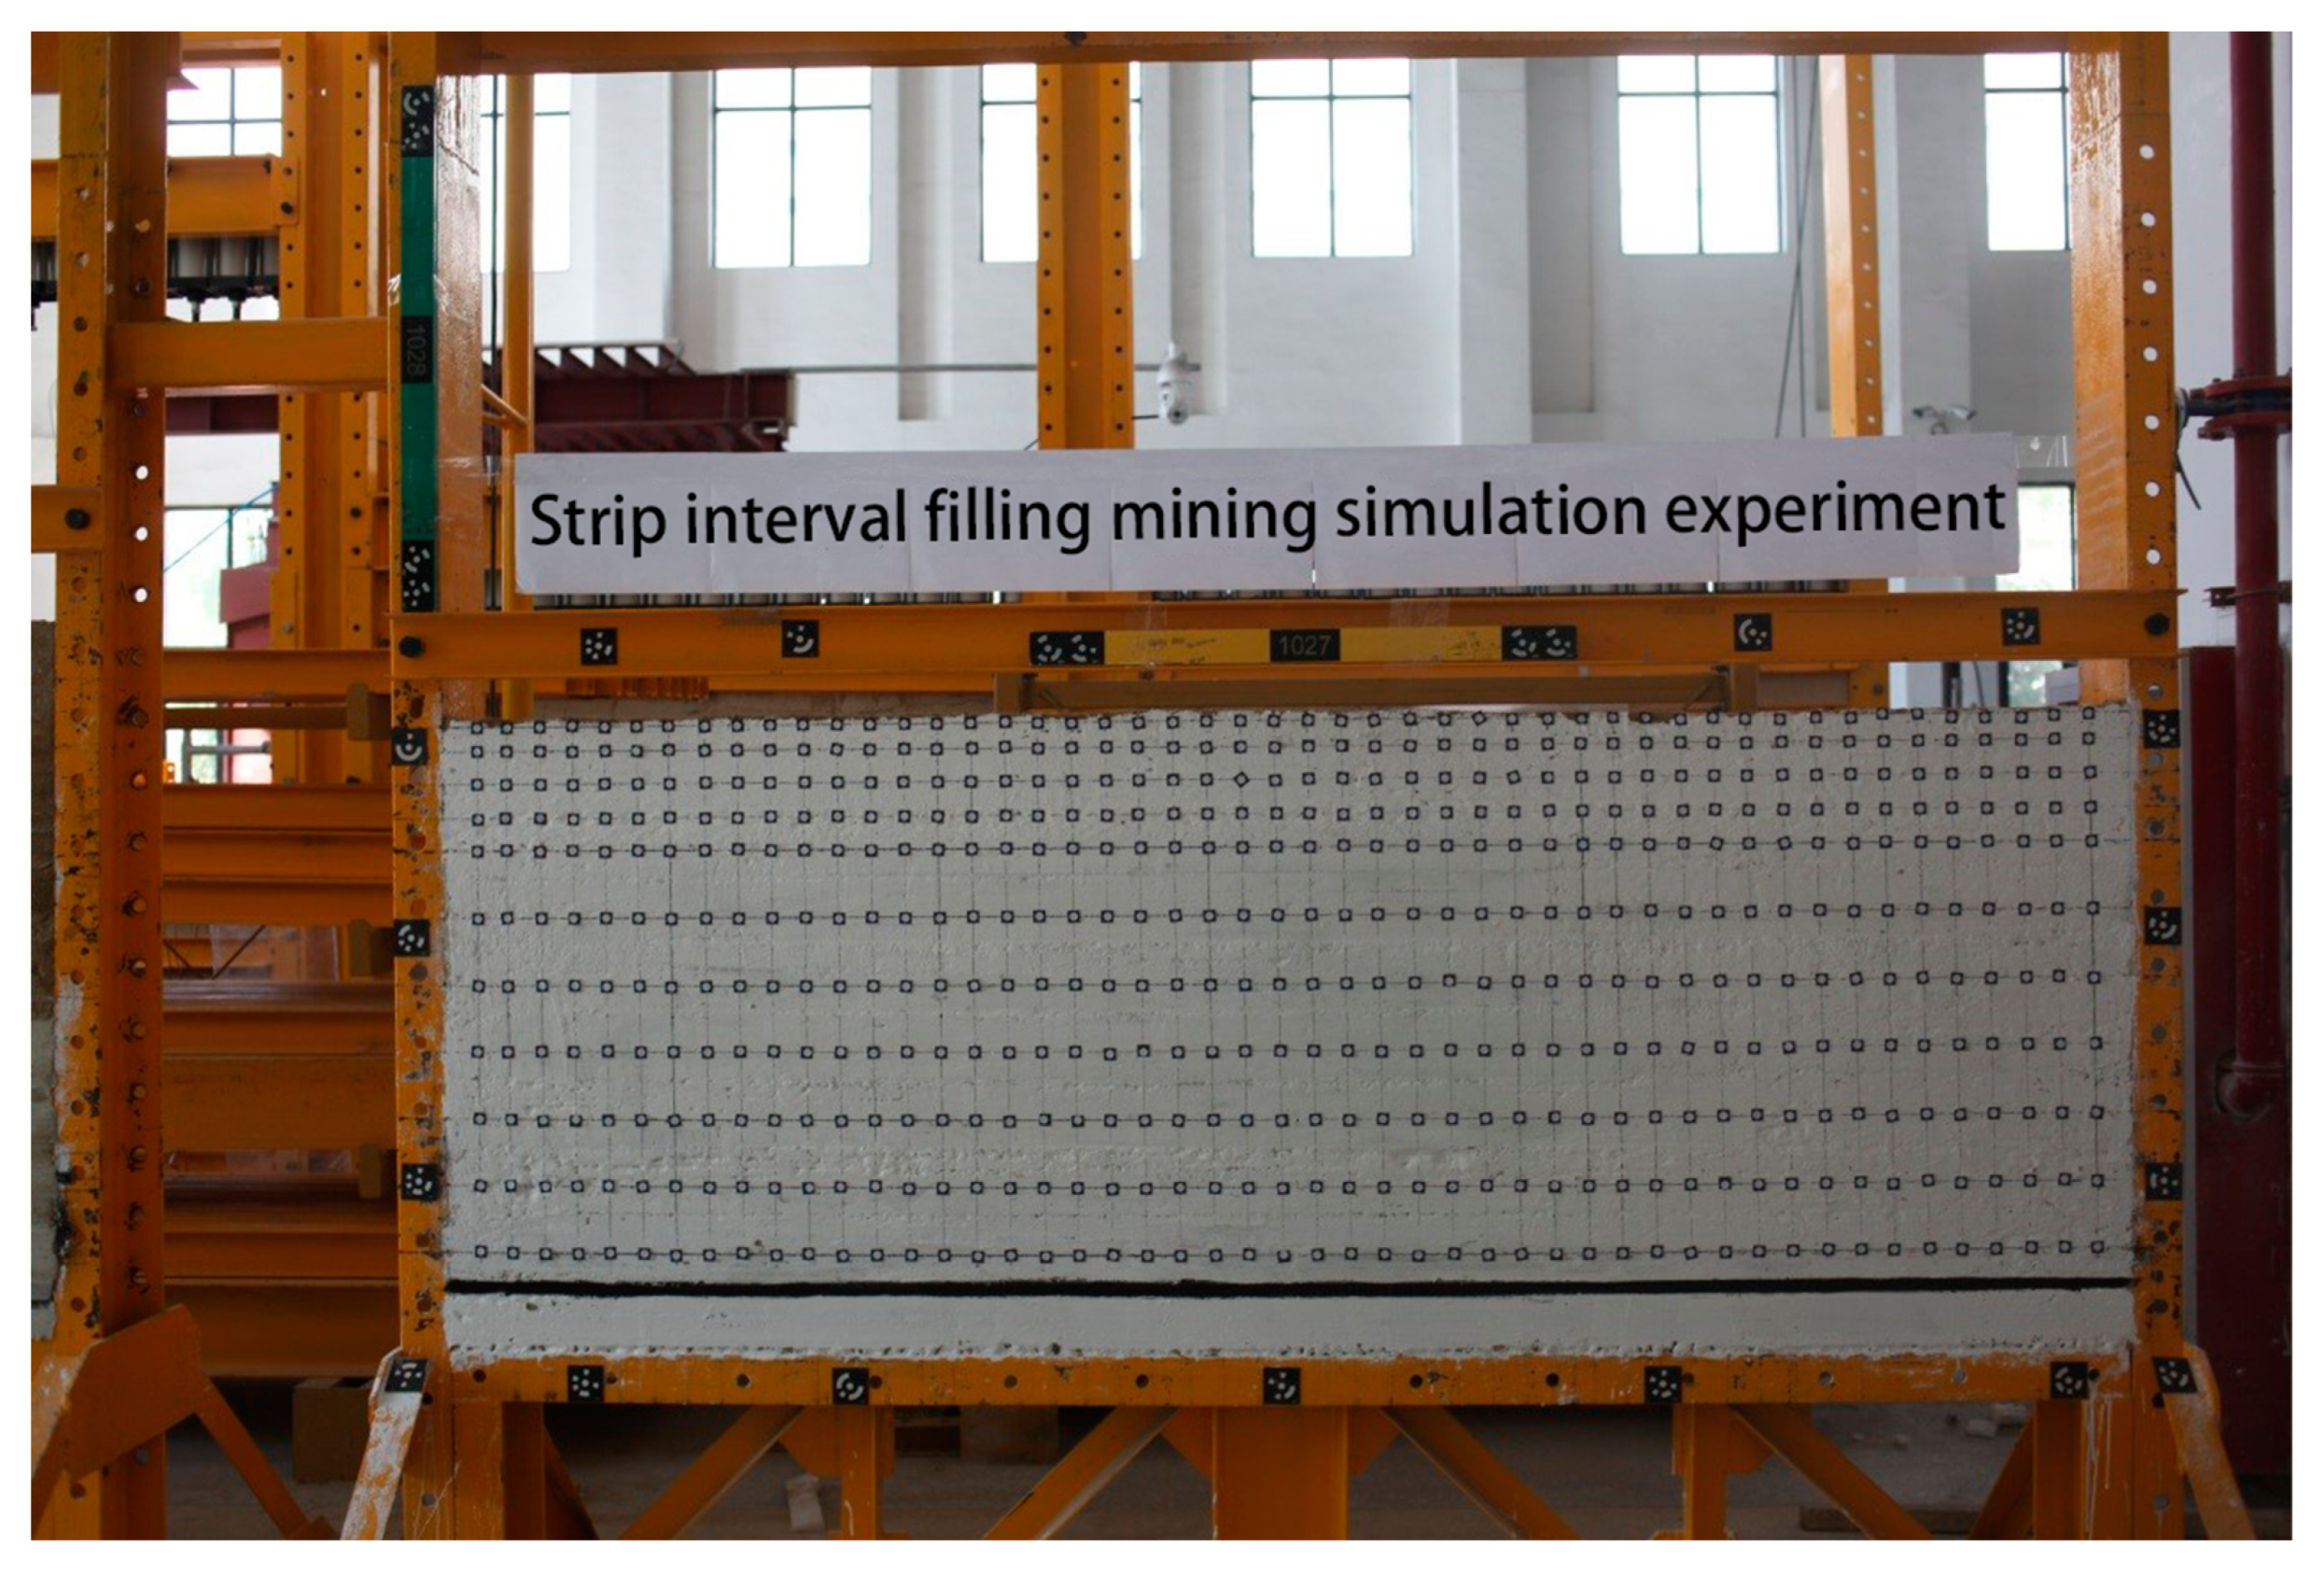
4. Similar Simulation Research on Rational Mining Width of Gangue-Filling in Thick Coal Seams without Support

A similarity simulation test is a model testing technique based on similarity theory, and the success of a similarity simulation test often depends on the degree of satisfaction of similarity conditions between the model and the prototype. The similarity simulation test is used to simulate the rock mass with materials similar to the mechanical properties of the prototype in a certain geometric scale, to excavate it, and to propose a basis and a way to improve and optimize the technical solution by measuring and analyzing its laws under the premise of meeting similar boundary and initial conditions [32,33,34].

4.1. Similar Material Model Design

The test combined rock layers with similar mechanical properties and used a 2500 mm × 200 mm plane stress test bench. Considering the height of the model, the geometric similarity ratio of the model was determined to be 1:400, and the geometric dimensions were (L × W × H) 2500 mm × 200 mm × 905 mm. The model layering is shown in Table 7, and the model material ratios are shown in Table 8.
The field model is shown in Figure 20. A total of 24 working faces were laid out in this test, with 12 5 m strip faces and 12 6 m strip faces. After excavation of the roadway was completed, 10 min was waited to provide sufficient time for the deformation of the roadway envelope, and then filling was carried out. The mining sequence was in accordance with option II above.

4.2. Deformation Analysis of Overlying Rock after Four Rounds of Excavation and Filling

From Figure 21 and Table 9, it can be seen that:
(1)
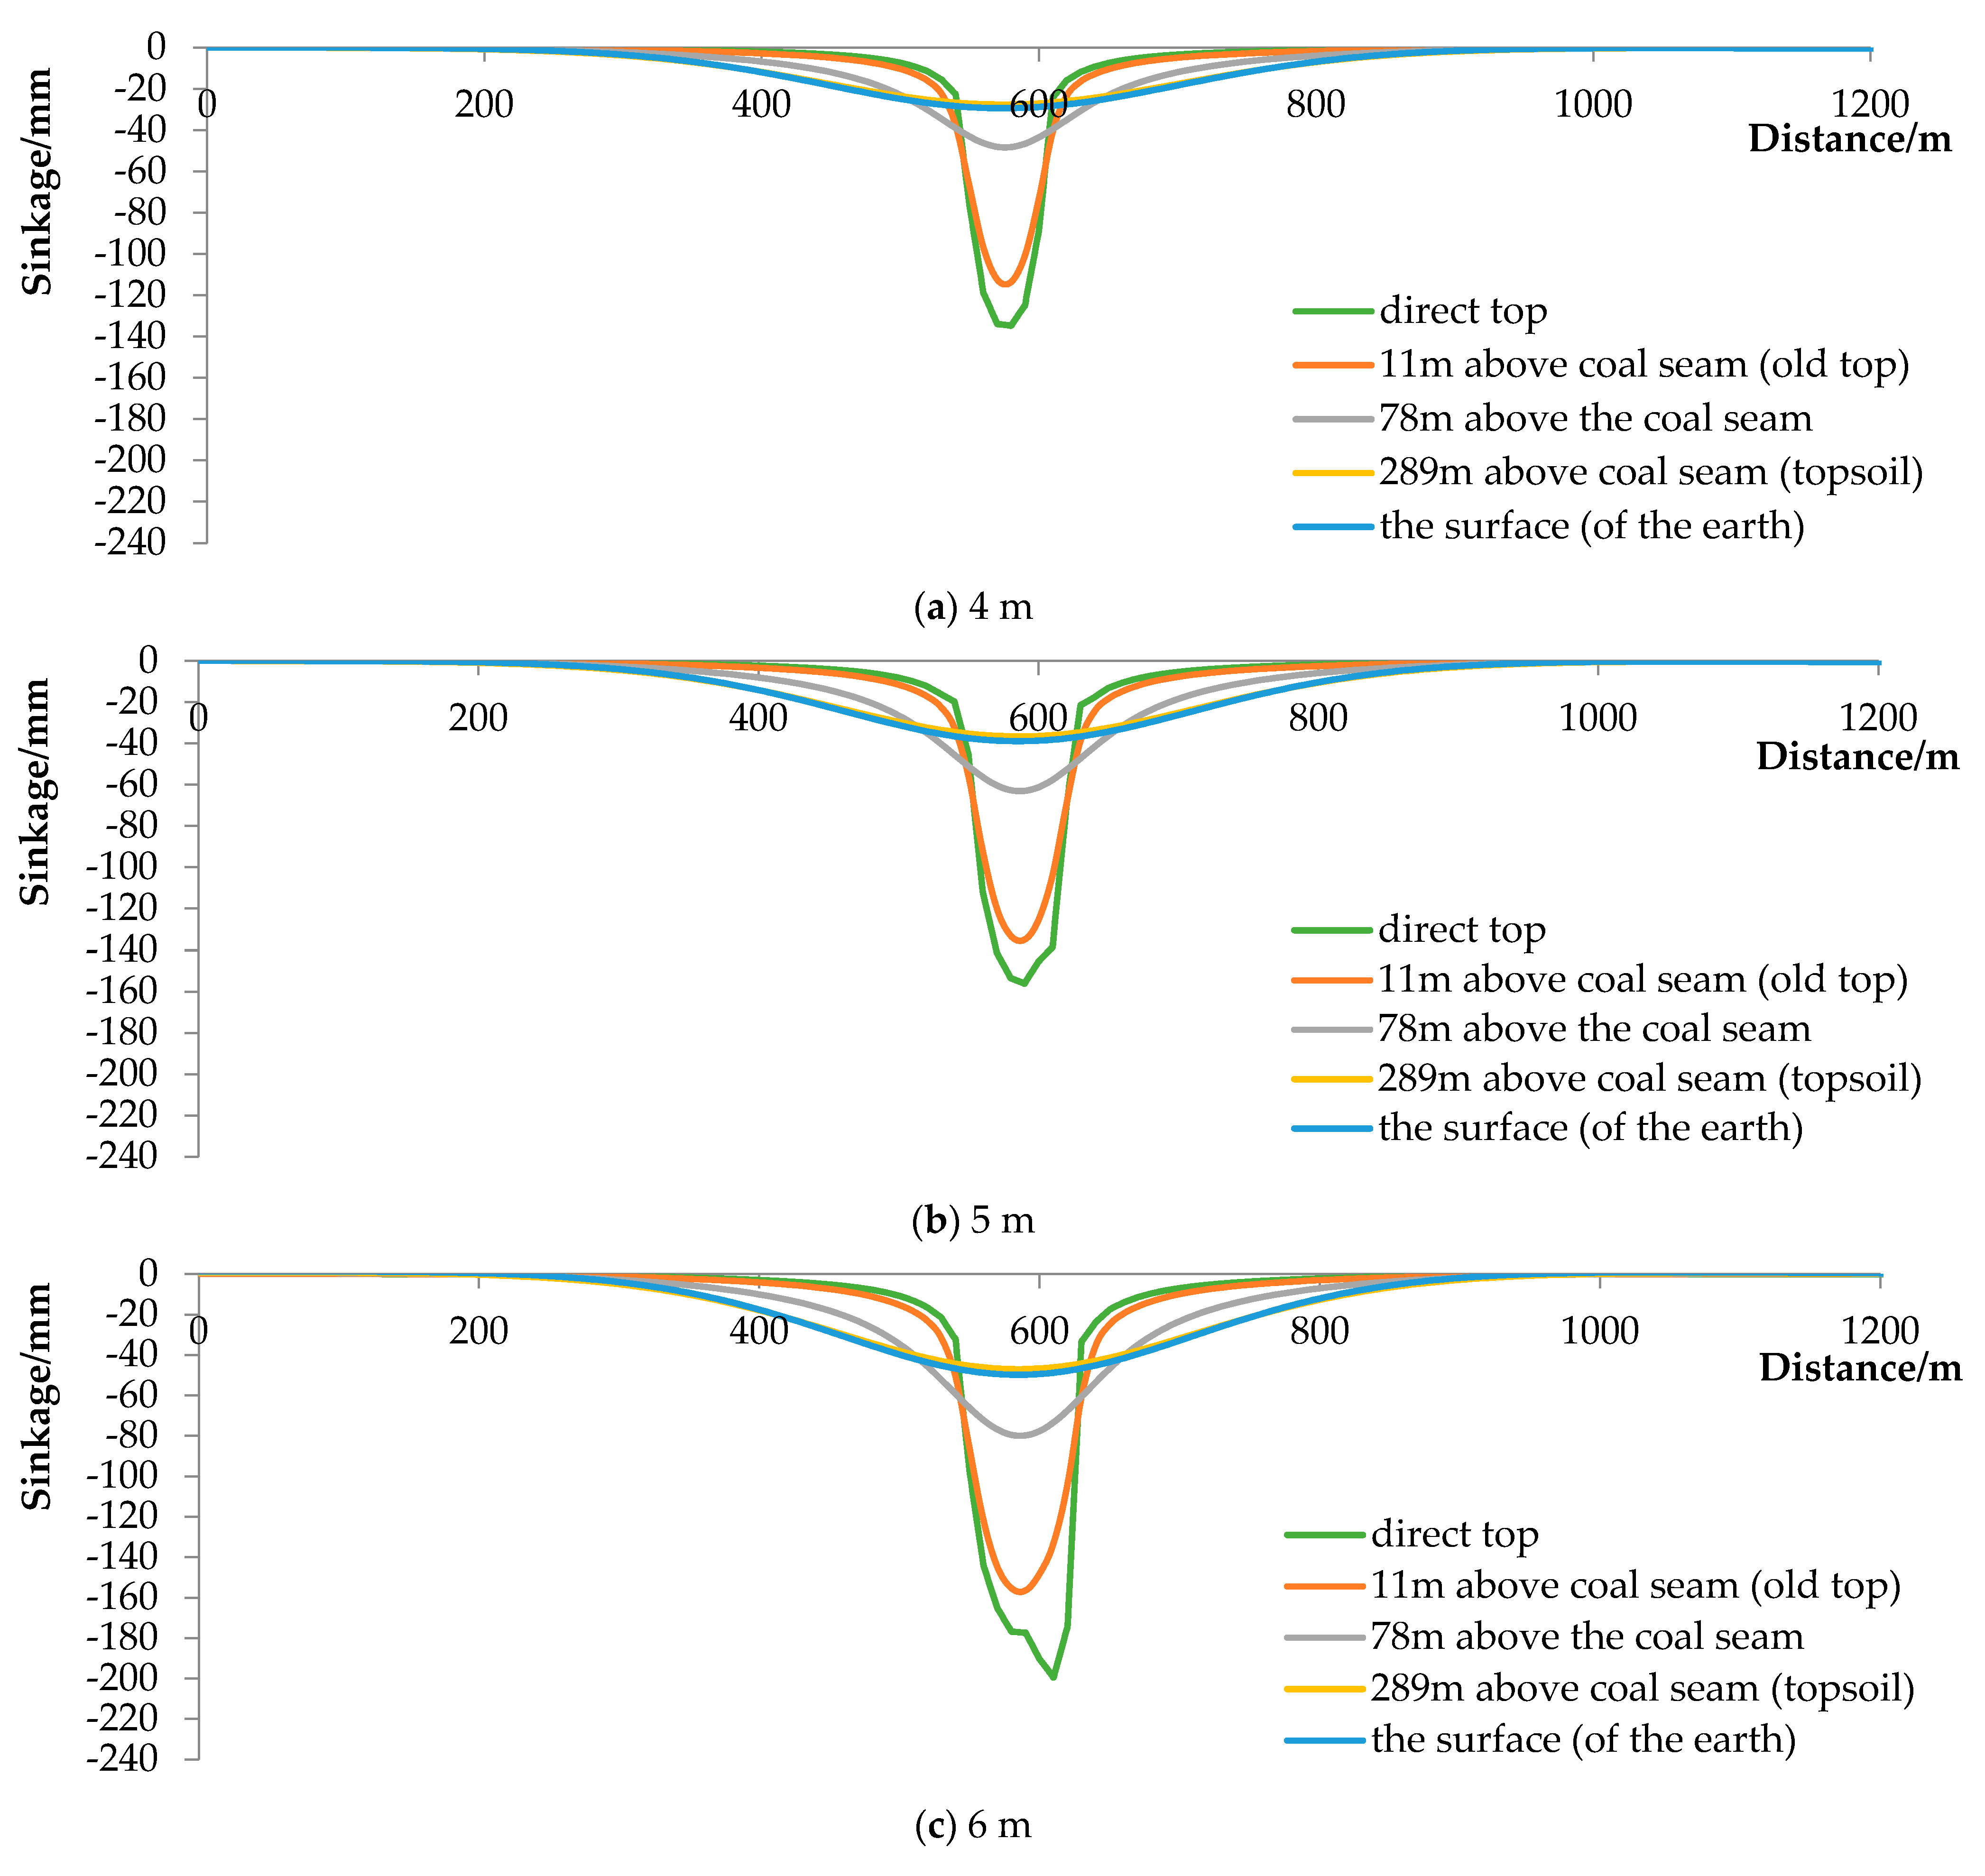
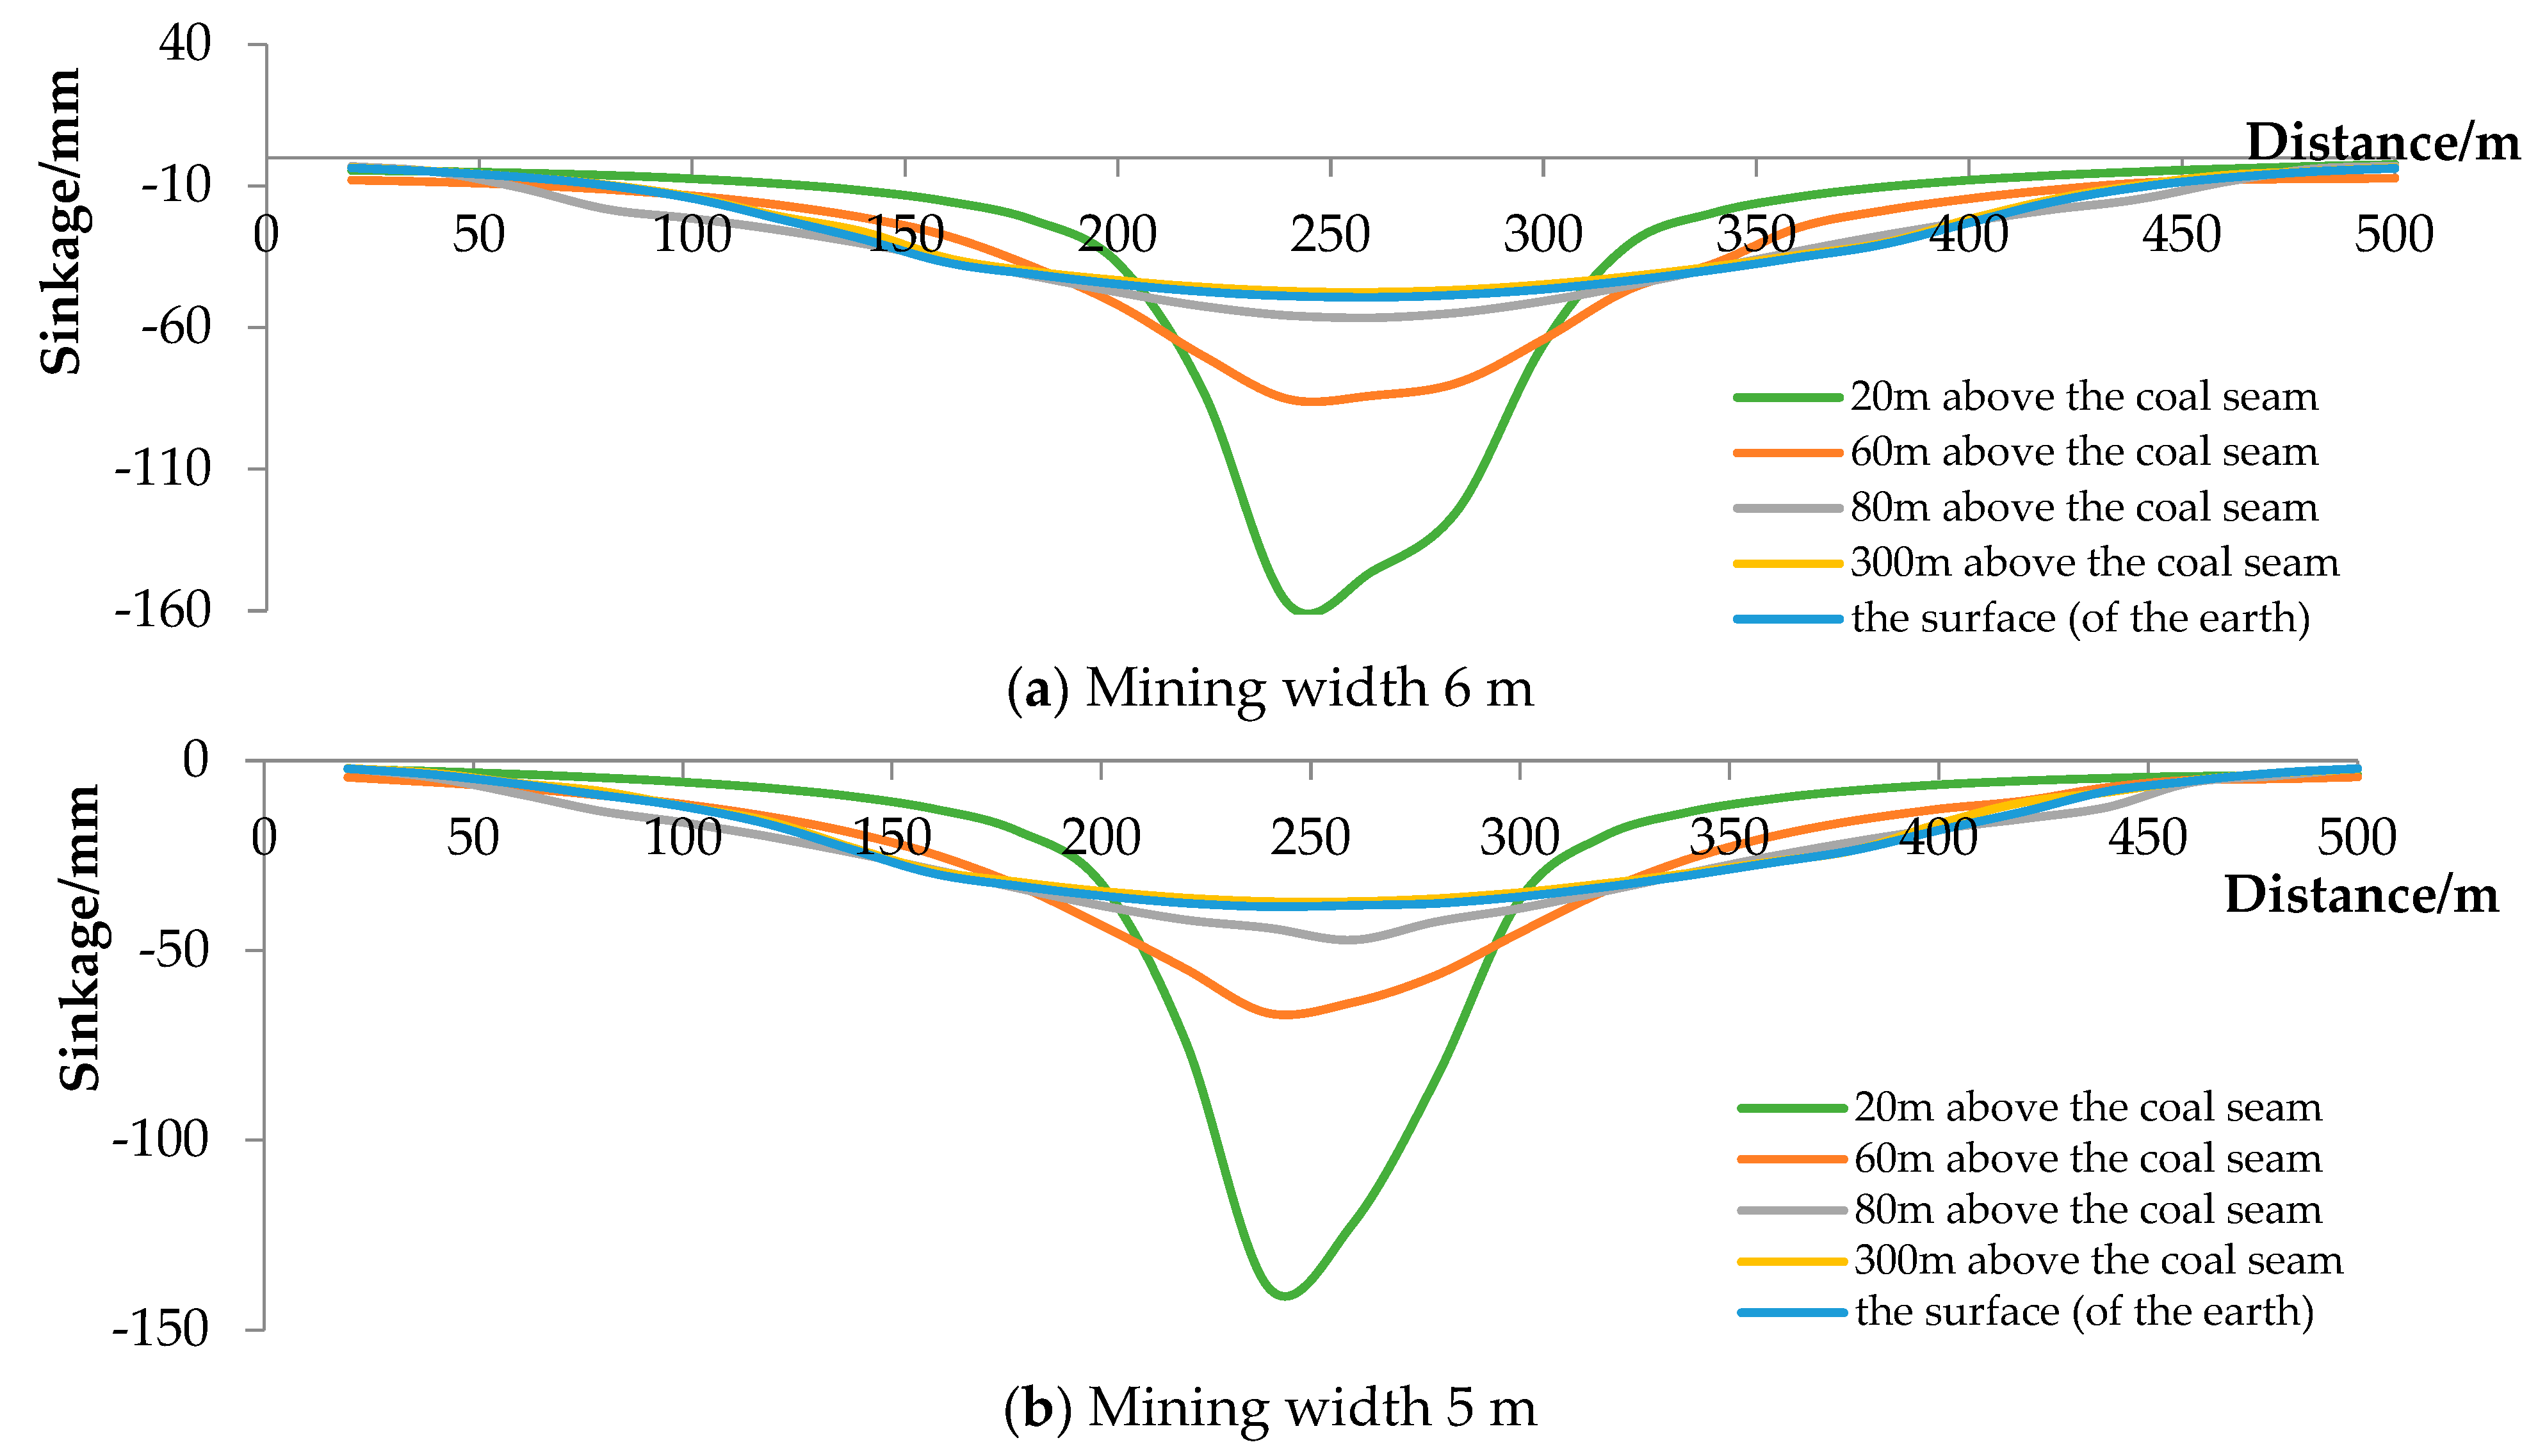
After the end of four rounds of excavation and filling, all the coal in the mining area was extracted, the overlying rock layer in the mining area was supported by the filling body, and the top plate will sink further with the compression of the filling material, but the increase of the top plate sinking was not obvious.
(2)
The working face was filled after mining, and the filling body effectively controlled the movement of the overlying rock layer. In addition, the sinking of the rock layer above was greatly influenced by the compression properties of the filling body.
(3)
The subsidence of the surface was still synchronized with the subsidence of the topsoil layer 300 m above the coal seam, the increase in the subsidence of the topsoil layer was less than the increase in the subsidence of the rock seam, and the influence of the mining width on the surface was gradually obvious as the mining area increased.
The analysis of the overburden deformation law under different mining widths through similar simulation tests shows that when the number of working faces is small, the overburden deformation law is more or less the same when the mining width is 5 m and 6 m, and with the increase of the number of working faces, the increase of mining width will lead to the increase of overburden and surface deformation. After the working face is mined and filled, the roof is well controlled under the support of the filling body, and there is a key layer to control the overburden and surface deformation at 80 m above the coal seam. The similar simulation results are close to the numerical simulation results, which shows that the study on the control of surface deformation of unsupported thick coal seam gangue-filling mining is reasonable.

5. Conclusions

This paper researches gangue-filling mining under the condition of no support in thick coal seams, analyzes the movement law of the overlying rock layer during mining, and can effectively control the surface subsidence while dealing with coal mine solid waste, and the main findings are as follows.
(1)
Through rock mechanics experiments, it was determined that the average compressive strength of sandstone in the study area is about 77.45 MPa and the tensile strength is about 4.52 MPa. In addition, the compressive strength of mudstone is about 19.86 MPa, and the tensile strength is about 1.56 MPa. The reasonable mining width of the mining area should be between 4 and 7 m through theoretical analysis.
(2)
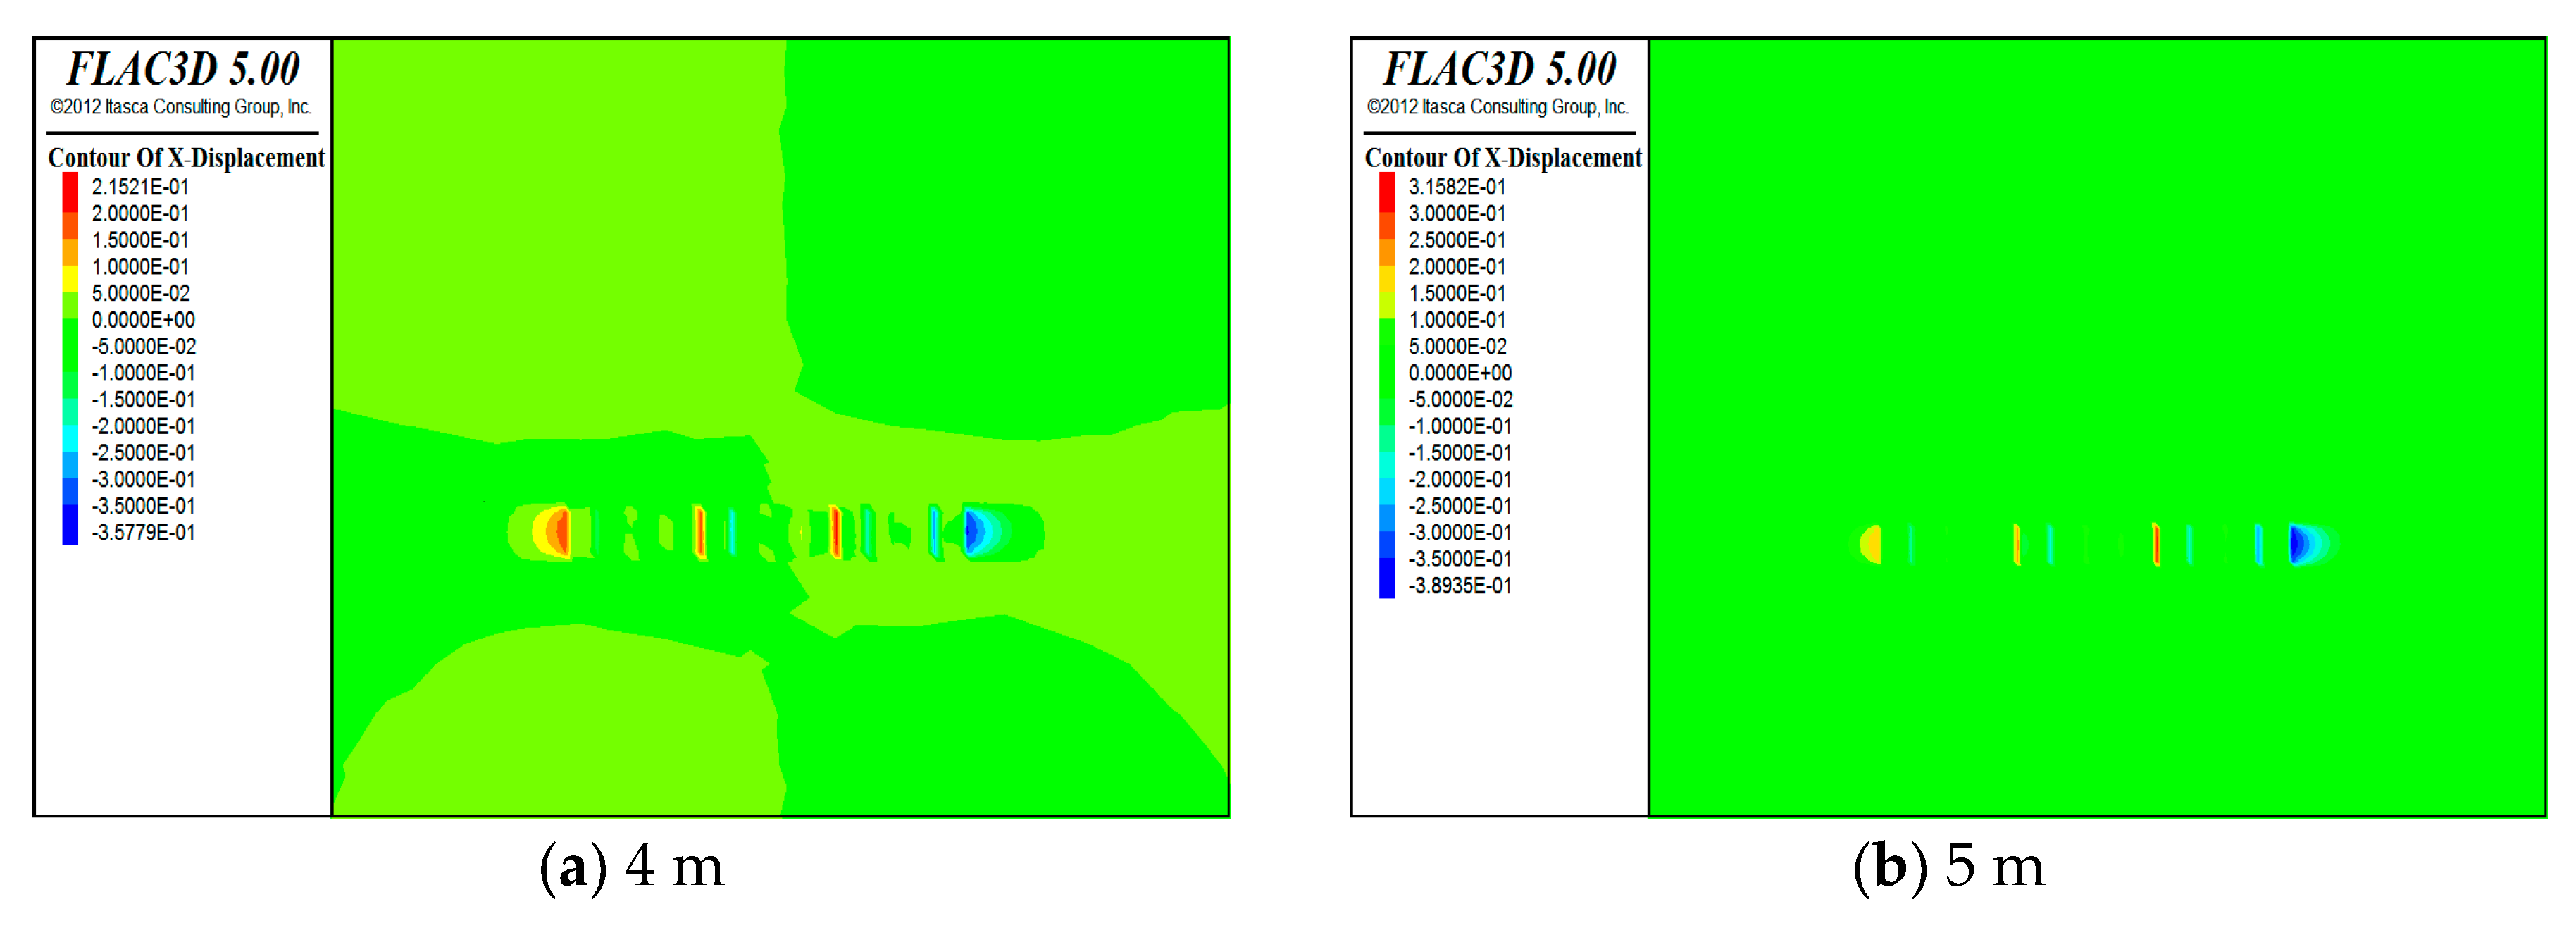
The numerical simulation results show that, considering the control of surrounding rock deformation angle and surrounding rock stress distribution, the skip mining sequence with large intervals in option II in this paper can fully solidify the filling material and is more conducive to controlling roof and surface settlement.
(3)
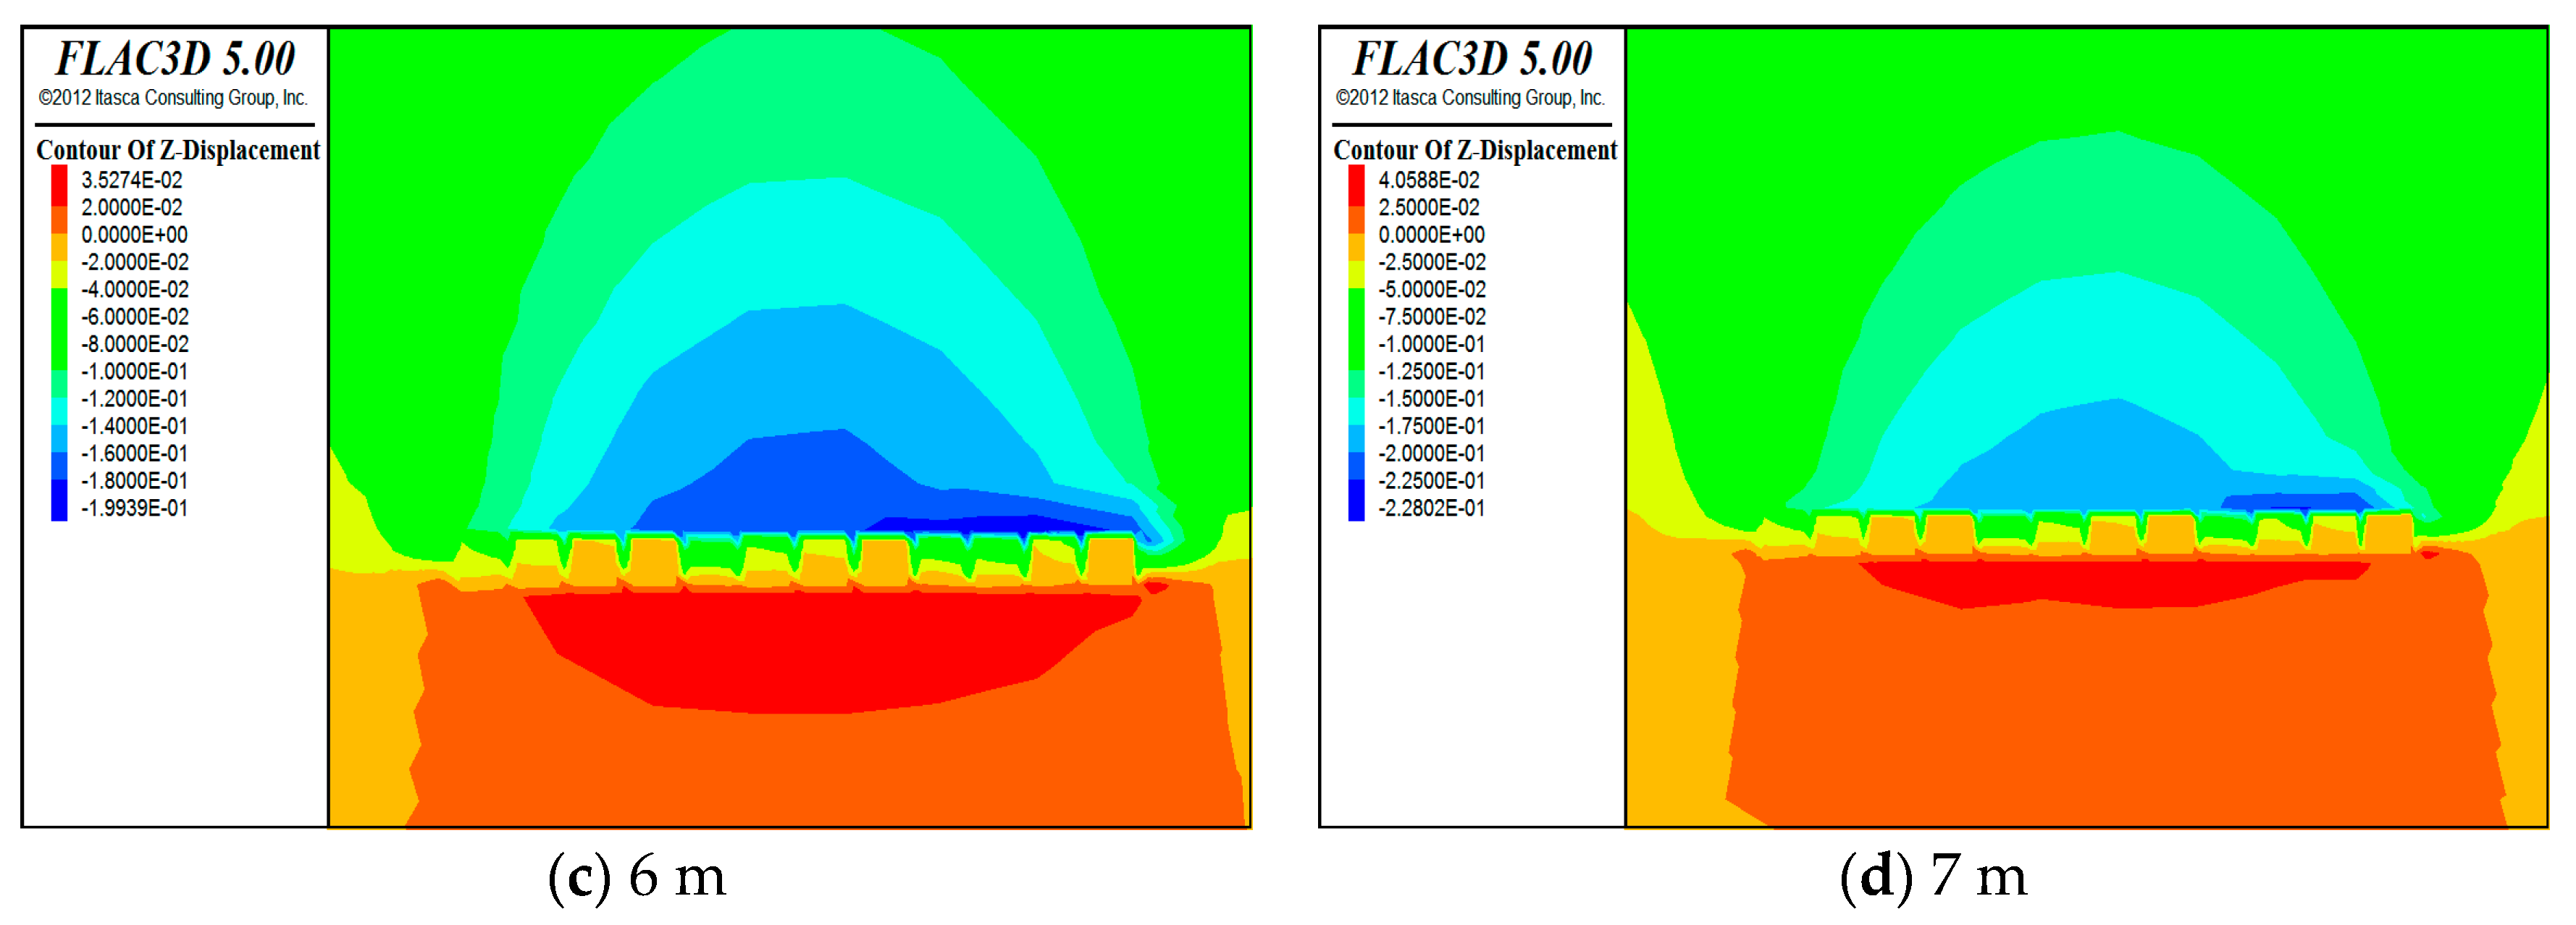
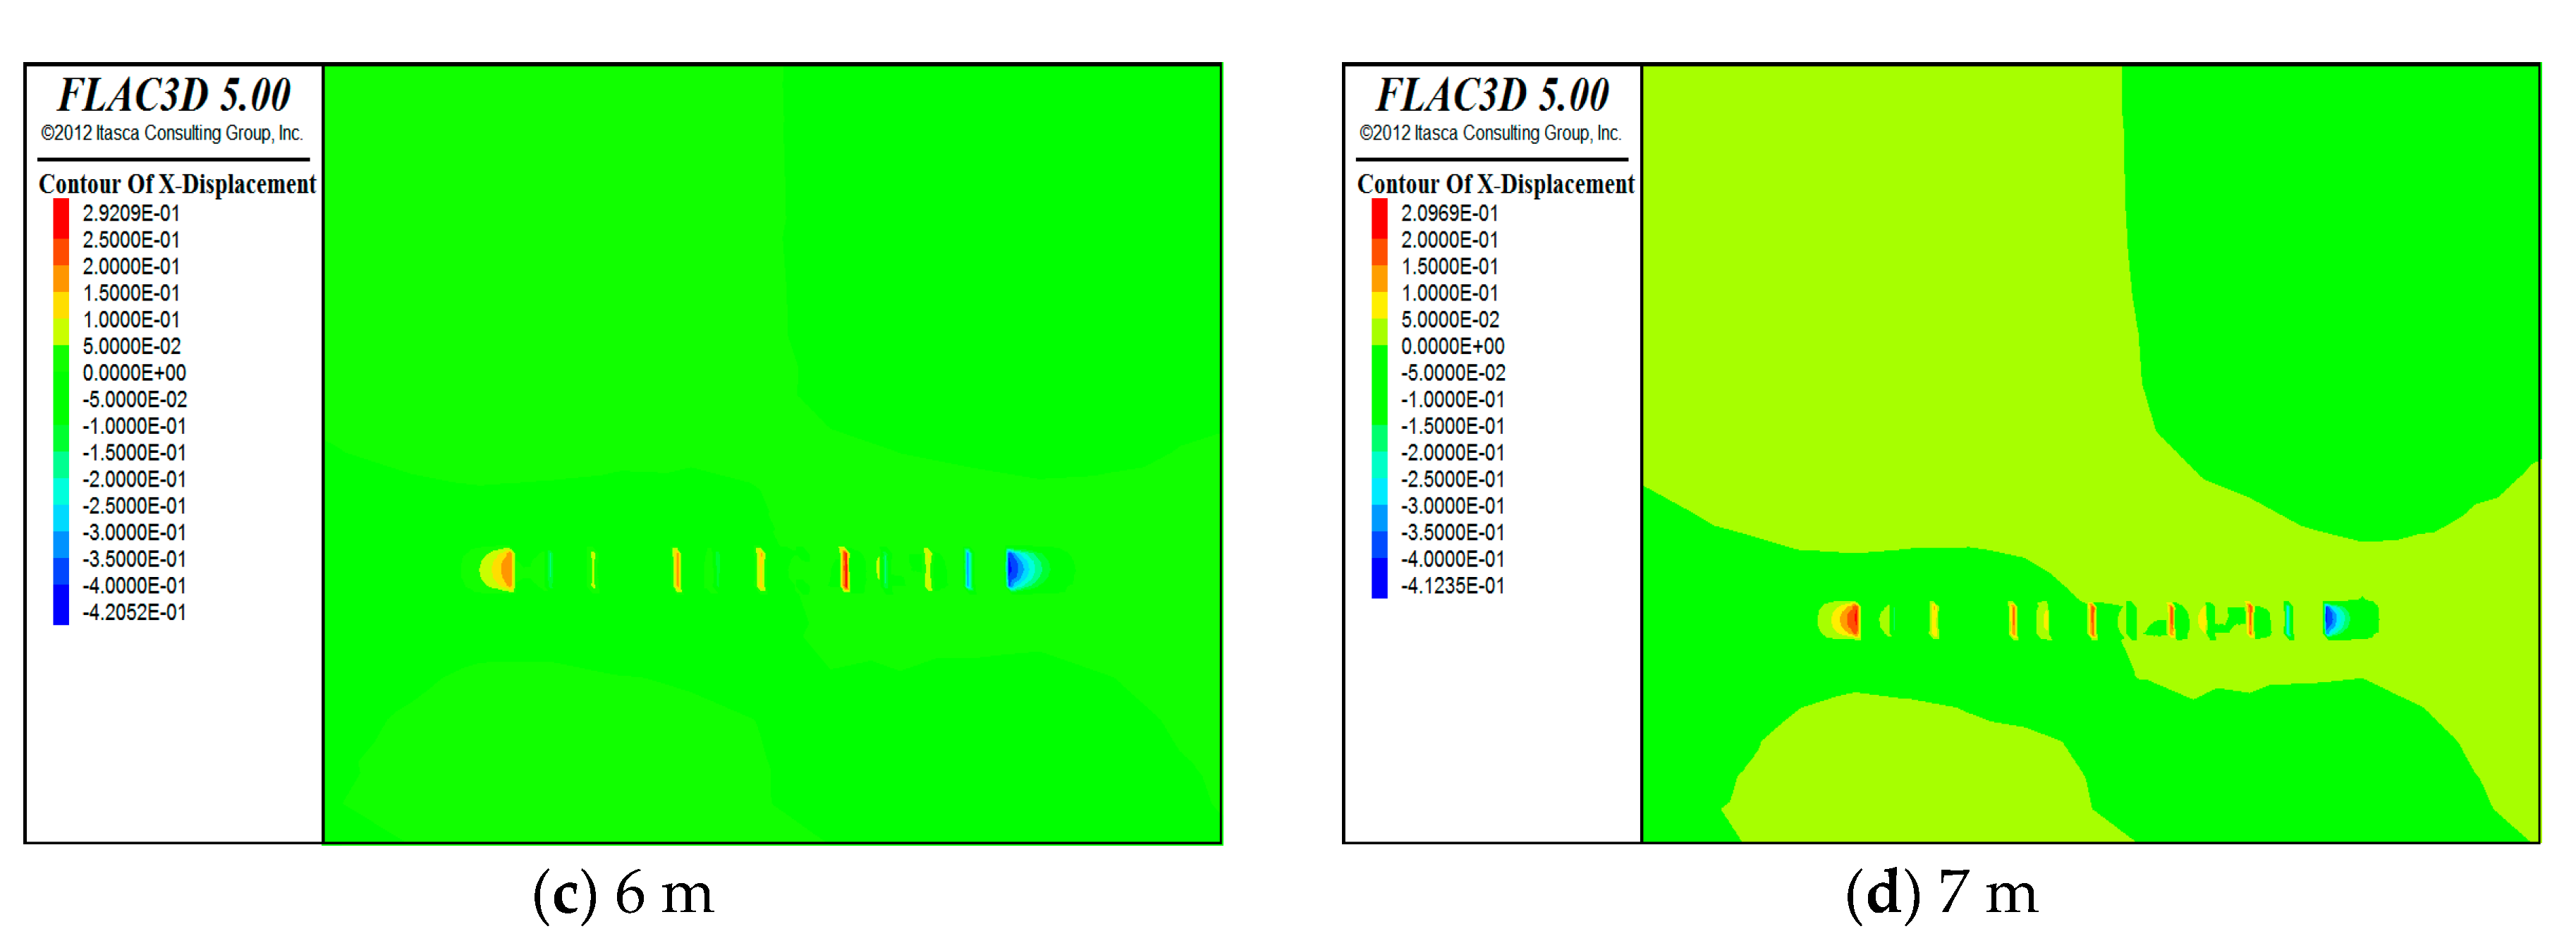
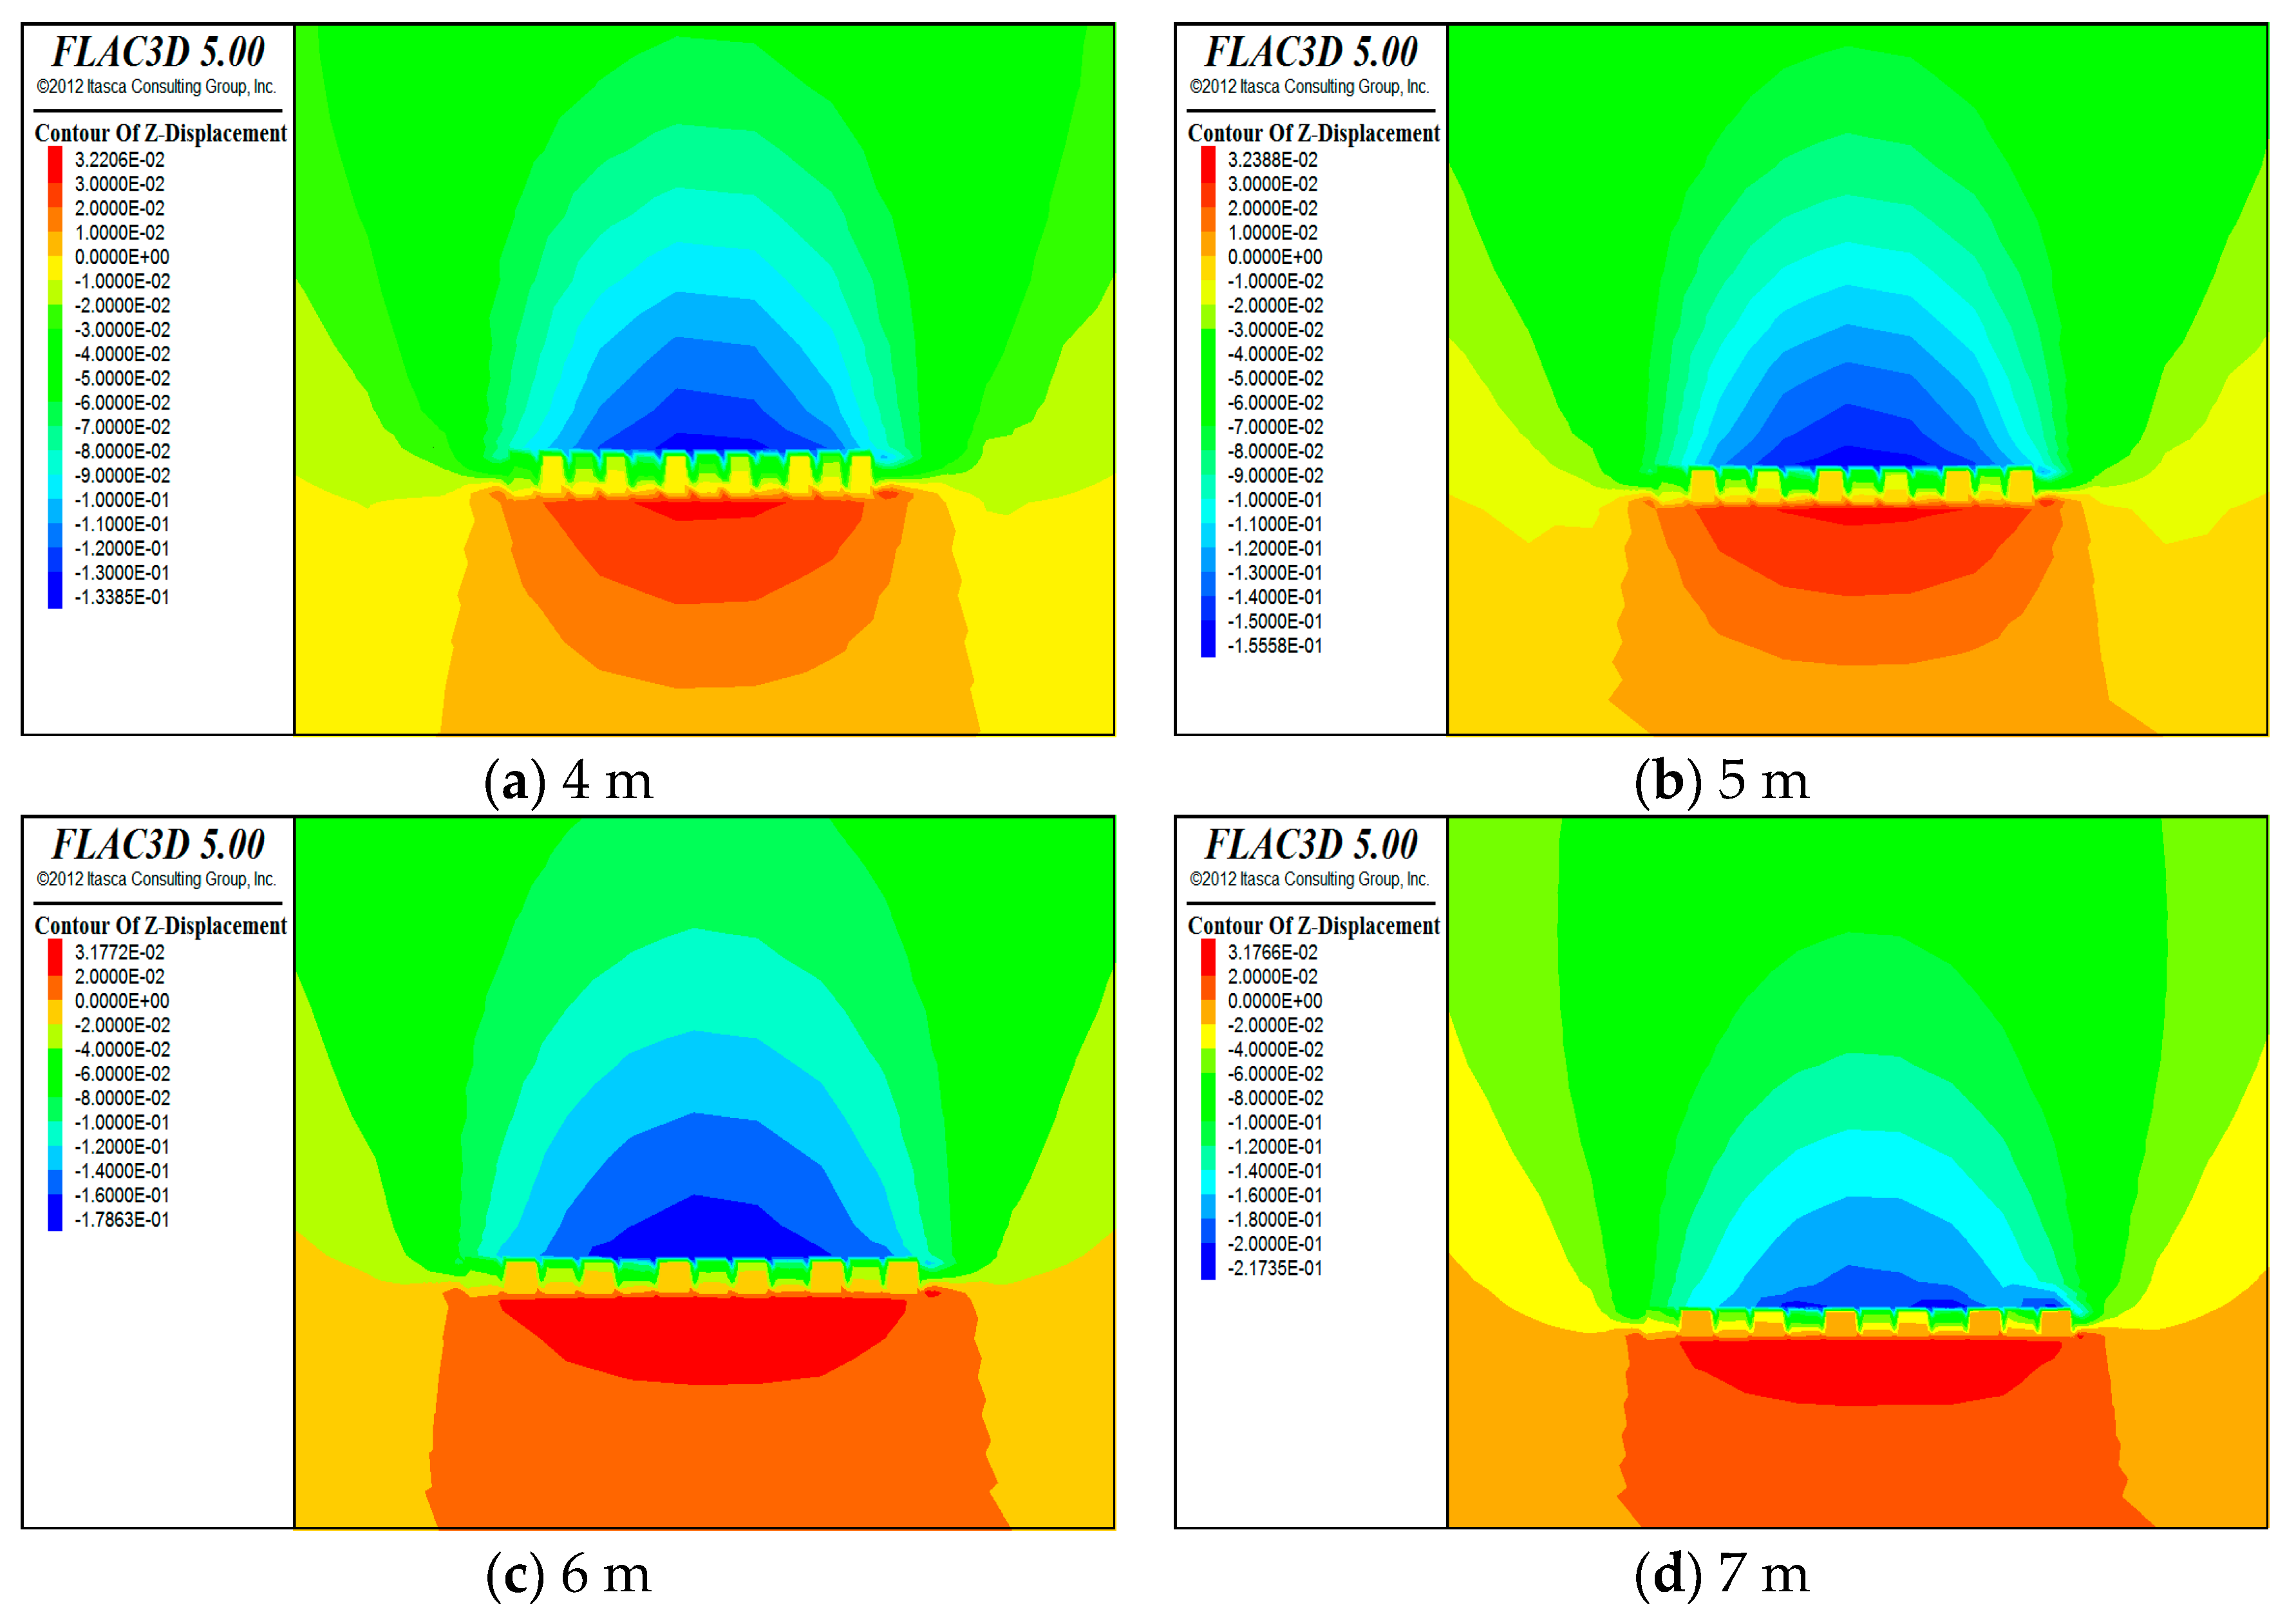
With the increase of the number of working faces, the increase of mining width will lead to the increase of overburden and surface deformation. When the mining width reaches 7 m, the amount of overburden sinking and sinking speed will increase significantly. The smaller the mining width, the smaller the stress increase caused by digging and filling, and the more conducive it is to the support of the working face and the stability of the coal column and filling body. However, if the mining width is too small, it will significantly increase the number of working faces, and the support cost will increase greatly.
(4)
The results of similar simulation tests show that the overburden deformation pattern is more or less the same when the mining width is 5 m and 6 m. After the working face is mined and filled, the roof is better controlled under the support of the filling body, and there is a key layer to control the deformation of the overburden and surface at 80 m above the coal seam.

Author Contributions

Conceptualization, W.G.; methodology, W.G.; software, L.C.; validation, L.C. and D.X.; formal analysis, D.X.; investigation, D.X.; resources, W.G.; data curation, L.C.; writing—original draft preparation, L.C.; writing—review and editing, W.G.; visualization, D.X.; supervision, W.G.; project administration, W.G.; funding acquisition, W.G. All authors have read and agreed to the published version of the manuscript.

Funding

This research was funded by the National Natural Science Foundation of China, grant number 52274103.

Data Availability Statement

Not applicable.

Conflicts of Interest

The authors declare no conflict of interest.

References

  1. Kim, K.-D.; Lee, S.; Oh, H.-J.; Choi, J.-K.; Won, J.-S. Assessment of ground subsidence hazard near an abandoned underground coal mine using GIS. Environ. Earth Sci. 2006, 50, 1183–1191. [Google Scholar] [CrossRef]
  2. Bell, F.G.; Stacey, T.R.; Genske, D.D. Mining subsidence and its effect on the environment: Some differing examples. Environ. Geol. 2000, 40, 135–152. [Google Scholar] [CrossRef]
  3. Cui, X.; Gao, Y.; Yuan, D. Erratum to: Sudden surface collapse disasters caused by shallow partial mining in Datong coalfield, China. Nat. Hazards 2015, 75, 1005. [Google Scholar] [CrossRef] [Green Version]
  4. Ke, Y.; Xinyuan, Z.; Zhen, W.; Jiqiang, Z. Development overview of paste backfill technology in China’s coal mines: A review. Environ. Sci. Pollut. Res. Int. 2021, 28, 67957–67969. [Google Scholar]
  5. Liu, Z.; Zhou, N.; Zhang, J. Random gravel model and particle flow based numerical biaxial test of solid backfill materials. Int. J. Min. Sci. Technol. 2013, 23, 463–467. [Google Scholar] [CrossRef]
  6. Huang, Y.; Li, J.; Song, T.; Kong, G.; Li, M. Analysis on Filling Ratio and Shield Supporting Pressure for Overburden Movement Control in Coal Mining with Compacted Backfilling. Energies 2016, 10, 31. [Google Scholar] [CrossRef] [Green Version]
  7. Zhou, N.; Han, X.; Zhang, J.; Li, M. Compressive deformation and energy dissipation of crushed coal gangue. Powder Technol. Int. J. Sci. Technol. Wet Dry Part. Syst. 2016, 297, 220–228. [Google Scholar] [CrossRef]
  8. Qi, W.; Zhang, Q.; Zhang, J.; Zhang, J.; Zhu, C. Design of coal pillars of gob-side entry between mining faces with large differences in mining height in deep mine. Energy Sources Part A Recovery Util. Environ. Eff. 2020, 42, 2648–2663. [Google Scholar] [CrossRef]
  9. Emad, M.Z. Numerical modelling approach for mine backfill. Sādhanā 2017, 42, 1595–1604. [Google Scholar] [CrossRef] [Green Version]
  10. Adach-Pawelus, K.; Butra, J.; Pawelus, D. The issue of determining the size of main excavations protective pillars in deep underground copper mines. Arch. Min. Sci. 2018, 63, 935–946. [Google Scholar] [CrossRef]
  11. Chen, S.-H.; Zhang, Z.-H. Determination of Coal Pillar Width and Support Parameters in Deep Coal Mines—A Case Study. J. Test. Eval. 2019, 47, 3160–3173. [Google Scholar] [CrossRef]
  12. Guo, Y.H.; Hou, K.P. Study on Surface Subsidence Law Induced by Deep Mining of Large Steep Metal Deposit. Appl. Mech. Mater. 2013, 295–298, 2902–2905. [Google Scholar] [CrossRef]
  13. Li, B.; Zhou, N.; Qi, W.; Li, A.; Cui, Z. Surface Subsidence Control during Deep Backfill Coal Mining: A Case Study. Adv. Civ. Eng. 2020, 2020, 6876453. [Google Scholar] [CrossRef]
  14. Sun, W.; Zhang, Q.; Luan, Y.; Zhang, X.-P. A study of surface subsidence and coal pillar safety for strip mining in a deep mine. Environ. Earth Sci. 2018, 77, 627. [Google Scholar] [CrossRef]
  15. Li, M.; Zhang, J.X.; Peng, H.; Rui, G. Mass ratio design based on compaction properties of backfill materials. J. Cent. South Univ. 2016, 23, 2669–2675. [Google Scholar] [CrossRef]
  16. Zhao, G.Y.; Zhou, L.; Ju, M.A.; Yang, Q. Study on Strength Properties of Cemented Tailings Backfill under Low Temperature Condition. Min. Metall. Eng. 2013, 33, 24–26. [Google Scholar]
  17. Lu, R.; Ma, F.; Zhao, J.; Wang, J.; Li, G.; Dai, B. Monitoring and Analysis of Stress and Deformation Features of Boundary Part of Backfill in Metal Mine. Sustainability 2020, 12, 733. [Google Scholar] [CrossRef] [Green Version]
  18. Li, M.; Zhang, J.; Wu, Z.; Sun, K. Calculation and monitoring analysis of stress distribution in a coal mine gob filled with waste rock backfill materials. Arab. J. Geosci. 2019, 12, 418. [Google Scholar] [CrossRef]
  19. Hao, J.; Shi, Y.; Lin, J.; Wang, X.; Xia, H. The Effects of Backfill Mining on Strata Movement Rule and Water Inrush: A Case Study. Processes 2019, 7, 66. [Google Scholar] [CrossRef] [Green Version]
  20. Machowski, R. Changes in the Landform and Water Conditions of the Industri-Alized Urban Area as a Result of Mining Activities. Land 2022, 11, 1710. [Google Scholar] [CrossRef]
  21. Marschalko, M.; Yilmaz, I.; Lamich, D.; Drusa, M.; Kubečková, D.; Peňaz, T.; Burkotová, T.; Slivka, V.; Bednárik, M.; Krčmář, D.; et al. Unique documentation, analysis of origin and development of an undrained depression in a subsidence basin caused by underground coal mining (Kozinec, Czech Republic). Environ. Earth Sci. 2014, 72, 11–20. [Google Scholar] [CrossRef]
  22. Solarski, M.; Machowski, R.; Rzetala, M.; Rzetala, M.A. Hypsometric changes in urban areas resulting from multiple years of mining activity. Sci. Rep. 2022, 12, 2982. [Google Scholar] [CrossRef] [PubMed]
  23. Solarski, M. Anthropogenic transformations of the Bytom area relief in the period of 1883-1994. Environ. Socio Econ. Stud. 2015, 1, 1–8. [Google Scholar] [CrossRef]
  24. Harnischmacher, S.; Zepp, H. Mining and its impact on the earth surface in the Ruhr District (Germany). Z. Für Geomorphol. 2014, 58, 3–22. [Google Scholar] [CrossRef]
  25. Nádudvari, Á. Using radar interferometry and SBAS technique to detect surface subsidence relating to coal mining in Upper Silesia from 1993-2000 and 2003-2010. Environ. Socio Econ. Stud. 2016, 4, 24–34. [Google Scholar] [CrossRef] [Green Version]
  26. Xu, D.; Shi, L.; Qu, X.; Tian, J.; Wang, K.; Liu, J. Leaching Behavior of Heavy Metals from the Coal Gangue under the Impact of Site Ordovician Limestone Karst Water from Closed Shandong Coal Mines, North China. Energy Fuels 2019, 33, 10016–10028. [Google Scholar] [CrossRef]
  27. Zhu, X.; Guo, G.; Zha, J.; Chen, T.; Fang, Q.; Yang, X. Surface dynamic subsidence prediction model of solid backfill mining. Environ. Earth Sci. 2016, 75, 1007. [Google Scholar] [CrossRef]
  28. Zhang, J.X.; Huang, Y.L.; Li, M.; Zhang, Q.; Liu, Z. Test on mechanical properties of solid backfill materials. Mater. Res. Innov. 2014, 18, S2-960–S2-965. [Google Scholar] [CrossRef]
  29. Zhang, J.X.; Deng, X.J.; Zhao, X.; Ju, F.; Li, B.Y. Effective control and performance measurement of solid waste backfill in coal mining. Int. J. Mining, Reclam. Environ. 2016, 31, 91–104. [Google Scholar] [CrossRef]
  30. Zhang, P.; Zhang, Y.; Zhao, T.; Tan, Y.; Yu, F. Experimental Research on Deformation Characteristics of Waste-Rock Material in Underground Backfill Mining. Minerals 2019, 9, 102. [Google Scholar] [CrossRef] [Green Version]
  31. Zhang, X.; Lin, J.; Liu, J.; Li, F.; Pang, Z. Investigation of Hydraulic-Mechanical Properties of Paste Backfill Containing Coal Gangue-Fly Ash and Its Application in an Underground Coal Mine. Energies 2017, 10, 1309. [Google Scholar] [CrossRef] [Green Version]
  32. Sun, Q.; Meng, G.; Sun, K.; Zhang, J. Physical simulation experiment on prevention and control of water inrush disaster by backfilling mining under aquifer. Environ. Earth Sci. 2020, 79, 429. [Google Scholar] [CrossRef]
  33. Chen, S.; Wang, H.; Zhang, J.; Xing, H.; Wang, H. Experimental Study on Low-Strength Similar-Material Proportioning and Properties for Coal Mining. Adv. Mater. Sci. Eng. 2015, 2015, 696501. [Google Scholar] [CrossRef]
  34. Zhu, X.J.; Guo, G.L.; Qian, Z. Simulation analysis of strata movement characteristics of backfill-strip mining. J. Mines Met. Fuels 2015, 63, 411–418. [Google Scholar]
Figure 1. Schematic diagram of the location of the mining area.
Minerals 13 00053 g001
Figure 2. Example of sample in the experimental part.
Minerals 13 00053 g002
Figure 3. Mudstone sample on the floor of hole No. 3 in the experiment.
Minerals 13 00053 g003
Figure 4. Sandstone sample from the floor of hole No. 3 in the experiment.
Minerals 13 00053 g004
Figure 5. Roof mudstone sample from hole No. 3.
Minerals 13 00053 g005
Figure 6. Thick coal seam gangue-filling mining model.
Minerals 13 00053 g006
Figure 7. Simulation test plan.
Minerals 13 00053 g007
Figure 8. Horizontal displacement cloud for (a) 4 m, (b) 5 m, (c) 6 m, and (d) 7 m.
Minerals 13 00053 g008
Figure 9. Vertical displacement cloud for (a) 4 m, (b) 5 m, (c) 6 m, and (d) 7 m.
Minerals 13 00053 g009aMinerals 13 00053 g009b
Figure 10. Overburden vertical deformation curve for (a) 4 m, (b) 5 m, (c) 6 m, and (d) 7 m.
Minerals 13 00053 g010aMinerals 13 00053 g010b
Figure 11. Horizontal displacement cloud for (a) 4 m, (b) 5 m, (c) 6 m, and (d) 7 m.
Minerals 13 00053 g011aMinerals 13 00053 g011b
Figure 12. Vertical displacement cloud for (a) 4 m, (b) 5 m, (c) 6 m, and (d) 7 m.
Minerals 13 00053 g012
Figure 13. Vertical displacement cloud map of (a) 4 m, (b) 5 m, (c) 6 m, and (d) 7 m.
Minerals 13 00053 g013
Figure 14. Horizontal stress distribution cloud for (a) 4 m, (b) 5 m, (c) 6 m, and (d) 7 m.
Minerals 13 00053 g014
Figure 15. Cloud of vertical stress distribution for (a) 4 m, (b) 5 m, (c) 6 m, and (d) 7 m.
Minerals 13 00053 g015
Figure 16. Horizontal stress distribution cloud for (a) 4 m, (b) 5 m, (c) 6 m, and (d) 7 m.
Minerals 13 00053 g016aMinerals 13 00053 g016b
Figure 17. Cloud of vertical stress distribution for (a) 4 m, (b) 5 m, (c) 6 m, and (d) 7 m.
Minerals 13 00053 g017
Figure 18. Surface subsidence curve.
Minerals 13 00053 g018
Figure 19. Surface horizontal movement curve.
Minerals 13 00053 g019
Figure 20. Model measurement point layout.
Minerals 13 00053 g020
Figure 21. Sinking curve after completion of four rounds of excavation and filling.
Minerals 13 00053 g021
Table 1. Patch 12 borehole column.
Rock NameBreadthThicknessLithological Description
Fine-grained sandstone212.6118.3Off-white, thinly laminated, quartz-dominated.
Mudstone256.5543.95Grey-black, friable, with fossilized plants.
Fine-grained sandstone287.0530.5Off-white, quartz and feldspar in composition, with a small amount of mica.
Mudstone325.8038.75Grayish black, thinly laminated, with more fine sand at the base.
Coal332.156.35Gray-black-black with black stripes, predominantly lumpy, glassy luster, jagged fracture, semi-bright coal.
Fine-grained sandstone335.703.55Gray, laminar, semi-hard, mainly quartz and mica, with argillaceous structure at the top.
Mudstone345.159.45Grayish black, lumpy, with a flatter fracture.
Medium-grained sandstone345.750.60Grey, quartz-dominated, semi-hard.
Mudstone348.152.40Gray-black, lumpy, flat fracture.
Table 2. Summary of mechanical parameters of the Sima mine roof and floor samples.
TypeCompressive Strength/MPaTensile Strength/MPaModulus of Elasticity
/GPa
Poisson’s RatioCohesion
/MPa
Internal Friction Angle
/(°)
Average of old roof coarse grain sandstone76.533.5933.580.2179.5334.69
Average of immediate roof mudstone17.291.5722.140.2643.6325.33
Average of coal24.410.989.350.311.1336.52
Average of immediate bottom fine-grained sandstone78.385.4636.030.1999.7835.32
Average of old bottom mudstone22.421.5522.350.2653.5924.70
Table 3. Mechanical parameters of the rock mass.
RockinessDensity (kg/m3)Bulk Modulus (GPa)Shear Modulus (GPa)Cohesion (MPa)Tensile Strength (MPa)Angle of Internal Friction (°)
Topsoil14000.0170.10.40.0415
siltstone interbedded with fine sandstone25005.03.758.73.2132
Mudstone25004.4643.0743.71.4826
Mudstone-sandstone interlayer25004.5983.3063.92.4230
Mudstone25003.8192.883.71.4826
Mudstone-sandstone interlayer25004.5983.3063.92.4230
Fine-grained sandstone25005.03.759.53.5935
Mudstone25003.8192.883.51.5726
Coal15001.941.461.81.024
Mudstone-sandstone interlayer25004.6574.0953.82.3428
Filling body16800.210.121.40.24427
Table 4. Maximum overburden subsidence for different mining width conditions.
Rock LocationMaximum Overburden Subsidence/mm
4 m5 m6 m7 m
Direct top135156199228
11 m above the coal seam (old top)113135156177
78 m above the coal seam48637997
289 m above the coal seam (topsoil)27374759
The surface (of the earth)29394963
Table 5. Maximum overburden subsidence for different mining width conditions.
Rock LocationMaximum Overburden Subsidence/mm
4 m5 m6 m7 m
Direct top134156178217
11 m above the coal seam (old top)112135155173
78 m above the coal seam45617894
289 m above the coal seam (topsoil)24334455
The surface (of the earth)25354758
Table 6. Surface deformation under different mining width conditions.
Deformation IndicatorsOption IOption II
4 m5 m6 m7 m4 m5 m6 m7 m
Maximum sink/mm−141−139−143−145−145−134−157−154
Maximum horizontal movement/mm7473757576718280
Maximum inclination/mm/m−0.54−053−0.54−0.54−0.56−0.53−0.58−0.57
Maximum curvature /10-3 mm/m2−4.5−4.6−4.5−4.6−4.9−4.9−4.5−4.6
Maximum horizontal deformation/mm/m−0.56−0.56−0.56−0.56−0.59−0.57−0.58−0.58
Table 7. Distribution of similar material model rock formations.
NumberRockinessPrototype Thickness/mModel Thickness/mm
1Topsoil76.15190
2Siltstone interbedded with fine sandstone18.1545
3Mudstone118.3296
4Mudstone-sandstone interlayer43.95110
5Mudstone30.576
6Mudstone-sandstone interlayer38.7597
7Coal6.3516
8Mudstone-sandstone interlayer30.0575
Table 8. Table of model material ratios.
NumberRockinessProportion Sign
(Sand:Mica Powder:Cements)
Cement
(Gypsum:Calcium Carbonate)
Sand
/kg
Mica/kgGypsum/kgCalcium Carbonate/kgSawdust/kg
1Topsoil86:0:4 (sawdust 10)2:2131.31 3.053.0515.3
2Siltstone interbedded with fine sandstone80:17:37:328.936.150.760.32
3Mudstone73:23:43:7173.6454.712.856.66
4Mudstone-sandstone interlayer73:23:47:364.5320.332.471.06
5Mudstone73:23:43:744.5814.050.731.71
6Mudstone-sandstone interlayer80:17:37:362.3613.251.640.7
7Coal90:0:6 (sawdust 4)3:311.57 0.390.390.51
8Mudstone-sandstone interlayer80:18:27:348.2210.850.840.36
Table 9. Maximum overburden subsidence for different mining width conditions.
Rock LocationMaximum Overburden Subsidence/mm
5 m6 m
20 m above the coal seam139157
60 m above the coal seam6785
80 m above the coal seam4756
300 m above the coal seam (topsoil)3747
The surface (of the earth)3849
Disclaimer/Publisher’s Note: The statements, opinions and data contained in all publications are solely those of the individual author(s) and contributor(s) and not of MDPI and/or the editor(s). MDPI and/or the editor(s) disclaim responsibility for any injury to people or property resulting from any ideas, methods, instructions or products referred to in the content.

