
Effects of Clay Mineral Content and Types on Pore-Throat Structure and Interface Properties of the Conglomerate Reservoir: A Case Study of Baikouquan Formation in the Junggar Basin
 ,
,
Abstract
:1. Introduction
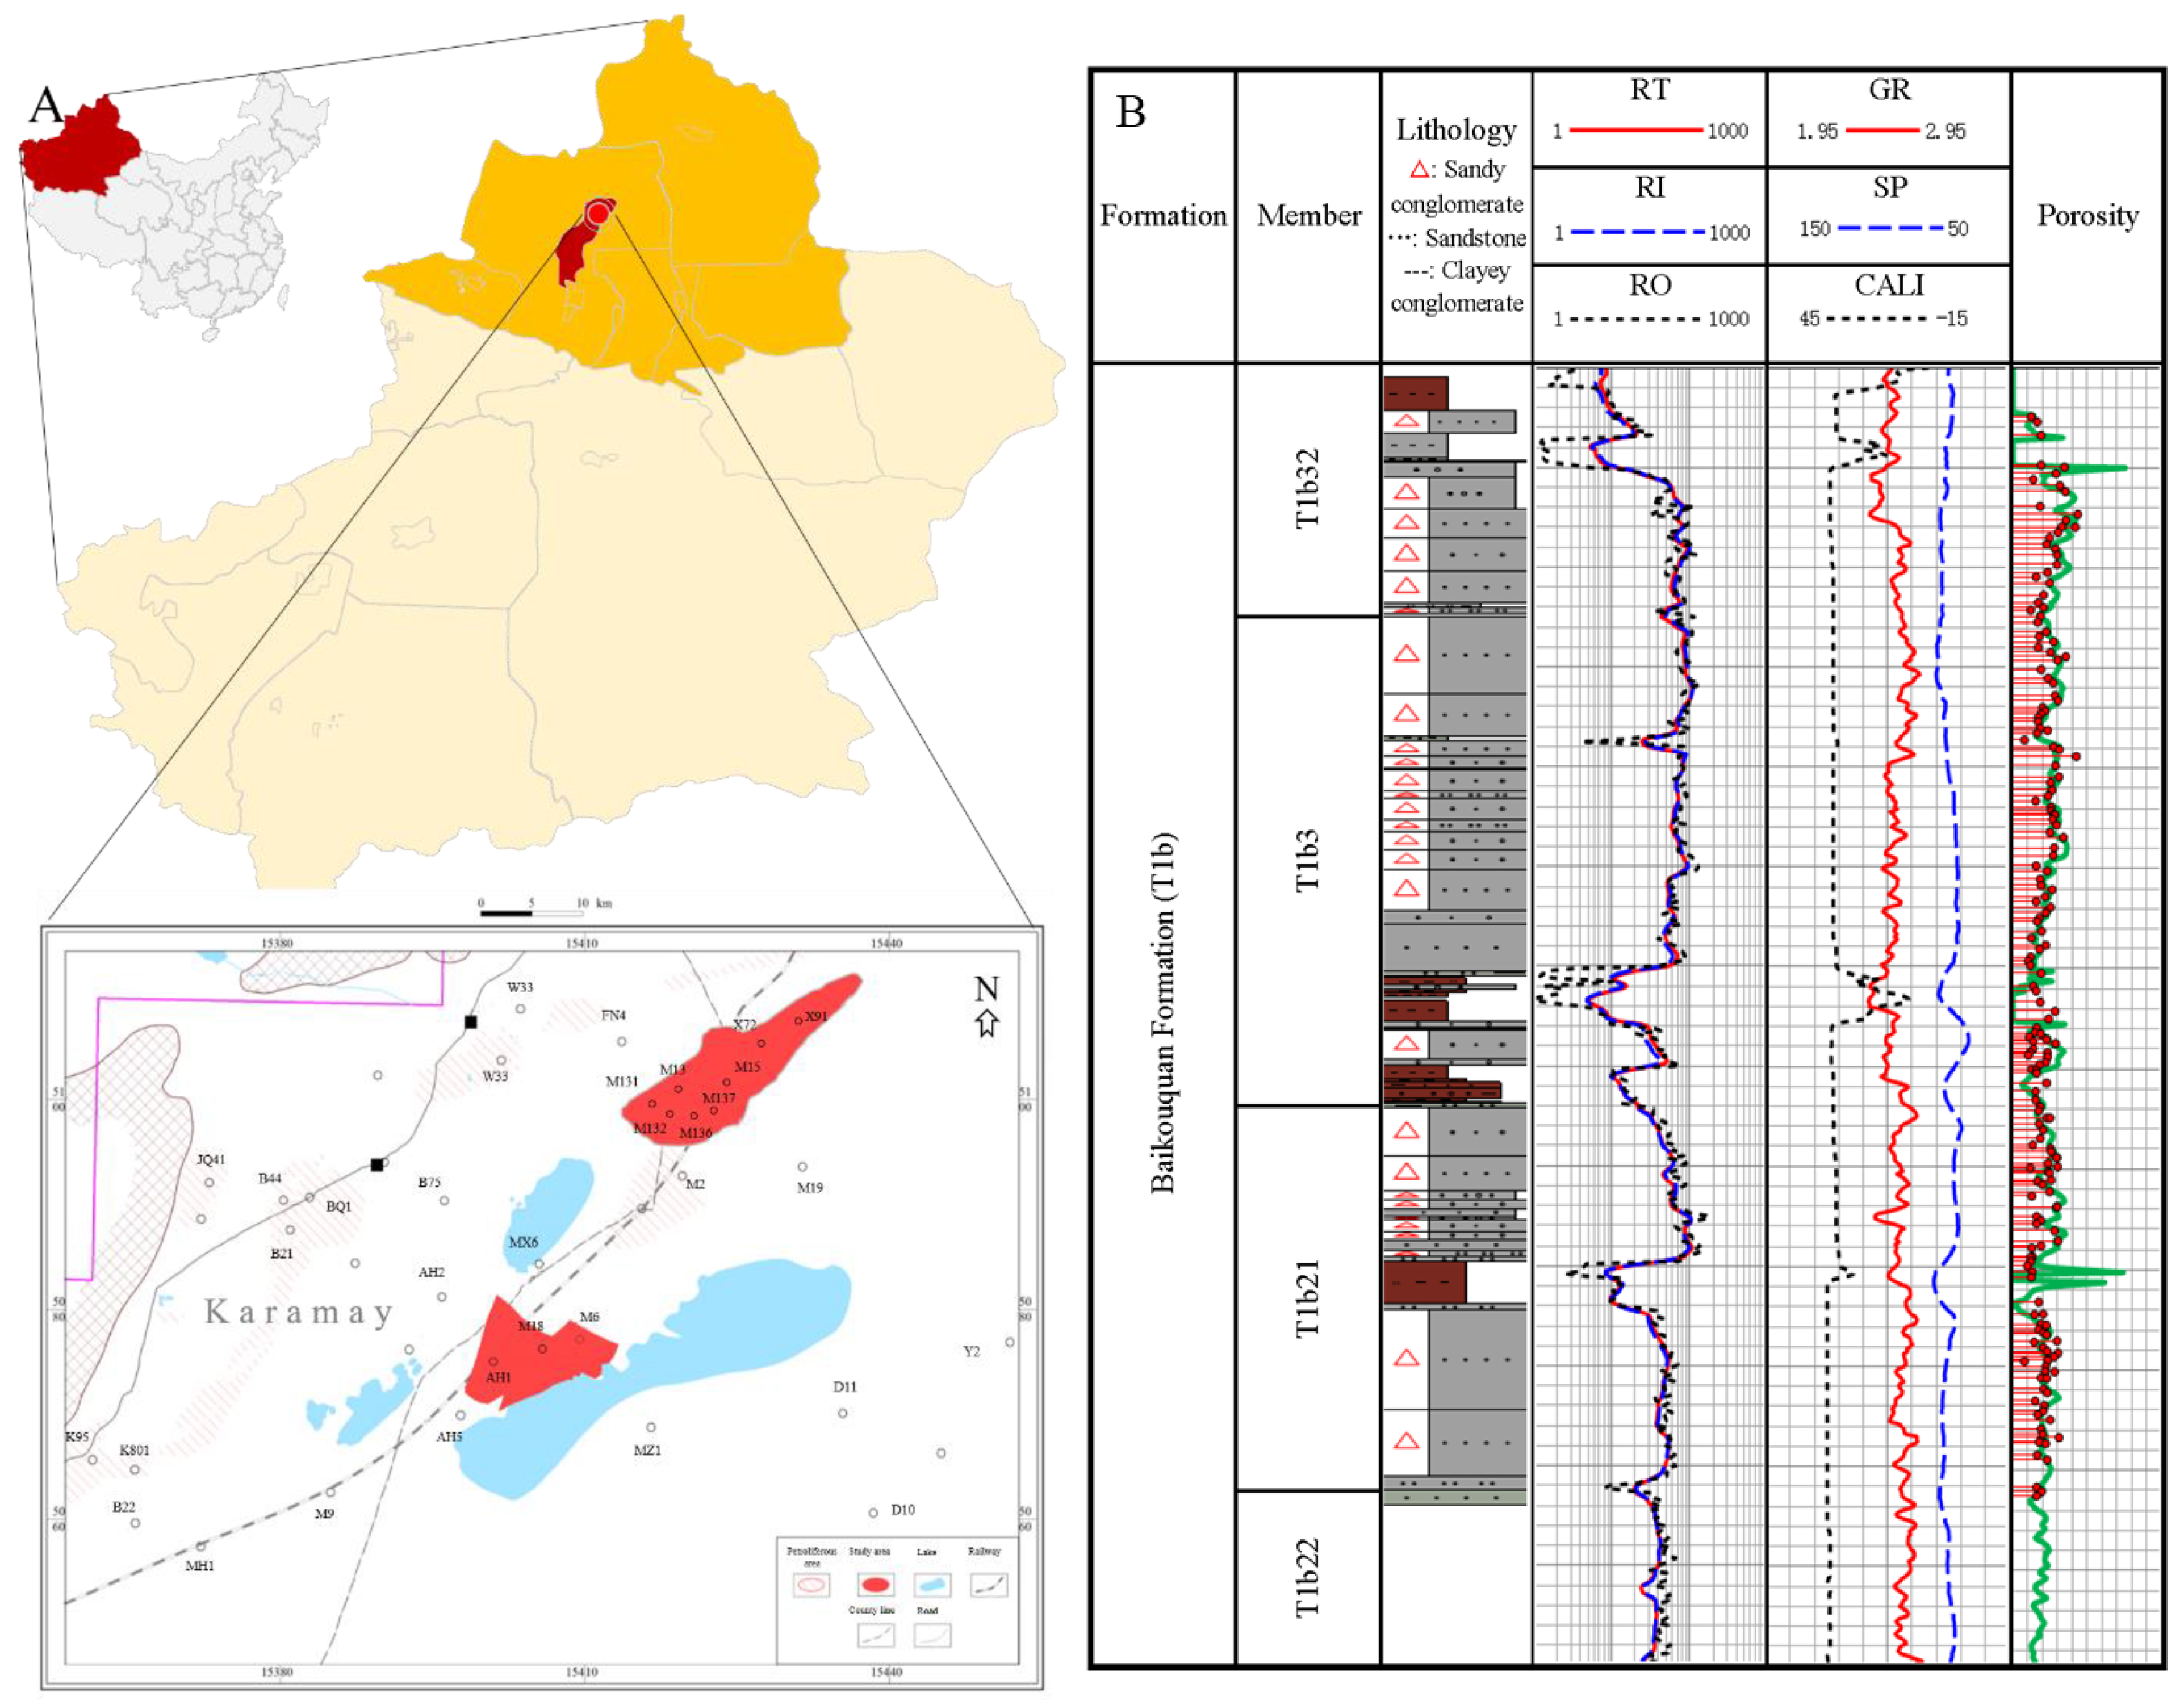
2. Geologic Setting
3. Data and Methods
4. Results
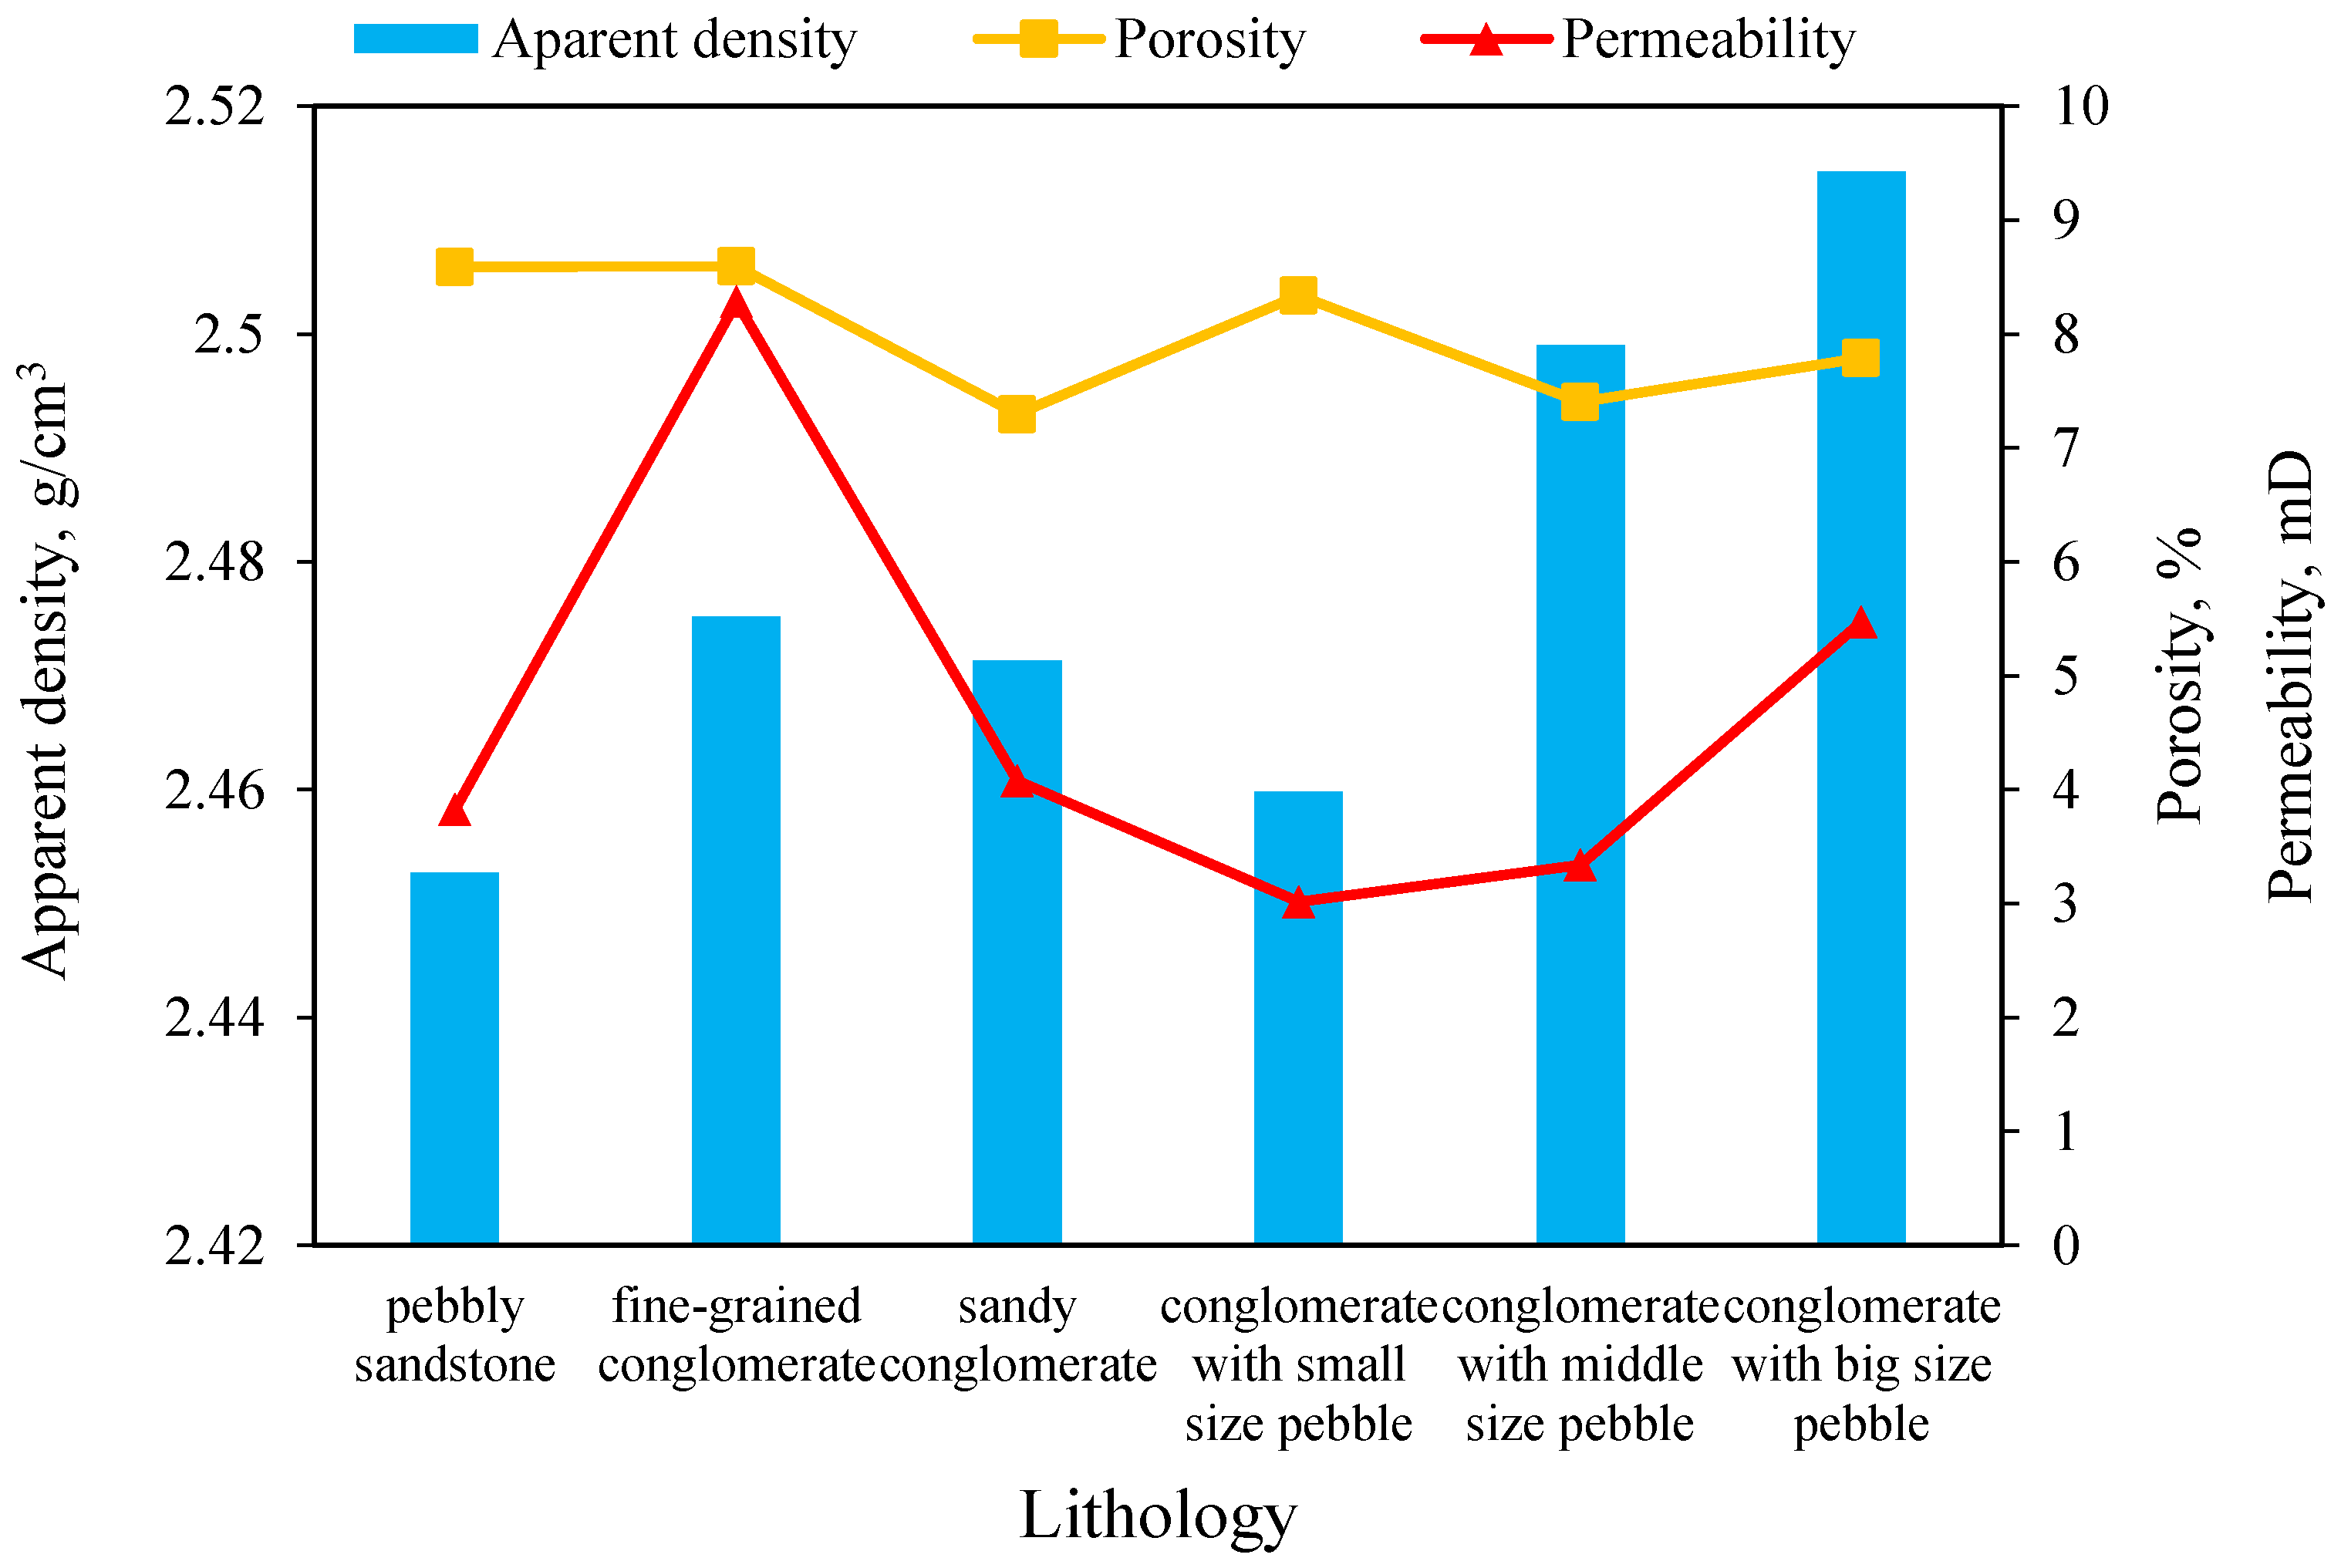
4.1. Porosity and Permeability
4.2. Mineral Compositions and Interfacial Properties
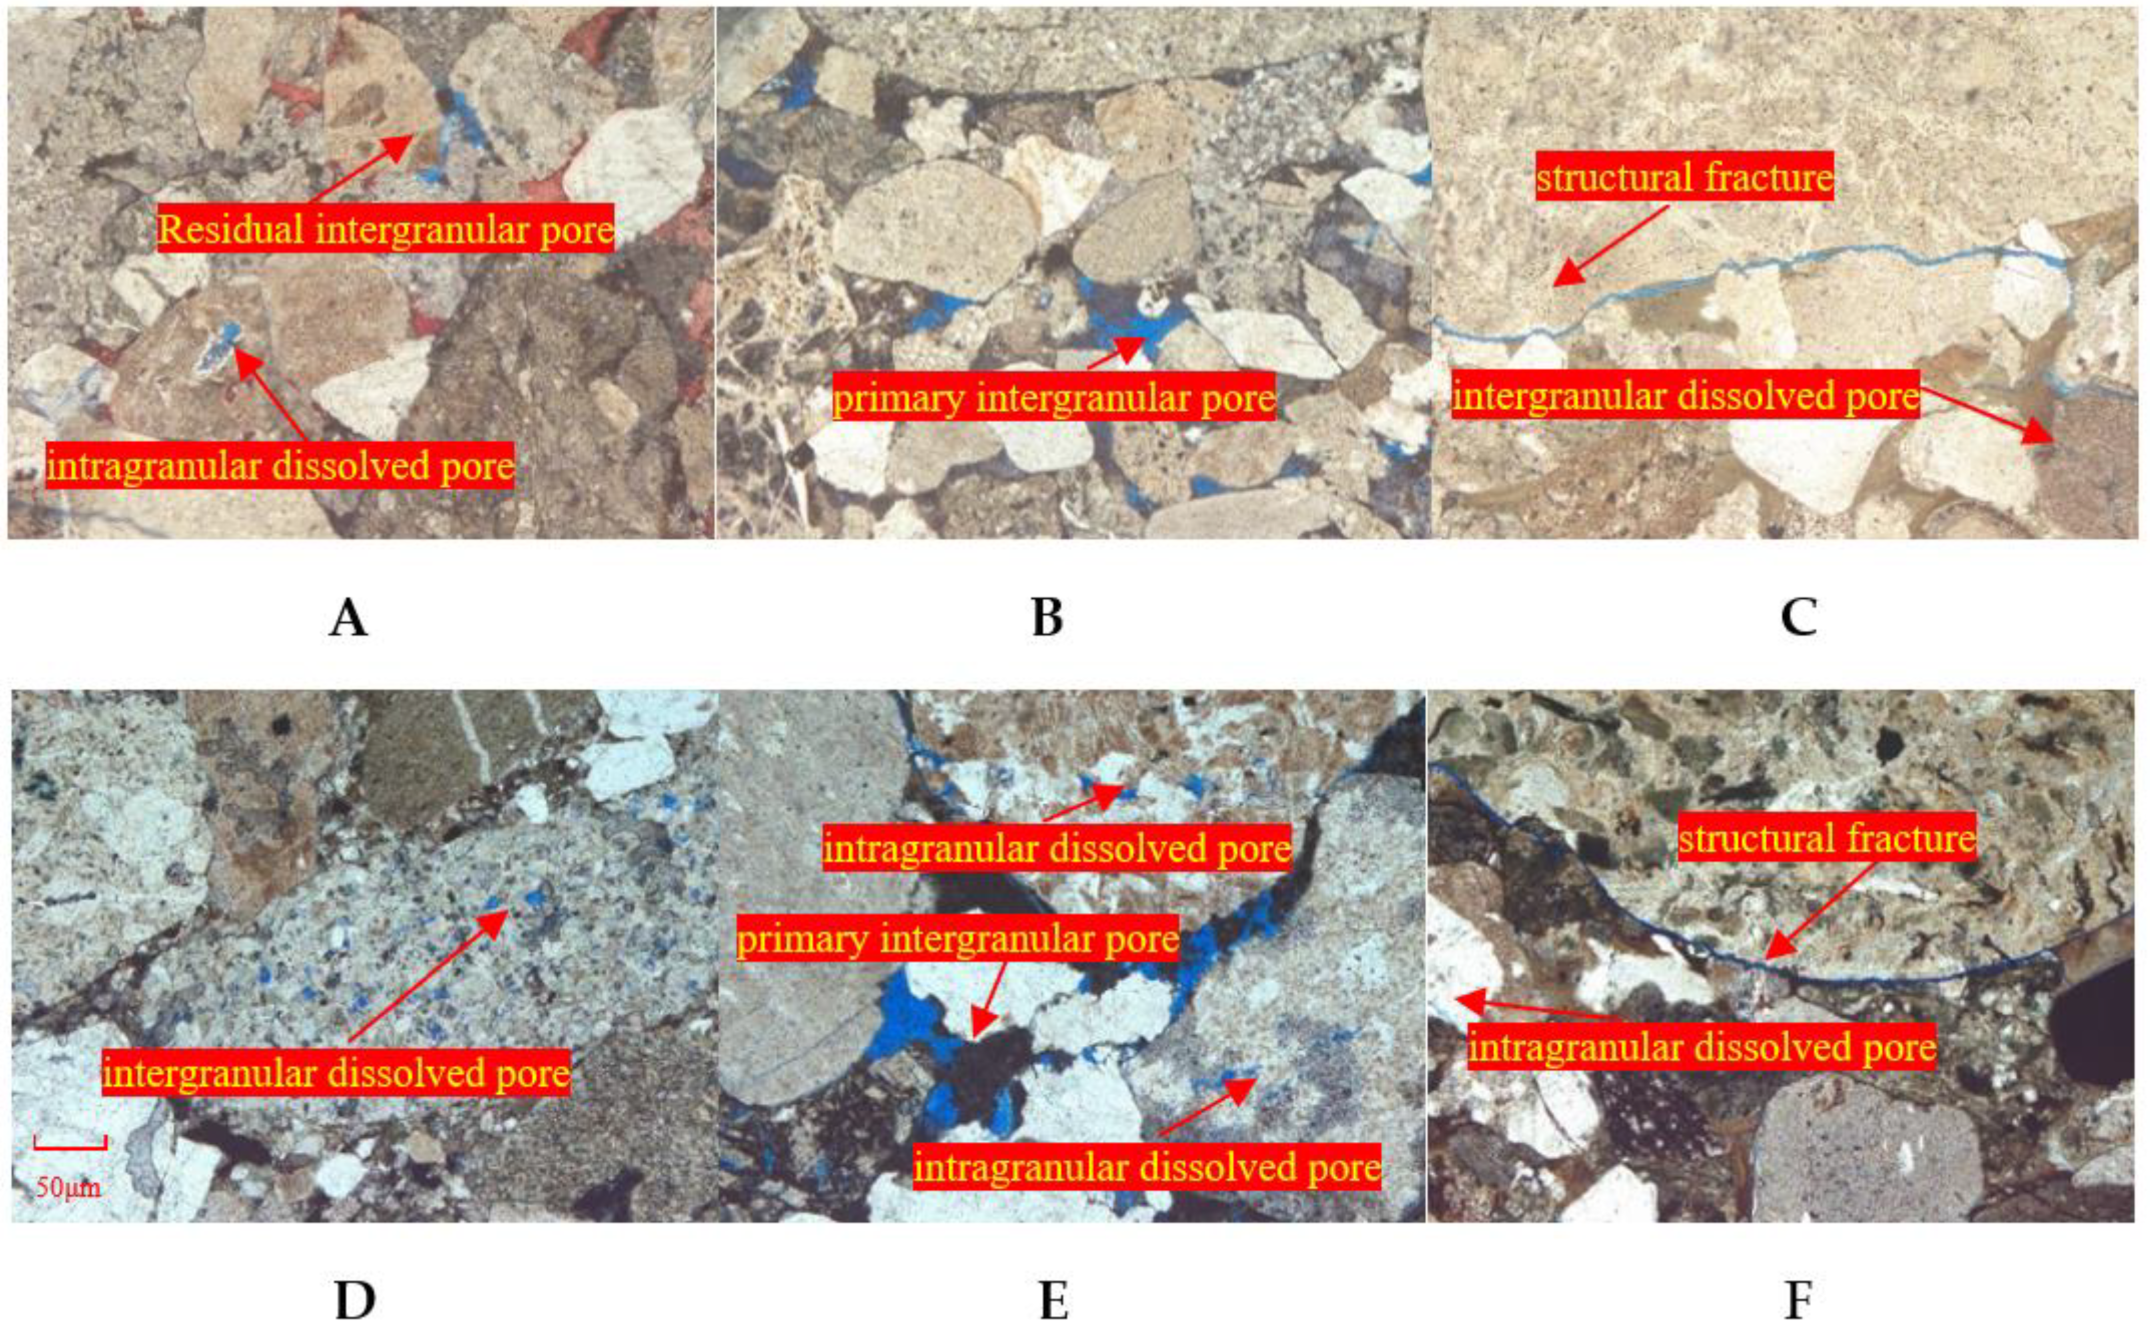
4.3. Morphology of Pore Throats and Clay Minerals
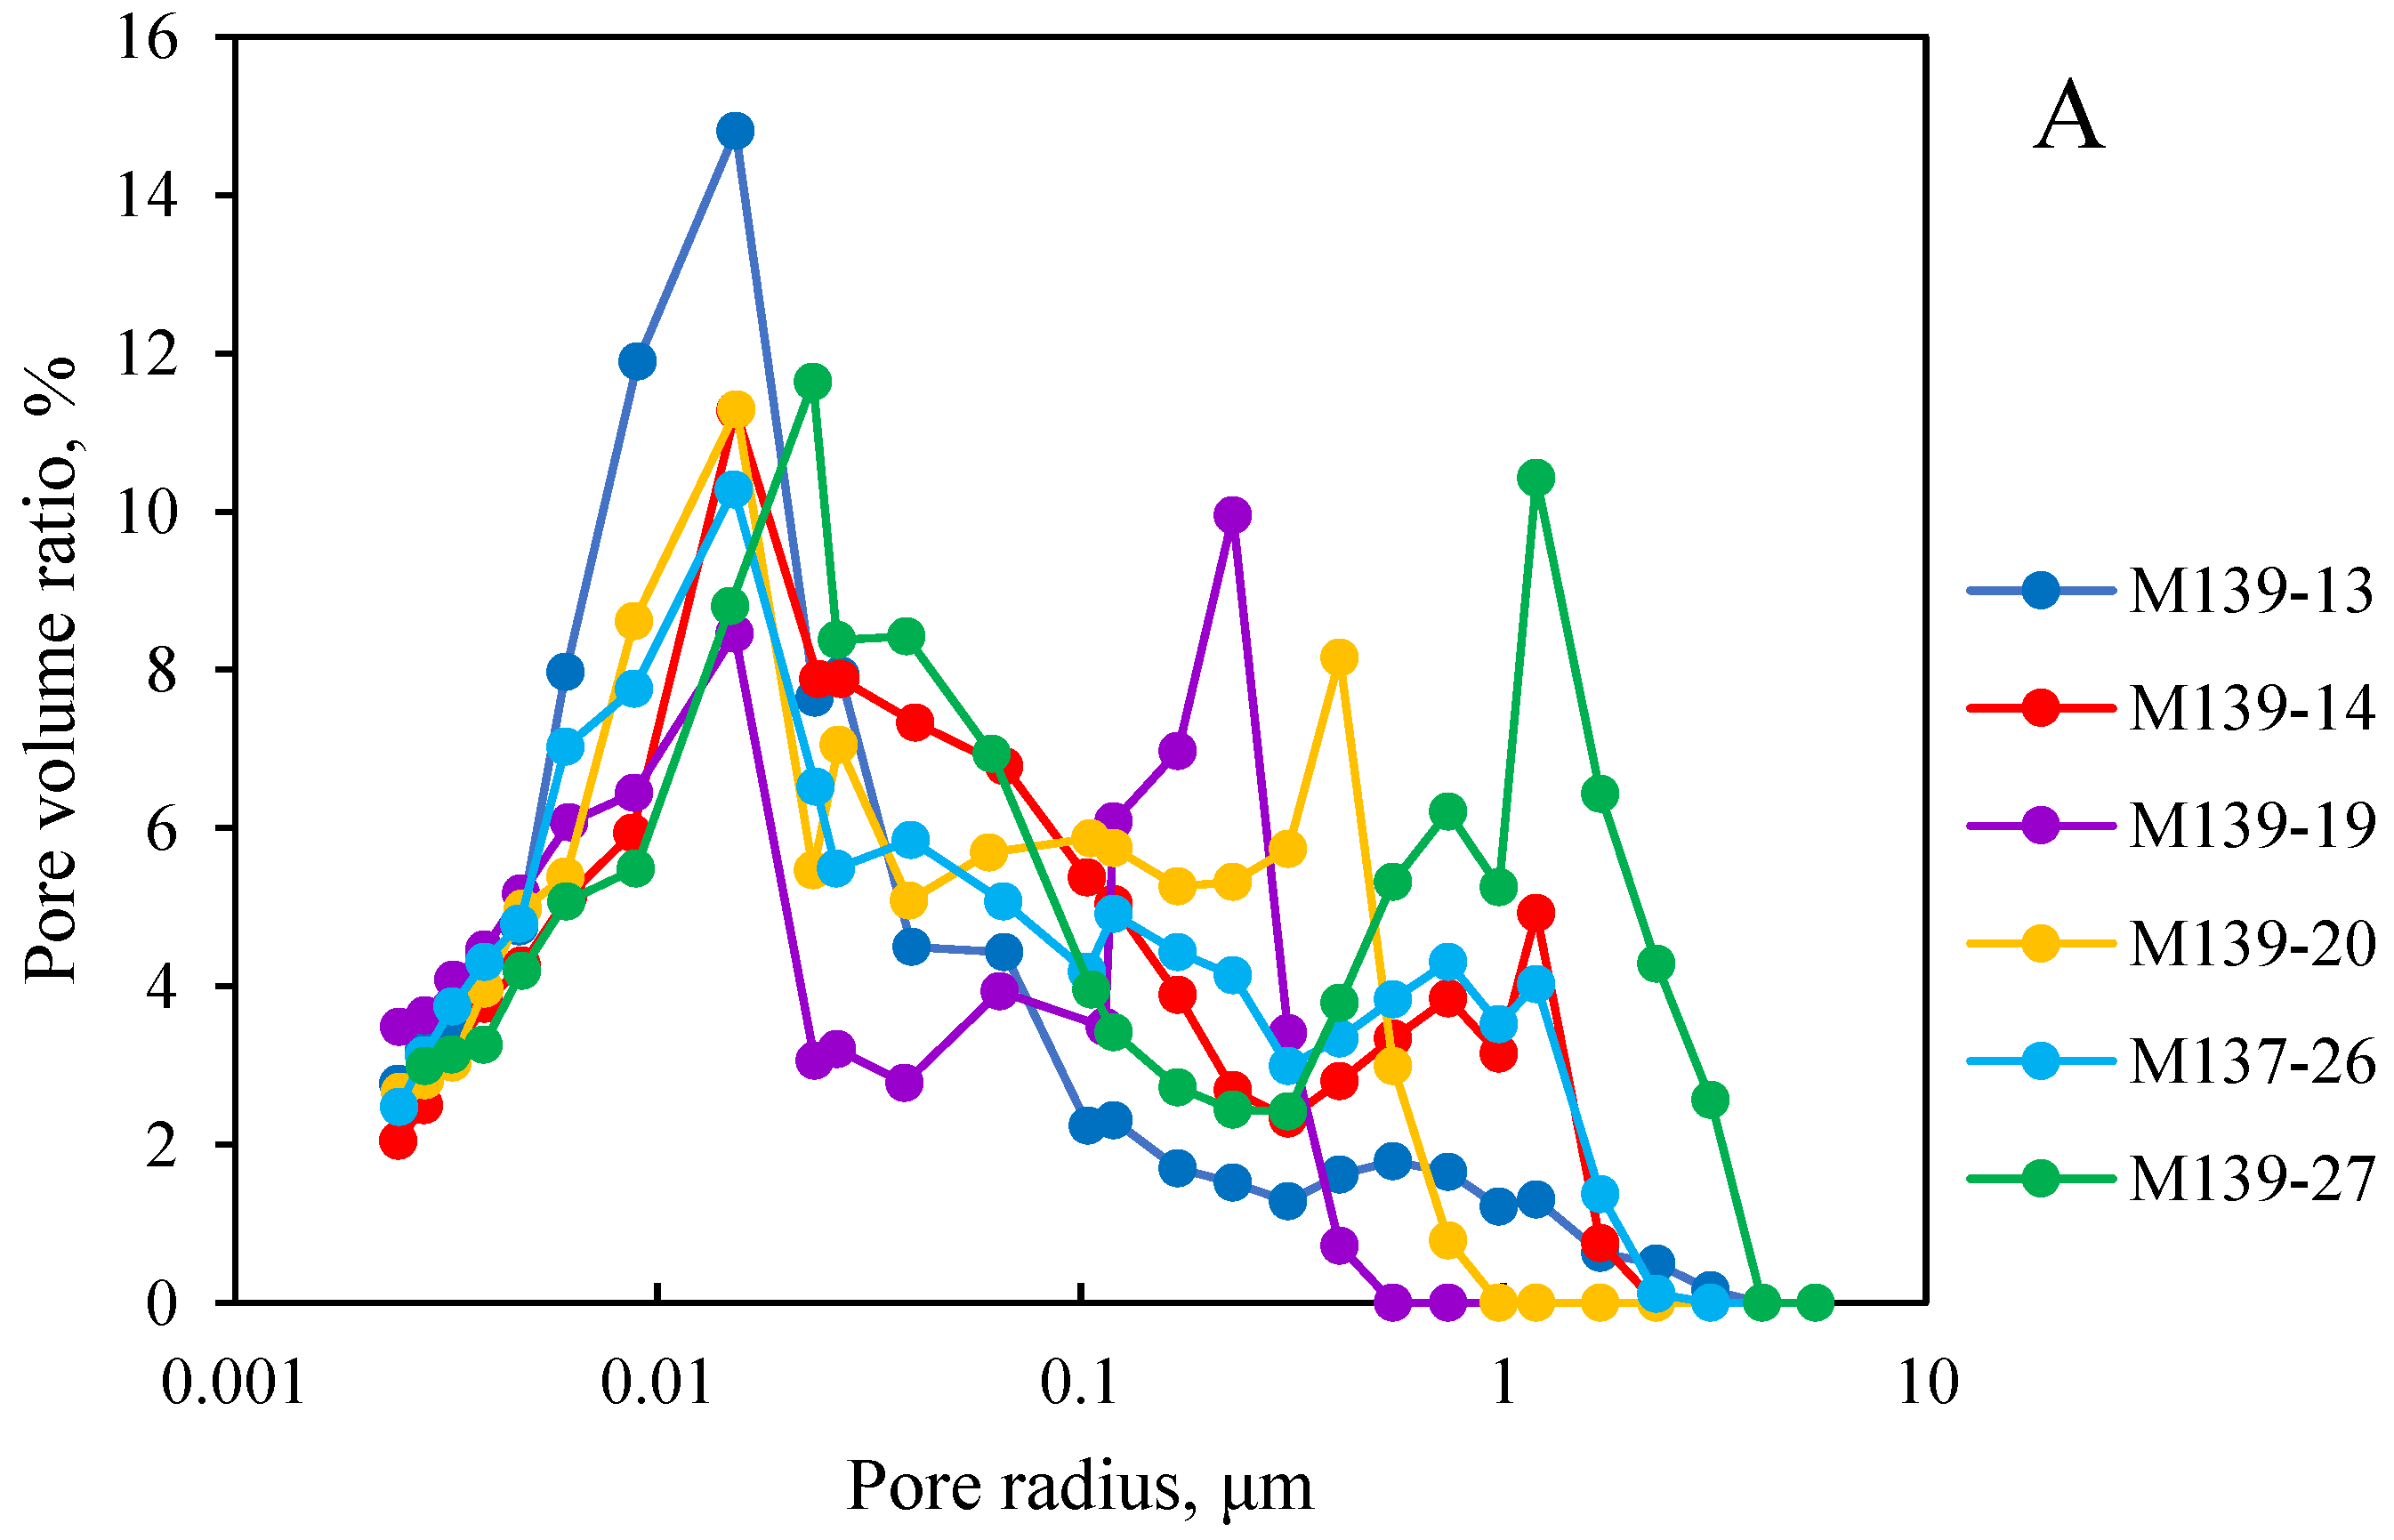
4.4. Pore and Throat Size Distribution
4.5. Saturation of Movable Fluid
5. Discussion
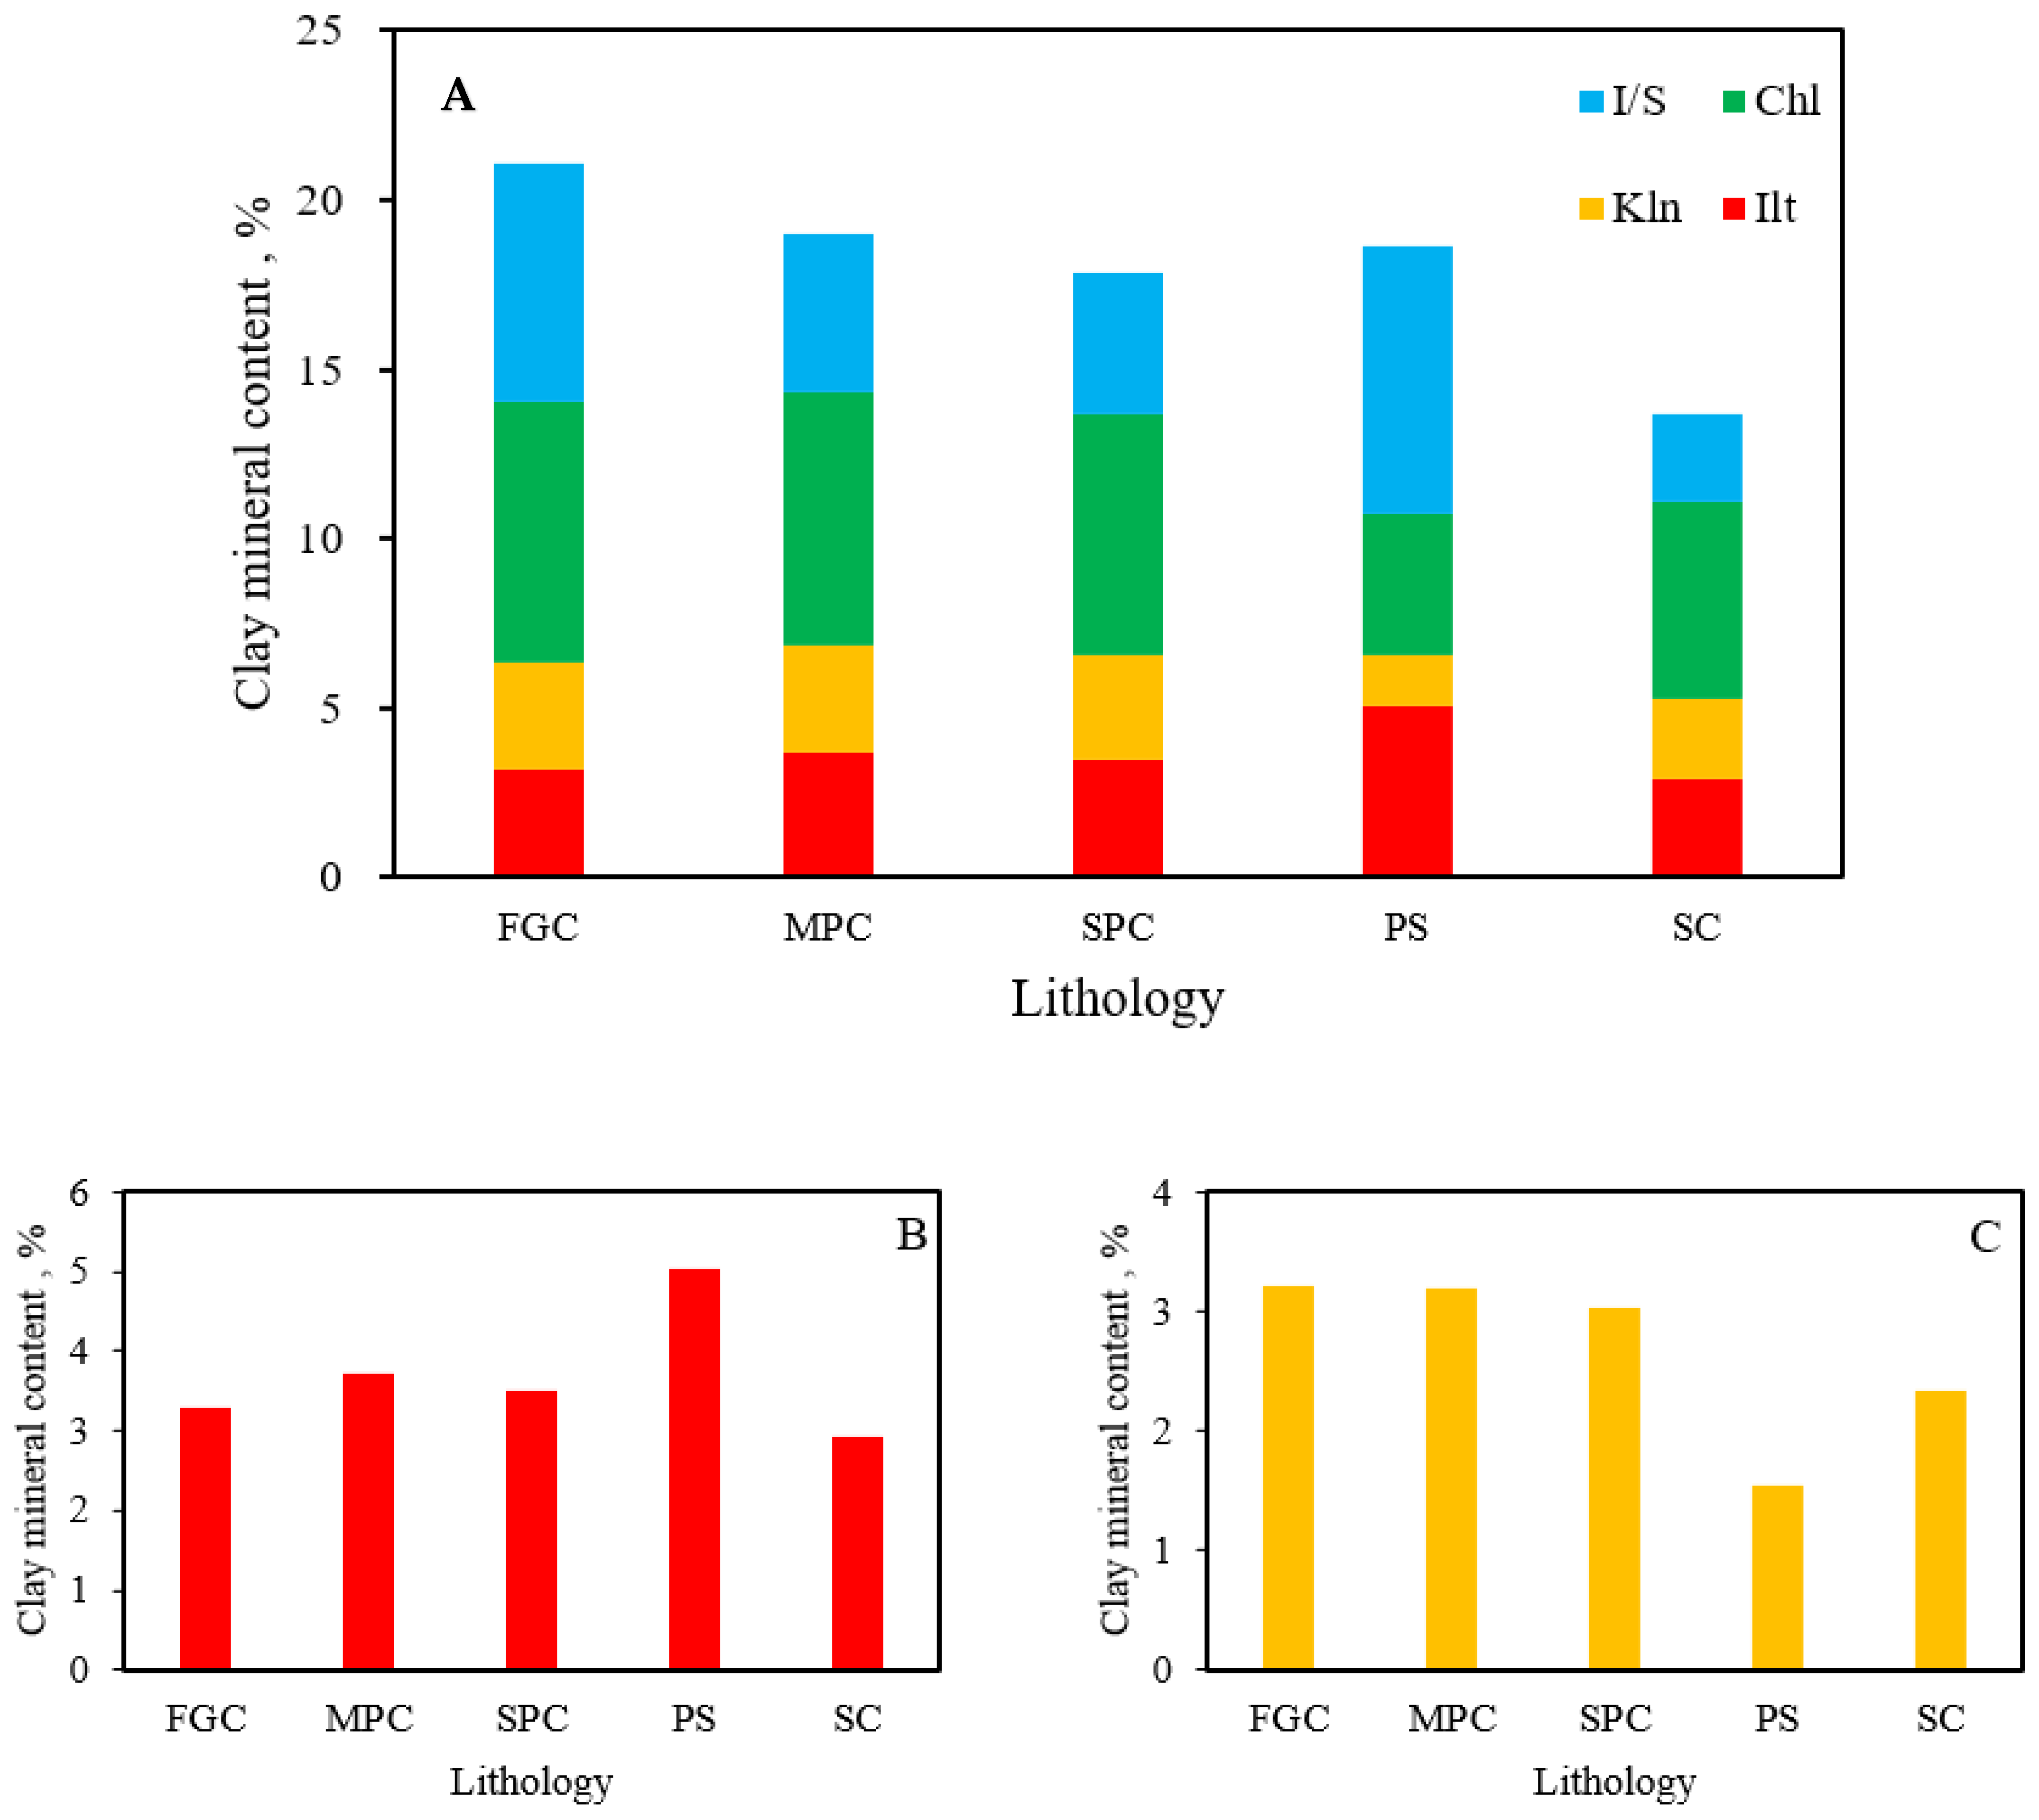
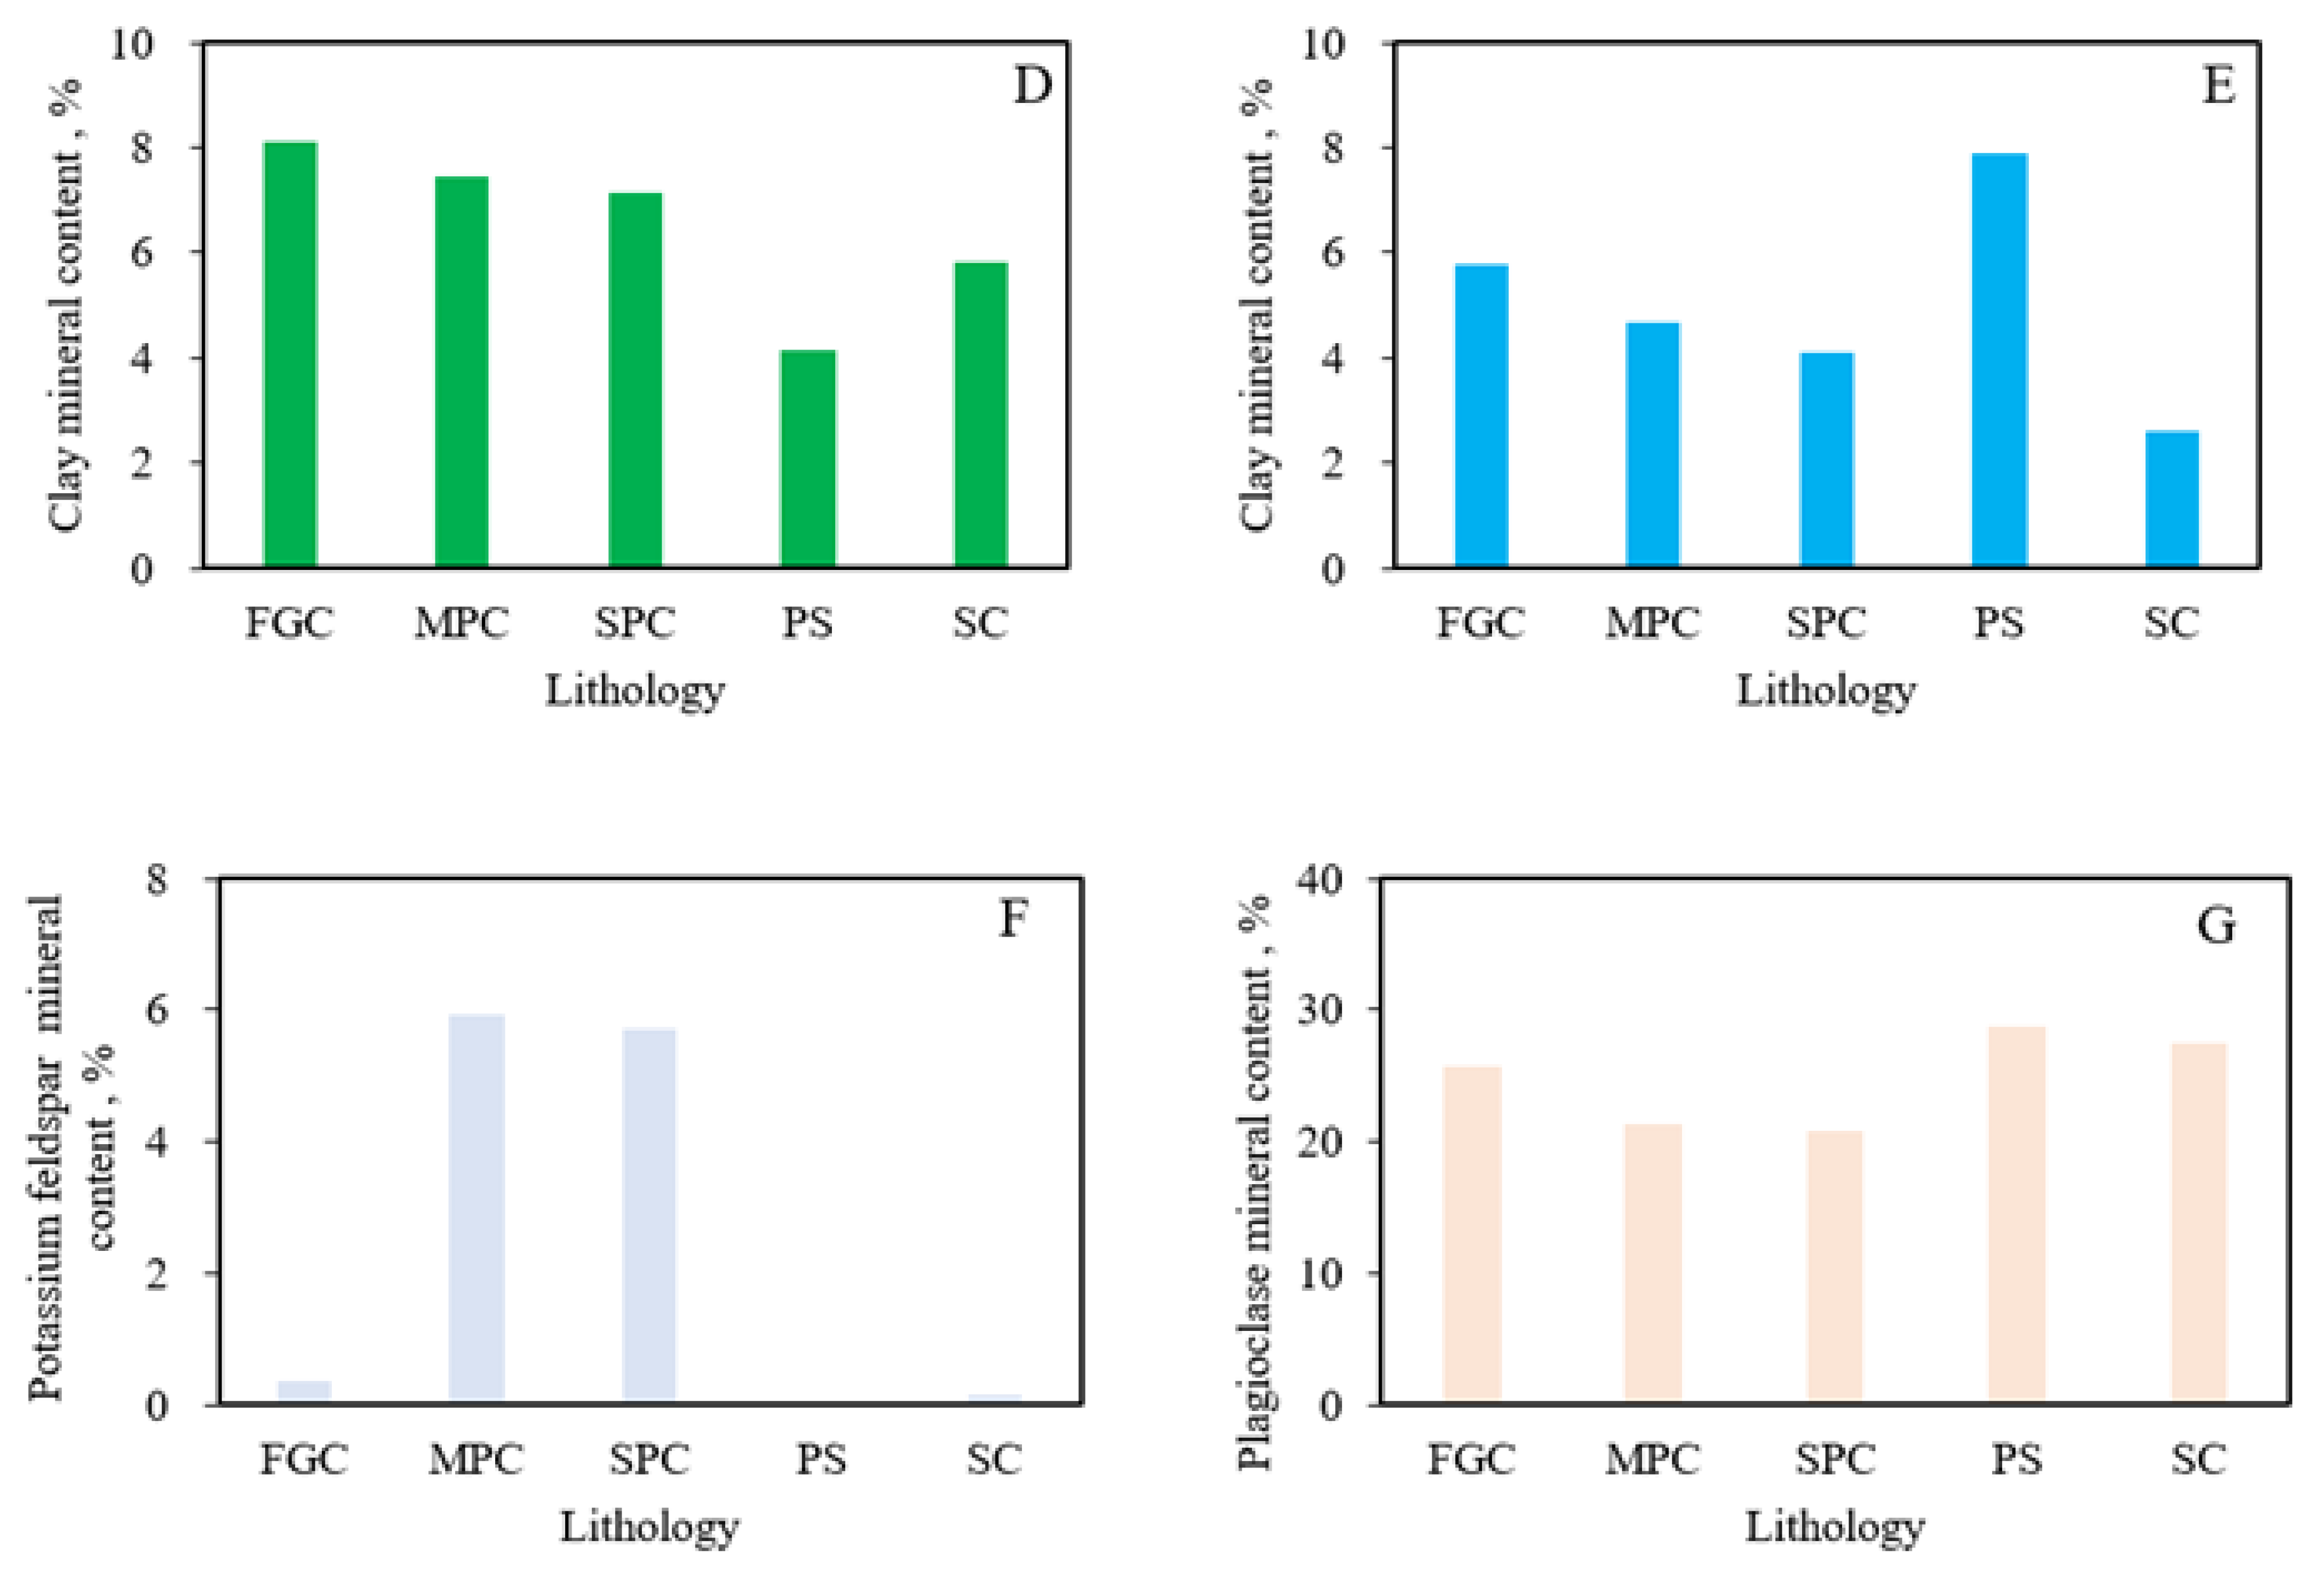
5.1. Effects of Lithology on Clay Mineral Content and Reservoir Physical Properties
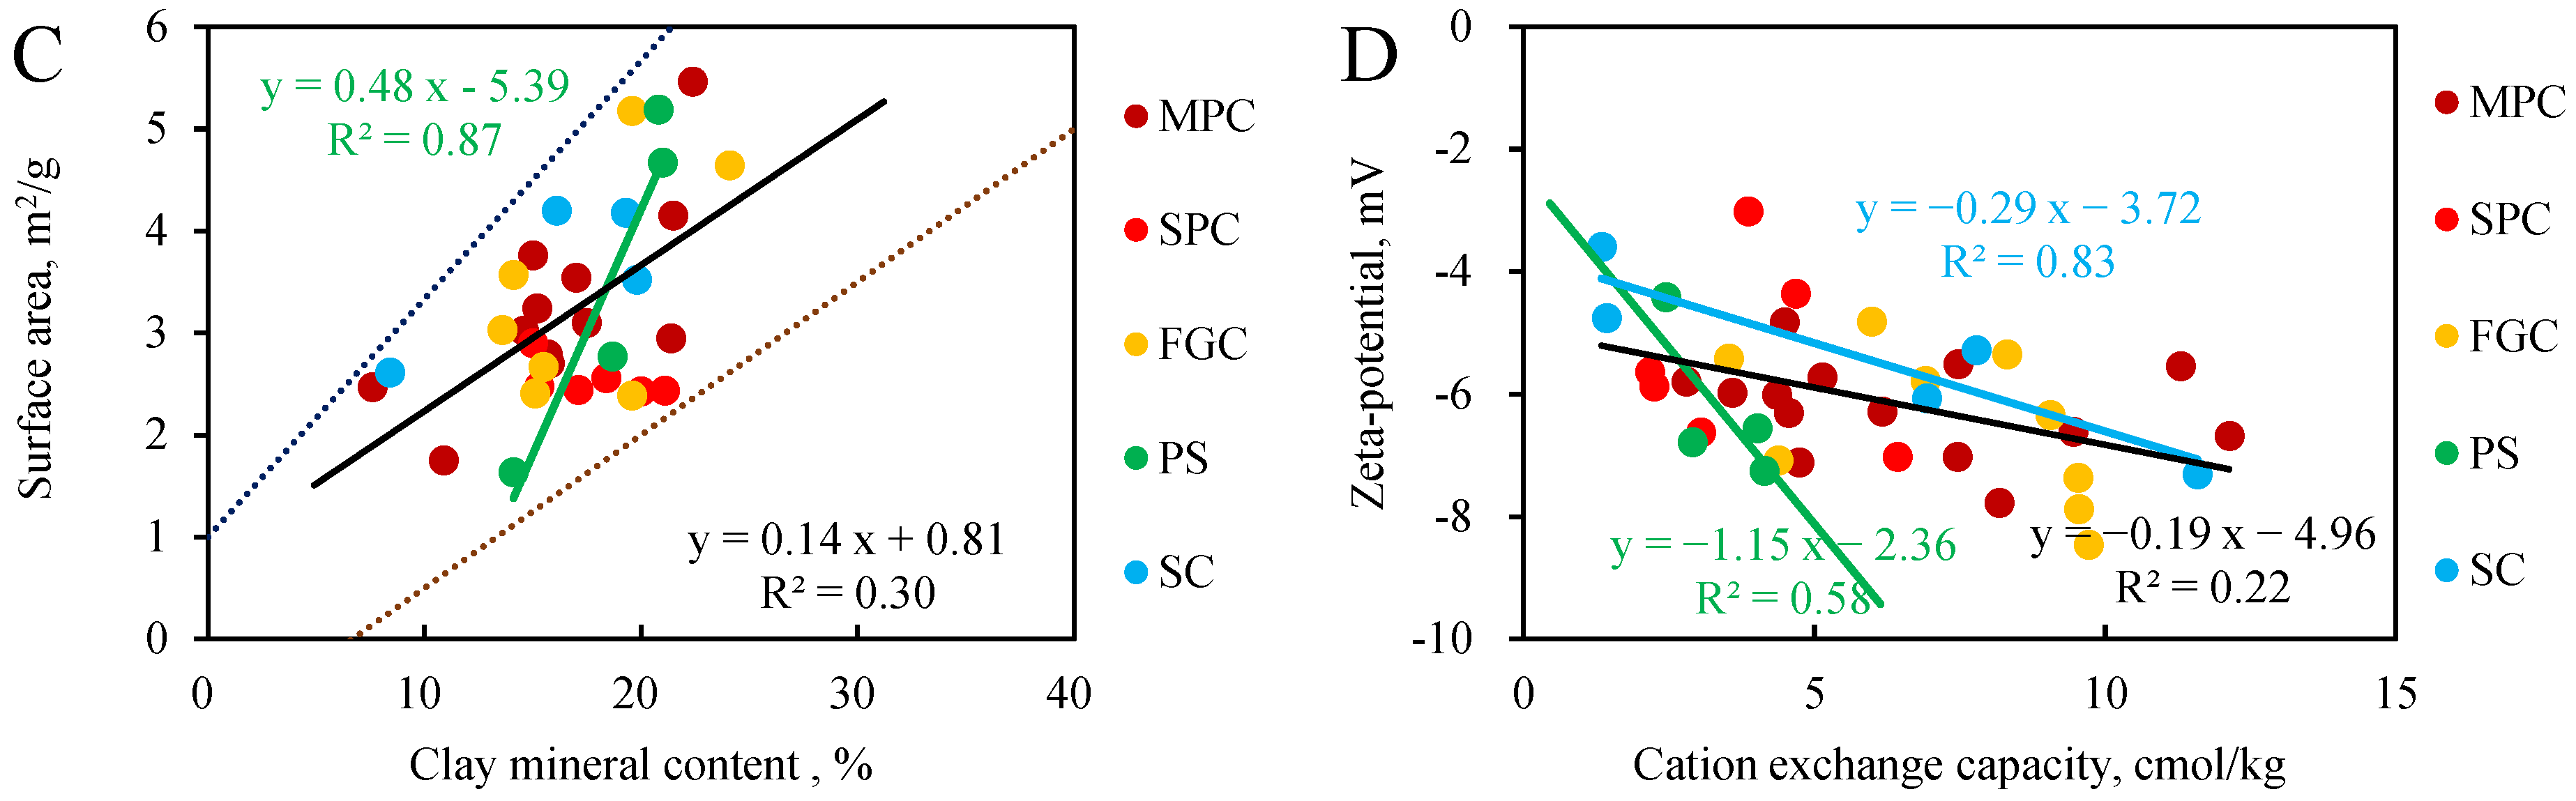
5.2. Effects of Clay Mineral Content on Interface Properties
5.3. Effects of Clay Mineral Content and Lithology on Pore-Throat Scale Distribution
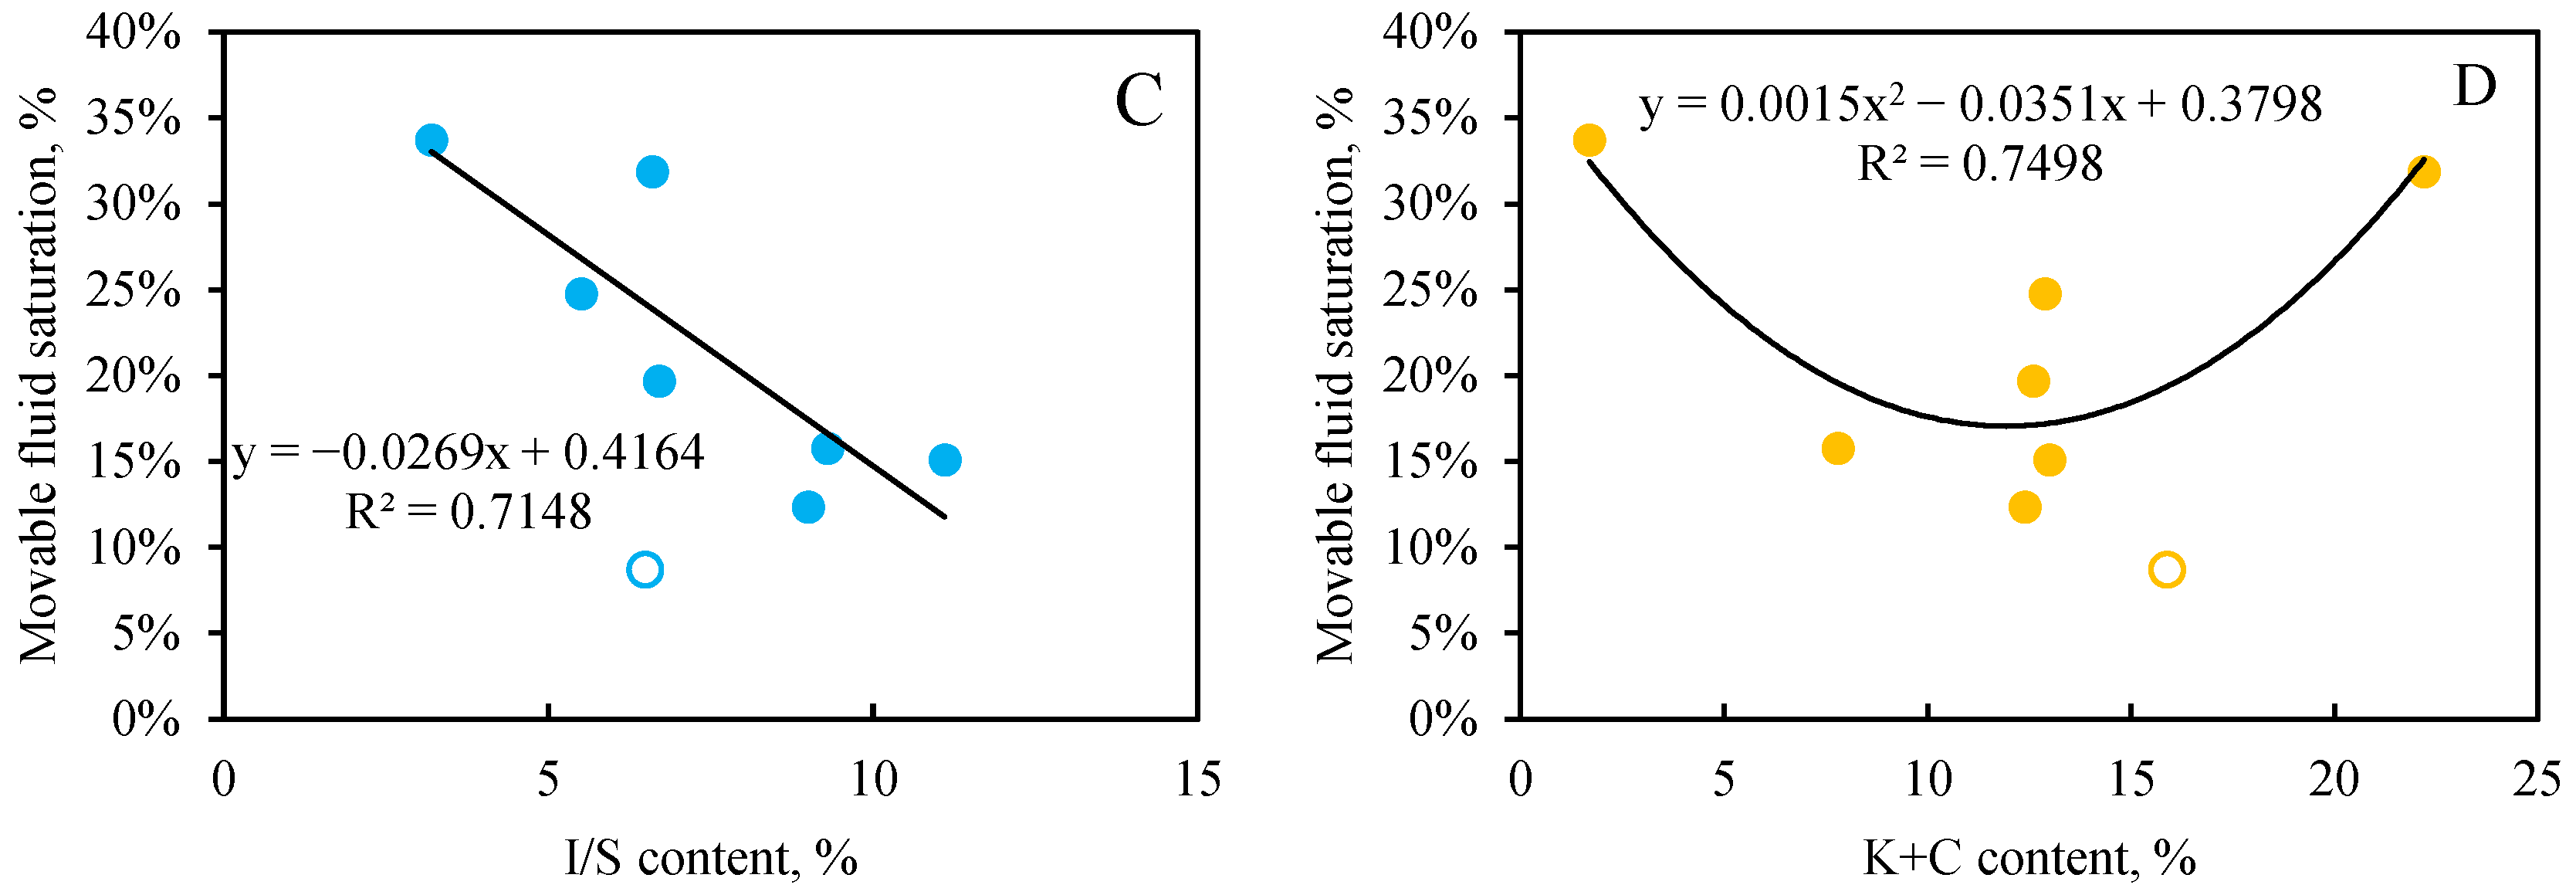
5.4. Effects of Clay Mineral Content on Pore Connectivity
6. Conclusions
Author Contributions
Funding
Acknowledgments
Conflicts of Interest
References
- Cant, D.J.; Ethier, V.G. Lithology–dependent diagenetic control of reservoir properties of conglomerates, Falher Member, Elmworth Field, Alberta. AAPG Bull. 1984, 68, 1044–1054. [Google Scholar]
- Schmidt, G.A.; Pemberton, S.G. Stratigraphy and paleogeography of a conglomeratic shoreline: The notikewin member of the Spirit River Formation in the Wapiti area of west–central Alberta. Bull. Can. Petrol. Geol. 2004, 52, 57–76. [Google Scholar] [CrossRef]
- Krézsek, C.; Filipescu, S.; Silye, L.; Maţenco, L.; Doust, H. Miocene facies associations and sedimentary evolution of the Southern Transylvanian Basin (Romania): Implications for hydrocarbon exploration. Mar. Petrol. Geol. 2010, 27, 191–214. [Google Scholar] [CrossRef]
- Liu, H.; Jiang, Z.X.; Zhang, R.F.; Zhou, H.W. Gravels in the daxing conglomerate and their effect on reservoirs in the Oligocene langgu depression of the Bohai Bay Basin, north China. Mar. Petrol. Geol. 2012, 29, 192–203. [Google Scholar] [CrossRef]
- Rogers, J.P. New reservoir model from an old oil field: Garfield conglomerate pool, Pawnee County, Kansas. AAPG Bull. 2007, 91, 1349–1365. [Google Scholar] [CrossRef]
- Mahmic, O.; Dypvik, H.; Hammer, E. Diagenetic influence on reservoir quality evolution, examples from Triassic conglomerates/arenites in the Edvard Grieg field, Norwegian North Sea. Mar. Petrol. Geol. 2018, 93, 247–271. [Google Scholar] [CrossRef] [Green Version]
- Falk, P.D.; Dorsey, R.J. Rapid development of gravely high–density turbidity currents in marine Gilbert–type fan deltas, Loreto Basin, Baja California Sur, Mexico. Sedimentology 1998, 45, 331–349. [Google Scholar] [CrossRef] [Green Version]
- Hart, B.S.; Plint, A.G. Stratigraphy and sedimentology of shoreface and fluvial conglomerates: Insights from the Cardium Formation in NW Alberta and adjacent British Columbia. Bull. Can. Petrol. Geol. 2003, 51, 437–464. [Google Scholar] [CrossRef]
- Zhang, S.C.; Zou, N.N.; Shi, J.A.; Chang, Q.S.; Lu, X.C.; Chen, B. Depositional model of the triassic Baikouquan Formation in mabei area of Junggar Basin. Oil Gas Geol. 2015, 36, 640–649, (In Chinese with English abstract). [Google Scholar]
- Jia, H.B.; Ji, H.C.; Wang, L.S.; Gao, Y.; Li, X.W.; Zhou, H. Reservoir quality variations within a conglomeratic fan-delta system in the Mahu sag, northwestern Junggar Basin: Characteristics and controlling factors. J. Petrol. Sci. Eng. 2017, 152, 165–181. [Google Scholar] [CrossRef]
- Wei, W.; Zhu, X.M.; Tan, M.X.; Wu, C.B.J.; Guo, D.B.; Su, H.; Jiang, F.H. Facies controls on the distribution of diagenetic alterations in fan delta deposits: A case study from the Lower Cretaceous sandstone, Chagan Sag, Inner Mongolia, China. Geol. J. 2017, 52, 539–558. [Google Scholar] [CrossRef]
- Luo, H.M.; Liu, S.H.; Mu, X. Study on petrophysical parameters of compacted sandy conglomerate. Tech. Progr. Expand. Abstr. 2011, 236, 1818–1826. [Google Scholar]
- Friesen, O.J.; Dashtgard, S.E.; Miller, J.; Schmitt, L.; Baldwin, C. Permeability heterogeneity in bioturbated sediments and implications for waterflooding of tight oil reservoirs, Cardium Formation, Pembina Field, Alberta, Canada. Mar. Petrol. Geol. 2017, 82, 371–387. [Google Scholar] [CrossRef]
- Kang, X.; Hu, W.; Cao, J.; Wu, H.; Xiang, B.; Wang, J. Controls on reservoir quality in fan-deltaic conglomerates: Insight from the lower triassic baikouquan formation, Junggar Basin, China. Mar. Petrol. Geol. 2019, 103, 55–75. [Google Scholar] [CrossRef]
- Markussen, Ø.; Dypvik, H.; Hammer, E.; Long, H.; Hammer, Ø. 3D characterization of porosity and authigenic cementation in Triassic conglomerates/arenites in the Edvard Grieg field using 3D micro-CT imaging. Mar. Petrol. Geol. 2019, 99, 265–281. [Google Scholar] [CrossRef]
- Li, S.M.; He, H.; Hao, R.L.; Chen, H.Q.; Bie, H.Y.; Liu, P.C. Depositional regimes and reservoir architecture characterization of alluvial fans of Karamay oilfield in Junggar basin, Western China. J. Petrol. Sci. Eng. 2020, 186, 106730. [Google Scholar] [CrossRef]
- Xi, K.L.; Cao, Y.C.; Jahren, J.; Zhu, R.K.; Bjørlykke, K.; Haile, B.G.; Zheng, L.J.; Hellevang, H. Diagenesis and reservoir quality of the lower cretaceous quantou formation tight sandstones in the southern Songliao Basin, China. Sediment. Geol. 2015, 330, 90–107. [Google Scholar] [CrossRef]
- Xiao, D.S.; Jiang, S.; Thul, D.; Lu, S.F.; Zhang, L.C.; Li, B. Impacts of clay on pore structure, storage and percolation of tight sandstones from the Songliao Basin, China: Implications for genetic classification of tight sandstone reservoirs. Fuel 2018, 211, 390–404. [Google Scholar] [CrossRef]
- Xi, K.; Cao, Y.C.; Liu, K.Y.; Jahren, J.; Zhu, R.K.; Yuan, G.H.; Hellevang, H. Authigenic minerals related to wettability and their impacts on oil accumulation in tight sandstone reservoirs: An example from the Lower Cretaceous Quantou Formation in the southern Songliao Basin, China. J. Asian Earth Sci. 2019, 178, 173–192. [Google Scholar] [CrossRef]
- Xu, C.F.; Liu, H.X.; Qian, G.B.; Qin, J.H. Microcosmic mechanisms of water-oil displacement in conglomerate reservoirs in Karamay Oilfield, NW China. Petrol. Explor. Dev. 2011, 38, 725–732. [Google Scholar]
- Qian, G.B.; Xu, C.F.; Chen, Y.K.; Wang, X.G.; Liu, H.X.; Lian, G.H. Microscopic mechanism of polymer flooding in glutenite reservoir of Lower Karamay Formation in east district-7, Karamay oilfield. Xinjing Pet. Geol. 2016, 37, 56–61, (In Chinese with English abstract). [Google Scholar]
- Yin, S.L.; Chen, G.Y.; Chen, Y.K.; Wu, X.J. Control effect of pore structure modality on remaining oil in glutenite reservoir: A case from lower Karamay Formation in block Qidong 1 of Karamay Oilfield. Lit. Res. 2018, 30, 91–102, (In Chinese with English abstract). [Google Scholar]
- Li, J.J.; Liu, Y.; Gao, Y.J.; Cheng, B.Y.; Meng, F.L.; Xu, H.M. Effects of microscopic pore structure heterogeneity on the distribution and morphology of remaining oil. Petrol. Explor. Dev. 2018, 45, 1112–1122. [Google Scholar] [CrossRef]
- Liu, G.F.; Wang, Y.F.; Yin, H.; Ding, Y.P.; Lan, Y.F.; Yang, D.Y. Determination of gas-water seepage characteristics with consideration of dynamic pore-throat structure in a tight sandstone gas formation. Mar. Petrol. Geol. 2022, 136, 105440. [Google Scholar] [CrossRef]
- Liu, G.F.; Xie, S.T.; Tian, W.; Wang, J.T.; Li, S.Y.; Wang, Y.X.; Yang, D.Y. Effect of pore-throat structure on gas-water seepage behaviour in a tight sandstone gas reservoir. Fuel 2022, 310, 121901. [Google Scholar] [CrossRef]
- Zhang, J.Y.; Liu, G.D.; Ole, T.; Tao, S.Z.; Jiang, M.Y.; Li, G.H.; Zhang, S.X. Pore-throat structure characteristics and its effect on flow behavior in Gaotaizi tight siltstone reservoir, northern Songliao Basin. Mar. Petrol. Geol. 2020, 122, 104651. [Google Scholar] [CrossRef]
- Mansurbeg., H.; Morad., S.; Salem, A.; Marfil., R.; El-ghali, M.A.K.; Nystuen, J.P.; Caja, M.A.; Amorosi, A.; Garcia, D.; Iglesia, A.L. Diagenesis and reservoir quality evolution of palaeocene deep-water, marine sandstones, the Shetland-Faroes Basin, British continental shelf. Mar. Petrol. Geol. 2008, 25, 514–543. [Google Scholar] [CrossRef]
- Armitage, P.J.; Worden, R.H.; Faulkner, D.R.; Aplin, A.C.; Butche, A.R.; Illiffe, J. Diagenetic and sedimentary controls on porosity in Lower Carboniferous fine-grained lithologies, Krechba field, Algeria: A petrological study of a caprock to a carbon capture site. Mar. Petrol. Geol. 2010, 27, 1395–1410. [Google Scholar] [CrossRef]
- Yuan, G.H.; Gluyas, J.; Cao, Y.C.; Oxtoby, N.H.; Jia, Z.Z.; Wang, Y.Z.; Xi, K.L.; Li, X.Y. Diagenesis and reservoir quality evolution of the eocene sandstones in the northern dongying Sag, Bohai Bay Basin, east China. Mar. Petrol. Geol. 2015, 62, 77–89. [Google Scholar] [CrossRef]
- Rosenbrand, E.; Fabricius, I.L.; Fisher, Q.; Grattoni, C. Permeability in Rotliegend gas sandstones to gas and brine as predicted from NMR, mercury injection and image analysis. Mar. Petrol. Geol. 2015, 64, 189–202. [Google Scholar] [CrossRef]
- Nelson, P.H. Pore-throat sizes in sandstones, tight sandstones, and shales. AAPG Bull. 2009, 93, 329–340. [Google Scholar] [CrossRef]
- Zou, C.N.; Zhu, R.K.; Liu, K.Y.; Su, L.; Bai, B.; Zhang, X.X.; Yuan, X.J.; Wang, J.H. Tight gas sandstone reservoirs in China: Characteristics and recognition criteria. J. Petrol. Sci. Eng. 2012, 88, 82–91. [Google Scholar] [CrossRef]
- Zhang, L.P.; Bai, G.P.; Luo, X.R.; Ma, X.H.; Chen, M.J.; Wu, M.H.; Yang, W.X. Diagenetic history of tight sandstones and gas entrapment in the Yulin Gas Field in the central area of the Ordos Basin, China. Mar. Petrol. Geol. 2009, 26, 974–989. [Google Scholar] [CrossRef]
- Zhang, Y.L.; Bao, Z.D.; Zhao, Y.; Jiang, L.; Zhou, Y.Q.; Gong, F.H. Origins of authigenic minerals and their impacts on reservoir quality of tight sandstones: Upper triassic chang-7 member, yanchang formation, Ordos Basin, China. Aust. J. Earth Sci. 2017, 64, 519–536. [Google Scholar] [CrossRef]
- Stroker, T.M.; Harris, N.B.; Elliott, W.C.; Wampler, J.M. Diagenesis of a tight gas sand reservoir: Upper cretaceous mesaverde group, piceance basin, Colorado. Mar. Petrol. Geol. 2013, 40, 48–68. [Google Scholar] [CrossRef]
- Wang, Y.S.; Gao, Y.; Fang, Z.W. Pore throat structure and classification of Paleogene tight reservoirs in Jiyang depression, Bohai Bay Basin, China. Petrol. Explor. Dev. 2021, 48, 308–322. [Google Scholar] [CrossRef]
- Qu, Y.Q.; Sun, W.; Wu, H.N.; Huang, S.J.; Li, T.; Ren, D.Z.; Chen, B. Impacts of pore-throat spaces on movable fluid: Implications for understanding the tight oil exploitation process. Mar. Petrol. Geol. 2022, 137, 105509. [Google Scholar] [CrossRef]
- Deng, H.C.; Fu, M.Y.; Zhou, W.; Zhang, L.Y.; Xie, X.H.; Li, Y.L.; Wang, D.L. The pores evolution of lacustrine shale induced by smectite-to-illite conversion and hydrocarbon generation: Upper Triassic Yanchang Formation, Ordos Basin, China. J. Petrol. Sci. Eng. 2021, 202, 108460. [Google Scholar]
- Nelson, P.H.; Kibler, J.E. Permeability-porosity relationships in sedimentary rocks. Log Analyst 1994, 35, 38–62. [Google Scholar]
- Xu, G.S.; Zhang, P.; Xu, F.G.; Wang, X.; Yang, C. Diagenesis and Pore Evolution of Cretaceous Tugulu Group Reservoir in Chepaizi Area, Junggar Basin, China; Chengdu University of Technology: Chengdu, China, 2015; pp. 513–520. [Google Scholar]
- Dong, S.P.; Shalaby, M.R.; Islam, M.A. Integrated Reservoir Characterization Study of the McKee Formation, Onshore Taranaki Basin, New Zealand. Geosciences 2018, 8, 105. [Google Scholar] [CrossRef] [Green Version]
- Wang, R.; Shi, W.Z.; Xie, X.Y.; Zhang, W.; Qin, S.; Liu, K.; Arthur, B.B. Clay mineral content, type, and their effects on pore throat structure and reservoir properties: Insight from the Permian tight sandstones in the Hangjinqi area, north Ordos Basin, China. Mar. Petrol. Geol. 2020, 115, 104281. [Google Scholar] [CrossRef]
- Xiao, M.; Yuan, X.J.; Wu, S.T.; Cao, Z.L.; Tang, Y.; Xie, Z.Y.; Wang, R.J. Conglomerate reservoir characteristics of and main controlling factors for the Baikouquan Formation, Mahu sag, Junggar Basin. Earth Sci. Front. 2019, 26, 212–224. [Google Scholar]
- Zhao, H.W.; Ning, Z.F.; Wang, Q.; Zhang, R.; Zhao, T.Y.; Niu, T.F.; Zeng, Y. Petrophysical characterization of tight oil reservoirs using pressure-controlled porosimetry combined with rate-controlled porosimetry. Fuel 2015, 154, 233–242. [Google Scholar] [CrossRef]
- Lai, J.; Wang, G.W.; Wang, Z.Y.; Chen, J.; Pang, X.J.; Wang, S.C.; Zhou, Z.L.; He, Z.B.; Qin, Z.Q.; Fan, X.Q. A review on pore structure characterization in tight sandstones. Earth Sci. Rev. 2017, 177, 436–457. [Google Scholar] [CrossRef]
- Stillings, L.L.; Drever, J.I.; Brantley, S.L.; Sun, Y.T.; Oxburgh, R. Rates of feldspar dissolution at pH 3–7 with 0–8 mM oxalic acid. Chem. Geol. 1996, 132, 79–89. [Google Scholar] [CrossRef]
- Seewald, J.S. Organic–inorganic interactions in petroleum–producing sedimentary basins. Nature 2003, 426, 327–333. [Google Scholar] [CrossRef]
- Fenter, P.; Zapol, P.; He, H.Y.; Sturchio, N.C. On the variation of dissolution rates at the orthoclase surface with pH and temperature. Geochem. Cosmochim. Acta 2014, 141, 598–611. [Google Scholar] [CrossRef]
- Hu, W.X.; Kang, X.; Cao, J.; Wang, X.L.; Fu, B.; Wu, H.G. Thermochemical oxidation of methane induced by high-valence metal oxides in a sedimentary basin. Nat. Commun. 2018, 9, 5131. [Google Scholar] [CrossRef]


| Block | Well | Well Depth (m) | Lithology | K (mD) | Φ (%) | Bulk Mineral Content (%) | Clay Mineral Content (%) | |||||||||||
|---|---|---|---|---|---|---|---|---|---|---|---|---|---|---|---|---|---|---|
| Quartz | Potassium Feldspar | Plagioclase | Calcite | Dolomite | Siderite | Pyrite | Clay | Ill | Kln | Chl | I/S | S(I/S) | ||||||
| Ma131 | M137 | 3249.8 | conglomerate with small pebbles | 0.14 | 11.3 | 52.3 | 4.7 | 18.9 | 5.7 | 18.4 | 2.9 | 4.6 | 8.3 | 2.6 | 65 | |||
| M137 | 3255.7 | conglomerate with medium pebbles | 0.089 | 7.43 | 48.3 | 5.4 | 23.6 | 0.2 | 22.5 | 6.3 | 2.3 | 6.8 | 7.2 | 65 | ||||
| M137 | 3256.4 | fine-grained conglomerate | 0.51 | 8.03 | 50.7 | 2.3 | 17.9 | 0.2 | 28.9 | 2.6 | 6.6 | 15.6 | 4.0 | 65 | ||||
| M137 | 3259.4 | conglomerate with medium pebbles | 0.11 | 10.5 | 55.2 | 10.6 | 17.4 | 1.1 | 15.7 | 3.8 | 3.0 | 6.6 | 2.4 | 45 | ||||
| M139 | 3264.8 | fine-grained conglomerate | 0.42 | 10.7 | 48.1 | 5.0 | 18.7 | 0.3 | 27.9 | 3.6 | 3.6 | 14.5 | 6.1 | 30 | ||||
| M139 | 3267 | sandy conglomerate | 0.28 | 13.3 | 57.0 | 4.6 | 21.2 | 8.8 | 8.4 | 1.1 | 1.8 | 4.5 | 1.0 | 10 | ||||
| M139 | 3268.3 | conglomerate with small pebbles | 0.26 | 9.6 | 50.3 | 6.4 | 26.4 | 1.6 | 15.3 | 2.9 | 3.1 | 8.0 | 1.4 | 10 | ||||
| M139 | 3268.4 | conglomerate with small pebbles | 0.22 | 10.9 | 49.4 | 5.6 | 27.6 | 1.3 | 1.1 | 15.0 | 2.9 | 3.5 | 7.5 | 1.2 | 10 | |||
| M139 | 3276.9 | conglomerate with medium pebbles | 0.2 | 8.95 | 50.4 | 3.8 | 28.2 | 0.1 | 17.5 | 3.0 | 4.2 | 6.8 | 3.5 | 70 | ||||
| M139 | 3277.7 | conglomerate with medium pebbles | 0.076 | 8.94 | 44.9 | 4.4 | 25.7 | 3.5 | 21.5 | 1.9 | 4.9 | 11.4 | 3.2 | 65 | ||||
| M139 | 3285.4 | conglomerate with medium pebbles | 0.27 | 13.3 | 56.0 | 6.6 | 19.3 | 2.9 | 15.2 | 2.6 | 3.2 | 8.1 | 1.4 | 10 | ||||
| M139 | 3293.8 | pebbly sandstone | 0.12 | 10.4 | 54.6 | 7.3 | 14.0 | 10.0 | 14.1 | 2.4 | 2.3 | 7.6 | 1.8 | 50 | ||||
| M139 | 3296 | conglomerate with medium pebbles | 0.42 | 7.86 | 53.6 | 4.7 | 25.3 | 0.6 | 15.8 | 4.6 | 2.8 | 4.9 | 3.5 | 75 | ||||
| M139 | 3296.2 | conglomerate with medium pebbles | 0.025 | 5.84 | 52.2 | 6.5 | 17.9 | 1.3 | 0.7 | 21.4 | 5.1 | 2.8 | 9.6 | 3.9 | 55 | |||
| M139 | 3296.8 | fine-grained conglomerate | 0.054 | 10.7 | 55.5 | 8.2 | 16.1 | 0.8 | 19.4 | 2.1 | 3.7 | 9.1 | 4.5 | 50 | ||||
| M139 | 3297.5 | fine-grained conglomerate | 0.072 | 8.2 | 52.3 | 8.7 | 23.1 | 0.8 | 15.1 | 3.2 | 2.6 | 6.8 | 2.6 | 50 | ||||
| M139 | 3303.4 | conglomerate with medium pebbles | 0.59 | 6.4 | 46.4 | 4.8 | 26.2 | 5.6 | 17.0 | 2.9 | 3.7 | 8.2 | 2.2 | 50 | ||||
| M139 | 3303.6 | conglomerate with medium pebbles | 0.27 | 8.58 | 51.9 | 7.3 | 17.9 | 7.9 | 15.0 | 2.7 | 2.9 | 6.9 | 2.6 | 50 | ||||
| M139 | 3304.2 | sandy conglomerate | 0.2 | 8.52 | 52.1 | 5.2 | 22.6 | 0.8 | 19.3 | 2.3 | 3.1 | 9.5 | 4.4 | 65 | ||||
| M139 | 3304 | sandy conglomerate | 0.13 | 9.47 | 56.7 | 6.6 | 16.2 | 0.7 | 19.8 | 4.0 | 3.2 | 8.9 | 3.8 | 55 | ||||
| M139 | 3305.3 | conglomerate with medium pebbles | 0.2 | 9.6 | 56.7 | 8.9 | 16.9 | 2.9 | 14.6 | 1.8 | 3.7 | 7.0 | 2.2 | 55 | ||||
| Ma18 | M18 | 3823.5 | sandy conglomerate | 0.066 | 7.1 | 48.1 | 1.4 | 25.4 | 9.0 | 16.1 | 5.5 | 3.2 | 5.0 | 2.4 | 30 | |||
| M18 | 3882.5 | sandy conglomerate | 1.45 | 15 | 66.0 | 2.0 | 26.7 | 0.4 | 4.9 | 1.8 | 0.3 | 1.4 | 1.4 | 30 | ||||
| M604 | 3929.2 | fine-grained conglomerate | 0.073 | 6.71 | 58.7 | 26.0 | 1.3 | 0.4 | 13.6 | 2.3 | 1.4 | 2.6 | 7.3 | 85 | ||||
| M604 | 3932 | fine-grained conglomerate | 0.06 | 7.32 | 52.0 | 2.3 | 21.0 | 0.6 | 24.1 | 4.1 | 3.4 | 9.6 | 7.0 | 90 | ||||
| M604 | 3932.1 | fine-grained conglomerate | 0.13 | 8.41 | 58.2 | 0.5 | 26.8 | 0.4 | 14.1 | 2.7 | 2.7 | 4.9 | 3.8 | 75 | ||||
| M604 | 3932.5 | conglomerate with medium pebbles | 0.14 | 10.27 | 44.8 | 23.5 | 0.8 | 30.9 | 4.3 | 5.9 | 12.1 | 8.7 | 55 | |||||
| M604 | 3933.2 | fine-grained conglomerate | 0.095 | 7.29 | 47.2 | 31.6 | 1.6 | 19.6 | 2.4 | 2.9 | 7.4 | 6.9 | 85 | |||||
| M604 | 3933.4 | fine-grained conglomerate | 0.55 | 7.45 | 52.6 | 30.6 | 1.3 | 15.5 | 2.6 | 2.0 | 3.7 | 7.1 | 90 | |||||
| M604 | 3933.6 | conglomerate with medium pebbles | 0.36 | 7.86 | 45.7 | 22.0 | 1.1 | 31.2 | 5.0 | 5.3 | 7.2 | 13.7 | 75 | |||||
| M604 | 3925.1 | pebbly sandstone | 0.024 | 5.68 | 59.8 | 16.3 | 0.7 | 0.5 | 0.3 | 22.4 | 2.2 | 2.2 | 13.7 | 4.3 | 55 | |||
| M604 | 3923.5 | fine-grained conglomerate | 0.11 | 10.6 | 47.6 | 32.7 | 0.1 | 19.6 | 4.3 | 3.7 | 4.3 | 7.3 | 85 | |||||
| M604 | 3921.1 | pebbly sandstone | 0.076 | 6.89 | 47.1 | 31.8 | 21.1 | 4.2 | 2.7 | 8.0 | 6.1 | 90 | ||||||
| M604 | 3921.7 | conglomerate with small pebbles | 0.062 | 6.06 | 45.8 | 37.0 | 0.1 | 17.1 | 2.6 | 1.5 | 6.3 | 6.7 | 75 | |||||
| M604 | 3919.1 | pebbly sandstone | 0.017 | 4.42 | 55.5 | 23.6 | 0.1 | 20.8 | 6.0 | 0.8 | 2.7 | 11.2 | 55 | |||||
| M604 | 3919.7 | pebbly sandstone | 0.15 | 8.32 | 47.5 | 31.4 | 0.1 | 21.0 | 6.7 | 1.3 | 4.6 | 8.4 | 85 | |||||
| M604 | 3909.7 | pebbly sandstone | 0.5 | 7.1 | 58.1 | 22.6 | 0.4 | 0.2 | 18.7 | 5.0 | 1.9 | 1.7 | 10.1 | 90 | ||||
| M604 | 3900 | conglomerate with medium pebbles | 0.52 | 9.67 | 63.7 | 28.3 | 0.3 | 0.1 | 7.6 | 1.8 | 1.4 | 1.7 | 2.6 | 75 | ||||
| M604 | 3900.3 | conglomerate with medium pebbles | 0.49 | 11.2 | 52.5 | 35.3 | 0.4 | 0.4 | 0.3 | 0.2 | 10.9 | 3.8 | 1.4 | 1.4 | 4.3 | 85 | ||
| M604 | 3896.4 | conglomerate with small pebbles | 0.86 | 11.2 | 49.8 | 27.4 | 2.8 | 20.0 | 5.6 | 2.8 | 4.8 | 6.8 | 85 | |||||
| M604 | 3892.8 | fine-grained conglomerate | 0.11 | 6 | 51.2 | 0.7 | 21.0 | 0.6 | 26.5 | 6.4 | 2.7 | 10.6 | 6.9 | 40 | ||||
| M604 | 3883.2 | conglomerate with medium pebbles | 0.54 | 7.81 | 49.2 | 25.2 | 0.5 | 25.1 | 7.5 | 1.3 | 6.8 | 9.5 | 70 | |||||
| Block | Well | Well Depth (m) | Lithology | K (mD) | Φ (%) | Zeta-Potential (mV) | Surface Area (m2/g) | Cation Exchange Capacity (cmol/kg) |
|---|---|---|---|---|---|---|---|---|
| Ma131 | M137 | 3249.8 | conglomerate with small pebbles | 0.14 | 11.3 | −7.0 | 2.56 | 6.429 |
| M137 | 3255.7 | conglomerate with medium pebbles | 0.089 | 7.43 | −7.8 | 8.186 | ||
| M137 | 3256.4 | fine-grained conglomerate | 0.51 | 8.03 | −8.5 | 3.73 | 9.719 | |
| M137 | 3259.4 | conglomerate with medium pebbles | 0.11 | 10.5 | −5.5 | 2.79 | 7.475 | |
| M139 | 3264.8 | conglomerate with small pebbles | 0.42 | 10.7 | −4.3 | 6.113 | ||
| M139 | 3267 | sandy conglomerate | 0.28 | 13.3 | −3.6 | 2.615 | 1.343 | |
| M139 | 3268.3 | conglomerate with small pebbles | 0.26 | 9.6 | −4.4 | 2.477 | 4.684 | |
| M139 | 3268.4 | conglomerate with small pebbles | 0.22 | 10.9 | −3.0 | 2.897 | 3.863 | |
| M139 | 3276.9 | conglomerate with medium pebbles | 0.2 | 8.95 | −6.3 | 3.096 | 6.165 | |
| M139 | 3277.7 | conglomerate with medium pebbles | 0.076 | 8.94 | −4.8 | 4.152 | 4.484 | |
| M139 | 3285.4 | conglomerate with medium pebbles | 0.27 | 13.3 | −4.5 | 3.24 | 8.085 | |
| M139 | 3293.8 | pebbly sandstone | 0.12 | 10.4 | −4.4 | 1.636 | 2.454 | |
| M139 | 3296 | conglomerate with medium pebbles | 0.42 | 7.86 | −6.6 | 2.7 | 9.453 | |
| M139 | 3296.2 | conglomerate with medium pebbles | 0.025 | 5.84 | −7.0 | 2.95 | 7.458 | |
| M139 | 3296.8 | fine-grained conglomerate | 0.054 | 10.7 | −7.1 | 4.379 | ||
| M139 | 3297.5 | fine-grained conglomerate | 0.072 | 8.2 | −4.8 | 2.409 | 5.99 | |
| M139 | 3303.4 | conglomerate with medium pebbles | 0.59 | 6.4 | −5.8 | 3.539 | 2.792 | |
| M139 | 3303.6 | conglomerate with medium pebbles | 0.27 | 8.58 | −5.7 | 3.758 | 5.133 | |
| M139 | 3304.2 | sandy conglomerate | 0.2 | 8.52 | −5.3 | 4.178 | 7.784 | |
| M139 | 3304 | sandy conglomerate | 0.13 | 9.47 | −6.1 | 3.521 | 6.935 | |
| M139 | 3305.3 | conglomerate with medium pebbles | 0.2 | 9.6 | −6.3 | 3.021 | 4.564 | |
| Ma18 | M18 | 3823.5 | sandy conglomerate | 0.066 | 7.1 | −4.8 | 4.197 | 1.43 |
| M18 | 3882.5 | sandy conglomerate | 1.45 | 15 | −7.3 | 11.588 | ||
| M604 | 3929.2 | fine-grained conglomerate | 0.073 | 6.71 | −7.9 | 3.03 | 9.549 | |
| M604 | 3932 | fine-grained conglomerate | 0.06 | 7.32 | −7.4 | 4.64 | 9.541 | |
| M604 | 3932.1 | fine-grained conglomerate | 0.13 | 8.41 | −6.3 | 3.57 | 9.062 | |
| M604 | 3932.5 | conglomerate with medium pebbles | 0.14 | 10.27 | −6.7 | 12.137 | ||
| M604 | 3933.2 | fine-grained conglomerate | 0.095 | 7.29 | −5.8 | 5.174 | 6.913 | |
| M604 | 3933.4 | fine-grained conglomerate | 0.55 | 7.45 | −4.2 | 2.664 | 4.616 | |
| M604 | 3933.6 | conglomerate with medium pebbles | 0.36 | 7.86 | −8.1 | |||
| M604 | 3925.1 | pebbly sandstone | 0.024 | 5.68 | −6.0 | 5.464 | 3.592 | |
| M604 | 3923.5 | fine-grained conglomerate | 0.11 | 10.6 | −5.4 | 2.384 | 3.526 | |
| M604 | 3921.1 | pebbly sandstone | 0.076 | 6.89 | −5.9 | 2.434 | 2.242 | |
| M604 | 3921.7 | conglomerate with small pebbles | 0.062 | 6.06 | −5.6 | 2.444 | 2.173 | |
| M604 | 3919.1 | pebbly sandstone | 0.017 | 4.42 | −6.8 | 5.187 | 2.902 | |
| M604 | 3919.7 | pebbly sandstone | 0.15 | 8.32 | −6.6 | 4.667 | 4.025 | |
| M604 | 3909.7 | pebbly sandstone | 0.5 | 7.1 | −7.3 | 2.769 | 4.14 | |
| M604 | 3900 | conglomerate with medium pebbles | 0.52 | 9.67 | −7.1 | 2.468 | 4.74 | |
| M604 | 3900.3 | conglomerate with medium pebbles | 0.49 | 11.2 | −6.0 | 1.749 | 4.352 | |
| M604 | 3896.4 | conglomerate with small pebbles | 0.86 | 11.2 | −6.6 | 2.428 | 3.049 | |
| M604 | 3892.8 | fine-grained conglomerate | 0.11 | 6 | −5.3 | 8.311 | ||
| M604 | 3883.2 | conglomerate with medium pebbles | 0.54 | 7.81 | −5.5 | 11.299 |
| Block | NO. | Lithology | Φ (%) | K (mD) | Pore Throat Parameters | Sorting Parameters | Connectivity Parameters | ||||
|---|---|---|---|---|---|---|---|---|---|---|---|
| Rt (μm) | Rm (μm) | Throat Sorting Coefficient | Relative Sorting Coefficient | Pd (MPa) | Sf (%) | Mercury Ejection Rate (%) | |||||
| Ma131 | M139-20 | SC | 8.52 | 0.2 | 0.17 | 0.01 | 3.95 | 0.39 | 0.50 | 69.49 | 35.67 |
| M139-19 | MPC | 8.94 | 0.076 | 0.15 | / | 5.38 | 1.02 | 0.80 | 38.55 | 32.59 | |
| M137-26 | FGC | 8.03 | 0.51 | 0.32 | 0.01 | 4.34 | 0.52 | 0.30 | 62.13 | 38.02 | |
| M139-27 | MPC | 13.3 | 0.27 | 0.37 | 0.03 | 3.47 | 0.36 | 0.30 | 73.64 | 28.45 | |
| M139-14 | SPC | 10.7 | 0.42 | 0.56 | 0.04 | 2.88 | 0.27 | 0.15 | 83.01 | 39.22 | |
| M139-13 | PS | 10.4 | 0.12 | 0.18 | 0.02 | 3.54 | 0.36 | 0.50 | 72.85 | 36.98 | |
| Ma18 | M18-1 | SC | 7.1 | 0.066 | 0.26 | 0.01 | 4.61 | 0.58 | 0.30 | 58.62 | 27.77 |
| M604-2 | MPC | 9.67 | 0.52 | 1.12 | / | 5.37 | 1.06 | 0.08 | 37.83 | 28.39 | |
| M604-5 | SPC | 11.2 | 0.86 | 0.52 | 0.01 | 5.04 | 0.67 | 0.20 | 54.08 | 25.61 | |
| M604-15 | FGC | 7.45 | 0.55 | 0.74 | 0.01 | 4.74 | 0.62 | 0.15 | 58.25 | 23.60 | |
| M604-19 | PS | 8.41 | 0.13 | 0.19 | / | 5.63 | 1.33 | 0.50 | 29.27 | 30.10 | |
| M604-22 | MPC | 11.2 | 0.49 | 1.51 | 0.01 | 4.57 | 0.68 | 0.05 | 55.94 | 17.37 | |
| Max | 14.85 | 3.92 | 1.51 | 0.04 | 5.63 | 1.33 | 0.80 | 83.01 | 39.22 | ||
| Min | 7.04 | 0.05 | 0.15 | 0.01 | 2.88 | 0.27 | 0.05 | 29.27 | 17.37 | ||
| Average | 10.76 | 0.94 | 0.94 | 0.94 | 0.94 | 0.94 | 0.94 | 0.94 | 0.94 | ||
| NO. | Well | Depth (m) | Lithology | >1 μm | 0.5–1 μm | 0.10–0.5 μm | 0.05–0.1 μm | Total |
|---|---|---|---|---|---|---|---|---|
| 1 | M604 | 3921.7 | SPC | 2.89% | 0.08% | 6.35% | 6.45% | 15.77% |
| 2 | M604 | 3925.1 | PS | 0.10% | 8.16% | 0.39% | 0.05% | 8.70% |
| 3 | M139 | 3304.2 | SC | 7.49% | 3.69% | 4.88% | 3.60% | 19.66% |
| 4 | M139 | 3296.2 | MPC | 7.83% | 2.00% | 1.13% | 1.40% | 12.36% |
| 5 | M18 | 3882.5 | SC | 2.62% | 2.05% | 24.11% | 4.94% | 33.72% |
| 6 | M604 | 3929.5 | FGC | 6.67% | 3.11% | 1.41% | 3.91% | 15.10% |
| 7 | M137 | 3256.4 | FGC | 0.02% | 4.98% | 10.76% | 16.12% | 31.88% |
| 8 | M137 | 3249.8 | SPC | 0.39% | 3.83% | 17.37% | 3.16% | 24.75% |
| Max | 7.83% | 8.16% | 24.11% | 16.12% | 33.72% | |||
| Min | 0.02% | 0.08% | 0.39% | 0.05% | 8.70% | |||
| Average | 3.50% | 3.49% | 8.30% | 4.95% | 20.24% | |||
Disclaimer/Publisher’s Note: The statements, opinions and data contained in all publications are solely those of the individual author(s) and contributor(s) and not of MDPI and/or the editor(s). MDPI and/or the editor(s) disclaim responsibility for any injury to people or property resulting from any ideas, methods, instructions or products referred to in the content. |
© 2022 by the authors. Licensee MDPI, Basel, Switzerland. This article is an open access article distributed under the terms and conditions of the Creative Commons Attribution (CC BY) license (https://creativecommons.org/licenses/by/4.0/).
Share and Cite
Li, B.; Sun, L.; Liu, X.; Feng, C.; Zhang, Z.; Huo, X. Effects of Clay Mineral Content and Types on Pore-Throat Structure and Interface Properties of the Conglomerate Reservoir: A Case Study of Baikouquan Formation in the Junggar Basin. Minerals 2023, 13, 9. https://doi.org/10.3390/min13010009
Li B, Sun L, Liu X, Feng C, Zhang Z, Huo X. Effects of Clay Mineral Content and Types on Pore-Throat Structure and Interface Properties of the Conglomerate Reservoir: A Case Study of Baikouquan Formation in the Junggar Basin. Minerals. 2023; 13(1):9. https://doi.org/10.3390/min13010009
Chicago/Turabian StyleLi, Bowen, Linghui Sun, Xiangui Liu, Chun Feng, Zhirong Zhang, and Xu Huo. 2023. "Effects of Clay Mineral Content and Types on Pore-Throat Structure and Interface Properties of the Conglomerate Reservoir: A Case Study of Baikouquan Formation in the Junggar Basin" Minerals 13, no. 1: 9. https://doi.org/10.3390/min13010009