Article

Microfacies Analysis of Mixed Siliciclastic-Carbonate Deposits in the Early-Middle Ordovician Meitan Formation in the Upper Yangtze Platform in SW China: Implications for Sea-Level Changes during the GOBE

1
Institute of Sedimentary Geology, Chengdu University of Technology, Chengdu 610059, China
2
State Key Laboratory of Oil and Gas Reservoir Geology and Exploitation, Chengdu University of Technology, Chengdu 610059, China
3
Chuanqing Drilling Engineering Company Limited Geological Exploration and Development Research Institute, Chengdu 610059, China
*
Authors to whom correspondence should be addressed.
Minerals 2023, 13(10), 1239; https://doi.org/10.3390/min13101239
Submission received: 11 August 2023 / Revised: 18 September 2023 / Accepted: 21 September 2023 / Published: 22 September 2023

Abstract

:
During the Early-Middle Ordovician, the Upper Yangtze Platform experienced extensive development of a distinctive set of mixed siliciclastic-carbonate deposits known as the Meitan Formation. To conduct a comprehensive study of the relationship between mixed sedimentation and sea-level changes, the Hailong section, situated at the southwest margin of the Upper Yangtze Platform in SW China, was selected as the study area due to its typical mixed sedimentary sequence. This section was effectively compared with sections in other regions. Clustering analysis of the point-count groups from the Honghuayuan and Meitan Formations revealed nine microfacies that developed during this period. Such a diverse range of microfacies provides the evidence of frequent sea-level changes in the Yangtze Platform throughout this period. Specifically, two sea-level rises were identified during the early TS.2b and early TS.3b, with the early TS.2b event occurring globally. Furthermore, four sea-level falls were observed in the late TS.2b, TS.2c, TS.3a, and late TS.3b periods. The late TS.2b sea-level fall was globally significant. From TS.2c onwards, distinct variations in sea-level changes among the Yangtze Platform, North China, Baltoscandia, Australia, and North America emerged due to alterations in the paleogeographic pattern. By comparing the sea-level curves in the Upper Yangtze Platform with the diversity curves of chitinozoans, acritarchs, and brachiopods, it became evident that environmental changes played a crucial role in the Great Ordovician Biodiversification Event (GOBE), especially during the Floian. The rising sea level and increased detrital materials fostered the development of diverse habitats, prompting organisms to adapt to varying environments. In general, rising sea levels favored increased brachiopod diversity, while falling sea levels favored enhanced planktonic diversity among chitinous and acritarch species. By shedding new light on the relationship between Ordovician sea-level changes and biodiversification in the Yangtze region, this study offers a fresh perspective on the subject from the microfacies analysis.

1. Introduction

The Ordovician period has been regarded as an exceptional epoch in the Earth’s evolutionary history, distinguished by momentous global transformation and a distinctive paleogeographic framework [1,2,3,4,5]. In particular, the Great Ordovician Biodiversification Event (GOBE) during the Ordovician period has attracted widespread scholarly attention [6,7,8,9,10,11,12,13,14,15,16]. This extraordinary biological radiation event has been characterized by diversity, episodicity, and divergence [12,13].
In recent years, extensive discussions have been published concerning the causative factors and environmental context of the Great Ordovician Biodiversification Event (GOBE) [9,17]. Diverse perspectives have been proposed for the GOBE such as an intense volcanic activity [18], alterations in seawater properties [11,19], and increases in primary productivity [20,21] that may have affected the occurrence of the remarkable Ordovician biological radiation. Rothman [22] and Cornette et al. [23] proposed a new idea for exploring the environmental context of the biological radiation in the Ordovician and the interactions between biological differentiation and geochemical cycle in the Phaneozoic. In addition, considerable attention has been devoted to the investigation of the relationship between global sea-level changes and this biological radiation event [24,25,26]. The rise and fall of the global sea level have a profound influence not only on the physical properties of the ocean (such as water depth, light transmittance, seawater circulation, geological properties of the ocean water), but also on the chemical and biological properties of the ocean (such as nutrient content, oxygen content, and primary productivity) [27,28]. Detailed studies of sea-level changes may hold immense potential for revealing biodiversity patterns, adaptive radiation dynamics, and their influencing factors [29,30].
The temporal dynamics of radiation during the Ordovician exhibit species-specific variations [17]. For example, when examining the radiation evolution of the Ordovician brachiopods in South China, the first peak of taxon diversity was observed within the Didymograptellus eobifidus graptolite zone in the early-middle Floian [13]. Around the first peak of the GOBE, the Meitan Formation was extensively developed on the Upper Yangtze Platform [13,31]. The Meitan Formation belongs to the late Early Ordovician, and its name originated from the Meitan Shale named by Yu Jianzhang in 1933, which was later changed to Meitan Formation by Zhang [13]. Several thousand meters of the Meitan Formation, which is characterized by the alternation of mud shale and limestone, is distributed several thousand meters from east to west on the Upper Yangtze Platform [25]. Because of such a thick and wide range of fine-grained deep-water sediments, in recent years, the Meitan Formation has been used as a potential source rock of Ordovician hydrocarbon systems in the Sichuan Basin in the Upper Yangtze Platform. The Meitan Formation is an equivalent stratigraphic to the Dawan and Zitai Formations, which are widely distributed in the Lower Yangtze Platform. These formations were deposited from the Late Floian to the Early Darriwilian [32,33]. The wide distribution and fossil-rich contents of the Meitan Formation have served as an exceptional resource for extensive biostratigraphy and paleobiology studies. Investigations in biostratigraphy and paleobiology have focused on various organisms, including brachiopods, graptolites, chitinozoans, and trilobites [34,35,36,37,38,39]. The presence of diverse sedimentary facies within the Meitan Formation has further enhanced its value as an invaluable material for studying the Ordovician biological radiation events and sea-level changes [30,33]. To investigate sea-level changes during the GOBE, the Hailong section, situated at the southwest margin of the Upper Yangtze Platform, was selected. The Upper Yangtze Platform in South China forms an uninterrupted and comprehensive stratigraphic sequence that comprises clastic and carbonate deposits from the Ordovician [40]. This region, specifically Zunyi City in Guizhou Province, offers a remarkable advantage for sample collection due to the presence of a well-preserved and complete stratigraphic profile, along with a wealth of fossil assemblages. In addition, previous detailed studies of the Ordovician biostratigraphy (graptolite zone) within this region have established a robust foundation for this study [36].
With the application of a quantitative microfacies analysis, this study aimed to explore the sedimentary environment of the Meitan Formation and discern its change patterns. Moreover, the research endeavor involved the recovery of high-frequency sea-level change curves, which were subsequently compared with sea-level change events documented in North China, Northern Europe, Australia, and North America. Compared to previous studies, which tended to focus on large-scale sedimentary facies of Ordovician, the study provided a foundation for further research on Ordovician biogenic radiation. In particular, it sheds light on the synergistic relationship between the evolution of marine biodiversity and paleoenvironmental changes.

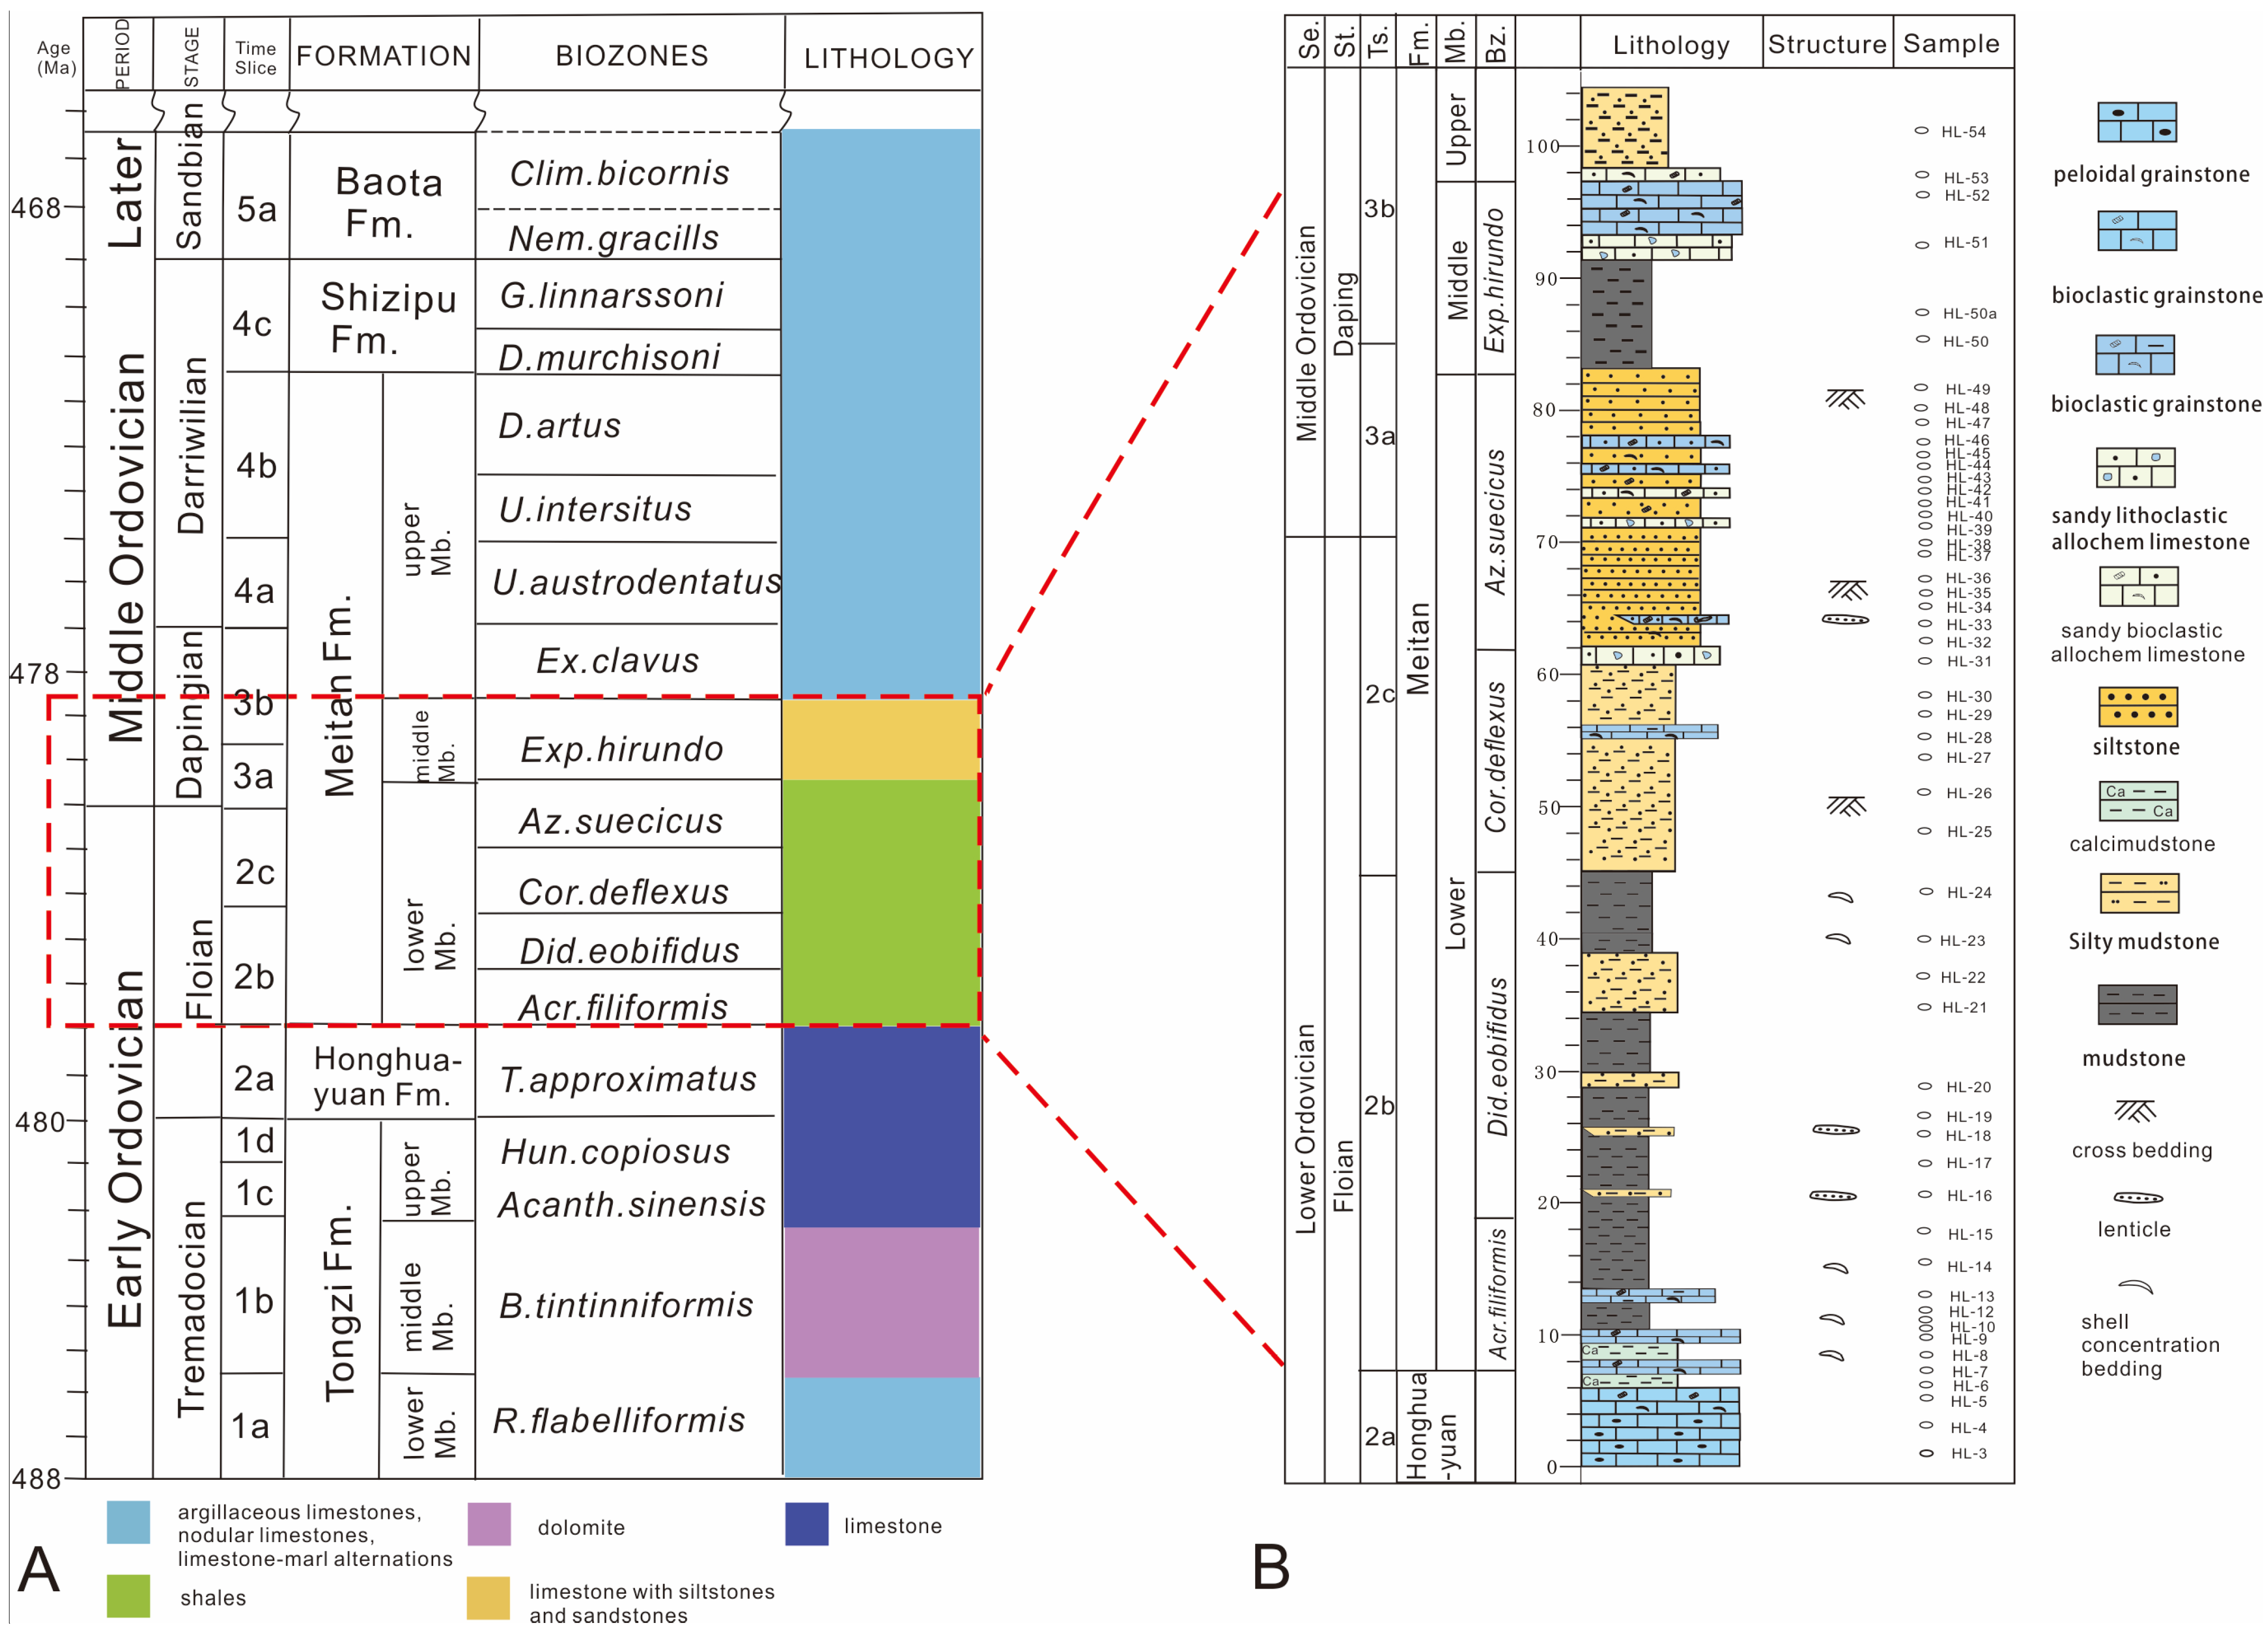
2. Geological Setting

The South China Plate (18–26.5° N, 104.5–117° E), which is recognized as one of the foremost tectonic entities in China, experienced relative stability throughout the Ordovician period [3]. During 490~520 Ma, with the rifting of the Gondwana supercontinent, the South China Plate migrated southward, culminating in a notable paleogeographic repositioning from 30 degrees south latitude to proximity with the paleoequator by the end of the Ordovician epoch (Figure 1A) [2,41]. The South China Plate is surrounded by other plates: the North China Plate to the north, the Kunlun–Tibet Domain to the northwest, and the Cathaysian Block to the southeast (Figure 1B). On this basis, the South China Plate can be subdivided into the Yangtze Shelf, Jiangnan Slope, and Zhujiang Basin. These three regions exhibit a parallel alignment along the northeast–southwest direction, with the sedimentary environment progressively deepening towards the southeast (Figure 1C). The Ordovician in the Yangtze region, in the northwest of South China, is characterized by the development of carbonates and occurrences of benthic shelly faunas. The Jiangnan region is typified by the intercalation of mudstone, shale, and carbonates [31].
In the Early Ordovician period, due to the stable tectonic activity and low paleogeographical latitude, the Yangtze Platform had a relatively flat topography in normal marine, shallow-water environments, with a warm climate that fostered abundant life forms [42]. The benthic realm thrives with diverse crustaceans, brachiopods, trilobites, and echinoderms. In addition, conodonts and graptolites are often used as indicators of regional divisions and correlations of biological substrata [21]. During this period, owing to a clean, bright, warm-water environment, carbonate strata represented by the Honghuayuan Formation were developed in the Upper Yangtze Platform, belonging to the platform-type carbonate deposition. In the Late Early Ordovician, with rising sea level and increasing detrital materials, the mixed siliciclastic-carbonate sediments of the Meitan Formation replaced the limestone of the Honghuayuan Formation. Shallow marine platforms and reefs are drowned when rising sea level or tectonic subsidence outpaces carbonate accumulation and benthic carbonate production ceases, and the sedimentary pattern shifts to a ramp [40].
The stratigraphic ages applied in this study are as follows (Figure 2A). Within the Yangtze Platform, the Ordovician system is divided from bottom to top into the Tongzi Formation, Honghuayuan Formation, Meitan Formation, Shizipu Formation, Baota Formation, and Wufeng Formation [43]. Positioned above the Honghuayuan Formation and below the Shizipu Formation, the Meitan Formation has a crucial stratigraphic position. The lithology of the Honghuayuan Formation is predominantly composed of thick bioclastic limestone, while the Meitan Formation is formed by the occurrence of shale. Furthermore, the Meitan Formation is divided into three members from bottom to top [33], including (1) gray-yellow sandy shale with a thin sandstone layer, and some fine-grained sandstones with wrinkle structures; (2) gray-black shale and gray, thinly laminated argillaceous limestone, accompanied by dark gray nodular limestone, which is commonly known as “Middle Member Limestone”, and (3) gray-yellow, gray-green, and blue-gray interbedded silty shale and limestone [33,40]. The upper and lower members are primarily composed of fine-grained clastic rocks with a consistent lithological composition. The middle section is dominated by limestone, which exhibits increasing thickness along the Zunyi–Meitan–Shiqian line in northern Guizhou, gradually transitioning with the Dawan Formation that is composed of mudstone. These lithologies suggest frequent changes in the Ordovician depositional environments, which provide excellent material for the study.

3. Materials and Methods

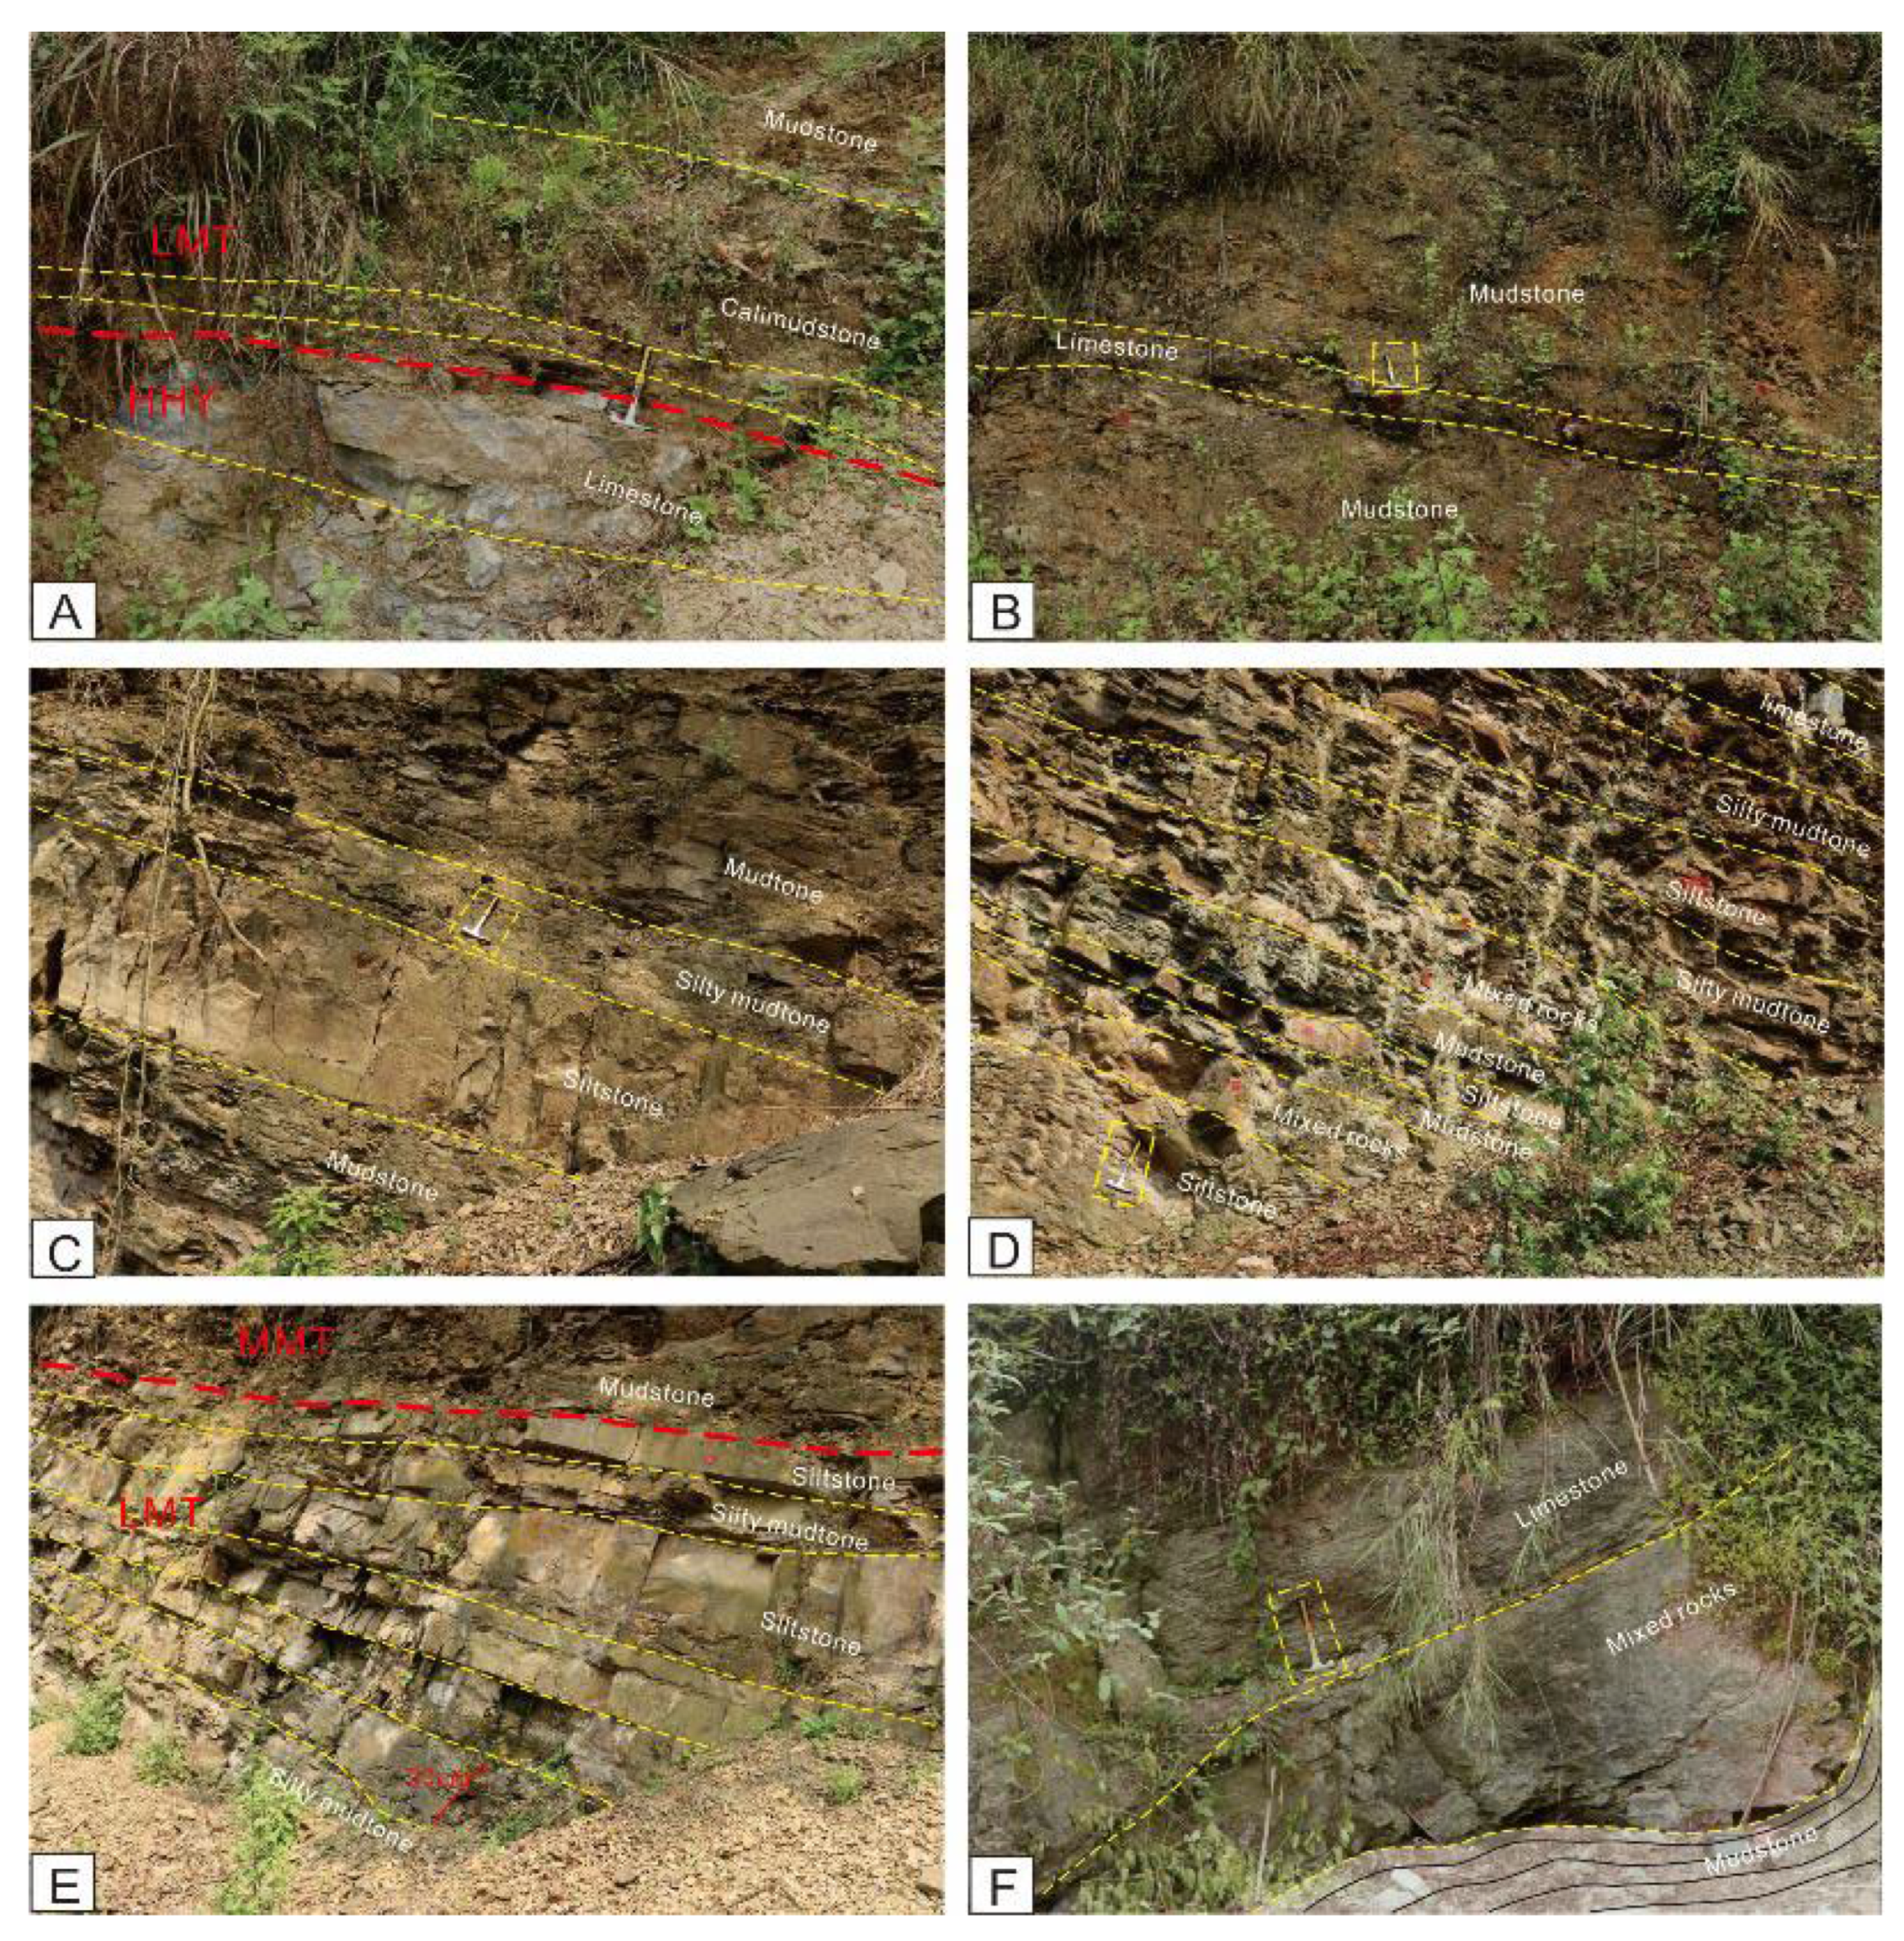
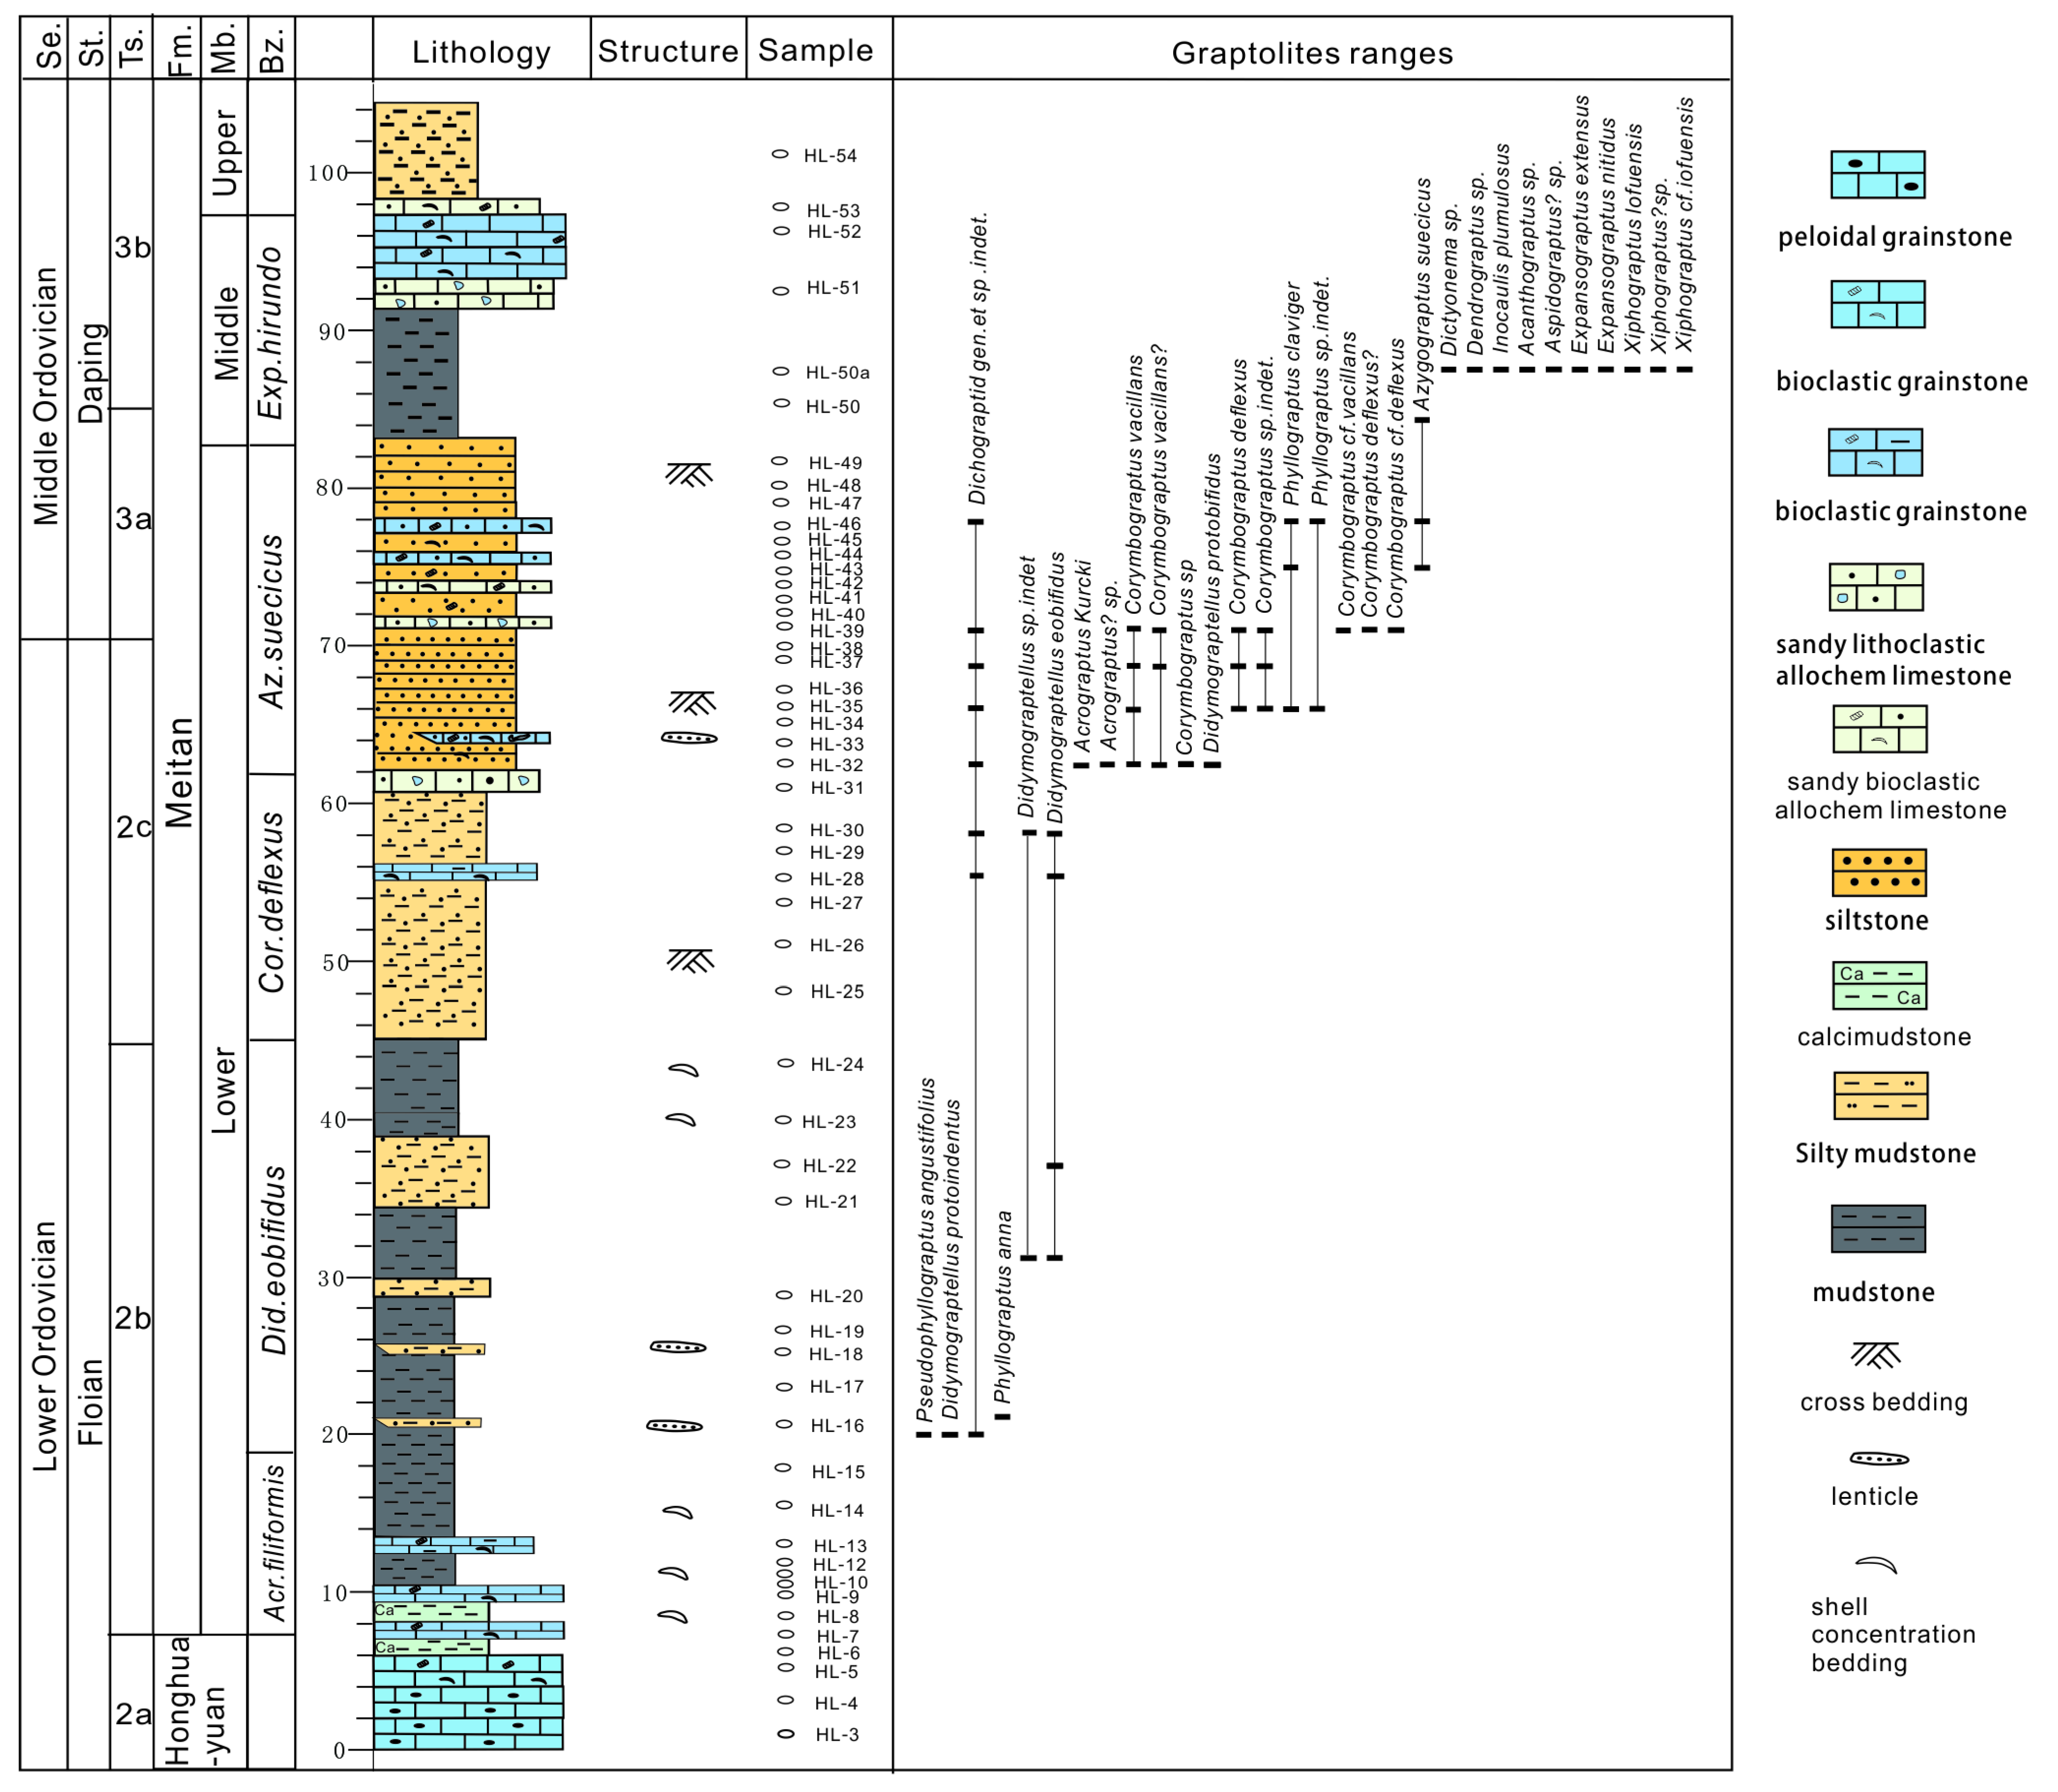
3.1. Research Section

The Hailong section (27°43′56.52″ N, 106°53′23.67″ E) is situated near the Hailong Reservoir, Gaoqiao Town, Zunyi City, Guizhou Province (Figure 1D). This section has a relatively complete Ordovician sequence, which is well exposed along the valley [36]. Within the Hailong section, the profile of the Honghuayuan Formation exhibits an approximate exposure of 5 m and is mainly composed of thick limestone. The occurrence of calcimudstone serves as a mappable and stratigraphic boundary between the Meitan and Honghuayuan Formations (Figure 3A). The Lower Meitan Formation within this profile primarily consists of yellow-green and gray-green mudstones, intermingled with limestone (Figure 3B). It further presents interbedded siltstone and mudstone layers (Figure 3C) extending to a thickness of approximately 72 m. The Middle Meitan is characterized by a combination of limestone and mudstone, with a layer of yellow-green mudstone at the bottom (Figure 3E), spanning a thickness of approximately 18 m. In addition, the “Middle Member Limestone” in the Middle Meitan of the Hailong section comprises a mixture of limestone and mixed rocks (Figure 3F). The Upper Meitan Formation is mostly concealed or covered.
Zhang et al. [36] conducted a preliminary classification of the graptolite sequence within the Meitan Formation in this section (Figure 4). The graptolite zone comprises Tetragraptus approximatus in the upper part of the Honghuayuan Formation and Acrograptus filiformis in the upper part of the Meitan Formation. Didymograptellus eobifidus, the lower part of Azygograptus suecicus, and the Expansograptus hirundo zone are in the middle part of the Meitan Formation. In this study, we used the time scale based on the graptolite zones.
Sampling was conducted in fresh materials, and all veins were avoided for contamination. Fifty-three samples were sampled following their lithology, sedimentary structure, and particle size on outcrop sections. Two samples were collected from the Honghuayuan Formation, 26 samples from the Lower Meitan Formation, and 23 samples from the Middle Meitan Formation. All sample locations are labelled in Figure 2B. Thin sections were made for petrography and microfacies analysis under binocular microscopes. Carbonate thin sections were stained with Alizarin Red S (ARS) in order to differentiate between dolomite and calcite. Petrography was conducted in the State Key Laboratory of Oil and Gas Reservoir Geology and Exploration, at the University of Technology of Chengdu, Chengdu, China. For more information about the lab, please visit: https://sklg.cdut.edu.cn/kycg/lw.htm, accessed on 1 May 2023.

3.2. Point-Count Groups

The components (particle, matrix, and cement) developed in carbonate rocks were categorized into different point-count groups [44,45,46,47,48]. The point-count groups adopted in this study are listed in Table 1.
Each group has a unique definition, bearing paleoenvironmental significance. SPSS software (version 20.0) was applied to calculate the correlation coefficients among the groups (Table 2). A detailed discussion is presented in the following section.

3.3. Cluster Analysis

Numerous previous studies have applied cluster analysis to distinguish carbonate microfacies [46,49,50,51,52,53,54]. Cluster analysis has demonstrated its practicality in sedimentary settings on ramps that do not fit the general microfacies model [48].
In this study, the point-count method was applied for quantitative statistical analysis of all 53 thin sections, with the point count group as the clustering variable. Ward’s method and square Euclidean distance, which have been applied in the interpretation of sedimentary microfacies by previous studies [25], were adopted as the similarity index, and SPSS 20.0 software was employed for cluster analysis. The data preprocessing steps and statistical software parameters that were used followed references [25,55].

4. Results

In this study, the classification of carbonate microfacies relied mainly on the sedimentary structures proposed by [56]. The approach to the classification of mixed rock depends on the amount of the four components: (1) siliciclastic sand, (2) siliciclastic mud, (3) carbonate sand (allochems), and (4) carbonate mud (micrite) [57]. Nine microfacies (MF) were defined by petrography and on the cluster analysis. They include peloidal grainstone (MF-1), bioclastic grainstone (MF-2), bioclastic packstone (MF-3), sandy lithoclastic allochem limestone (MF-4), sandy bioclastic allochem limestone (MF-5), sandstone (MF-6), calcimudstone (MF-7), silty mudstone (MF-8), and mudstone (MF-9). This classification is less dependent upon genetic criteria. The Standard Microfacies (SMF) types and Facies Zone (FZ) described in [48] were applied for the comparison with the microfacies. Following previous investigations on the depositional model of the Meitan Formation [30], the different environments were delineated based on the microfacies (MF) analysis, as shown in Figure 5.

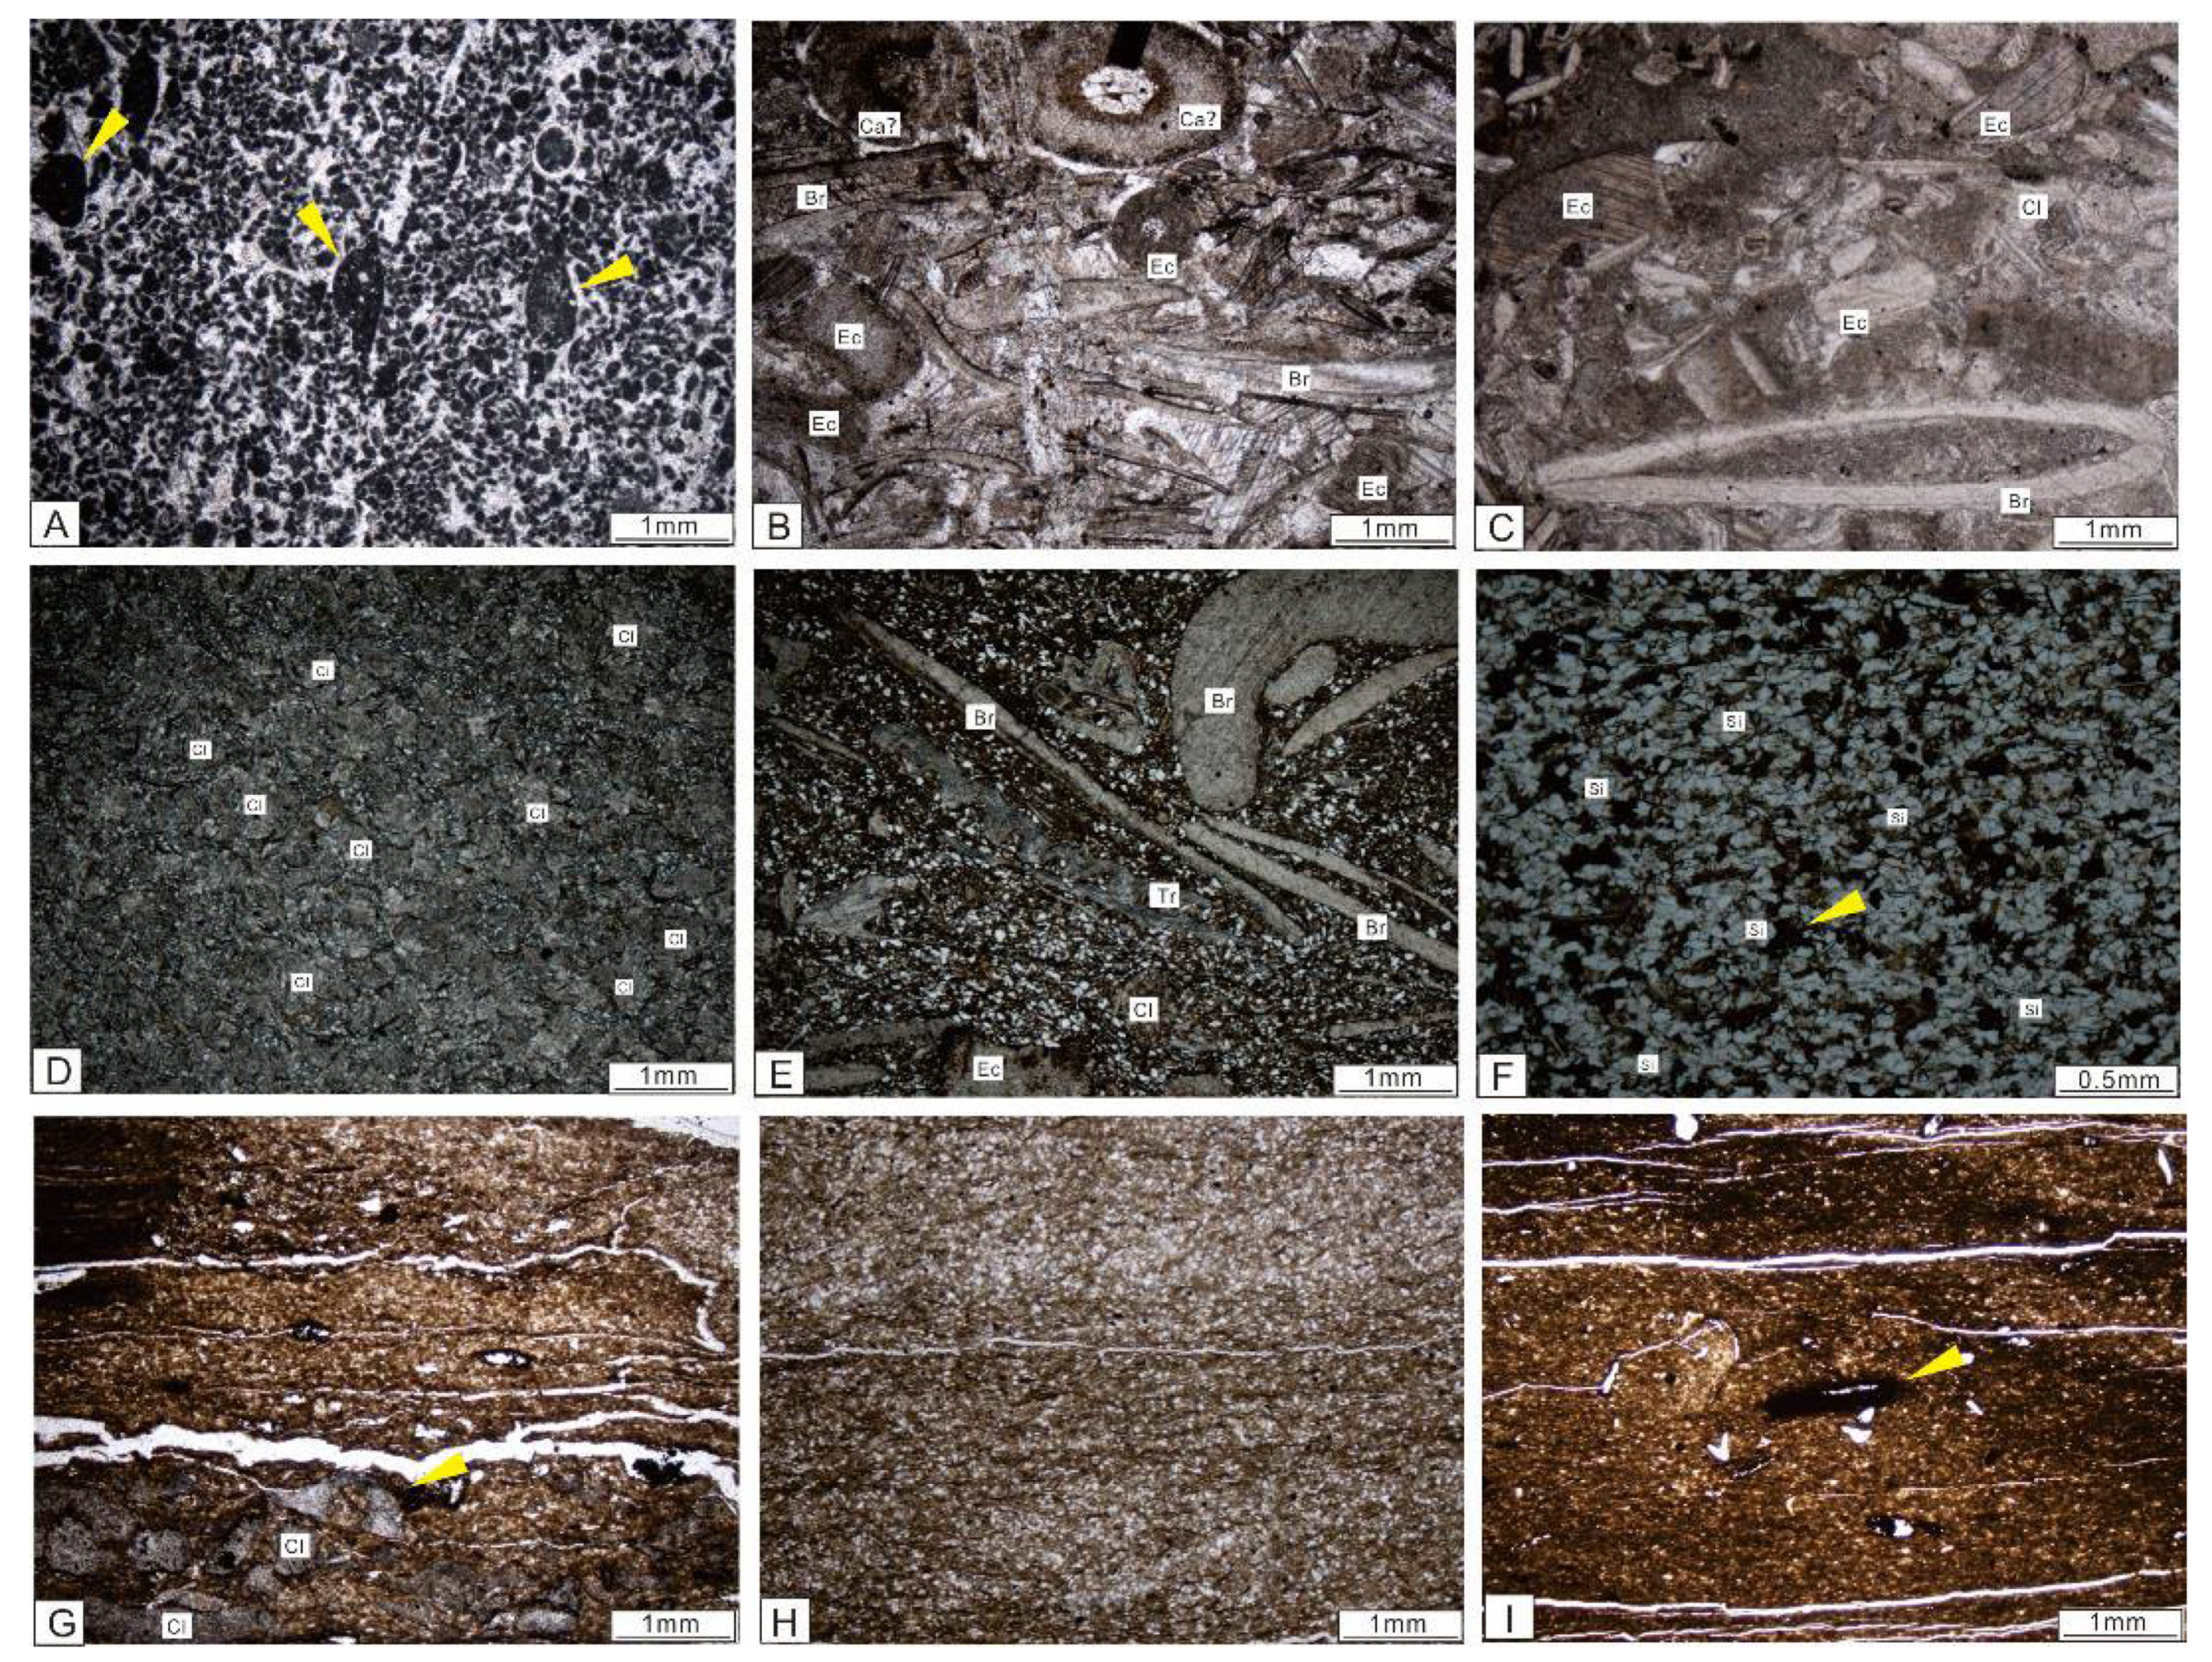
4.1. MF-1 Peloidal Grainstone

MF-1 Peloidal grainstone is composed mainly of calcite. This microfacies is grey grainstone predominantly developed in the Honghuayuan Formation. As shown in Figure 6, the peloidal grainstone exhibits high levels of peloids (60.5%) and sparite (33%). It is particularly prevalent in Early Paleozoic shelf-phase carbonates [19,48]. The peloidal grains are mainly composed of micrite and ranged in size from 0.1 mm to 0.2 mm. Moreover, a few larger peloidal grains (0.8–1 mm) contained smaller sparite grains (Figure 7A).
Depositional environment: The abundance of peloidal grains indicates deposition in shallow and moderately turbulent environments, mostly shallow subtidal and inner ramp settings (FZ7), comparable to SMF-16.

4.2. MF-2 Bioclastic Grainstone

MF-2 Bioclastic grainstone is composed mainly of calcite. This microfacies is grainstone that mainly developed in the Honghuayuan and middle of the Meitan Formation. As shown in Figure 6, the main components of this microfacies are bioclasts (58.3%) and sparite (28.5%). The bioclasts include brachiopods, echinoderms, and Calathium, which is the main reef-building organism [58,59]. The well-preserved internal structure of the skeletal remains indicates limited particle transportation over long distances, whereas the bright sparite indicates a high hydrodynamic energy level (Figure 7B).
Depositional environment: This microfacies is characterized as shallow water with high-energy hydrodynamic energy levels, located near the fair-weather wave base, mainly affected by the shallow subtidal zone and the inner-middle ramp zone.

4.3. MF-3 Bioclastic Packstone

MF-3 Bioclastic packstone is composed mainly of calcite. This microfacies is packstone that is mainly composed of bioclasts (43%), micrite (24.7%), and clasts (18.3%) (Figure 6). The bioclasts consisted of echinoderms, trilobites, and brachiopods, which indicate normal seawater salinity and temperature conditions. Well-preserved brachiopods with a high micritic content demonstrated a lower hydrodynamic energy level (Figure 7C). The sedimentary environment is characterized by normal seawater salinity.
Depositional environment: Compared with MF-2, the depositional environment of MF-3 shows a decrease in the hydrodynamic energy level and is mainly located near the fair-weather wave base in proximity to the middle ramp zone.

4.4. MF-4 Sandy Lithoclastic Allochem Limestone

MF-4 Sandy lithoclastic allochem limestone is composed mainly of calcite and quartz. The particles mainly consist of internal clasts (48.3%), weakly consolidated carbonate cuttings, and high sand content (20%) that mainly contains quartz grains. MF-4 belongs to the mixed environment of siliciclastic and carbonates [60]. Mixed sediments signify a transitional record depicting the lateral gradation between carbonate and siliciclastic facies [59]. The shallow-sea carbonate rocks provided abundant clastic carbonates to the shelf sedimentary system. The coexistence of abundant carbonate rocks and terrigenous quartz indicates the influence of turbulent water on microfacies.
Depositional environment: The depositional environment of MF-4 is associated with the topography of the granule beach facies (FZ6) that is situated in close proximity to the middle ramp.

4.5. MF-5 Sandy Bioclastic Allochem Limestone

MF-5 Sandy bioclastic allochem limestone is composed mainly of calcite and quartz. MF-5 belongs to a mixed environment that comprises both siliciclastic and carbonates, with bioclasts (40%) and sand (32%) being the dominant grain types (Figure 6). The main mineral composition is calcite and quartz. The skeletons within this microfacies are well preserved, mainly consisting of brachiopods, which exhibit high adaptability to mixed environments. A minor amount of intra-carbonate debris is also observed (Figure 7E).
Depositional environment: Microfacies is commonly encountered in shallow water that is characterized by the dominance of terrigenous sand. Within this environment, diverse assemblages of organisms, such as mollusks, foraminifera, bryozoans, brachiopods, echinoderms, and calcareous algae, coexist with terrigenous sands, facilitated by burrowing organisms and weak tides or ocean currents [60]. The microfacies is mainly developed near the middle ramp that is primarily located between the fair-weather wave base and the storm wave base.

4.6. MF-6 Sandstone

MF-6 Sandstone is composed mainly of quartz. MF-6 is mainly composed of 76.2% sand, 9.8% micrite, and 7.2% mud (Figure 6). The sandstone exhibits a uniform grain size that ranges from 0.05 mm to 0.1 mm, excellent sorting, and intergranular spaces filled with micrite and organic matter mud (Figure 7F).
Depositional environment: MF-6 can be characterized by a high silica content and a low benthic presence, mainly situated in the middle ramp-outer ramp zone.

4.7. MF-7 Calcimudstone

MF-7 Calcimudstone is composed mainly of calcite. This microfacies mainly occurs at the boundary of the Meitan and Honghuayuan Formations. As shown in Figure 7G, it is mainly composed of micrite (95%), along with a few organisms and the development of hardbottom structures. These features indicate a rapid rise in sea level and a decrease in sedimentation rate [48]. Furthermore, this microfacies is comparable to SMF-2.
Depositional environment: This microfacies represents a deep-water basin, open shelves, and slopes of deep-water shelves in an outer ramp setting [30].

4.8. MF-8 Silty Mudstone

MF-8 Silty mudstone consists mainly of clay minerals (55.3%) and quartz particles (26.9%) with a particle size smaller than 0.05 mm, and stratification (Figure 7H). The microfacies is common in the Meitan Formation, particularly in the interior of the Sichuan Basin, where intact fossils, specifically brachiopods, are observed in the field preserved in this microphase [38].
Depositional environment: Compared to MF-6, the depositional environment of MF-8 is characterized by a significantly higher argillous content, which indicates a deeper sedimentary environment setting, This environment is supported by the presence of intact biota observed in the field section, which suggests a deep-water shelf environment (FZ2).

4.9. MF-9 Mudstone

MF-9 Mudstone is mainly composed of clay, which exhibits a minimal presence of bioclasts both in the field and under microscopic examination. With a transition towards MF-8, the quartz content increases.
Depositional environment: This microfacies is typically located below the storm wave base, frequently occurring in a relatively deep basin, open shelves, and the lower regions of slopes within deep-water shelves, with depths ranging from hundreds to thousands of meters (FZ1).

5. Discussion

In this section, the correlation between point-counts and their implications for microfacies are explained. Sequences of microfacies are then interpreted. Sea level curves were plotted according to the variations between them, and compared with other areas on the graptolite zone. Further, by comparing the changes in sea level curves and palynological curves with previous studies, the causes of sea level and environmental changes affecting biogenic radiation are analyzed in the following section.

5.1. Point-Count Groups

The components of carbonate and siliciclastic-carbonate mixed rocks provide valuable insights into the sedimentary paleoenvironment [48]. To conduct a cluster analysis, the microfacies were divided into point-count groups based on their natural characteristics. Potential relationships between different groups are identified by calculating the correlation coefficients of the cluster information. For example, Table 2 demonstrates a significant positive correlation between sparite and bioclasts, as well as between sparite and peloids (0.37 and 0.36), indicating a shared depositional environment. Sparite, considered to be a depositional product of high hydrodynamic conditions [48], indicated that the bioclasts and peloids were also deposited in this environment. In contrast, micrite formed under low hydrodynamic conditions presented a negative correlation with sparite (−0.43). Meanwhile, muds that are often considered to have been deposited in deep-water basins beneath storm-save basins demonstrated significant negative correlations with peloids, bioclasts, clasts, and sparite (−0.39, −0.41, −0.45, and −0.49), suggesting that these carbonate-related sediments were less likely to be preserved in deep-water environments. Clastic sands originating from terrestrial sources were positively correlated with micrite (0.32) and negatively correlated with sparite (−0.35), suggesting that the mixed depositional environments with high land-sourced inputs could favor micrite deposition over sparite. These point-count groups as indicators of paleoenvironments are useful for identification of microfacies; therefore, through clustering analysis, uncorrelated information was removed, enabling a more precise delineation of the microfacies and sedimentary associations, thereby enhancing the interpretation of the depositional environment.

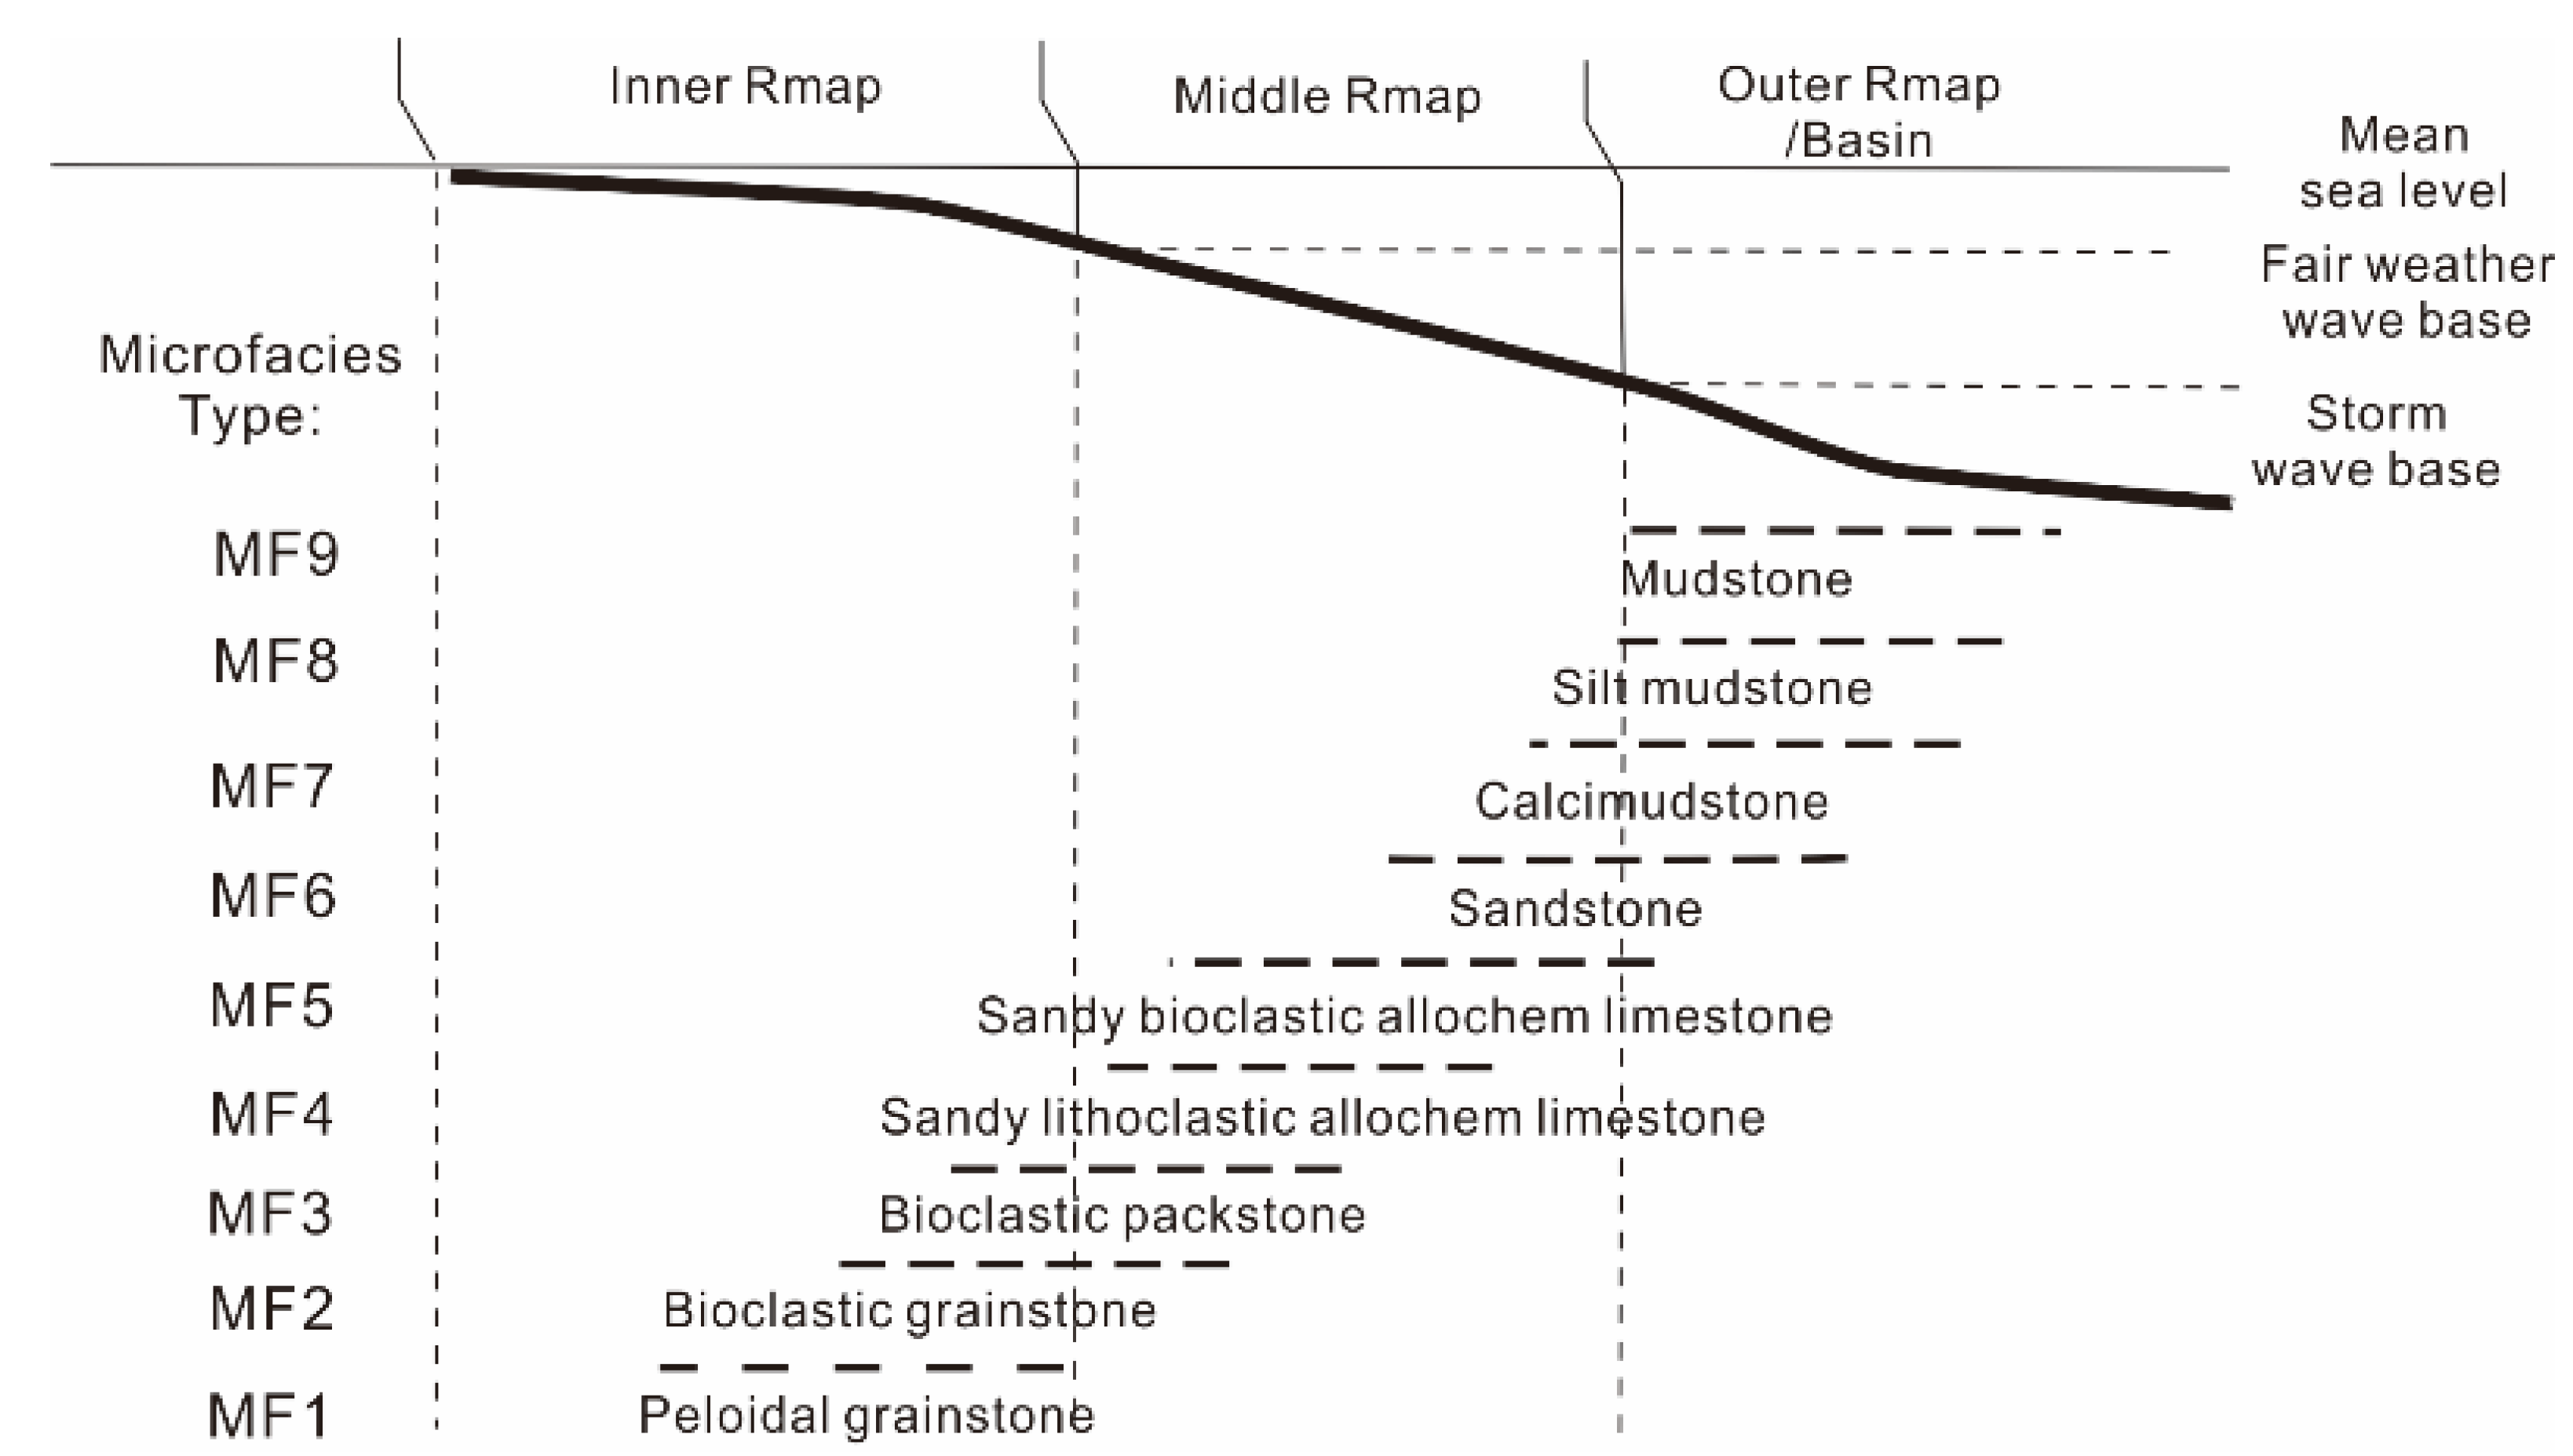
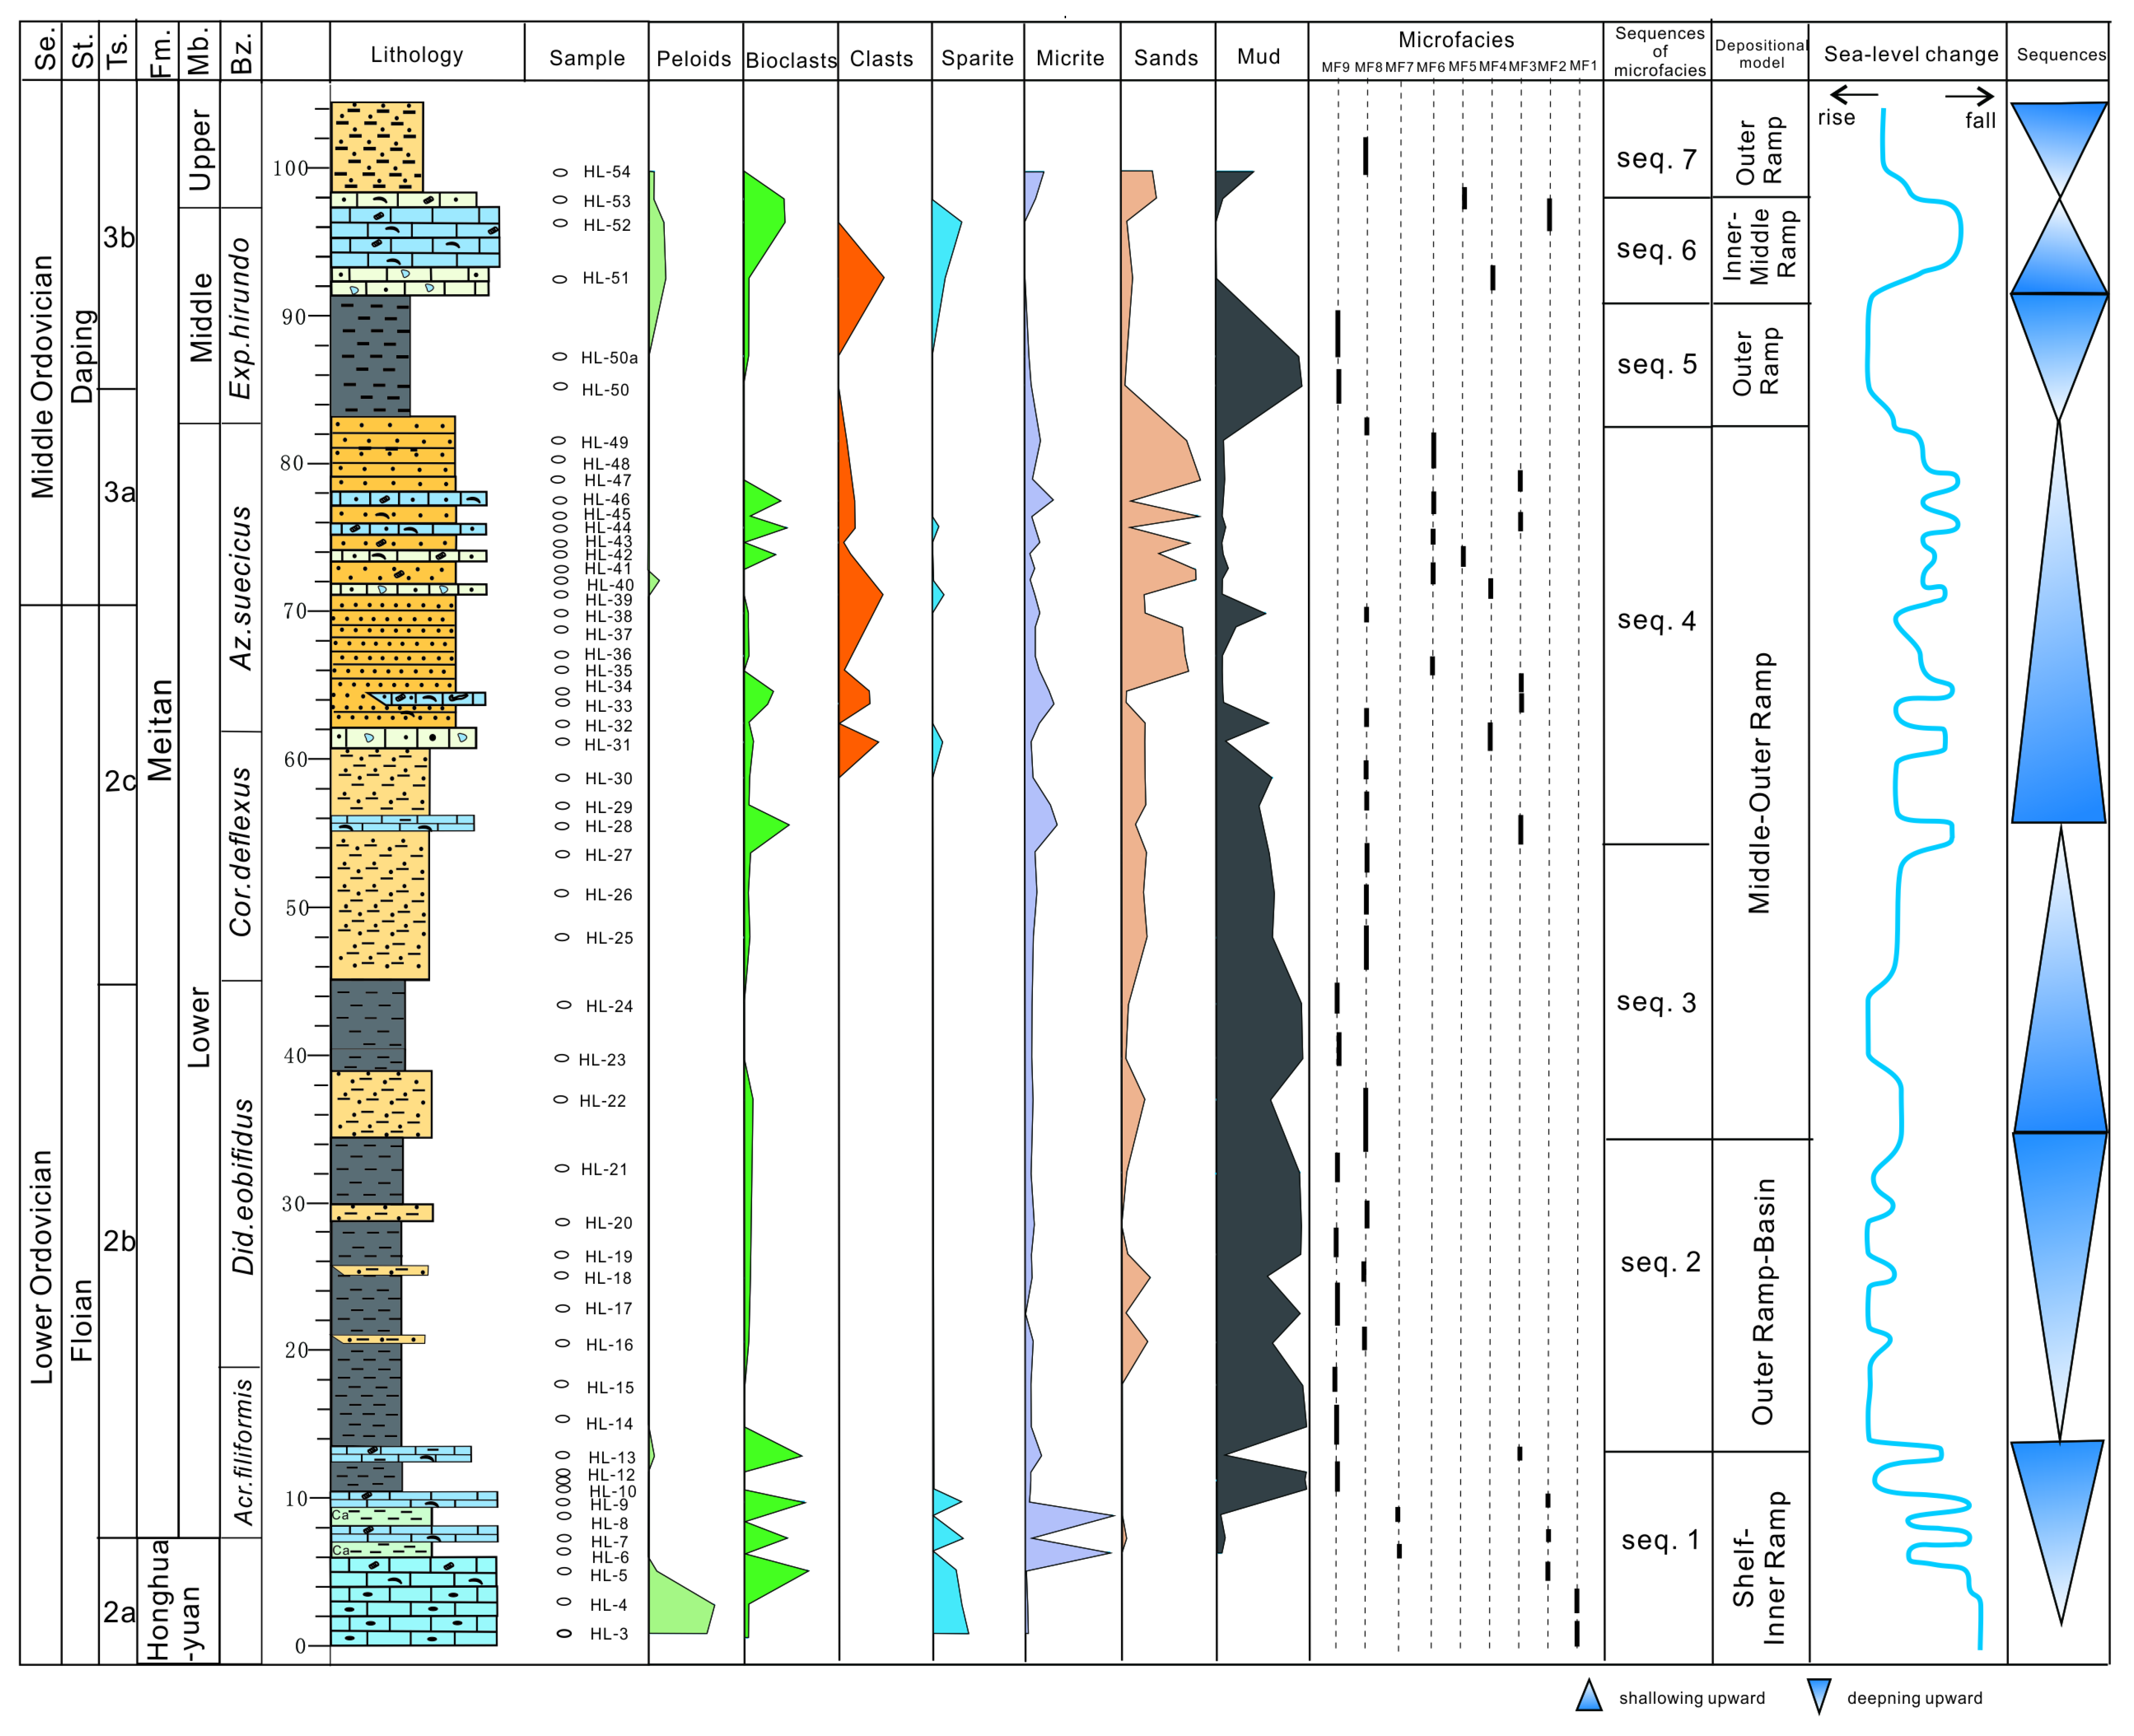
5.2. Sequence of Microfacies

Seven sequences of microfacies (Seq.1–Seq.7) were identified based on the hierarchy of microfacies stacking patterns that reflect correlative environments (Figure 8). Each sequence of microfacies represents a shallowing-upward or deepening-upward cycle. The shallowing-upward cycles are mostly composed of upper members in the given hierarchy (Figure 4) at the bottom, lower members in the given hierarchy at the top. The deepening-upward cycles are mostly composed of lower members in the given hierarchy at the bottom, and upper members in the given hierarchy at the top.
Sequence 1 is made up of MF1 and MF2, characterized by thick-bedded peloidal and bioclastic grainstones, respectively, which are all commonly observed along a shallow water (tropical) carbonate shelf. Sequence 1 is considered to be a period of highest sea level. Sequence 2 mainly contains MF8 and MF9; these microfacies indicate a deep-water deposition that was dominated by mud crystals and clay minerals. The base of sequence 3 consists of MF8, that grades to MF6 in the upper part. Compared to sequence 2, sequence 3 shows an increasing trend in sand content. This sequence recorded a sea-level rise. Sequence 4 is made up of MF4, MF5, and MF6, which indicate a mixed carbonate-siliciclastic sedimentation. Carbonate was deposited during a sea-level rise. Sequence 5 mainly contains MF9, which indicates a deep-water deposition. This sequence is considered to represent a period of low sea level. The upper and lower parts of sequence 6 are characterized by MF4 and MF5, which were deposited on an extensive carbonate ramp after a marine transgression. Sequence 7 mainly contains MF8. Compared to sequence 6, sequence 7 shows a high sand content.

5.3. Drowning of the Carbonate Platform and Shelf-Ramp Transition

Sequence 1 (0–8 m) occurs in the Hunghuayuan Formation and the base of the Meitan Formation. The sequence represents a carbonate ramp that was formed by peloidal and bioclastic grainstones. The Lower Meitan Formation (8–70 m), consists of sequence 2 and sequence 3. The transition from sequence 1 to sequence 2 represents drowning of the carbonate platform. Disappearance of carbonate grains, occurrence of muddy and silty shales, and fossil-rich layers of benthic brachiopods, indicate a significant change in the depositional environment from an open platform to an external ramp-basin deposition. This environmental change has been extensively documented in the Yangtze Platform, and it may be linked to a carbonate terrace inundation event during the transition from the Honghuayuan to the Meitan Formation, mainly driven by sea-level rise [25,30]. In the Upper depositional phase of the Lower Meitan Formation, sequence 4, which is characterized by siliciclastic debris and siliciclastic-carbonate debris (MF-4 to MF-6), is marked by a gradual transition from an outer ramp environment to a mixed middle-outer ramp.
Following the occurrence of sequence 5 (83–90 m) in the Middle Meitan Formation, the deposition and development of the bioclastic grainstone known as the “Middle Member Limestone” (MF-2) occurred, accompanied by transitional microfacies MF-4 and MF-5 with mixed depositional characteristics (sequence 6). A detailed study of the middle tuff section of the Meitan Formation in the Fenggang Tongkara section of the Upper Yangtze Platform suggests warm and shallow water depositional environments, consistent with those observed in the Hailong section. The depositional environment gradually transitioned from an outer ramp environment to a middle ramp–inner ramp environment. The Upper Meitan Formation consists of a return to an outer ramp environment dominated by MF-8 (sequence 7).

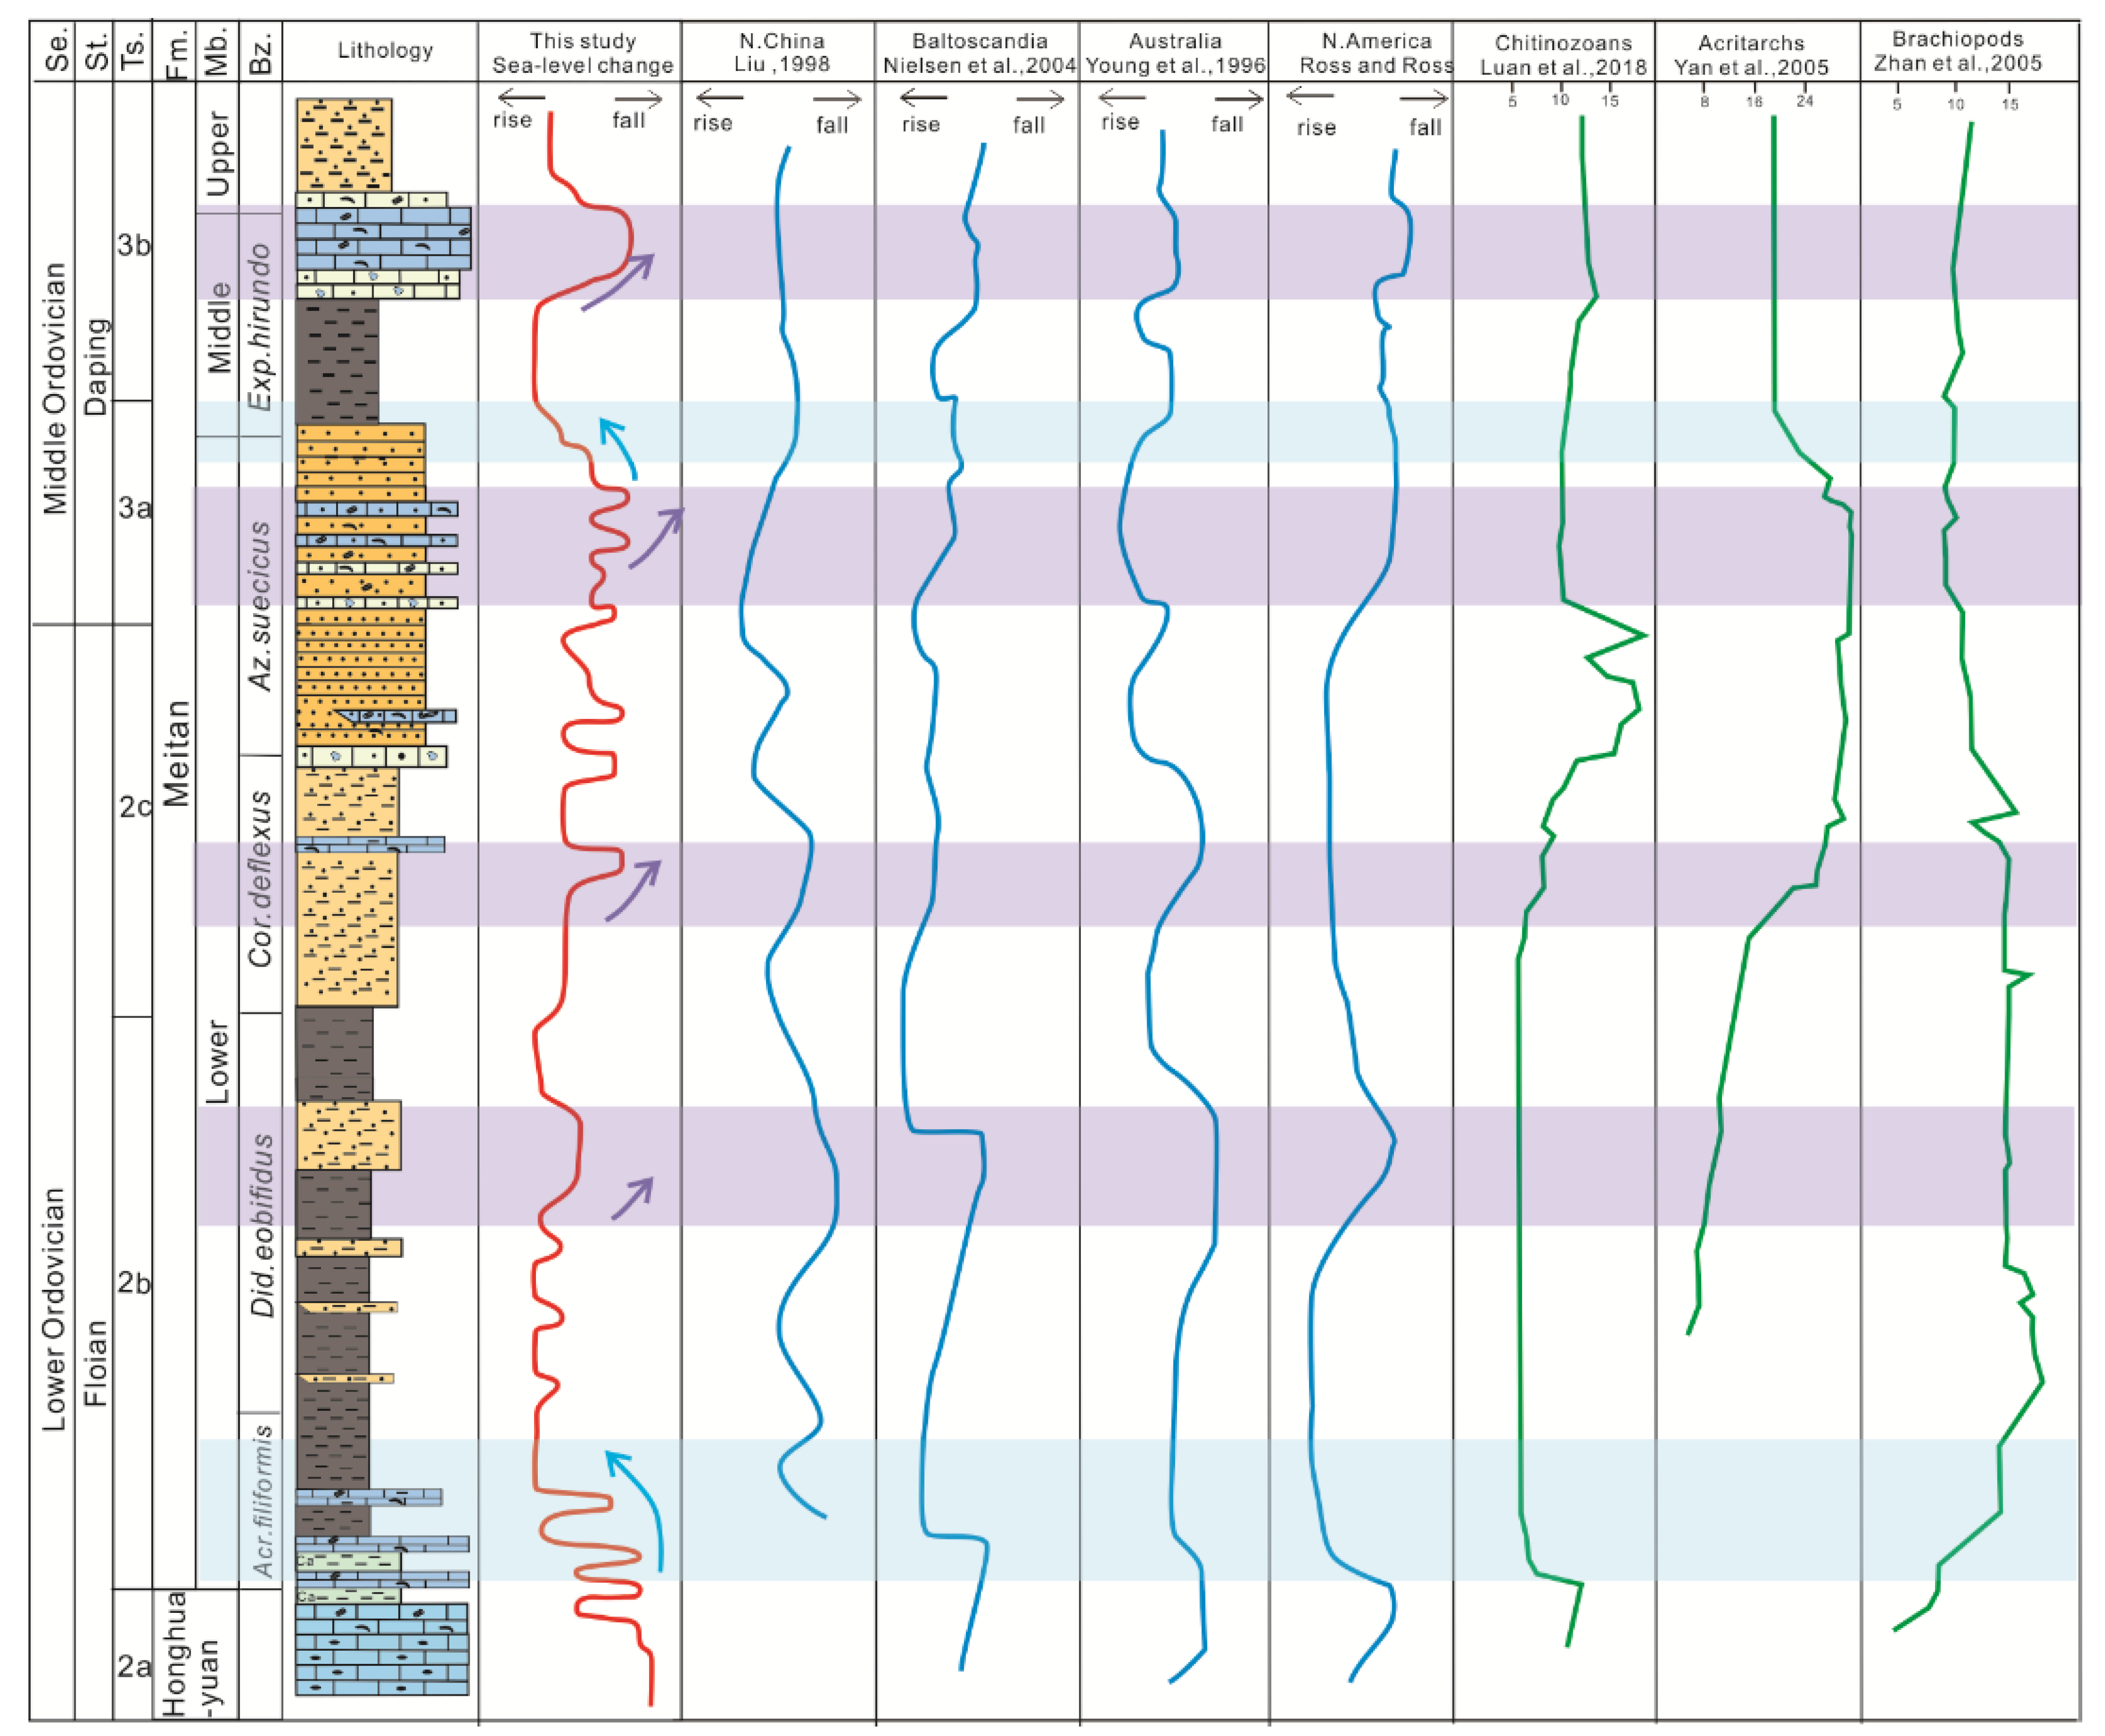
5.4. Sea-Level Changes in the Upper Yangtze Platform and Global Sea-Level Changes

Microfacies analysis and its sequence of microfacies have proven to be a valuable indicator of sea-level changes, and their application has been well documented in various regions and periods [24,29,47,61,62]. For instance, during the Ordovician period, Nielsen (2004) used microfacies analysis to investigate the sea-level fluctuations based on Baltoscandia sections [29]; Young and Laurie (1996) examined the sea-level changes based on Australian sections [61]; Ross and Ross (1992) conducted similar studies for North America [24]; and Liu (1998) provided a detailed analysis of the sea-level variations based on North China sections [62] (Figure 8). In this section, we use the time scale based on the graptolite zones provided by [63].
During TS.2a, which represents the period of the highest sea level, the dominant microfacies of sequence 1 were MF-1 and MF-2, indicating deposition in an open marine environment with an inner ramp setting. Extensive carbonate deposits were observed in the Yangtze Platform, and similar low sea-level conditions were recorded during the same period in Australia, North America, and Baltoscandia.
Since early TS.2b, muddy deposits had appeared in the early sedimentary period of the Meitan Formation in the Hailong section, indicating a gradual deepening of the sedimentary water. The thickness of the carbonate rocks gradually decreased, and the mixed deposits of carbonate rocks and terrigenous clasts covered the shallow-water carbonate rocks. These substantial changes in sedimentary characteristics have been observed throughout the Yangtze Platform [33]. Moreover, the sea level experienced a rapid rise across South China, accompanied by a carbonate platform inundation event, which may be considered the largest transgression event in the Early Ordovician on the Yangtze Platform [25]. This sea-level rise event has been identified in North China, Baltoscandia, Australia, and North America. In addition, Zhang and Barnes (2004) identified this transgression event based on conodonts in Finland and Canada [64]. These findings suggested that the early sea-level rise event of TS.2b was a strong global event, and the carbonate platform inundation event was mainly driven by global sea-level changes.
During the TS.2b–TS.2c interval, the Meitan Formation experienced a period of high sea level characterized by sequence 2, with the dominant microfacies type MF-9 and the deposition of mainly mudstone. A thin layer of siltstone, approximately 5 m thick, appeared in late TS.2b, accompanied by an increase in the sand component (Figure 8). Moreover, there was a brief decline in sea level, synchronized with similar sea-level fluctuations observed in North China, Baltoscandia, Australia, and North America, suggesting the global nature of this event, albeit with a relatively small magnitude.
From TS.2c onwards, the Meitan Formation continued to develop the general profile of MF-8, dominated by siltstone deposition, within a phase of elevated sea level. From late TS.2c onwards, the clastic content began to increase in the seamount profile, with mixed deposition of carbonate-silica clasts occurring within horizontally laminated sandstones. Both clasts and biogenic particles showed an upward trend, accompanied by frequent sea fluctuations. Overall, the sea level began to decline gradually. This sea-level decline exhibited more contrasting patterns with North China and Australia, whereas weaker correlations were observed with North America and Baltoscandia, suggesting potential local sea-level changes. Paleogeographic reconstructions indicate a closer spatial relationship between Australia and North China during the Early Ordovician [3,5,37], which may contribute to the contrasting sea-level patterns observed in these regions. Moreover, from this period onwards, differences in sea-level changes among northern Europe, North America, Yangtze Platform, Australia, and North China plates can be attributed to potential tectonic activity among these plates, possibly involving a super-mantle column event [65].
This sea retreat did not occur until early TS.3b, following the preceding period of sea-level rise. During the late TS.3b, thick layers of carbonate rocks were prominently observed in the field in the Hailong section, and similar occurrences were widely reported in the Yangtze region. Reef-building organisms were documented in the Fenggang section, indicating a warm-water, shallow-water sedimentation period associated with low sea levels [66]. This sea retreat affected southern China as a whole and demonstrated a comparability to Australia and North America, whereas North China and Baltoscandia remained at high sea levels without experiencing any sea-level lowering events. It is hypothesized that regional tectonic movements related to the equatorward drift of the Yangtze plate away from the Gondwana continent during this period may have played a role in controlling these sea-level dynamics [3,4,37].

5.5. Impact of Sea-Level Change on the Great Ordovician Biodiversification Event

During the Ordovician period, The Yangtze Platform emerged as a pivotal location for investigating the remarkable biological radiation that occurred during that time. Paleontologists studying the Yangtze Platform have provided valuable biological materials, enabling comprehensive examinations of its paleontology. The utilization of a consistent stratigraphic framework across various studies facilitates comparisons of the paleontology of the Yangtze region. By examining the sea-level curves in this study and comparing them with the diversity curves derived from studies on chitinous species, acritarchs, and brachiopods based on the same graptolite zones, the synergistic evolution between sea-level changes and biogenic radiation can be explored [25,28,35].
As shown in Figure 8, during the early TS.2b sea-level rise, a notable decline in chitinozoan diversity and a concurrent increase in brachiopod diversity were observed. The abrupt sea-level rising caused a change in the living conditions of chitinous species. Chitinous organisms were unable to adapt to this new deep-water environment, leading to this chitinozoan crisis. Conversely, in the late TS.2b period of sea-level fall, a surge in suspected biodiversity and a slight decrease in brachiopod diversity commenced. Notably, the absence of acritarchs during this period in TS.2b was not a sampling or preservation bias. Similar deficiencies were observed in the Guizhou and Chongqing areas of the Yangtze Platform. Thus, a regional crisis of chitinous species likely existed, possibly linked to the sudden rise in sea level [25]. The brachiopods exhibited an evident change in biogenic radiation during this period, with a significant increase in species diversity, mainly in the form of a sharp increase in Ortho and lingual shellfish [35]. The rise in sea level and increased detrital materials fostered the development of diverse habitats, prompting organisms to adapt to varying environments. This resulted in divergence, which favored the divergence and differentiation of brachiopods, as they exhibited better resistance to turbidity and greater adaptability. Moreover, competition for food was one of the controlling factors for the Ordovician radiation of marine organisms, and the metabolically slow brachiopods originally had lower food demands than their contemporaries. As a result, they thrived in relatively nutrient-poor and less competitive benthic environments [13].
During the sea-level decline in TS.2c, there was a gradual increase in both chitinozoan and acritarch diversity, whereas brachiopod diversity remained at a high level. In addition, both chitinozoan and acritarch diversity reached their peak levels during the sea-level decline in TS.3a until the early TS.3b sea-level rise, when they decreased and then remained elevated (Figure 9). As the sea level dropped, the sedimentary environment returned to a shallower environment, which was more conducive to the survival and evolution of chitinous and acritarch organisms. Brachiopod diversity exhibited distinct patterns compared to these two planktonic groups. Brachiopods underwent a radiation process and reached their first diversity peak in the early Floian. The range diversity of brachiopods remained high in the Middle Floian until the period of sea-level fall in TS.3a In the Late Floian and Early Daping, biodiversity remained low, and this change may be due to the lowering of the sea level [42].
As proposed by Zhan et al. [13], even within the same environment of a given area, different marine taxa presented specific evolutionary patterns. In addition, the biodiversity of chitinozoans and acritarchs seemed to indicate a positive correlation with environmental changes, especially sea level, whereas brachiopods demonstrated a negative correlation in the Floian. However, their biodiversity was more influenced by intrinsic biological factors such as morphological innovation and functional transformation from fighting turbid waters. In general, rising sea levels favored increased brachiopod diversity, while falling sea levels favored enhanced planktonic diversity among chitinozoan and acritarch species. The Great Ordovician Biodiversification Event has been of scientific interest for a long time, with various opinions regarding the mechanisms underlying its formation, including both endogenous and exogenous causes. By shedding new light on the relationship between Ordovician sea-level changes and biodiversification in the Yangtze region, this study offers a fresh perspective on the subject from microfacies analysis.

6. Conclusions

The Honghuayuan Formation mainly indicated the development of sequence 1(MF-1–MF-2), characterized by abundant peloids and bioclasts as the main depositional features. In the Lower Meitan Formation, sequence 2 and sequence 3 (MF8–MF9) were mainly developed, accompanied by the influx of terrestrial silica. Rapidly rising sea levels and drowning of the carbonate platform led to the disappearance of peloids and bioclasts, signifying a significant change in the depositional environment from a bright and open inner ramp to an outer ramp deposition. In the upper part of the Lower Meitan Formation, sequence 4 (MF4-MF6), indicating mixed sedimentation, comprises both siliciclastic and carbonate deposits. The presence of a carbonate component is thought to be a reflection of a sea-level rise. As for the Middle Meitan Formation, sequence 5 also recorded a sea-level rise. Sequence 6 (MF-5–MF-7), with a gradual increase in bioclastic and quartz content, mainly developed on an extensive carbonate ramp after a marine transgression. Moreover, carbonate rocks emerged in sequence 7, further transitioning to an inner ramp depositional environment.
The frequent changes in microfacies provide valuable material for studying sea-level changes in the Yangtze region. This study identified sea-level patterns in the Upper Yangtze region, including sea-level rise in the early TS.2b, sea-level fall in the late TS.2b, sea-level fall in the TS.2c, sea-level fall in the TS.3a, sea-level rise in the early TS.3b, and sea-level fall in the late TS.3b. Prior to the TS.2c period, global sea-level changes exhibited some similarities. However, after the TS.2c period, sea-level changes gradually differentiated from region to region, which is presumed to be linked to changes in global paleogeographic patterns and super-mantle column events.
In this study, the analyses of the sea-level curves and the diversity curves of chitinozoans, acritarchs, and brachiopods revealed notable insights. During the Early Ordovician Floian, frequent sea-level changes provided favorable conditions for the extensive radiation of organisms, as evidenced by the development of diverse living environments resulting from rising sea levels and increased clastic material. Moreover, the diversity of living environments further facilitated organismal adaptation to various environments, thereby generating divergence. Brachiopods tended to have a better resistance to turbidity and exhibited greater adaptability. In contrast, declining sea levels tended to be more favorable to the survival of chitinozoans and acritarchs.

Author Contributions

X.W.: Software, Investigation, Writing—Original draft preparation; X.L.: Conceptualization, Methodology, Writing—Review & Editing; J.T.: Visualization, Funding acquisition, Resources; Q.L.: Software, Investigation, Formal analysis; W.C.: Software, Investigation; B.W.: Software, Investigation. All authors have read and agreed to the published version of the manuscript.

Funding

This research was funded by the National Major Science and Technology Projects of China, grant number 2016ZX05007004-002.

Data Availability Statement

Data will be made available on request.

Acknowledgments

We thank Zhuangsheng Wang and Junming Fan for their valuable and constructive suggestions during this research.

Conflicts of Interest

The authors declare no conflict of interest.

References

  1. Cocks, L.; Torsvik, T. Earth geography from 500 to 400 million years ago: A faunal and palaeomagnetic review. J. Geol. Soc. 2002, 159, 631–644. [Google Scholar] [CrossRef]
  2. Torsvik, T.H.; van der Voo, R.; Doubrovine, P.V.; Burke, K.; Steinberger, B.; Ashwal, L.D.; Trønnes, R.G.; Webb, S.J.; Bull, A.L. Deep mantle structure as a reference frame for movements in and on the Earth. Proc. Natl. Acad. Sci. USA 2014, 111, 8735–8740. [Google Scholar] [CrossRef] [PubMed]
  3. Torsvik, T.H. Earth history: A journey in time and space from base to top. Tectonophysics 2019, 760, 297–313. [Google Scholar] [CrossRef]
  4. Scotese, C.R. An atlas of phanerozoic paleogeographic maps: The seas come in and the seas go out. Ann. Rev. Earth Planet. Sci. 2021, 49, 679–728. [Google Scholar] [CrossRef]
  5. Scotese, C.R. Ordovician plate tectonic and palaeogeographical maps. In A Global Synthesis of the Ordovician System: Part 1; Harper, D.A.T., Lefebvre, B., Percival, I.G., Servais, T., Eds.; Geological Society: London, UK, 2023; Volume 532, pp. 91–109. [Google Scholar] [CrossRef]
  6. Sepkoski, J.J., Jr. A kinetic model for Phanerozoic taxonomic diversity: I. Analysis of marine orders. Paleobiology 1978, 4, 223–251. [Google Scholar] [CrossRef]
  7. Sepkoski, J.J., Jr. A kinetic model for Phanerozoic taxonomic diversity: II. Early Phanerozoic families and multiple equilibria. Paleobiology 1979, 5, 222–251. [Google Scholar] [CrossRef]
  8. Sepkoski, J.J., Jr. A factor analytic description of the Phanerozoic marine fossil record. Paleobiology 1981, 7, 36–53. [Google Scholar] [CrossRef]
  9. Webby, B.D.; Droser, M.L.; Paris, F.; Percival, I. The Great Ordovician Biodiversification Event; Columbia University Press: New York, NY, USA, 2004. [Google Scholar]
  10. Harper, D.A.T. The Ordovician biodiversification: Setting an agenda for marine life. Palaeogeogr. Palaeoclimatol. Palaeoecol. 2006, 232, 148–166. [Google Scholar] [CrossRef]
  11. Servais, T.; Owen, A.W.; Harper, D.A.T.; Kröger, B.; Munnecke, A. The Great Ordovician Biodiversification Event (GOBE): The palaeoecological dimension. Palaeogeogr. Palaeoclimatol. Palaeoecol. 2010, 294, 99–119. [Google Scholar] [CrossRef]
  12. Zhang, Y.D.; Zhan, R.B.; Fan, J.X.; Cheng, J.F.; Liu, X. Principal aspects of the Ordovician biotic radiation. Sci. China Earth Sci. 2010, 53, 382–394. [Google Scholar] [CrossRef]
  13. Zhan, R.B.; Jin, J.S.; Liu, J.B. Investigation on the great Ordovician biodiversification event (GOBE): Review and prospect. Chin. Sci. Bull. 2013, 58, 3357–3371. (In Chinese) [Google Scholar] [CrossRef]
  14. Harper, D.A.T.; Zhan, R.B.; Jin, J.S. The Great Ordovician Biodiversification Event: Reviewing two decades of research on diversity’s big bang illustrated by mainly brachiopod data. Palaeoworld 2015, 24, 75–85. [Google Scholar] [CrossRef]
  15. Rasmussen, C.M.Ø.; Ullmann, C.V.; Jakobsen, K.G.; Lindskog, A.; Hansen, J.; Hansen, T.; Eriksson, M.E.; Dronov, A.; Frei, R.; Korte, C.; et al. Onset of main Phanerozoic marine radiation sparked by emerging Mid Ordovician icehouse. Sci. Rep. 2016, 6, 18884. [Google Scholar] [CrossRef] [PubMed]
  16. Servais, T.; Perrier, V.; Danelian, T.; Klug, C.; Martin, R.; Munnecke, A.; Nowak, H.; Nützel, A.; Vandenbroucke, T.R.A.; Williams, M.; et al. The onsetof the ‘Ordovician Plankton Revolution’ in the late Cambrian. Palaeogeogr. Palaeoclimatol. Palaeoecol. 2016, 458, 12–28. [Google Scholar] [CrossRef]
  17. Stigall, A.L.; Freeman, R.L.; Edwards, C.T.; Rasmussen, C.M. A multidisciplinary perspective on the Great Ordovician Biodiversification Event and the development of the early Paleozoic world. Palaeogeogr. Palaeoclimatol. Palaeoecol. 2020, 543, 109521. [Google Scholar] [CrossRef]
  18. Miller, A.I.; Mao, S. Association of orogenic activity with the Ordovician radiation of marine life. Geology 1995, 23, 305–308. [Google Scholar] [CrossRef]
  19. Wilson, M.A.; Palmer, T.J.; Guensburg, T.E.; Finton, C.D.; Kaufman, L.E. The development of an Early Ordovician hard ground community in response to rapid sea-floor calcite precipitation. Lethaia 1992, 25, 19–34. [Google Scholar] [CrossRef]
  20. Bambach, R.K. Seafood through time: Changes in biomass, energetics, and productivity in the marine ecosystem. Paleobiology 1993, 19, 372–397. [Google Scholar] [CrossRef]
  21. Chen, W.Z.; Tian, J.C.; Lin, X.B.; Liang, Q.S.; Wang, X.; Yi, D.X.; Li, Y.Y. Climate fluctuations during the Ordovician-Silurian transition period in South China: Implications for paleoenvironmental evolution and organic matter enrichment. Palaeogeogr. Palaeoclimatol. Palaeoecol. 2023, 613, 111411. [Google Scholar] [CrossRef]
  22. Rothman, D.H. Global biodiversity and the ancient carbon cycle. Proc. Natl. Acad. Sci. USA 2001, 98, 4305–4310. [Google Scholar] [CrossRef]
  23. Cornette, J.L.; Lieberman, B.S.; Goldstein, R.H. Documenting a significant relationship between macroevolutionary origination rates and Phanerozoic pCO2 levels. Proc. Natl. Acad. Sci. USA 2002, 99, 7832–7835. [Google Scholar] [CrossRef] [PubMed]
  24. Ross, J.; Ross, C.A. Ordovician sea-level fluctuations. Glob. Perspect. Ordovician Geol. 1992, 22, 327–335. [Google Scholar]
  25. Luan, X.C.; Brett, C.E.; Zhan, R.B.; Liu, J.B.; Wu, R.C.; Liang, Y. Microfacies analysis of the Lower-Middle Ordovician succession at Xiangshuidong, southwestern Hubei Province, and the drowning and shelf-ramp transition of a carbonate platform in the Yangtze region. Palaeogeogr. Palaeoclimatol. Palaeoecol. 2017, 485, 68–83. [Google Scholar] [CrossRef]
  26. Liang, Y.; Hints, O.; Luan, X.C.; Tang, P.; Nõlvak, J.; Zhan, R.B. Lower and Middle Ordovician chitinozoans from Honghuayuan, South China: Biodiversity patterns and response to environmental changes. Palaeogeogr. Palaeoclimatol. Palaeoecol. 2018, 500, 95–105. [Google Scholar] [CrossRef]
  27. Paris, F.; Nolvak, J. Biological interpretation and palaeobiodiversity of a cryptic fossil group: The “chitinozoan animal”. Geobios 1999, 32, 315–324. [Google Scholar] [CrossRef]
  28. Yan, K.; Li, J.; Liu, J.B. Biodiversity of Early-Middle Ordovician acritarchs and sea level changes in South China. Chin. Sci. Bull. 2005, 50, 2362–2368. (In Chinese) [Google Scholar] [CrossRef]
  29. Nielsen, A.T. Ordovician sea level changes: A Baltoscandian perspective. In The Great Ordovician Biodiversification Event; Webby, B., Paris, F., Droser, M., Percival, I., Eds.; Columbia University Press: Warren, OR, USA, 2004; pp. 84–94. [Google Scholar]
  30. Liu, J. Sea-level changes during the Early-Mid Ordovician radiation of South China. Originations, Radiations and Biodiversity Changes-Evidences From the Chinese Fossil Record 335. In Originations, Radiations and Biodiversity Changes-Evidences from the Chinese Fossil Record; Rong, J.Y., Fang, Z.J., Zhou, Z.H., Zhan, R.B., Yuan, X.L., Eds.; Science Press: Beijing, China, 2006. [Google Scholar]
  31. Munnecke, A.; Zhang, Y.D.; Liu, X.; Cheng, J.F. Stable carbon isotope stratigraphy in the Ordovician of South China. Palaeogeogr. Palaeoclimatol. Palaeoecol. 2011, 307, 17–43. [Google Scholar] [CrossRef]
  32. Wang, X.F.; Chen, X.H. Ordovician chitinozoan diversification events in China. Sci. China Ser. D-Earth Sci. 2004, 47, 874–879. (In Chinese) [Google Scholar] [CrossRef]
  33. Chen, P.F.; Zhan, R.B. The lower to middle Ordovician Dawan formation and its coeval rocks in the Yangtze region. J. Stratigr. 2006, 30, 11–20. (In Chinese) [Google Scholar]
  34. Yan, K.; Li, J. Ordovician biostratigraphy of acritarchs from the Meitan Formation of Honghuayuan section, Tongzi, Guizhou, southwest China. J. Stratigr. 2005, 29, 236–256. (In Chinese) [Google Scholar]
  35. Zhan, R.B.; Rong, J.Y.; Cheng, J.H.; Chen, P.F. Early-Mid Ordovician brachiopod diversification in South China. Sci. China Ser. D Earth Sci. 2005, 48, 662–675. [Google Scholar] [CrossRef]
  36. Zhang, Y.D.; Liu, X.; Zhan, R.B. Penstones from the lower part of the Meitan Formation of the Gaoqiao Ordovician in Zunyi, Guizhou. J. Paleontol. 2007, 46, 145–166. (In Chinese) [Google Scholar]
  37. Wu, R.C.; Percival, I.G.; Zhan, R.B. Biodiversification of Early to Middle Ordovician conodonts: A case study from the Zitai Formation of Anhui Province, eastern China. Alcheringa 2010, 34, 75–86. [Google Scholar] [CrossRef]
  38. Sun, H.J.; Yang, Y.N.; Peng, J.; Zhao, Y.L.; Yang, X.L. Characterization of the brachiopod assemblage from the lower part of the Early Ordovician Meitan Formation, Wudang, Guiyang. J. Guizhou Univ. (Nat. Sci. Ed.) 2011, 28, 23–29. (In Chinese) [Google Scholar]
  39. Liang, Y.; Servais, T.; Tang, P.; Liu, J.B.; Wang, W.H. Tremadocian (Early Ordovician) chitinozoan biostratigraphy of South China: An update. Rev. Palaeobot. Palynol. 2017, 247, 149–163. [Google Scholar] [CrossRef]
  40. Zhang, Y.D.; Zhan, R.B.; Zhen, Y.Y.; Wang, Z.H.; Yuan, W.W.; Fang, X.; Ma, X.; Zhang, J.P. Ordovician integrative stratigraphy and timescale of China. Sci. China Earth Sci. 2019, 62, 61–88. [Google Scholar] [CrossRef]
  41. Wu, F.Y.; Wan, B.; Zhao, L.; Xiao, W.J.; Zhu, R.X. Tethys geodynamics. J. Petrol. 2020, 36, 1627–1674. (In Chinese) [Google Scholar]
  42. Zhan, R.B.; Harper, D.A. Biotic diachroneity during the Ordovician Radiation: Evidence from South China. Lethaia 2006, 39, 211–226. [Google Scholar] [CrossRef]
  43. Zhang, Y.B.; Zhou, Z.Y.; Zhang, J.M. Late Early Ordovician—Early Middle Ordovician Darriwilian sedimentary differentiation in the Yangtze massif. J. Stratigr. 2002, 26, 302–314. (In Chinese) [Google Scholar]
  44. Reijmer, J.J.G.; Everaars, J.S.L. Carbonate platform facies reflected in carbonate basin facies (Triassic, Northern Calcareous Alps, Austria). Facies 1991, 25, 253–277. [Google Scholar] [CrossRef]
  45. Reijmer, J.J.G.; Ten Kate, W.G.H.Z.; Sprenger, A.; Schlager, W. Calciturbidite composition related to exposure and flooding of a carbonate platform (Triassic, Eastern Alps). Sedimentology 1991, 38, 1059–1074. [Google Scholar] [CrossRef]
  46. Reijmer, J.J.G. Compositional variations during phases of progradation and retrogradation of a Triassic carbonate platform (Picco di Vallandro/Dürrenstein, Dolomites, Italy). Geol. Rundsch. 1998, 87, 436–448. [Google Scholar] [CrossRef]
  47. Wang, H.; Zhong, H.T.; Chen, A.Q.; Li, K.R.; He, H.; Qi, Z.; Zheng, D.Y.; Zhao, H.Y.; Hou, M.C. A knowledge graph for standard carbonate microfacies and its application in the automatical reconstruction of the relative sea-level curve. Geosci. Front. 2023, 14, 101535. [Google Scholar] [CrossRef]
  48. Flügel, E.; Munnecke, A. Microfacies of Carbonate Rocks: Analysis, Interpretation and Application; Springer: Berlin/Heidelberg, Germany, 2010. [Google Scholar]
  49. Shi, G.R. Multivariate data analysis in palaeoecology and palaeobiogeography—A review. Palaeogeogr. Palaeoclimatol. Palaeoecol. 1993, 105, 199–234. [Google Scholar] [CrossRef]
  50. Palma, R.M. Analysis of carbonate microfacies in the Chachao Formation(cretaceous), Barda Blanca-malargüe, Mendoza province-Argentina: A cluster analytic approach. Carbonates Evaporites 1996, 11, 182–194. [Google Scholar] [CrossRef]
  51. Brachert, T.C.; Betzler, C.; Braga, J.C.; Martin, J.M. Microtaphofacies of a warmtemperate carbonate ramp (uppermost Tortonian/lowermost Messinian, southern Spain). Palaios 1998, 13, 459–475. [Google Scholar] [CrossRef]
  52. Halfar, J.; Godinez-Orta, L.; Ingle, J.C. Microfacies analysis of recent carbonate environments in the southern Gulf of California, Mexico—A model for warm temperate to subtropical carbonate formation. Palaios 2000, 15, 323–342. [Google Scholar] [CrossRef]
  53. Lanfranchi, A.; Berra, F.; Jadoul, F. Compositional changes in sigmoidal carbonate clinoforms (Late Tithonian, eastern Sardinia, Italy): Insights from quantitative microfacies analyses. Sedimentology 2011, 58, 2039–2060. [Google Scholar] [CrossRef]
  54. Jarochowska, E. High-resolution microtaphofacies analysis of a carbonate tidal channel and tidally influenced lagoon, Pigeon Creek, San Salvador Island, Bahamas. Palaios 2012, 27, 151–170. [Google Scholar] [CrossRef]
  55. Stehlik-Barry, K.; Babinec, A.J. Data Analysis with IBM SPSS Statistics; Packt Publishing Ltd.: Birmingham, UK, 2017. [Google Scholar]
  56. Dunham, R.J. Classification of carbonate rocks according to depositional textures. In Classification of Carbonate Rocks—A Symposium; Ham, W.E., Ed.; American Association of Petroleum Geologists: Tulsa, OK, USA, 1962. [Google Scholar]
  57. Mount, J. Mixed siliciclastic and carbonate sediments: A proposed first-order textural and compositional classification. Sedimentology 1985, 32, 435–442. [Google Scholar] [CrossRef]
  58. Li, Q.J.; Li, Y.; Wang, J.P.; Kiessling, W. Early Ordovician lithistid sponge–Calathium reefs on the Yangtze Platform and their paleoceanographic implications. Palaeogeogr. Palaeoclimatol. Palaeoecol. 2015, 425, 84–96. [Google Scholar] [CrossRef]
  59. Li, Q.J.; Li, Y.; Zhang, Y.D.; Munnecke, A. Dissecting Calathium-microbial frameworks: The significance of calathids for the Middle Ordovician reefs in the Tarim Basin, northwestern China. Palaeogeogr. Palaeoclimatol. Palaeoecol. 2017, 474, 66–78. [Google Scholar] [CrossRef]
  60. Mount, J.F. Mixing of siliciclastic and carbonate sediments in shallow shelf environments. Geology 1984, 12, 432–435. [Google Scholar] [CrossRef]
  61. Young, G.C.; Laurie, J.R. An Australian Phanerozoic Timescale; Oxford University Press: New York, USA, 1996. [Google Scholar]
  62. Liu, J. Lower Ordovician Pendulum Stratigraphy and Radiolarian Fauna of Northern China; Osaka City University: Osaka, Japan, 1998. [Google Scholar]
  63. Webby, B.D.; Cooper, R.A.; Bergström, S.M.; Paris, F. Stratigraphic framework and time slices. In The Great Ordovician Biodiversification Event; Webby, B.D., Paris, F., Droser, M.L., Percival, I., Eds.; Columbia University Press: New York, NY, USA, 2004; pp. 41–51. [Google Scholar]
  64. Zhang, S.; Barnes, C.R. Arenigian (Early Ordovician) sea-level history and the response of conodont communities, western Newfoundland. Can. J. Earth Sci. 2004, 41, 843–865. [Google Scholar] [CrossRef]
  65. Barnes, C.R. Was There an Ordovician Superplume Event. In The Great Ordovician Biodiversification Event; Webby, B., Paris, F., Droser, M., Percival, I., Eds.; Columbia University Press: Warren, OR, USA, 2004; pp. 77–80. [Google Scholar]
  66. Li, Q.J.; Li, Y.; Kershaw, S.; Zhang, Y.Y.; Deng, X.J. Middle chert of the Kara Ordovician Meitan Formation, Fenggang Refuge, Qianbei: A typical warm-water phase. J. Microsomal Paleontol. 2010, 27, 150–158. (In Chinese) [Google Scholar]
Figure 1. (A) Global paleogeographic reconstruction at 460 Ma (modified from https://deeptimemaps.com/global-series/.jpg, accessed on 1 May 2023). (B) Geographic distribution of major plates in China. (C) Geographic position of sampled sections in relation to the distribution of Early/Middle Ordovician major facies on the South China Plate (modified from [31]). (D) Location of the Hailong profile in Gaoqiao Town, Zunyi City, Guizhou Province.
Minerals 13 01239 g001
Figure 2. (A) Correlation chart depicting the relationship between lithostratigraphy and lithology in comparison to chronostratigraphic units, based on the studies of [31,40]. (B) Lithostratigraphic column illustrating the sampled levels at the Hailong profile in Gaoqiao Town, Zunyi City, Guizhou Province.
Minerals 13 01239 g002
Figure 3. (A) Boundary between Low Meitan (LMT) and Honghuayuan (HHY) Formations. (BD) Lithological changes observed within the Lower Meitan Formation (refer to the accompanying photos for specific details). (E) Boundary between LMT and Middle Meitan (MMT) Formations. (F) The “Middle Member Limestone” located within the Middle Meitan Formation at the Hailong profile, characterized by a composition of limestone and mixed rock.
Minerals 13 01239 g003
Figure 4. Ranges chart for the Ordovician graptolites from the Meitan Formation at the Hailong section (data from [36]).
Minerals 13 01239 g004
Figure 5. Depositional model and distribution patterns of microfacies within the Meitan Formation (modified from [30]).
Minerals 13 01239 g005
Figure 6. Cluster analysis of point-count group data obtained from the Meitan Formation. The dendrogram illustrates an increasing similarity between the individual cases from right to left. Cases with shorter distances, as indicated by the blue line, are regarded as belonging to the same cluster. The pie chart depicts the average composition of point-count groups within each cluster, which serves as the basis for defining microfacies.
Minerals 13 01239 g006
Figure 7. Photomicrographs of thin sections under polarized light from the Hailong section. (A) MF-1: Peloidal grainstone exhibiting a lack of micrite, dense grain filling, and a substantial presence of bright sparite in the intergranular pores. The grains primarily consist of peloids with uniform sizes (0.1–0.2 mm), with a few larger grains (0.8–1 mm) displaying internal bright sparite (indicated by yellow arrows). (B) MF-2: Bioclastic grainstone showing abundant biological debris, including Ca (calathiums), Ec (echinoderms), Br (brachiopods), and others. The intergranular pores contain a large amount of bright sparite. (C) MF-3: Bioclastic packstone characterized by extensive biological debris, such as Ec (echinoderms), Tr (trilobites), and Br (brachiopods). Micrite fills the intergranular spaces. (D) MF-4: Sandy lithoclastic allochem limestone featuring carbonate Cl (clasts) resembling cuttings, which are influenced by diagenesis, obscuring internal structure. (E) MF-5: Sandy bioclastic allochem limestone comprising numerous structurally intact biological fragments, including Br (brachiopods) and Ec (echinoderms), alongside Cl (clasts). (F) MF-6: Sandstone exhibiting mainly grain sizes ranging from 0.05 mm to 0.1 mm, with intergranular filling comprising micrite and organic-matter-rich mud (indicated by yellow arrow). (G) MF-7: Calcimudstone appearing above the Cl (carbonate clastic) grains, with the presence of a hard-bottom structure (indicated by yellow arrow) suggesting a depositional interruption between the Meitan and Honghuayuan Formations. (H) MF-8: Silty mudstone characterized by mixed composition of silt-graded sandstone (<0.05) and clays, with some stratification. (I) MF-9: Mudstone mainly composed of clay with organic matter (indicated by yellow arrow).
Minerals 13 01239 g007
Figure 8. Vertical successions of components, distribution of microfacies, and sea-level changes within the Meitan formations at the Hailong profile.
Minerals 13 01239 g008
Figure 9. Comparison of the sea-level curve obtained in this study with North China [62], Baltoscandia [29], Australia [61], and North America [24]. The green curves represent biodiversity curves for chitinozoans [25], acritarchs [28], and brachiopods [35], respectively, within the Early and Middle Ordovician Meitan Formation. The figure is rescaled based on graptolite biozones for enhanced representation of geological time. Two sea-level rises, corresponding to early TS.2b and early TS.3b, are identified (indicated by blue shading). Four sea-level decreases occurred during the late TS.2b, TS.2c, TS.3a, and late TS.3b periods (indicated by purple shading).
Minerals 13 01239 g009
Table 1. Definitions of point-count groups.
Point-Count GroupsDescriptionsReferences
PeloidsPeloids are carbonate grains significantly smaller than lithoclasts and microbialites, and exhibit the size ranges spanning from 0.1 mm to 0.5 mm. These grains have multiple proposed origins: (a) the most abundant can be microbiogenic peloids, characterized by irregular and diverse shapes with inconspicuous internal structures; (b) mud peloids lacking an internal structure represent the reworking of lithified lime mud and micritic clasts; and (c) micritized grains.[48]
BioclastsThis category comprises bioclasts that lack diagnostic attributes for specific paleo-environmental identifications, such as trilobites, echinoderms, and discrete.[48]
ClastsThe observed clasts can be categorized as synsedimentary or postsedimentary lime clasts, indicating the reworking of partially consolidated carbonate sediments or pre-existing lithified material. These clasts exhibit a broad spectrum of shapes and sizes, ranging from angular to rounded. The sizes span a wide range from less than 0.2 mm to several decameters. Very small clasts are hardly distinguishable from peloids.[48]
MicriteThis group includes micrite and microspar ranging from 64 to about 30 μm in diameter.[48]
SpariteThe spar cements growing in their original cavities are included. However, in certain thin sections, the presence of pseudospars can be mixed into this category due to the difficulty in distinguishing in certain cases.[48]
SandsIn the classification presented, sands are considered to include quartz, feldspar, other silicates, and heavy minerals that range from 0.0625 to 2 mm in diameter.[48]
MudFine sand gradually transitions into mud, a term employed in this context to denote siliciclastic sediment with a diameter smaller than 0.0625 mm. It commonly consists of a mixture of silt and clay particles.[48]
Table 2. Correlation coefficient matrix of point-count groups.
Point-Count GroupsPeloidsBioclastsClastsSpariteMicriteSandsMud
Peloids1.00
Bioclasts0.041.00
Clasts0.010.211.00
Sparite0.37 **0.36 **0.271.00
Micrite−0.270.080.20−0.43 **1.00
Sands−0.01−0.270.17−0.35 *0.32 *1.00
Mud−0.39 **−0.41 **−0.45 **−0.49 **−0.22−0.181.00
N = 53. * Correlation is significant at the 0.05 level (two-tailed). ** Correlation is significant at the 0.01 level (two-tailed).
Disclaimer/Publisher’s Note: The statements, opinions and data contained in all publications are solely those of the individual author(s) and contributor(s) and not of MDPI and/or the editor(s). MDPI and/or the editor(s) disclaim responsibility for any injury to people or property resulting from any ideas, methods, instructions or products referred to in the content.

