Abstract
An earlier study has shown that chlorine solutions were capable of effectively regenerating an ammonium-loaded zeolite column; however, the chlorine concentrations were high (1000 mg Cl2/L), and for two hours of the regeneration cycle, the pH was approximately 3. This led to concerns regarding the long-term durability of the zeolite. The objective of this study is to investigate the durability of a zeolite by conducting long-term batch exposure tests using (a) high concentration chlorine solutions and (b) low pH solutions. Particle size analysis, SEM images, N2 gas adsorption tests, FTIR characterization and batch loading tests showed that 35-day exposure to 1000 mg Cl2/L solutions did not significantly impact the zeolite studied. This chlorine exposure is equivalent to 840,000 ppm-h, which is three orders of magnitude higher than the values recommended by the supplier. The 90-day-long low pH exposure tests showed that pH = 4 solutions only slightly impacted the zeolite’s characteristics and ammonium uptake; however, the pH = 3 exposure led to discernable changes, and the pH = 2 exposure led to an even greater impact. At pH = 2, there was a breakdown of some external part of the zeolite particles, leading to a 7.1-fold increase in the fines and a 56% reduction in the ammonium uptake. The decrease in the ammonium uptake was proportional to the percent of fines.
1. Introduction
As ammonium (NH4+) is the dominant species of ammonia at neutral pH levels, cationic ion exchange (IE) is a feasible technology for ammonia removal from water and wastewater [1,2]. Natural zeolites are relatively inexpensive and are effective cationic ion exchangers for the removal of ammonium from water. They have been extensively studied for ammonia removal from municipal [3,4], industrial [5,6] and mining [7,8] wastewaters. Additionally, there has been at least one full-scale system in operation for many years [9]. As ion exchange materials have limited ion uptake capacity, they require frequent regeneration before reuse in the next ion uptake cycle. The most common type of regeneration uses NaCl solutions with concentrations ranging from 0.5% to 14% [3,4]. Due to very high salt concentrations and significant ammonia concentrations, the used regenerant cannot be discharged directly into the environment before proper treatment. Furthermore, if the regenerant is reused, the high concentration of ammonium would hinder regeneration. A common approach for managing and treating the used NaCl regenerant has been to raise its pH and air strip the ammonia; then, the solution can be reused [3,4,7,9]. However, air stripping is impractical in cold areas, e.g., Northern Canada, where there are many mines, which could benefit from this technology. Thus, an alternative method for ammonium-loaded zeolite regeneration is necessary for cold temperature applications.
Recent research has demonstrated that regeneration using chlorine solutions is a feasible alternative regeneration method for ammonia-loaded zeolites [6,10,11]. The ammonia nitrogen adsorbed on ion exchange media desorbs from the solid phase and is oxidized to N2 gas through chlorination [6,10]. Through this process, ammonia removal from the regeneration solution can be achieved, so that the regenerant can be reused, which also avoids the creation of a waste stream with high salt and ammonia concentrations. The reactions could be described by the following equation [6,10,11]:
Or alternatively
Two studies investigated chlorine regeneration of zeolite loaded with ammonia using batch systems [6,10], while Zhang et al. [11] loaded their zeolite using a continuous flow column system—the more common type of system used in full-scale applications. Zhang et al. [11] showed that their zeolite column loaded with mining wastewater impacted by synthetic explosives (EIMWW) containing 21 mg NH4+-N/L could be effectively regenerated using a 1000 mg free Cl2/L NaOCl solution. However, the regeneration required approximately four hours despite the high chlorine concentrations. In addition, during the regeneration phase, the ammonia–chlorine reaction led to substantial production of H+ ions (as predicted by Equation (2)), which caused the regenerant’s pH to drop to as low as 3 for two hours. Given that zeolite is regenerated two to four times daily in a continuous ion exchange process accompanied by high chlorine concentrations and low pHs, there are concerns about the potential impact on the zeolite. Resintech, the supplier of the particular zeolite used in that study, as well as the current one, states that a lifetime chlorine exposure of 106 ppm∙h was safe but did not specify a maximum value [12]. The authors are not aware of any literature studies investigating the impact of high chlorine concentrations on zeolites. The supplier also claims that the same particular zeolite can operate in a pH range of 3 to 10 [12]. The high chlorine concentrations and the low pH conditions during chlorine regeneration of the ammonia-loaded zeolite may affect the durability of the material and the feasibility of this technology. Some studies have exposed zeolites to strong acids to modify the zeolites [13,14]. These studies used more acidic conditions (pH ≤ 1) while heating the sample and often followed by calcination. As the material processing conditions are quite different, their results are not directly applicable to the current situation. The novelty of this initiative lies in the fact that, so far, only three studies appear to have studied chlorine regeneration of ammonia-loaded zeolite [6,10,11], and no studies have investigated the long-term impact of the high chlorine concentrations and low pH conditions, which arise during the chlorine regeneration of zeolite columns [11]. Thus, the specific objective of this study is to separately investigate the impact of long-term exposure to low pHs and to high chlorine concentrations on the zeolite’s characteristics and ability to remove ammonia.
2. Materials and Methods
2.1. Materials
The zeolite used in this study was ResinTech’s SIR_600—a modified clinoptilolite [15]. This particular zeolite was selected because it was used by Zhang et al. [11] in their chlorine regeneration studies. Table 1 presents this zeolite’s more relevant properties information provided by the supplier.

Table 1.
Properties of SIR-600 (source: Ref [12]).
To assess the ammonia uptake capacity, zeolite samples were batch loaded with the same synthetic EIMWW used in the earlier study [11]. The EIMWW was prepared by adding ammonium chloride, potassium chloride and calcium chloride hexahydrate (ACS grade, Fisher Scientific, Waltham, MA, USA) to distilled water. The synthetic EIMWW wastewater contained approximately 21 mg NH4+ as N/L, 30 mg K/L and 80 mg Ca/L (1.5 meq/L, 0.77 meq/L and 4 meq/L, respectively). This composition is very similar to that reported for underground mine wastewaters [7]. The inclusion of Ca and K was important because these cations compete with the NH4+ and reduce the zeolite’s NH4+ uptake.
Commercial bleach (NaOCl) was used to prepare the chlorine regeneration solutions. The free chlorine concentration of the chlorine solutions was measured to ensure consistency. The pH = 3 and pH = 4 solutions were prepared using universal buffer mixtures, which combined citric acid and sulfuric acid (ACS grade, Fisher Scientific, Waltham, MA, USA). The pH = 2 solution was prepared by diluting 0.1 M sulfuric acid solution (ACS grade, Fisher Scientific, Waltham, MA, USA) with deionized water.
2.2. IE Material Durability Tests with Chlorine Exposure
Due to concerns about the impact of high chlorine concentrations on the long-term durability and the ion uptake capacity of SIR-600, several properties of the zeolite and its ammonia uptake capacity were evaluated for different chlorine contact times and different chlorine concentrations. This was achieved by conducting five sequential week-long batch chlorine exposure tests using two NaOCl solutions (100 and 1000 mg/L as free Cl2). The lower concentration was used to expand the range of the ppm∙h chlorine exposure range. To conduct some of the material characterization tests, a large mass of zeolite was required. For the sieve-based particle size analysis, a minimum of 50 g of zeolite was required, and the largest size bottles, which can be used in our end-over-end tumbler, are 1 L bottles. Accordingly, to generate the chlorine-exposed zeolite samples for material characterization, it was decided to use multiple bottles containing 50 g of zeolite per 1 L of the exposure solution.
Each loading–regeneration cycle consisted of a batch ammonium-loading phase and a batch chlorine regeneration phase. In the ammonium-loading phase, 0.24 g of SIR-600 was added to a 120 mL glass bottle filled with the synthetic EIMWW. To avoid ammonia losses due to volatilization, the bottles were filled to the top with the solution, leaving no headspace. The Teflon tape was entwined on the threaded neck of the bottles to enhance the seal of the screw-on caps. The sealed bottles were placed in an end-over-end tumbler and slowly (~10 rpm) rotated for 24 h to provide sufficient contact of solid and liquid to achieve equilibrium [16]. Subsequently, the liquid in the bottle was separated by vacuum filtration through a 0.45 μm membrane filter (GN-6, Pall, Port Washington, NY, USA). The ammonia, K+ and Ca2+ concentrations of the filtrate were then determined. The SIR-600 particles captured by the membrane filter were kept for the subsequent regeneration phase. The experiments were conducted in triplicate, and the average results were reported. The experiments were conducted at room temperature (22 °C). As the batch test reaches equilibrium, the ion concentrations of the filtrate are referred to as the equilibrium liquid phase concentrations (Ceq). One can determine the equilibrium ion uptake by each gram of IE material (Quptake) in each cycle using the following equation:
where M stands for the IE material’s mass (g); V is the liquid’s volume (L); Ci stands for the target ion’s initial liquid phase concentration (mg/L or meq/L); Ceq is expressed in mg/L or meq/L; and Quptake is expressed in mg/g or meq/g.
For the chlorine regeneration phase, the loaded SIR-600 was placed in a clean 120 mL glass bottle, which was then filled with the regeneration solution (without leaving headspace) and sealed, as previously described. Then, the bottle rotated in the end-over-end tumbler for 1 week. After the rotation, the contents of the bottle were vacuum filtered through a 0.45 um membrane filter to retrieve the regenerated SIR-600. The regenerated SIR-600 materials were rinsed with deionized water and stored for the following loading and regeneration cycle. The regeneration cycle also functioned as a week-long high chlorine concentration exposure period. The full cycles (i.e., 1 loading phase + 1 regeneration/chlorine exposure phase) were repeated five times. Prior to the first cycle of the long-term loading–regeneration experiments, the zeolite samples were preconditioned with three batch loading–regeneration cycles, in which the regeneration phases were conducted using 100 mg free Cl2/L NaOCl regenerant solutions.
The durability of the SIR-600 samples was assessed by comparing the characteristics of the virgin SIR-600 with that subjected to the five 1-week chlorine exposures. The methods used for particle/material characterization are described in the section below.
2.3. IE Material Durability Tests with pH Exposure
In contrast to the chlorine exposure assessment, the low pH batch exposure tests used a single 90-day-long contact period. For the low pH exposure tests, 50 g of SIR-600 was added to 1 L glass bottles, which were then filled with deionized water, which had the desired pH, sealed as described earlier and rotated in the end-over-end bottle tumbler at 10 rpm for three months. In Zhang’s IE column experiments, the media were exposed to low pH conditions for nearly 2 h during each regeneration cycle, and there were four regeneration cycles in each day, which means the daily exposure duration was 8 h [17]. Thus, the 90 days of low pH batch exposure tests is equivalent to 270 days of column operation. After the three months, the exposed SIR-600 was retrieved utilizing vacuum filtration through 0.45 μm membrane filters and dried in an oven (~105 °C) for 24 h. Then, the cooled samples were characterized. A second batch of bottles containing 50 g of SIR-600 and 1 L of distilled water were also mixed for 90 days to serve as controls. The ammonia uptakes of the exposed SIR-600 samples were determined as described in the previous subsection.
2.4. Analytical Methods
As it is very difficult to analytically distinguish between ammonium (NH4+) and ammonia (NH3), the ammonia was quantified in terms of the total ammonia nitrogen (TAN) concentration. TAN was quantified using a Nessler method, a modified version of Standard Method 4500-NH3 C [18]. The Ca and K ion concentrations were determined using a flame atomic absorption spectrometer (AAS) (PinAAcle 500, PerkinElmer, Waltham, MA, United States). The analytical method stemmed from the Standard Method 3111B [19]. The Hach method 8021 was applied to quantify the free chlorine levels; this method is equivalent to Standard Method 4500-Cl G for drinking water [19]. The pH values were quantified with a pH probe and a pH meter (VER Symphony B10P, VWR, Radnor, PA, USA) (VWR 89231-580, VWR, Radnor, PA, USA).
2.5. Particle/Material Characterization Methods
The effects of long-term chlorine exposure of the SIR-600 media were evaluated through particle grain size analysis, the BET surface area, pore size distribution, Fourier transfer infrared (FTIR) absorbance and scanning electron microscope (SEM) images. The particle size distribution tests were conducted following a sieve test procedure adapted from the ASTM method D6913/D6913M–17 [20]. The BET surface area and pore size distribution quantifications were accomplished using a N2 gas adsorption-based surface area analyzer at the temperature of 77 K (ASAP 2020, Micromeritics, Norcross, GA, USA). The FTIR tests were conducted using a FTIR spectrometer (Nicolet 6700FT-IR, Thermo Electron Corp., Waltham, MA, USA). The SEM images of the SIR-600 were captured with a field emission SEM (JMS7500F, JEOL Ltd., Tokyo, Japan).
The assessment of the impact of long-term low pH exposure tests on SIR-600 characteristics was based on particle size distribution analysis, scanning electron microscope (SEM) images, BET surface area analysis, thermal gravimetric analysis (TGA) and powder X-ray diffraction (PXRD). The latter two were added because the FTIR analysis performed as part of the chlorine exposure impact tests did not show significant differences, so it was decided to try alternative characterization techniques. The particle size distribution analysis, BET and SEM image procedures were the same as above. The thermal gravimetric analysis (TGA) test was conducted in the Civil Engineering Department of the University of Sherbrooke using a differential scanning calorimetry analyzer (Q10, Q Series™, Newcastle, DE, USA) at a temperature rise rate of 10 °C/min; the measurements involved a baseline correction. The PXRD tests were conducted with a Rigaku Ultima IV Diffractometer (IR Technology Services Pvt. Ltd., Mumbai, India).
3. Results
3.1. Impacts of Exposure of Zeolite Particles to High Concentration Chlorine Solutions
The results of the particle size distribution, SEM imaging, BET surface area and pore size analysis, the FTIR spectra and the ion uptake tests of SIR-600 materials before and after the 5-week-long exposure to two NaOCl solutions are presented in the following sections.
3.1.1. Particle Size Distribution
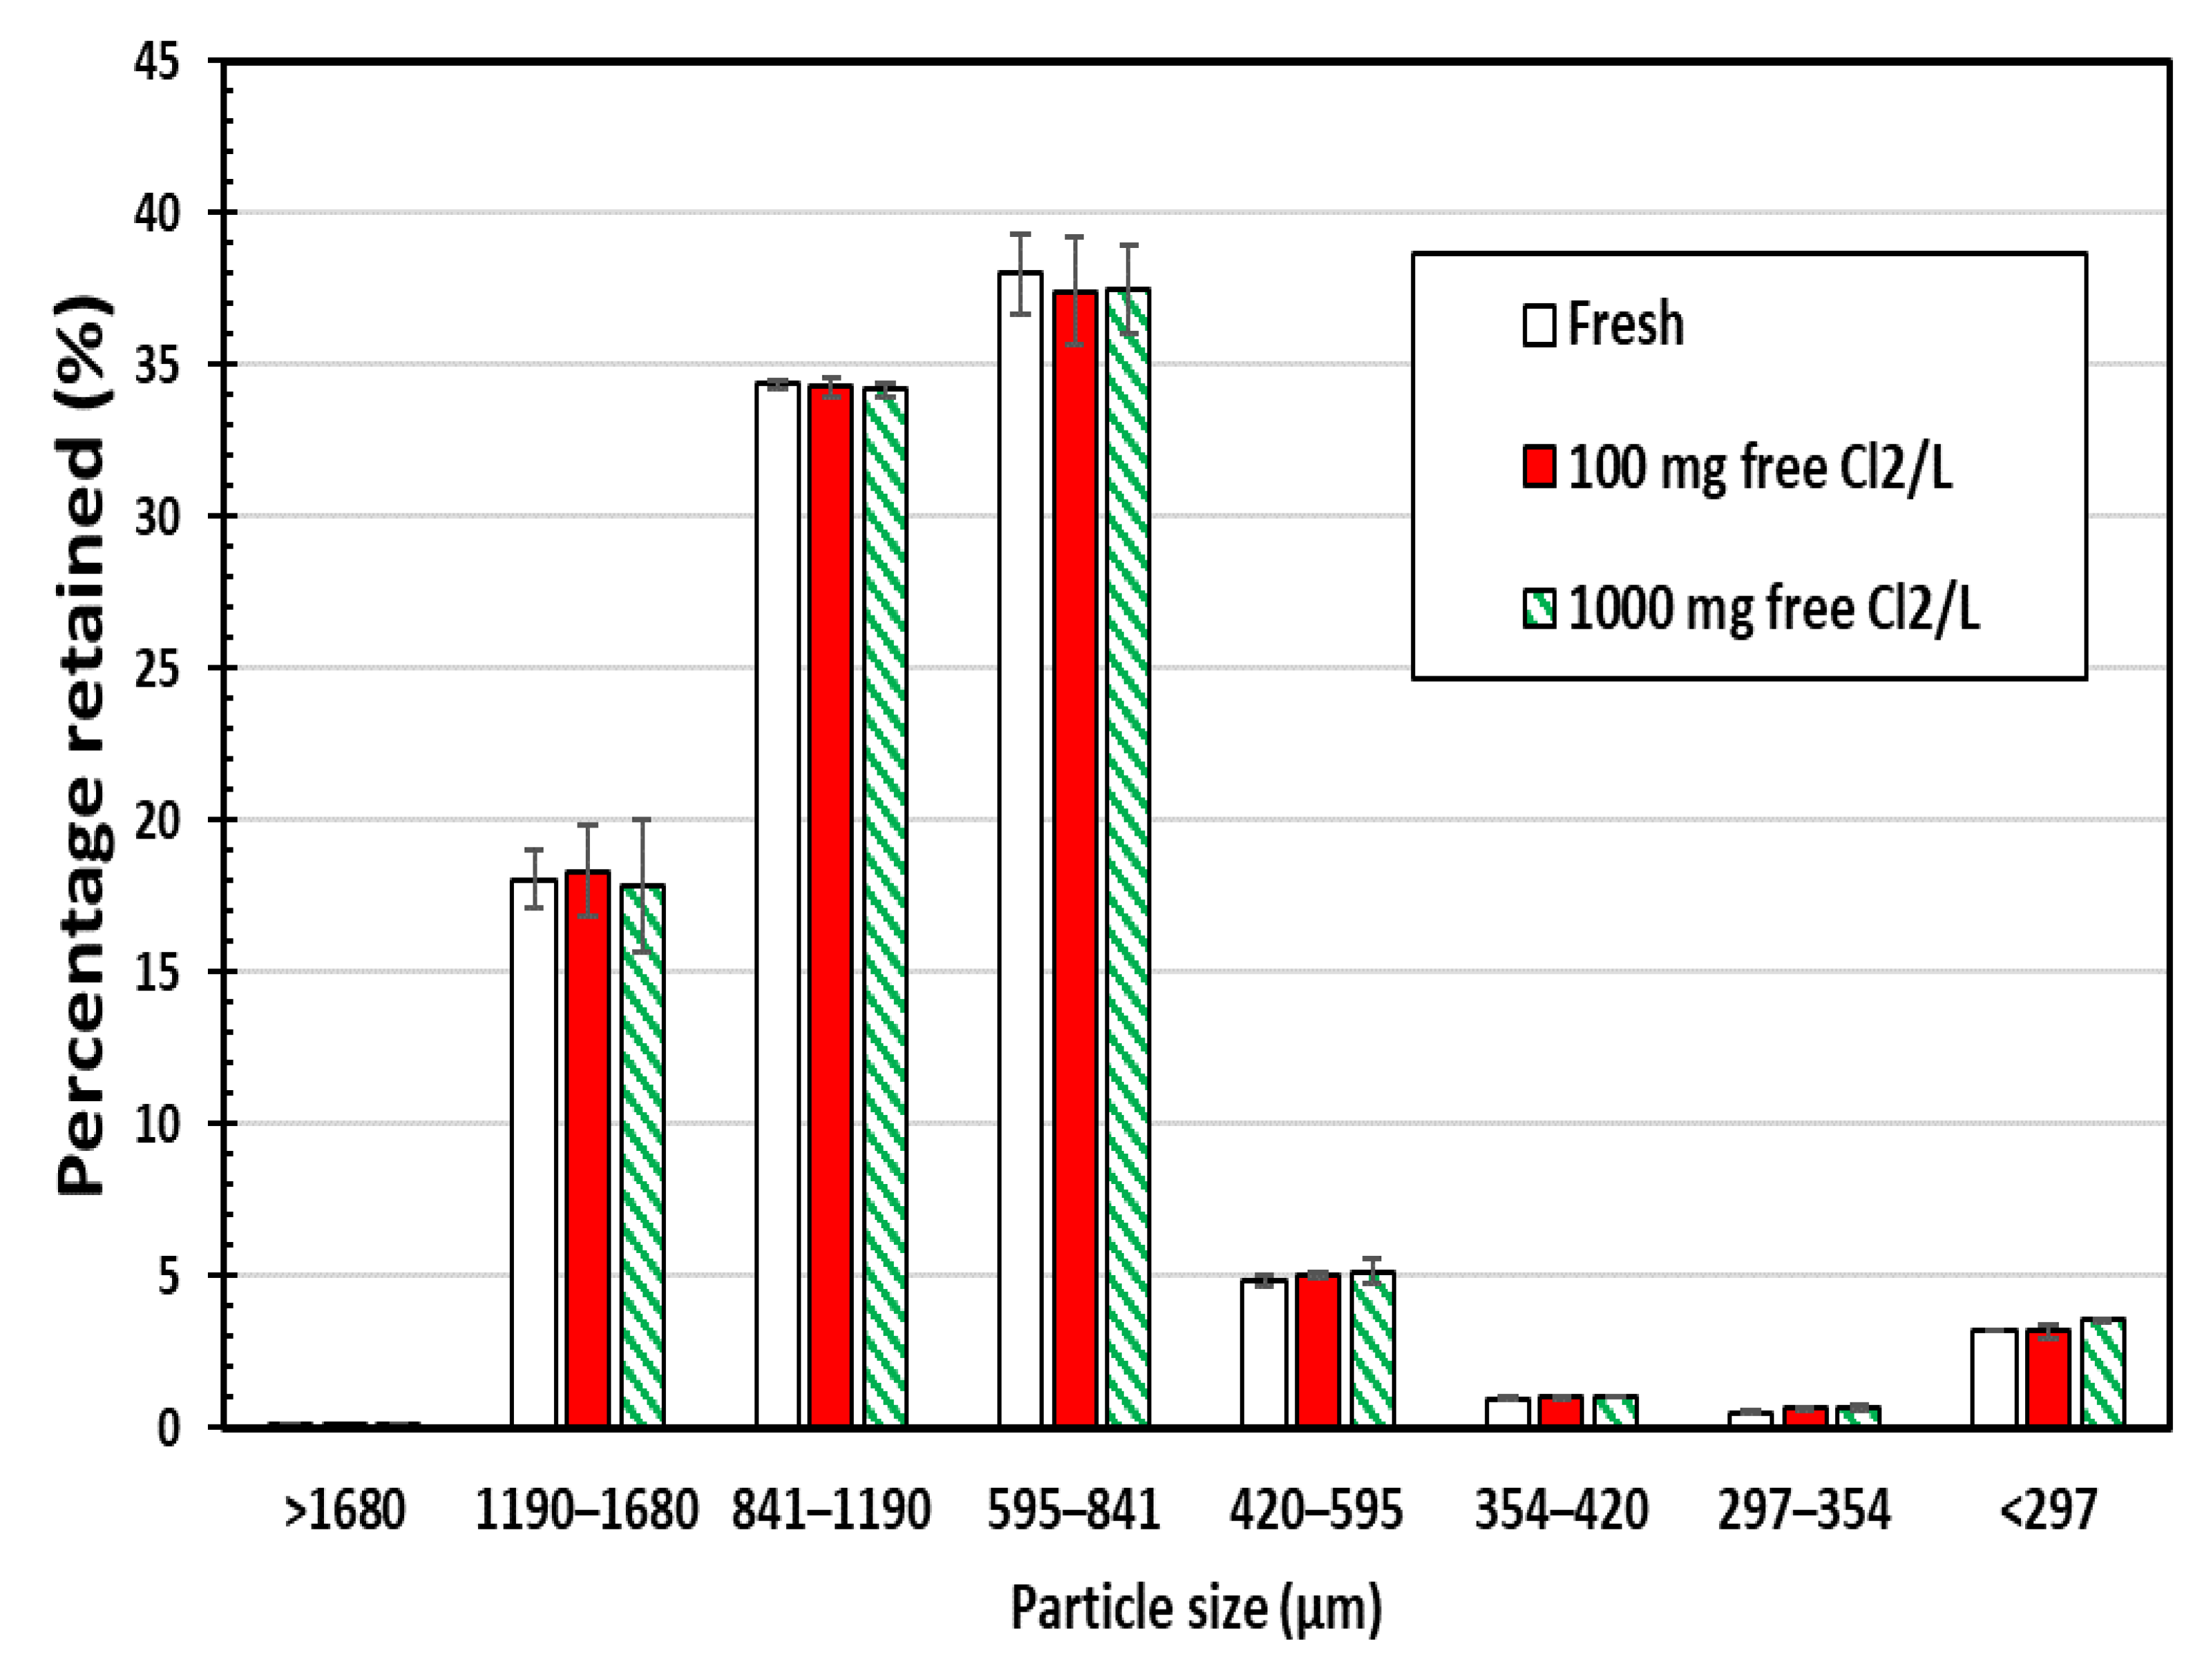
Sieve analyses of chlorine-exposed SIR-600 and fresh SIR-600 samples were conducted to determine the effects of chlorine exposures on the particle size distribution of the material. The following are the key findings of this particle size analysis (Figure 1); note that the error bars presented in this manuscript represent the standard error. First, there was no statistically significant difference between the particle size distribution for the fresh versus the 100 ppm and 1000 mg free Cl2/L exposed zeolite samples. It can be concluded that the SIR-600 particles were not fragmented into smaller particles by the five-week chlorine exposures (up to 1000 ppm as free Cl2). Second, the particle size of SIR-600 was mostly between 420 and 1680 microns, which agrees with the manufacturer’s specification outlined in Table 1 [12].
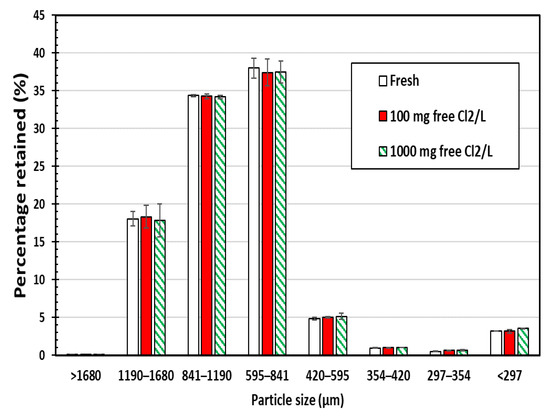
Figure 1.
Particle size distributions of SIR-600 with and without 5-week chlorine (100 and 1000 ppm as free Cl2) exposure (average value of three replicates ± standard error).
3.1.2. SEM Analysis
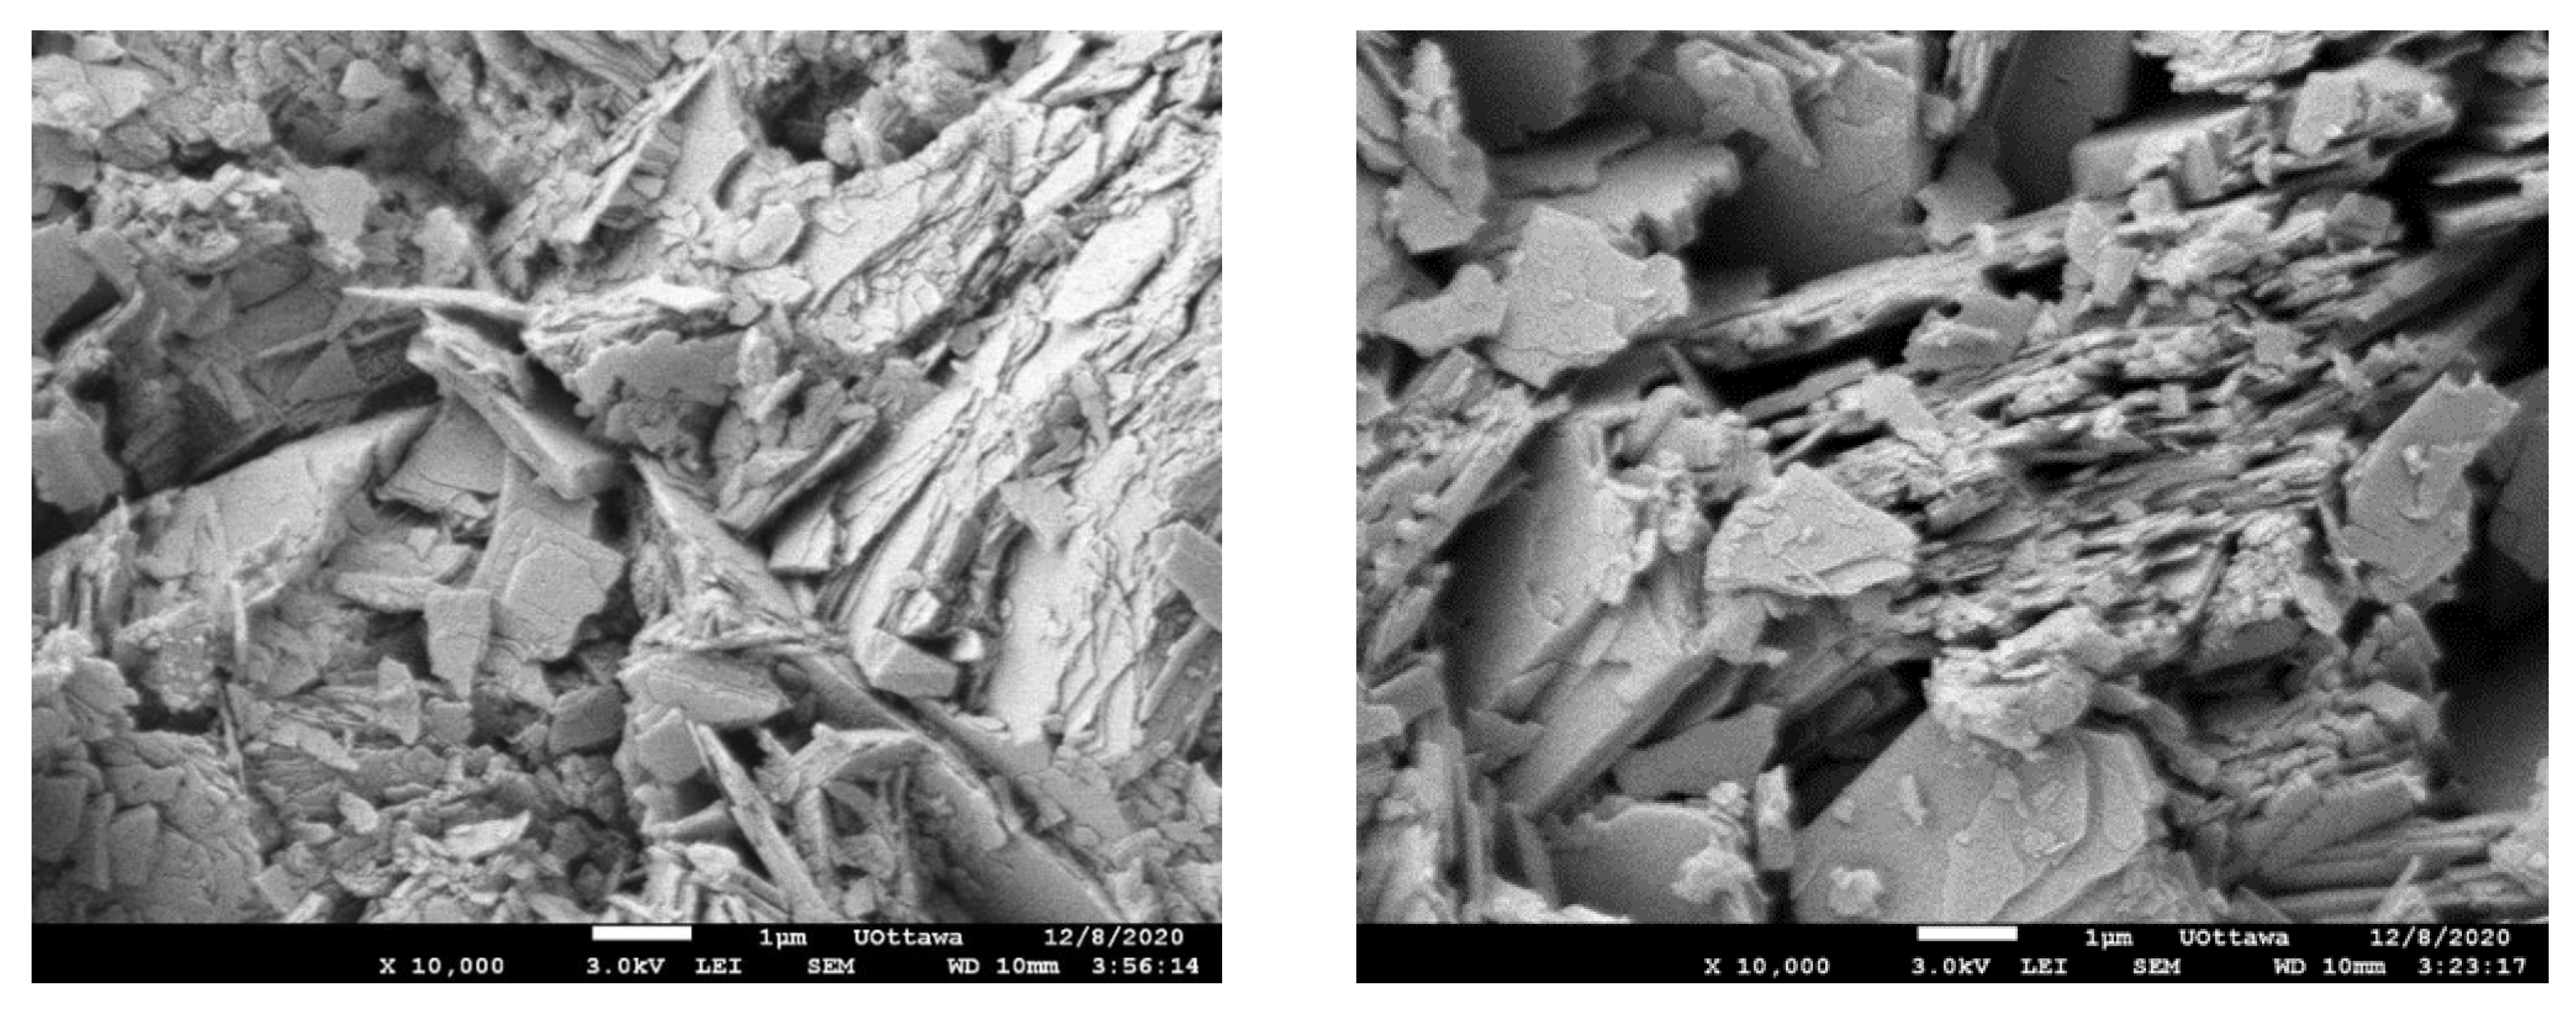
The SEM images (Figure 2) reveal that the SIR-600 is in the shape of stratified plates or sheets, which is a clinoptilolite characteristic. Other studies have also reported similar SEM images [21,22]. When the morphology of fresh and chlorine-exposed SIR-600 was compared, there were no discernible differences. This is consistent with the unchanged particle size distribution.

Figure 2.
SEM image of SIR-600 after 5-week 1000 ppm as free Cl2/L exposure (left); SEM image of fresh SIR-600 without chlorine exposure (right).
3.1.3. BET Surface Area
The adsorbed N2 gas versus relative pressure graphs for SIR-600 can best be described as BET type II isotherms with a slight hysteresis for all of the materials, which produced the same patterns [23]. In comparison with the Langmuir model, the BET model provides a more precise estimate of the surface area for this type of zeolite for type II isotherms [23]. The BET surface area of the fresh SIR-600 is 16.3 ± 1.4 m2/g, and there is no appreciable difference with that of the SIR-600 samples exposed to the two levels of chlorine and the control. The BET surface areas of tested zeolites reported by other studies were within the same range (11–20 m2/g) [6,22,24]. The pore diameter (dpore) calculations based on the N2 adsorption analysis also demonstrated that the majority of this material’s total pore volume consists of mesopores (20 Å > dpore <50 Å) and macropores (dpore > 50 Å). This finding largely agrees with the characteristic of type II isotherms, in which macropores account for the majority of the pore volume [23].
The above BET results are consistent with the particle size distribution and SEM images described earlier; however, these findings conflict with those of Zhang et al. [10]. Their experiments with a different zeolite showed that after 10 NaOCl–NaCl regeneration cycles, the zeolite material’s BET surface area increased from 67.9 to 81.4 m2/g, while the micropore volume increased from 27.3% to 31.8%. Their zeolite was from a different source and had a much larger BET area (67.9 versus 16 m2/g), as it was much more microporous (average dpore 31.6 versus 204 Å). Accordingly, it is speculated that the conflicting results with the current study are the result of differences in the zeolitic minerals and/or the smaller pores in the zeolite used by Zhang et al. [10], which make it more susceptible to chlorine attack. Regardless, this type of study bears repetition.
3.1.4. FTIR Spectra
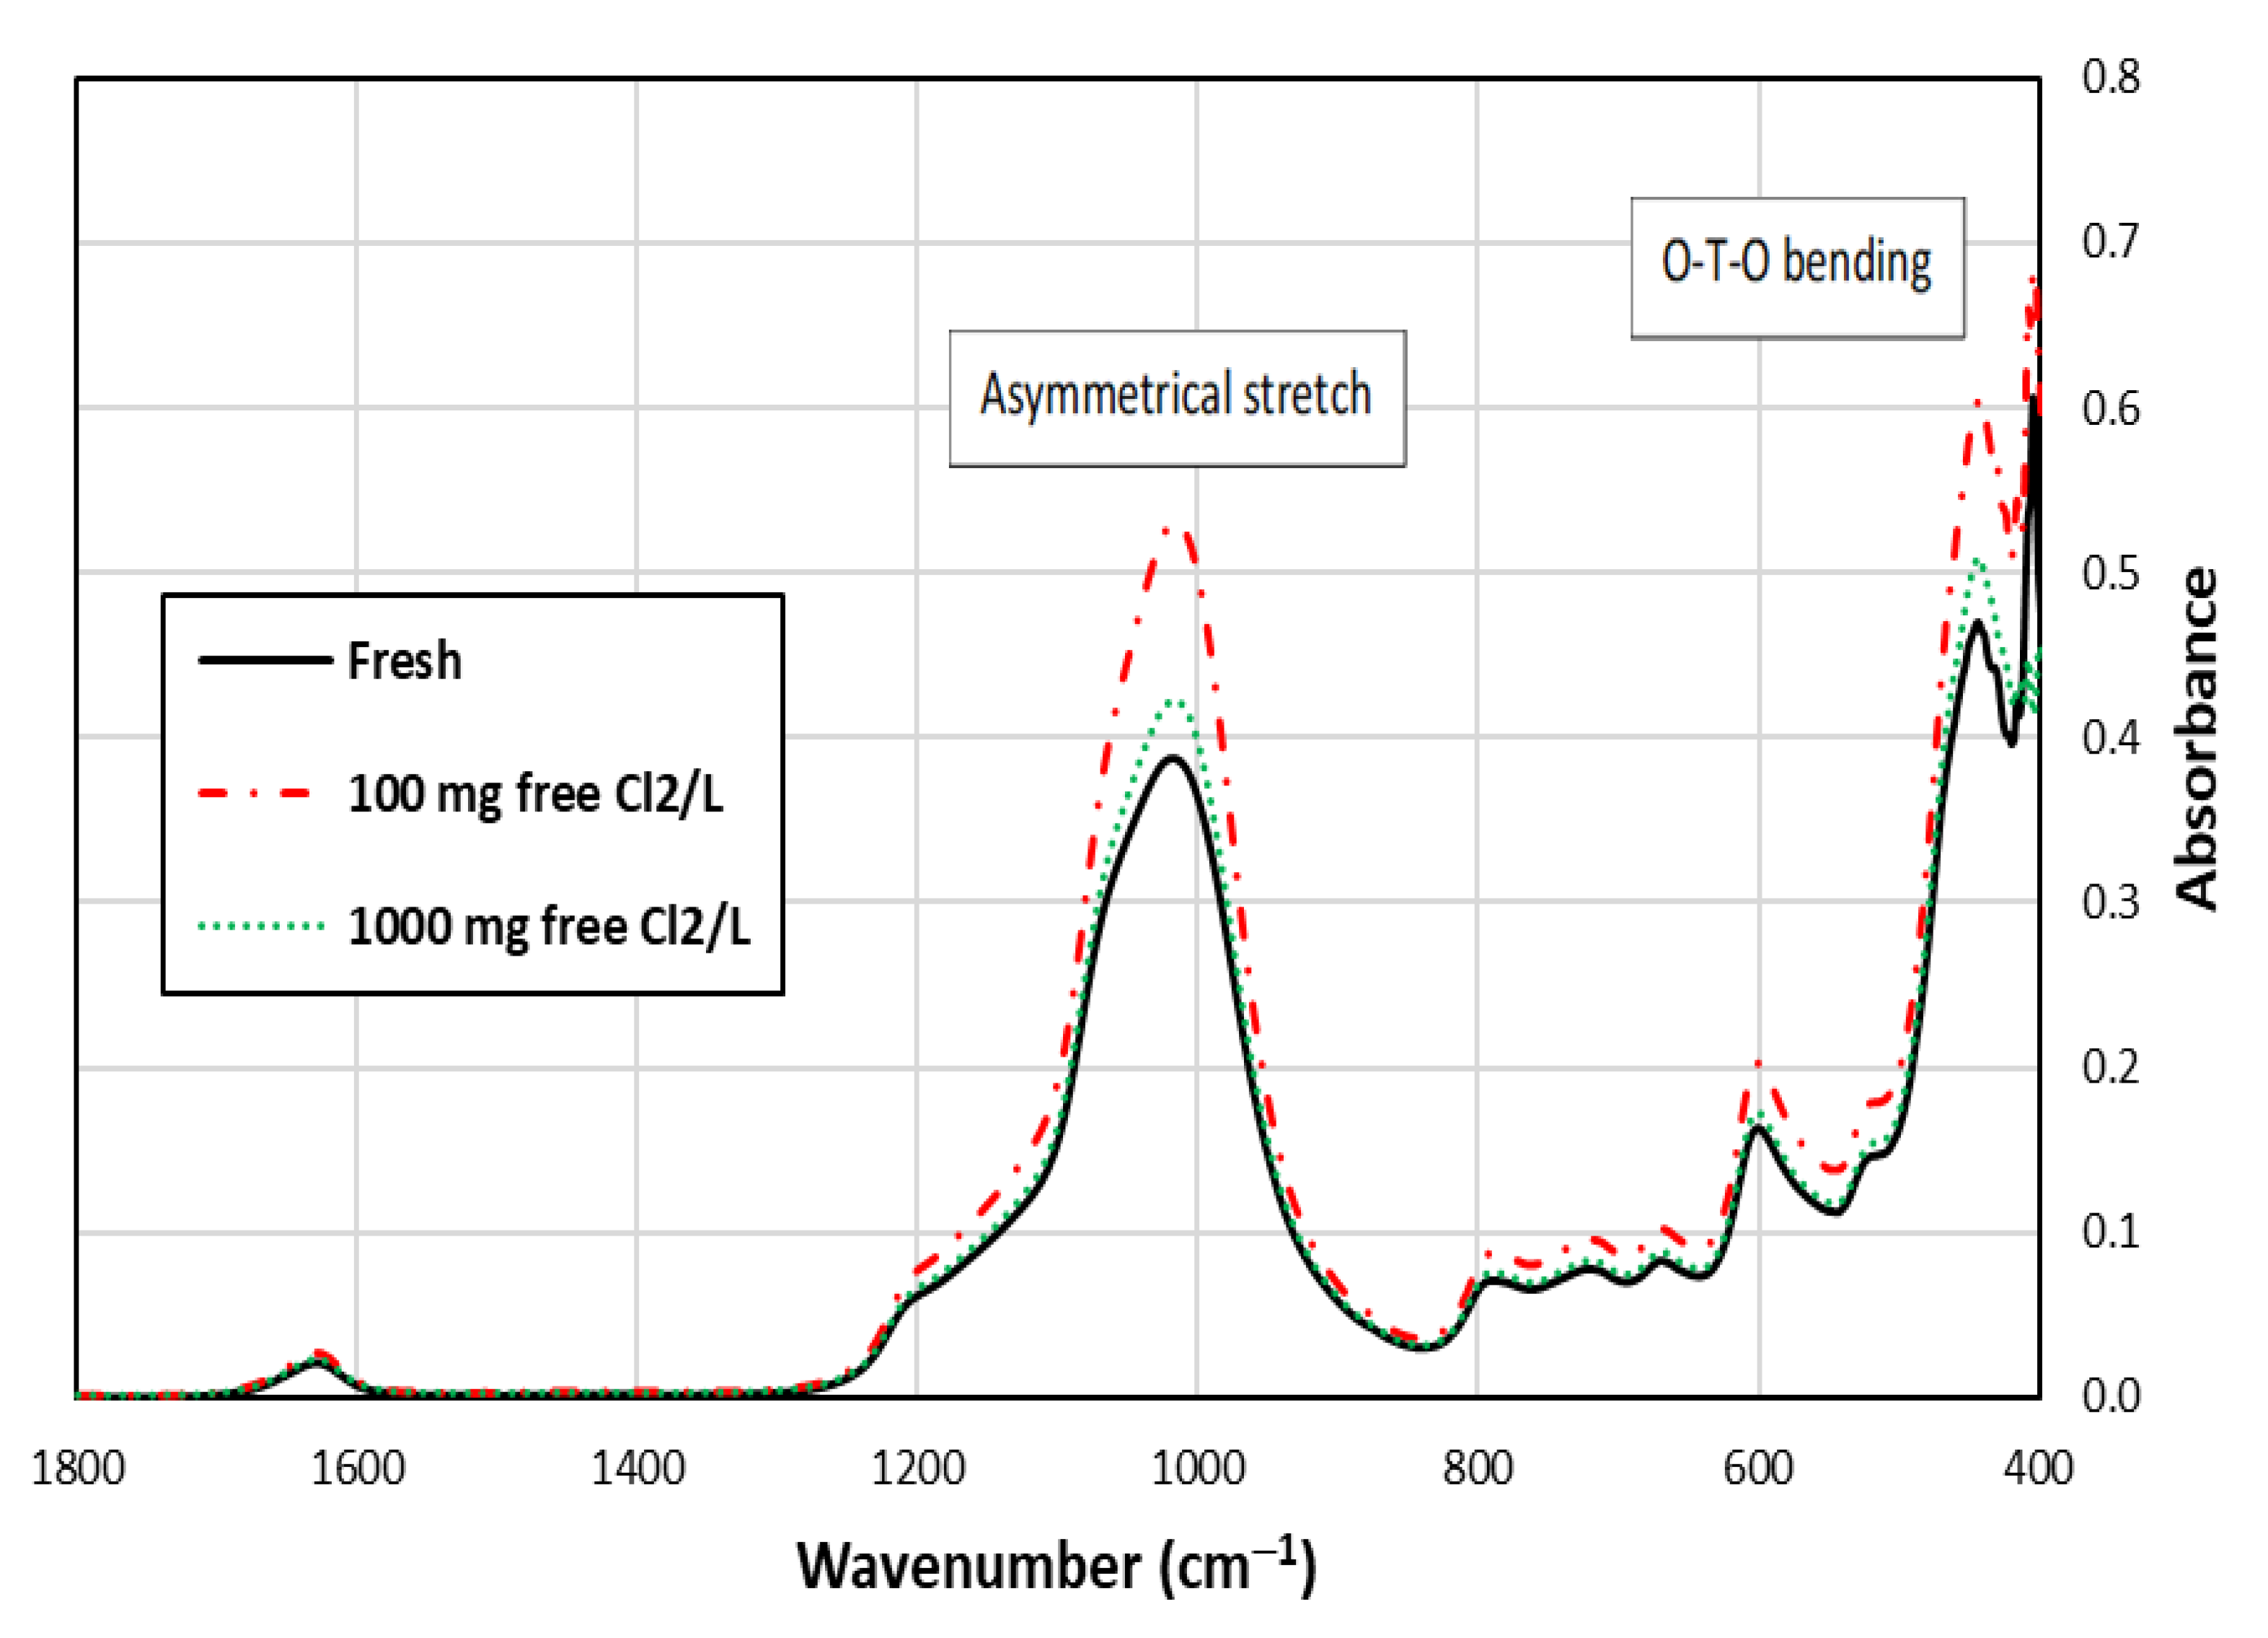
Zeolites are aluminosilicate minerals. The aluminosilicate framework, which is composed of SiO4 and AlO4, has negative charges and exhibits affinity to cations by substituting Al3+ for Si3+ in the silica framework [25,26]. The framework consists of Al and Si tetrahedral basic building units connected by different types of bonds [24]. According to Lecher and Jentys [27], the zeolite’s main bonds (and their FTIR wave numbers) are asymmetrical stretch (950–1250 cm−1), symmetrical stretch (650–720 cm−1) and O-T-O bending (439–449 cm−1), where T corresponds to cations such as Al3+ and Si4+.
Figure 3 shows that the peak representing O-T-O bending is noticeable for the fresh and chlorine-exposed SIR-600 samples [25,26,27]. Other lattice vibration bands, such as asymmetrical stretch, were also detected in the spectra in addition to the O-T-O bending. These results are consistent with those reported by Mozgawa [28]. FTIR is a qualitative tool, which aids in determining the presence of specific bonds, but the height of the peaks is not informative. It can be seen that the patterns and locations of bonds were similar in the IR spectra of the samples shown in Figure 3, indicating that the chlorine exposure did not significantly change the zeolite structure.
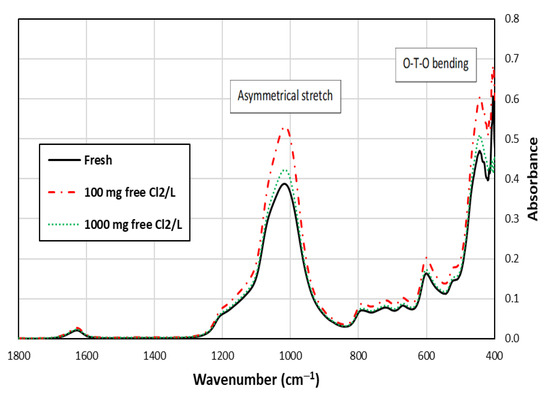
Figure 3.
FTIR spectra of SIR-600 with and without 5-week chlorine (100 and 1000 mg free Cl2/L) exposures.
3.1.5. Ion Uptake Tests
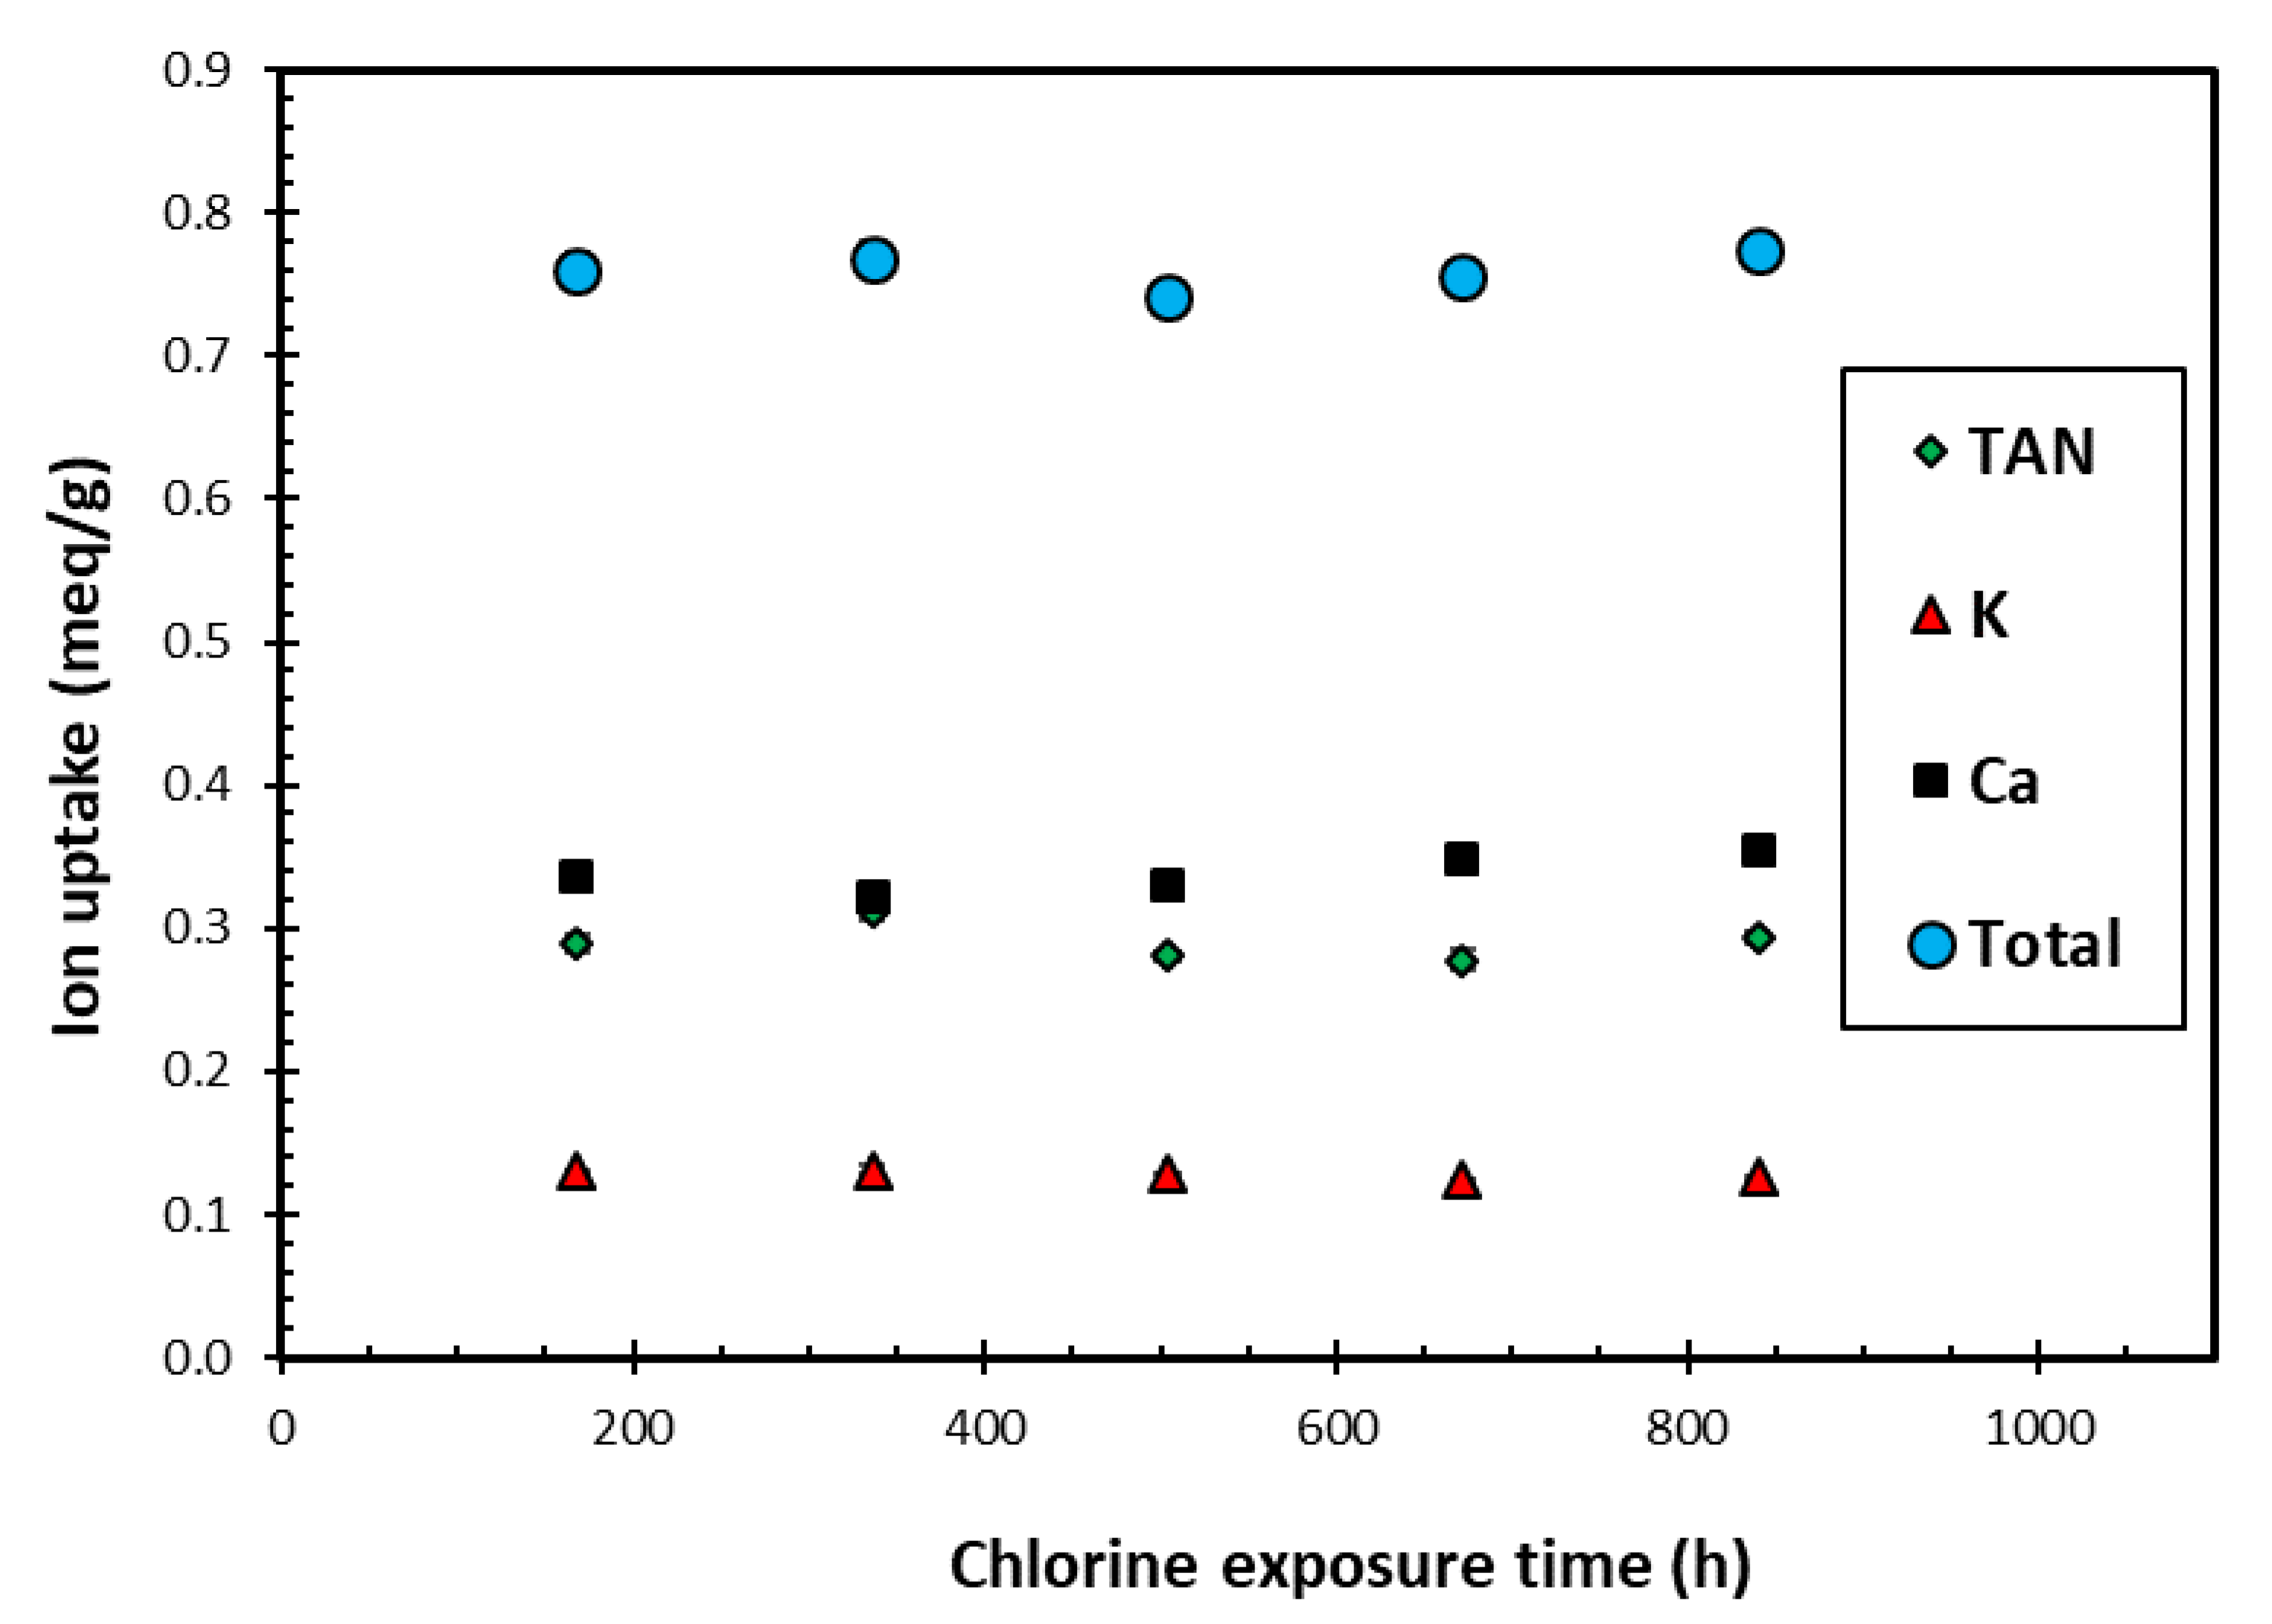
Figure 4 presents the TAN, K+ and Ca2+ uptakes achieved by loading the SIR-600 with the synthetic EIMWW after each of the one-week exposures to 1000 mg free Cl2/L NaOCl solutions. Note that these experiments were conducted in triplicate, and as the results were highly reproducible, they resulted in very small confidence intervals, which are not readily visible in Figure 4. The key observation is that the exposure to 1000 mg free Cl2/L solutions over 5 weeks did not significantly impact the individual ion and total ion uptake. These findings are consistent with the FTIR, BET and particle size distribution analysis results. The distribution among the ions adsorbed also did not change with exposure time. The TAN uptake was significantly higher than the K+ uptake, which is consistent with earlier column experiments using the same EIMWW and media [11]. It should be noted that the K uptakes were significantly lower than those for TAN, and those of Ca were slightly higher than those for TAN; thus, the ion preference sequence is Ca > TAN > K. The ion uptakes are proportional to the relative ion concentration of the challenge water and are consistent with other test results using the same EIMWW and zeolite [12,17]. This study’s ion uptake preference sequence contrasts with the K > TAN > Ca general preference reported by the zeolite supplier and the literature [12,29]; however, their sequence relates to equimolar solutions, which are different from those used in the current study.
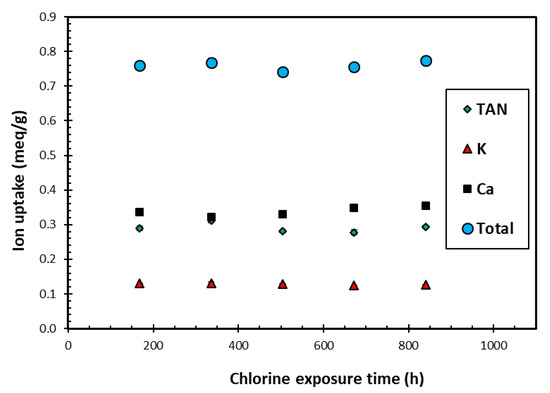
Figure 4.
The variation of average ion uptake with chlorine exposure time using initial chlorine level of 1000 ppm as free Cl2 in each exposure cycle.
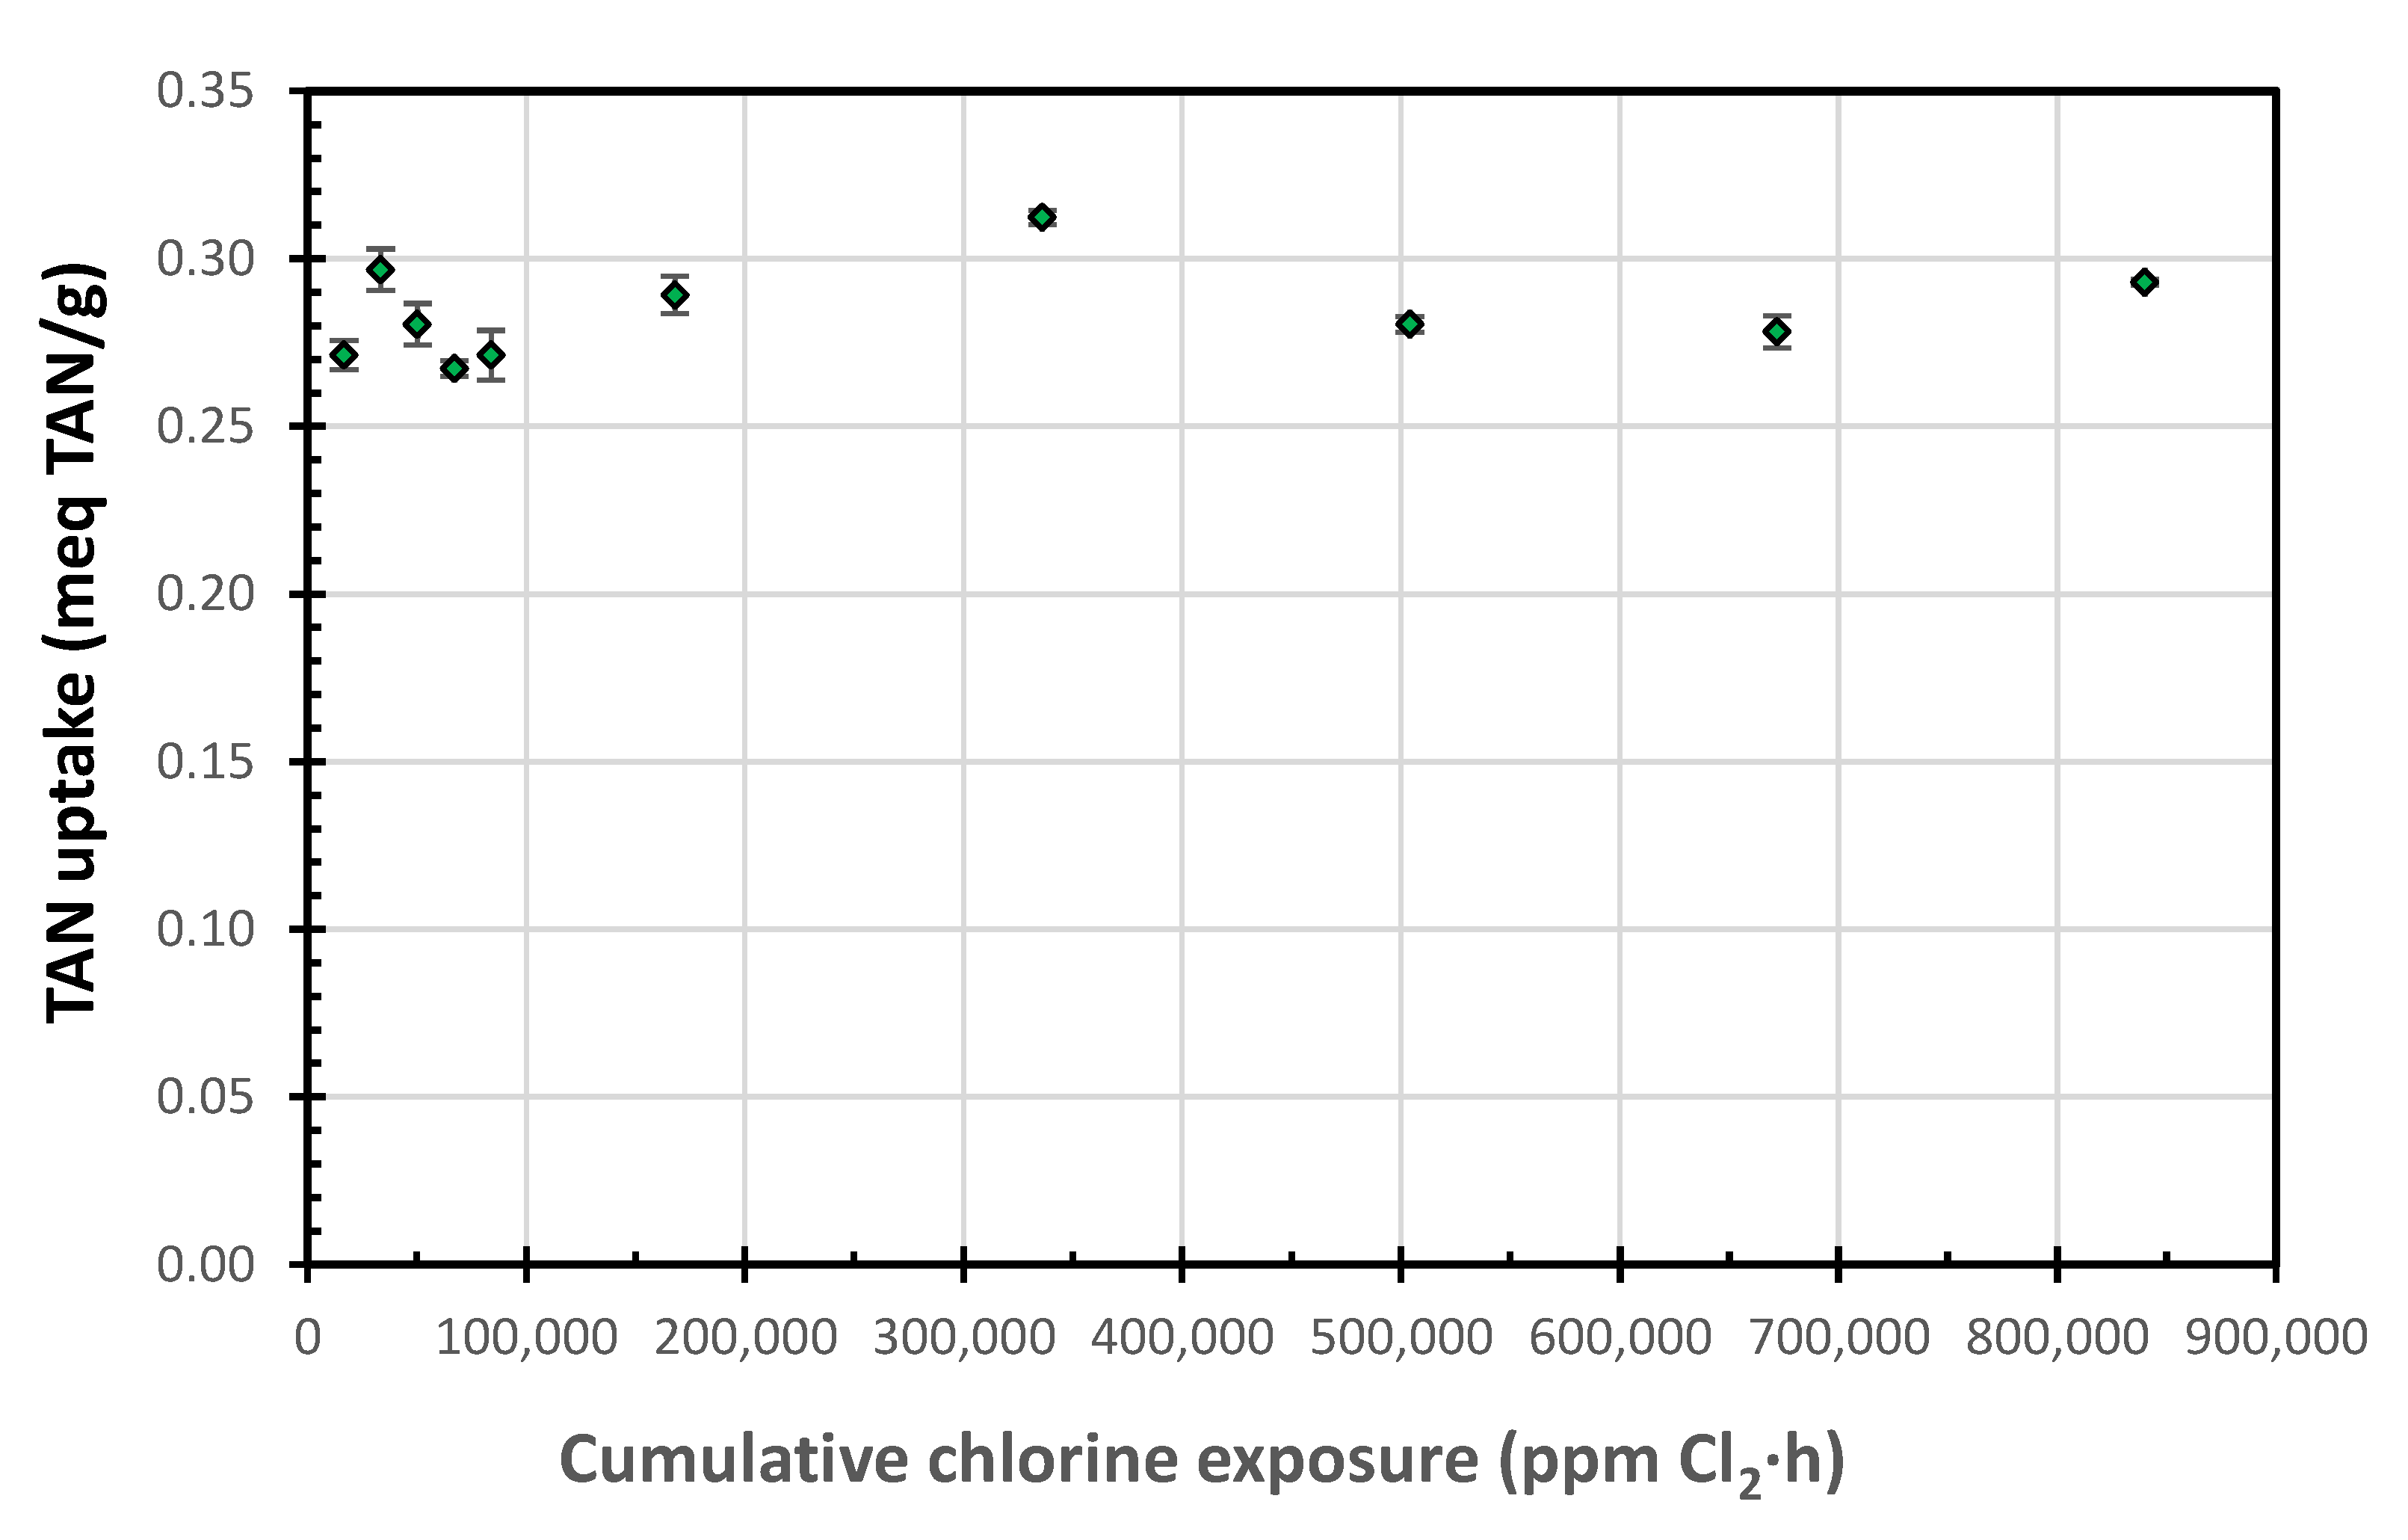
The ion uptakes following the 100 mg free Cl2/L week-long exposures were slightly lower than those for the 1000 mg free Cl2/L exposures; however, they showed the same pattern. The lower values are likely due to the low Na+ concentration (32.4 versus 324 mg Na/L) in the regenerant, which should enhance the SIR-600 regeneration and increase its ion uptake. While SIR-600′s supplier recommended that chlorine exposure should be limited to 106 ppm-h, the current results suggest that the zeolite was resistant to chlorine exposure levels thousands of times higher (840,000 ppm-h, or 7900 times higher) than the level reported above (Figure 5). This graph was generated by combining the TAN uptakes for 100 and 1000 mg free Cl2/L regeneration data.
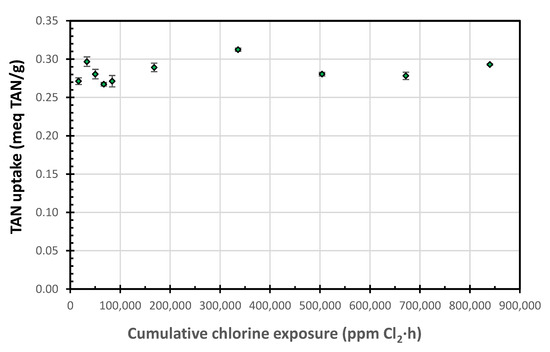
Figure 5.
TAN uptake as a function of the cumulative chlorine exposure.
During the 100 mg Cl2/L chlorine exposure tests, the pH decreased from 10 to approximately 6, and for the 1000 mg Cl2/L chlorine exposure tests, the pH decreased from 10 to approximately 9. The higher chlorine concentration appears to have a buffering effect. These pHs are significantly higher than the pH ~ 3 observed by Zhang et al. [11] for their column NaOCl regeneration experiments; the differences are attributed to the differences between the batch and continuous flow column setups. Note that the pHs in the chlorine exposure tests were significantly higher than those investigated in the low pH long exposure tests, that follow.
3.2. Impact of Exposure of Zeolite Particles to Long-Term Low pH Exposure
3.2.1. Particle Size Distribution
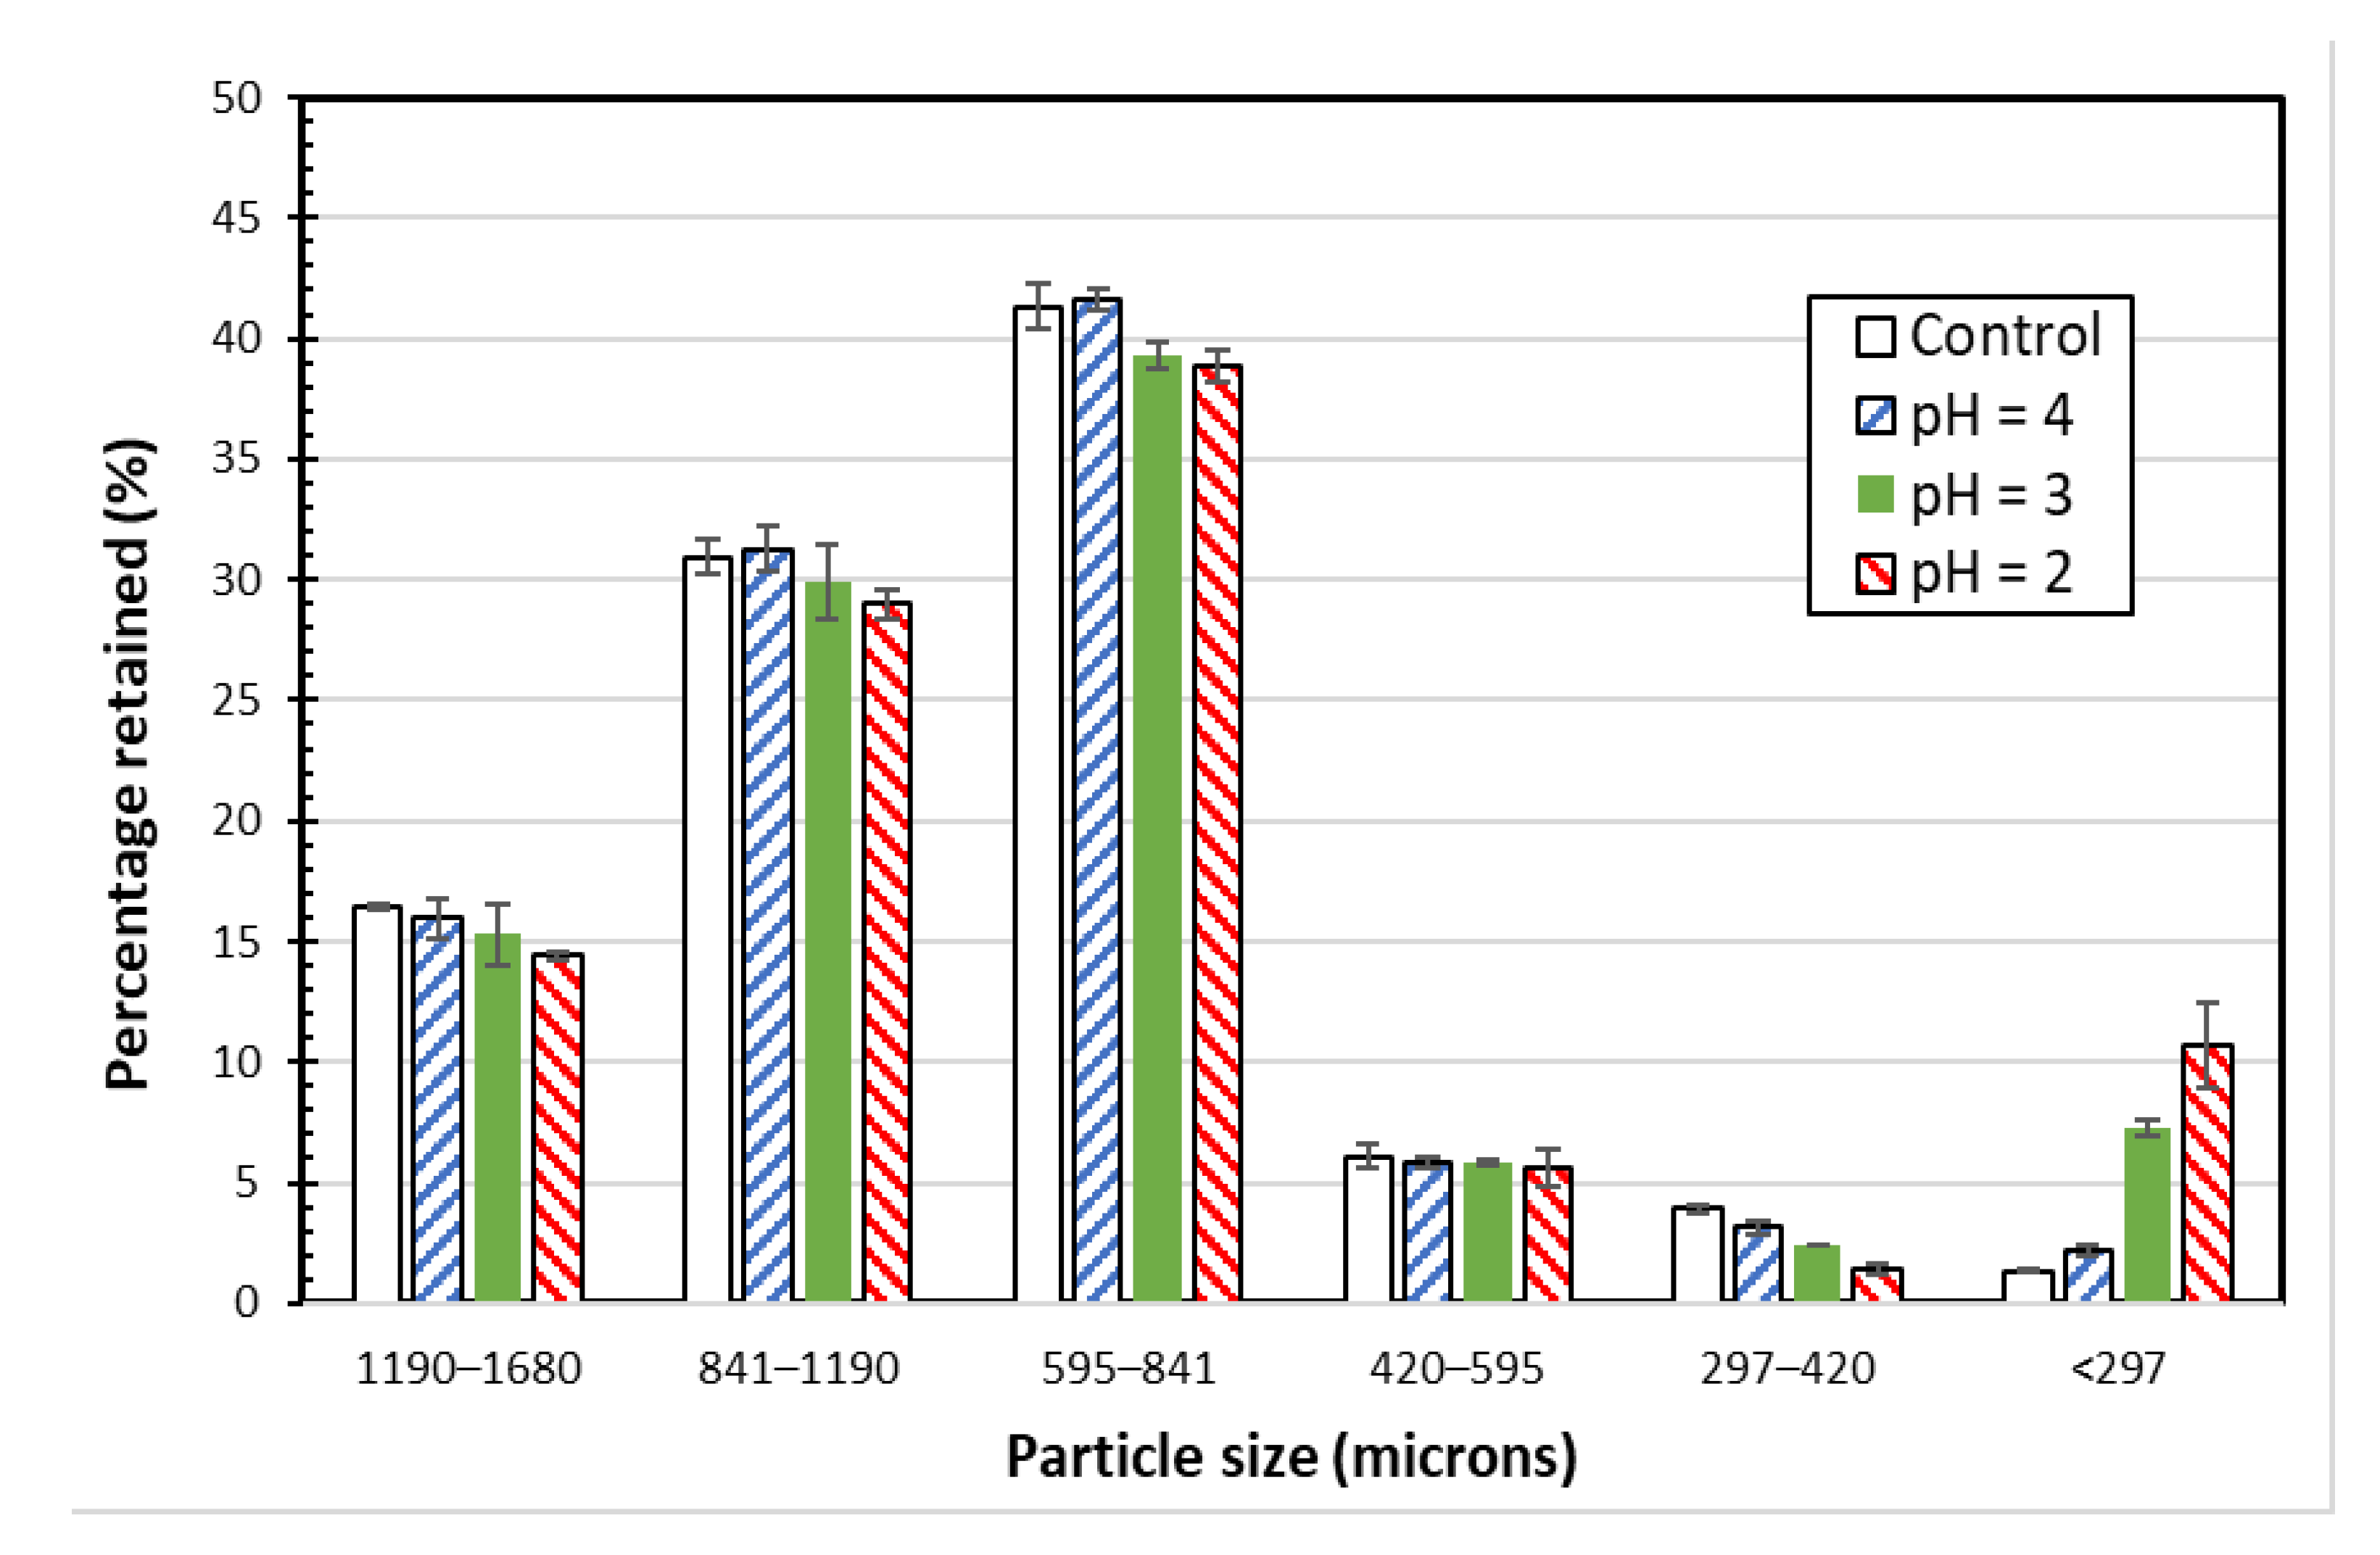
Figure 6 shows the particle size distribution analysis for the control SIR-600 samples and the SIR-600 samples exposed to low pH solutions for 90 days; the error bars represent the standard errors based on the results of triplicate tests. For the control SIR-600 samples, most particles were between 420 microns and 1680 microns in size. Note that the low pH exposure tests were performed using a different batch of SIR-600; yet, the particle size distribution was very similar to that of SIR-600 samples used in the chlorine exposure tests (Figure 1). The small variations might have resulted from friction created by the longer mixing periods in the tumbler or by the fact that the samples came from different SIR-600 batches.

Figure 6.
Particle size distributions of SIR-600 exposed to distilled water (control) and pH 4, 3 and 2 solutions.
Because of the overlapping confidence intervals of the three largest particle size fractions, the low pH exposure does not appear to have a clear and significant impact on SIR-600′s main particle sizes. However, the average mass fraction values for the three largest fractions (i.e., 1190–1680 um, 841–1190 um and 591–841 um fractions) and the two smallest fractions (i.e., 297–420 um and <297 um) indicate that the lower pH exposure resulted in a slight decrease in the largest particle size fractions and a significant increase in the smallest fraction. For example, for the pH = 2 exposed SIR-600, the three largest fractions were, respectively, 12, 6 and 6 percent smaller than those of the control SIR-600, while the fines (i.e., fraction < 297 um) were 7.1-fold higher than those of the control. Therefore, the data of fine particles suggest that particle degradation caused by exposure to pH 2 and 3 resulted in the creation of fines (<297 microns), and the mass of the fines is a function of pH. Therefore, it seems that the zeolite particles decreased slightly in size (particularly the 297–420 micron fraction) as a result of being exposed to extremely low pHs, i.e., 3 and below.
3.2.2. SEM Analysis
Figure 7 presents the SEM images of the control SIR-600 and the SIR-600 samples exposed to the low pHs for three months. The SEM images show that the control SIR-600 has a rough surface, which is a typical feature of clinoptilolite [17]. By contrast, the low pH exposure appears to have altered the exterior surface of the IE materials. For all the low pH exposure samples, the sharp edges appeared to have been ground down, resulting in smoother surfaces. This grinding should result in smaller particle sizes and the creation of fines, and this was indeed consistent with the particle size distribution analysis. The surface smoothening of the particles subjected to pH = 4 solution does not result in the creation of appreciable extra fines. The surface smoothening of the particles subjected to pH = 2 and pH = 3 solutions is consistent with the observed abrasion losses and production of fines. For pH = 4 samples, it seems that the surface smoothening was not as profound, resulting in fewer smaller particles created. It should be noted that these are surface images, which give no indication of how deep into the particles the impact of the low pH solutions was.
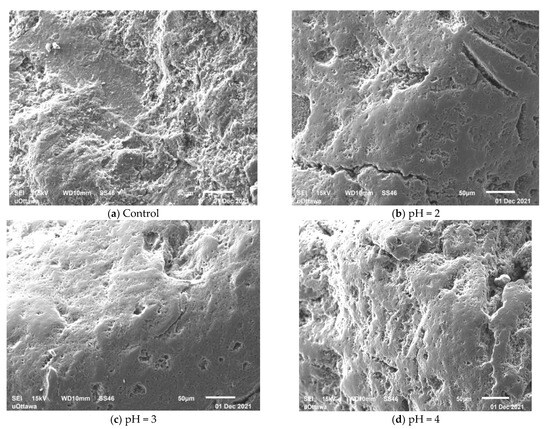
Figure 7.
SEM image of SIR-600 control (a); and SEM images after 3 months of pH = 2 (b); pH = 3 (c); and pH = 4 (d) solutions.
3.2.3. BET Surface Area
The BET surface area of the control samples is comparable to that reported in Section 3.1.3 for SIR-600 (15.3 versus 16.3 m2/g). The differences may be due to the fact that these SIR-600 samples originated from a different batch than that used in the chlorine exposure tests. Additionally, the values are within the 11 to 20 m2/g range reported as typical for clinoptilolites [6,22,24]. The BET surface areas for the samples exposed to pH = 4 and pH = 2 were essentially the same as that of the control. Surprisingly, the BET surface area for the sample exposed to pH = 3 was higher (15%), so it appears to be an outlier. Unfortunately, samples were not available to repeat the measurements. Thus, it appears that exposure to solutions with pHs as low as 2 does not appear to impact the BET surface area. These relatively small BET area changes are in contrast with the large BET changes reported by Korkuna et al. [24]; however, they used a 12M HCl solution, which results in a much lower pH.
3.2.4. Thermogravimetric Analysis (TGA)
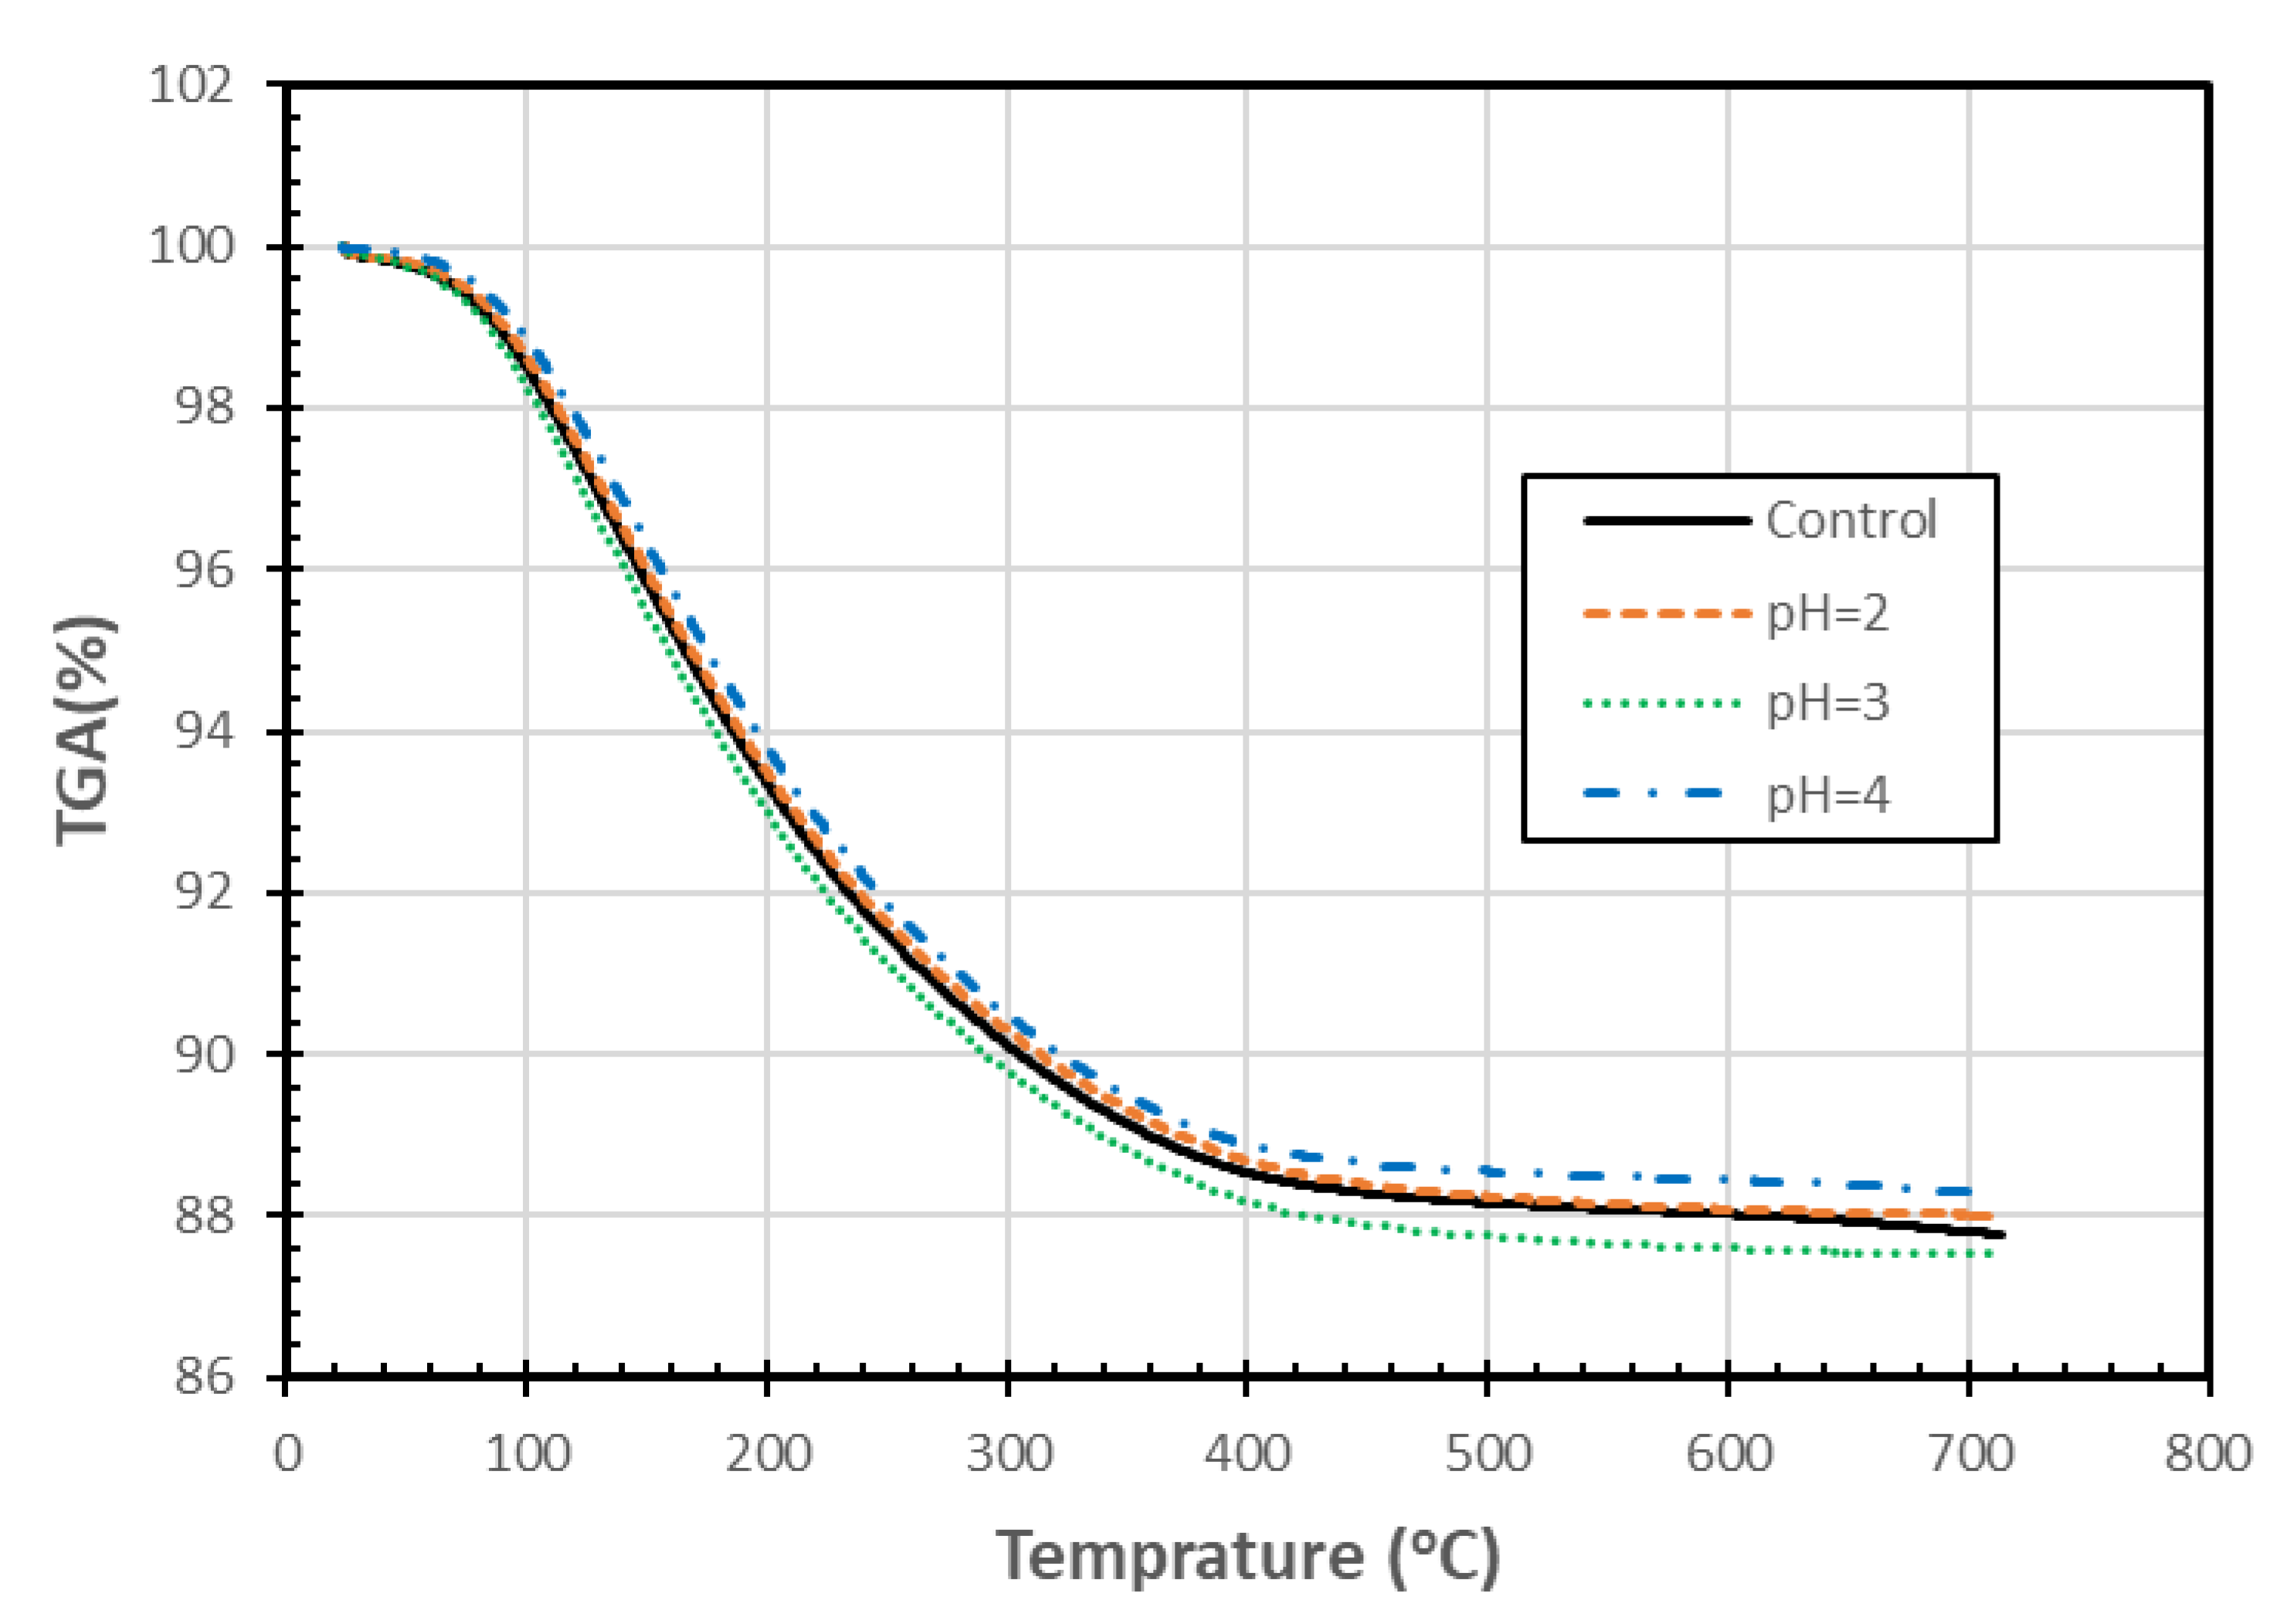
Figure 8 shows that the TGA of mass patterns were very similar for the zeolite samples exposed to different pH for 90 days. The slight differences could be the result of experimental variability or possibly due to changes associated with the different levels of pH exposure. These changes are smaller than those observed by Korkuna et al. [24] for another clinoptilolite, which was treated with a much stronger acid. The TGA data were also used to generate differential thermogravimetric graphs (DTG) (not included), which also showed small differences among the various treatments. As there is no consistent pattern with decreasing pH, and the changes are relatively insignificant, the differences may be due to sample variability. The resulting differential thermal analysis/differential scanning calorimetry graphs (not included) also had similar patterns, and again, the differences among the various treatments did not follow a clear pattern with changing pH. Increasing the maximum temperature within the TGA test from 700 °C to 1100 °C might have helped identify some differences among the materials, but we did not have sufficient material to perform the TGA tests again. Based on the TGA tests conducted, it is concluded that exposure to different pHs did not appear to result in a loss of thermal properties of the zeolite samples.
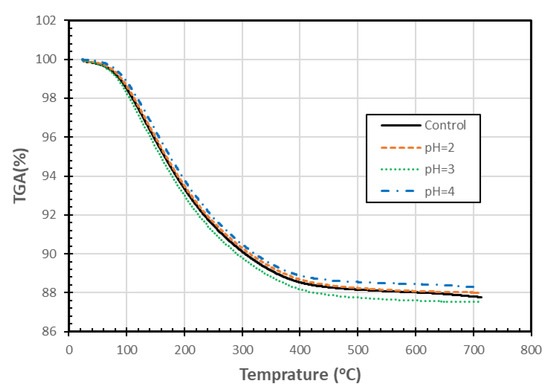
Figure 8.
TGA analysis of SIR-600 exposed to distilled water (control) and different pH solutions (pH = 2, 3, 4).
3.2.5. PXRD Analysis
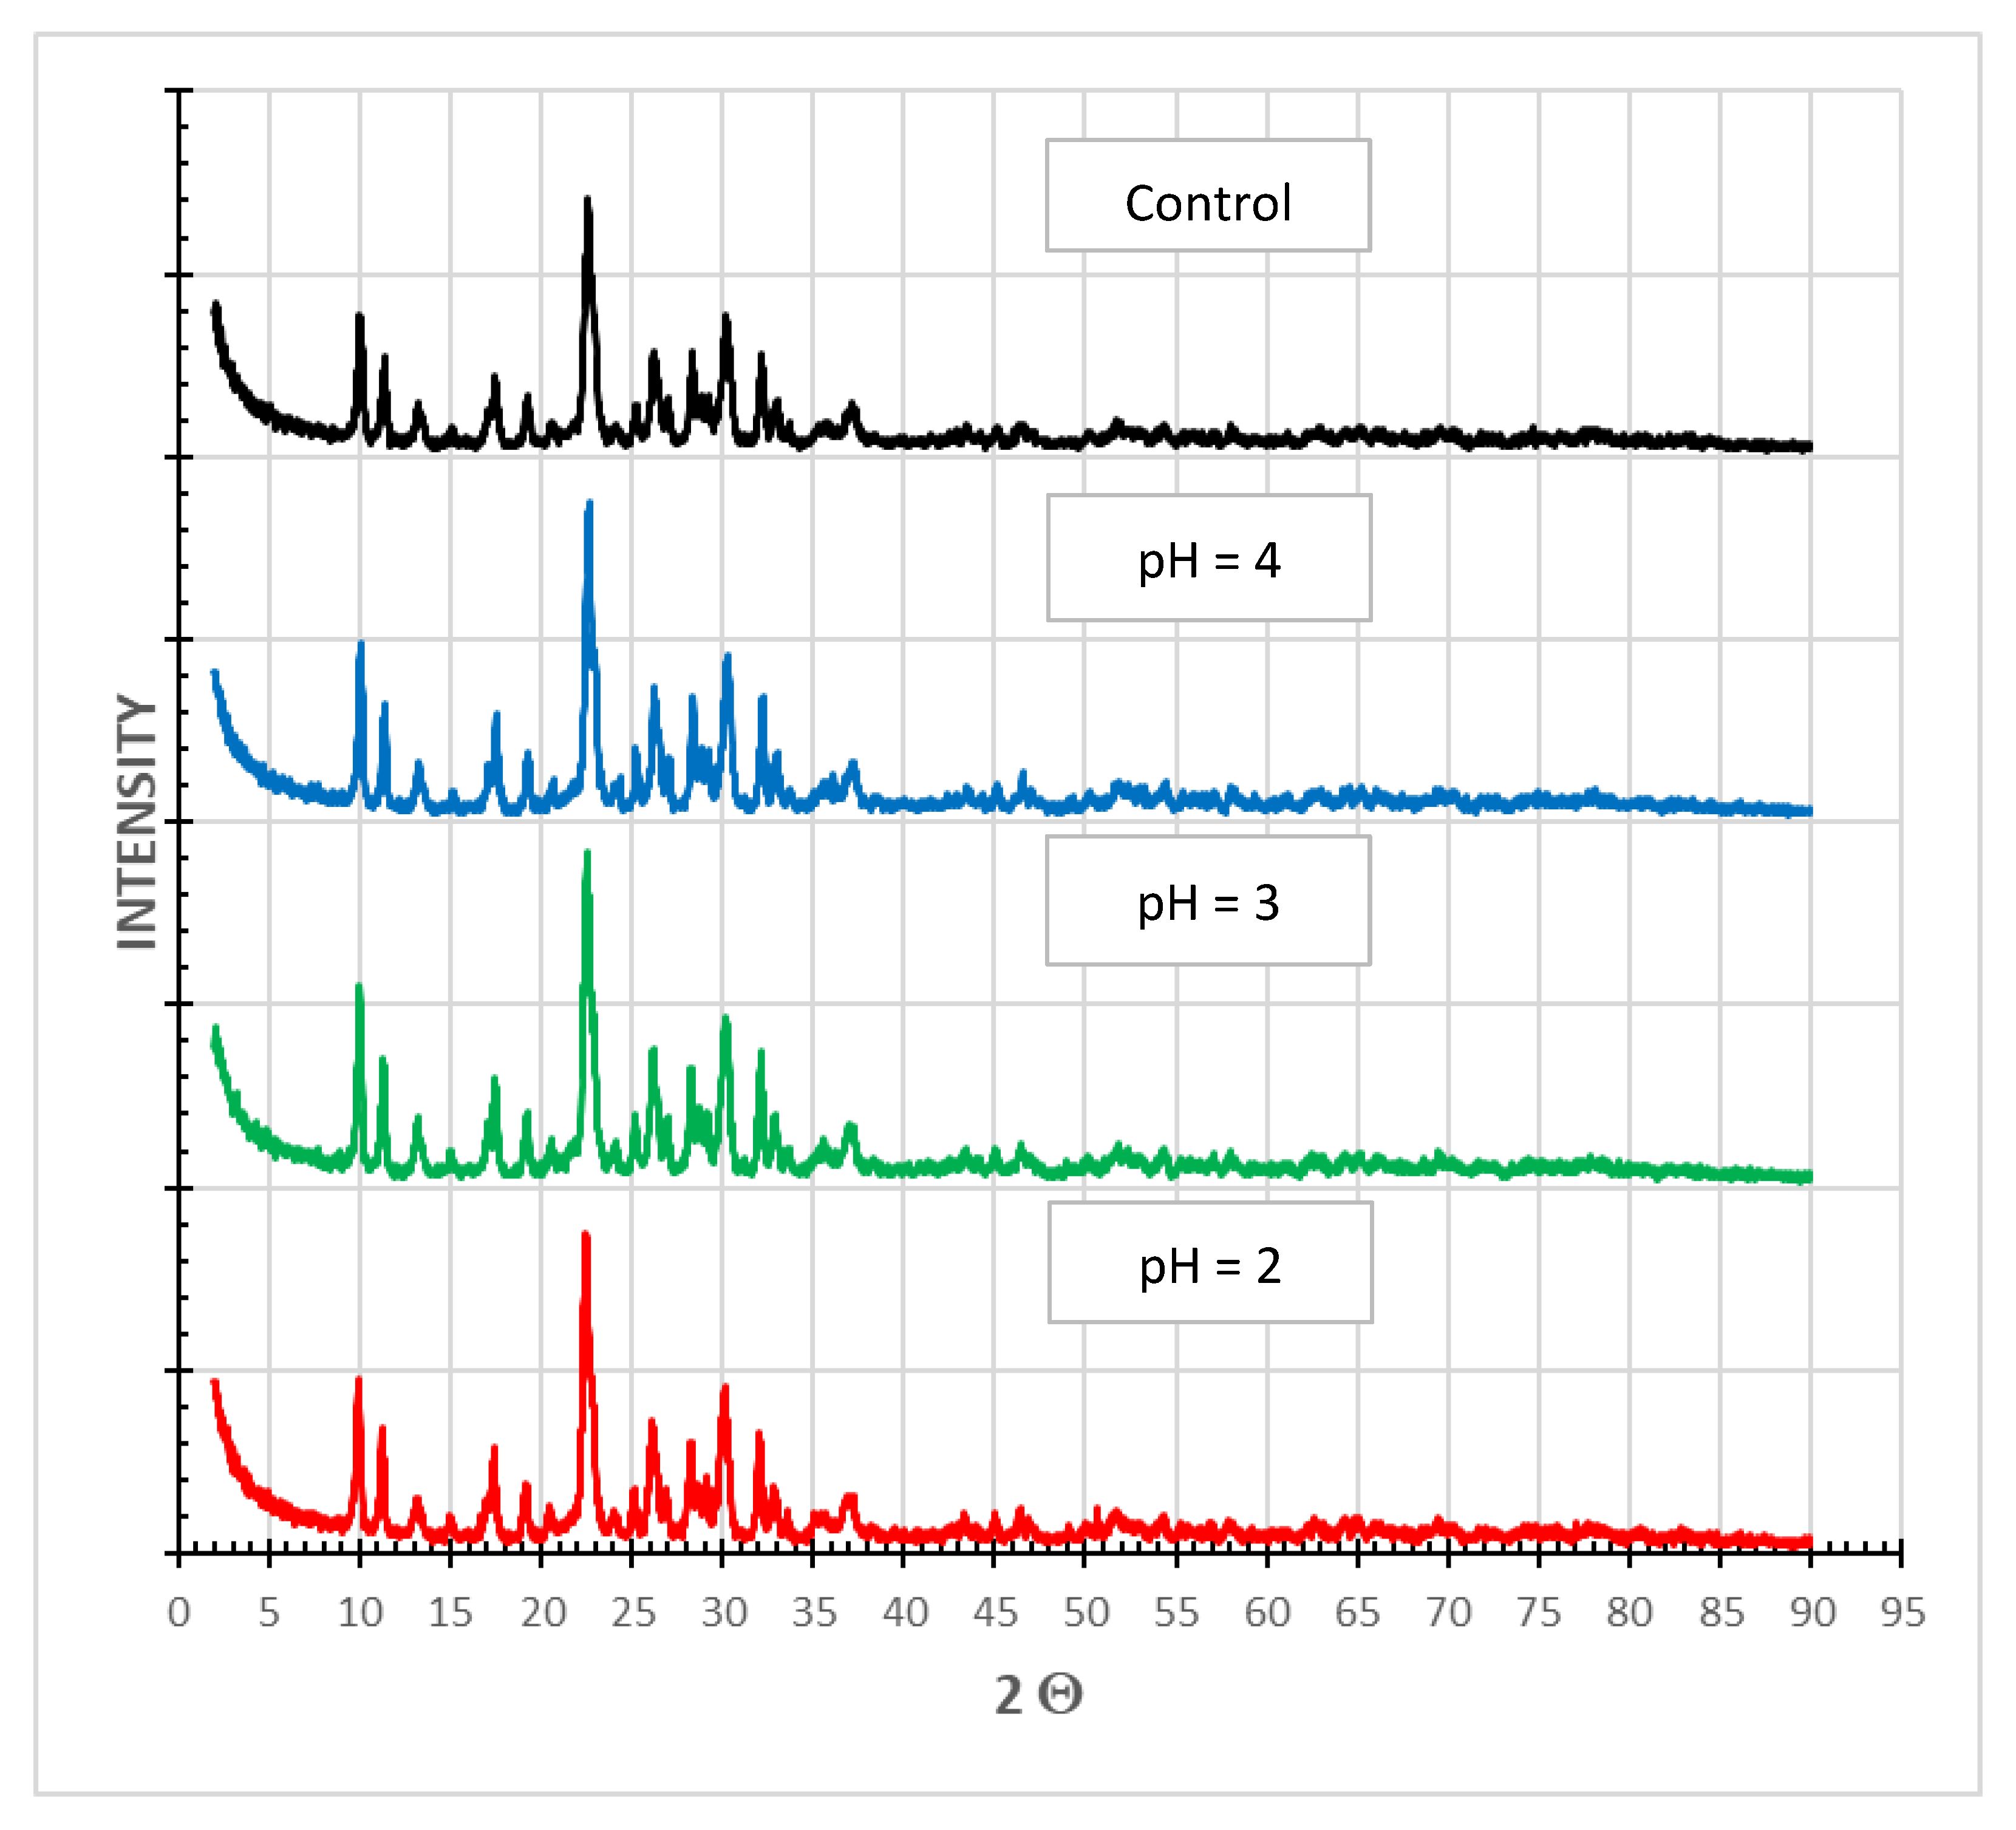
X-ray powder diffraction (PXRD) is an instrumental technique used to identify the structure of crystalline materials. PXRD has a wide range of applications in geology, material science, mineral processing, environmental science, chemistry and the pharmaceutical industry, among others [30]. The main finding from the PXRD analysis of SIR-600 samples subjected to distilled water (control) and pH 2, 3 and 4 solutions was that the diffraction pattern was unaffected by exposure to low pHs (Figure 9). The small variations in the peak location are within what is expected in sample preparation variances. In this qualitative technique, the loss of crystallinity is observed as a broadening of the peaks. As there was no broadening of peaks in the current measurements, the crystalline structure of the material appears to be unchanged.
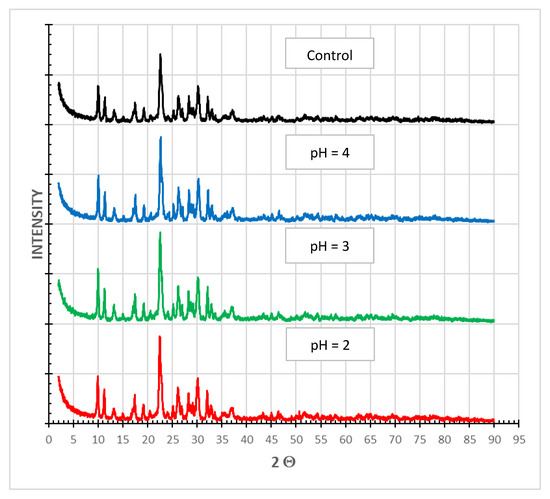
Figure 9.
PXRD analysis of SIR-600 exposed to distilled water (control) and different pH solutions (pH = 2, 3, 4).
A number of studies on the acidic modification of zeolites have demonstrated that exposure to extremely low pHs (pH < 1) and temperatures higher than 60 °C leads to the loss of aluminum [13,14,31]. A loss of aluminum could explain the observed changes in the particle size distribution. Unfortunately, the pH, temperature and length of exposure do not match those of the current study. The closest condition identified was one of the conditions studied by Caicioglu-Ozkan and Ulku [14], who exposed their zeolitic tuffs to different pHs and temperatures and quantified the extent of dealumination. For exposure pH = 1.5 at 25 °C for three hours, they observed an aluminum loss of only 0.9%, which is within the experimental error of the measurement. Thus, it is not clear whether dealumination had occurred. It is recommended that follow-up studies incorporate the quantification of aluminum and silica losses by conducting atomic absorption analysis of the exposure solutions or XPS analysis of the exposed zeolite.
3.2.6. TAN Uptake
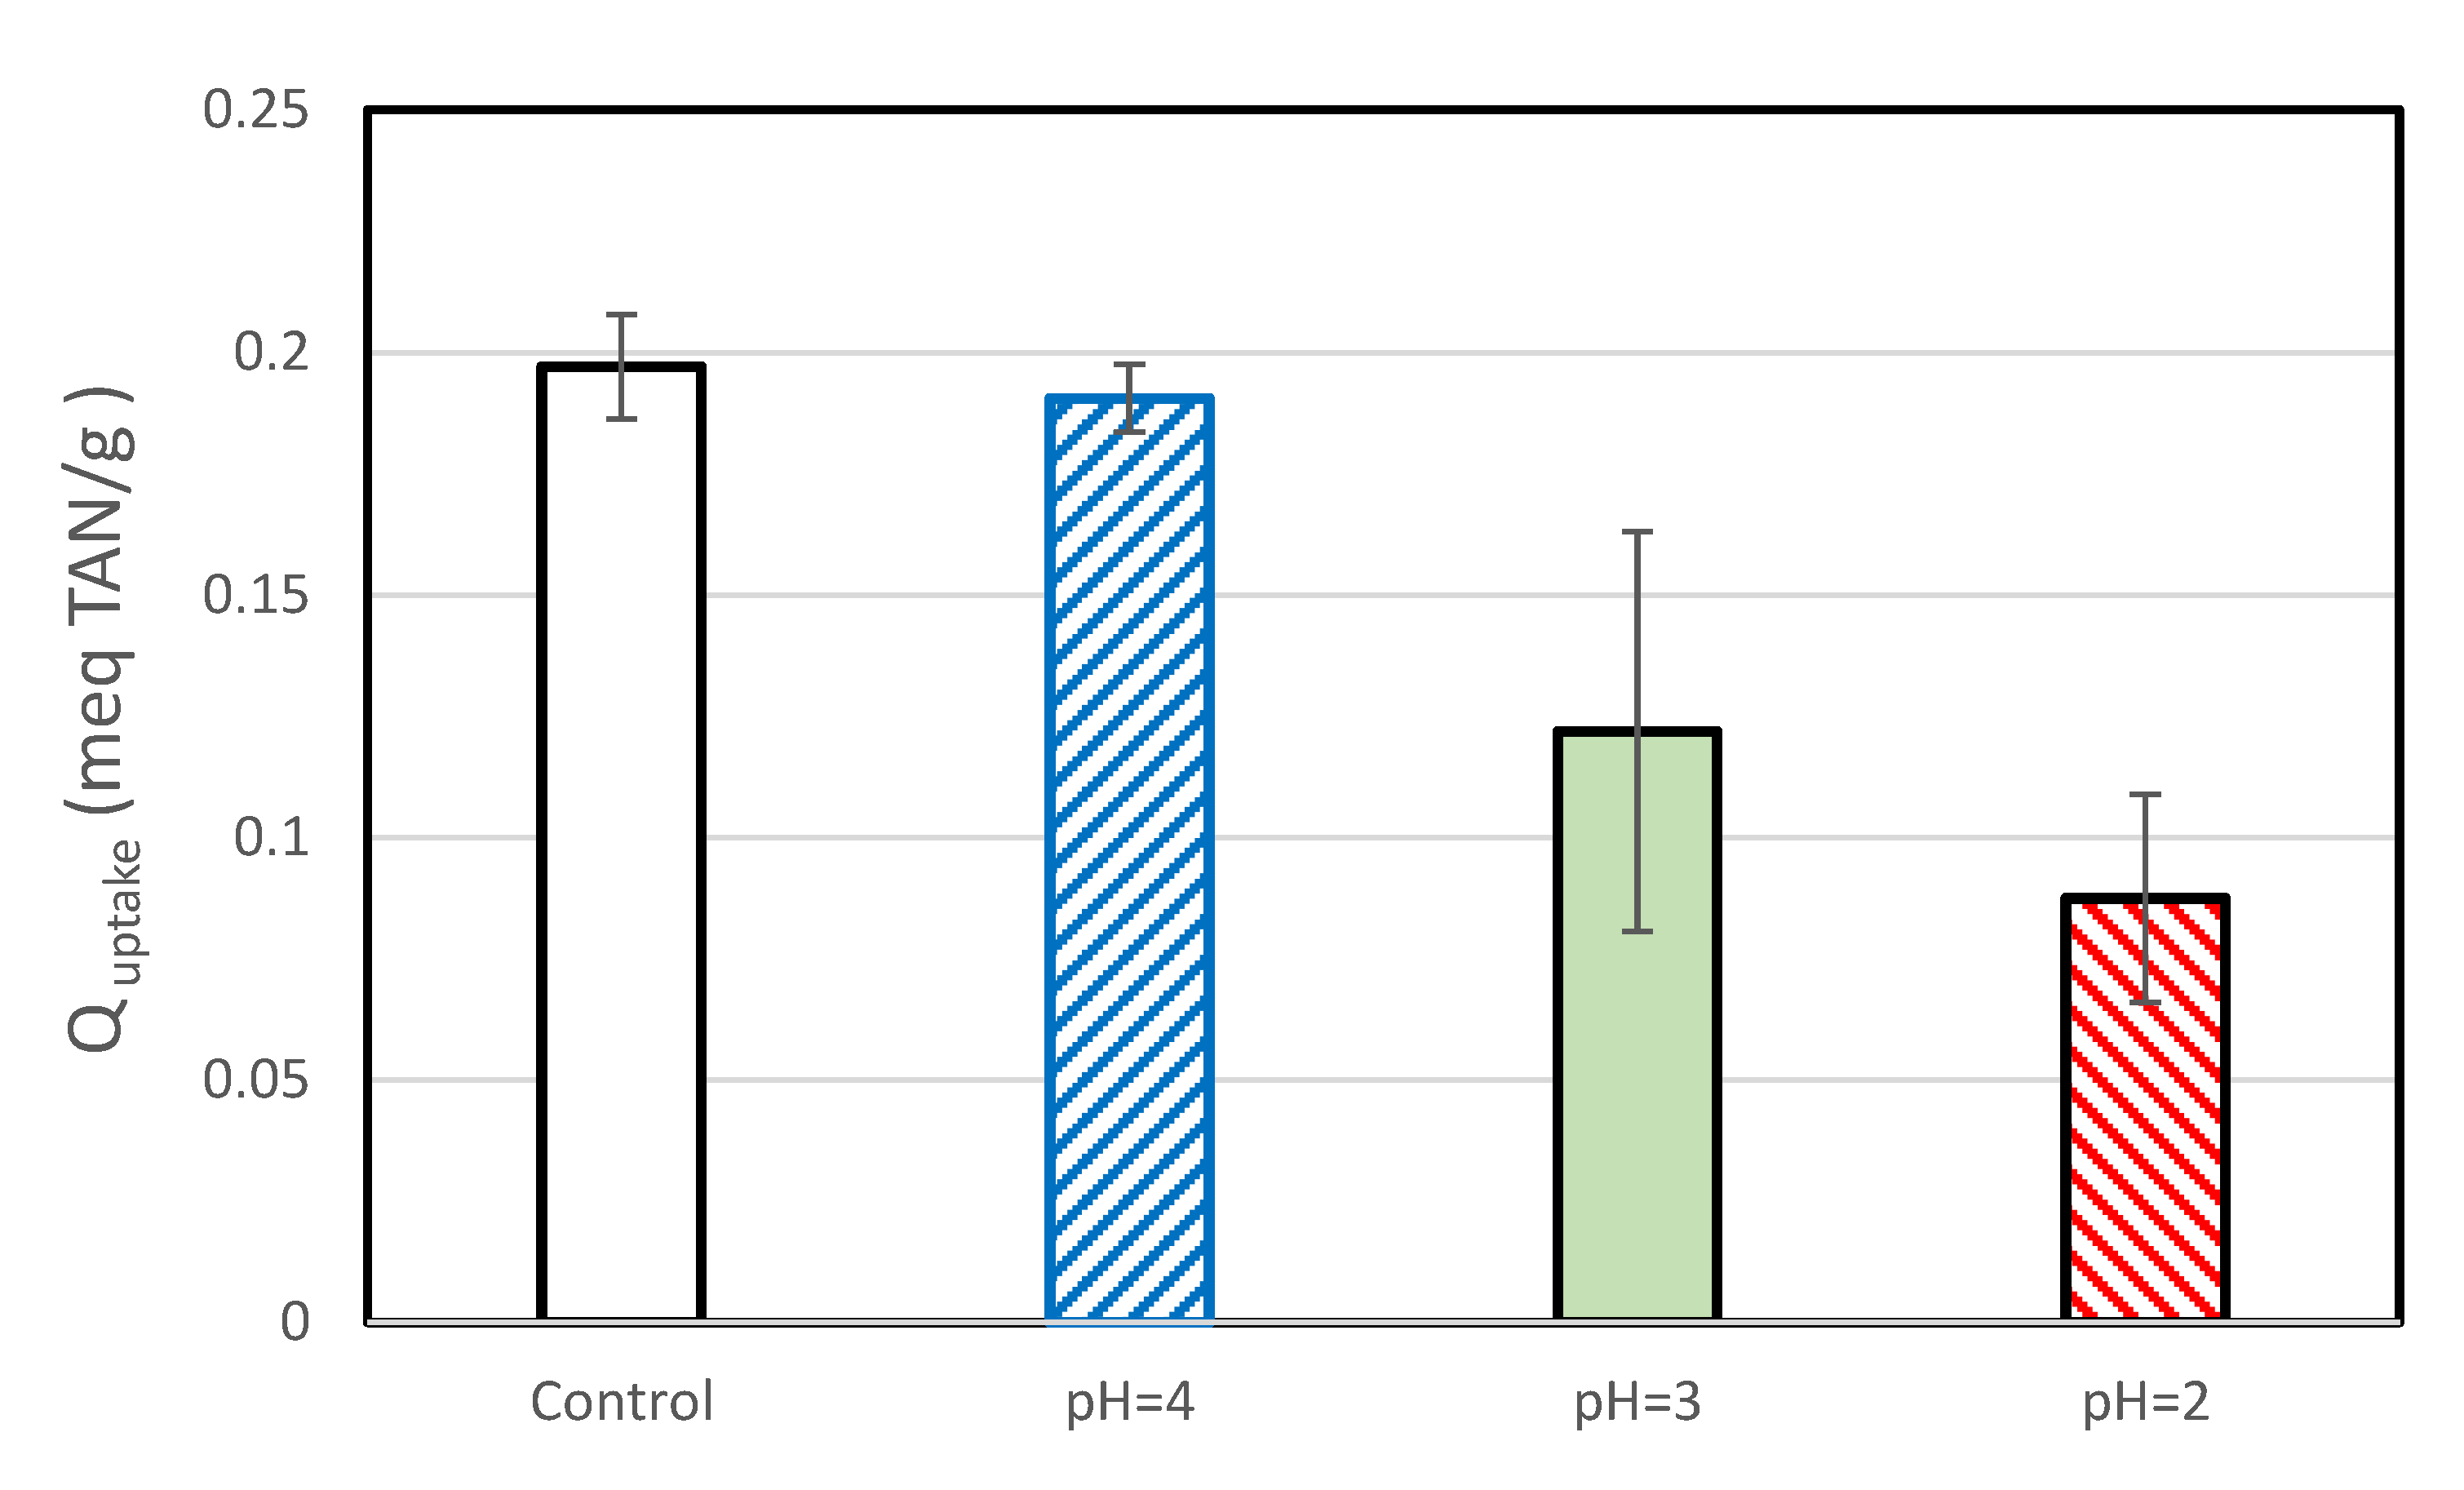
The TAN uptake for the control samples of this set of experiments was lower than that observed during the chlorine exposure tests. This may be because the two sets of experiments were performed by different persons, because they used SIR-600 from different batches (which had slightly different BET areas) and/or because the SIR-600 in the low pH exposure impact was not preconditioned. In general, the average TAN uptake decreased with decreasing pH (Figure 10). Exposure to pH =4 resulted in a small decrease in average TAN uptake, but as evident in the overlapping confidence limits, the decrease was not statistically significant. The average TAN uptakes of the pH = 3 and pH = 2 samples were statistically significant and lower than those of the controls; the SIR-600 samples exposed to pH = 2 showed a 56% lower TAN uptake than the control, and as discussed earlier, they also had a 7.1-fold increase in the percent of fines.
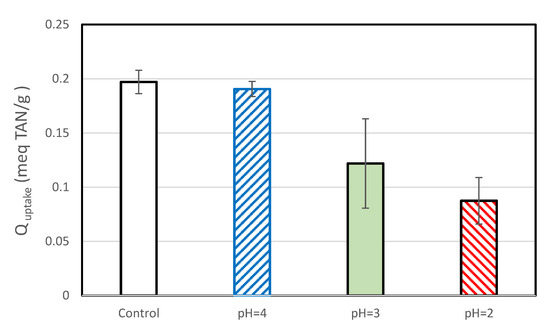
Figure 10.
TAN uptakes of SIR-600 versus the pH (2,3,4) exposed SIR-600.
The percent decrease in the average TAN uptakes was found to be proportional to the percent of fines (Figure 11). Thus, the fines do not seem to have the necessary zeolite structure to permit ammonia uptake.
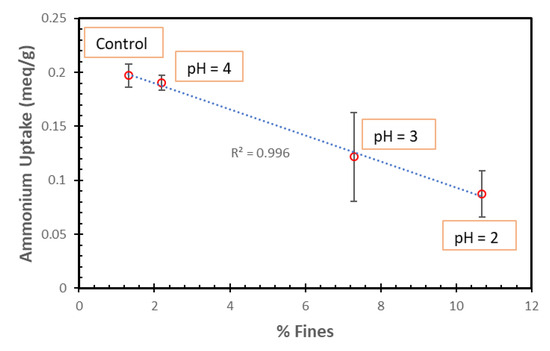
Figure 11.
NH4+ ion uptakes of SIR-600 with respect to the control versus the percent of fines for the SIR-600 exposed to pH 2, 3 and 4.
4. Discussion
The long-term exposure tests showed that the zeolite was not significantly impacted by chlorine exposure, but it was impacted by exposure to pH of 3 and lower. The 35-day-long high chlorine concentration solution exposure experiments showed that the TAN uptake and physical properties of the zeolite tested were not impacted by free chlorine concentrations of up to 1000 mg free Cl2/L. This was despite the level of exposure being up to 7900 greater than that suggested by the zeolite’s supplier. The zeolite particles and their capacity for TAN uptake were not substantially affected by long-term exposure to pH = 4 solutions. The overall chemical properties of the zeolite, as analyzed by TGA and PXRD, were not considerably altered by exposure to pH = 2 and pH = 3 solutions; however, it appears that some exterior layers of the zeolite particles were destroyed, reducing TAN uptake capacity. Future studies should investigate whether the loss of zeolite mass was caused by dealumination and/or desilication. The findings suggest that exposure of SIR-600 to pHs below 4 should be avoided.
It should be noted that in the chlorine regenerations of a continuous flow column system conducted by Zhang et al. [11], the high chlorine concentration and low pH conditions occurred simultaneously. This did not occur in the current study’s chlorine exposure tests because of the different operation (i.e., batch), which resulted in a decrease in the chlorine concentration with time. This led to a lower generation of H+ ions and a higher pH. Thus, it is reasonable that the material properties were not significantly impacted by the 1000 mg Cl/L exposure, while they were more impacted by the low pH exposure.
5. Conclusions
The main conclusions of this long-term exposure study are that the zeolite studied was resistant to exposure to 1000 mg/L chlorine solutions, but it was impacted by solutions with a pH below 4. The zeolite tested was resistant to thousands of times higher ppm-h chlorine exposure levels than those suggested by the manufacturer.
Based on these results, it appears that 1000 mg free Cl2/L solution regeneration of NH4+ -loaded zeolite columns is feasible, but one must make allowances for the accompanying low pH conditions. Essentially, the operators are going to have to replace the zeolite to compensate for the losses. Alternatively, the extent of the pH decrease could possibly be managed by using a longer regeneration phase with a lower NaOCl concentration solution. The latter will likely require the use of a three-column system, which would increase the system’s capital cost.
Author Contributions
The co-authors responsible for the following aspects of this study and manuscript are as follows: conceptualization, R.M.N., M.S. and J.D.; methodology, T.Z., G.O.A., R.M.N., M.S. and J.D.; data analysis, T.Z., G.O.A. and R.M.N.; investigation/experimentation, T.Z. and G.O.A.; resources, R.M.N.; writing—original draft, R.M.N. and T.Z.; writing—subsequent drafts, R.M.N.; writing—review and editing, R.M.N. and M.S.; supervision, R.M.N. and M.S.; project administration, R.M.N. and M.S.; funding acquisition, R.M.N., M.S. and J.D. All authors have read and agreed to the published version of the manuscript.
Funding
This research was made possible with support of the VIP Program of the Ontario Centre for Innovation (grant #33021), the Discovery Grant Program of the Natural Sciences and Engineering Research Council of Canada (grant# RGPIN/06571-2018) and our industrial partners Dowclear Environmental Inc. and Milestone Environmental Inc.
Data Availability Statement
The data for this manuscript are available in T. Zhang’s thesis [17] and G.O. Akerele’s thesis [32].
Acknowledgments
The authors would like to thank Reza Foruzanmehr and Jeffrey Owens for their help in interpreting the TGA and XPS data.
Conflicts of Interest
This study was partially funded by Dowclear Environmental Inc., whose representative was involved in the choice of the project, the design of the experiments and the interpretation of the results.
References
- Hedström, A. Ion exchange of ammonium in zeolites: A literature review. J. Environ. Eng. 2001, 127, 673–681. [Google Scholar] [CrossRef]
- Huang, J.; Rathnayake Kankanamge, N.; Chow, C.; Welsh, D.T.; Li, T.; Teasdale, P.R. Removing ammonium from water and wastewater using cost-effective adsorbents: A review. J. Environ. Sci. 2018, 2018, 174–197. [Google Scholar] [CrossRef] [PubMed]
- Koon, J.H.; Kaufmann, W.J. Ammonia removal from municipal wastewater by ion exchange. J. Water Pollut. Control Fed. 1975, 47, 448–465. [Google Scholar]
- Liberti, L.; Limoni, N.; Lopez, A.; Passino, R.; Boari, G. The 10 m3h-1 RIM-NUT demonstration plant at West Bari for removing and recovering N and P from wastewater. Water Res. 1986, 20, 735–739. [Google Scholar] [CrossRef]
- Lubensky, J.; Ellersdofer, M.; Stocker, K. Ammonium recovery from model solutions and sludge liquor with a combined ion exchange and air stripping process. J. Water Proc. Eng. 2019, 32, 100909. [Google Scholar] [CrossRef]
- Huang, H.; Yang, L.; Xue, Q.; Liu, J.; Hou, L.; Ding, L. Removal of ammonium from swine wastewater by zeolite combined with chlorination for regeneration. J. Environ. Manag. 2015, 160, 333–341. [Google Scholar] [CrossRef] [PubMed]
- Schoemann, J.J. Evaluation of a South African clinoptilolite for ammonia nitrogen removal from an underground mine water. Water SA 1986, 12, 73–82. [Google Scholar]
- Chartrand, Z.G.; Narbaitz, R.M.; Sartaj, M.; Downey, J. Ammonia-Ca-K competitive ion-exchange on zeolites in mining wastewater treatment: Batch regeneration and column performance. J. Sustain. Min. 2020, 19, 59–71. [Google Scholar] [CrossRef]
- Svetich, R. Long-term use of clinoptilolite in the treatment of sewage at Tahoe-Truckee Sanitation Agency, Truckee, California. In Proceedings of the 4th International Conference on the Occurrence, Properties, and Utilization of Natural Zeolites, Boise, ID, USA, 20–28 June 1993. [Google Scholar]
- Zhang, W.; Zhou, Z.; An, Y.; Du, S.; Ruan, D.; Zhao, C.; Ren, N.; Tian, X. Optimization for zeolite regeneration and nitrogen removal performance of a hypochlorite-chloride regenerant. Chemosphere 2017, 178, 565–572. [Google Scholar] [CrossRef] [PubMed]
- Zhang, T.; Narbaitz, R.M.; Sartaj, M.; Downey, J. Chlorine vs. sodium chloride regeneration of zeolite column for ammonium removal from an explosives impacted mining wastewater. Water 2022, 14, 3094. [Google Scholar] [CrossRef]
- ResinTech Inc. Resintech SIR-600. 2019. Available online: https://www.resintech.com/rks_images/shopcart/pdf_specs_90253.pdf (accessed on 25 October 2019).
- Kurama, H.; Zimmer, A.; Reschetilowski, W. Chemical modification effect on the sorption capacities of natural clinoptilolite. Chem. Eng. Technol. 2002, 25, 301–305. [Google Scholar] [CrossRef]
- Cakiicioglu-Ozkan, F.; Ulku, S. The effect of HCl treatment on water vapor adsorption characteristics of clinoptilolite rich natural zeolite. Microporous Mesoporous Mater. 2005, 77, 47–53. [Google Scholar] [CrossRef]
- ResinTech Inc. Resintech SIR-600. 2023. Available online: https://www.resintech.com/wp-content/uploads/2021/06/SDS-SIR-600.pdf (accessed on 20 February 2023).
- Chartrand, Z. The Selective Ion-Exchange Removal of Ammonia from Mining Wastewater. Master’s Thesis, Department of Civil Engineering, University of Ottawa, Ottawa, ON, Canada, 2018. [Google Scholar] [CrossRef]
- Zhang, T. Ammonia Removal from Mining Wastewater by Ion-Exchange Regenerated by Chlorine Solutions. Master’s Thesis, Department of Civil Engineering, University of Ottawa, Ottawa, ON, Canada, 2022. [Google Scholar] [CrossRef]
- APHA. Standard Methods for the Examination of Water and Wastewater, 18th ed.; American Public Health Association: Washington, DC, USA, 1992; Available online: https://www.scirp.org/(S(351jmbntvnsjt1aadkposzje))/reference/ReferencesPapers.aspx?ReferenceID=1818549 (accessed on 30 August 2022).
- APHA. Standard Methods for the Examination of Water and Wastewater, 23rd ed.; American Public Health Association: Washington, DC, USA, 2017; Available online: https://scirp.org/reference/referencespapers.aspx?referenceid=2329795 (accessed on 30 August 2022).
- ASTM D6913/D6913M-17; Standard Test Methods for Particle-Size Distribution (Gradation) of Soils Using Sieve Analysis. ASTM International: West Conshohocken, PA, USA. 2017. Available online: www.astm.org (accessed on 10 May 2021).
- Ghasemian, N.; Falamaki, C. Zn2+, Fe2+, Cu2+, Mn2+, H+ Ion-exchanged and raw clinoptilolite zeolite catalytic performance in the Propane-SCR-NOx process: A comparative study. Int. J. Chem. React. Eng. 2017, 16, 20160192. [Google Scholar] [CrossRef]
- Chen, H.Y.; Lin, Y.; Chen, B.; Yoshiyuki, I.; Liou, S.Y.; Huang, R. A further investigation of NH4+ removal mechanisms by using natural and synthetic zeolites in different concentrations and temperatures. Minerals 2018, 8, 499. [Google Scholar] [CrossRef]
- Thommes, M.; Kaneko, K.; Neimark, A.V.; Olivier, J.P.; Rodriguez-Reinoso, F.; Rouquerol, J.; Sing, K.S.W. Physisorption of gases, with special reference to the evaluation of surface area and pore size distribution (IUPAC Technical Report). Pure Appl. Chem. 2015, 87, 1051–1069. [Google Scholar] [CrossRef]
- Korkuna, O.; Leboda, R.; Skubiszewska-Ziemba, J.; Vrublevska, T.; Gunko, V.M.; Ryczkowski, J. Structural and physicochemical properties of natural zeolites: Clinoptilolite and mordenite. Microporous Mesoporous Mater. 2006, 87, 243. [Google Scholar] [CrossRef]
- McCusker, L.B.; Baerlocher, C. Zeolite structure. In Introduction to Zeolite Science and Practice, 3rd ed.; Čejka, J., Ed.; Elsevier: Amsterdam, The Netherlands, 2007; Chapter 2; pp. 13–38. [Google Scholar] [CrossRef]
- Mintova, S.; Čejka, J. Micro/mesoporous composites. In Introduction to Zeolite Science and Practice, 3rd ed.; Čejka, J., Ed.; Elsevier: Amsterdam, The Netherlands, 2007; Chapter 9; pp. 301–326. [Google Scholar] [CrossRef]
- Lercher, J.A.; Jentys, A. Infrared and Raman spectroscopy for characterizing zeolites. In Introduction to Zeolite Science and Practice, 3rd ed.; Čejka, J., Ed.; Elsevier: Amsterdam, The Netherlands, 2007; Chapter 13; pp. 435–476. [Google Scholar] [CrossRef]
- Mozgawa, W. The influence of some heavy metals cations on the FTIR spectra of zeolites. J. Mol. Struct. 2000, 555, 299–304. [Google Scholar] [CrossRef]
- Ames, L.L. The cation sieve properties of clinoptilolite. Am. Mineralogist. 1960, 45, 689–700. [Google Scholar]
- Flohr, M.J.K. X-ray Powder Diffraction. US Geological Surveys Information Handout. 1997. Available online: https://pubs.usgs.gov/info/diffraction/html/ (accessed on 2 September 2023).
- Hernández-Beltrán, N.A.; Olguín, M.T.; Rosas-Aburto, A. Effect of acid phosphate media on the stability of clinoptilolite-rich tuff. J. Incl. Phenom. Macrocycl. Chem. 2008, 61, 93–100. [Google Scholar] [CrossRef]
- Akerele, G.O. Bench-Scale SIR-600 Ion- of Exchange Column and Cl2 Regeneration for Ammonia Removal from a Simulated Mining Wastewater. Master’s Thesis, Department Civil Engineering, University of Ottawa, Ottawa, ON, Canada, 2022. [Google Scholar] [CrossRef]


Disclaimer/Publisher’s Note: The statements, opinions and data contained in all publications are solely those of the individual author(s) and contributor(s) and not of MDPI and/or the editor(s). MDPI and/or the editor(s) disclaim responsibility for any injury to people or property resulting from any ideas, methods, instructions or products referred to in the content. |
© 2023 by the authors. Licensee MDPI, Basel, Switzerland. This article is an open access article distributed under the terms and conditions of the Creative Commons Attribution (CC BY) license (https://creativecommons.org/licenses/by/4.0/).