Article

Study on the Controlling Factors and Laws of Deep Carbonate Geothermal Reservoirs in the Jizhong Depression

1
Institute of Geophysical and Geochemical Exploration, Chinese Academy of Geological Sciences, Langfang 065000, China
2
National Center for Geological Exploration Technology, Langfang 065000, China
3
Key Laboratory of Geophysical Electromagnetic Probing Technologies, Ministry of Natural Resources, Langfang 065000, China
4
Terrestrial Geophysical Research Center, China Geological Survey, Langfang 065000, China
5
College of Geoexploration Science and Technology, Jilin University, Changchun 130026, China
6
School of Geophysics and Information Technology, China University of Geosciences, Beijing 100083, China
*
Authors to whom correspondence should be addressed.
Minerals 2023, 13(10), 1266; https://doi.org/10.3390/min13101266
Submission received: 13 September 2023 / Revised: 25 September 2023 / Accepted: 26 September 2023 / Published: 28 September 2023
(This article belongs to the Section Mineral Exploration Methods and Applications)

Abstract

:
The absence of regional electrical data has constrained our comprehension of the deep geological structures in the Jizhong Depression. This limitation has impeded the exploration of factors and principles governing geothermal reservoirs. Historically, studies on these factors primarily centered on geothermal field attributes, such as anomalous geothermal flux, geothermal gradients, and deep Moho variations. In our research, we undertook an exhaustive interpretation of extended-period magnetotelluric readings. This was amalgamated with prior regional geological and geophysical studies to discern deep geological structural details pertinent to geothermal resource components, encompassing heat sources, pathways, reservoirs, and cap rocks. Our analysis spanned the foundational surface of the Cenozoic era, fault configurations, carbonate formation distribution, and layers with low velocity yet high conductivity. We also statistically evaluated geothermal wells, their density, and the water temperature attributes across various structural entities. This aided in comprehending how structural units influence thermal well features. Our research delineated the spatial interrelation between geothermal well distribution and deep geological structures, including carbonate rock distribution, Cenozoic thickness, fault patterns, and profound low-velocity, high-conductivity layers. Moreover, we scrutinized how structural unit types impact thermal well attributes, offering insights into the formation principles of deep carbonate geothermal reservoirs within the Jizhong Depression. Our findings suggest that the genesis of deep geothermal resources in the Jizhong Depression is swayed by regional geological conditions. Notably, the distribution of regional and especially deep geothermal wells is intimately tied to regional stratigraphy, structural designs, and profound geological structural traits. Furthermore, the temperature within geothermal wells correlates strongly with the burial depth, carbonate formation thickness, Cenozoic thickness, and proximity to fault channels responsible for fluid movement and heat transmission.

1. Introduction

Geothermal resources encompass the geothermal energy and fluids and their beneficial components found within the Earth’s interior that can be economically harnessed by humans. These resources are formed through a combination of elements, including heat sources, reservoirs, cap rocks, pathways, and fluids. Grasping the intricacies of these formation elements is pivotal for the effective exploration and development of geothermal resources and stands as a crucial facet of geothermal research [1,2]. Typically, the identification of these elements is dependent on comprehensive regional deep geological structure data.
In the Jizhong Depression, the primary source of these deep geological data stems from geophysical studies aimed at oil and gas reservoir exploration, particularly in the Huabei Oilfield. During the 1970s and 1980s, the region saw a surge in 2D seismic, regional gravity, and magnetotelluric surveys. More recently, 3D seismic studies were initiated in areas with potential oil and gas reserves, targeting the Cenozoic, Paleozoic, and Precambrian formations [3,4,5,6,7,8]. Concurrently, sporadic magnetotelluric surveys were undertaken to discern crustal configurations such as deep fault structures, low-velocity and high-conductive layers, and lithosphere thickness [9,10,11,12]. However, earlier efforts by the oil sector were constrained by data precision and probing depth, limiting the interpretation of deep geological structures pertinent to geothermal resources. The subsequent 3D seismic studies, while more detailed, had a narrower focus and failed to capture the broader regional geological nuances. The magnetotelluric surveys, although valuable, were sporadic and lacked a systematic approach, making it challenging to derive a comprehensive electrical structure of the Jizhong Depression region.
Chang et al. (2016) observed a seamless alignment between the geothermal gradient and heat flux in the Jizhong Depression with the undulations of the basement’s topography [13]. Li Jun et al. (2018) uncovered a strong correlation between the distribution characteristics of the geothermal field in the Jizhong Depression and the underlying geological structure. The contour lines of the geothermal gradient in the overlying strata and the isothermal lines at depths of 1000 to 2000 m exhibit a remarkable congruence with the regional structural trends and the topographic variations of the basement [14]. Liang et al. (2010) postulated that as the depth increases, the geological layers age, leading to a decline in the geothermal gradient. Consequently, the rate at which temperature rises with depth diminishes over time [15]. Liu et al. (2018) proposed that one significant heat source for geothermal anomalies stems from the heat conducted upwards from the upper mantle. The Moho’s shallow depth facilitates the conduction of this deep mantle heat [16]. Dong et al. (2020) used oil test temperature data to draw a section map of formation temperature and formation distribution at 3500 m, revealing that the temperature of the northwestern uplift area is lower than the eastern uplift area, and the temperature of the convex area of the depression is generally higher than the temperature of the depression at the same depth [17]. Miao et al. (2022) observed that the heat of the deep carbonate geothermal reservoirs in the Jizhong Depression mainly comes from the deep mantle. Heat from the mantle enters the deep thermal reservoirs in the form of thermal conduction and thermal convection [18,19]. Xiang et al. (2023) indicated that in the carbonate reservoirs of the Jizhong Depression, the dolostones have relatively higher porosity and permeability than limestones and breccias. Unfilled and partly filled fractures, in particular, multiply enhance reservoir permeability [20]. Wang et al. (2017) posited that the conductive geothermal resource in the sedimentary basin of the Beijing–Tianjin–Hebei region is predominantly driven by the upward diffusion of heat from the upper mantle coupled with the heat generated from radioactive decay in the basement [21].
While these studies provide a qualitative analysis of the role of geothermal elements in shaping the geothermal resources of the Jizhong Depression, there remains a conspicuous absence of systematic and regional quantitative analyses. This gap underscores the need for more comprehensive research to effectively guide the identification of prime geothermal areas, crucial for the exploration and utilization of deep geothermal resources in the Jizhong Depression.
In this study, we integrated the data from deep geological structures, including the distribution of carbonate rocks, the Cenozoic basement, fault structures, and low-velocity, high-conductivity layers. We conducted a systematic survey to statistically analyze the distribution of 272 geothermal wells, considering various factors such as carbonate rock burial depths, thickness variations, Cenozoic thickness ranges, proximity to fault structures, and burial depth ranges of low-velocity, high-conductivity layers. From this analysis, we categorized the geothermal wells based on different temperature ranges. We identified specific spatial relationships between the distribution of geothermal wells and deep geological structures like carbonate rock distribution, Cenozoic thickness, fault structures, and deep low-velocity, high-conductivity layers. This led us to summarize the formation principles of deep carbonate geothermal resources in the Jizhong Depression. Our findings indicate that the burial depth and thickness of carbonate formations play a pivotal role in determining the temperature and quality of deep geothermal reservoirs. A cap rock with an optimal thickness, specifically within the Cenozoic range of 1000–4000 m, is most effective for heat retention. There is a positive correlation between geothermal well temperatures and Cenozoic thickness within this specified range. Fault structures act as efficient thermal conduits, with geothermal wells predominantly located within a 6 km radius on either side of these faults. The proximity of wells to these faults directly influences the number of wells and the temperature of the thermal water they access. Furthermore, the low-velocity, high-conductivity layers potentially serve as a significant supplementary heat source for regional geothermal energy. Geothermal wells are primarily found within a burial depth range of 10–20 km of these layers, with high-temperature geothermal wells predominantly situated between 13–15 km.

2. Regional Geological and Geothermal Background

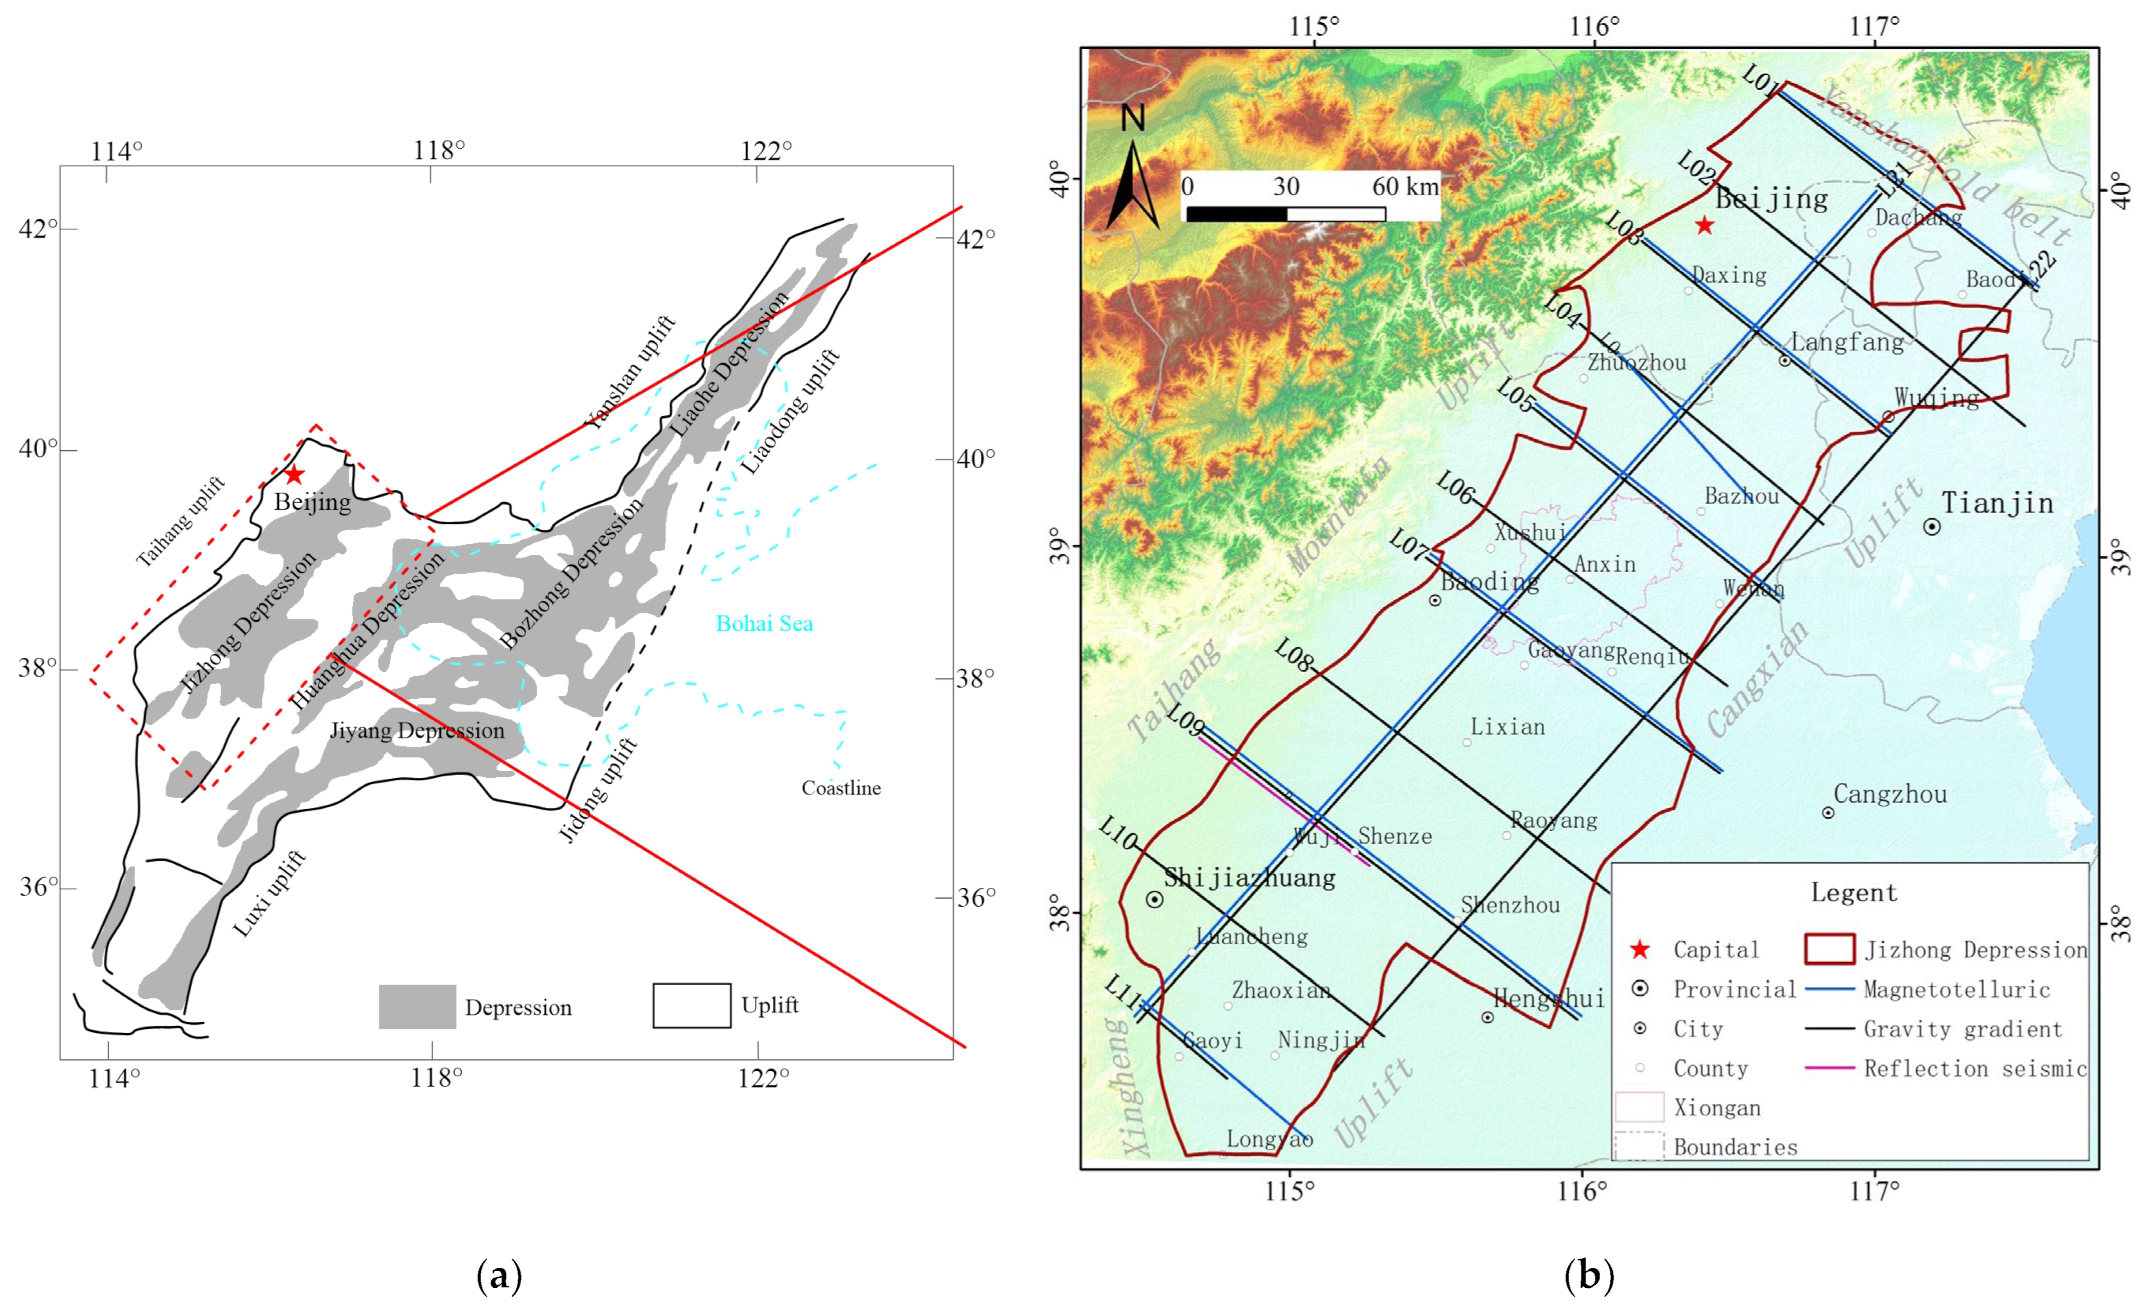
The Jizhong Depression is located in the western part of the Bohai Bay Basin, which is a third-level tectonic unit above the North China Craton. It is a Mesozoic–Cenozoic sedimentary depression developed on the North China Platform and generally exhibits a pattern of alternating uplifts and depressions (Figure 1a). It divides the Jizhong Depression into western and eastern depression zones, with a central uplift zone along the Daxing–Niutuozhen–Gaoyang–Liucun–Caocheng line. The Jizhong Depression is covered by multiple geothermal fields, and geothermal resources are abundant. The presence of underground hot water has been discovered in most drilling and water wells. The Bohai Bay Basin where it is located is a Mesozoic–Cenozoic superimposed rift basin developed in the eastern part of the North China Craton. It has undergone multiple tectonic movements since the Precambrian, from the regional stable sedimentation stage from the Mesoproterozoic to the Paleozoic to the uplifting and folding stage in the Mesozoic to the fault development stage in the Paleogene and finally to the regional subsidence stage from the Cenozoic strata to the present. The destruction and thinning of the thermal lithosphere were developed in the Cenozoic. From bottom to top, the study area developed Archean metamorphic rocks, marine carbonate formations from the Mesoproterozoic to the Middle Ordovician, clastic rocks interbedded with carbonate formations from the Permian, and lacustrine and fluvial sediments from the Paleogene to the Quaternary [22].
Under the background of extensional thinning of the lithosphere in the Bohai Bay Basin, the thinner lithosphere facilitates the easier conduction of heat to the shallow crust. The thick, low thermal conductivity Neogene sedimentary layers in the study area act as insulating layers, collectively forming the geological background for the geothermal anomaly in this region. The North China Craton has maintained a stable thermal evolution since the early Mesozoic, with two peaks of high heat flow (85–88 mW/m2) and a current heat flow of 60–68 mW/m2. The current geothermal gradient in the unified depth of 0–3000 m ranges from 20.8 to 41.0 °C/km, with an average of 31.6 °C/km. The current geothermal heat flow ranges from 48.7 to 79.7 mW/m2. The geothermal heat flow and the geothermal gradient gradually increase from west to east, and their spatial distribution characteristics correspond well with the undulations of the underlying topography. The rock radiogenic heat production rate (A) and rock thermal conductivity (K) are important parameters for studying the current thermal state of the region. Based on the actual drilling data and stratigraphic information, the column of radiogenic heat production rate and thermal conductivity (Table 1) established in the study area of the central part of the Jizhong Depression show that the majority of sedimentary rocks in this area have a radiogenic heat production rate lower than 1.60 μW/m3, with rock thermal conductivity ranging from 1.49 to 6.69 W/(m·K). In this context, clastic rocks demonstrate a higher radiogenic heat production rate compared to limestone, while igneous rocks and metamorphic rocks fall between the two. Additionally, limestone exhibits the highest thermal conductivity, while clastic rocks have lower values, and metamorphic rocks and igneous rocks fall in between [23].

3. Geological Structure Features

The study in this paper utilized deep geological structure information of the Jizhong Depression, which is based on the data processing and interpretation of geophysical measurement profiles (Figure 1b). The northwest–southeast composite profile has an average length of about 100 km, crossing the eastern and western boundaries of the Jizhong Depression, while the northeast–southwest profile is 338 km long, crossing the northern and southern boundaries of the depression. These data are important for analyzing the controlling factors and laws of geothermal reservoirs in the Jizhong Depression carbonate formations.

3.1. Processing and Interpretation

Based on the collection and comprehensive study of previous regional geological and geophysical survey data, combined with the geological information of regional structures, stratigraphic distribution, and deep heat sources obtained from the geophysical measurement profiles used in this study, the following methods and procedures were adopted:
(1)
Identification and division of regional tectonic framework. Firstly, the 0°, 45°, 90°, 135°, 225°, and 315° derivatives of the 1:250,000 Bouguer gravity anomaly were calculated to understand the distribution of faults in different directions. The horizontal gradient modulus was calculated to infer and identify fault structures based on the gravity anomaly directional derivatives and horizontal gradient modulus maps [24,25]. Then, the gravity and electrical characteristics were used to identify the scale and grade of faults and to divide the deep major faults and large faults for Class III and Class IV tectonic units, respectively. The boundaries of the Jizhong Depression, internal uplifts, and depressions were delineated along with the regional tectonic framework.
(2)
Detailed characterization of the regional tectonic framework. The positions, attitudes, and extension features of fault zones were determined based on the interpretation of gravity, gravity gradient, and magnetotelluric data [26,27,28,29]. Nonlinear conjugate gradient inversion (NLCG) with topography and surface inhomogeneity was used for two-dimensional inversion calculation to accurately locate fault zones and determine the width of uplifts and depressions. The extension length in the north–south direction was determined based on multiple profile data, ultimately defining the boundaries of Class IV tectonic units and identifying the range of uplifts and depressions.
(3)
Inference of deep geological structure. Using the results of magnetotelluric inversion as the main data source and combined with seismic, gravity, and magnetic data [30], the vertical extension of fault zones and the structural interpretation of formations in the uplift and depression areas were inferred. The thickness of each formation in the inferred interpretations was fitted with the measured gravity/gradient data. If the inferred thickness (burial depth) matched the known density characteristics, it indicated that the inferred depth was correct. If it did not match the measured curve, the thickness of rock layers was reconfirmed based on the characteristics of the inversion resistivity curve until the gravity anomaly curve reflecting the formation structure was consistent with the measured curve.
(4)
Mapping of deep geological structures. After obtaining the burial depth lines and burial points of the top surface of the Cenozoic, Mesozoic, carbonate formations, and low-velocity, high-conductive layers [31,32] (characterized by low resistivity, low magnetic, and low density) on the measurement profiles, contour lines of burial depth were generated using Surfer software (Version 13.0) [33].

3.2. Geological Features

3.2.1. Tectonic Units

As shown in Figure 2, the secondary tectonic units within the Jizhong Depression exhibit an east–west alternating distribution pattern [34]. Except for the Sheze low uplift and the Shengxian depression, the overall distribution of the secondary tectonic units is northeast–southwest, forming a pattern of alternating depressions and uplifts from west to east. The east–west trending fault systems show a steplike faulting pattern. From west to east, both the uplift zones and the depression zones exhibit a gradual increase in Cenozoic strata thickness and burial depth of carbonate formations (Figure 3, Figure 4, Figure 5 and Figure 6). In the north–south direction, the Xu–Shui–Wen’an fault zone and the Wuji–Hengshui fault zone divide the Jizhong Depression into three segments, namely, the northern, central, and southern segments. These three segments show significant differences in the thickness of the Cenozoic strata and the burial depth of carbonate formations, especially between the northern and southern segments compared to the central region, indicating significant differences in subsidence magnitude, with the central segment experiencing the largest subsidence.

3.2.2. Distribution of Carbonate Formations

The burial depth characteristics of the top surface of carbonate formations are shown in Figure 3, with deeper depths in the depression zones compared to the uplift zones. The east–west trending fault systems show a steplike faulting pattern, and the north–south direction is divided into three segments of subsidence [35]. The basement burial depth features of carbonate formation are shown in Figure 4. The areas mainly include the eastern part of Tongzhou–Gu’an–Rongcheng area north of the Xushui Fault, small areas near the front edge of the mountain in the central part, northern Suning, and northern Xianxian, with burial depths ranging from 4 to 5 km. In the south, the areas of Xinle–Zhengding–Shijiazhuang–Luancheng and Anping–Jinzhou–Zhaoxian–Ningjin have burial depths ranging from 4 to 5 km. The areas to the west of the Gaoyang–Anguo line, including the Baoding Depression and Shenzhou–Wuyi areas, have burial depths exceeding 6 km, with some areas reaching 8 to 9 km. The thickness features are shown in Figure 5. In most areas, the thickness of carbonate formation is between 2000 and 3000 m. Overall, the thickness is smaller in the uplifted areas than in the depression areas. The regions with thickness less than 2000 m mainly include the mountainous areas north of Beijing–Xianghe to Zhuozhou–Bazhou, the Baoding–Renqiu area, the Gaoyi–Longyao to Zhaoxian–Ningjin area, and protruding northwards to the Shenze area.

3.2.3. Basement Surface of the Cenozoic (Bedrock Top Interface)

As shown in Figure 6, the Cenozoic is distributed throughout the entire Jizhong Depression [36]. The overall trend of the thickness of the Cenozoic is thin in the northwest, gradually thickening towards the southeast with a generally thicker thickness in the central part, and gradually thinning towards the southwest. The distribution trend of the thickness of the Cenozoic era is generally consistent with that of the top burial depth of carbonate formations, which is also in line with the geological makeup of many areas in the region where the Mesozoic era is missing or has a small thickness and the Cenozoic overlies the Paleozoic–Mesozoic carbonate formations.

3.2.4. Fault Structures

The main fault structures within the Jizhong Depression are northeast–southwest trending normal faults, which form boundaries between different tectonic units (Figure 7). Multiple strike–slip faults cut the northeast–southwest trending faults into several segments. The overall trend of the fault structures shows a southward inclination in the northern fault systems and a northward inclination in the southern fault systems. These faults and their displacement led to the segmentation of tectonic units in the north–south direction and complex variations in the size and subsidence magnitude of the tectonic units. Overall, the total fault displacement and subsidence magnitude increase from the northern and southern parts towards the central part. Some faults show active characteristics [37].

3.2.5. Low-Velocity and High-Conductive Layers

Low-velocity and high-conductive layers are generally present in the Jizhong Depression [38] (Figure 8), with burial depths ranging from 13 to 20 km in most areas. Shallow burial areas are mainly distributed in the southern Jizhong Depression, including the Dingzhou–Gaoyi and Langgu–Xiongan areas, with burial depths of less than 13 km. Partial areas of Anxin, Bazhou, Gu’an, and Yongqing lie in the central and northern parts of the Jizhong Depression, while in the southern part, the areas of Luancheng–Wuji and Xinle have burial depths less than 13 km. The depths in the northwestern Jizhong Depression, including the area west of Zhuozhou–Daxing–Tongzhou except Shunyi, are generally deeper, mostly exceeding 20 km.

4. Methodology Distribution of Known Geothermal Wells

From a regional perspective (Figure 2), the distribution of geothermal wells is highly uneven. Geothermal wells are relatively few in the northern and southern parts, while they are more abundant in the central part. The average geothermal well density is 6.82 per thousand km2 in the northern region, 13.26 per thousand km2 in the central region, and 6.04 per thousand km2 in the southern region. The central region has a significantly higher exploration and development level compared to the northern and southern regions. Geothermal wells are present in different types of tectonic units, with the Raoyang Depression and Niutuozhen uplift having the highest number of known geothermal wells, accounting for 28.68% and 18.01% of the total, with 78 and 49 wells, respectively. Six tectonic units have geothermal well densities higher than the regional average of 8.93 per thousand km2 and the uplift areas’ average of 11.09 per thousand km2. The highest density is found in the Niutuozhen uplift with an average of 106.06 per thousand km2, followed by the Gaoyang low uplift with an average of 54.32 per thousand km2, making them the two tectonic units with the highest exploration and development levels in the Jizhong Depression.
The analysis of geothermal well water temperatures (Table 2) shows that the known geothermal wells in the Jizhong Depression are mainly low-temperature geothermal wells producing hot water or warm water. Geothermal wells with temperatures below 60 °C account for 25.74% of the total wells and are mainly located in the Raoyang Depression, Beijing Depression, and Shulu Depression. Low-temperature geothermal wells with temperatures between 60 °C and 90 °C are widely distributed, accounting for over 66% and covering 14 tectonic units, mainly in the Raoyang Depression, Niutuozhen uplift, Gaoyang low uplift, and Dexian Depression. There are relatively fewer medium-temperature geothermal wells (above 90 °C), accounting for less than 8%, mainly distributed in the central part of the Jizhong Depression and its adjacent areas, such as the Gaoyang low uplift, Raoyang Depression, and Lixian Slope, as well as the Rongcheng uplift, Baxian Depression, and Wuji–Gaocheng low uplift.
Overall, the distribution characteristics of known geothermal wells in the Jizhong Depression can be summarized as follows: uneven distribution, dominated by low-temperature geothermal wells, a considerable number of medium-temperature geothermal wells, and significant influences of tectonic unit types.

5. Geothermal Reservoir Control Factors

The spatial coupling relationships between the distribution of 272 well-developed geothermal wells, including well depths, temperatures, and extraction methods, and identified geological factors such as the burial depth of carbonate formation, fault structures, and the depth of the Cenozoic strata, were analyzed to study the controlling factors and laws of deep geothermal resources.

5.1. Relationship between Geothermal Well Distribution and Carbonate Formation

There is a clear correlation between the number of geothermal wells in the Jizhong Depression and the burial depth and thickness of carbonate formation, as shown in Table 3. In terms of quantity, geothermal wells are mainly concentrated in the depth range of 2000–4000 m, with 119 wells at a depth of 2000–3000 m, accounting for 42.65% of all wells, and 106 wells at a depth of 3000–4000 m, accounting for 37.99%. The number of geothermal wells in other depth ranges is relatively small, with 23 wells at a depth of 1000–2000 m, accounting for 8.24%, 21 wells at a depth of 4000–5000 m, accounting for 7.53%, and fewer than 10 wells at a depth of <1000 m, accounting for less than 3%. There are only two geothermal wells at a depth of ≥5000 m, accounting for less than 1%. This indicates that the formation conditions for geothermal resources require an appropriate burial depth of carbonate formation (2000–4000 m). Burial depths greater than 5000 m are difficult to explore and exploit, while depths less than 1000 m are not conducive to heat accumulation and retention, hindering the formation of geothermal resources.
The distribution of geothermal wells also correlates with the thickness of carbonate formation. A total of 200 wells are located in the region with a thickness of 2000–3000 m, accounting for 71.68% of all wells, 73 wells are located in the region with a thickness of 1000–2000 m, accounting for 26.16%, 3 wells are located in the region with a thickness of <1000 m, accounting for 1.08%, and 3 wells are located in the region with a thickness of 3000–4000 m, accounting for 1.08%. From the analysis of regional geological characteristics, the ratio of thickness to carbonate reservoir thickness is generally 10–20%. A small thickness of carbonate formation cannot guarantee the formation of effective reservoirs, while a large thickness indicates a low degree of weathering and fault fracturing in the region, which is not conducive to increased porosity and permeability, affecting the reservoir quality [39,40,41].
In terms of well temperature, there is also a significant correlation with the burial depth and thickness of carbonate formation in the Jizhong Depression. The water temperature of known geothermal wells is mainly concentrated in the range of 60–90 °C (Table 4). Among them, there are 70 geothermal wells with temperatures <60 °C, accounting for 25.09%, and 67 geothermal wells with temperatures of 60–75 °C, accounting for 43.01%.
From the burial depth of carbonate formation in geothermal wells at different temperature ranges, the burial depth of carbonate formation in geothermal wells with temperatures <60 °C is mainly in the range of 1000–4000 m, concentrated in the range of 2000–3000 m. The burial depth of carbonate formation in geothermal wells with temperatures of 60–90 °C is mainly in the range of 2000–4000 m, concentrated in the range of 2000–3000 m. The burial depth of carbonate formation in geothermal wells with temperatures >90 °C is mainly in the range of 2000–4000 m, concentrated in the range of 3000–4000 m. Overall (Figure 9), as the burial depth of carbonate formation changes, there are more geothermal wells with relatively low temperatures in the shallow depths and more geothermal wells with higher temperatures in the deeper depths.
From the thickness of carbonate formation in different temperature ranges of geothermal wells, most geothermal wells are distributed in the thickness range of 1000–3000 m, predominantly in the range of 2000–3000 m. Among them, the thickness of carbonate formation in geothermal wells with temperatures <60 °C is mainly in the range of 1000–3000 m, concentrated in the range of 2000–3000 m. The thickness of carbonate formation in geothermal wells with temperatures of 60–90 °C is mainly in the range of 1000–3000 m, concentrated in the range of 2000–3000 m. The thickness of carbonate formation in geothermal wells with temperatures >90 °C is mainly in the range of 1000–3000 m, concentrated in the range of 2000–3000 m. The table also shows that as the thickness of carbonate formation increases, the number of geothermal wells with lower temperatures gradually decreases, while the number of geothermal wells with higher temperatures continues to increase (Figure 10).
The number of geothermal wells and well water temperatures in the Jizhong Depression are clearly constrained by the burial depth and thickness of carbonate formation, which are important factors for reservoir formation. In terms of burial depth of carbonate formations, from a perspective of favorability for reservoir formation, the order from high to low is 2000–4000 m, 1000–2000 m and 4000–5000 m, and <1000 m or ≥5000 m. The burial depths favorable for the formation of high-, medium-, and low-temperature geothermal resources are ≥5000 m, 3000–4000 m, and <3000 m. In terms of the thickness of carbonate formation, from a perspective of favorability for reservoir formation, the order from high to low is 2000–3000 m, 1000–2000 m, and <1000 m or ≥3000 m. The favorable thicknesses for the formation of high-, medium-, and low-temperature geothermal resources are all within the range of 2000–3000 m. When further divided, they are ≥3000 m, 2000–3000 m, and <2000 m.

5.2. Relationship between Geothermal Well Distribution and Cenozoic Strata

There is a clear correlation between the distribution of geothermal wells in the Jizhong Depression and the thickness of the Cenozoic strata, as shown in Table 5. From the perspective of the number of geothermal wells, they are mainly concentrated in the region with a thickness of 1000–4000 m, with 139 wells at a thickness of 2000–3000 m, accounting for 49.82% of all wells, and 78 wells at a thickness of 3000–4000 m, accounting for 37.99%. There are 29 wells at a thickness of 1000–2000 m, accounting for 10.39%. The number of geothermal wells in other thickness ranges is relatively small, with fewer than 10 wells at a thickness of <1000 m, accounting for less than 4%, and 24 wells at a thickness of ≥4000 m, accounting for 8.60%. This indicates that the formation conditions for geothermal resources require an appropriate thickness of the Cenozoic cap layer (1000–4000 m). Burial depths greater than 4000 m are difficult to explore and exploit, while depths less than 1000 m are not conducive to heat retention, hindering the formation of geothermal resources.
From the perspective of the thickness of the Cenozoic strata in geothermal wells at different temperature ranges, the Cenozoic strata thickness in geothermal wells with temperatures <60 °C is mainly in the range of 1000–4000 m, concentrated in the range of 2000–3000 m. The Cenozoic strata thickness in geothermal wells with temperatures of 60–90 °C is mainly in the range of 2000–4000 m, concentrated in the range of 2000–3000 m. The Cenozoic strata thickness in geothermal wells with temperatures >90 °C is mainly in the range of 2000–4000 m, concentrated in the range of 3000–4000 m. The temperature of geothermal wells also correlates significantly with the thickness of the Cenozoic strata.

5.3. Relationship between Geothermal Well Distribution and Fault Structures

Geothermal wells are mainly located around faults; the majority of geothermal wells are found within a 5 km range of faults, especially within a 1–3 km range on both sides of the faults. The area with the highest number of geothermal wells is within a 1 km range (Figure 7). As the distance from the faults increases, the number of geothermal wells gradually decreases, and there are virtually no geothermal wells beyond 10 km. This indicates that the presence of faults is a necessary condition for the formation of deep geothermal resources and is one of the important factors in ensuring sufficient heat and water sources for geothermal fields, serving as an important basis for evaluating the prospects of geothermal reservoirs.
According to statistics (Table 6), there are 61 geothermal wells within a 1 km range of the faults, accounting for 21.86% of the total number of geothermal wells. Within a 3 km range, there are 162 geothermal wells, accounting for 58.06% of the total. Within a 5 km range, there are 234 geothermal wells, accounting for 83.87% of the total. Outside of the 5 km range, there are 45 geothermal wells, accounting for 16.12% of the total, and there are fewer than 10 geothermal wells beyond 8 km, accounting for only 3.22% of the total. There are no deep geothermal wells beyond 10 km.
By analyzing the relationship between the change in wellhead water temperature and the distance from faults, it can be seen that the common characteristic of geothermal well distribution in different temperature ranges is that the shorter the distance to the faults, the greater the number of geothermal wells; as the distance increases, the number of geothermal wells decreases, with a greater decrease in temperature for higher temperature wells. As shown in Figure 11, the proportion of geothermal wells in the 60–90 °C range is above 20% within the 0–1 km and 1–2 km ranges. Within the 2–3 km and 3–4 km ranges, the proportion is close to 15%, and within the 4–7 km range, the proportion is greater than 5%. Within the 7–10 km range, the proportion of geothermal wells is less than 3%. As shown in Figure 7, Figure 8 and Figure 9, geothermal wells with temperatures above 120 °C only exist within a 4 km range of the faults. The two known geothermal wells with temperatures above 120 °C are within a 1–3 km range of the faults, and no geothermal wells with temperatures above 120 °C have been found within the ≤1 km or ≥5 km regions. This indicates that the formation of medium- and high-temperature geothermal resources requires the strong conductive function of fault structures, and being far from the faults leads to insufficient accumulation of geothermal energy.
Figure 11 also shows that there are no geothermal wells above 120 °C within the 0–1 km range, which may be due to the risk of rapid loss of heat energy or rapid replenishment of low-temperature water near the faults. The analysis above shows that fault structures have a significant impact on the formation of deep geothermal resources and on the number of geothermal wells and the temperature of hot water, which are indicators of the scale and quality of geothermal fields. In general, the presence of faults is conducive to the formation of deep geothermal resources, and the closer the distance to the faults, the greater the number of geothermal wells and the higher the temperature of the hot water.
In summary, the favorable locations for geothermal well production are mainly within a 6 km range on both sides of the faults. The production range of geothermal wells with temperatures below 60 °C is within 0–6 km, the production range of geothermal wells with temperatures between 60 and 90 °C is within 0–5 km, the production range of geothermal wells with temperatures above 90 °C is within 0–4 km, and the production range of geothermal wells with temperatures above 120 °C is within 1–3 km.

5.4. Relationship between Geothermal Well Distribution and Burial Depth of Low-Velocity and High-Conductive Layers

From Table 7 and Figure 8, it can be seen that geothermal wells are concentrated in the burial depth range of 10–15 km of low-velocity and high-conductive layers. The statistics show that there are five corresponding geothermal wells in the 5–10 km range of shallow high-conductive burial depths, accounting for 1.79% of the total. In the 10–13 km range, there are 73 geothermal wells, accounting for 26.16% of the total. In the 13–15 km range, there are 131 geothermal wells, accounting for 46.95% of the total. In the 15–20 km range, there are 21 geothermal wells, accounting for 7.53% of the total.
This indicates that geothermal wells are mainly distributed in the 10–20 km range of the burial depth of low-velocity and high-conductive layers, especially in the 13–15 km range, near the interface between the upper and lower crust. As the burial depth of low-velocity and high-conductive layers becomes too shallow or too deep, the number of geothermal wells continuously decreases and the temperature decreases. The distribution of existing geothermal wells has a clear positive correlation with the burial depth of low-velocity and high-conductive layers, indicating that low-velocity and high-conductive layers may be an important supplementary source of regional geothermal reservoirs.
Analysis of the burial depth of low-velocity and high-conductive layers in the distribution area of geothermal wells in different temperature ranges shows that geothermal wells below 60 °C are distributed in the 5–40 km range of low-velocity and high-conductive layers burial depth, with a relatively concentrated distribution in the 10–13 km, 20–25 km, and 30–40 km ranges. Geothermal wells with temperatures between 60 and 90 °C are mainly found in the 10–20 km range of the burial depth of low-velocity and high-conductive layers, with a total of 175 wells, accounting for 94% of the total number of geothermal wells in this temperature range. They are mainly concentrated in the 10–13 km range (51 wells, accounting for approximately 27%) and the 13–15 km range (111 wells, accounting for approximately 59%). Geothermal wells with temperatures above 90 °C are mainly located in the 14–15 km range of the burial depth of low-velocity and high-conductive layers, with a total of 16 wells, accounting for 73% of the total number of geothermal wells in this temperature range. There are fewer geothermal wells in other ranges, including three in the 10–13 km range, accounting for 14%, and one each in the 15–20 km and 15–20 km ranges, each accounting for 5%.
The comprehensive results of different temperatures and burial depths of low-velocity and high-conductive layers show that, at depths of 10–13 km, the proportion of geothermal wells with lower temperatures is relatively high, while at depths of 13–15 km, the proportion of geothermal wells with higher temperatures is relatively high. At depths of 15–20 km, the proportion of geothermal wells with lower temperatures is relatively high. This indicates that the low-velocity and high-conductive layers with burial depths of 13–15 km are most favorable for encountering geothermal wells with higher temperatures.

5.5. Summary

Utilizing temperature data from geothermal wells and a geological profile deduced from extensive geophysical interpretation, Figure 12 shows a sectional map depicting the relationship between geothermal well temperature and the distribution of the line L09 (shown in Figure 2) formation. This illustration reveals that geothermal wells are predominantly situated on either side of the faults within the profile, with elevated water temperatures recorded in wells located in depression areas as opposed to those in uplifted regions. For example, wells Ji12 and Hu1, displaying the highest water temperatures, are situated within the Baoding and Shenxian depressions, respectively. These wells exhibit common characteristics such as extensive burial beneath the upper surface of carbonate rocks, substantial thickness of carbonate rock layers, intersection by major faults, and shallow burial depths accompanied by low velocity and high conductivity.
Moreover, the three geothermal wells located in the interval between the Gaoyang low uplift and the Shenze low uplift demonstrate shallow burial depths to the top surface of carbonate rocks, a slender layer of carbonate rocks, and deep burial depths characterized by low velocity and high conductivity. Consequently, their water temperatures are slightly above 60 degrees Celsius, signifying a medium- to low-temperature geothermal reservoir. This underscores the intricate correlation between the efficacy of the geothermal wells and the variables of burial depth, thickness, fault structures, and distribution of low velocity and high conductivity within carbonate rocks.

6. Conclusions

From the spatial relationship observed between the distribution of known geothermal wells and regional geology, it is evident that the distribution of regional geothermal wells, particularly deep geothermal wells, is intricately linked to regional stratigraphy, structures, and deep geological features. The formation of deep geothermal resources in the Jizhong Depression is predominantly influenced by regional geological conditions. The following patterns in geothermal resource formation can be discerned:
  • Carbonate formation depth: The burial depth of carbonate formations plays a pivotal role in determining the temperature of deep thermal reservoirs. Typically, a depth of 2000 m is where the thermal reservoir (water) temperature consistently exceeds 60 °C, marking the transition from low-temperature to warm-temperature geothermal resources. At a depth of 3000 m, the temperature consistently surpasses 90 °C, indicating the boundary between warm-temperature and moderate-temperature geothermal fields. The thickness of carbonate formations serves as a crucial indicator of reservoir quality, correlating with erosion levels and karstification intensity. Excessive thickness suggests minimal erosion and weak karstification, unfavorable for high-quality reservoir formation. Conversely, minimal thickness indicates significant erosion and intense karstification, leading to a reduced reservoir thickness and diminished heat storage capacity.
  • Cenozoic strata thickness: The thickness of the Cenozoic strata is a key determinant of the preservation conditions for deep thermal energy. Analyzing geothermal well water temperatures, areas with thinner Cenozoic strata in the northern and southern regions predominantly feature low-temperature geothermal wells, primarily of the hot water–warm water variety. These areas have a higher proportion of geothermal wells with temperatures ranging from 40 to 60 °C and fewer wells exceeding 90 °C. In contrast, areas with thicker Cenozoic strata in the central region possess a greater number of low-temperature, hot-water-type geothermal wells and a notable presence of moderate-temperature geothermal wells surpassing 90 °C.
  • Regional structures and conductivity: Regional structures and shallow high-conductive burial depths exert a significant influence on geothermal resource distribution. Fault structures possess robust conductive capabilities. The shallow high-conductive burial depth, especially within the 10–20 km range and more precisely the 13–15 km range, can serve as a vital supplementary source for regional geothermal energy, profoundly impacting geothermal reservoir formation.

Author Contributions

Conceptualization, W.Z., D.W. and H.Q.; methodology, W.Z., W.X. and G.Z.; software, W.Z., G.W. and G.Z.; investigation and validation, W.Z., G.W., A.C. and M.L.; writing—original draft preparation, W.Z. and D.W.; writing—review and editing, all participants; supervision, D.W., Q.Z. and H.Q. All authors have read and agreed to the published version of the manuscript.

Funding

This research was funded by the China Geological Survey Project (grant number DD20190556) and the Basic Scientific Research Project of the Chinese National Nonprofit Institute (grant number AS2020P01, JYYWF20182601, and AS2022P02).

Data Availability Statement

Not applicable.

Conflicts of Interest

The authors declare no conflict of interest.

References

  1. Chapman, D.S.; Rybach, L. Heat flow anomalies and their interpretation. J. Geodyn. 1985, 4, 3–37. [Google Scholar] [CrossRef]
  2. Cermark, V.; Rybach, L. Vertical distribution of heat production in the continental crust. Tectonophysics 1989, 159, 217–230. [Google Scholar] [CrossRef]
  3. Wu, H. Review and Prospect of Oil and Gas Exploration in Jizhong Depression. Oil Gas Geol. 1988, 3, 320–323. [Google Scholar]
  4. Qi, J.; Yang, Q. Cenozoic structural deformation and dynamic processes of the Bohai Bay basin province, China. Mar. Pet. Geol. 2010, 27, 757–771. [Google Scholar] [CrossRef]
  5. Mao, L.G.; Xiao, A.C.; Zhang, H.W.; Wu, Z.K.; Yi, L.F.; Wu, L.; Zhao, X.Z. Structural patterns of the late Mesozoic crustal detachment system in the Raoyang Sag, Bohai Bay Basin, eastern China: New insights from 3D seismic data. Mar. Pet. Geol. 2017, 84, 215–224. [Google Scholar] [CrossRef]
  6. Chen, F.; Zheng, Q.; Lu, S.; Ding, X.; Ju, Y.; Zhao, H. Classification of the tight oil reservoir storage space in the Raoyang Sag of the Jizhong Depression in the Bohai Bay Basin, China. Energy Sci. Eng. 2020, 8, 74–88. [Google Scholar] [CrossRef]
  7. Wang, J.; Xie, J. Seismic recognition and quantitative characterization of siliciclastic–carbonate mixed sedimentary rocks in the Bohaiwan Basin, Northeast of China. Carbonates Evaporites 2020, 35, 52. [Google Scholar] [CrossRef]
  8. Liu, C.; Li, H.; Shan, X. Development mechanism of metamorphic fractured reservoirs in the Bozhong area, Bohai Bay Basin: Implications from tectonic and magmatic hydrothermal activities. Geoenergy Sci. Eng. 2023, 229, 212030. [Google Scholar] [CrossRef]
  9. Liu, G.D.; Shi, S.L.; Wang, B.J. Relationship between the high-conductivity layer within the crust and the tectonic activity in the North China region. Sci. China Ser. B 1984, 14, 839–848. [Google Scholar] [CrossRef]
  10. Zhao, G.Z.; Liu, G.D.; Wang, J.Y. Inversion and Interpretation of Magnetotelluric Data Along the Beijing-Baigezhuang Profile: A Continuous Variation Model in Resistivity. Acta Seismol. Sinica. 1986, 8, 179–190. [Google Scholar]
  11. Wei, W.B.; Jin, S.; Ye, G.F.; Deng, M.; Jing, J.E. MT sounding and lithosphere thickness in North China. Geol. China 2006, 33, 762–772. [Google Scholar]
  12. Zhan, Y.; Zhao, G.Z.; Wang, L.F.; Wang, J.J.; Xiao, Q.B. Deep structure in Shijiazhuang and the vicinity by Magnetotellurics. Seismol. Geol. 2011, 33, 913–927. [Google Scholar]
  13. Chang, J.; Qiu, N.S.; Zhao, X.Z.; Xu, W.; Xu, Q.C.; Jin, F.M.; Han, C.Y.; Ma, X.F.; Dong, X.Y. Present-day geothermal regime of the Jizhong Depression in Bohai basin, East China. Chin. J. Geophys. 2016, 59, 1003–1016. [Google Scholar] [CrossRef]
  14. Li, J.; Zhang, Z.G. Characteristics of geothermal resources in Jizhong depression (Hebei region). J. Hebei Univ. Technol. 2018, 47, 113–120. [Google Scholar] [CrossRef]
  15. Liang, H.; Qian, Z.; Xin, S.; Zhao, K.; Zhu, L. Assessment and Development of Geothermal Resources in Jizhong Depression. China Pet. Explor. 2010, 15, 63–69. Available online: http://www.cped.cn/EN/Y2010/V15/I5/63 (accessed on 10 July 2023).
  16. Liu, X.; You, G.Q. Tectonic regional subdivision of China in the light of plate theory. Geol. China 2015, 42, 1–17. [Google Scholar]
  17. Dong, Y.Y.; Zeng, J.H.; Zhao, X.Z.; Wang, Y.N.; Chen, T.H.; Zhang, Y.C.; Feng, S. The temperature evaluation of the buried hill geothermal reservoirs in the Jizhong Depression, Bohai Bay Basin, China. Geofluids 2020, 2020, 1–14. [Google Scholar] [CrossRef]
  18. Miao, Q.; Wang, G.; Qi, S.; Xing, L.; Xin, H.; Zhou, X.; Zhang, S. Genesis Mechanism of Deep Carbonate Reservoir in Jizhong Depression. Lithosphere 2022, 2022, 7223019. [Google Scholar] [CrossRef]
  19. Miao, Q.; Wang, G.; Qi, S.; Xing, L.; Xin, H.; Zhou, X. Genetic mechanism of geothermal anomaly in the Gaoyang uplift of the Jizhong depression. Front. Earth Sci. 2022, 10, 885197. [Google Scholar] [CrossRef]
  20. Xiang, P.; Ji, H.; Shi, Y.; Huang, Y.; Sun, Y.; Xu, X. Characteristics, Diagenesis, Controlling Factors and Formation Mechanism of Deep-Burial Ordovician Carbonate Reservoirs in the Yangshuiwu Area, Jizhong Depression, Bohai Bay Basin. Arab. J. Sci. Eng. 2023, 48, 645–663. [Google Scholar] [CrossRef]
  21. Wang, G.L.; Zhang, W.; Lin, W.J.; Liu, F.; Zhu, X.; Liu, Y.G.; Li, J. Research on formation mode and development potential of geothermal resources in Beijing Tianjin-Hebei region. Geol. China 2017, 44, 1074–1085. [Google Scholar] [CrossRef]
  22. Zuo, Y.H.; Qiu, N.S.; Chang, J.; Hao, Q.Q.; Li, Z.X.; Li, J.W.; Li, W.Z.; Xie, C.H. Meso-Cenozoic Lithospheric Thermal Structure in the Bohai Bay Basin. Acta Geol. Sin. 2013, 87, 145–153. Available online: https://caod.oriprobe.com/articles/32046816/Meso_Cenozoic_Lithospheric_Thermal_Structure_in_th.htm (accessed on 1 August 2023).
  23. Cui, Y.; Zhu, C.Q.; Qiu, N.S.; Tang, B.N.; Guo, S.S. Geothermal lithospheric thickness in the centra Jizhong Depression and its geothermal significance. Acta Geol. Sin. 2020, 94, 1960–1969. [Google Scholar] [CrossRef]
  24. Ma, L.; Meng, J.H.; Shan, Z.X.; Li, X.L.; Li, F.T.; Jin, Y.M.; Wang, J.H.; Li, B.L. Comparisons and applications of several boundary detection methods for potential field data. Prog. Geophys. 2017, 32, 2514–2519. [Google Scholar]
  25. Vasanthi, A.; Santosh, M. Overview of regional gravity field computation models and application of a novel method in imaging the lithospheric architecture and destruction of the North China Craton. Earth-Sci. Rev. 2021, 215, 103548. [Google Scholar] [CrossRef]
  26. Oskooi, B.; Pedersen, L.B.; Smirnov, M.; Árnason, K.; Eysteinsson, H.; Manzella, A.; DGP Working Group. The deep geothermal structure of the Mid-Atlantic Ridge deduced from MT data in SW Iceland. Phys. Earth Planet. Inter. 2005, 150, 183–195. [Google Scholar] [CrossRef]
  27. Zhou, R.F.; Wang, X.B.; Qin, C. Comprehensive utilization of NLCG and OCCAM in two-dimensional magnetotelluric inversion. Prog. Geophys. 2016, 31, 2306–2312. [Google Scholar]
  28. Zhu, W.; Fan, C.S.; Yao, D.W.; Wang, G. Noise source analysis and noise characteristics study of MT in an ore concentration area. Geophys. Geochem. Explor. 2011, 35, 658–662. [Google Scholar]
  29. Wang, G.; Wang, D.; Meng, Y.; Li, Y.; Wang, W.; Zhu, W.; Cui, A.; Zhao, Y. High-Speed Railways Interference Signal Characteristics and Multiple Remote References Denoising of Magnetotelluric Data in Jizhong Depression, China. Appl. Sci. 2023, 13, 4304. [Google Scholar] [CrossRef]
  30. Wang, K.; Feng, X.; Malcolm, A.; Williams, C.; Wang, X.; Zhang, K.; Zhang, B.; Yue, H. Multiscale Full-Waveform Inversion with Land Seismic Field Data: A Case Study from the Jizhong Depression, Middle Eastern China. Energies 2022, 15, 3223. [Google Scholar] [CrossRef]
  31. Pavlenkova, N.I. Low velocity and low electrical resistivity layers in the middle crust. Ann. Geophys. 2004, 47, 157–169. [Google Scholar] [CrossRef]
  32. Patro, P.K. Magnetotelluric Studies for Hydrocarbon and Geothermal Resources: Examples from the Asian Region. Surv. Geophys. 2017, 38, 1005–1041. [Google Scholar] [CrossRef]
  33. Wang, M.D.; Ma, J.Q.; Fan, J.S. The Discussion on the Geophysical Data Gridding Based on the Surfer Software. Chin. J. Eng. Geophys. 2017, 14, 694–700. Available online: https://caod.oriprobe.com/articles/52226553/The_Discussion_on_the_Geophysical_Data_Gridding_Ba.htm (accessed on 3 August 2023).
  34. He, D.F.; Cui, Y.Q.; Shan, S.Q.; Xiao, Y.; Zhang, Y.Y.; Zhang, C.B. Characteristics of geologic framework of buried-hill in Jizhong depression, Bohai Bay Basin. Chin. J. Geol. 2018, 53, 1–24. Available online: http://www.dzkx.org/en/article/doi/10.12017/dzkx.2018.001 (accessed on 15 August 2023).
  35. Liu, J. Reservoir Characteristics and Comprehensive Evaluation of Wumishan Formation in Jizhong Depression. Master’s Thesis, China University of Petroleum, Beijing, China, 2015. [Google Scholar] [CrossRef]
  36. Shan, S.Q.; Zhang, Y.Y.; Zhang, R.F. Geologic architecture and tectonic evolution of Xushui Sag, Bohai Bay Basin. Oil Gas Geol. 2018, 39, 1037–1047. [Google Scholar]
  37. Yang, M.H.; Liu, C.Y.; Sun, D.S.; Cui, Y.Q. Extensional Tectonic System and its Deep Seated Setting of Jizhong Basin, China. Geotecton. Metallog. 2002, 26, 113–120. [Google Scholar]
  38. Yang, X.P.; Liu, B.J.; Zhan, Y.; Ji, J.F.; Xu, X.W.; Feng, S.Y.; Gao, C.J.; Zhao, W.L.; Liang, G.P.; Du, X.Q. Survey of crustal structure and fault activity around southern Shijiazhuang in the eastern margins of Taihangshan Mts. Acta Geophys. Sin. 2016, 59, 528–542. [Google Scholar]
  39. Mao, X.; Wang, X.W.; Guo, S.Y.; Bao, Z.D. Genetic mechanism of geothermal resources in the Gaoyang geothermal field and adjacent areas. Carsologica Sin. 2021, 40, 273–280. [Google Scholar]
  40. Miao, Q.Z.; Wang, G.L.; Xing, L.X.; Zhang, W.; Zhou, X.N.; Wang, W.Q. Study on application of deep thermal reservoir by using geophysical and geochemical methods in the Jizhong depression zone. Acta Geol. Sin. 2020, 94, 2147–2156. [Google Scholar] [CrossRef]
  41. Dai, P.; Wu, K.; Wang, G.; Wang, S.; Song, Y.; Zhang, Z.; Shang, Y.; Zheng, S.; Meng, Y.; She, Y. Geothermal Geological Characteristics and Genetic Model of the Shunping Area along Eastern Taihang Mountain. Minerals 2022, 12, 919. [Google Scholar] [CrossRef]
Figure 1. Tectonic units of Bohai Bay Basin (modified from Cui et al. (2020) [23]) (a) and comprehensive geophysical survey profiles in the Jizhong Depression (b).
Minerals 13 01266 g001
Figure 2. Structural zoning and location map of geothermal wells for analysis in the Jizhong Depression.
Minerals 13 01266 g002
Figure 3. Isodepth map of the top surface of carbonate formations in the Jizhong Depression.
Minerals 13 01266 g003
Figure 4. Isodepth map of the bottom surface of carbonate formations in the Jizhong Depression.
Minerals 13 01266 g004
Figure 5. Isopach map of carbonate formations thickness in the Jizhong Depression.
Minerals 13 01266 g005
Figure 6. Burial depth map of the basement surface of the Cenozoic (bedrock top interface) in the Jizhong Depression.
Minerals 13 01266 g006
Figure 7. Relationship between geothermal well distribution and fault structures.
Minerals 13 01266 g007
Figure 8. Relationship between the distribution of geothermal wells and the burial depth of low-velocity and high-conductive layers within the crust and mantle. These layers are distinguished by their low density, reduced seismic wave velocity, elevated electrical conductivity, and high temperature, establishing them as significant sources of heat.
Minerals 13 01266 g008
Figure 9. Percentage curve of geothermal wells at different temperatures in different burial depth ranges of carbonate formations ((a): 2–3 km, (b): 3–4 km).
Minerals 13 01266 g009
Figure 10. Percentage curve of geothermal wells at different temperatures in different thickness ranges of carbonate formations ((a): 1–2 km, (b): 2–3 km).
Minerals 13 01266 g010
Figure 11. Statistical curve of distribution of geothermal wells at different temperatures ((a): 60–90 °C, (b): ≥120 °C).
Minerals 13 01266 g011
Figure 12. Geothermal well water temperature and L09 stratigraphic distribution.
Minerals 13 01266 g012
Table 1. Sedimentary layer heat production and thermal conductivity columns in central Jizhong Depression (Cui et al. (2020) [23]).
StratumLithological Content (%)A * (μW/m3)K * (W/(m·K))
Q + N30Sandstone1.171.907
20Siltstone
50Mudstone
E30Sandstone1.162.315
23Siltstone
45Mudstone
2Terrestrial dolomite
Mz + Pz6Sandstone1.063.395
2Siltstone
6Mudstone
50Graystone
25Marine dolomite
11Marine clastic rocks
Jx5Marine clastic rocks0.465.109
95Marine dolomite
Ch30Marine clastic rock0.943.838
70marine dolomite
* A–rock radiative heating rate; K–rock thermal conductivity; A and K are weighted according to the lithological content of the same stratum as the measured data.
Table 2. Statistical table of geothermal well distribution with different temperature ranges.
Water Temperature (°C)Number of Geothermal WellsPercentageMain Distribution UnitsUnits without Geothermal Wells
<607025.74%Raoyang Depression (17), Beijing Depression (17), Shulu Depression (13), etc. (12 units)Dachang Depression, Wuqing Depression, Niubei Slope, Rongcheng uplift, Gaoyang low uplift, Lixian Slope, etc. (11 units)
60~756423.53%Raoyang Depression (19), Niutuo town uplift (16), etc. (14 units)Daxing uplift, Niubei Slope, Rongcheng uplift, Wuji–Gaocheng low uplift, etc. (9 units)
75~9011743.01%Raoyang Depression (36), Niutuo uplift (30), Gaoyang low uplift (15), Shendian Depression (13), etc. (12 units)Daxing uplift, Dachang Depression, Langgu Depression, etc. (11 units)
90~105114.04%Gaoyang low uplift (3), Raoyang Depression (3), Niutuo uplift (2), Baxian Depression (1), Lixian Slope (1), Wuji–Gaocheng low uplift (1), etc. (6 units)Beijing Depression, Daxing uplift, Niubei Slope, Rongcheng uplift, etc. (17 units)
105~12082.94%Gaoyang low uplift (3), Raoyang Depression (2), Lixian Slope (2), Rongcheng uplift (1), etc. (4 units)Beijing Depression, Daxing uplift, Niutuo town uplift, etc. (19 units)
120~13520.74%Raoyang Depression (1), Lixian Slope (1)Other units (21 units)
Table 3. Statistics of the correlation between the number of geothermal wells and burial depth (left) and thickness (right) of carbonate formations.
NumberBurial Depth of Carbonate Formations (m)Number of Geothermal WellsPercentageThickness of Carbonate Formations (m)Number of Geothermal Wells Percentage
10~100082.87%0~100031.08%
21000~2000238.24%1000~20007326.16%
32000~300011942.65%2000~300020071.68%
43000~400010637.99%3000~400031.08%
54000~5000217.53%
65000~600020.72%
Table 4. Statistics of the correlation between the geothermal well water temperature and depth of carbonate formation.
Water Temperature (°C)Number of Geothermal WellsPercentageDepth (m)Number of Geothermal WellsPercentage
<607025.09%0~1000710.00%
1000~20001724.29%
2000~30002840.00%
3000~40001724.29%
4000~500011.43%
5000~600000.00%
60~756724.01%0~100000.00%
1000~200011.49%
2000~30004161.19%
3000~40001826.87%
4000~500057.46%
5000~600022.99%
75~9012043.01%0~100010.83%
1000~200054.17%
2000~30004436.67%
3000~40005545.83%
4000~50001512.50%
5000~600000.00%
90~105124.30%0~100000.00%
1000~200000.00%
2000~3000541.67%
3000~4000758.33%
4000~500000.00%
5000~600000.00%
105~12082.87%0~100000.00%
1000~200000.00%
2000~3000112.50%
3000~4000787.50%
4000~500000.00%
5000~600000.00%
120~13520.72%0~100000.00%
1000~200000.00%
2000~300000.00%
3000~40002100.00%
4000~500000.00%
5000~600000.00%
Table 5. Statistics of the correlation between the number of geothermal wells and thickness of Cenozoic strata.
Thickness of Cenozoic Strata (m)Number of Geothermal WellsPercentage of Total Geothermal WellsThickness of Cenozoic Strata (m)Number of Geothermal WellsPercentage of Total Geothermal Wells
0~100093.23%1000~20002910.39%
2000~300013949.82%3000~40007827.96%
4000~5000238.24%5000~600010.36%
Table 6. Statistics of the correlation between the number of geothermal wells and distance to the faults.
Distance (m)Number of Geothermal WellsPercentageDistance (m)Number of Geothermal WellsPercentage
0~100093.23%1000~20002910.39%
2000~300013949.82%3000~40007827.96%
4000~5000238.24%5000~600010.36%
Table 7. Statistics of the correlation between the geothermal well distribution and burial depth of low-velocity and high-conductive layers.
Burial Depth of Low-Velocity and High-Conductive Layers (km)Number of Geothermal WellsPercentageBurial Depth of Low-Velocity and High-Conductive Layers (km)Number of Geothermal WellsPercentage
5~1051.79%20~25196.81%
10~137326.16%25~3093.23%
13~1513146.95%30~35103.58%
15~20217.53%35~40113.94%
Disclaimer/Publisher’s Note: The statements, opinions and data contained in all publications are solely those of the individual author(s) and contributor(s) and not of MDPI and/or the editor(s). MDPI and/or the editor(s) disclaim responsibility for any injury to people or property resulting from any ideas, methods, instructions or products referred to in the content.

