Article

Molecular Simulation of Adsorption and Diffusion of Methane and Ethane in Kaolinite Clay under Supercritical Conditions: Effects of Water and Temperature

School of Science, North China University of Science and Technology, Tangshan 063210, China
*
Authors to whom correspondence should be addressed.
Minerals 2023, 13(10), 1269; https://doi.org/10.3390/min13101269
Submission received: 2 August 2023 / Revised: 22 September 2023 / Accepted: 26 September 2023 / Published: 28 September 2023
(This article belongs to the Section Clays and Engineered Mineral Materials)

Abstract

:
Grand Canonical Monte Carlo (GCMC) simulation and Molecular Dynamics (MD) simulations were used to study the effects of temperature (310 K to 400 K), pressure (≤30 MPa) and water content (0 molecule/nm3 to 9 molecule/nm3) on the adsorption and diffusion behavior of CH4 and C2H6 in 3 nm kaolinite slit under supercritical conditions. The obtained adsorption capacity, isosteric adsorption heat, concentration distribution and diffusion coefficient were analyzed and compared. The simulation results show that the adsorption capacity of C2H6 is higher under low pressure conditions, and the adsorption capacity of CH4 is higher under high pressure conditions due to the small molecular radius and increased adsorption space. The addition of water molecules and the increase in temperature will reduce the adsorption capacity and isosteric adsorption heat of the two gases. We analyzed the changes in Langmuir volume and Langmuir pressure of the two gases under different temperature and water content conditions. The addition of water molecules and the increase in temperature will reduce the saturation adsorption capacity (which has a greater effect on C2H6) and the adsorption rate of the two gases in the kaolinite slit. The water molecules occupy the adsorption site of the gas molecules (limiting the diffusion of the gas molecules), which reduces the interaction between gas molecules and the wall surface, thus altering the distribution of the two gases in the slit. The increase in temperature will accelerate the oscillation of the gas molecules, increasing diffusion, and also leads to a reduction in the peak value of the adsorption peaks of the two gases.

1. Introduction

In recent years, with the increasing energy consumption and the gradual depletion of the world’s recoverable conventional oil and gas resources, the search for safe and promising new energy sources has become the focus of widespread concern and discussion. Shale gas, as a new type of unconventional energy, has attracted a lot of attention [1]. It consists mainly of methane and other hydrocarbons (ethane, propane, butane). Compared to conventional gas reservoirs, shale gas reservoirs are not only the source of shale gas production, but also the storage place of shale gas. There are generally three types of storage states in shale formations (free state, adsorbed state and dissolved state), among which the adsorption state is an important part of shale gas, accounting for about 20% to 85% of the total reserves [2,3,4]. Clay minerals and organic matter provide sufficient space for adsorbed shale gas due to their large pore volume and specific surface area [5,6].
CH4 occupies the largest proportion of shale gas [2]. In recent years, the adsorption of CH4 in clay minerals has been studied by many researchers and the effects of temperature and pressure on adsorption are mostly considered. Rexer et al. [7] studied the adsorption of CH4 on dry and organic-rich alum shale samples in their study, with pressures reaching 14 MPa and the temperature ranging from 300–473 K. In 2020, Hu et al. [8] conducted a CH4 adsorption experiment on shale samples in a certain area in Sichuan and found that the adsorption amount of methane in shale has a strong linear negative correlation with temperature. Unlike other researchers who considered the influence of a single factor on CH4 adsorption by shale, Han et al. [9] considered the synergistic effect of water content, temperature and pressure on CH4 adsorption, and found that the adsorption of CH4 in shale with low water content is greatly affected by temperature; at low temperature, water content has a great influence on the adsorption of CH4 by shale. Huang et al. [10] used the volumetric method to determine the high-pressure adsorption isotherms of CH4, C2H6 and their mixtures on shale in the Sichuan Basin. However, the traditional experimental methods have a high cost, low efficiency, and can only be carried out in a limited range of pressures and temperatures, which makes it difficult to reflect the real reservoir environment of shale rock. These methods also lack strong support for in-depth understanding of the microscopic mechanism of shale gas adsorption.
Benefiting from the rapid development of computer technology and commercial molecular simulation software, the study of adsorption properties of adsorbents by molecular simulation methods is increasingly favored by scientists. In the research of shale gas adsorption, people mostly choose montmorillonite, illite and kerogen as adsorbents with strong adsorption properties. Hao et al. [11] used the Grand Canonical Monte Carlo (GCMC) method to compare and analyze the adsorption behavior of CH4 in quartz, montmorillonite and organic matter nanopores. Huang et al. [12] studied the adsorption rules of CH4 in inorganic pores with pore sizes less than 1 nm. With the intensifying research, the types of adsorbents have been extended to organic–inorganic nanocomposites. Huang et al. [13] studied in depth, the microscopic characteristics of the fluid state in clay–organic nanocomposites during shale gas extraction on a molecular scale. Zhu et al. [14] investigated the properties of organic–inorganic nanocomposites and their effects on gas adsorption capacity and found that clay–organic interactions and structural evolution greatly affect gas adsorption capacity. It has been found that shales at different depths in the actual formation have varying degrees of water content, and the presence of these water molecules is not conducive to gas adsorption [15]. In some molecular modelling work, researchers have considered the mechanisms by which water molecules affect shale gas adsorption. Li et al. [16] suggested that stronger interactions between water molecules and the slit walls (electrostatic forces and van der Waals forces) would occupy more adsorption space leading to a significant decrease in the amount of CH4 adsorbed in illite, montmorillonite and chlorite. Xiong et al. [17] concluded that the electrostatic force between water molecules and the wall and the hydrogen bonding effect between water molecules make it easy for water molecules to accumulate on the surface of minerals to occupy the adsorption space, which is unfavorable for CH4 adsorption. Huang et al. [18,19] in their study found that the occupation of enterable pores by H2O in the form of clusters lead to a decrease in the adsorption capacity of CH4 and CO2 in casein. It can be seen that the mechanism of water molecules influencing adsorption is different in organic and inorganic nanopores.
It can be seen that most of the previous modelling studies have focused on the adsorption patterns of CH4 or CO2. As an important industrial raw material, C2H6 accounted for 12% to 35% of shale gas composition, but there were few reports on the adsorption law of C2H6. In addition to this, kaolinite, as one of the important components of clay minerals, has been less well studied. Therefore, this paper intends to use Materials Studio software to establish a kaolinite slit model, and explore the effects of temperature, pressure and water content on the adsorption behavior of CH4 and C2H6 in the kaolinite slit using the Grand Canonical Monte Carlo (GCMC) simulation and Molecular Dynamics (MD) simulation methods provided by the software [11,12,16,18]. We analyzed and compared the adsorption capacity, isosteric adsorption heat, concentration distribution and diffusion coefficient, which were obtained to provide a theoretical basis for elucidating the microscopic mechanism of shale gas adsorption.

2. Materials and Methods

2.1. Molecular Models

The kaolinite model data used in the calculations were obtained from the COD database [20], with space group P1 and triclinic system, and cell parameters: a = 5.15 Å , b = 8.94 Å , c = 7.39 Å . α = 91.93°, β = 105.05°, γ = 89.80°. The molecular formula is Al4[Si4O10](OH)8, with a total of 34 atoms in the single cell, and it is a TO-type dioctahedral layered structure, that is, the structural unit layer is stacked along the C-axis by connecting the silicon tetrahedral sheet and the aluminum oxide octahedral sheet. No cations or water molecules exist between the layers, and the layers are linked by hydrogen bonds.
Since the single cell structure cannot reflect the periodicity and symmetry of the crystal structure of kaolinite, we carried out the supercell treatment on a single cell, and established the 4 a × 2 b kaolinite supercell model in the x × y direction. Among the three dissociation surfaces of kaolinite, the (001) surface is the most easily dissociated, this is because only the hydrogen bonds between the layers are broken at this time, not the chemical bonds. The main exposed surface is the (001) surface of kaolinite. Therefore, we construct a (001) surface by slicing the supercell model and using this as a research focus [21]. The pores between the crystal layers of clay minerals are mostly slit-like, and XRD results show that pore structures (micropores and mesoporous pores) less than 20 nm are the main ones in shale nanopores [22], where slit width is defined as the distance between planes of the centers of oxygen atoms in the inner surface layers. On the basis of the (001) surface, we construct the kaolinite slit model through the “build layer” button. On this basis, the effects of temperature and water content on the adsorption behavior of CH4 and C2H6 were investigated.
The non-bond interaction in this system includes van der Waals force interaction and electrostatic interaction, wherein the van der Waals force interaction is described by the L-J 12-6 potential energy model, while the potential energy model describing the combined action of van der Waals force and Coulomb force is:
u r i j = 4 ε i j σ i j r i j 12 σ i j r i j 6 + q i q j 4 π ε 0 r i j
σ i j and ε i j in the above equation are L-J potential energy parameters, which can be calculated according to the Lorentz–Botherlot mixing rule:
σ i j = σ i + σ j / 2 ε i j = ε i ε j
where σ is the collision diameter of the atom or molecule (Å), ε   is the depth of the potential energy well of the atom or molecule (kcal/mol), r i j is the distance between the two atoms (Å), ε 0 is the dielectric constant (F/m), and q i and q j are the charges carried by the atoms in the system (C).
We use the Universal force field to describe the kaolinite slit, which covers all elements of the periodic table and is not only applicable to a variety of different systems, but also has high accuracy in predicting molecular structure [12,23,24]. The potential parameters of adsorbent molecules CH4 and C2H6 were taken from a defined OPLS model [25], and the potential parameters of H2O were taken from defined SPC-E model [26]. All fluid molecules were kept electrically neutral and assumed to be rigid. The 3 nm kaolinite slit model and the L-J potential energy parameters and charges of each atom in the fluid molecule are shown in Table 1.

2.2. Simulation Details

The adsorption of CH4 and C2H6 by kaolinite slit under different conditions was simulated by the giant regular Monte Carlo method. Based on the uVT ensemble, the adsorbent molecules were inserted, deleted and moved randomly to keep the chemical potential of the gas, the volume and temperature of the system unchanged, where the chemical potential is a function of fugacity rather than pressure. Therefore, the Peng–Robinson equation of state was used to convert the pressure into fugacity as an input parameter in the adsorption simulation for the calculation [27]. The Coulomb force was calculated by the Ewald addition method, and the van der Waals force was calculated by the Atom based method, and the cut-off distance of the L-J potential energy was 0.9 nm. According to previous experience [28,29,30], the total number of simulated steps was set to 1 × 10⁸, half of which was used to achieve the equilibrium state of the system, and half of which was used to obtain a statistical average. In this simulation, the clay layer was assumed to be rigid, because the research focus was on the adsorption mechanism, rather than the clay swelling caused by adsorption. Based on the above setup we simulated the adsorption behavior of CH4 with C2H6 in a 3 nm kaolinite slit at different temperatures (310 K to 400 K) and water contents (0 molecule/nm3 to 9 molecule/nm3). The critical temperature of CH4 is 190.5 K and that of C2H6 is 305.4 K. Therefore, both gases are in a supercritical state at the temperature set in this modeling simulation. In this case, the excess adsorption capacity of CH4/C2H6 is no longer equal to the absolute adsorption capacity. The absolute adsorption capacity includes the adsorbed phase gas molecules on the wall of the kaolinite slit and the gas phase gas molecules in the middle of the slit [31], while the excess adsorption capacity only includes the former. Therefore, the absolute adsorption scale of CH4 and C2H6 is used in this paper to better reflect the adsorption behavior of gases in the supercritical state. The adsorption capacity and heat of CH4 and C2H6 by kaolinite slit were obtained after the simulation, and the final result was the average value of three parallel calculations.
The lowest energy configuration returned by the adsorption calculation was selected for molecular dynamics simulation, NVT was selected for ensemble, Nose was selected for the temperature control function, and the time step and total time were set to 1 fs and 1000 ps, respectively. The simulation results were output every 200 steps. The resulting energy, temperature, and pressure are independent of time, with only negligible fluctuations, indicating that the system is stable. The particle trajectory obtained by the molecular dynamics simulation method was analyzed, and the distribution diagram and self-diffusion coefficient of CH4 and C2H6 in the three clay minerals along the Z direction were obtained under different conditions.

3. Results and Discussion

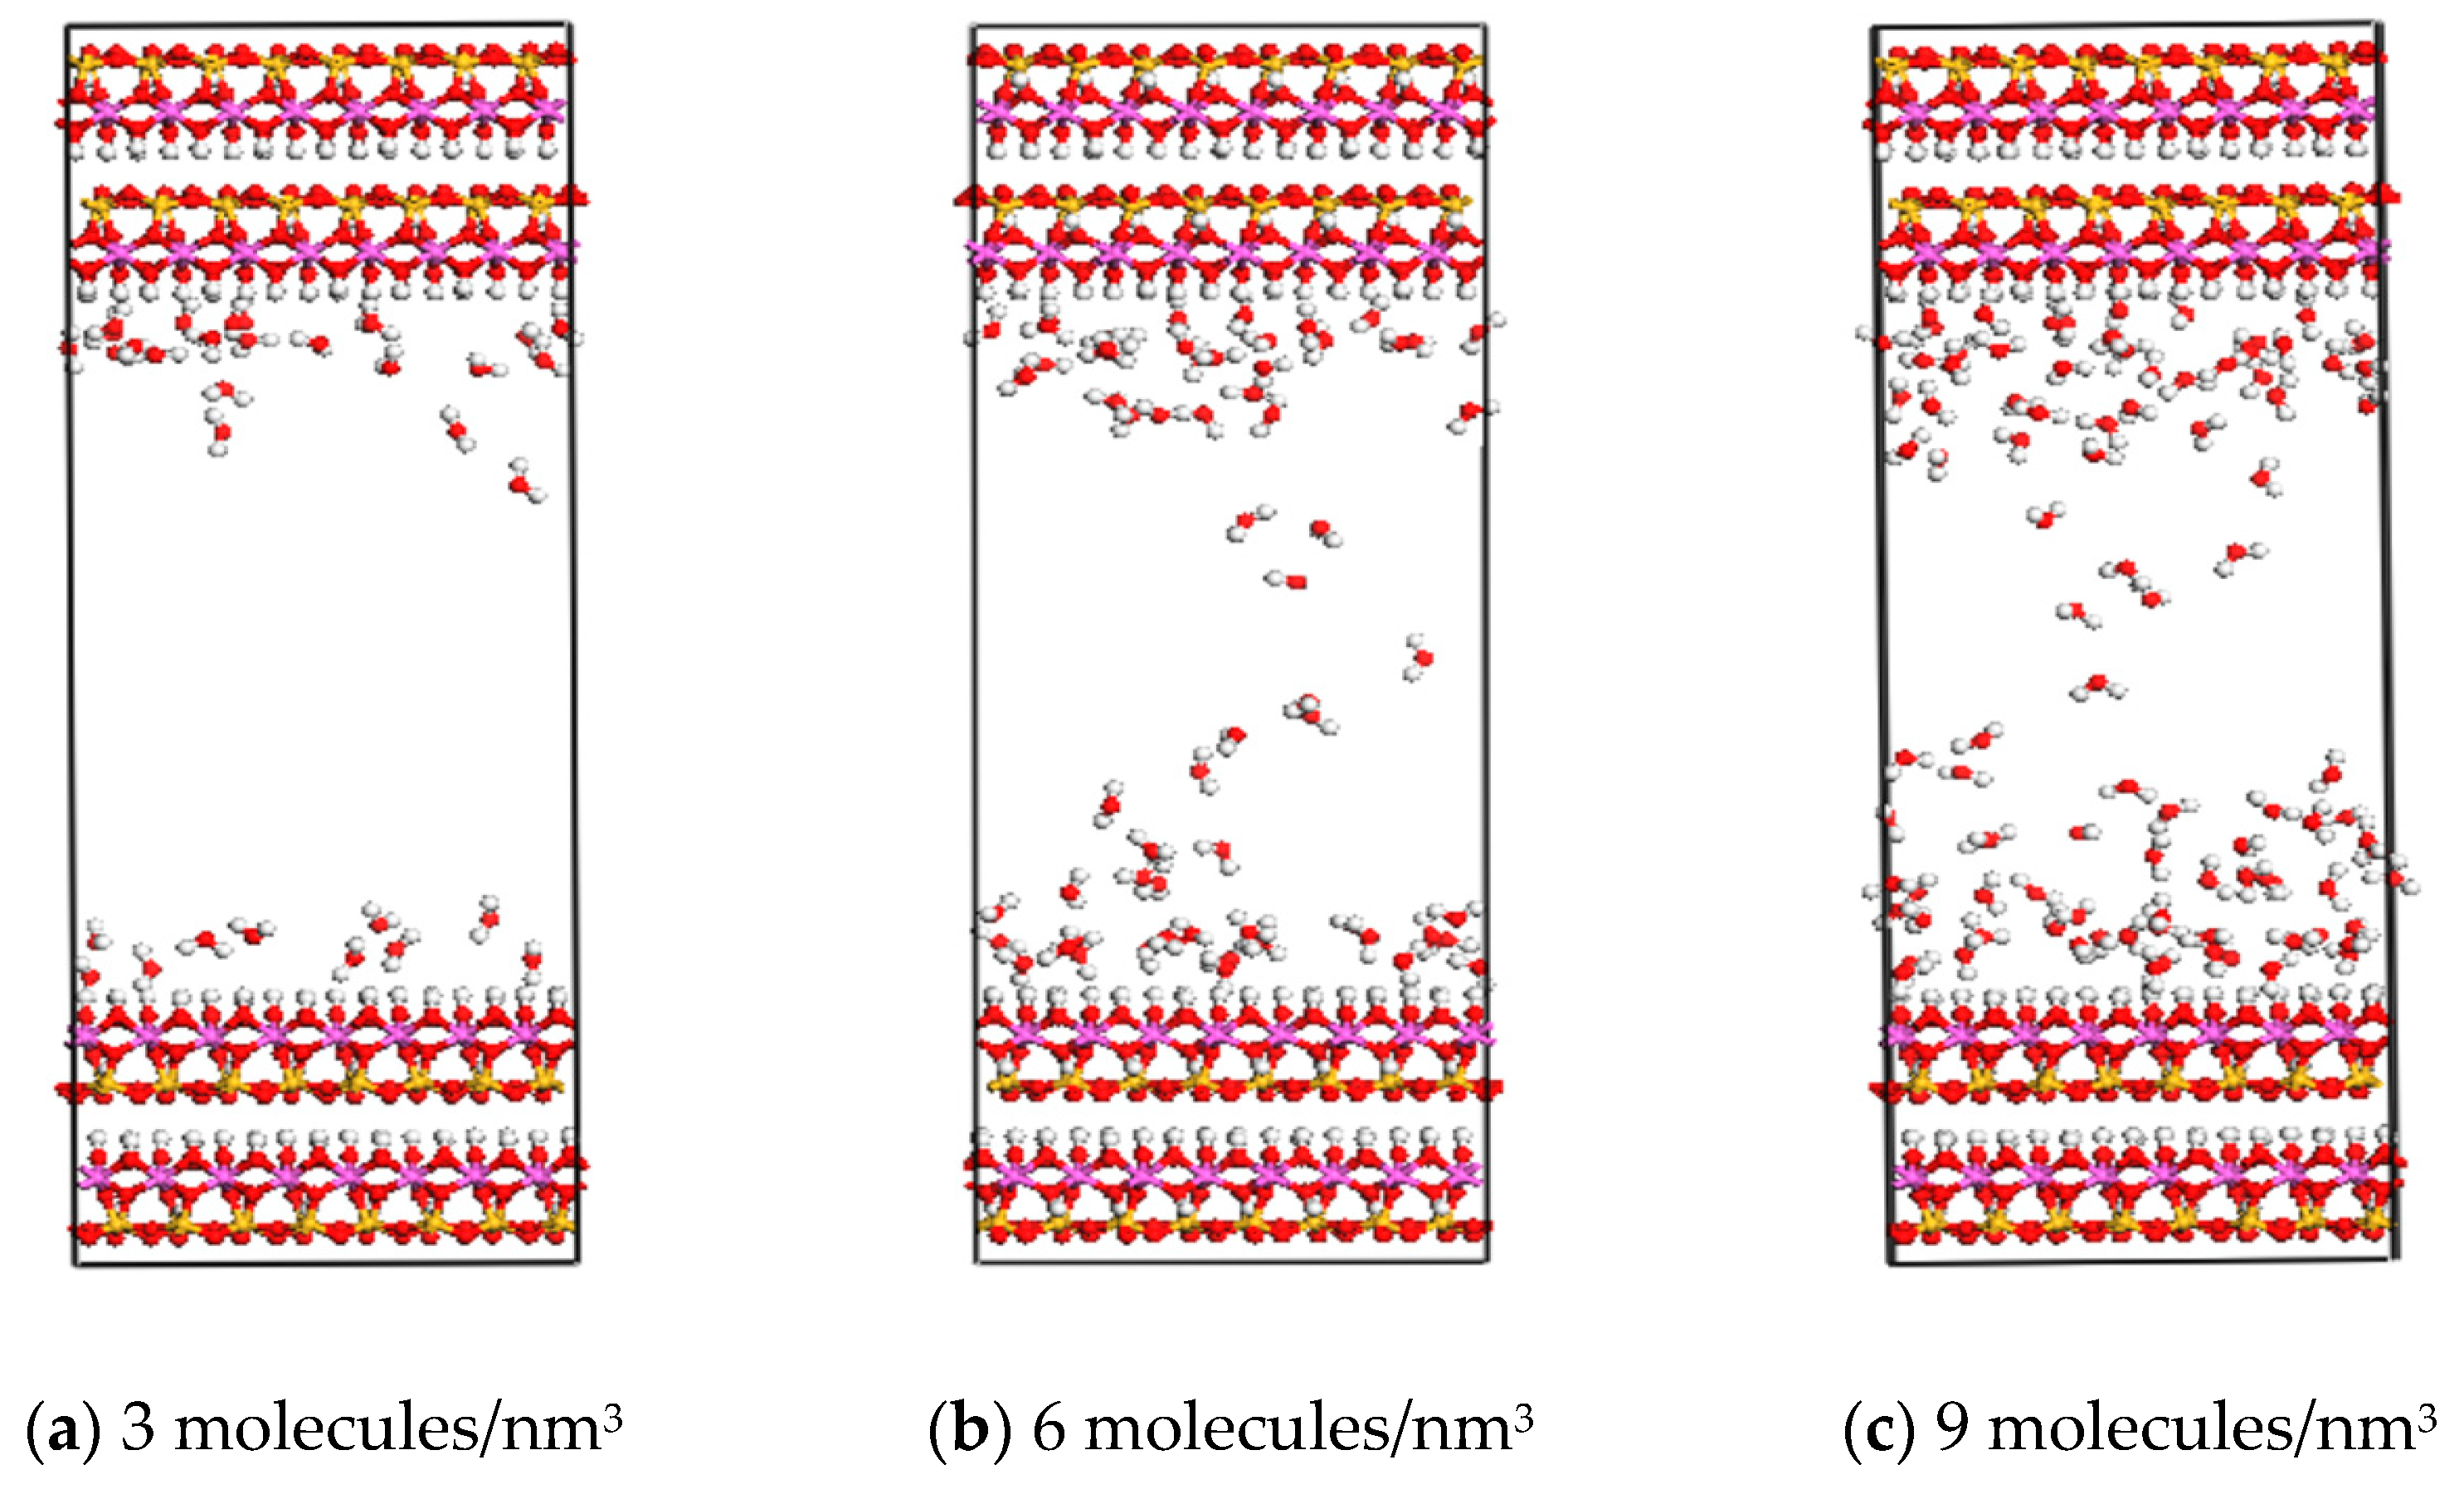
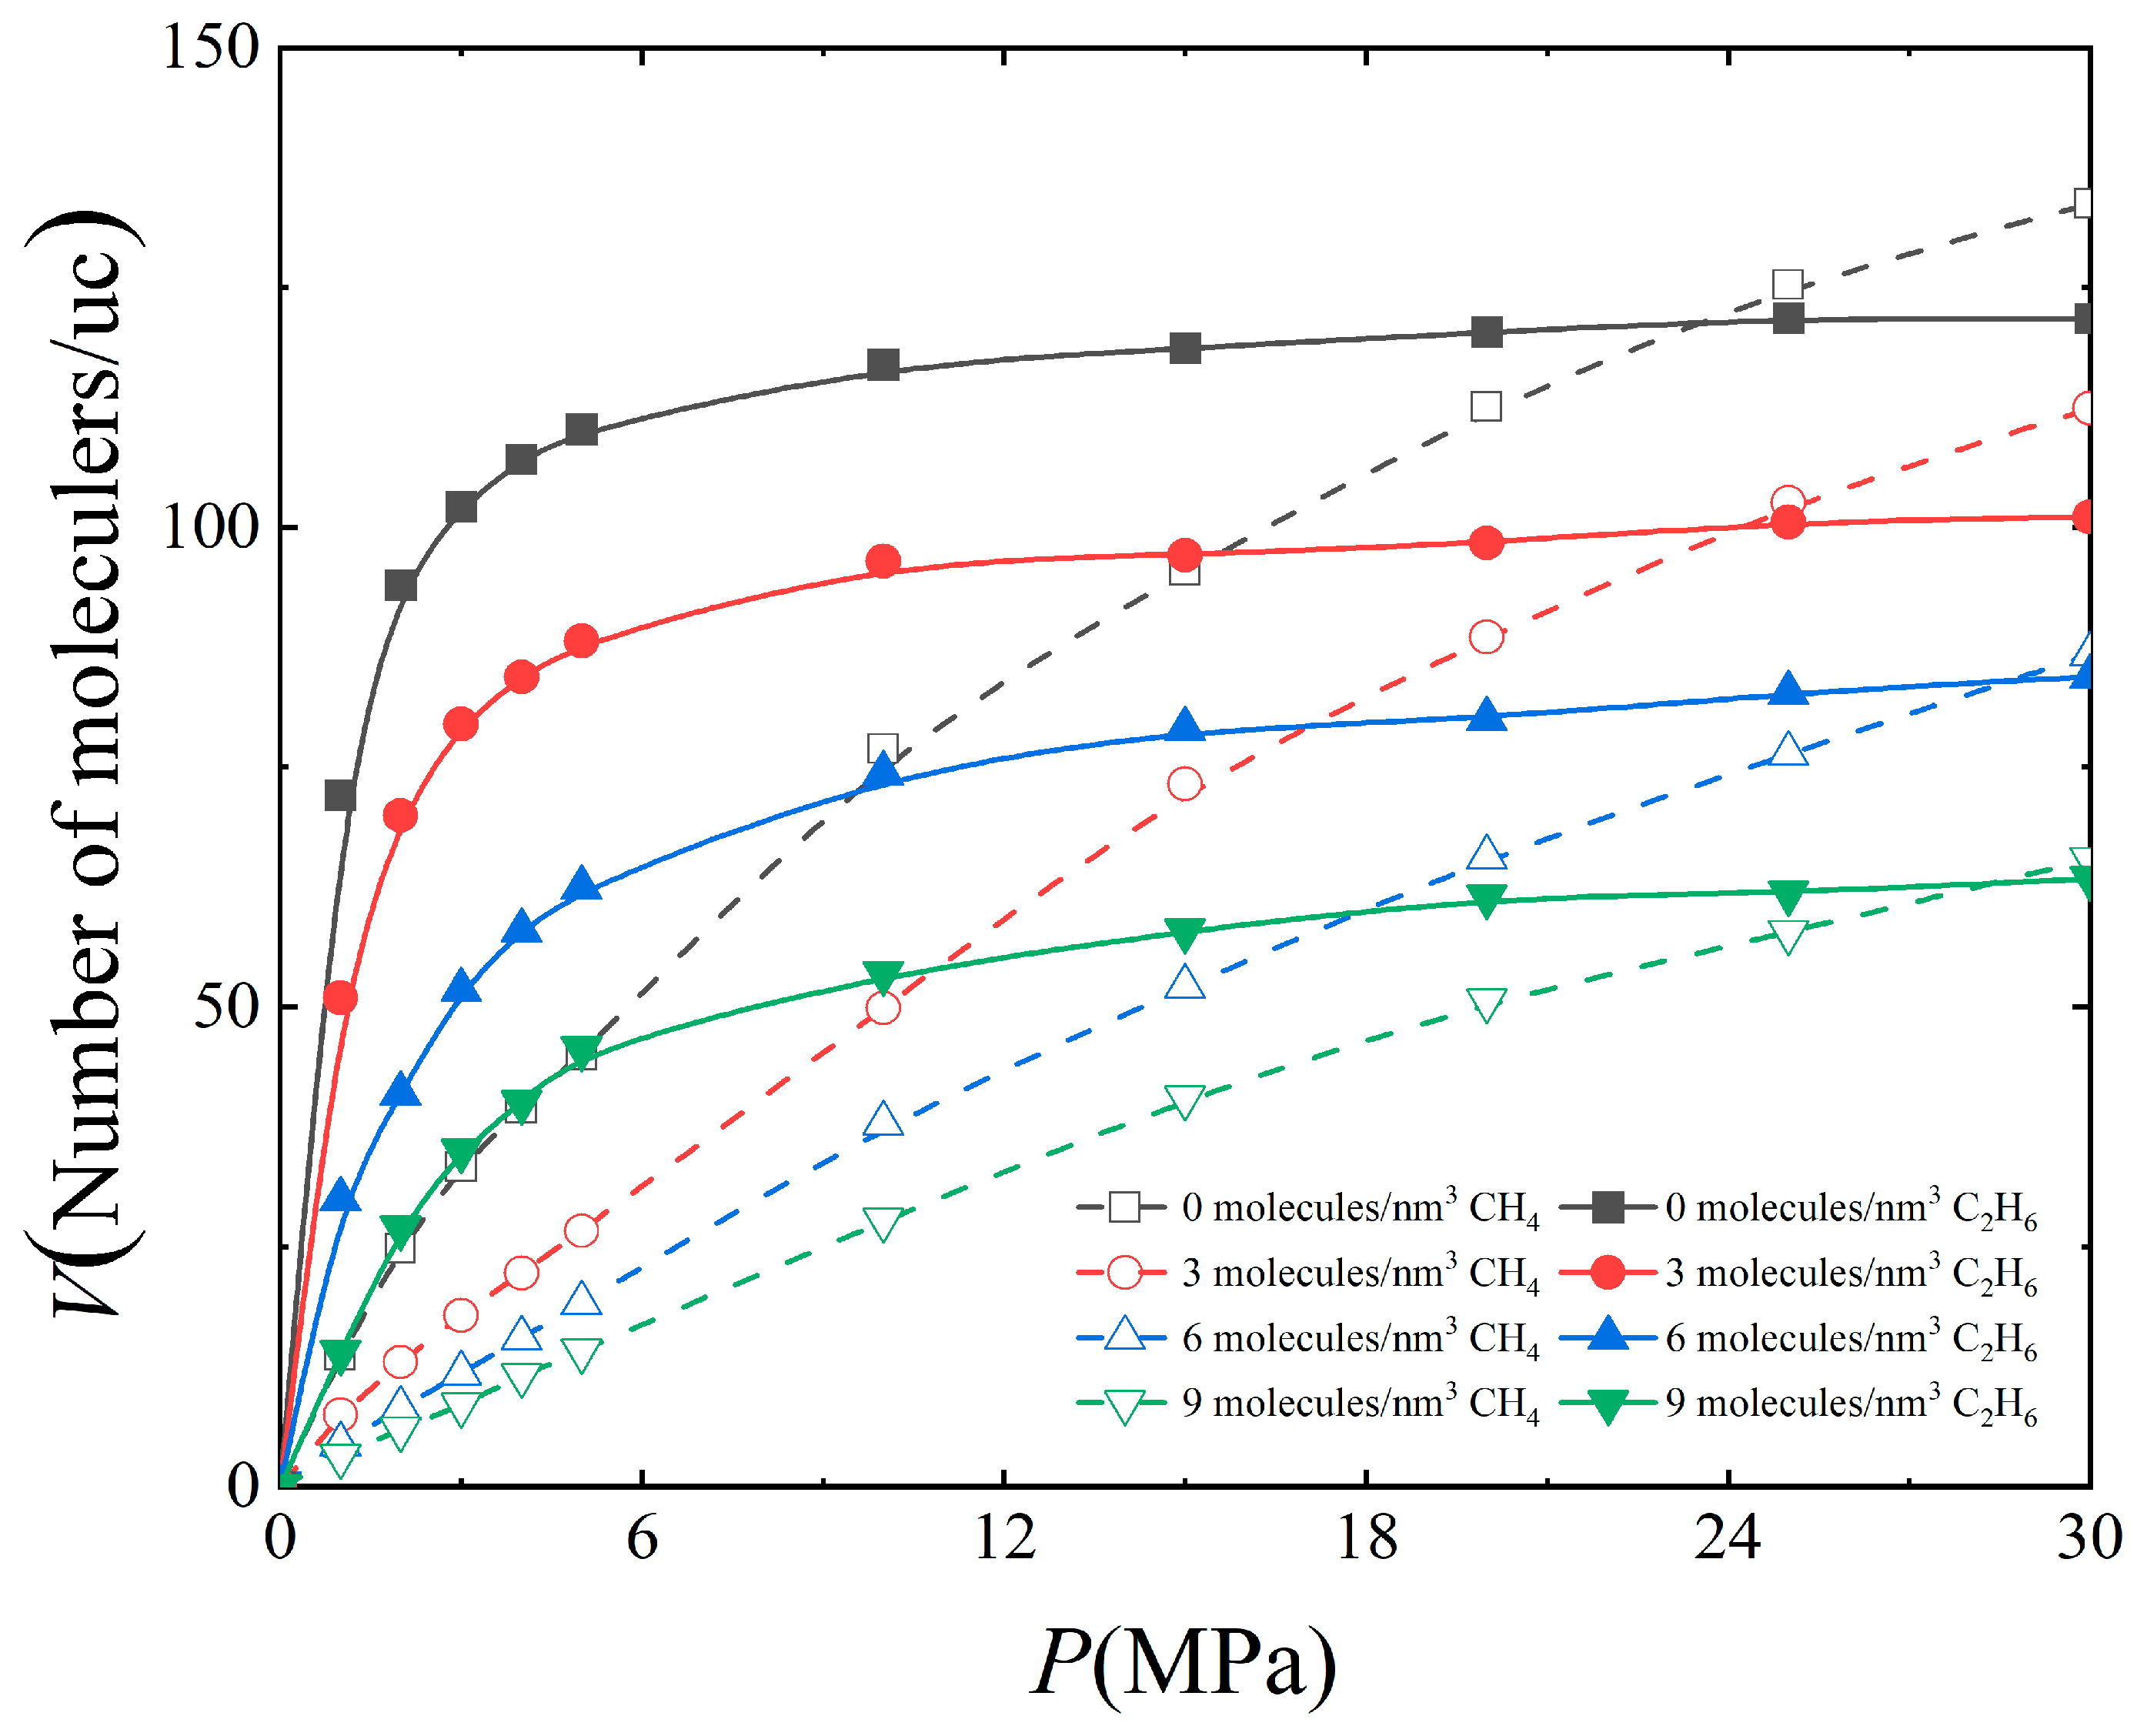
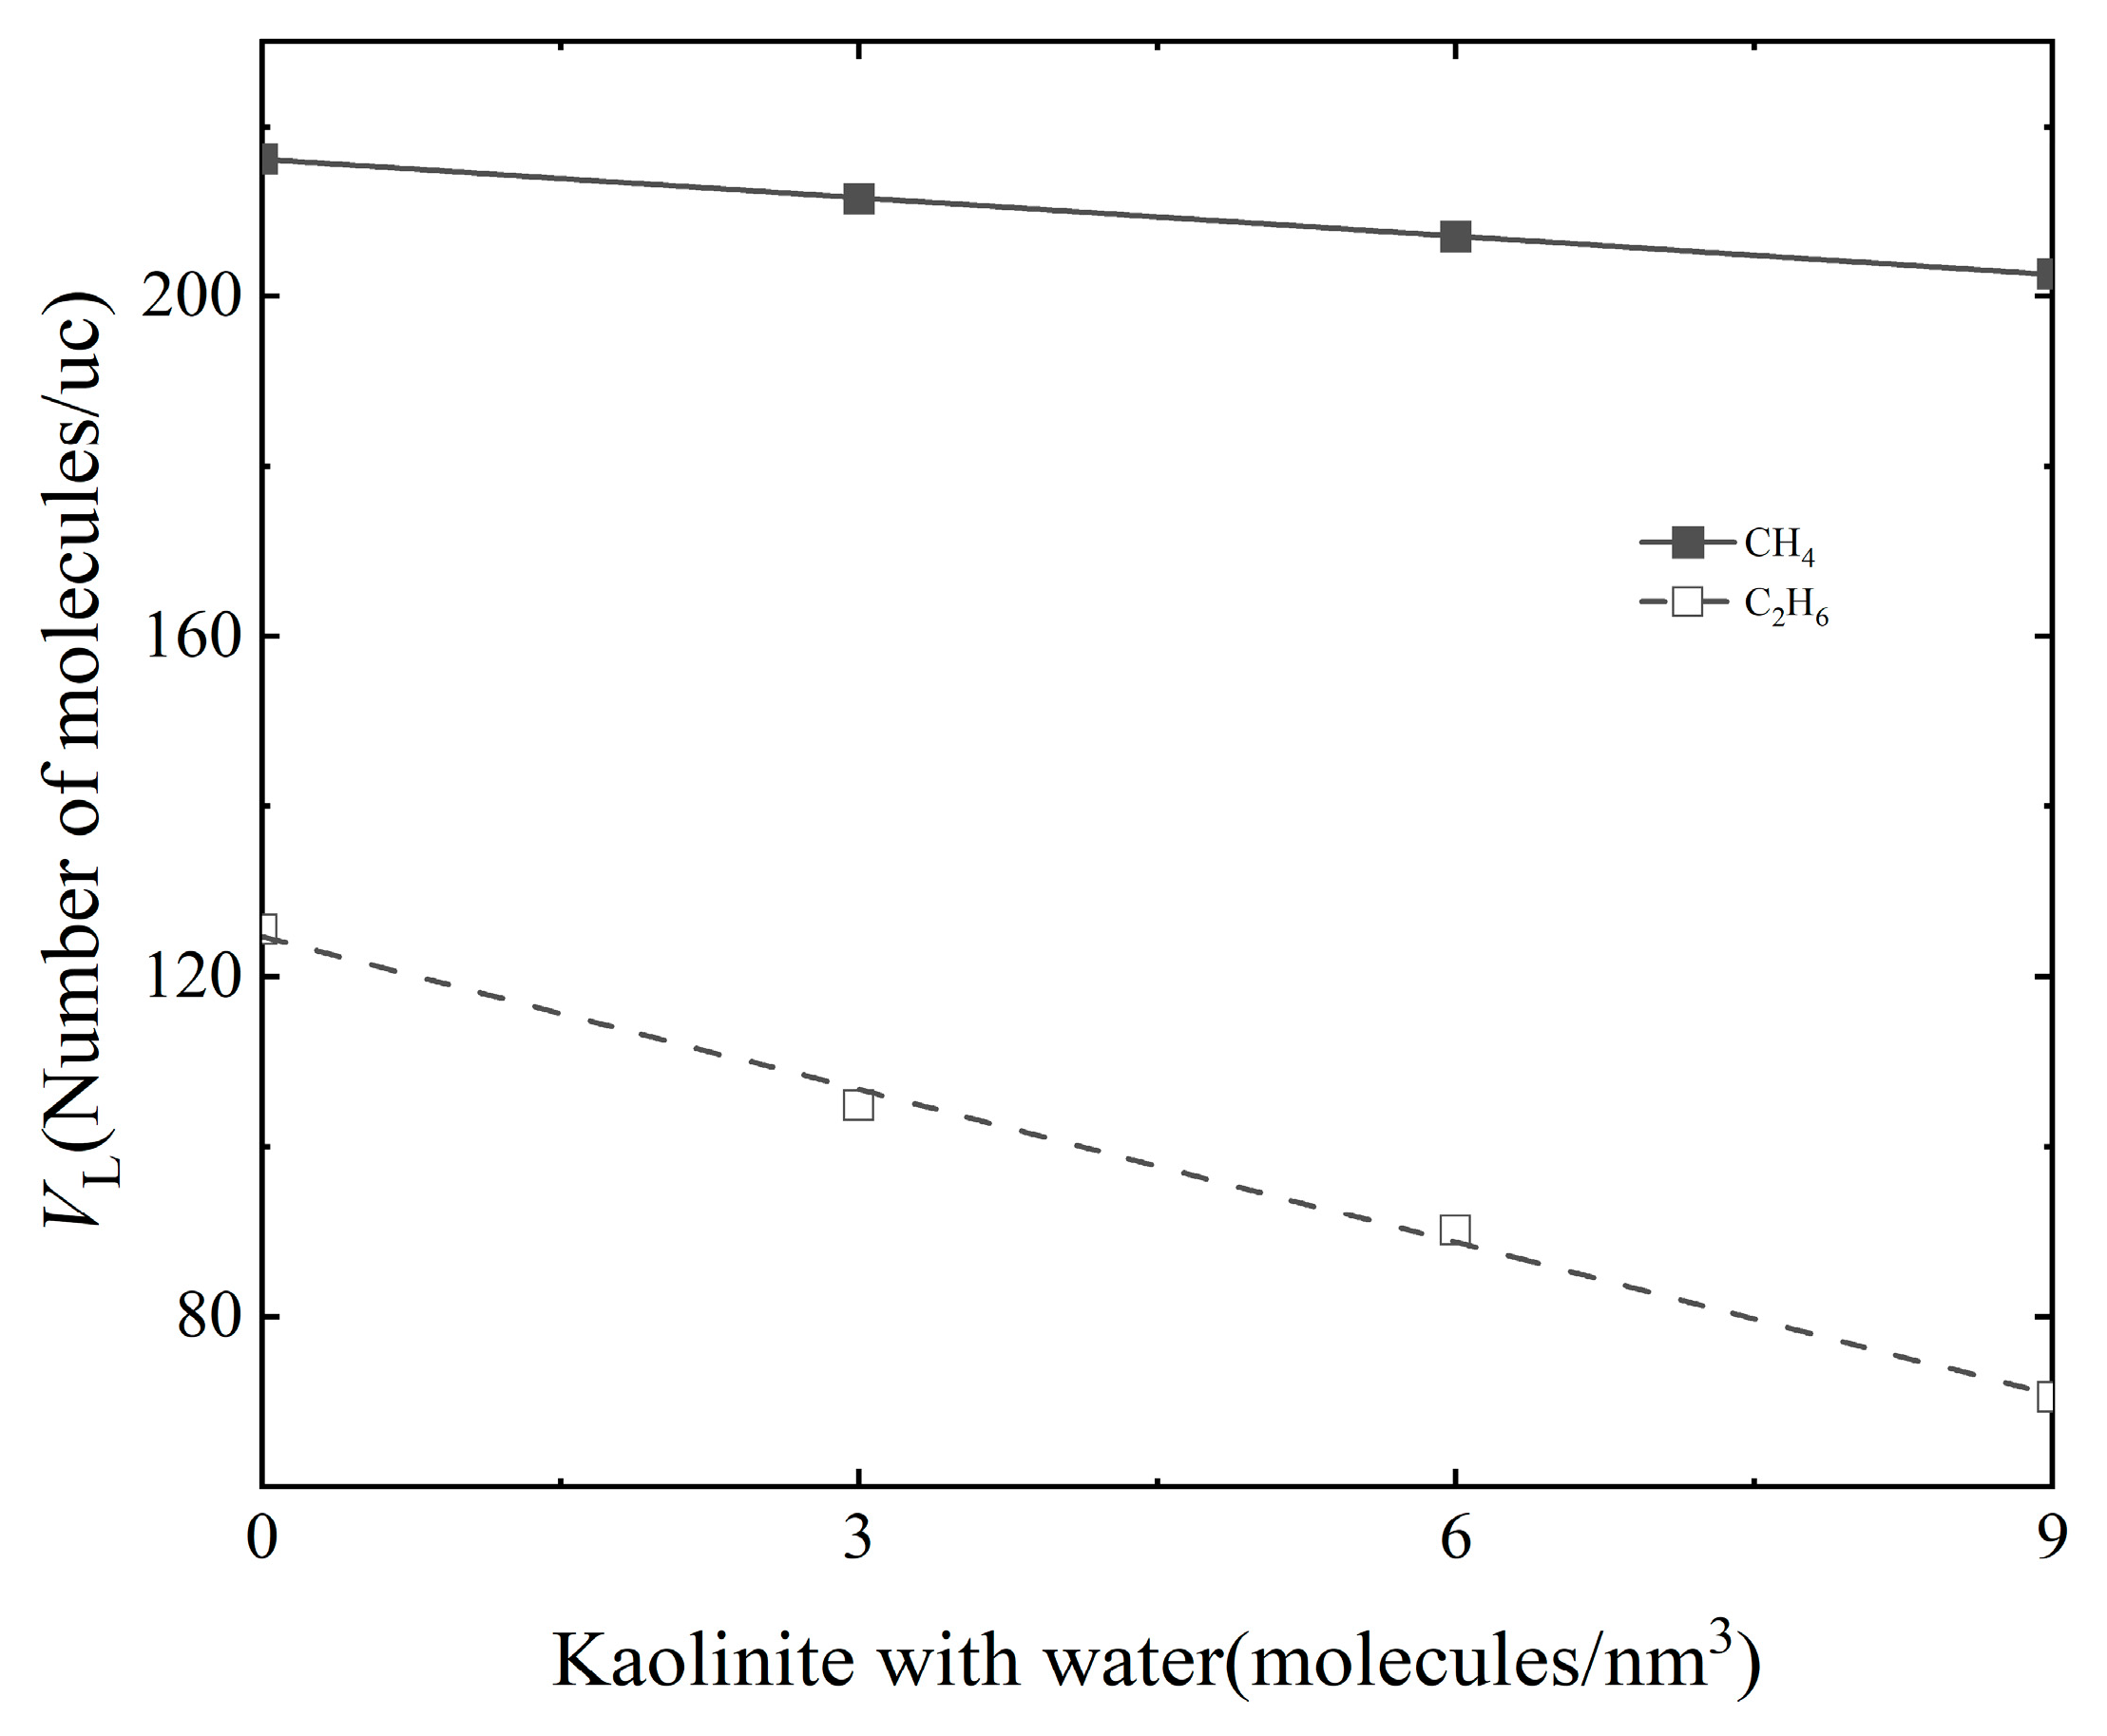
3.1. Effect of Water Content

In order to study the microscopic mechanism of the adsorption of CH4 and C2H6 by kaolinite with different degrees of water, the optimized kaolinite slit model was first treated with water. Water molecules of 3 molecules/nm3, 6 molecules/nm3 and 9 molecules/nm3 are, respectively, loaded into the kaolinite slit model to form the kaolinite slit model with different water contents. Then, the lowest energy configuration was selected from the resulting low energy frames (Figure 1).
It was found that H2O preferentially adsorbs and accumulates on the slit wall and kaolinite shows strong hydrophilicity. Due to the fact that water molecules are polar molecules, there are strong electrostatic forces and van der Waals forces between water molecules and the slit wall, and there are hydrogen bonds between water molecules [15,16,17]. With the increase in the number of water molecules, H2O will gradually appear in the middle of the slit and increase with the further increase in the number of H2O molecules.
Figure 2 shows the change in adsorption capacity of CH4 and C2H6 on 3 nm kaolinite slit of 0, 3, 6, 9 molecules/nm3 with pressure when the temperature is 340 K. It was found that under all water contents, the adsorption capacities of CH4 and C2H6 initially increased rapidly and then tended to be stable with the increase in pressure. This trend is similar to the adsorption isotherms of the two gases in the pores of other clays [32,33,34,35]. According to the classification of isothermal adsorption lines by the International Union of Pure and Applied Chemistry (IUPAC) [36], these features are consistent with the adsorption behavior described by Type I (Langmuir). The Langmuir equation is expressed as follows:
V = V L P P L + P
where V is the absolute adsorption capacity, molecules/unit cell; V L is the saturated adsorption capacity of two gas molecules by the kaolinite slit, molecules/unit cell; P L is the Langmuir pressure (the corresponding pressure at which the adsorption capacity is half of V L , which reflects the magnitude of the adsorption rate) [37], MPa. P is the pressure, MPa.
Langmuir constants of CH4 and C2H6 at different water contents are shown in Table 2. It can be seen that the correlation coefficients of Langmuir equations of the two gases are both greater than 0.96 and range from 0.985 to 0.998, indicating that the fitting results are satisfactory [38]. Therefore, it is reasonable to use Langmuir equation curves to characterize the adsorption properties of CH4 and C2H6.
As can be seen from Figure 2, with a certain water content, the increase rate of the two gases gradually slows down with the increase in pressure. Therefore, increasing pressure is conducive to the adsorption of CH4 and C2H6 in kaolinite, and compared with low pressure, pressure has less influence on the adsorption of CH4 and C2H6 at high pressure.
By comparing the adsorption isotherms of CH4 and C2H6 under the same conditions, it is found that under all water contents, the adsorption capacity of C2H6 is higher at low pressure, which indicates that the interaction force between C2H6 and the surface of kaolinite slit is stronger, and it is easier for C2H6 to be adsorbed in pores and reach saturation quickly. Therefore, the number of molecules of C2H6 adsorbed is more than that of CH4 at low pressure. Under the same water conditions, with the increase in pressure, the increase rate of adsorption capacity of C2H6 decreases rapidly, while that of CH4 decreases slowly. Therefore, the adsorption capacity of C2H6 reaches the highest point before CH4, but the final adsorption capacity of CH4 is higher than that of C2H6, which indicates that under high pressure, CH4 is more inclined to be adsorbed in pores than C2H6. The analysis shows that the final adsorption capacity is determined by the size of molecules. The molecular radius of CH4 (0.375 nm) is slightly smaller than that of C2H6 (0.444 nm), and more pore space can be occupied by CH4 molecules in the kaolinite slits, thus the adsorption capacity of CH4 is higher under high pressure [39].
By comparing the adsorption of CH4 and C2H6 by kaolinite slits with different water content (Figure 2), it is found that, due to the presence of water molecules, the adsorption amounts of CH4 and C2H6 are greatly reduced, and the more water molecules there are, the less gas molecules are adsorbed in the kaolinite. The analysis shows that the presence of water molecules is not conducive to the adsorption of CH4 and C2H6. Due to the strong hydrophilicity of the mineral surface, water molecules are preferentially adsorbed on the pore surface of kaolinite to form water molecular layers [40]. With the increase in water content, two or three layers of water molecular layers can be formed, and these water molecular layers occupy the low-energy adsorption sites on the surface of kaolinite. The adsorption sites provided by kaolinite for CH4 and C2H6 are reduced.
As can be seen from Figure 3, the Langmuir volume of both gases decreases linearly with the increase in water content. The relationship between Langmuir volume and water content of CH4 and C2H6 is VL = −1.496wt% + 216.110 and VL = −5.990wt% + 124.680, respectively. The slope of CH4 is −1.4976, which is lower than that of C2H6, which is −5.99, indicating that the addition of water molecules inhibits the adsorption of the two gases in the kaolinite slit, and the adsorption of C2H6 was increasingly inhibited more obviously. It can be seen from Figure 4 that the Langmuir pressure of CH4 and C2H6 increases linearly with the increase in water content. The relationship between Langmuir pressure and water content of CH4 and C2H6 is PL = 0.227wt% + 20.829 and PL = 0.029wt% + 1.890, respectively. This indicates that the pressure required for CH4 and C2H6 to reach the maximum adsorption capacity increases with the increase in water content in the slit, so it is difficult to reach adsorption saturation. Comparing the two curves, it is found that under all water contents, the Langmuir pressure of CH4 is higher than that of C2H6. Therefore, it can be seen that C2H6 more easily reaches adsorption saturation under a certain water content, which is consistent with the above analysis of adsorption isotherm.
The Isosteric heat of adsorption refers to the heat released after the adsorbent is adsorbed during the adsorption process, which reflects the adsorption capacity of the mineral for CH4 and C2H6, and the larger the value, the stronger the adsorptive capacity, and vice–versa [15,29]. Isosteric heat of adsorption can be calculated by the following Clausius–Clapeyron equation [41]:
Q s t = R T d ln p d ln T
Figure 5 shows the change in isosteric adsorption heat of CH4 and C2H6 in 3 nm kaolinite slits with water contents of 0, 3, 6, 9 molecules/nm3 under pressure when the temperature is 340 K. It was found that the isosteric adsorption heat of CH4 and C2H6 under all water contents simulated is less than 42 kJ/mol. This indicates that the adsorption of the two gases by kaolinite with different water contents is physical adsorption, and we found that the isosteric adsorption heat of the two gases shows an overall increasing trend with increasing pressure at all water contents, suggesting that the interaction of the gases with the wall of the slit is stronger at high pressures [42]. Among them, the isosteric adsorption heat of CH4 on the surface of kaolinite ranges from 9.559–18.894 kJ/mol, which is similar to the isosteric adsorption heat of mud shale from 11.67 to 16.62 kJ/mol obtained by Yang et al. [43].
Compared with the isosteric adsorption heat of CH4 and C2H6 on the surface of kaolinite under the same conditions, it can be seen that the isosteric adsorption heat of C2H6 on the surface of kaolinite is far greater than that of CH4, so kaolinite has a strong adsorption capacity for C2H6 under the same conditions. This result is consistent with the above results on the difficulty of adsorption of the two gases at low pressure in the adsorption capacity analysis.
By comparing the isosteric adsorption heat of CH4 and C2H6 in kaolinite slits with different water contents, it is found that the addition of water molecules will reduce the isosteric adsorption heat of the two gases, and the isosteric adsorption heat of the two gases will further decrease with the increase in water molecules, that is because water molecules will form a water molecular layer on the mineral surface (Figure 6). The proximity of these water molecular layers to the mineral surface reduces the contact between gas molecules and the mineral surface, thus reducing the isosteric adsorption heat of CH4 and C2H6 in the kaolinite slit.
Figure 6 shows the distribution of CH4 and C2H6 along the direction (001) in a 3 nm kaolinite slit with a water content of 0, 3, 6, 9 molecules/nm3 under a pressure of 30 MPa. On the whole, the distribution of gas molecules and water molecules on both sides of the slit center is symmetrical, mainly because the structure of the kaolinite slit is similar in the upper and lower layers, and there are similar adsorption potential energies on both sides of the slit wall [44]. When there are no water molecules in the slit, CH4 and C2H6 form a main adsorption peak with high peak value near the surface of the slit due to strong interaction with the wall. At the distance of 20 Å from the slit wall, the interaction between gas molecules and the wall is weakened and a secondary adsorption peak with lower peak value is formed. As the distance from the wall increases, within the truncation radius, C2H6 still forms clear upper and lower symmetric adsorption peaks due to the strong interaction with the wall, whereas the interaction of CH4 with the wall is greatly reduced and its distribution becomes uniform.
The addition of water molecules will destroy the distribution of CH4 and C2H6 in the slits; one of the reasons is that the mineral surface has strong hydrophilicity, and water molecules are preferentially adsorbed on the kaolinite wall to form water molecular layers. These water molecular layers will weaken the interaction between gas and kaolinite wall, resulting in the reduction or even disappearance of the adsorption peaks of CH4 and C2H6. In addition, because the water molecular layer also occupies the adsorption position near the wall of CH4 and C2H6, they are more present in the center of the slit.

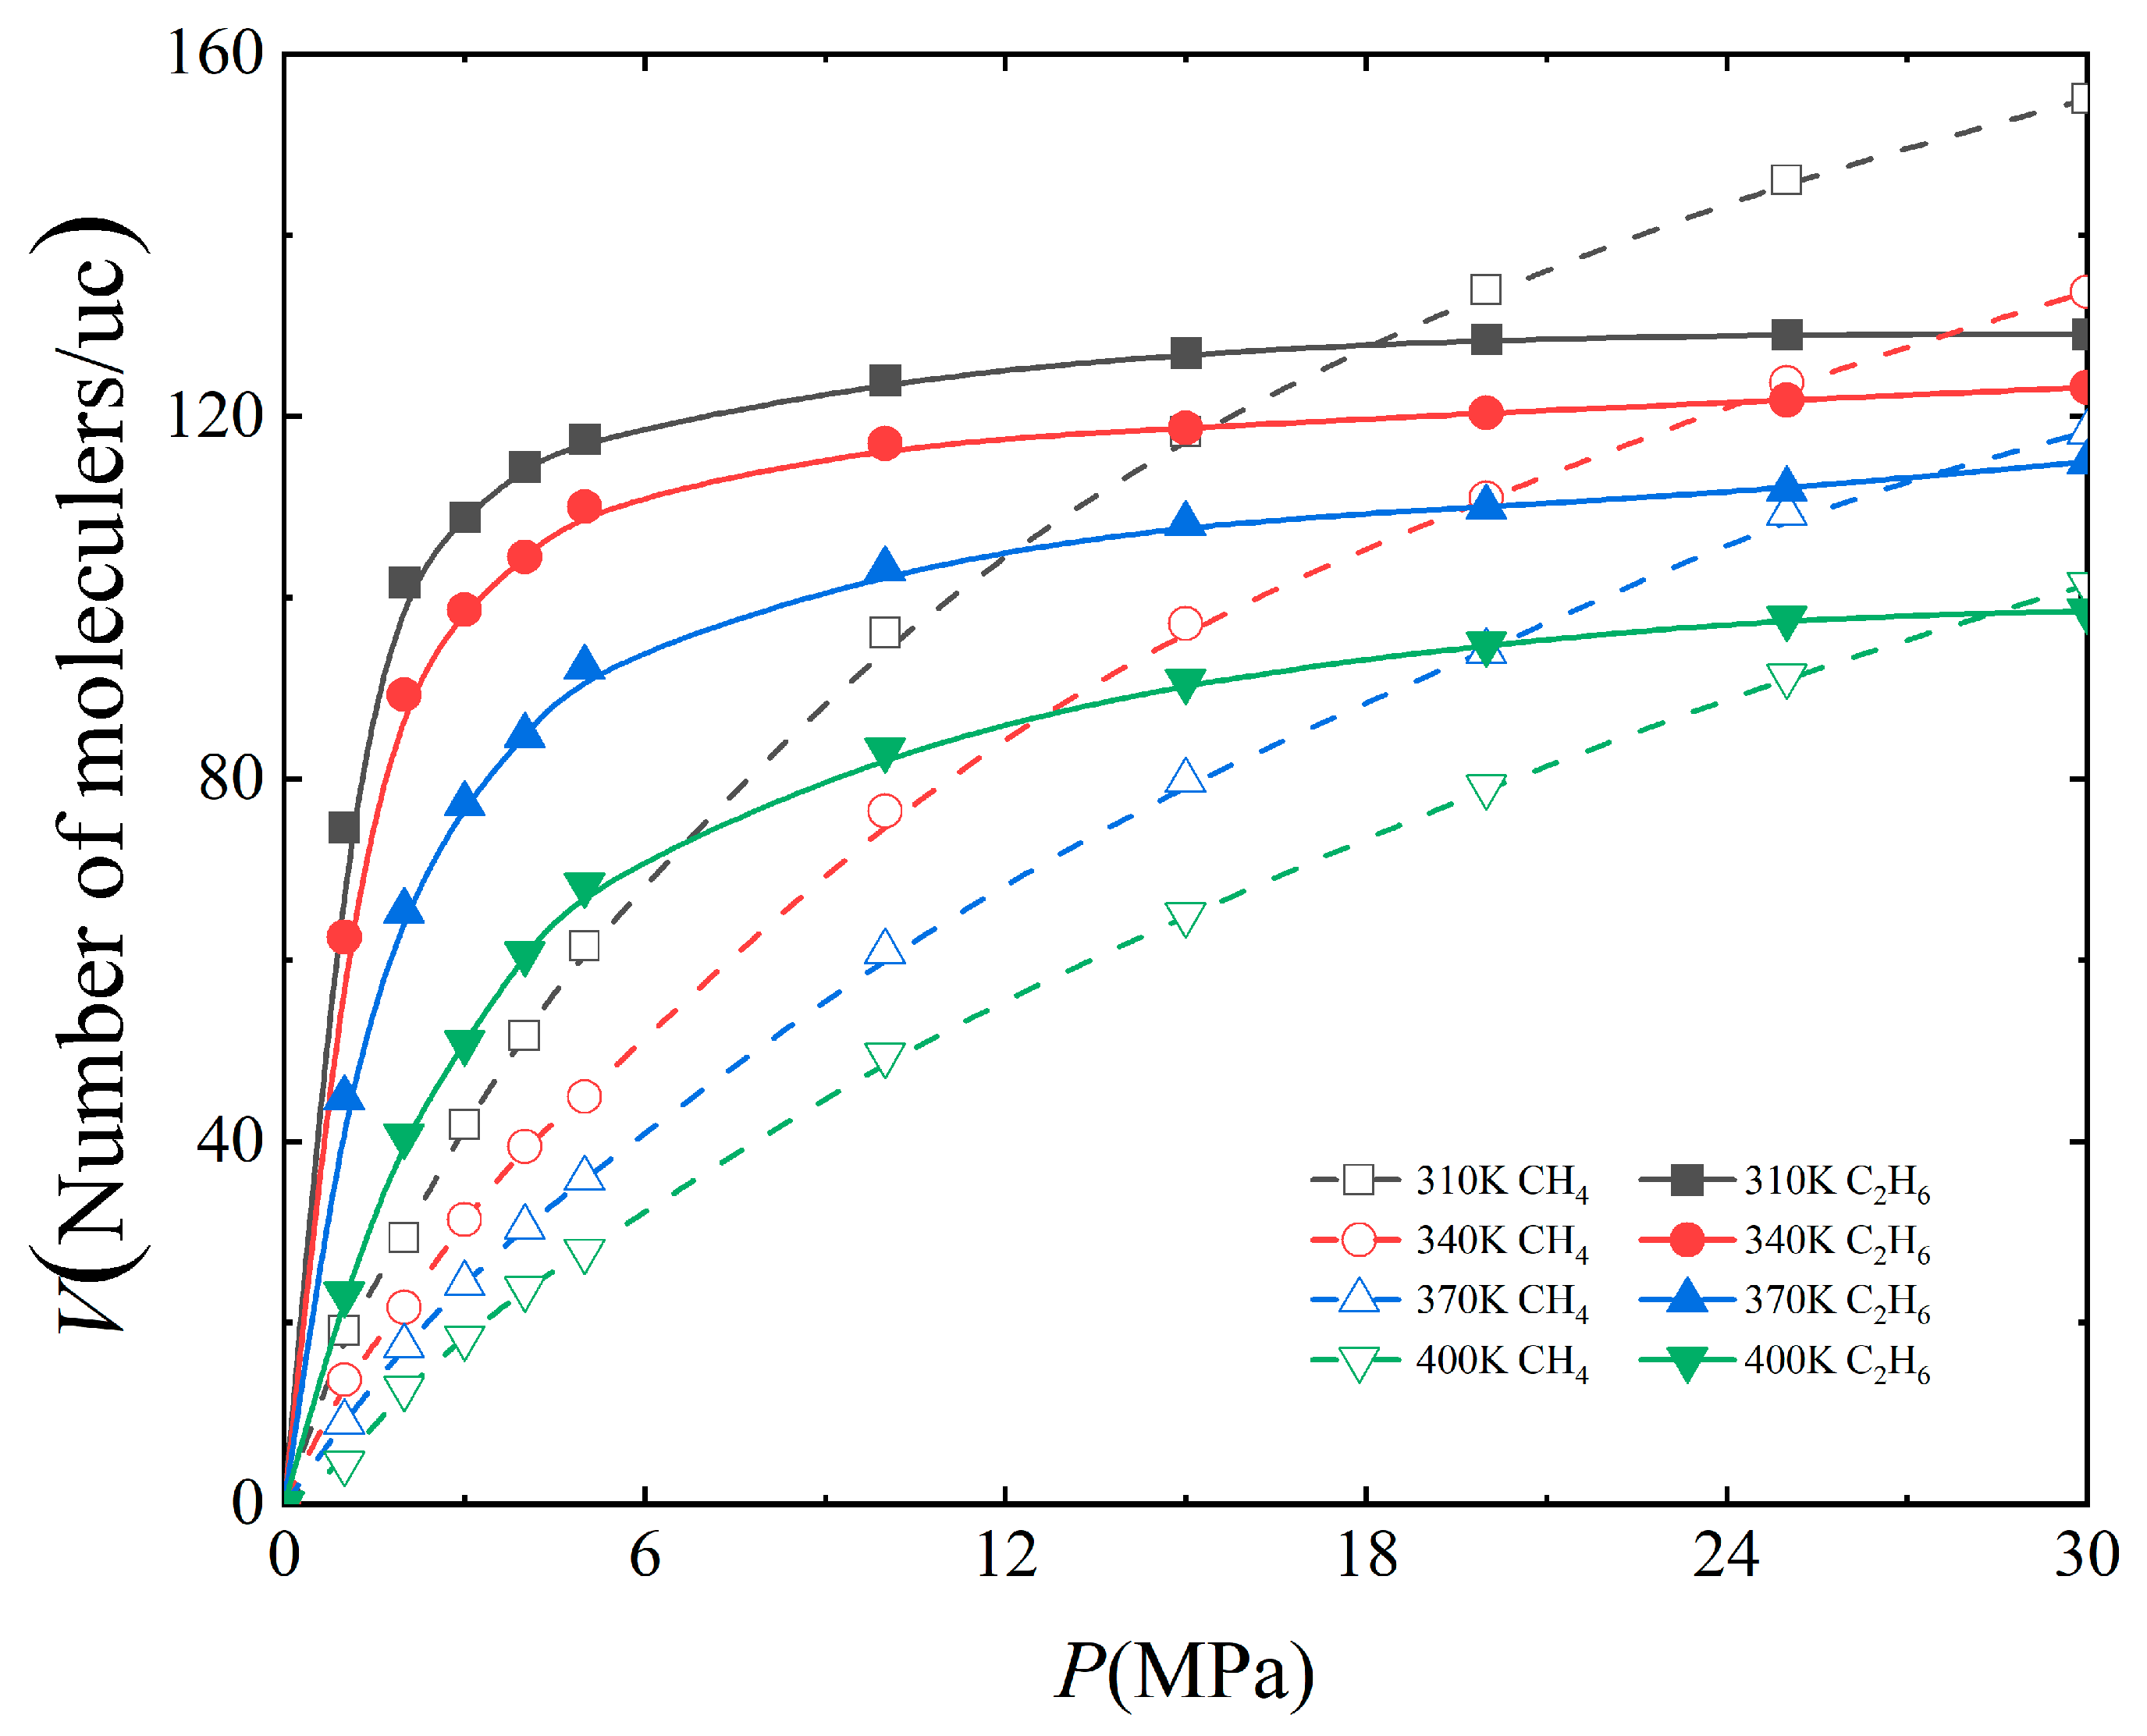
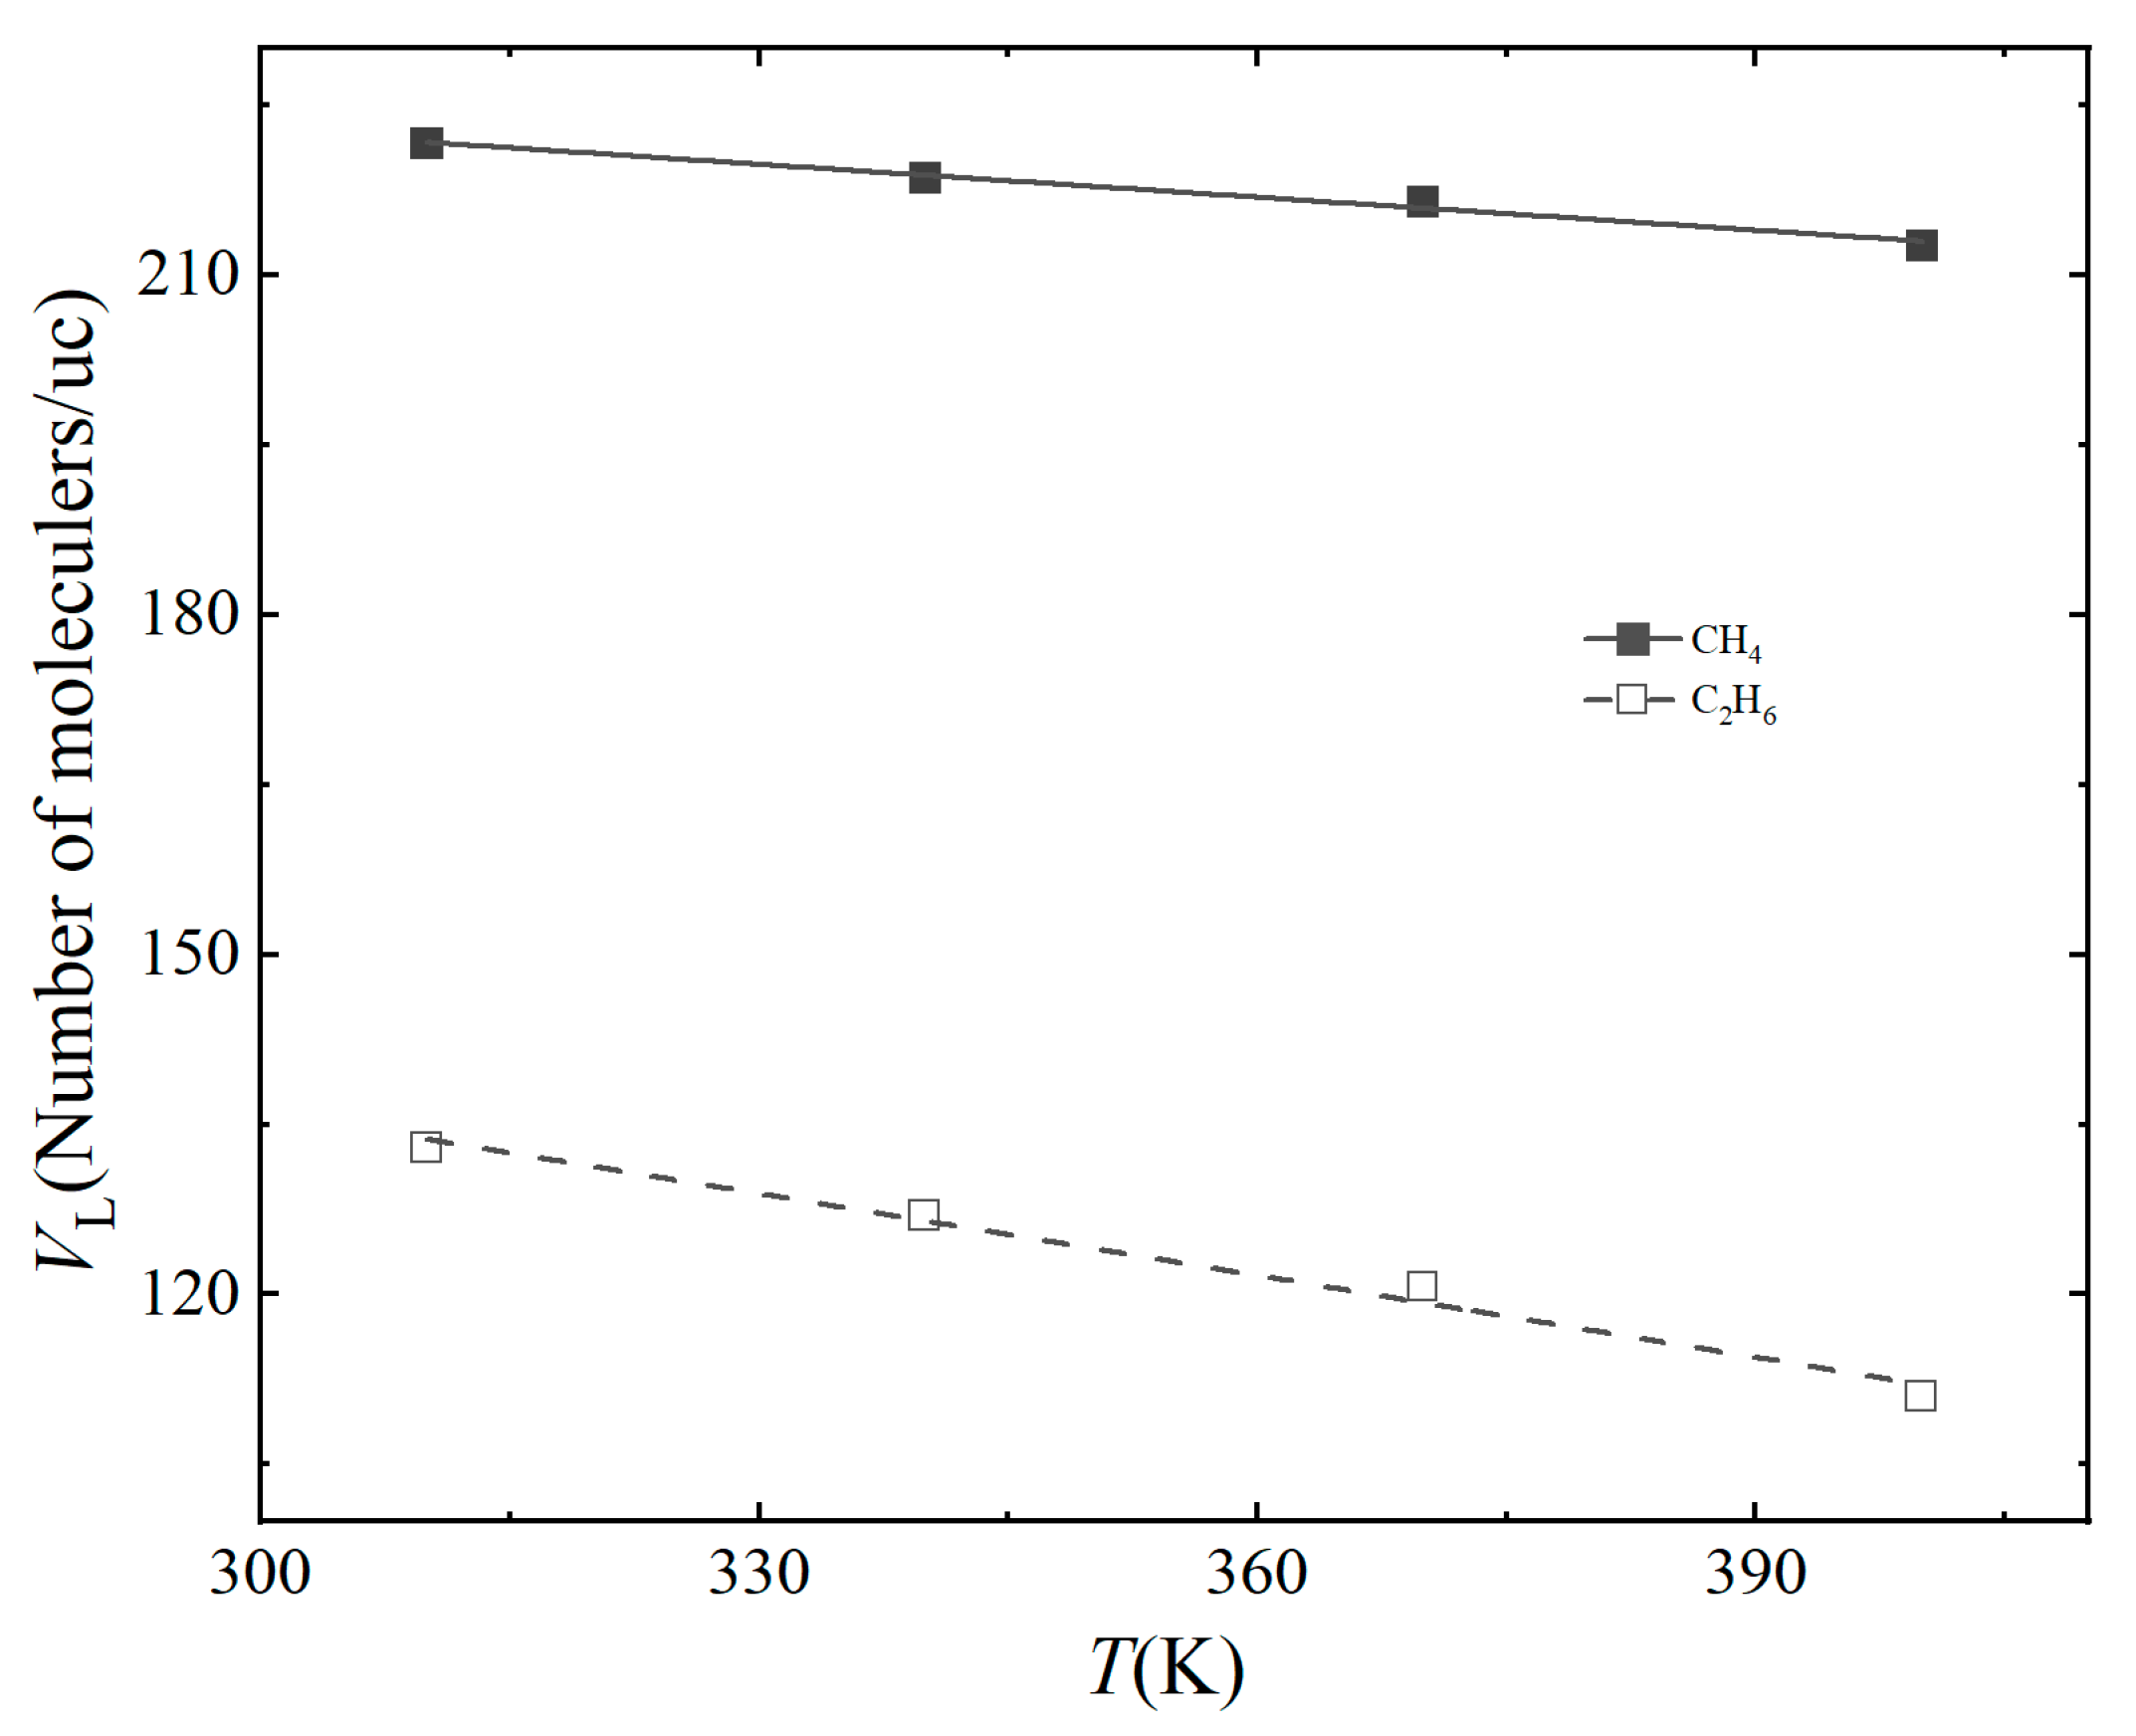
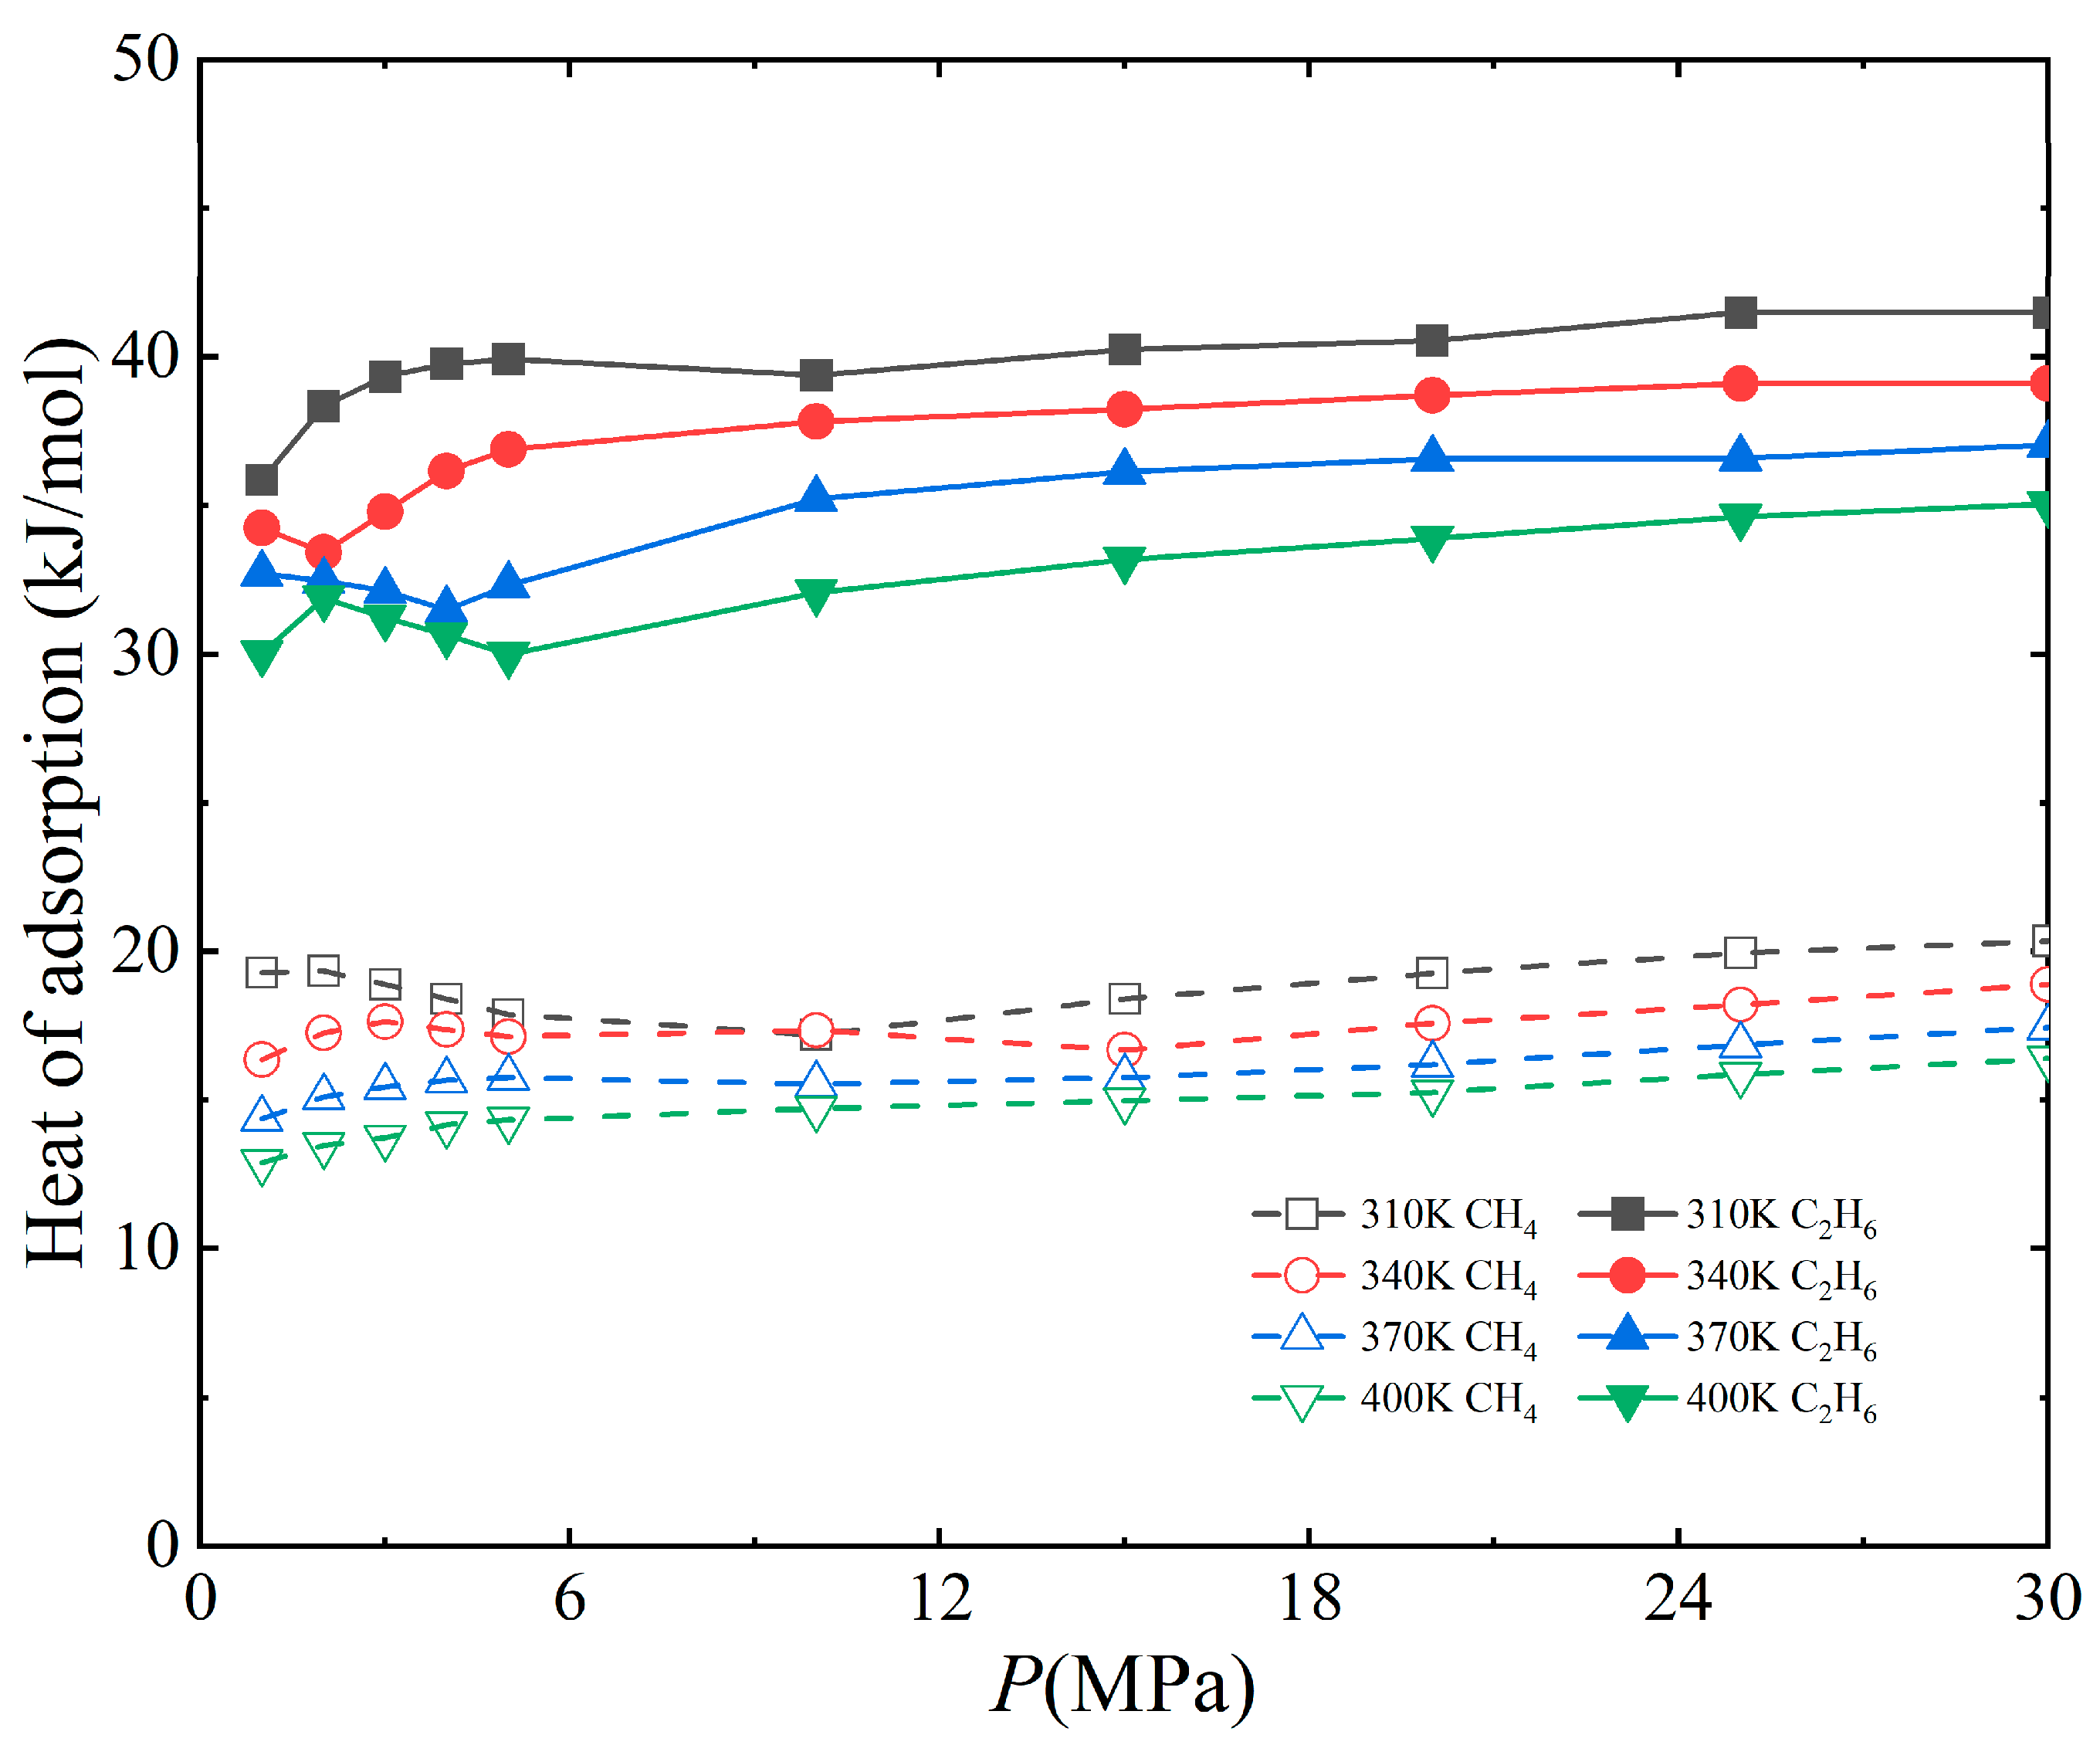
3.2. Effect of Temperature

In order to explore the influence of temperature on the adsorption capacity of CH4 and C2H6, the adsorption isotherms of CH4 and C2H6 on the 3 nm kaolinite slit surface without water at 310 K, 340 K, 370 K and 400 K were calculated, respectively (Figure 7). The characteristics of the adsorption capacity of the two gases on the surface of kaolinite with pressure is also in accord with the Langmuir. The Langmuir constants of CH4 and C2H6 at different temperatures are shown in Table 3. The correlation coefficients of the two gases are both greater than 0.96, and the fitting results are reliable. As can be seen from Figure 7, with the increase in temperature, the adsorption capacity of CH4 and C2H6 decreases, which is consistent with the conclusion obtained by Li et al. [45]. The main reason for this phenomenon is that the adsorption behavior of kaolinite to CH4 and C2H6 is an exothermic process, and the increase in temperature leads to the intense movement of CH4 and C2H6 molecules and an increase in kinetic energy [9,44]. This plays an active role in the desorption of gas molecules, thus reducing the adsorption amount of CH4 and C2H6. The pressures of the two gases with the same adsorption capacity at 310 K, 340 K, 370 K and 400 K are 17.98 MPa, 24.41 MPa, 28.47 MPa and 29.42 MPa, respectively, indicating that the desorption point moves to a higher value with the increase in temperature. This phenomenon has also been reported in montmorillonite, illite and kerogen [34,35,46].
Figure 8 and Figure 9 show the variation rules of Langmuir volume and Langmuir pressure of the two gases with temperature, respectively. The Langmuir volume of the two gases decreases linearly with the increase in temperature. The relationship between Langmuir volume and temperature of CH4 and C2H6 is VL = −0.097T + 251.760 and VL = −0.24T + 208.182, respectively. The slope of curves of CH4 is −0.097 and that of curves of C2H6 is −0.24, which is similar to the above effect of water content on adsorption. The increase in temperature is also unfavorable for the adsorption of the two gases in the kaolinite slit, and the inhibition of the adsorption of C2H6 is more obvious. The Langmuir pressure of CH4 and C2H6 increases linearly with the increase in temperature. The relationship between Langmuir pressure and temperature of CH4 and C2H6 is PL = 0.233T − 60.190 and PL = 0.029T − 8.891, respectively. This indicates that the increase in temperature also leads to the increase in the pressure required for CH4 and C2H6 to reach the maximum adsorption capacity, making it more difficult to reach the state of adsorption saturation. This is because as the temperature increases, the mean free path of gas molecules increases, and the probability of collision with the slit wall decreases during the movement, which is not conducive to the adsorption [47]. By comparing the two curves, it is found that the Langmuir pressure of CH4 is higher than that of C2H6 at all temperatures. It can be seen that C2H6 is more likely to reach adsorption saturation at a certain temperature.
Figure 10 shows the isosteric adsorption heat of CH4 and C2H6 on the surface of 3 nm kaolinite at different temperatures. It is found that at all temperatures, the isosteric adsorption heat of the two gases ranges from 14.375 to 41.5 kJ/mol, which is less than 42 kJ/mol, indicating that the adsorption of the two gases by the 3 nm kaolinite slit at higher temperatures is also physical adsorption. By comparing the isosteric adsorption heat of CH4 and C2H6 on the kaolinite surface at the same temperature, it is found that the isosteric adsorption heat of C2H6 on the kaolinite surface is much greater than that of CH4, indicating that kaolinite still has a high adsorption capacity for C2H6 when the temperature rises. As the temperature increases from 310 K to 400 K, the isosteric adsorption heat of the two gases gradually decreases, and the adsorption capacity of the kaolinite slit for CH4 and C2H6 decreases. This is because the increase in temperature causes the intense movement of gas molecules and an increase in kinetic energy, which is not conducive to adsorption by the kaolinite slit.
In order to specifically describe the distribution states of CH4 and C2H6 in the kaolinite slit at different temperatures, we calculated the distribution maps of CH4 and C2H6 in the 3 nm kaolinite slit along the direction (001) at 310 K, 340 K, 370 K and 400 K, respectively (Figure 11). It is found that CH4 and C2H6 also exhibit distribution characteristics similar to that shown in Figure 6a at all temperatures. In addition, the number of gas molecules on the slit surface and in the central region decreases with the increase in temperature, but the change in temperature does not cause the change in adsorption peak location. Moreover, the main adsorption peak of CH4 is about 16 Å from the wall, and the secondary adsorption peak is about 20 Å from the wall, the position of C2H6 main and secondary adsorption peaks is also the same, which indicates that the two gases can coexist near the surface of kaolinite. A similar phenomenon also appears in the adsorption process of CH4 and C2H6 by calcite [48]. The thickness of the first adsorption peak of CH4 and C2H6 is 0.375 nm and 0.39 nm, respectively, which are the kinetic diameters of the two gases. As the temperature increases from 310 K to 400 K, the adsorption peak formed by C2H6 in the center of the slit gradually disappears, this is because the gas molecules move rapidly and the kinetic energy increases, overcoming the interaction with the slit wall and forming a free state.

3.3. Particle Diffusion Coefficient

In order to further understand the diffusion behavior of CH4 and C2H6 in the kaolinite slit, we calculated the diffusion coefficients of the two gases in the slit at different temperatures and water contents at 30 MPa. Under this pressure, the adsorption capacities of CH4 and C2H6 tend to be saturated, and the diffusion coefficients of the two gases tend to be stable.
The diffusion coefficient of a particle is one of the important parameters in dynamics, which is used to characterize the diffusion ability of a particle. The larger the value is, the stronger the ability of a particle to move in a directional or non-directional way with time. The diffusion coefficient can be obtained by Einstein’s diffusion equation [49]:
D = lim t 1 6 t | r t r 0 | 2
In this equation, | r t r 0 | 2 is the mean azimuth shift of the particle, and the diffusion coefficient of the particle is 1/6 of the slope of the mean azimuth shift.
Table 4 shows the diffusion coefficient of CH4/C2H6 in the 3 nm kaolinite slit with water contents of 0, 3, 6, 9 molecules/nm3 at 340 K, respectively. It is found that at the same water content, the diffusion coefficient of C2H6 is lower than that of CH4, indicating that the interaction between C2H6 and the wall of the kaolinite slit is strong, so it is difficult to diffuse. A similar phenomenon can be seen in illite, calcite, and montmorillonite [44,50,51]. By comparing the diffusion coefficients of CH4 and C2H6 in 3 nm kaolinite slit with different water contents, it is found that the diffusion coefficients of CH4 and C2H6 decrease slightly with the increase in the water content of kaolinite. It can be observed from Figure 4 that, on the one hand, the water molecules will accumulate in the wall of the slit to occupy a certain adsorption space, so that the movement space of gas molecules is reduced, which is not conducive to the diffusion of CH4 and C2H6; on the other hand, the water molecules existing in the wall of the slit will weaken the interaction force between gas molecules and the wall of the slit, which is conducive to the diffusion of CH4 and C2H6 [33]. Under the influence of these two factors, the diffusion coefficient of the two gases is only slightly reduced.
Table 5 shows the diffusion coefficients of CH4 and C2H6 in 3 nm kaolinite slit at temperatures of 310 K, 340 K, 370 K and 400 K, respectively. Similar to the diffusion coefficients of CH4 and C2H6 at different water contents, the diffusion coefficients of CH4 at different temperatures are larger. Unlike the addition of water molecules, the increase in temperature leads to a significant increase in the diffusion coefficient of the two gases, and a similar phenomenon can be seen in illite and calcite [43,49]. As can be seen from Figure 7, with the increase in temperature, the adsorption capacity of both gases will decrease, and the movable space in the slit will become larger, which is conducive to the diffusion of gas molecules. Moreover, the temperature rise will lead to the intensification of the oscillation of gas molecules, and the diffusion coefficient of the two gases will increase significantly under the influence of these two factors.

4. Conclusions

In order to explore the microscopic mechanism of shale gas adsorption in the kaolinite slit, the adsorption and diffusion behaviors of CH4 and C2H6 in the established 3 nm kaolinite slit model were studied by using the methods of Grand Canonical Monte Carlo (GCMC) simulation and Molecular Dynamics (MD) simulation, taking into account the effects of temperature, pressure and water content. We analyzed and compared the adsorption capacity, isosteric adsorption heat, concentration distribution and diffusion coefficient that were obtained. The conclusions are as follows:
(1) Due to the strong interaction between C2H6 and the kaolinite wall, the adsorption amount of C2H6 is higher under low pressure; while the molecular radius of CH4 is smaller, so there is more adsorption space in kaolinite, and the adsorption amount of CH4 is higher under high pressure;
(2) We analyzed the variation law of Langmuir volume and Langmuir pressure of the two gases under different temperature and water contents. The addition of water molecules and the increase in temperature would reduce the saturation adsorption capacity (which had a greater impact on C2H6) and adsorption rate of the two gases in the kaolinite slit;
(3) Under the condition of no water, due to the strong interaction between C2H6 and the kaolinite wall, multiple adsorption peaks will still be formed in the middle of the slit, and water molecules will preferentially adsorb and gather on the kaolinite slit wall, occupying the adsorption space of gas molecules (which will limit gas diffusion), while reducing the interaction between gas molecules and the slit wall. Therefore, the addition of water molecules will destroy the distribution of gas molecules in the slit, and cause the isosteric adsorption heat of the two gases to decrease;
(4) As the temperature increases, the vibration of gas molecules will intensify, which will weaken the interaction between gas molecules and the wall surface, resulting in a decrease in the peak value of its adsorption peak and an increase in the diffusion coefficient.

Author Contributions

Conceptualization, D.-Y.L.; Data curation, D.-Y.L. and H.-K.H.; Formal analysis, D.-Y.L.; Funding acquisition, D.-M.L., Z.-X.Z. and H.-F.B.; Investigation, D.-Y.L. and D.-M.L.; Methodology, D.-Y.L.; Project administration, D.-Y.L., D.-M.L., Z.-X.Z. and H.-F.B.; Resources, D.-Y.L., D.-M.L., Z.-X.Z. and H.-F.B.; Software, D.-Y.L., D.-M.L., Z.-X.Z. and H.-F.B.; Supervision, D.-Y.L.; Validation, D.-Y.L.; Visualization, D.-Y.L.; Writing—original draft, D.-Y.L. and H.-K.H.; Writing—review and editing, D.-Y.L. and H.-F.B. All authors have read and agreed to the published version of the manuscript.

Funding

This research was funded by Science and Technology Project of Hebei Education Department, grant number QN2022058.

Data Availability Statement

Not applicable.

Conflicts of Interest

The authors declare no conflict of interest.

References

  1. Wang, Q.; Huang, L. Molecular insight into competitive adsorption of methane and carbon dioxide in montmorillonite: Effect of clay structure and water content. Fuel 2019, 239, 32–43. [Google Scholar] [CrossRef]
  2. Xiong, J.; Liu, K.; Liu, X.J.; Liang, L.X.; Zeng, Q. Molecular simulation of methane adsorption in slit-like quartz pores. RSC Adv. 2016, 6, 110808–110819. [Google Scholar] [CrossRef]
  3. Wang, T.Y.; Tian, S.C.; Li, G.S.; Zhang, L.Y.; Sheng, M.; Ren, W.X. Molecular simulation of gas adsorption in shale nanopores: A critical review. Renew. Sustain. Energy Rev. 2021, 149, 111391. [Google Scholar] [CrossRef]
  4. Jin, Z.H.; Firoozabadi, A. Phase behavior and flow in shale nanopores from molecular simulations. Fluid Phase Equilib. 2016, 430, 156–168. [Google Scholar] [CrossRef]
  5. Wang, Q.; Chen, X.; Jha, A.N.; Rogers, H. Natural gas from shale formation–The evolution, evidences and challenges of shale gas revolution in United States. Renew. Sustain. Energy Rev. 2014, 30, 1–28. [Google Scholar] [CrossRef]
  6. Pang, W.Y.; He, Y.Q.; Yan, C.H.; Jin, Z.H. Tackling the challenges in the estimation of methane absolute adsorption in kerogen nanoporous media from molecular and analytical approaches. Fuel 2019, 242, 687–698. [Google Scholar] [CrossRef]
  7. Rexer, T.F.T.; Benham, M.J.; Aplin, A.C.; Thomas, K.M. Methane Adsorption on Shale under Simulated Geological Temperature and Pressure Conditions. Energy Fuels 2013, 27, 3099–3109. [Google Scholar] [CrossRef]
  8. Hu, K.; Mischo, H. Modeling High-Pressure Methane Adsorption on Shales with a Simplified Local Density Model. ACS Omega 2020, 5, 5048–5060. [Google Scholar] [CrossRef]
  9. Han, W.C.; Li, A.F.; Memon, A.; Ma, M. Synergetic Effect of Water, Temperature, and Pressure on Methane Adsorption in Shale Gas Reservoirs. ACS Omega 2021, 6, 2215–2229. [Google Scholar] [CrossRef]
  10. Huang, L.; Ning, Z.F.; Lin, H.; Zhou, W.; Wang, L.; Zou, J.; Xu, H. High-Pressure Sorption of Methane, Ethane, and Their Mixtures on Shales from Sichuan Basin, China. Energy Fuels 2021, 35, 3989–3999. [Google Scholar] [CrossRef]
  11. Hao, S.C.; Ren, Z.J. Study on adsorption characteristics of shale gas based on Monte Carlo method. Chin. J. Appl. Mech. 2022, 37, 1314–1320. [Google Scholar] [CrossRef]
  12. Huang, T.; Liu, D.H.; Sun, J. Simulation on adsorption of methane in micro-pore of clay minerals. Sci. Technol. Eng. 2020, 20, 141–145. [Google Scholar] [CrossRef]
  13. Huang, L.; Zhou, W.; Xu, H.; Wang, L.; Zou, J.; Zhou, Q. Dynamic fluid states in organic-inorganic nanocomposite: Implications for shale gas recovery and CO2 sequestration. Chem. Eng. J. 2021, 411, 128423. [Google Scholar] [CrossRef]
  14. Zhu, H.; Ju, Y.; Huang, C.; Chen, F.; Chen, B.; Yu, K. Microcosmic gas adsorption mechanism on clay-organic nanocomposites in a marine shale. Energy 2020, 197, 117256. [Google Scholar] [CrossRef]
  15. Li, J.; Li, X.; Wang, X.; Li, Y.; Wu, K.; Shi, J.; Yang, L.; Feng, D.; Zhang, T.; Yu, P. Water distribution characteristic and effect on methane adsorption capacity in shale clay. Int. J. Coal Geol. 2016, 159, 135–154. [Google Scholar] [CrossRef]
  16. Li, W.; Pang, X.Q.; Snape, C.; Zhang, B.; Zheng, D.Y.; Zhang, X. Molecular Simulation Study on Methane Adsorption Capacity and Mechanism in Clay Minerals: Effect of Clay Type, Pressure, and Water Saturation in Shales. Energy Fuels 2019, 33, 765–778. [Google Scholar] [CrossRef]
  17. Xiong, J.; Liu, X.; Liang, L.; Wei, X.; Xu, P. Investigation of the factors influencing methane adsorption on illite. Energy Sci. Eng. 2019, 7, 3317–3331. [Google Scholar] [CrossRef]
  18. Huang, L.; Ning, Z.; Wang, Q.; Qi, R.; Zeng, Y.; Qin, H.; Ye, H.; Zhang, W. Molecular simulation of adsorption behaviors of methane, carbon dioxide and their mixtures on kerogen: Effect of kerogen maturity and moisture content. Fuel 2018, 211, 159–172. [Google Scholar] [CrossRef]
  19. Huang, L.; Ning, Z.; Wang, Q.; Zhang, W.; Cheng, Z.; Wu, X.; Qin, H. Effect of organic type and moisture on CO2/CH4 competitive adsorption in kerogen with implications for CO2 sequestration and enhanced CH4 recovery. Appl. Energy 2018, 210, 28–43. [Google Scholar] [CrossRef]
  20. Bish, D.L. Rietveld refinement of the kaolinite structure at 1.5 K. Clays Clay Miner. 1993, 41, 738–744. [Google Scholar] [CrossRef]
  21. Li, H.P.; Hu, Y.H.; Wang, D.Z.; Xu, K. Interaction mechanism between cationic surfactant and kaolinite. J. Cent. South Univ. Nat. Sci. Ed. 2004, 35, 228–233. [Google Scholar] [CrossRef]
  22. Li, Y.; Wang, Z.S.; Pan, Z.J.; Niu, X.L.; Yu, Y.; Meng, S.Z. Pore structure and its fractal dimensions of transitional shale: A cross-section from east margin of the Ordos Basin, China. Fuel 2019, 241, 417–431. [Google Scholar] [CrossRef]
  23. Yang, F.; Fang, X.H.; Zeng, F.G.; Zhang, Y.Y. Simulation of adsorption of lead and cadmium on kaolinite surface. Multipurp. Util. Miner. Resour. 2020, 225, 196–202. [Google Scholar] [CrossRef]
  24. Tang, J.P.; Sun, S.J.; Bao, S.Y. Molecular simulation of methane adsorption on kaolinite. Pet. Geol. Recovery Effic. 2019, 26, 43–49. [Google Scholar] [CrossRef]
  25. Abbaspour, M. Computation of some thermodynamics, transport, structural properties, and new equation of state for fluid methane using two-body and three-body intermolecular potentials from molecular dynamics simulation. J. Mol. Liq. 2011, 161, 30–35. [Google Scholar] [CrossRef]
  26. Berendsen, H.J.C.; Grigera, J.R.; Straatsma, T.P. The Missing Term in Effective Pair Potentials. J. Phys. Chem. 1987, 91, 6269–6271. [Google Scholar] [CrossRef]
  27. Robinson, D.B.; Peng, D.Y.; Chung, Y.K. The development of the Peng–Robinson equation and its application to phase equilibrium in a system containing methanol. Fluid Phase Equilib. 1985, 24, 25–41. [Google Scholar] [CrossRef]
  28. Gotzias, A.; Heiberg-Andersen, H.; Kainourgiakis, M.; Steriotis, T. Grand canonical Monte Carlo simulations of hydrogen adsorption in carbon cones. Appl. Surf. Sci. 2010, 256, 5226–5231. [Google Scholar] [CrossRef]
  29. Liu, X.Q.; He, X.; Qiu, N.X.; Yang, X.; Tian, Z.Y.; Li, M.J.; Xue, Y. Molecular simulation of CH4, CO2, H2O and N2 molecules adsorption on heterogeneous surface models of coal. Appl. Surf. Sci. 2016, 389, 894–905. [Google Scholar] [CrossRef]
  30. Zhang, B.; Kang, J.T.; Kang, T.H. Effect of water on methane adsorption on the kaolinite (001) surface based on molecular simulations. Appl. Surf. Sci. 2018, 439, 792–800. [Google Scholar] [CrossRef]
  31. Zhang, Y.Y.; Fang, X.H.; Zeng, F.G. Molecular simulation of methane adsorption in kaolinite slit. Multipurp. Util. Miner. Resour. 2019, 1, 130–134+113. [Google Scholar] [CrossRef]
  32. Zhang, B.; Kang, T.H.; Kang, J.T.; Song, Z.P. Molecular simulation of competitive adsorption of C2H6 and CH4 on kaolinite surface. J. Taiyuan Univ. Technol. 2019, 50, 297–302. [Google Scholar] [CrossRef]
  33. Ji, L.; Zhang, T.; Milliken, K.L.; Qu, J.; Zhang, X. Experimental investigation of main controls to methane adsorption in clay-rich rocks. Appl. Geochem. 2012, 27, 2533–2545. [Google Scholar] [CrossRef]
  34. Wang, S.; Feng, Q.H.; Javadpour, F.; Hu, Q.H.; Wu, K.L. Competitive adsorption of methane and ethane in montmorillonite nanopores of shale at supercritical conditions: A grand canonical Monte Carlo simulation study. Chem. Eng. J. 2019, 355, 76–90. [Google Scholar] [CrossRef]
  35. Zhang, L.; Liu, C.; Li, Q.B. Molecular simulations of competitive adsorption behavior between CH4-C2H6 in K-illite clay at supercritical conditions. Fuel 2020, 260, 116358. [Google Scholar] [CrossRef]
  36. Donohue, M.D.; Aranovich, G.L. Classification of Gibbs adsorption isotherms. Adv. Colloid Interface Sci. 1998, 76, 137–152. [Google Scholar] [CrossRef]
  37. Xu, J.T. Study on the influence of temperature on methane adsorption characteristics of soft and hard anthracite based on molecular simulation method. Saf. Coal Mines 2022, 53, 158–165. [Google Scholar] [CrossRef]
  38. Liu, X.; Ma, J.K.; Xu, J.T. Study on the influence of water on methane adsorption characteristics of soft and hard anthracite based on molecular simulation method. Saf. Coal Mines 2022, 53, 20–27. [Google Scholar] [CrossRef]
  39. Sharma, A.; Luxami, V.; Paul, K. Purine-benzimidazole hybrids: Synthesis, single crystal determination and in vitro evaluation of antitumor activities. Eur. J. Med. Chem. 2015, 93, 414–422. [Google Scholar] [CrossRef]
  40. Hao, X.S.; Jia, Z.H.; Zhang, L.L.; Wang, X.; Zhang, J.; Zhou, L.X.; Yan, Y.G. Molecular Insight into the Methane Occurrence inside a Shale Nanochannel with Formation Water. Energy Fuels 2023, 37, 1207–1215. [Google Scholar] [CrossRef]
  41. Pan, H.; Ritter, J.A.; Balbuena, P.B. Examination of the approximations used in determining the isosteric heat of adsorption from the Clausius− Clapeyron equation. Langmuir 1998, 14, 6323–6327. [Google Scholar] [CrossRef]
  42. Yang, L.L.; Zhou, X.; Zhang, K.W.; Zeng, F.H.; Wang, Z.H. Investigation of dynamical properties of methane in slit-like quartz pores using molecular simulation. RSC Adv. 2018, 8, 33798–33816. [Google Scholar] [CrossRef] [PubMed]
  43. Yang, F.; Ning, Z.F.; Zhang, R.; Zhao, H.W. Adsorption isothermal process of methane on shale. Int. J. Coal Sci. Technol. 2014, 39, 1327–1332. [Google Scholar] [CrossRef]
  44. Zhang, L.; Liu, C.; Liu, Y.; Li, Q.B.; Cheng, Q.L.; Cai, S.Y. Transport Property of Methane and Ethane in K-Illite Nanopores of Shale: Insights from Molecular Dynamic Simulations. Energy Fuels 2020, 34, 1710–1719. [Google Scholar] [CrossRef]
  45. Li, A.; Han, W.; Fang, Q.; Memon, A.; Ma, M. Experimental investigation of methane adsorption and desorption in water-bearing shale. Capillarity 2020, 3, 45–55. [Google Scholar] [CrossRef]
  46. Collell, J.; Galliero, G.; Gouth, F.O.; Montel, F.O.; Pujol, M.; Ungerer, P.; Yiannourakou, M. Molecular simulation and modelisation of methane/ethane mixtures adsorption onto a microporous molecular model of kerogen under typical reservoir conditions. Microporous Mesoporous Mater. 2014, 197, 194–203. [Google Scholar] [CrossRef]
  47. Hui, W.; Long, S. Experimental study on isothermal adsorption of coalbed methane under different temperature conditions. Shanxi Coal 2018, 38, 71–75. [Google Scholar] [CrossRef]
  48. Brasili, J.; Fox, K.; Badamo, D.; Berghe, G.; Khanal, R.; Singh, R. Molecular dynamics simulation of shale gas confined inside slit-like calcite 104 nanopore. Mol. Simul. 2019, 45, 104–110. [Google Scholar] [CrossRef]
  49. Owusu, J.P.; Karalis, K.; Prasianakis, N.I.; Churakov, S.V. Mobility of Dissolved Gases in Smectites under Saturated Conditions: Effects of Pore Size, Gas Types, Temperature, and Surface Interaction. J. Phys. Chem. C 2022, 126, 17441–17455. [Google Scholar] [CrossRef]
  50. Spera, M.M.; Franco, L.M. Surface and confinement effects on the self-diffusion coefficients for methane-ethane mixtures within calcite nanopores. Fluid Phase Equilib. 2020, 522, 112740. [Google Scholar] [CrossRef]
  51. Sharma, A.; Namsani, S.; Singh, J.K. Molecular simulation of shale gas adsorption and diffusion in inorganic nanopores. Mol. Simul. 2015, 41, 414–422. [Google Scholar] [CrossRef]
Figure 1. Low energy structure of kaolinite slit with water content of (a) 3 molecules/nm3 (b) 6 molecules/nm3 (c) 9 molecules/nm3, respectively, at a temperature of 340 K. The color scheme: O, red; H, white; Si, yellow; Al, purple.
Minerals 13 01269 g001
Figure 2. The adsorption isotherms of CH4 and C2H6 at different water contents at 340 K.
Minerals 13 01269 g002
Figure 3. Variation of Langmuir volume with water content.
Minerals 13 01269 g003
Figure 4. Langmuir pressure variation with water content.
Minerals 13 01269 g004
Figure 5. The isosteric adsorption heat of CH4 and C2H6 at different water contents at 340 K.
Minerals 13 01269 g005
Figure 6. The distribution of CH4, C2H6 and H2O along the direction (001) in a 3 nm kaolinite slit (P = 30 Mpa) with water content of (a) 0 molecules/nm3, (b) 3 molecules/nm3, (c) 6 molecules/nm3, (d) 9 molecules/nm3.
Minerals 13 01269 g006
Figure 7. The adsorption isotherms of CH4 and C2H6 at 310 K, 340 K, 370 K and 400 K.
Minerals 13 01269 g007
Figure 8. Variation of Langmuir volume with different temperatures.
Minerals 13 01269 g008
Figure 9. Variation of Langmuir pressure with different temperatures.
Minerals 13 01269 g009
Figure 10. Isosteric adsorption heat of CH4 and C2H6 at different temperatures.
Minerals 13 01269 g010
Figure 11. Distribution of C2H6 (a) and CH4 (b) along the direction (001) in a 3 nm kaolinite slit (P = 30 MPa).
Minerals 13 01269 g011
Table 1. L-J parameters of methane, ethane and kaolinite.
SubstanceAtoms ε / k B / K σ / Å q / e
kaoliniteSi155.9924.27+1.25
Al155.9924.39+1.05
O48.156243.4046−0.85
H7.648643.195+0.28
CH4C33.243.5−0.24
H15.1092.5+0.06
C2H6C33.243.5−0.18
H15.1092.5+0.06
H2OH00+0.4238
O78.183.166−0.8476
Table 2. Langmuir constants of CH4 and C2H6 at different water contents.
GasWater Content (Molecules/nm3)VL (Molecules/uc)PL (Mpa)R2
CH40216.218.440.995
3211.539.220.997
6207.146.470.996
9202.762.070.998
C2H60125.50.670.985
3104.80.950.986
690.12.210.996
970.53.130.992
Table 3. Langmuir constants of CH4 and C2H6 at different temperatures.
GasTemperature (K)VL (Molecules/uc)PL (Mpa)R2
CH4310 K221.613.060.996
340 K218.617.500.998
370 K216.526.940.998
400 K212.633.260.999
C2H6310 K132.90.660.988
340 K126.90.860.978
370 K120.61.690.984
400 K110.963.350.995
Table 4. Diffusion coefficients of CH4 and C2H6 at different water contents.
10−8 m2·s−10 Molecules/nm33 Molecules/nm36 Molecules/nm39 Molecules/nm3
C2H62.842.602.261.64
CH49.919.738.928.74
Table 5. Diffusion coefficients of CH4 and C2H6 at different temperatures.
10−8 m2·s−1310 K340 K370 K400 K
C2H61.892.843.875.59
CH47.509.9113.216.9
Disclaimer/Publisher’s Note: The statements, opinions and data contained in all publications are solely those of the individual author(s) and contributor(s) and not of MDPI and/or the editor(s). MDPI and/or the editor(s) disclaim responsibility for any injury to people or property resulting from any ideas, methods, instructions or products referred to in the content.

