
Migration Mechanisms of Al3+/Li+ Lattice Impurities during Phase Transition from α-Quartz to β-Quartz: An Implication for Purification of High-Purity Quartz
 ,
,
Abstract
:1. Introduction
2. Methodology
3. Results and Discussion
3.1. Optimization of Bulk α-Quartz and β-Quartz
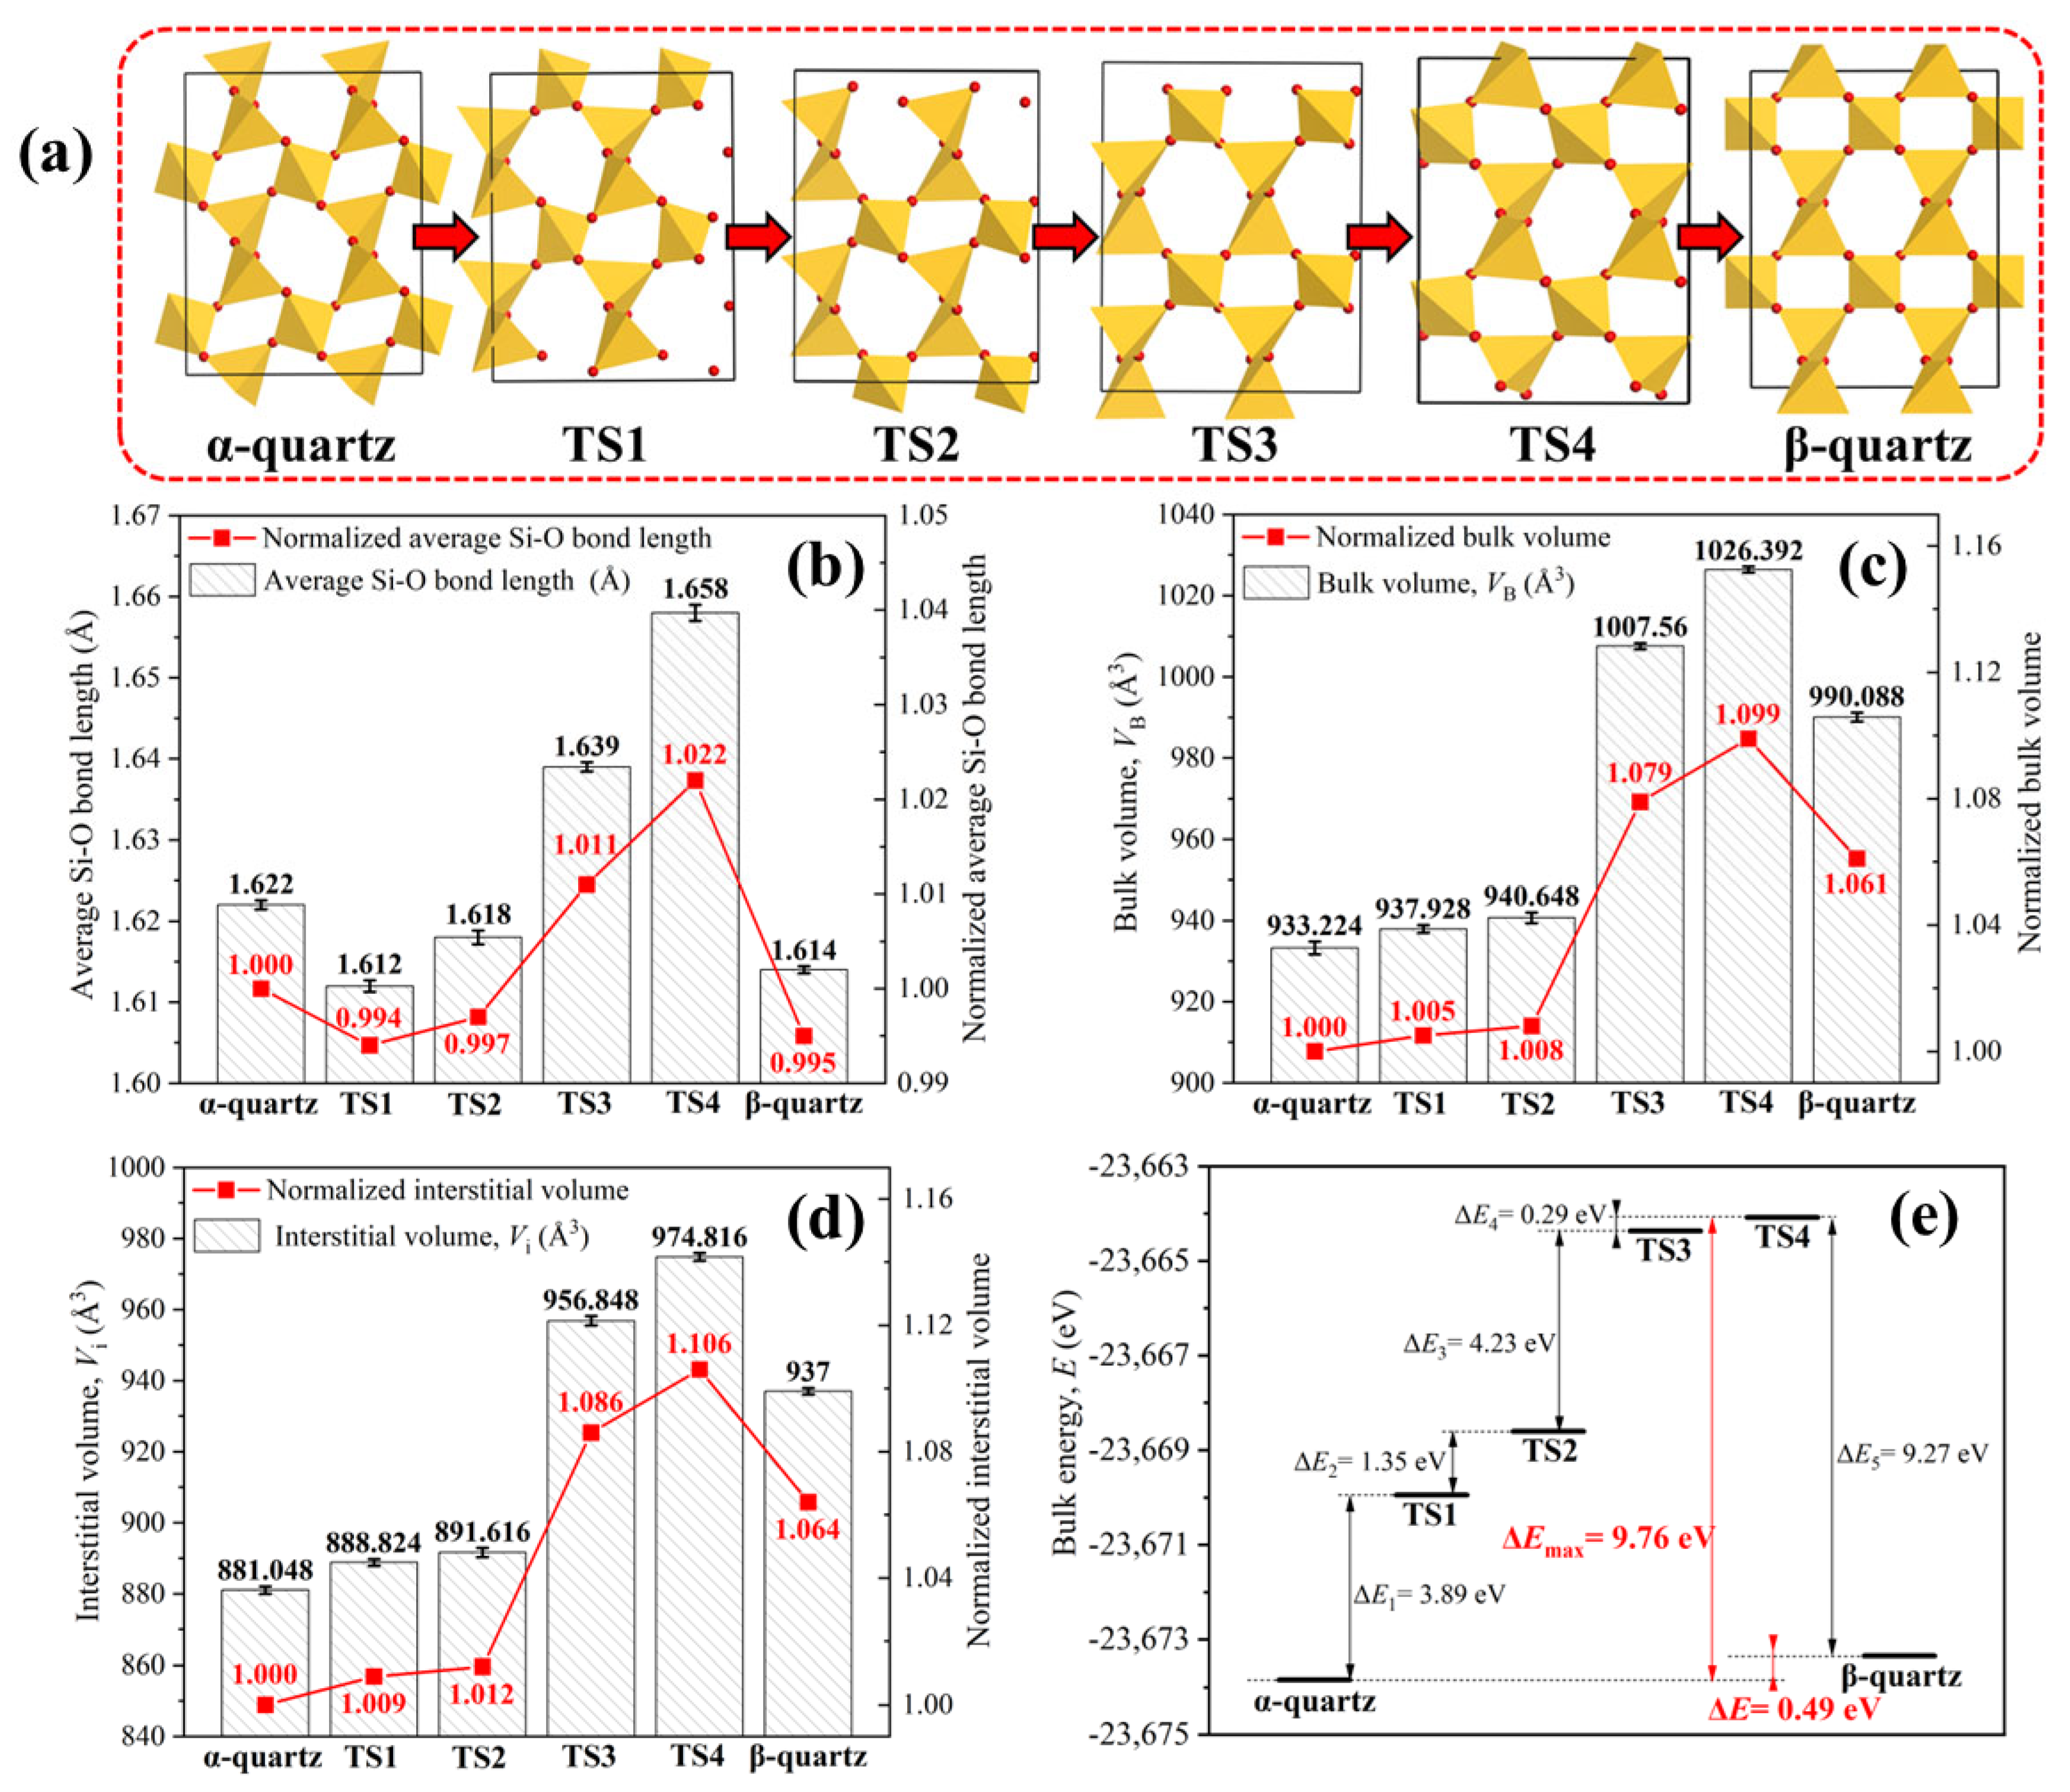
3.2. Phase Transition from α-Quartz to β-Quartz
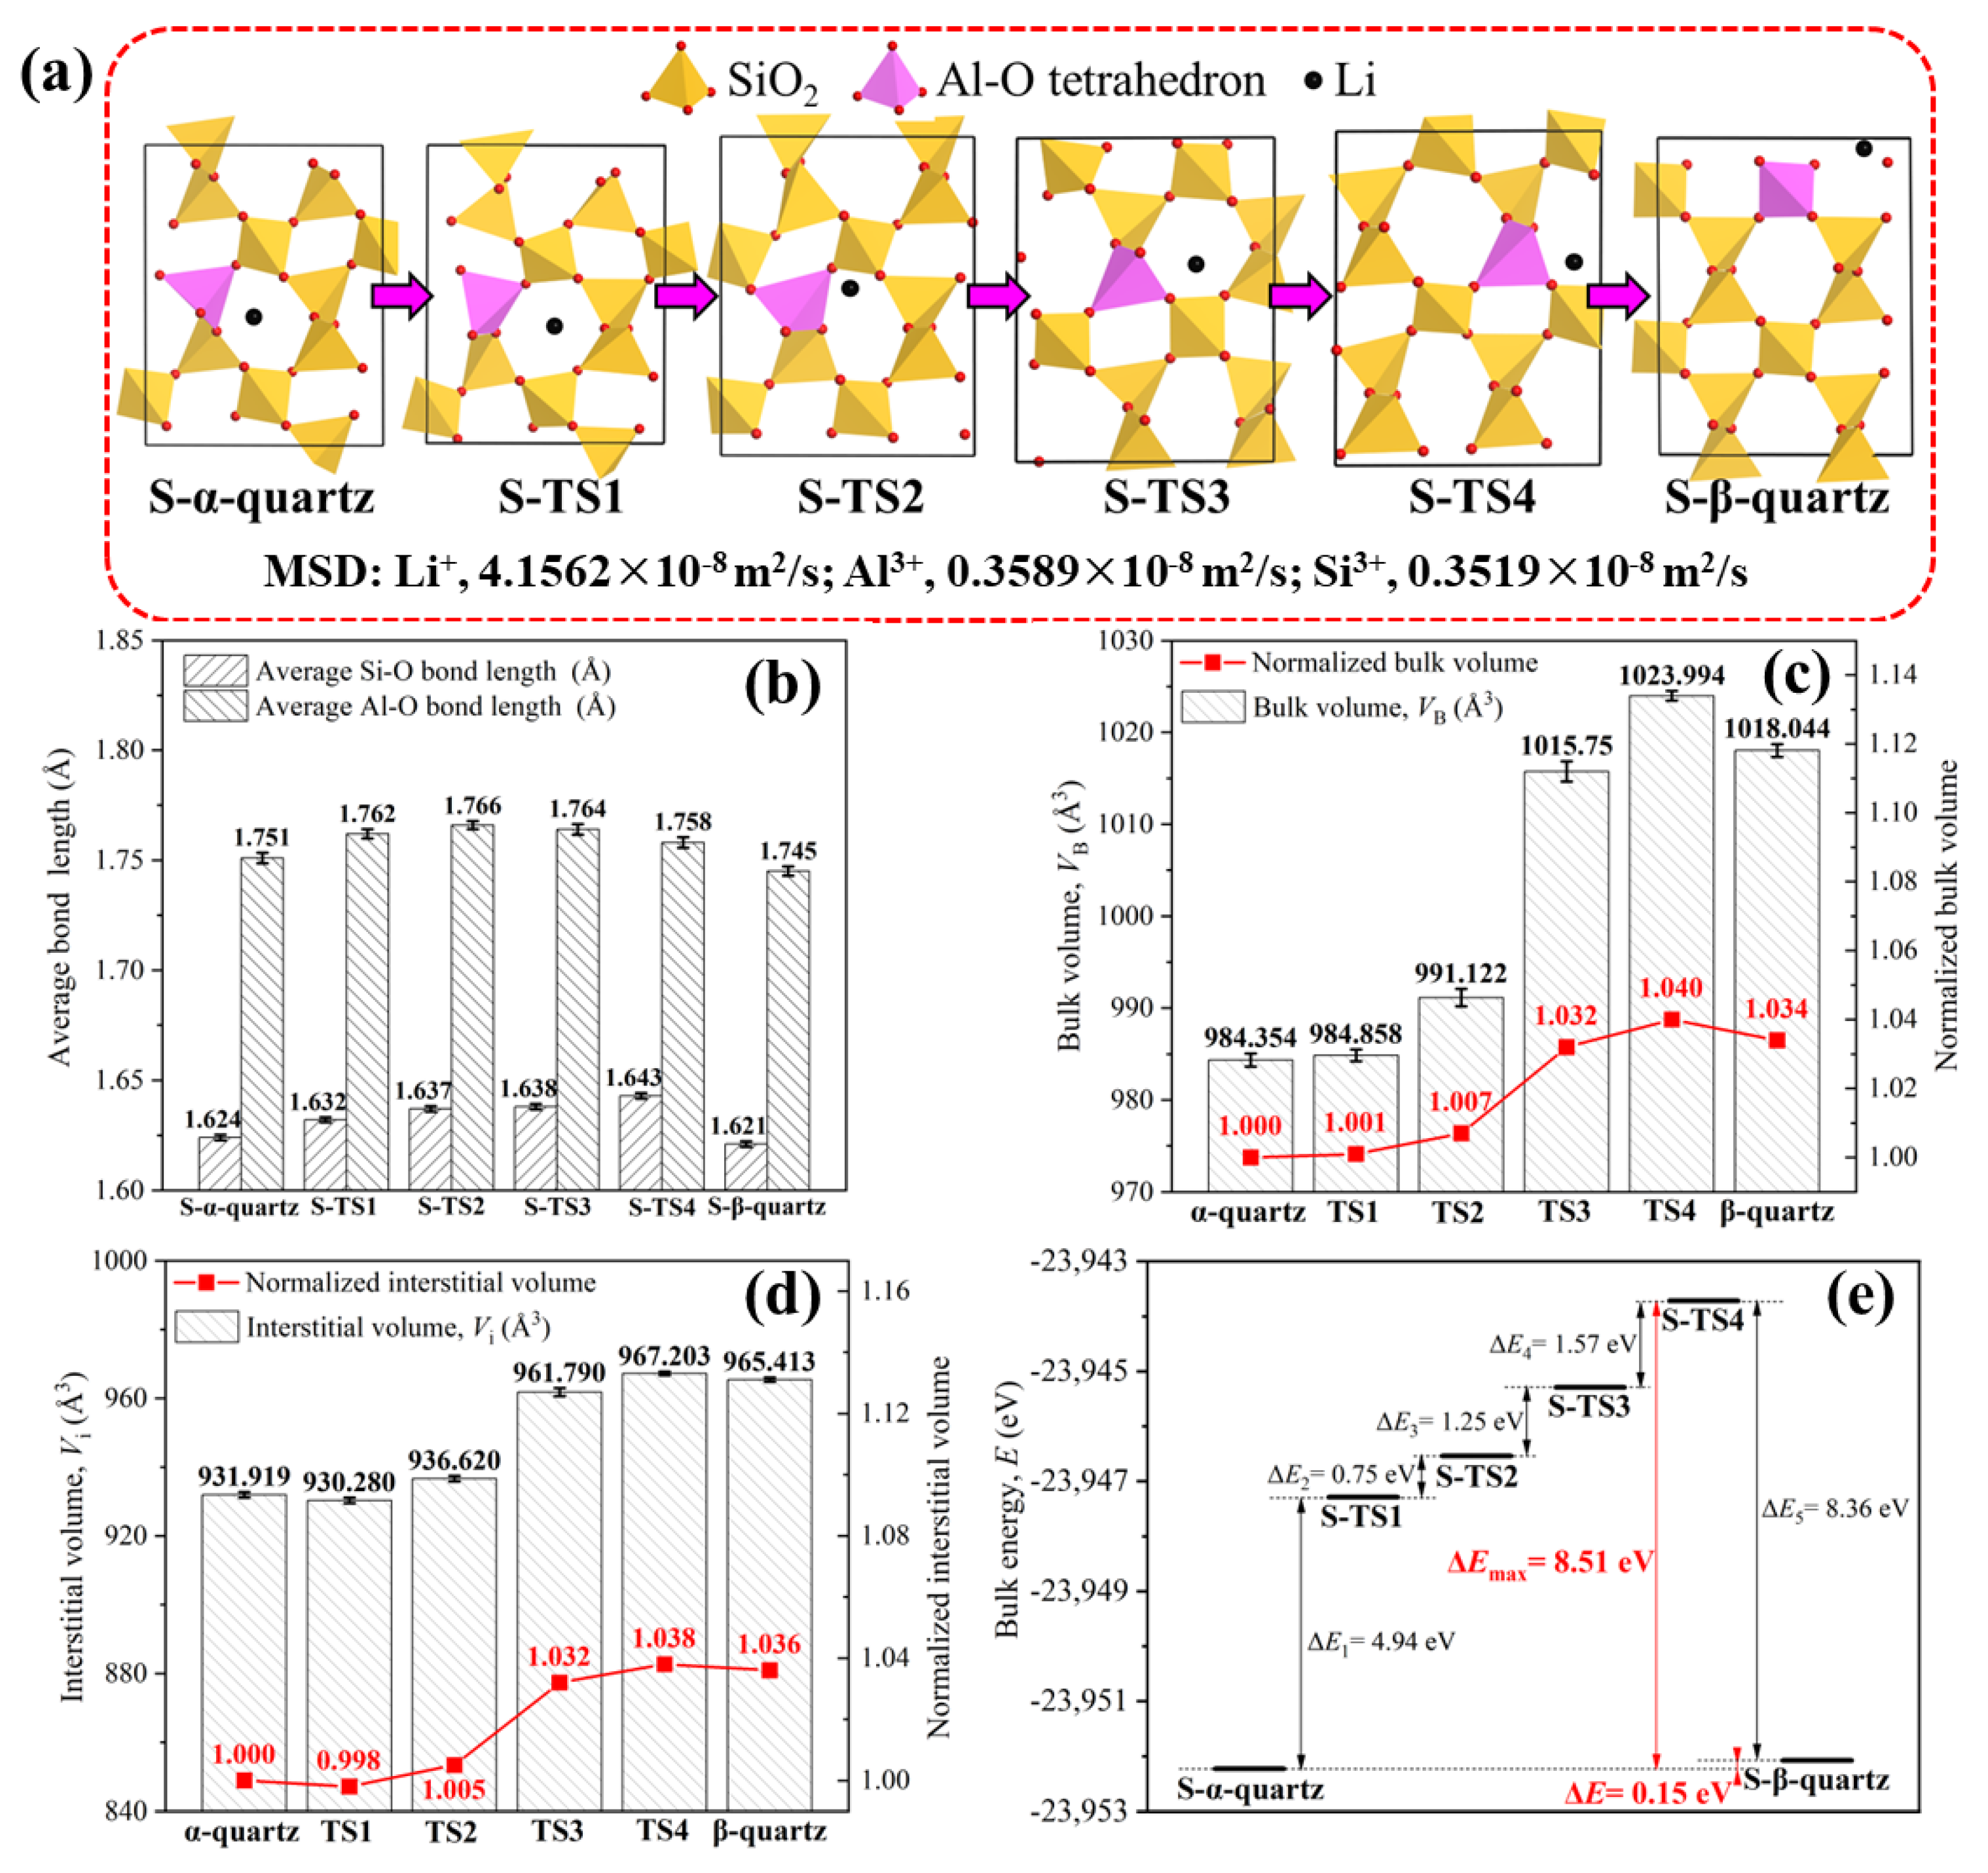
3.3. Migration Pathway of Lattice Impurities
4. Conclusions
Supplementary Materials
Author Contributions
Funding
Data Availability Statement
Conflicts of Interest
References
- Xia, M.; Sun, C.; Yang, X.Y.; Chen, J. Assessment of Gold-Bearing Quartz Vein as a Potential High-Purity Quartz Resource: Evidence from Mineralogy, Geochemistry, and Technological Purification. Minerals 2023, 13, 261. [Google Scholar] [CrossRef]
- Zhang, Y.; Zhao, H.B.; Liu, L.; Pan, J.Y.; Zhu, L.K.; Liu, G.Q.; Zhang, X.T. Timing of granite pegmatite-type high-purity quartz deposit in the Eastern Qinling, China: Constraints from in-situ LA-ICP-MS trace analyses of quartz and monazite U–Pb dating. Acta Geochim. 2022, 41, 197–207. [Google Scholar] [CrossRef]
- Shen, L.F.; Sun, N.; Xu, R.; Sun, W.; Wang, L. Adsorption mechanisms of activated surface of quartz and feldspar with mixed NaOL/DDA. Sep. Purif. Technol. 2023, 314, 123501. [Google Scholar] [CrossRef]
- Wang, Y.H.; Lu, D.F.; Wang, L.G.; Zheng, X.Y. Flotation separation of limonite from quartz with sodium oleate: Effects of limonite dissolution and addition of sodium hexametaphosphate. Min. Proc. Ext. Met. Rev. 2021, 130, 202–208. [Google Scholar] [CrossRef]
- Liu, C.F.; Wang, W.T.; Wang, H.; Zhu, C.Y.; Ren, B. A Review on Removal of Iron Impurities from Quartz Mineral. Minerals 2023, 13, 1128. [Google Scholar] [CrossRef]
- Götze, J. Quartz: Deposits, Mineralogy and Analytics; Springer: New York, NY, USA, 2012. [Google Scholar]
- Weil, J.A. A review of electron spin spectroscopy and its application to the study of paramagnetic defects in crystalline quartz. Phys. Chem. Miner. 1984, 10, 149–165. [Google Scholar] [CrossRef]
- Perny, B.; Eberhardt, P.; Ramseyer, K.; Mullis, J.; Pankrath, R. Microdistribution of Al, Li, and Na in alpha quartz; possible causes and correlation with short-lived cathodoluminescence. Am. Mineral. 1992, 77, 534–544. [Google Scholar]
- Stalder, R.; Potrafke, A.; Billström, K.; Skogby, H.; Meinhold, G.; Gögele, C.; Berberich, T. OH defects in quartz as monitor for igneous, metamorphic, and sedimentary processes. Am. Mineral. 2017, 102, 1832–1842. [Google Scholar] [CrossRef]
- Potrafke, A.; Stalder, R.; Schmidt, B.C.; Ludwig, T. OH defect contents in quartz in a granitic system at 1–5 kbar. Contrib. Mineral. Petr. 2019, 174, 98. [Google Scholar] [CrossRef]
- Shannon, R.D. Revised effective ionic radii and systematic studies of interatomic distances in halides and chalcogenides. Acta Crystallogr. A 1976, 32, 751–767. [Google Scholar] [CrossRef]
- Beurlen, H.; Muller, A.; Silva, D.; Da Silva, M.R.R. Petrogenetic significance of LA-ICP-MS trace-element data on quartz from the Borborema Pegmatite Province, northeast Brazil. Mineral. Mag. 2011, 75, 2703–2719. [Google Scholar] [CrossRef]
- Götze, J.; Plötze, M.; Trautmann, T. Structure and luminescence characteristics of quartz from pegmatites. Am. Mineral. 2005, 90, 13–21. [Google Scholar] [CrossRef]
- Botis, S.M.; Pan, Y. Theoretical calculations of [AlO4/M+]0 defects in quartz and crystal-chemical controls on the uptake of Al. Mineral. Mag. 2009, 73, 537–550. [Google Scholar] [CrossRef]
- Li, J.S.; Li, X.X.; Shen, Q.; Zhang, Z.Z.; Du, F.H. Further Purification of Industrial Quartz by Much Milder Conditions and a Harmless Method. Environ. Sci. Technol. 2010, 44, 7673–7677. [Google Scholar] [CrossRef] [PubMed]
- Loritsch, K.B.; James, R.D. Purified Quartz and Process for Purifying Quartz. US Patent 07/475595, 8 January 1991. [Google Scholar]
- Lin, M.; Pei, Z.Y.; Li, Y.B.; Liu, Y.Y.; Wei, Z.L.; Lei, S.M. Separation mechanism of lattice-bound trace elements from quartz by KCl-doping calcination and pressure leaching. Miner. Eng. 2018, 125, 42–49. [Google Scholar] [CrossRef]
- Keith, M.L.; Tuttle, O.F. Significance of variation in the high-low inversion of quartz. Am. J. Sci. 1952, 250, 203–280. [Google Scholar]
- Baur, W.H. In search of the crystal structure of low quartz. Z. Krist.-New Cryst. Struct. 2010, 224, 580–592. [Google Scholar] [CrossRef]
- Le Page, Y.; Calvert, L.D.; Gabe, E.J. Parameter variation in low quartz between 94 and 298 K. J. Phys. Chem. Solids 1980, 41, 721–725. [Google Scholar] [CrossRef]
- Fischer, M.; Kim, W.J.; Badawi, M.; Lebegue, S. Benchmarking the performance of approximate van der Waals methods for the structural and energetic properties of SiO2 and AlPO4 frameworks. J. Chem. Phys. 2019, 150, 094102. [Google Scholar] [CrossRef]
- Sun, H.R.; Yang, B.; Zhu, Z.L.; Yin, W.Z.; Sheng, Q.Y.; Hou, Y.; Yao, J. New insights into selective-depression mechanism of novel depressant EDTMPS on magnesite and quartz surfaces: Adsorption mechanism, DFT calculations, and adsorption model. Miner. Eng. 2021, 160, 106660. [Google Scholar] [CrossRef]
- Lin, K.J.; Ding, H.; Demkowicz, M.J. Formation, migration, and clustering energies of interstitial He in α-quartz and β-cristobalite. J. Nucl. Mater. 2016, 479, 224–231. [Google Scholar] [CrossRef]
- Perdew, J.P.; Wang, Y. Accurate and simple analytic representation of the electron-gas correlation energy. Phys. Rev. B 1992, 45, 13244. [Google Scholar] [CrossRef] [PubMed]
- Neugebauer, J.; Scheffler, M. Adsorbate-substrate and adsorbate-adsorbate interactions of Na and K adlayers on Al(111). Phys. Rev. B 1992, 46, 16067–16080. [Google Scholar] [CrossRef] [PubMed]
- Young, R.A.; Mackie, P.E.; Von Dreele, R.B. Application of the pattern-fitting structure-refinement method of X-ray powder diffractometer patterns. J. Appl. Crystallogr. 1977, 10, 262–269. [Google Scholar] [CrossRef]
- Wright, A.F.; Lehmann, M.S. The structure of quartz at 25 and 590°C determined by neutron diffraction. J. Solid State Chem. 1981, 36, 371–380. [Google Scholar] [CrossRef]
- Yang, S.; Xu, Y.; Kang, H.; Li, K.; Li, C. Investigation into starch adsorption on hematite and quartz in flotation: Role of starch molecular structure. Appl. Surf. Sci. 2023, 623, 157064. [Google Scholar] [CrossRef]
- Götze, J.; Pan, Y.; Müller, A. Mineralogy and mineral chemistry of quartz: A review. Miner. Mag. 2021, 85, 639–664. [Google Scholar] [CrossRef]

| α-Quartz | β-Quartz | ||||||
|---|---|---|---|---|---|---|---|
| Experiment Value | This Work | Yang et al. [28] | Experiment Value | This Work | |||
| Average Value | Standard Deviation | Average Value | Standard Deviation | ||||
| a (Å) | 4.910 | 4.961 | 0.00156 | 5.027 | 5.01 | 5.048 | 0.000312 |
| c (Å) | 5.402 | 5.472 | 0.00282 | 5.513 | 5.47 | 5.607 | 0.000481 |
| Volume (Å3) | 112.784 | 116.653 | 0.106 | - | 118.906 | 123.761 | 0.0783 |
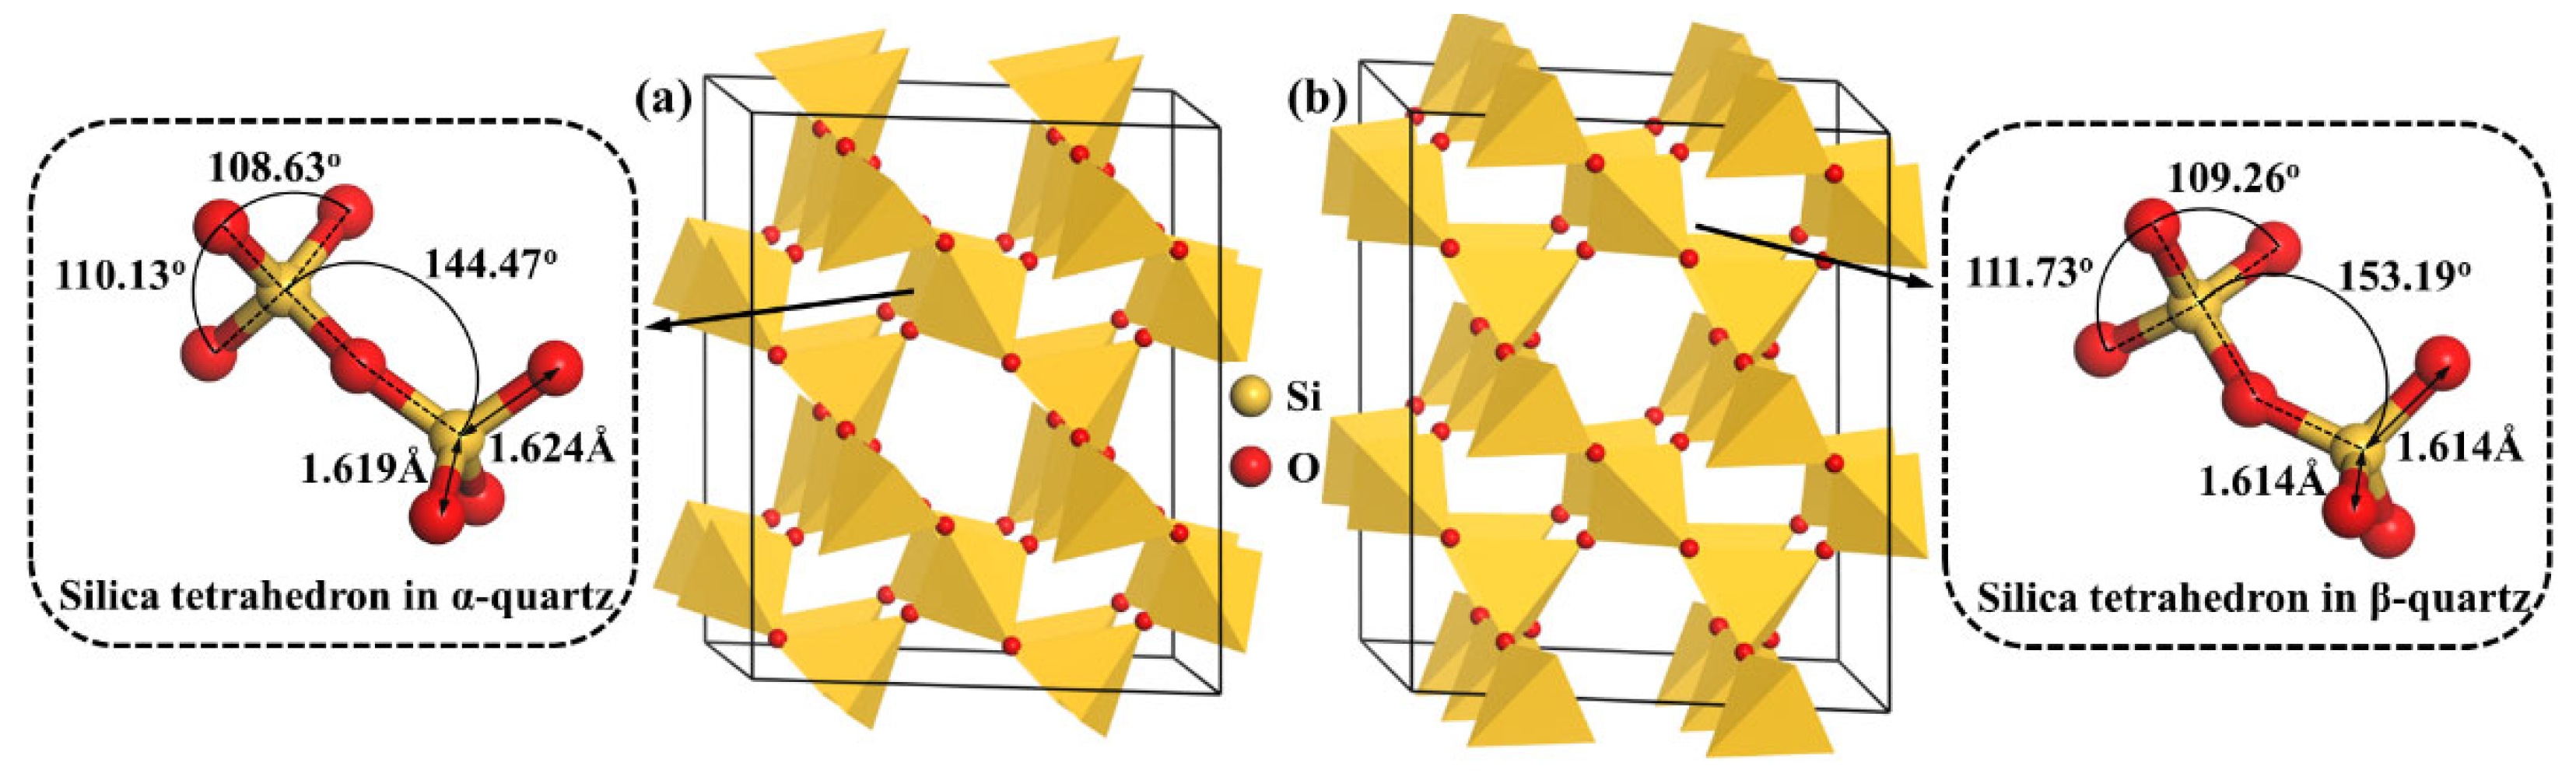
| Si-O bond (Å) | 1.600 /1.615 | 1.619 /1.624 | 0.000565 /0.000681 | - | 1.616 | 1.614 | 0.000374 |
| Si-O-Si angle (o) | 143.03 | 144.47 | 0.182 | - | 146.93 | 153.19 | 0.137 |
| O-Si-O angle (o) | 108.98 /109.88 | 108.63 /110.13 | 0.251 /0.136 | - | 111.31 /116.13 | 109.26 /111.73 | 0.115 /0.163 |
Disclaimer/Publisher’s Note: The statements, opinions and data contained in all publications are solely those of the individual author(s) and contributor(s) and not of MDPI and/or the editor(s). MDPI and/or the editor(s) disclaim responsibility for any injury to people or property resulting from any ideas, methods, instructions or products referred to in the content. |
© 2023 by the authors. Licensee MDPI, Basel, Switzerland. This article is an open access article distributed under the terms and conditions of the Creative Commons Attribution (CC BY) license (https://creativecommons.org/licenses/by/4.0/).
Share and Cite
Wei, Z.; Li, Y.; Li, P.; Pan, L.; Hu, X.; Gu, Y.; Tian, Y. Migration Mechanisms of Al3+/Li+ Lattice Impurities during Phase Transition from α-Quartz to β-Quartz: An Implication for Purification of High-Purity Quartz. Minerals 2023, 13, 1280. https://doi.org/10.3390/min13101280
Wei Z, Li Y, Li P, Pan L, Hu X, Gu Y, Tian Y. Migration Mechanisms of Al3+/Li+ Lattice Impurities during Phase Transition from α-Quartz to β-Quartz: An Implication for Purification of High-Purity Quartz. Minerals. 2023; 13(10):1280. https://doi.org/10.3390/min13101280
Chicago/Turabian StyleWei, Zhenlun, Yubiao Li, Peiyue Li, Li Pan, Xianglin Hu, Yunxiang Gu, and Yan Tian. 2023. "Migration Mechanisms of Al3+/Li+ Lattice Impurities during Phase Transition from α-Quartz to β-Quartz: An Implication for Purification of High-Purity Quartz" Minerals 13, no. 10: 1280. https://doi.org/10.3390/min13101280