
Experimental Development of an Innovative Approach to Enhance the Strength of Early Age Cemented Paste Backfill: A Preliminary Investigation of Microwave-Assisted Curing


Abstract
:1. Introduction
2. Methods
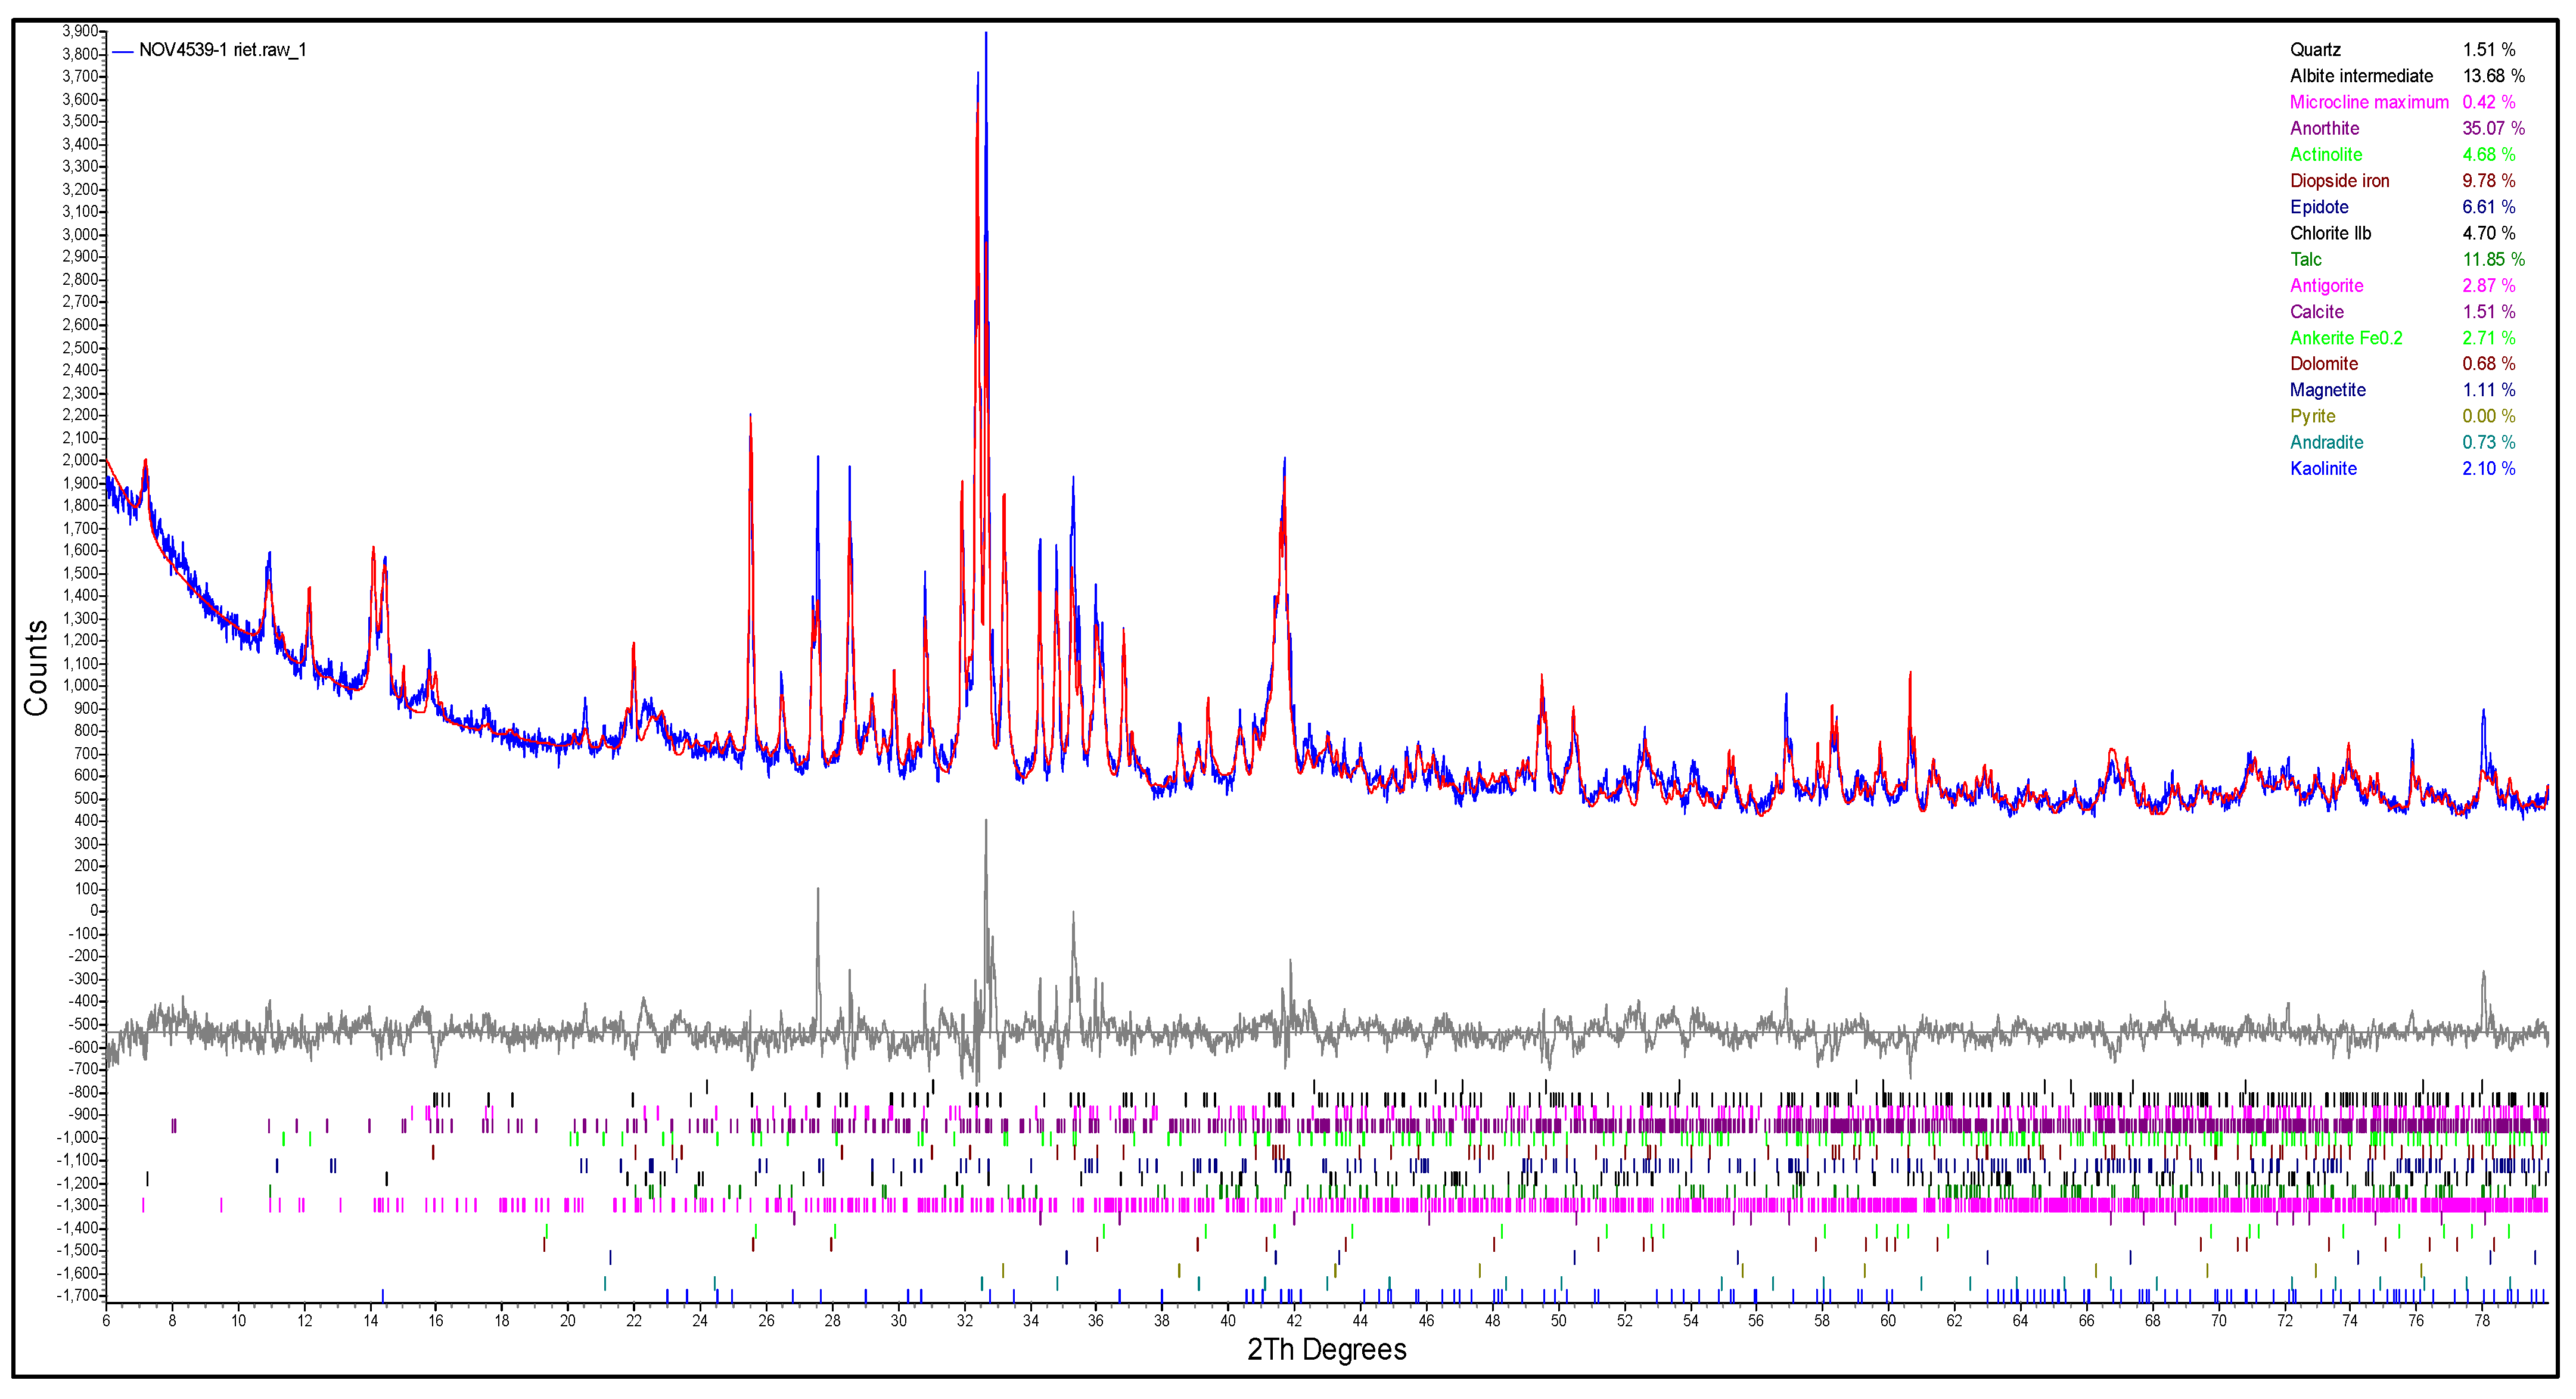
2.1. Materials
2.2. Sample Preparation and Treatment
2.3. UCS Tests
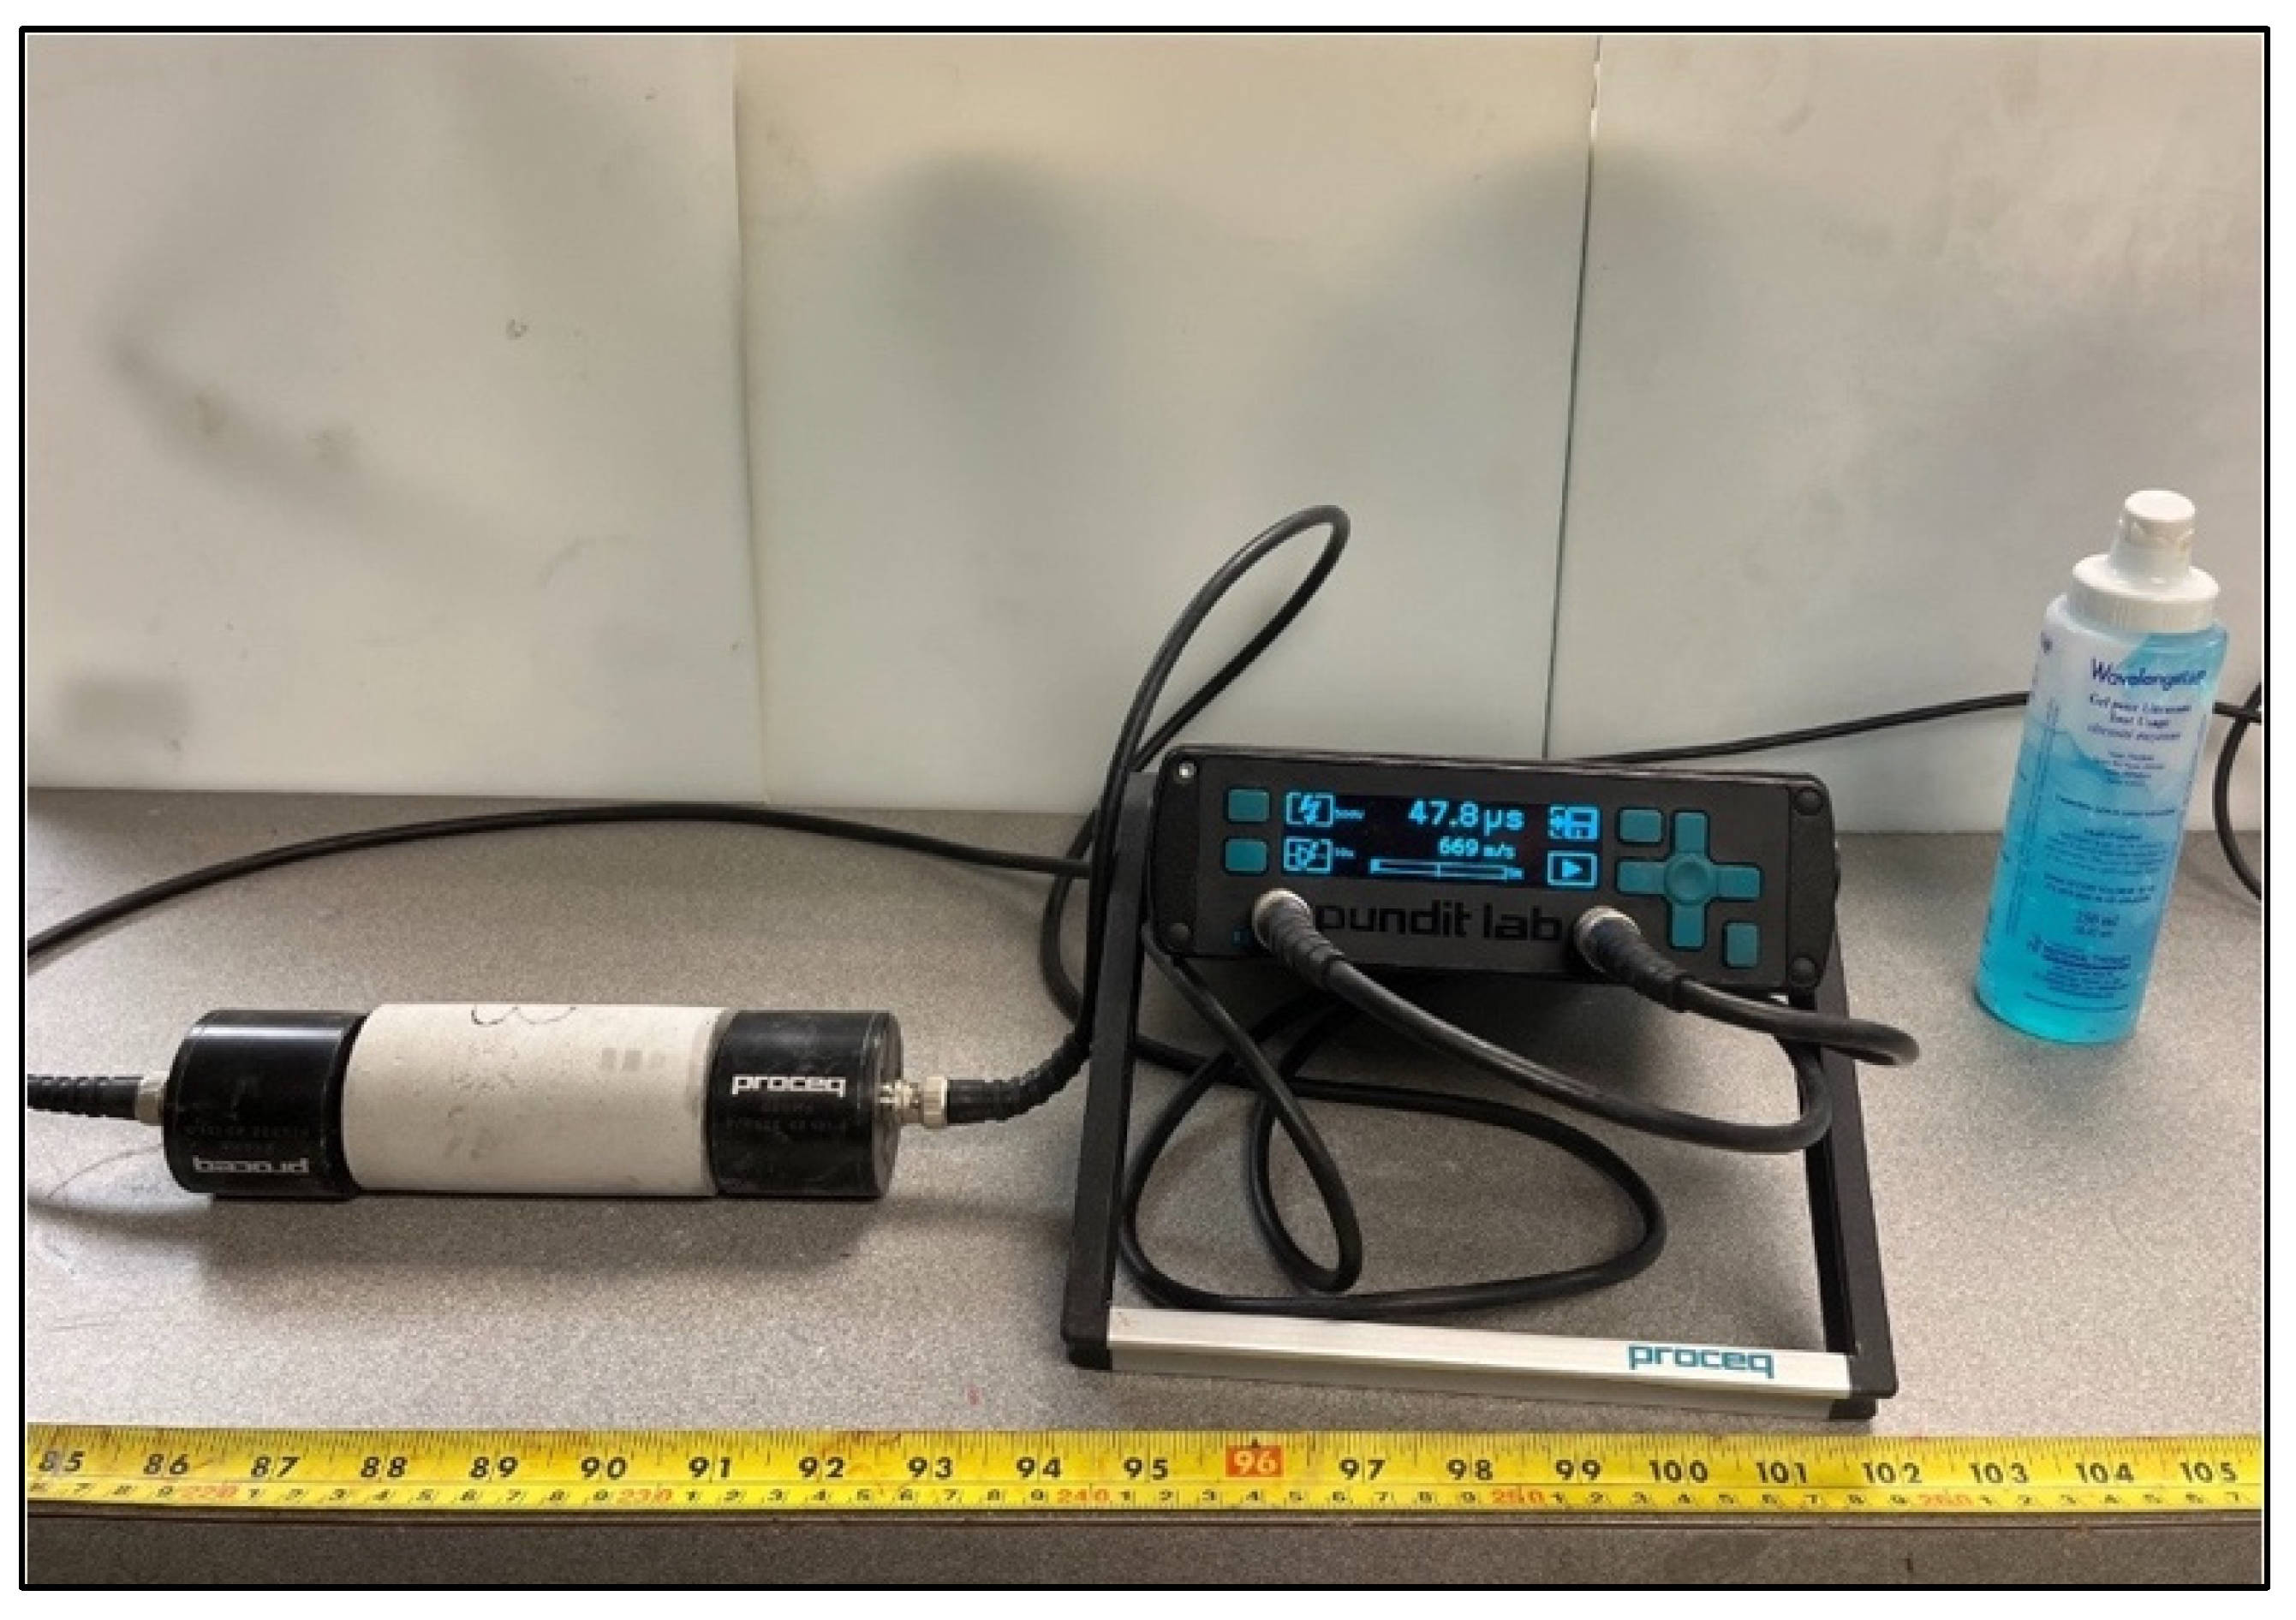
2.4. UPV Tests
2.5. MIP Tests
2.6. Experimental Design
- Design 1 investigated whether UCS and UPV differed between the microwave-treated (measured on curing days 3, 5, and 7) and reference (measured on curing day 7) CPB samples.
- Design 2 investigated whether increasing the MT at a specific curing age affected CPB strength; it did not consider the reference sample.
3. Results and Discussion
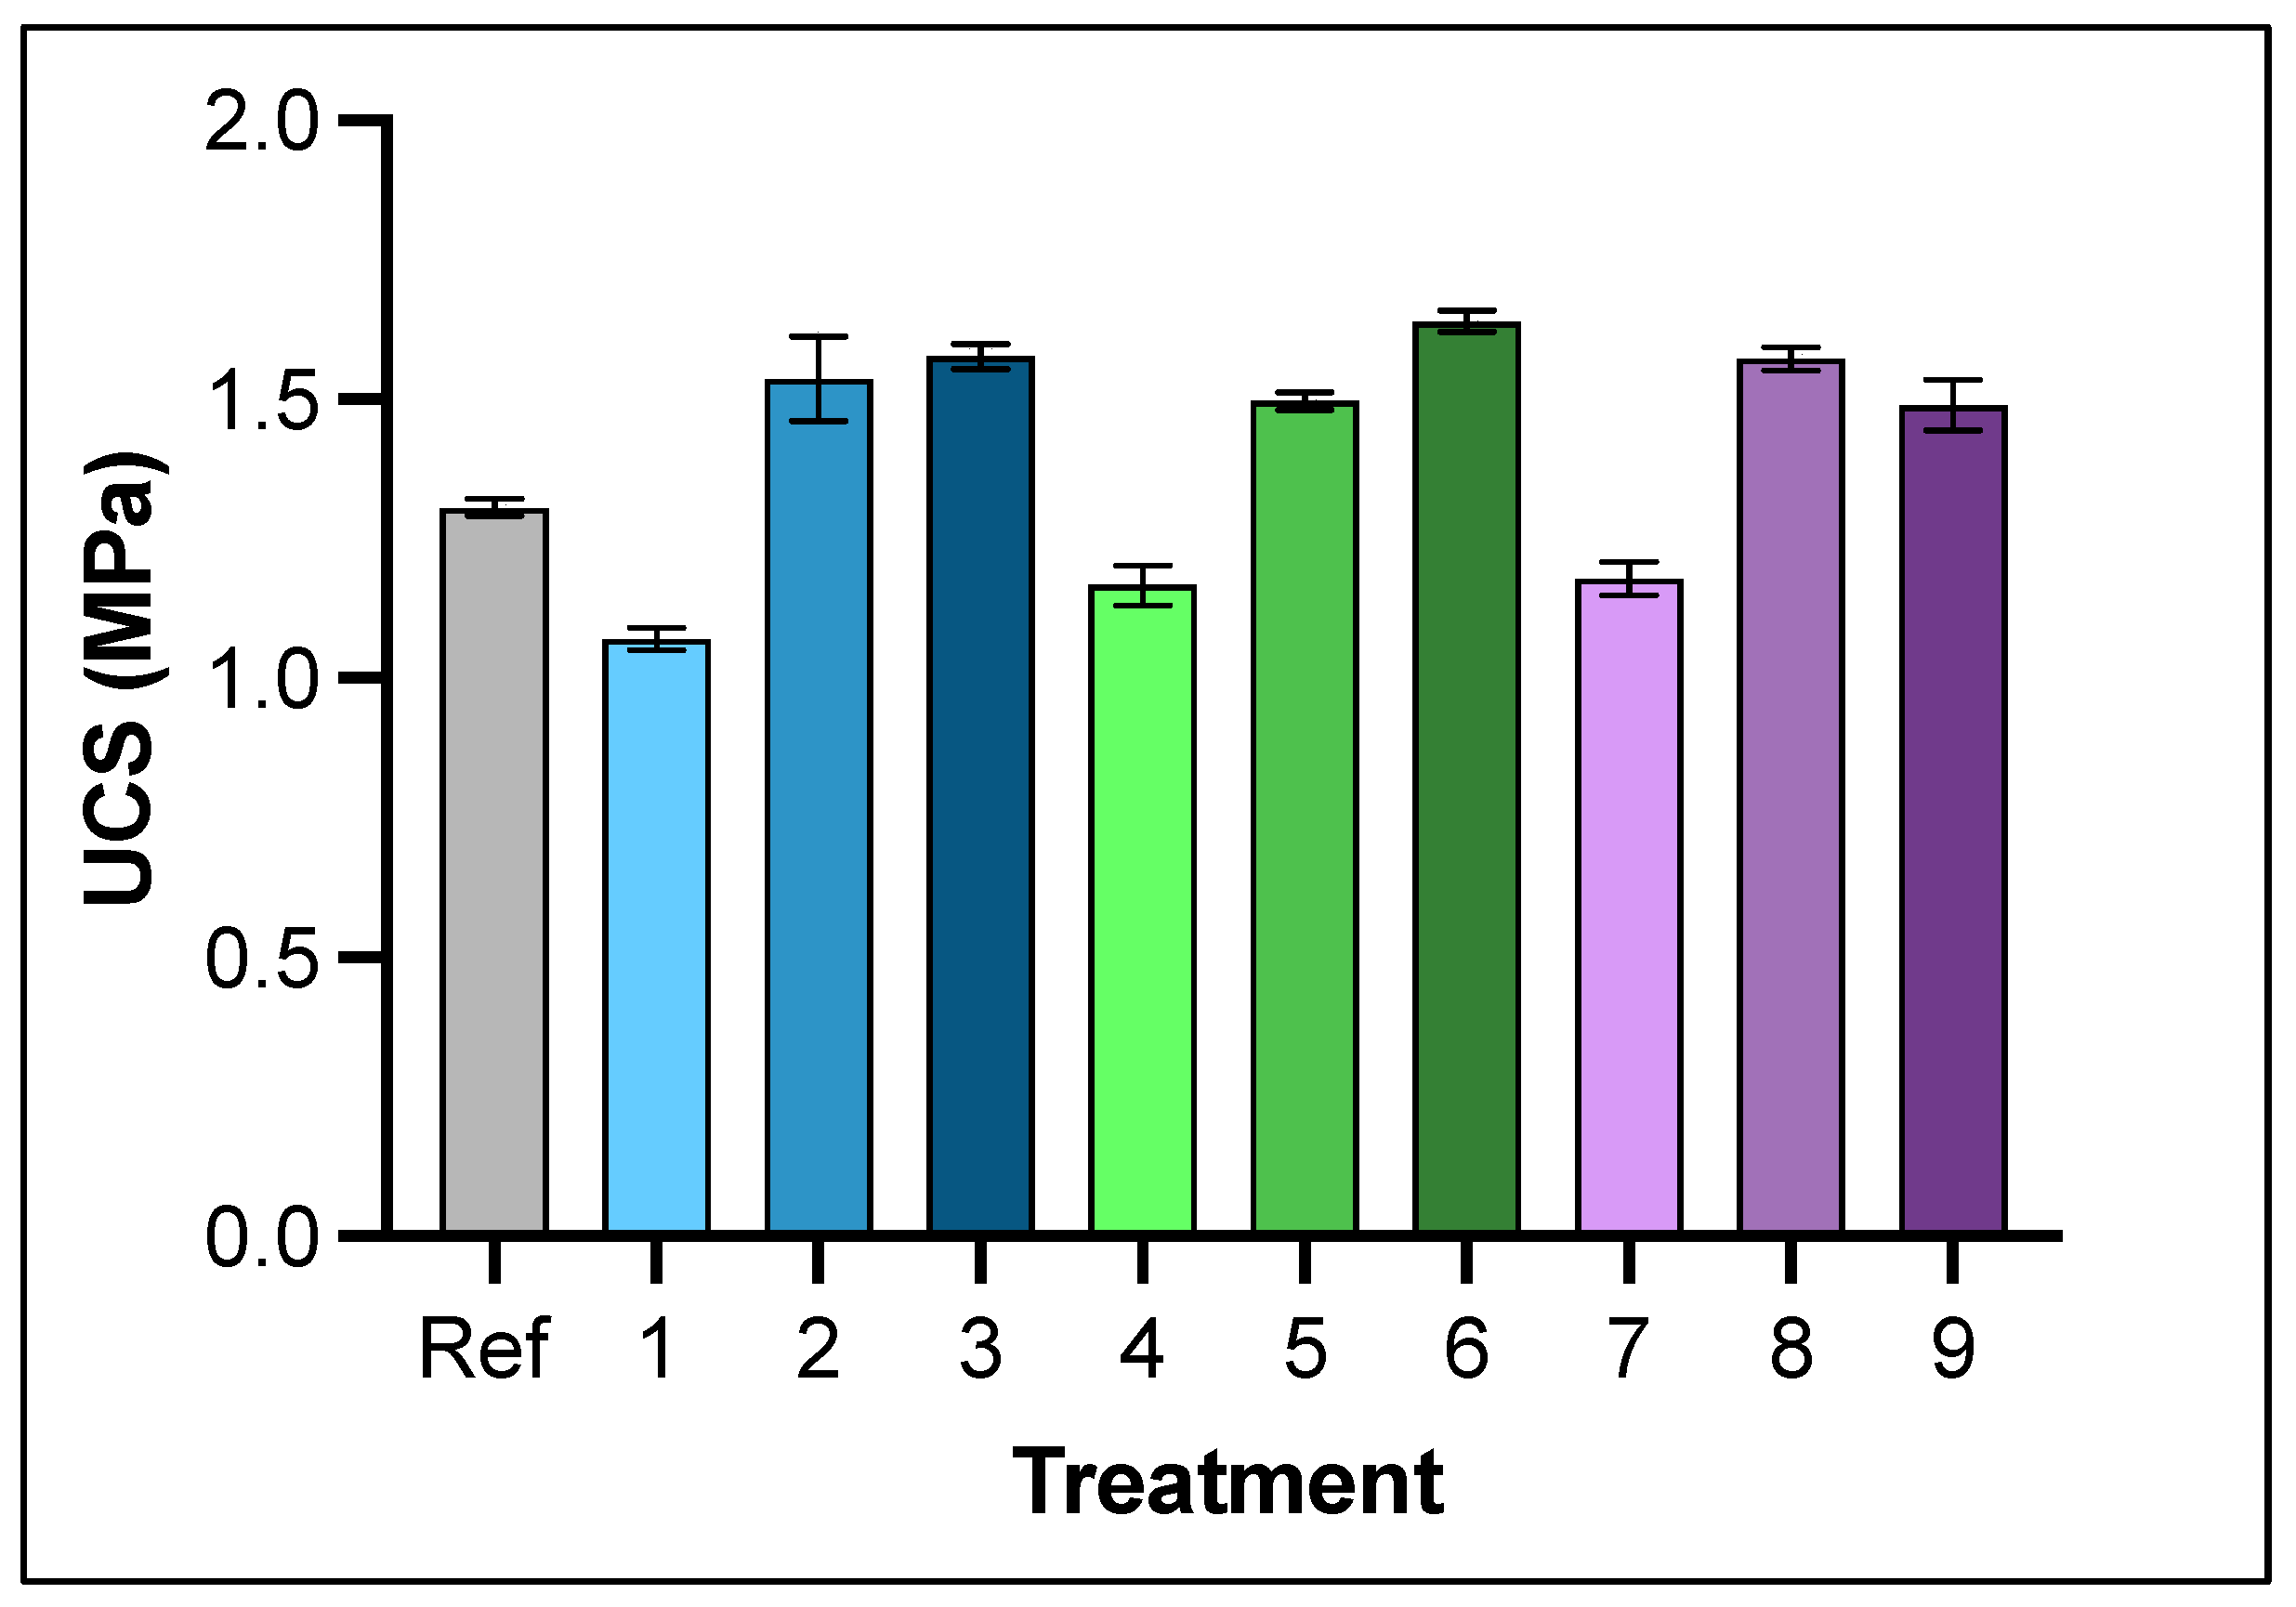
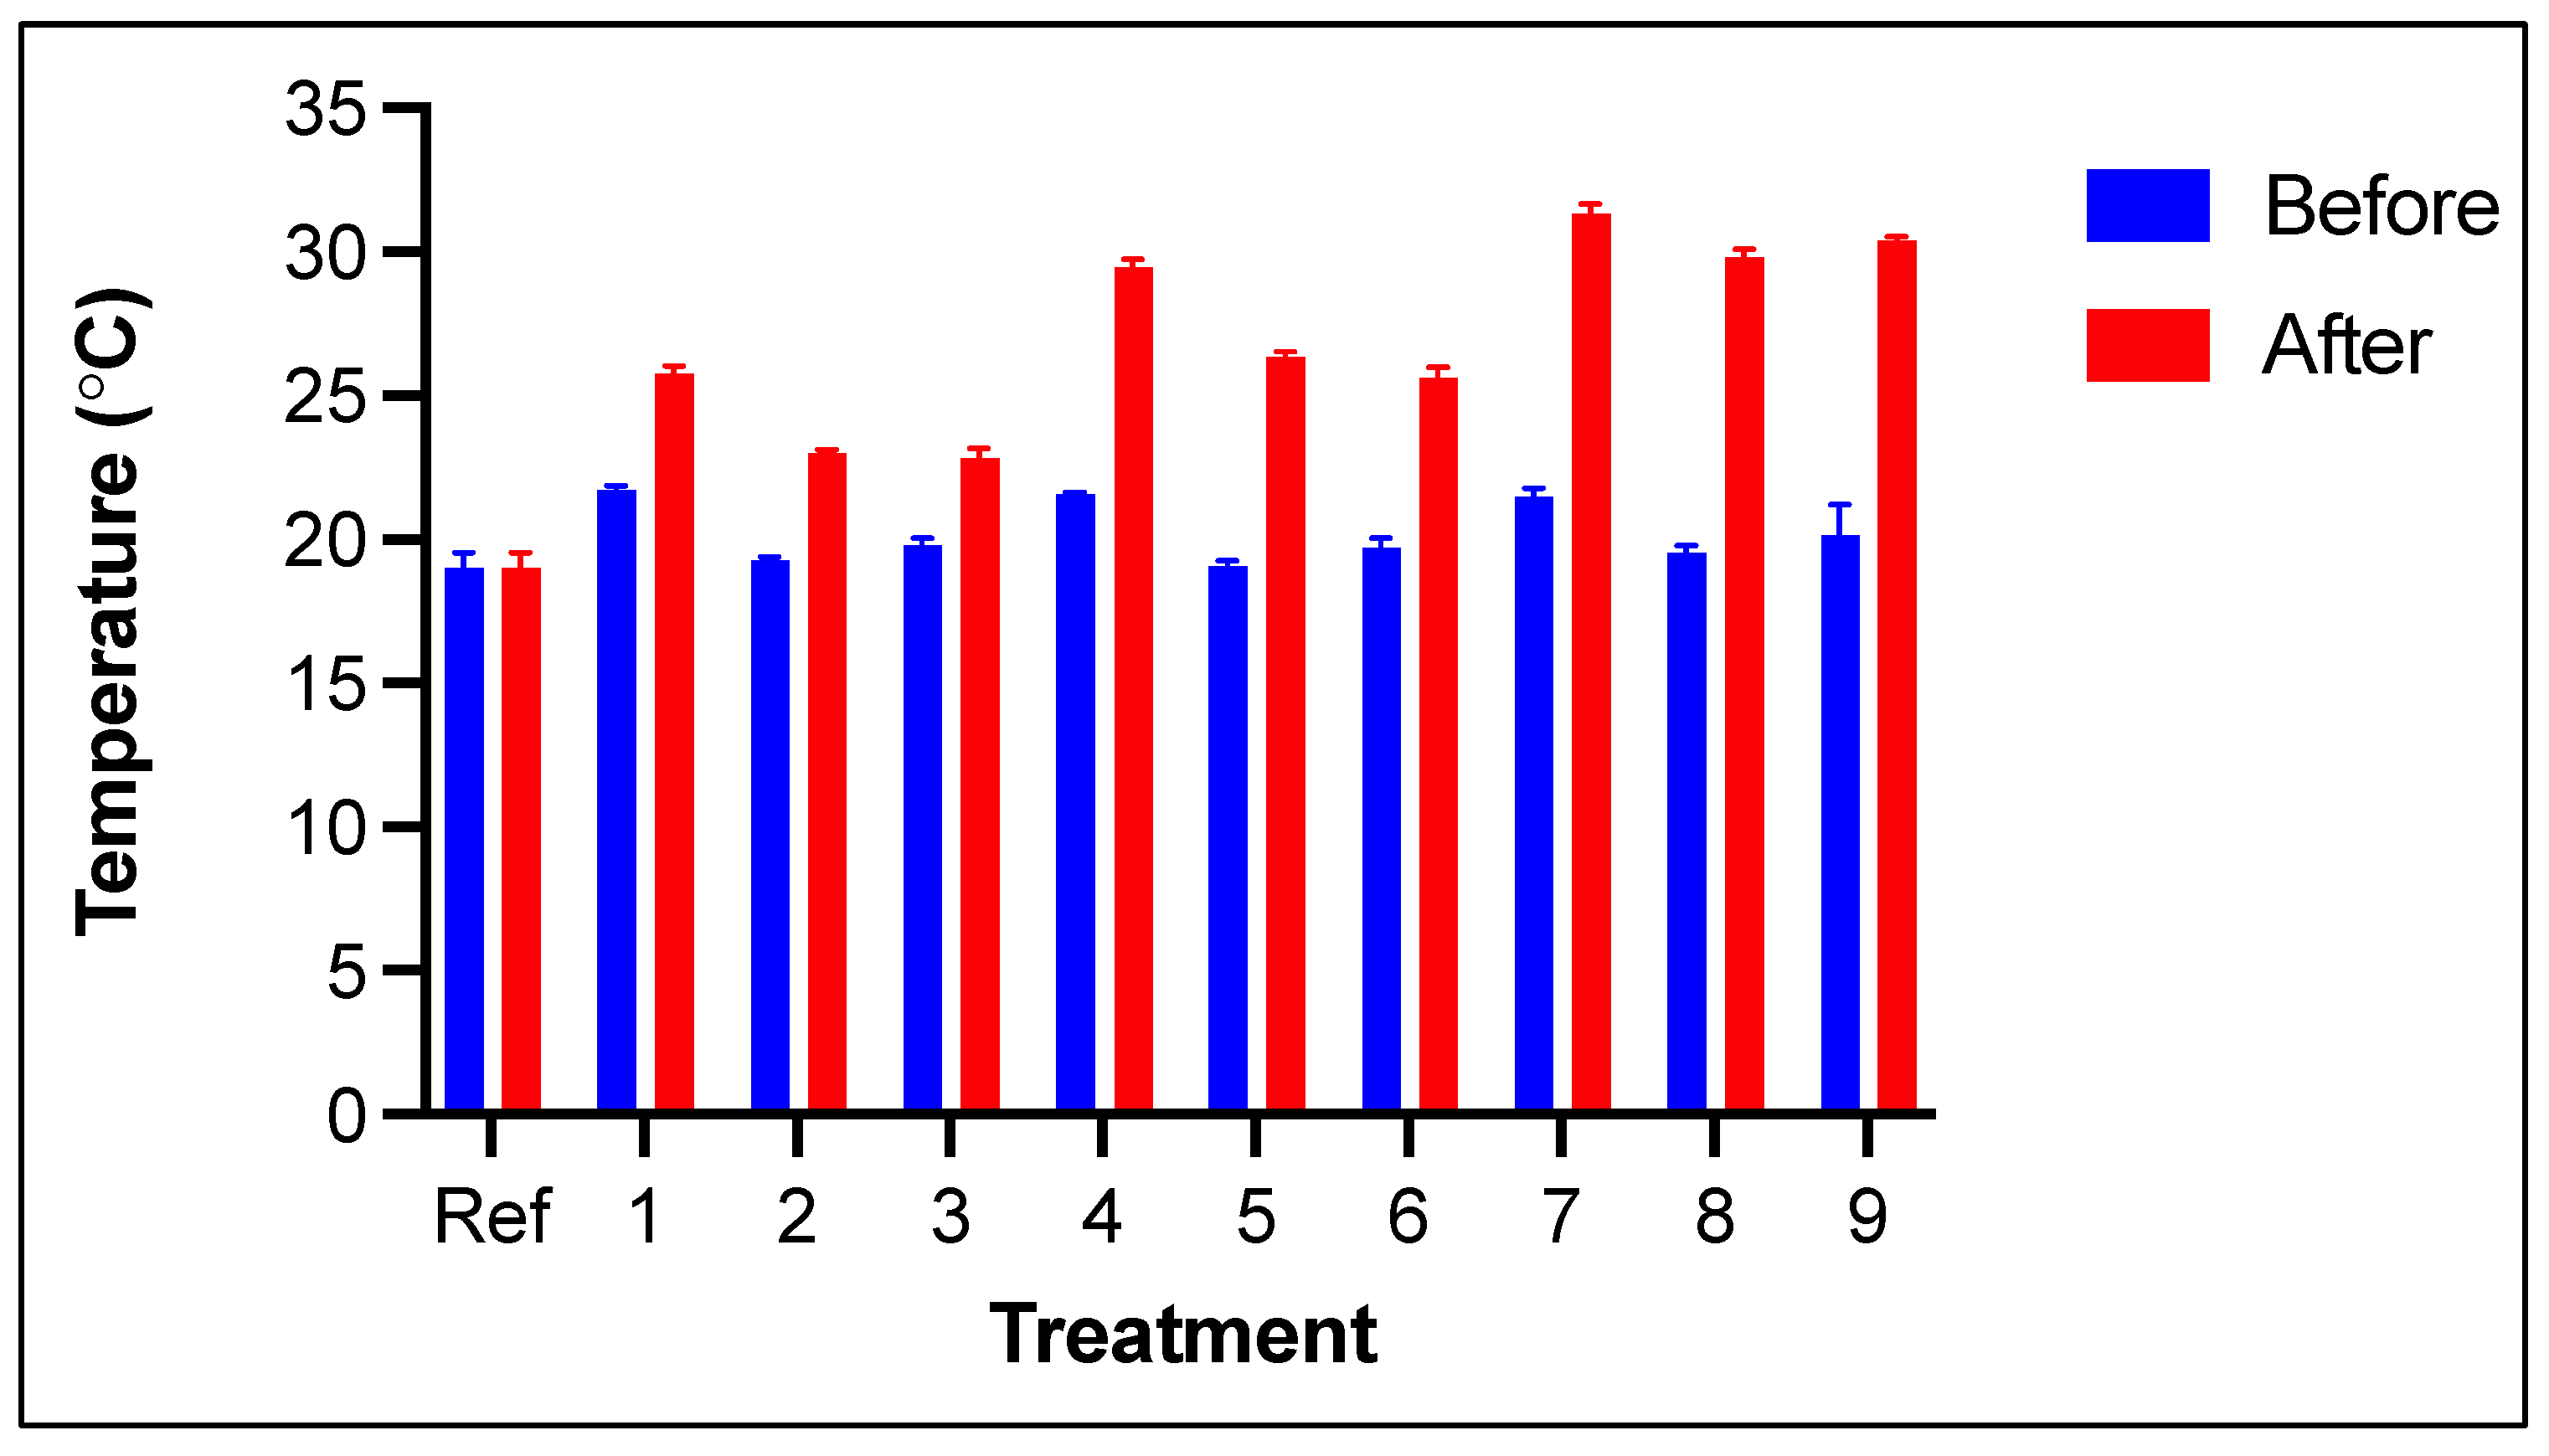
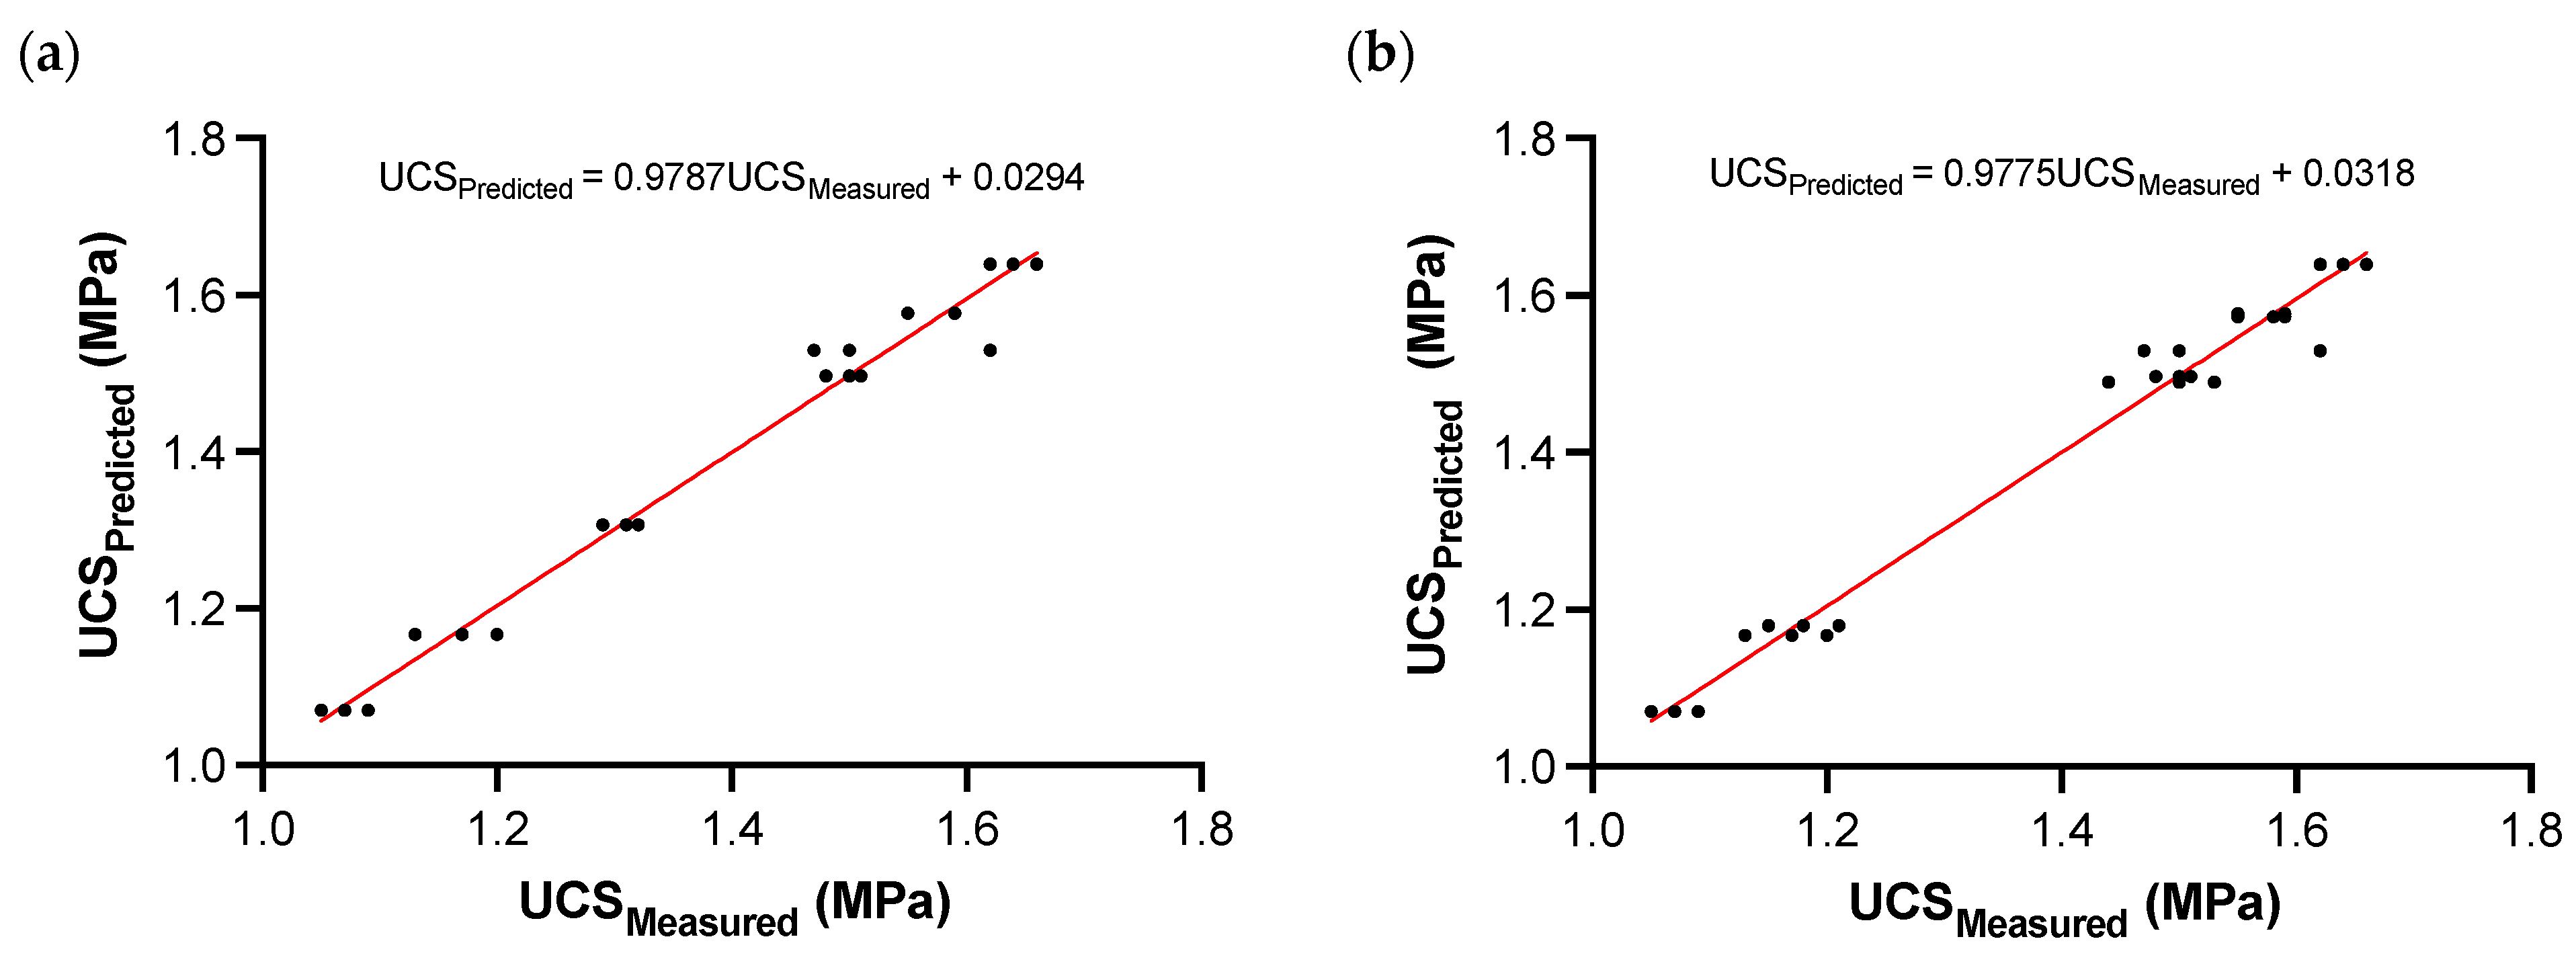
3.1. Effect of Microwave-Assisted Curing on UCS
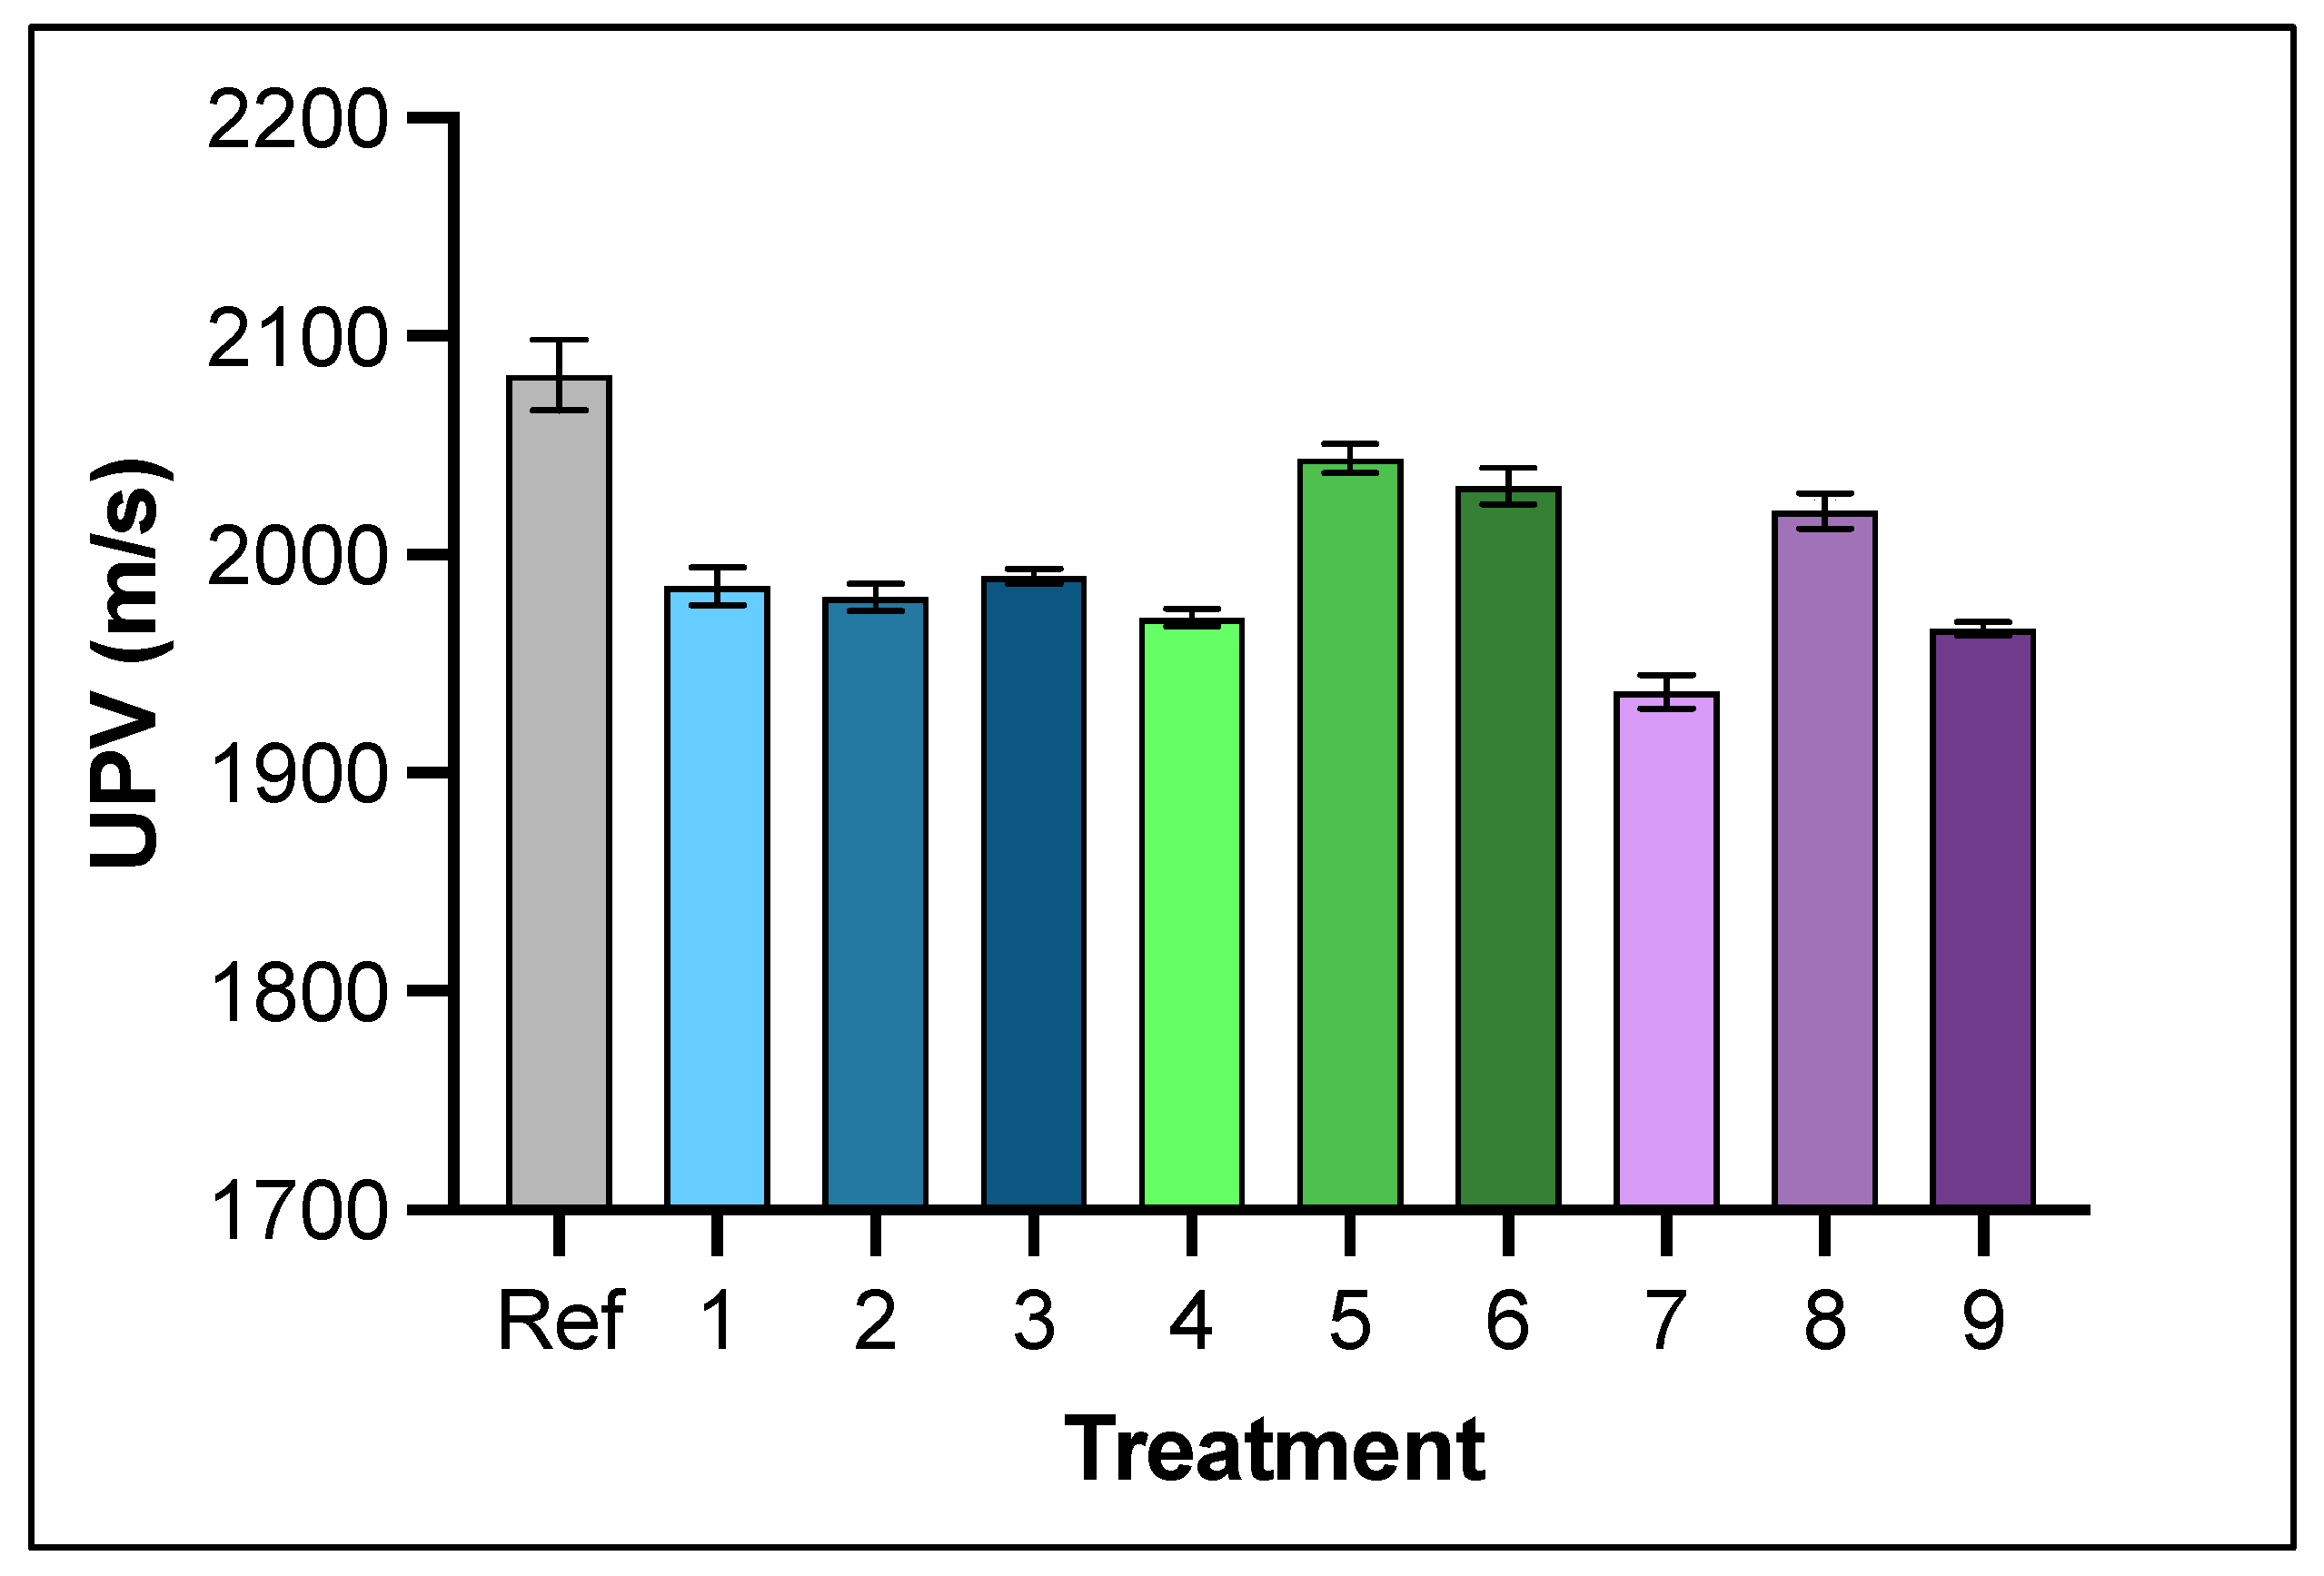
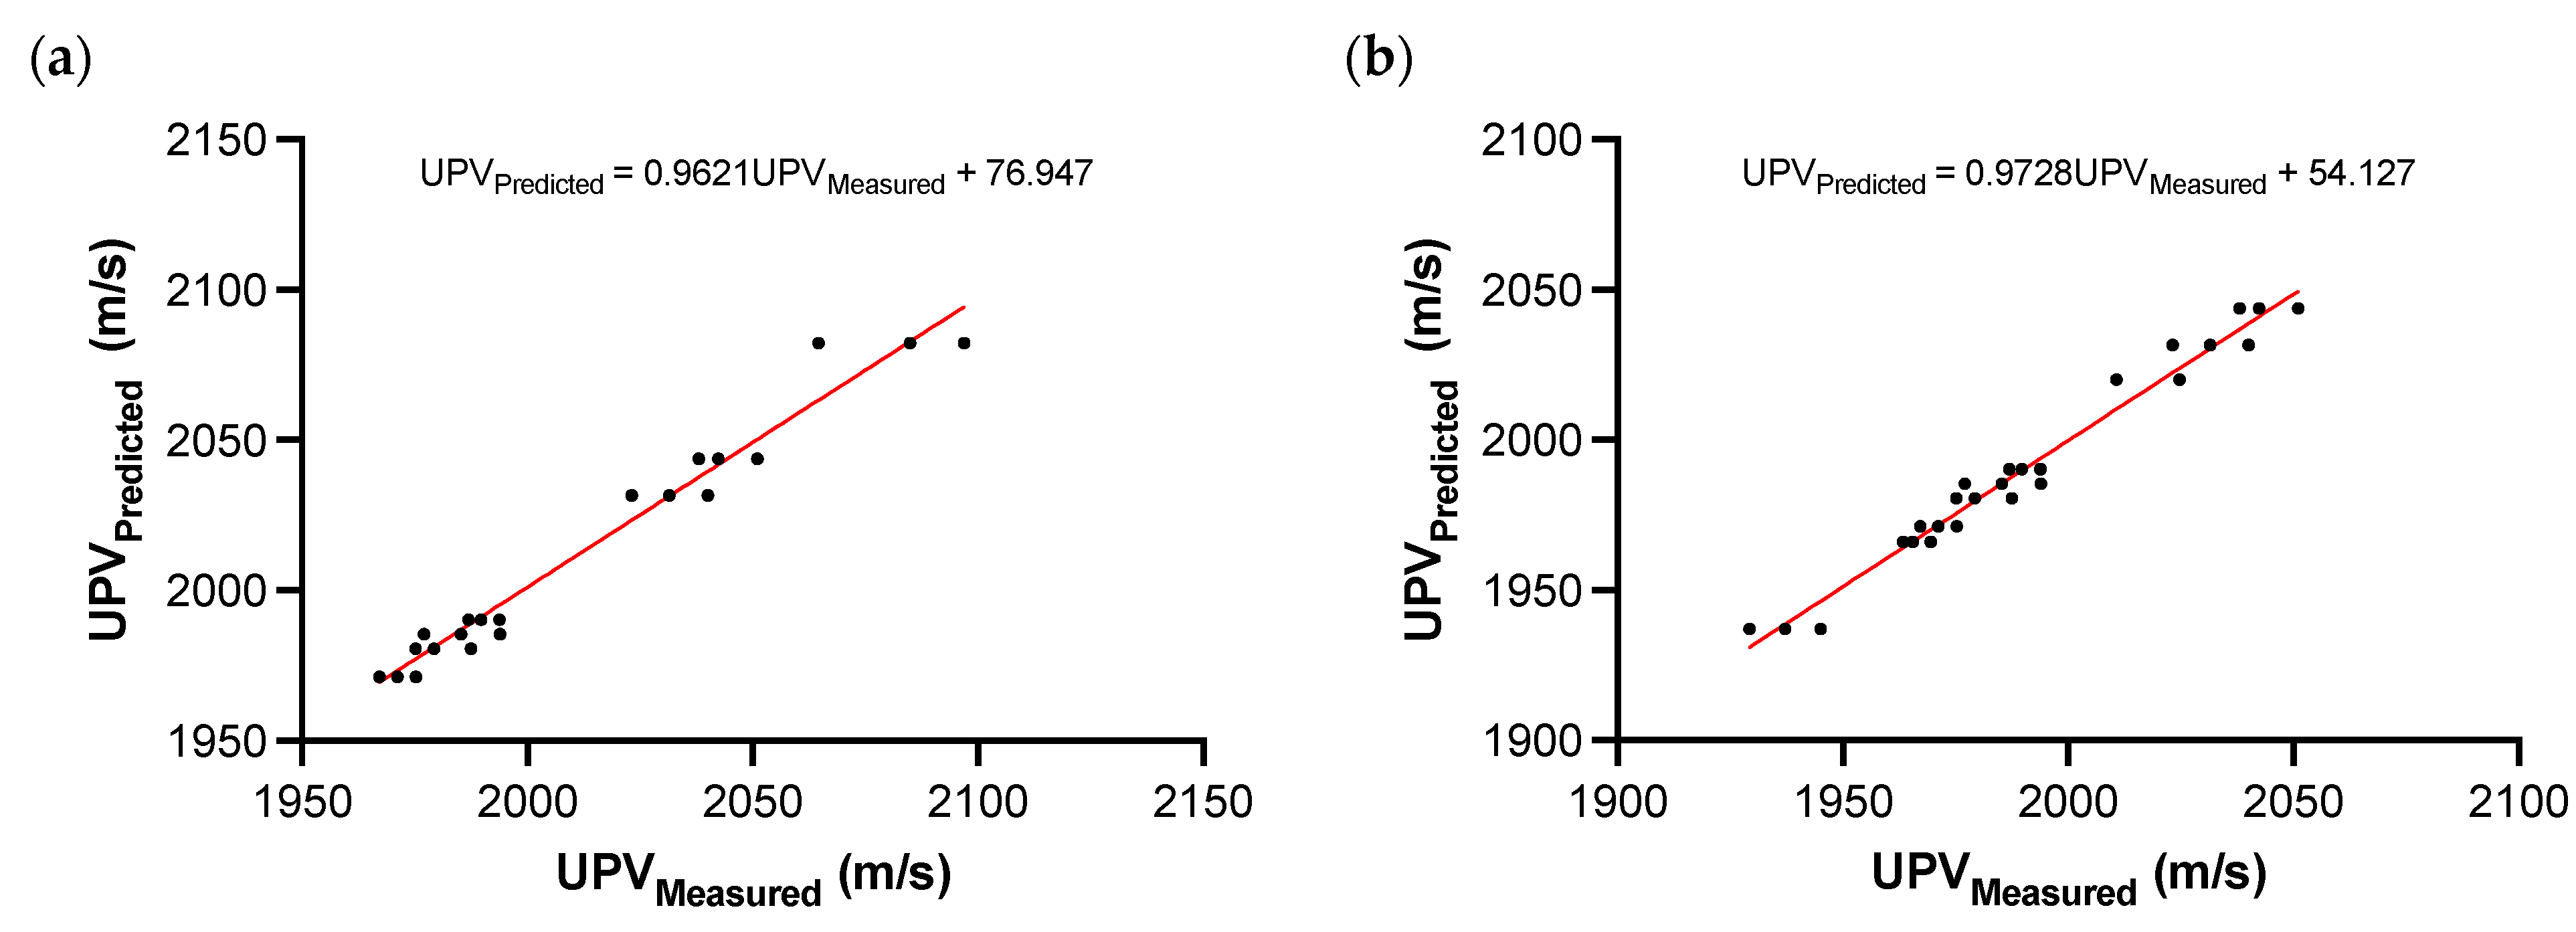
3.2. Effect of Microwave-Assisted Curing on UPV
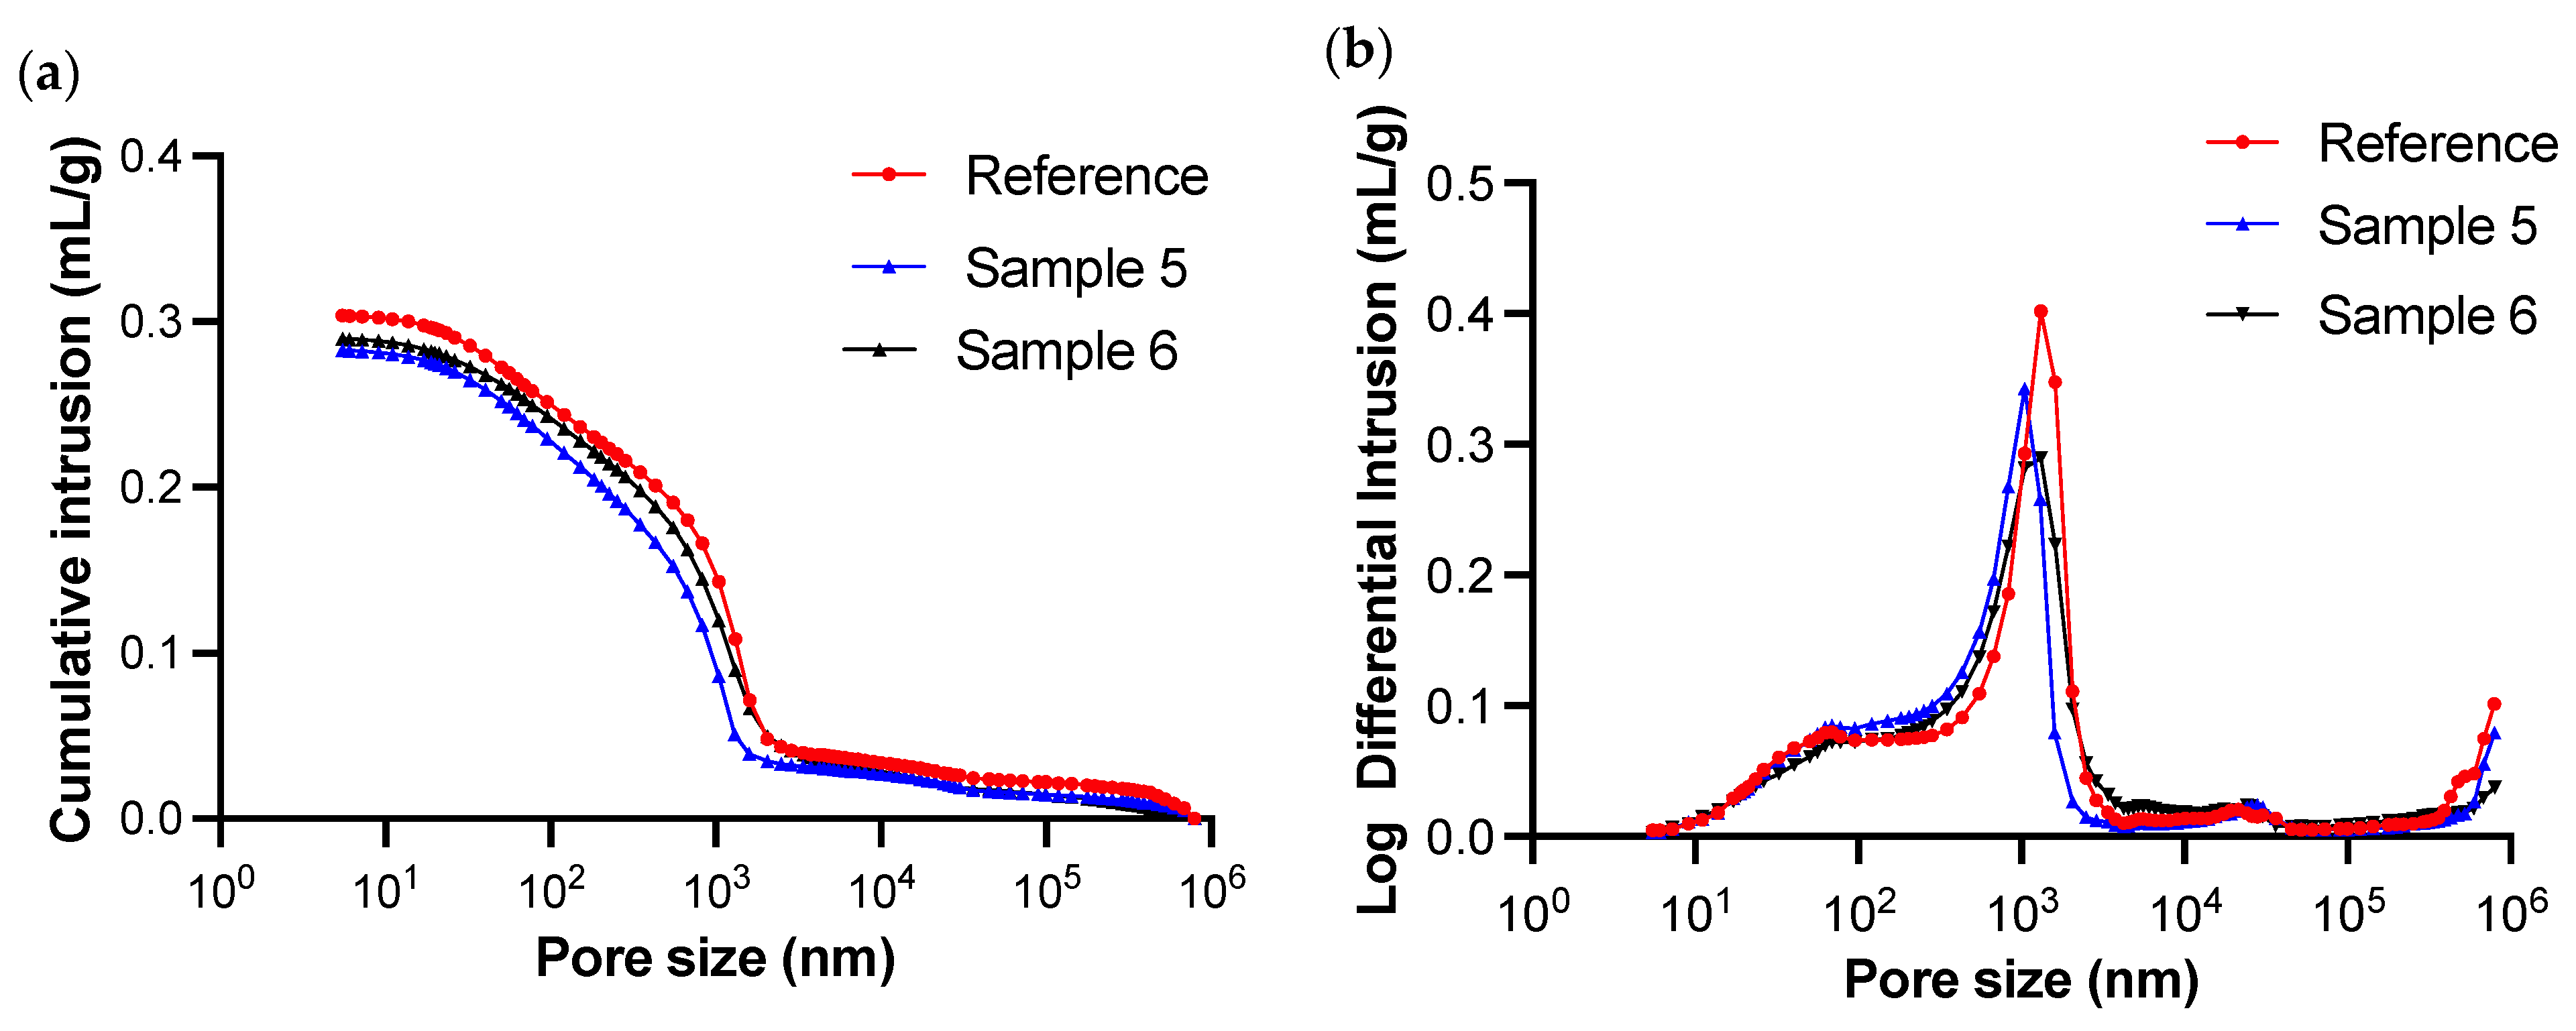
3.3. Effect of Microwave-Assisted Curing on Pore Size Distribution and Porosity
4. Conclusions
Funding
Data Availability Statement
Acknowledgments
Conflicts of Interest
References
- Zhao, Y.; Qiu, J.; Wu, P.; Guo, Z.; Zhang, S.; Sun, X. Preparing a binder for cemented paste backfill using low-aluminum slag and hazardous oil shale residue and the heavy metals immobilization effects. Powder Technol. 2022, 399, 117167. [Google Scholar] [CrossRef]
- Lottermoser, B.; Lottermoser, B.G. Tailings. In Mine Wastes: Characterization, Treatment and Environmental Impacts; Springer: Berlin/Heidelberg, Germany, 2010; pp. 205–241. [Google Scholar]
- Ismail, S.N.; Ramli, A.; Aziz, H.A. Influencing factors on safety culture in mining industry: A systematic literature review approach. Resour. Policy 2021, 74, 102250. [Google Scholar] [CrossRef]
- Zhao, Y.; Qiu, J.; Guo, Z.; Zhang, S.; Wu, P.; Sun, X. Activation the hydration properties of illite-containing tailings to prepare a binder for cemented paste backfill. Constr. Build. Mater. 2022, 318, 125989. [Google Scholar] [CrossRef]
- Haruna, S.; Fall, M. Reactivity of cemented paste backfill containing polycarboxylate-based superplasticizer. Miner. Eng. 2022, 188, 107856. [Google Scholar] [CrossRef]
- Yang, L.; Yilmaz, E.; Li, J.; Liu, H.; Jiang, H. Effect of superplasticizer type and dosage on fluidity and strength behavior of cemented tailings backfill with different solid contents. Constr. Build. Mater. 2018, 187, 290–298. [Google Scholar] [CrossRef]
- Qi, C.; Fourie, A.; Chen, Q. Neural network and particle swarm optimization for predicting the unconfined compressive strength of cemented paste backfill. Constr. Build. Mater. 2018, 159, 473–478. [Google Scholar] [CrossRef]
- Fall, M.; Benzaazoua, M.; Saa, E. Mix proportioning of underground cemented tailings backfill. Tunn. Undergr. Space Technol. 2008, 23, 80–90. [Google Scholar] [CrossRef]
- Orejarena, L.; Fall, M. Mechanical response of a mine composite material to extreme heat. Bull. Eng. Geol. Environ. 2008, 67, 387–396. [Google Scholar] [CrossRef]
- Niu, H.; Hassani, F.P.; Kermani, M.F.; He, M. Rheological and mechanical properties of fibre-reinforced cemented paste and foam backfill. Int. J. Min. Reclam. Environ. 2021, 35, 488–505. [Google Scholar] [CrossRef]
- Fall, M.; Benzaazoua, M.; Ouellet, S. Experimental characterization of the influence of tailings fineness and density on the quality of cemented paste backfill. Miner. Eng. 2005, 18, 41–44. [Google Scholar] [CrossRef]
- Kesimal, A.; Yilmaz, E.; Ercikdi, B. Evaluation of paste backfill mixtures consisting of sulphide-rich mill tailings and varying cement contents. Cem. Concr. Res. 2004, 34, 1817–1822. [Google Scholar] [CrossRef]
- Kesimal, A.; Yilmaz, E.; Ercikdi, B.; Alp, I.; Deveci, H. Effect of properties of tailings and binder on the short-and long-term strength and stability of cemented paste backfill. Mater. Lett. 2005, 59, 3703–3709. [Google Scholar] [CrossRef]
- De Araújo, E.E.B.; Simon, D.; de França, F.A.N.; de Freitas Neto, O.; dos Santos, O.F., Jr. Shear strength of a cemented paste backfill submitted to high confining pressure. Appl. Mech. Mater. 2017, 858, 219–224. [Google Scholar] [CrossRef]
- Yilmaz, E.; Belem, T.; Bussière, B.; Mbonimpa, M.; Benzaazoua, M. Curing time effect on consolidation behaviour of cemented paste backfill containing different cement types and contents. Constr. Build. Mater. 2015, 75, 99–111. [Google Scholar] [CrossRef]
- Ercikdi, B.; Yılmaz, T.; Külekci, G. Strength and ultrasonic properties of cemented paste backfill. Ultrasonics 2014, 54, 195–204. [Google Scholar] [CrossRef]
- Ercikdi, B.; Kesimal, A.; Cihangir, F.; Deveci, H.; Alp, İ. Cemented paste backfill of sulphide-rich tailings: Importance of binder type and dosage. Cem. Concr. Compos. 2009, 31, 268–274. [Google Scholar] [CrossRef]
- Mitchell, R.J.; Stone, D.M. Stability of reinforced cemented backfills. Can. Geotech. J. 1987, 24, 189–197. [Google Scholar] [CrossRef]
- Kermani, M.; Hassani, F.; Aflaki, E.; Benzaazoua, M.; Nokken, M. Evaluation of the effect of sodium silicate addition to mine backfill, Gelfill−Part 1. J. Rock Mech. Geotech. Eng. 2015, 7, 266–272. [Google Scholar] [CrossRef]
- Koohestani, B.; Belem, T.; Koubaa, A.; Bussière, B. Experimental investigation into the compressive strength development of cemented paste backfill containing Nano-silica. Cem. Concr. Compos. 2016, 72, 180–189. [Google Scholar] [CrossRef]
- Mangane, M.B.C.; Argane, R.; Trauchessec, R.; Lecomte, A.; Benzaazoua, M. Influence of superplasticizers on mechanical properties and workability of cemented paste backfill. Miner. Eng. 2018, 116, 3–14. [Google Scholar] [CrossRef]
- Grice, T. Underground mining with backfill. In Proceedings of the 2nd Annual Summit œ Mine Tailings Disposal Systems, Brisbane, QLD, Australia, 24 November 1998; pp. 24–25. [Google Scholar]
- Jiang, H.; Ren, L.; Zhang, Q.; Zheng, J.; Cui, L. Strength and microstructural evolution of alkali-activated slag-based cemented paste backfill: Coupled effects of activator composition and temperature. Powder Technol. 2022, 401, 117322. [Google Scholar] [CrossRef]
- Potvin, Y.; Thomas, E.; Fourie, A. Handbook on Mine Fill; Australian Centre for Geomechanics: Crawley, Australia, 2005; p. 179. [Google Scholar]
- Li, H.; Wu, A.; Wang, H. Evaluation of short-term strength development of cemented backfill with varying sulphide contents and the use of additives. J. Environ. Manag. 2019, 239, 279–286. [Google Scholar] [CrossRef] [PubMed]
- Yilmaz, E.; Yilmaz, E. Sustainability and tailings management in the mining industry: Paste technology. Mugla J. Sci. Technol. 2018, 4, 16–26. [Google Scholar] [CrossRef]
- Srividhya, S.; Vidjeapriya, R.; Neelamegam, M. Enhancing the performance of hyposludge concrete beams using basalt fiber and latex under cyclic loading. Comput. Concr. 2021, 28, 93. [Google Scholar]
- Prakash, R.; Thenmozhi, R.; Raman, S. Mechanical characterisation and flexural performance of eco-friendly concrete produced with fly ash as cement replacement and coconut shell coarse aggregate. Int. J. Environ. Sustain. Dev. 2019, 18, 131–148. [Google Scholar] [CrossRef]
- Prakash, R.; Raman, S.N.; Subramanian, C.; Divyah, N. Eco-friendly fiber-reinforced concretes. In Handbook of Sustainable Concrete and Industrial Waste Management; Elsevier: Amsterdam, The Netherlands, 2022; pp. 109–145. [Google Scholar]
- Peyronnard, O.; Benzaazoua, M. Alternative by-product based binders for cemented mine backfill: Recipes optimisation using Taguchi method. Miner. Eng. 2012, 29, 28–38. [Google Scholar] [CrossRef]
- Ercikdi, B.; Cihangir, F.; Kesimal, A.; Deveci, H.; Alp, İ. Utilization of industrial waste products as pozzolanic material in cemented paste backfill of high sulphide mill tailings. J. Hazard. Mater. 2009, 168, 848–856. [Google Scholar] [CrossRef]
- Niroshan, N.; Sivakugan, N.; Veenstra, R.L. Laboratory study on strength development in cemented paste backfills. J. Mater. Civ. Eng. 2017, 29, 04017027. [Google Scholar] [CrossRef]
- Sivakugan, N.; Rankine, R.; Rankine, K.; Rankine, K. Geotechnical considerations in mine backfilling in Australia. J. Clean. Prod. 2006, 14, 1168–1175. [Google Scholar] [CrossRef]
- Fall, M.; Célestin, J.; Pokharel, M.; Touré, M. A contribution to understanding the effects of curing temperature on the mechanical properties of mine cemented tailings backfill. Eng. Geol. 2010, 114, 397–413. [Google Scholar] [CrossRef]
- Graytee, A.; Sanjayan, J.G.; Nazari, A. Development of a high strength fly ash-based geopolymer in short time by using microwave curing. Ceram. Int. 2018, 44, 8216–8222. [Google Scholar] [CrossRef]
- Chindaprasirt, P.; Rattanasak, U.; Taebuanhuad, S. Role of microwave radiation in curing the fly ash geopolymer. Adv. Powder Technol. 2013, 24, 703–707. [Google Scholar] [CrossRef]
- Tanaka, H.; Fujii, A.; Fujimoto, S.; Tanaka, Y. Microwave-assisted two-step process for the synthesis of a single-phase Na-A zeolite from coal fly ash. Adv. Powder Technol. 2008, 19, 83–94. [Google Scholar] [CrossRef]
- Hutchison, R.; Chang, J.; Jennings, H.M.; Brodwin, M. Thermal acceleration of Portland cement mortars with microwave energy. Cem. Concr. Res. 1991, 21, 795–799. [Google Scholar] [CrossRef]
- Hassani, F.; Nekoovaght, P.M.; Gharib, N. The influence of microwave irradiation on rocks for microwave-assisted underground excavation. J. Rock Mech. Geotech. Eng. 2016, 8, 1–15. [Google Scholar] [CrossRef]
- Wu, D.; Sun, W.; Liu, S.; Qu, C. Effect of microwave heating on thermo-mechanical behavior of cemented tailings backfill. Constr. Build. Mater. 2021, 266, 121180. [Google Scholar] [CrossRef]
- Liu, L.; Miramini, S.; Hajimohammadi, A. Characterising fundamental properties of foam concrete with a non-destructive technique. Nondestruct. Test. Eval. 2019, 34, 54–69. [Google Scholar] [CrossRef]
- Xu, W.; Tian, X.; Wan, C. Prediction of Mechanical Performance of Cemented Paste Backfill by the Electrical Resistivity Measurement; ASTM International: West Conshohocken, PA, USA, 2018. [Google Scholar]
- Xu, S.; Suorineni, F.T.; Li, K.; Li, Y. Evaluation of the strength and ultrasonic properties of foam-cemented paste backfill. Int. J. Min. Reclam. Environ. 2017, 31, 544–557. [Google Scholar] [CrossRef]
- Simon, D.; Grabinsky, M.W. Electromagnetic wave-based measurement techniques to study the role of Portland cement hydration in cemented paste backfill materials. Int. J. Min. Reclam. Environ. 2012, 26, 3–28. [Google Scholar] [CrossRef]
- Xu, W.; Tian, X.; Cao, P. Assessment of hydration process and mechanical properties of cemented paste backfill by electrical resistivity measurement. Nondestruct. Test. Eval. 2018, 33, 198–212. [Google Scholar] [CrossRef]
- Yılmaz, T.; Ercikdi, B. Predicting the uniaxial compressive strength of cemented paste backfill from ultrasonic pulse velocity test. Nondestruct. Test. Eval. 2016, 31, 247–266. [Google Scholar] [CrossRef]
- ASTM C136-06; Standard Test Method for Sieve Analysis of Fine and Coarse Aggregates. ASTM International: West Conshohocken, PA, USA, 2006.
- Jiang, H.; Qi, Z.; Yilmaz, E.; Han, J.; Qiu, J.; Dong, C. Effectiveness of alkali-activated slag as alternative binder on workability and early age compressive strength of cemented paste backfills. Constr. Build. Mater. 2019, 218, 689–700. [Google Scholar] [CrossRef]
- Wu, A.; Wang, Y.; Wang, H.; Yin, S.; Miao, X. Coupled effects of cement type and water quality on the properties of cemented paste backfill. Int. J. Miner. Process. 2015, 143, 65–71. [Google Scholar] [CrossRef]
- ASTM. D2166; Standard Test Method for Unconfined Compressive Strength of Cohesive Soil. ASTM International: West Conshohocken, PA, USA, 2016.
- ASTM. C597; Standard Test Method for Pulse Velocity through Concrete. ASTM International: West Conshohocken, PA, USA, 2016.
- Jiang, H.; Han, J.; Li, Y.; Yilmaz, E.; Sun, Q.; Liu, J. Relationship between ultrasonic pulse velocity and uniaxial compressive strength for cemented paste backfill with alkali-activated slag. Nondestruct. Test. Eval. 2020, 35, 359–377. [Google Scholar] [CrossRef]
- Sari, M.; Yilmaz, E.; Kasap, T.; Karasu, S. Exploring the link between ultrasonic and strength behavior of cementitious mine backfill by considering pore structure. Constr. Build. Mater. 2023, 370, 130588. [Google Scholar] [CrossRef]
- Ma, H. Mercury intrusion porosimetry in concrete technology: Tips in measurement, pore structure parameter acquisition and application. J. Porous Mater. 2014, 21, 207–215. [Google Scholar] [CrossRef]
- Aligizaki, K.K. Pore Structure of Cement-Based Materials: Testing, Interpretation and Requirements; Crc Press: Boca Raton, FL, USA, 2005. [Google Scholar]
- Kong, Y.; Wang, P.; Liu, S.; Gao, Z. Hydration and microstructure of cement-based materials under microwave curing. Constr. Build. Mater. 2016, 114, 831–838. [Google Scholar] [CrossRef]
- Gao, Z.; He, Y.; Li, M.; Jiang, M.; Shen, J. Impacts of microwave on hydration evolution of Portland cement in the perspective of composition and microstructure of hydrates. Constr. Build. Mater. 2022, 360, 129569. [Google Scholar] [CrossRef]
- Yan, G.; Li, J.; Lin, Y.; Chen, X. Difference between Internal and External Hydration of Hardened Cement Paste under Microwave Curing. Adv. Mater. Sci. Eng. 2021, 2021, 3307325. [Google Scholar] [CrossRef]
- De Rojas Gómez, M.S.; Rojas, M.F. Natural pozzolans in eco-efficient concrete. In Eco-Efficient Concrete; Elsevier: Amsterdam, The Netherlands, 2013; pp. 83–104. [Google Scholar]
- Yousuf, S.; Shafigh, P.; Ibrahim, Z.; Hashim, H.; Panjehpour, M. Crossover effect in cement-based materials: A review. Appl. Sci. 2019, 9, 2776. [Google Scholar] [CrossRef]
- Candelaria, M.D.E.; Kee, S.-H.; Yee, J.-J.; Lee, J.-W. Effects of saturation levels on the ultrasonic pulse velocities and mechanical properties of concrete. Materials 2020, 14, 152. [Google Scholar] [CrossRef] [PubMed]
- Hewlett, P.; Liska, M. Lea's Chemistry of Cement and Concrete, 4th ed.; Butterworth-Heinemann: Oxford, UK, 2019. [Google Scholar]
- Hassani, F.; Nekoovaght, P. The development of microwave assisted machineries to break hard rocks. In Proceedings of the 28th International Symposium on Automation and Robotics in Construction (ISARC), Seoul, Republic of Korea, 29 June–2 July 2011; pp. 678–684. [Google Scholar]


| Specific Gravity (g/cm3) | D10(1) (μm) | D30(1) (μm) | D50(1) (μm) | D60(1) (μm) | D90(1) (μm) | Cu (2) | Cc (3) | Color |
|---|---|---|---|---|---|---|---|---|
| 2.80 | 3.85 | 17.59 | 35.82 | 48.23 | 120.69 | 12.53 | 1.67 | Gray |
| Compound | SiO2 | Al2O3 | CaO | MgO | Fe2O3 | Na2O | Cr2O3 | MnO | TiO2 |
|---|---|---|---|---|---|---|---|---|---|
| Concentration (%) | 45.85 | 19.65 | 12.70 | 10.50 | 5.92 | 1.18 | 0.17 | 0.10 | 0.10 |
| Compound | K2O | Ni | Zn | V2O5 | P2O5 | Co | Cu | Pb | |
| Concentration (%) | 0.09 | 0.04 | 0.03 | 0.01 | 0.01 | <0.01 | <0.01 | <0.01 |
| Compound | CaO | SiO2 | Al2O3 | MgO | Fe2O3 | SO3 | Na2O | K2O | Cl |
|---|---|---|---|---|---|---|---|---|---|
| Concentration (%) | 62.53 | 20.03 | 4.61 | 4.28 | 3.74 | 2.40 | 0.20 | 0.17 | 0.015 |
| Parameter | pH | Temperature (°C) | Color | Turbidity (NTU) | Total Solids (mg/L) | Conductivity (μS/cm) | Alkalinity (mg/L CaCO3) | Hardness (mg/L CaCO3) |
|---|---|---|---|---|---|---|---|---|
| Value | 7.4 | 24 | colorless | 0.16 | 146 | 306 | 93 | 123 |
| Treatment | Microwave Treatment Time (min) | Curing Age (days) | No. Samples Tested with MIP |
|---|---|---|---|
| Reference | 0 | 7 | 1 |
| 1 | 4 | 3 | - |
| 2 | 4 | 5 | - |
| 3 | 4 | 7 | - |
| 4 | 8 | 3 | - |
| 5 | 8 | 5 | 1 |
| 6 | 8 | 7 | 1 |
| 7 | 12 | 3 | - |
| 8 | 12 | 5 | - |
| 9 | 12 | 7 | - |
| Design | Factor | Level 1 (−1) | Level 2 (0) | Level 3 (+1) |
|---|---|---|---|---|
| 1 | Microwave treatment time (min) | 0 | 4 | 8 |
| Curing age when treated (days) | 3 | 5 | 7 | |
| 2 | Microwave treatment time (min) | 4 | 8 | 12 |
| Curing age when treated (days) | 3 | 5 | 7 |
| Treatment | Unconfined Compressive Strength (MPa) | ||||
|---|---|---|---|---|---|
| Sample 1 | Sample 2 | Sample 3 | Mean | Standard Deviation | |
| Reference | 1.29 | 1.31 | 1.32 | 1.31 | 0.02 |
| 1 | 1.07 | 1.09 | 1.05 | 1.07 | 0.02 |
| 2 | 1.47 | 1.52 | 1.62 | 1.54 | 0.08 |
| 3 | 1.55 | 1.59 | 1.59 | 1.58 | 0.02 |
| 4 | 1.17 | 1.20 | 1.13 | 1.17 | 0.04 |
| 5 | 1.48 | 1.50 | 1.51 | 1.50 | 0.02 |
| 6 | 1.64 | 1.62 | 1.66 | 1.64 | 0.02 |
| 7 | 1.18 | 1.15 | 1.21 | 1.18 | 0.03 |
| 8 | 1.59 | 1.55 | 1.58 | 1.57 | 0.02 |
| 9 | 1.53 | 1.50 | 1.44 | 1.49 | 0.05 |
| Source | LogWorth | p-Value | |
|---|---|---|---|
| CA (days) | 13.102 |  | <0.00001 |
| CA (days) × MT (min) | 9.734 |  | <0.00001 |
| MT (min) | 6.206 |  | <0.00001 |
| Source | LogWorth | p Value | |
|---|---|---|---|
| CA (days) | 14.600 |  | <0.00001 |
| CA (Days) × MT (min) | 3.752 |  | 0.00018 |
| MT (min) | 1.086 |  | 0.08201 |
| Treatment | Ultrasonic Pulse Velocity (m/s) | ||||
|---|---|---|---|---|---|
| Sample 1 | Sample 2 | Sample 3 | Mean | Standard Deviation | |
| Reference | 2065 | 2085 | 2097 | 2082 | 16.31 |
| 1 | 1985 | 1977 | 1994 | 1985 | 8.44 |
| 2 | 1975 | 1988 | 1979 | 1981 | 6.29 |
| 3 | 1987 | 1990 | 1994 | 1990 | 3.45 |
| 4 | 1971 | 1967 | 1975 | 1971 | 4.06 |
| 5 | 2051 | 2042 | 2038 | 2044 | 6.63 |
| 6 | 2023 | 2031 | 2040 | 2031 | 8.45 |
| 7 | 1945 | 1929 | 1937 | 1937 | 7.85 |
| 8 | 2011 | 2025 | 2025 | 2020 | 8.08 |
| 9 | 1965 | 1963 | 1969 | 1966 | 3.08 |
| Source | LogWorth | p-Value | |
|---|---|---|---|
| MT (min) | 12.078 |  | <0.00001 |
| CA (days) × MT (min) | 4.503 |  | 0.00003 |
| CA (days) | 3.425 |  | 0.00038 |
| Source | LogWorth | p-Value | |
|---|---|---|---|
| CA (days) | 10.797 |  | <0.00001 |
| MT (min) | 9.522 |  | <0.00001 |
| CA (days) × MT (min) | 8.592 |  | <0.00001 |
Disclaimer/Publisher’s Note: The statements, opinions and data contained in all publications are solely those of the individual author(s) and contributor(s) and not of MDPI and/or the editor(s). MDPI and/or the editor(s) disclaim responsibility for any injury to people or property resulting from any ideas, methods, instructions or products referred to in the content. |
© 2023 by the author. Licensee MDPI, Basel, Switzerland. This article is an open access article distributed under the terms and conditions of the Creative Commons Attribution (CC BY) license (https://creativecommons.org/licenses/by/4.0/).
Share and Cite
Hefni, M.A. Experimental Development of an Innovative Approach to Enhance the Strength of Early Age Cemented Paste Backfill: A Preliminary Investigation of Microwave-Assisted Curing. Minerals 2023, 13, 1392. https://doi.org/10.3390/min13111392
Hefni MA. Experimental Development of an Innovative Approach to Enhance the Strength of Early Age Cemented Paste Backfill: A Preliminary Investigation of Microwave-Assisted Curing. Minerals. 2023; 13(11):1392. https://doi.org/10.3390/min13111392
Chicago/Turabian StyleHefni, Mohammed A. 2023. "Experimental Development of an Innovative Approach to Enhance the Strength of Early Age Cemented Paste Backfill: A Preliminary Investigation of Microwave-Assisted Curing" Minerals 13, no. 11: 1392. https://doi.org/10.3390/min13111392