Article

Grain Size Analyses and Mineral Compositions of Core Sediments in the Western North Pacific Ocean: Implications for the Rare Earth Element and Yttrium Enrichment and Deposition Environment

1
College of Earth Science and Engineering, Shandong University of Science and Technology, Qingdao 266590, China
2
Key Laboratory of Marine Geology and Metallogeny, First Institute of Oceanography, Ministry of Natural Resources, Qingdao 266061, China
3
Laboratory for Marine Geology, Laoshan Laboratory, Qingdao 266237, China
4
Key Laboratory of Deep Sea Mineral Resources Development, Shandong (Preparatory), Qingdao 266061, China
*
Authors to whom correspondence should be addressed.
Minerals 2023, 13(12), 1470; https://doi.org/10.3390/min13121470
Submission received: 13 October 2023 / Revised: 10 November 2023 / Accepted: 14 November 2023 / Published: 22 November 2023
(This article belongs to the Special Issue Geology and Geochemistry of Marine Mineral Resources)

Abstract

:
Rare earth element and Yttrium (REY)-rich deep-sea sediments have been identified as significant potential resources. Although grain size analysis is important for the study of deposition environment and the future exploration of REY, related research is limited. Here, we have investigated the grain size and mineral composition of bulk pelagic sediments from Western North Pacific to indicate the evolutions of deposition environment. Grain size analysis results reveal that silt contents are dominant, and the grain size ranges between 20 and 40 μm and can be an additional grain characteristic indicator for REY-rich sediments. Furthermore, the better sorting coefficient of REY-rich sediments reflects the scouring action of bottom currents, which allows the preservation of coarse-grained bioapatite and the removal of clay fraction particles. ΣREY is negatively correlated with clay fractions but positively correlated with sand and silt fractions for the REY-rich sediments, and this is consistent with the dominant distribution of silt-sized biogenic apatite. In addition, grain size distribution (GSD) varies significantly after HCl treatment in the REY-rich sediment. Therefore, for deep-sea sediments collected below the carbonate compensation depth (CCD), an additional presence of a grain size peak at ~20–40 μm and distinct differences in GSD after HCl treatment can serve as important indicators for REY enrichment sediments.

1. Introduction

Rare earth elements and yttrium (REY) are crucial metallic elements that find widespread application in various fields such as new energy, electronics, and medicine [1,2]. The increasing importance of REY has led to a rise in their demand year after year [3]. Extensive new REY resources in pelagic sediment from the Pacific Ocean were first reported by Kato et al. [4]. Subsequently, several research cruises were conducted to comprehensively understand the distribution of REY-rich sediments in global oceans [5,6,7,8,9,10,11]. Recently, ΣREY concentrations as high as 8000 ppm have been found near Minamitorishima Island with a water depth below the CCD (usually deeper than 5000 m) [12,13], where the dissolution of CaCO3 together with a small supply of diluting materials indirectly leads to the physical enrichment of REY-rich materials in the sediments. Considering the higher exploration costs and the ΣREY values observed in ion adsorption-type rare earth element (REE) ore deposits in Southern China, REY-rich sediments were defined as deep-sea sediments with ΣREY concentrations higher than 700 ppm, while sediments with ΣREY concentrations less than 700 ppm are classified as normal sediments [6]. Previous studies have summarized three factors facilitating the formation of REY-rich sediments, namely, greater seawater depth (below CCD), low sedimentation rate, and strong bottom current activity [14]. The combination of greater seawater depth and low sedimentation rate ensures a reduced supply of diluting materials. Additionally, the presence of strong bottom current activity leads to the removal of fine-grained fractions and the preservation of coarse fractions such as fish debris or biogenic apatite, which have been identified as the main host phases of REY-rich sediments [4,15,16,17]. Thus, it makes the Pacific Ocean preferable for the widespread occurrence of REY-rich muds since a large area of its seafloor is below the CCD compared to Indian and Atlantic Oceans [18].
Previous studies on REY-rich sediments have primarily focused on the geochemistry and characteristics of monominerals, such as bioapatite, Fe/Mn micronodule, and phillipsite [8,13,16,19,20,21,22,23]. REY-rich pelagic sediments are commonly composed of clay, biogenic apatite, Fe/Mn oxyhydroxides, Fe/Mn micronodule, and phillipsite [24]. Biogenic apatite is capable of adsorbing REY from ambient seawater during early diagenesis [9]. However, the incorporation of REY slows down during burial due to the limited input of REY in ambient pore water. This leads to a cessation of REY incorporation at deeper depths [25]. Phillipsite, a common authigenic mineral formed through the alteration of volcanic glass, indicates a relatively slow sedimentation rate [4,21,26,27,28]. It has been verified by Dubinin et al. [29] that phillipsite itself does not accommodate REY in its crystal lattice. However, some REY-rich minerals incorporated in phillipsite aggregates can contribute to the enrichment of REY. Other studies have also focused on the contribution of clay mineral [30,31], Fe/Mn oxyhydroxides [4,32], and Fe/Mn micronodules [33] to the enrichment of REY-rich sediments.
The determination of grain size of host phase (mainly bioapatite) is crucial to industrially explore the REY-rich mud in the future [27]. On the other hand, the grain size of sediments can also reflect the hydrodynamic intensity [27]. Grain size can not only determine the nature and energy conditions of the transport medium, but also clarify the transport mode and sedimentation form to differentiate sediment types. Therefore, the reconstruction of the depositional dynamics and environmental information during sedimentation could provide a basis for the determination of sedimentary facies and depositional environments [34]. However, limited research on granularity characteristic has been reported before [24,35]. Ohta et al. [24] conducted grain analyses on discontinuous REY-rich samples (both from the phillipsite-rich layer and apatite-rich layer) from the Western Pacific Ocean, showing unimodal and bimodal patterns of distribution but lacking other granularity parameter characteristics. Takaya et al. [27] confirmed that most of biogenic apatite grains were distributed in the >20 μm size fraction and provided an easily applicable method to selectively recover the biogenic apatite that could increase REY content in the future exploration study. In addition, Sa et al. [35] analyzed the mean grain size and the components of different grain sizes from almost normal sediments in the Central Pacific Ocean, with a conclusion that clay-sized contents were positively correlated with ΣREY. However, systematic research conducted on the granularity analyses of a sediment core in the Western Pacific Ocean is still limited. In this study, we conducted the granularity analyses of original samples and acidified samples to illustrate the differences in grain size distribution and the major grain range of apatite. Furthermore, we examined the relationship between ΣREY and the contents of different grain sizes. Our results could provide significant implications for the enrichment of REY in the pelagic sediments.

2. Materials and Analytical Methods

2.1. Sediment Samples

Gravity core S027GC27 (161.98 °E, 22.57 °S; 5361 m) was collected from the Markus-Wake Seamounts of Pigiffeta Basin in the Western North Pacific Ocean in 2020. The formation of the Markus-Wake Seamounts can be attributed to a combination of multi-hotspot-derived inter-plate movement, plate movement, and fault activity. These geological processes are associated with the extensive eruption of mantle magma during the Cretaceous period [6,36]. The seamounts migrated northward along with the Pacific Plate after crossing the Equator after Cretaceous [36]. The study area is influenced by the Lower Circumpolar Deep Water (LCDW) mass, which originates from the Southern Pacific Ocean and flows northward towards the North Pacific Ocean. The LCDW is characterized by low temperature, high salinity, and high dissolved oxygen content [37]. The presence of this cold, oxygen-rich, and dense water mass may lead to sediment discontinuity and hiatuses in sedimentation along its northward path [37].
Core S027GC27 was retrieved from a water depth of 5361 m and penetrated the seafloor to a depth of 449 cm with a diameter of 11 cm. This sediment core consists of homogenous brown-to-dark-brown pelagic clay sediment with no visible sand-sized particles. Brown pelagic sediments are barren in calcareous microfossils due to the sampling depth being below the CCD, where calcareous fossils would have dissolved. There is a significant enrichment of fish teeth and fish bone debris found in the lower part of the core (Figure 1). The sediment composition indicates that the pelagic clay was likely deposited at a low sedimentation rate of less than 1 m/myr [38]. A total of 45 samples were collected from the core at intervals of 10 cm and numbered sequentially from top to bottom (from S027GC27 0–2 to S027GC27 445–447). Each sample was divided into two portions, and all subsamples were immediately sealed in clean polyethylene bags and stored at a temperature of 4 °C. The preparation and analysis of the samples were performed at the Key Laboratory of Marine Geology and Metallogeny, First Institute of Oceanography, MNR.

2.2. Grain Size Analysis

The grain size of bulk sediment was determined using a Mastersizer 3000 laser (Malvern, Malvern, UK) diffraction particle size analyzer. The measurement range of the instrument was 0.01–3500 μm. Based on previous discussions, it is believed that calcium phosphate (biogenic apatite) should be the main Ca-based mineral due to the lack of calcium carbonate. Previous studies by Takaya et al. [39] have shown that the extraction rate of phosphorus (P) in REY-rich sediments can reach up to 99% when using dilute hydrochloric acid with concentrations ranging from 0.5 to 3 mol/L at a temperature of 25 °C. To determine the grain size of fish debris, the first treatment involved analyzing the original sample without any reaction with hydrochloric acid, while the second treatment involved dissolving the fish debris in hydrochloric acid. Hence, 90 samples were obtained, with 45 original samples and 45 acidified samples. Prior to the instrument measurement, each bulk sample was treated with hydrogen peroxide (15 mL, 15%) for 24 h at 20 °C, followed by a 2 h incubation in a water bath at 85 °C. This process was repeated twice to ensure the complete removal of all organic matter. The acidified samples were then treated with hydrochloric acid (5 mL, 2 mol/L) for 24 h at 20 °C to ensure the complete removal of any calcareous matter. The residual materials were rinsed with distilled water to minimize the influence of reagents, and any potential sample aggregates were disaggregated using an ultrasonic cleaner for 1 min. Finally, grain size measurements were immediately conducted in deionized and degassed water to avoid any gaseous interference.

2.3. Geochemical Analyses

One portion of the samples was freeze-dried and grounded into a powder of 200 mesh diameter for the geochemical analyses of the bulk sediments. The detailed methods used for analysis were consistent with those outlined by Bi et al. [6].

2.4. Microscopic Observation

A detailed smear-slide analysis of the core was conducted to comprehensively understand the mineral composition. A ~1 mm3 sample aliquot was obtained from each sediment sample and dispersed on a glass slide using Mill-Q water. After drying, the sample was then sealed under a cover glass using an ultraviolet curing resin provided by Norland products, INC, Jamesburg, NJ, USA. Then, mineral compositions were determined under a polarizing microscope.
Furthermore, one portion of the freeze-dried samples was immersed in deionized water for 24 h and subsequently wet sieved in 200 mesh sieves to obtain its coarse fractions (>63 μm). The coarse fractions were then dried at 50 °C for their mineral identification under a binocular microscope.

2.5. X-ray Diffraction Analyses (XRD)

Four samples were selected from each unit (30–32 cm, 190–192 cm, 350–352 cm, and 420–422 cm) and were analyzed using X-ray diffractometer. The bulk sediment samples were freeze-dried and grounded to a powder of less than 200 mesh size. The bulk powders were then ground gently using a pestle into round aluminum sample holders to retain their random particle orientation. The XRD diagrams were obtained using X-ray diffractometer with CuKa radiation using a D/Max 2500PC diffractometer at a voltage of 40 kV and an intensity of 100 mA. Diffraction patterns (2θ) were scanned from 3° to 75°, with a step size of 0.02°.

3. Results

3.1. Mineral Composition
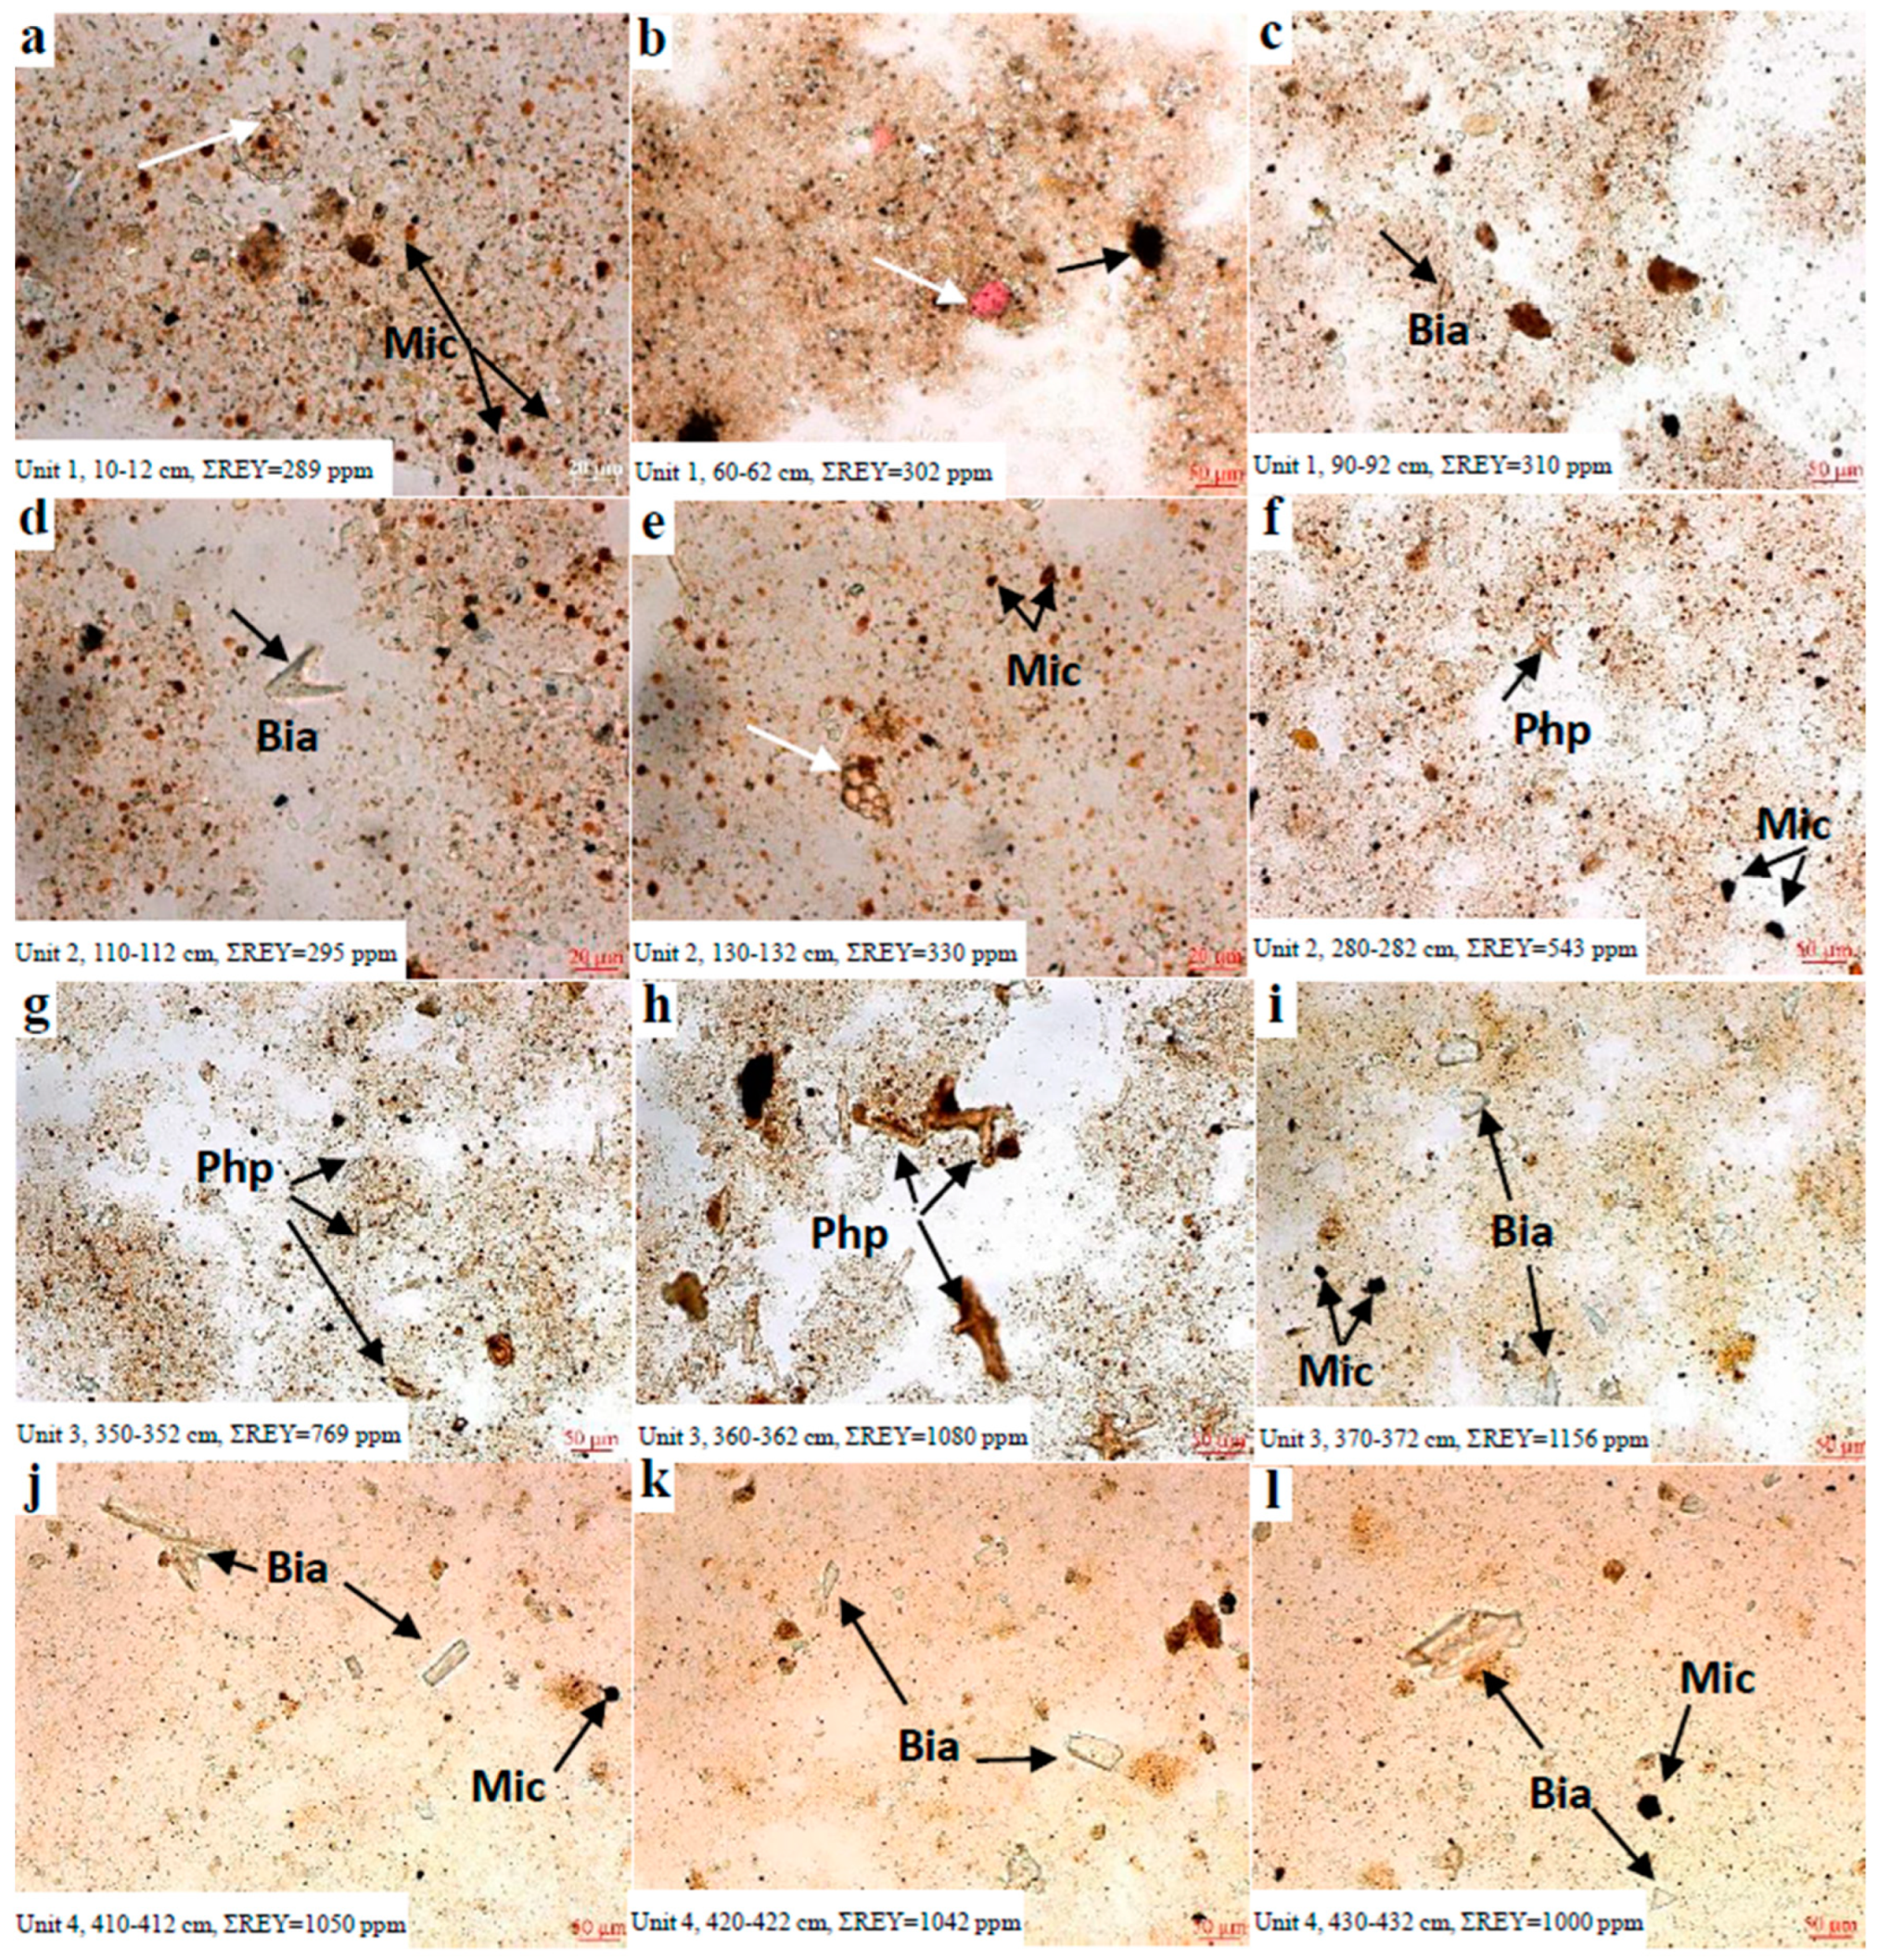
3.1.1. Smear Slides

The smear slides results are shown in Figure 2. It is divided into four units based on the abundance of biogenic components, phil-lipsites, Fe/Mn micronodules, and other rock-forming minerals (such as quartz and feldspar).
  • Unit 1, ranging from the surface to approximately 90 cm (Figure 2a–c), is characterized by dominant clay-sized fractions, with minor biogenic components, rock-forming minerals.
  • Unit 2, ranging from approximately 100 cm to 340 cm (Figure 2d–f), shares similarities with unit 1. It mainly consists of clay-sized fractions and detritus of rock-forming minerals. However, it exhibits an increasing abundance of Fe/Mn micronodules, fish debris, and sporadic occurrences of phillipsite.
  • Unit 3 is phillipsite-rich layers (~350–370 cm) containing large amounts of euhedral phillipsites and moderate amounts of Fe-Mn micronodules and fish debris (Figure 2g–i). The phillipsite grains are relatively large, ranging from approximately 40 to 120 μm. The size of Fe/Mn micronodule grains ranges from approximately 10 to 100 μm.
  • Unit 4, the lower section of the core (~380–449 cm) is extremely rich in fish debris, with minor amounts of Fe/Mn micronodules and phillipsites (Figure 2j–l).

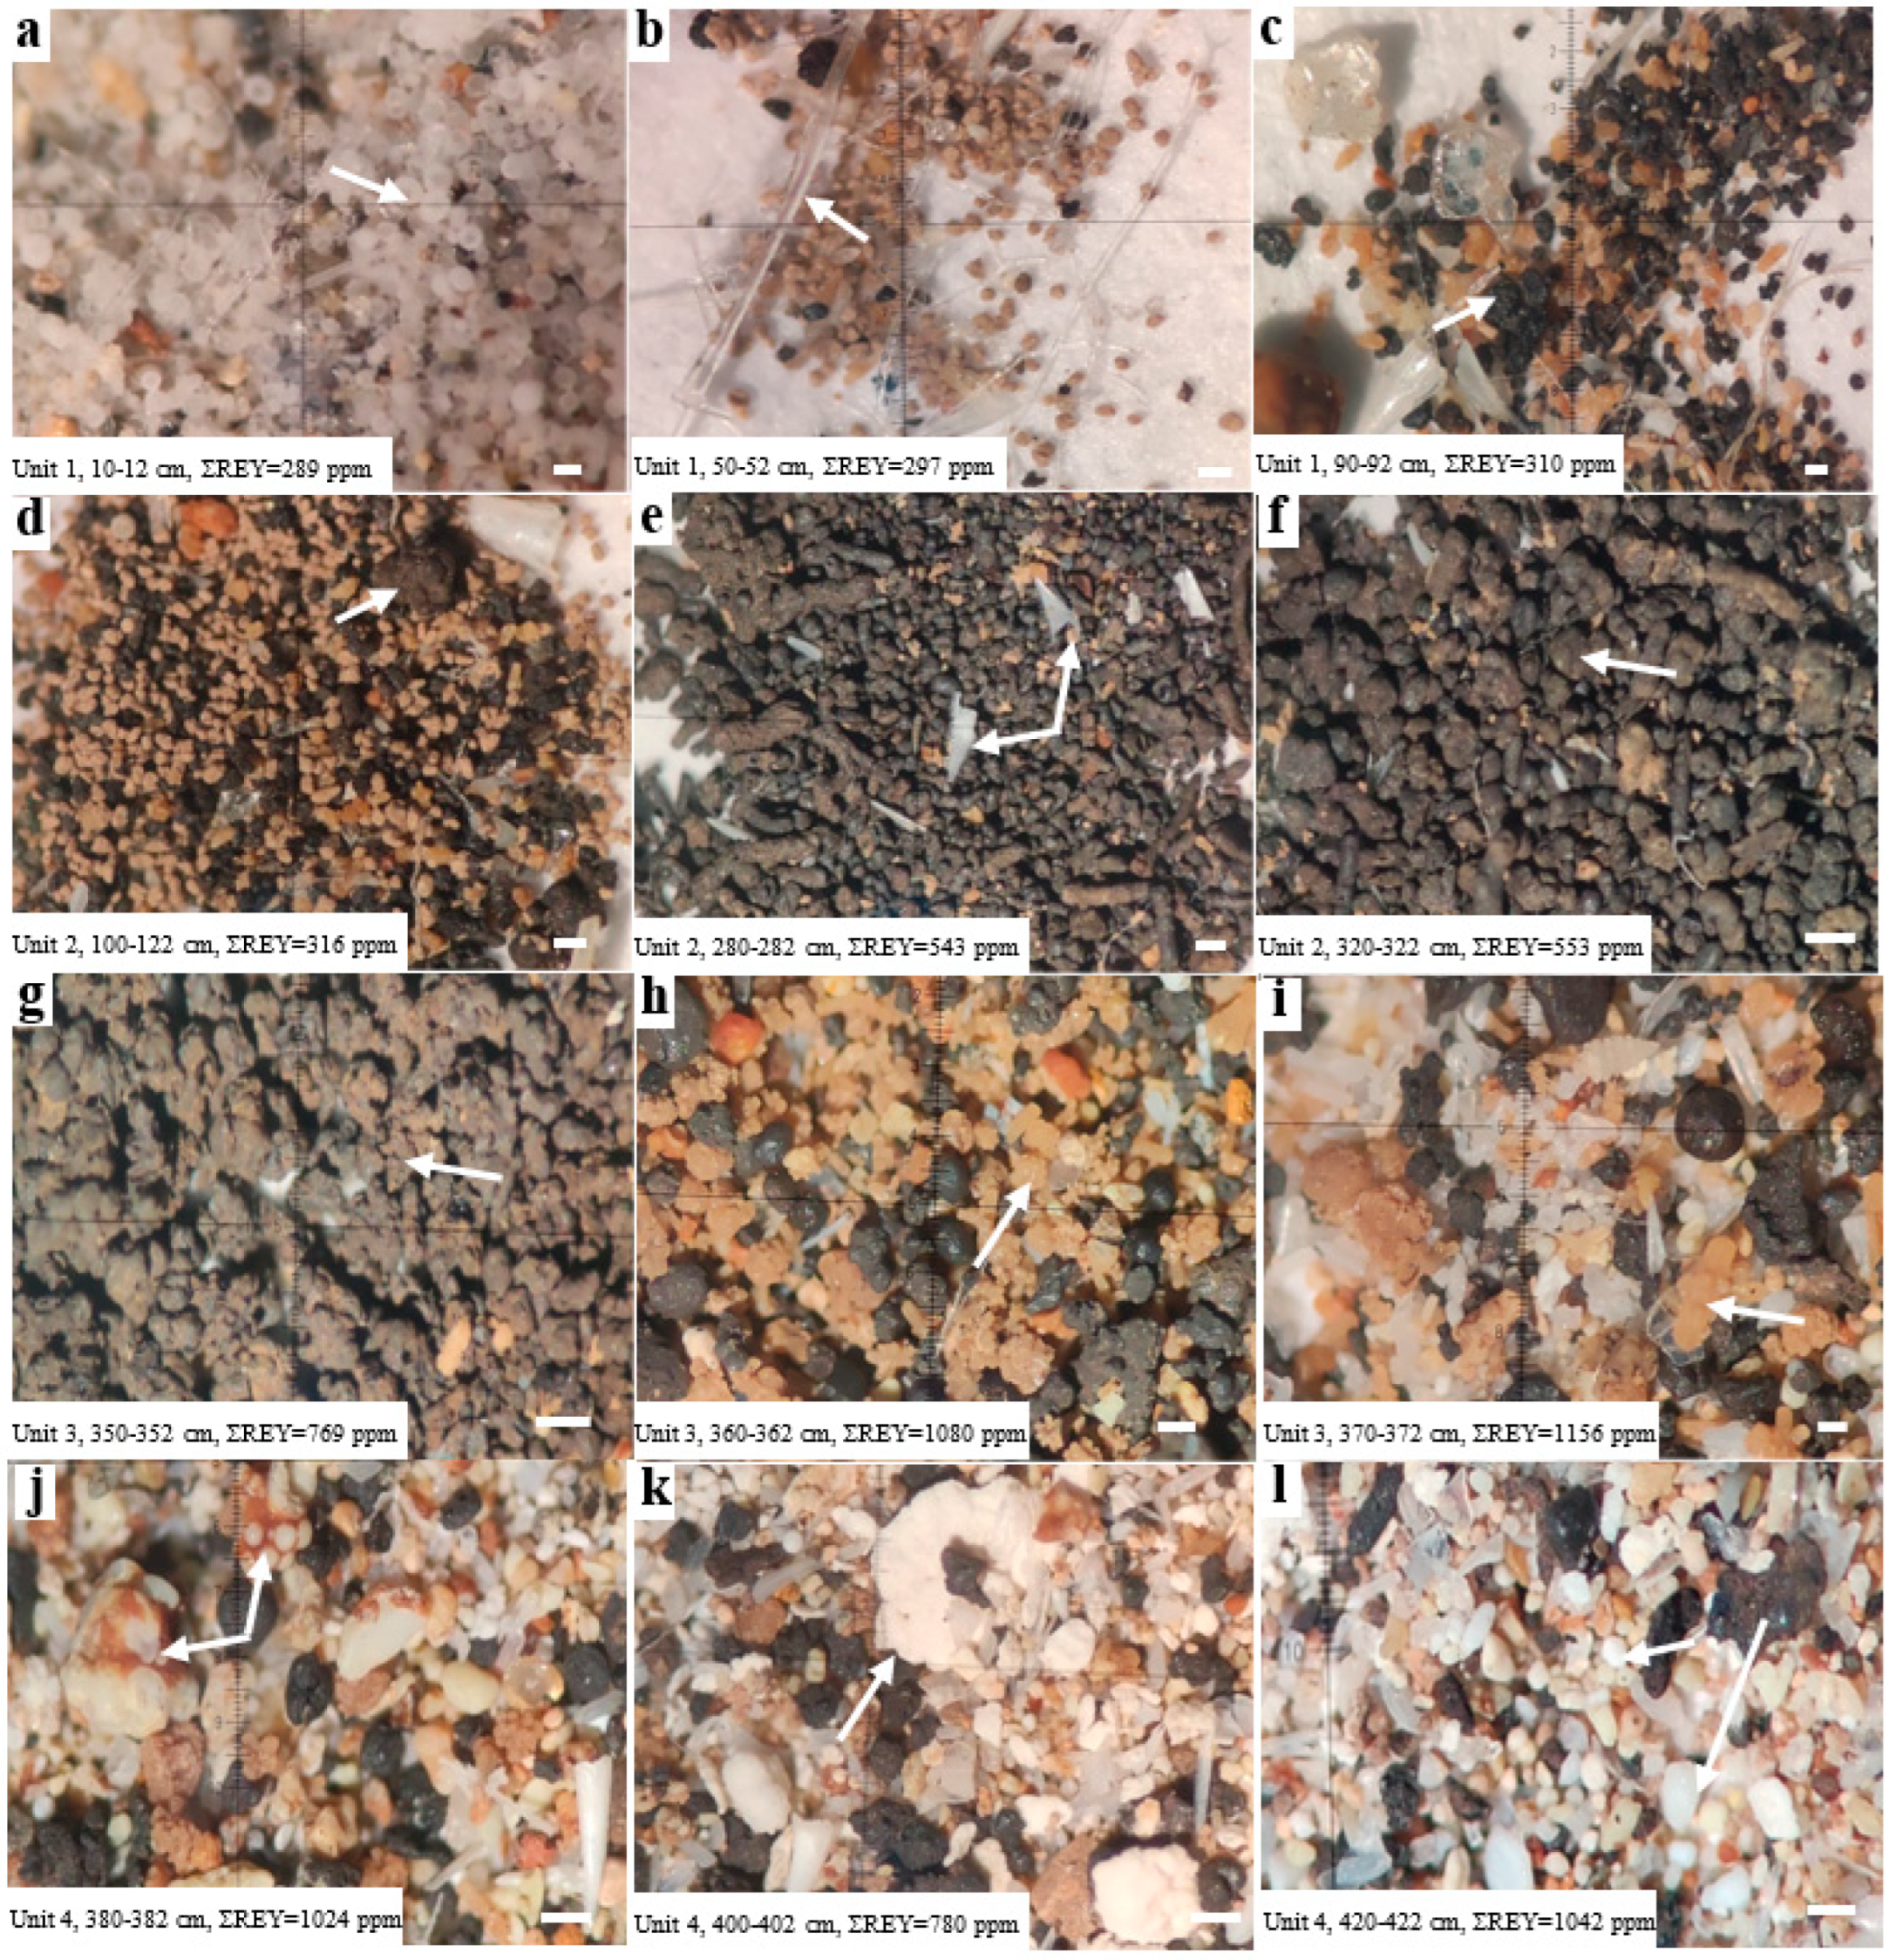
3.1.2. Mineral Components in Coarse Fraction

The binocular observations of coarse fractions (>63 μm) from 45 samples revealed variations in mineral assemblages at different depth layers. The mineral distribution characteristics were similar to those observed in smear slides; thus, the classification characteristics in smear slides were also applicable to this section.
  • In the upper part of unit 1 (~0–20 cm), three samples were mainly composed of biogenic components, such as radiolarians (Figure 3a) and sponge spicules (Figure 3b). Although rock-forming detritus was occasionally scattered, there was hardly any presence of Fe/Mn micronodules in these samples. On the contrary, the lower part of unit 1 (~30–90 cm) is characterized by an increasing abundance of Fe/Mn micronodules and rock-forming detritus and by the absence of biogenic components (Figure 3c). In addition, the sporadic distribution of well-conserved fish teeth and fish bone debris was observed in the lower part of unit 1.
  • In unit 2 (~100–340 cm), the abundance of Fe/Mn micronodules continuously increased, while rock-forming detritus (such as quartz and feldspar) dramatically decreased with depth. The Fe–Mn micronodules commonly exhibited ellipsoidal and sub-spherical shapes with diameters ranging from 100 to 800 μm. Occasionally, warty-like protrusions were developed on their rough surfaces (Figure 3d–f). On the other hand, biogenic components diminished with the increase in phillipsite, with only the sporadic distribution of fish debris among these samples.
  • Unit 3 contained large amounts of phillipsite. Fe–Mn micronodules and phillilpsite are predominant in the coarse fractions. The first layer (~350 cm, Figure 3g) was almost entirely composed of Fe–Mn micronodules with loose crusts. It was determined that almost all micronodules were characterized by sub-parallel growth layers around the nuclei, which usually consisted of detrital minerals such as phillipsite, basalt fragments, or other biological remains [40]. The Fe–Mn micronodules in this unit were strikingly different from those in unit 1 and unit 2, with nuclei mainly composed of phillipsite grains that were either entirely wrapped (data not published yet) or half-wrapped by loose Fe–Mn crust. Hence, Fe–Mn micronodules were dominant, and fish debris and rock-forming detritus were absent in this sample. In contrast, the lower part of this unit (~360–370 cm, Figure 3h,i) was composed of huge amounts of euhedral phillipsites and phillipsite aggregates, with decreased amounts of Fe–Mn micronodules. Interestingly, the amounts of fish debris in the layer at 370 cm (Figure 3i) began to increase compared to all the samples described above.
  • Huge amounts of “white fractions” were widely distributed in unit 4 (~380–449 cm). Beyond fish teeth and bone debris, there was a notable presence of numerous small white spheres (Figure 3l) and large loose flakes (Figure 3k). Notably, both white substances were observed to dissolve upon the addition of hydrochloric acid and showed the characteristic peaks of PO43– with the application of microscopical laser Raman spectroscopy (data not published yet). Additionally, peculiar octopussy leg-shaped substances were discovered within this unit, suggesting their probable biogenic origin (Figure 3j). However, the abundance of Fe–Mn micronodules and phillipsites was significantly reduced within this unit. In summary, the composition of this layer, rich in calcium phosphate, exhibited distinct differences compared to the other units described above.
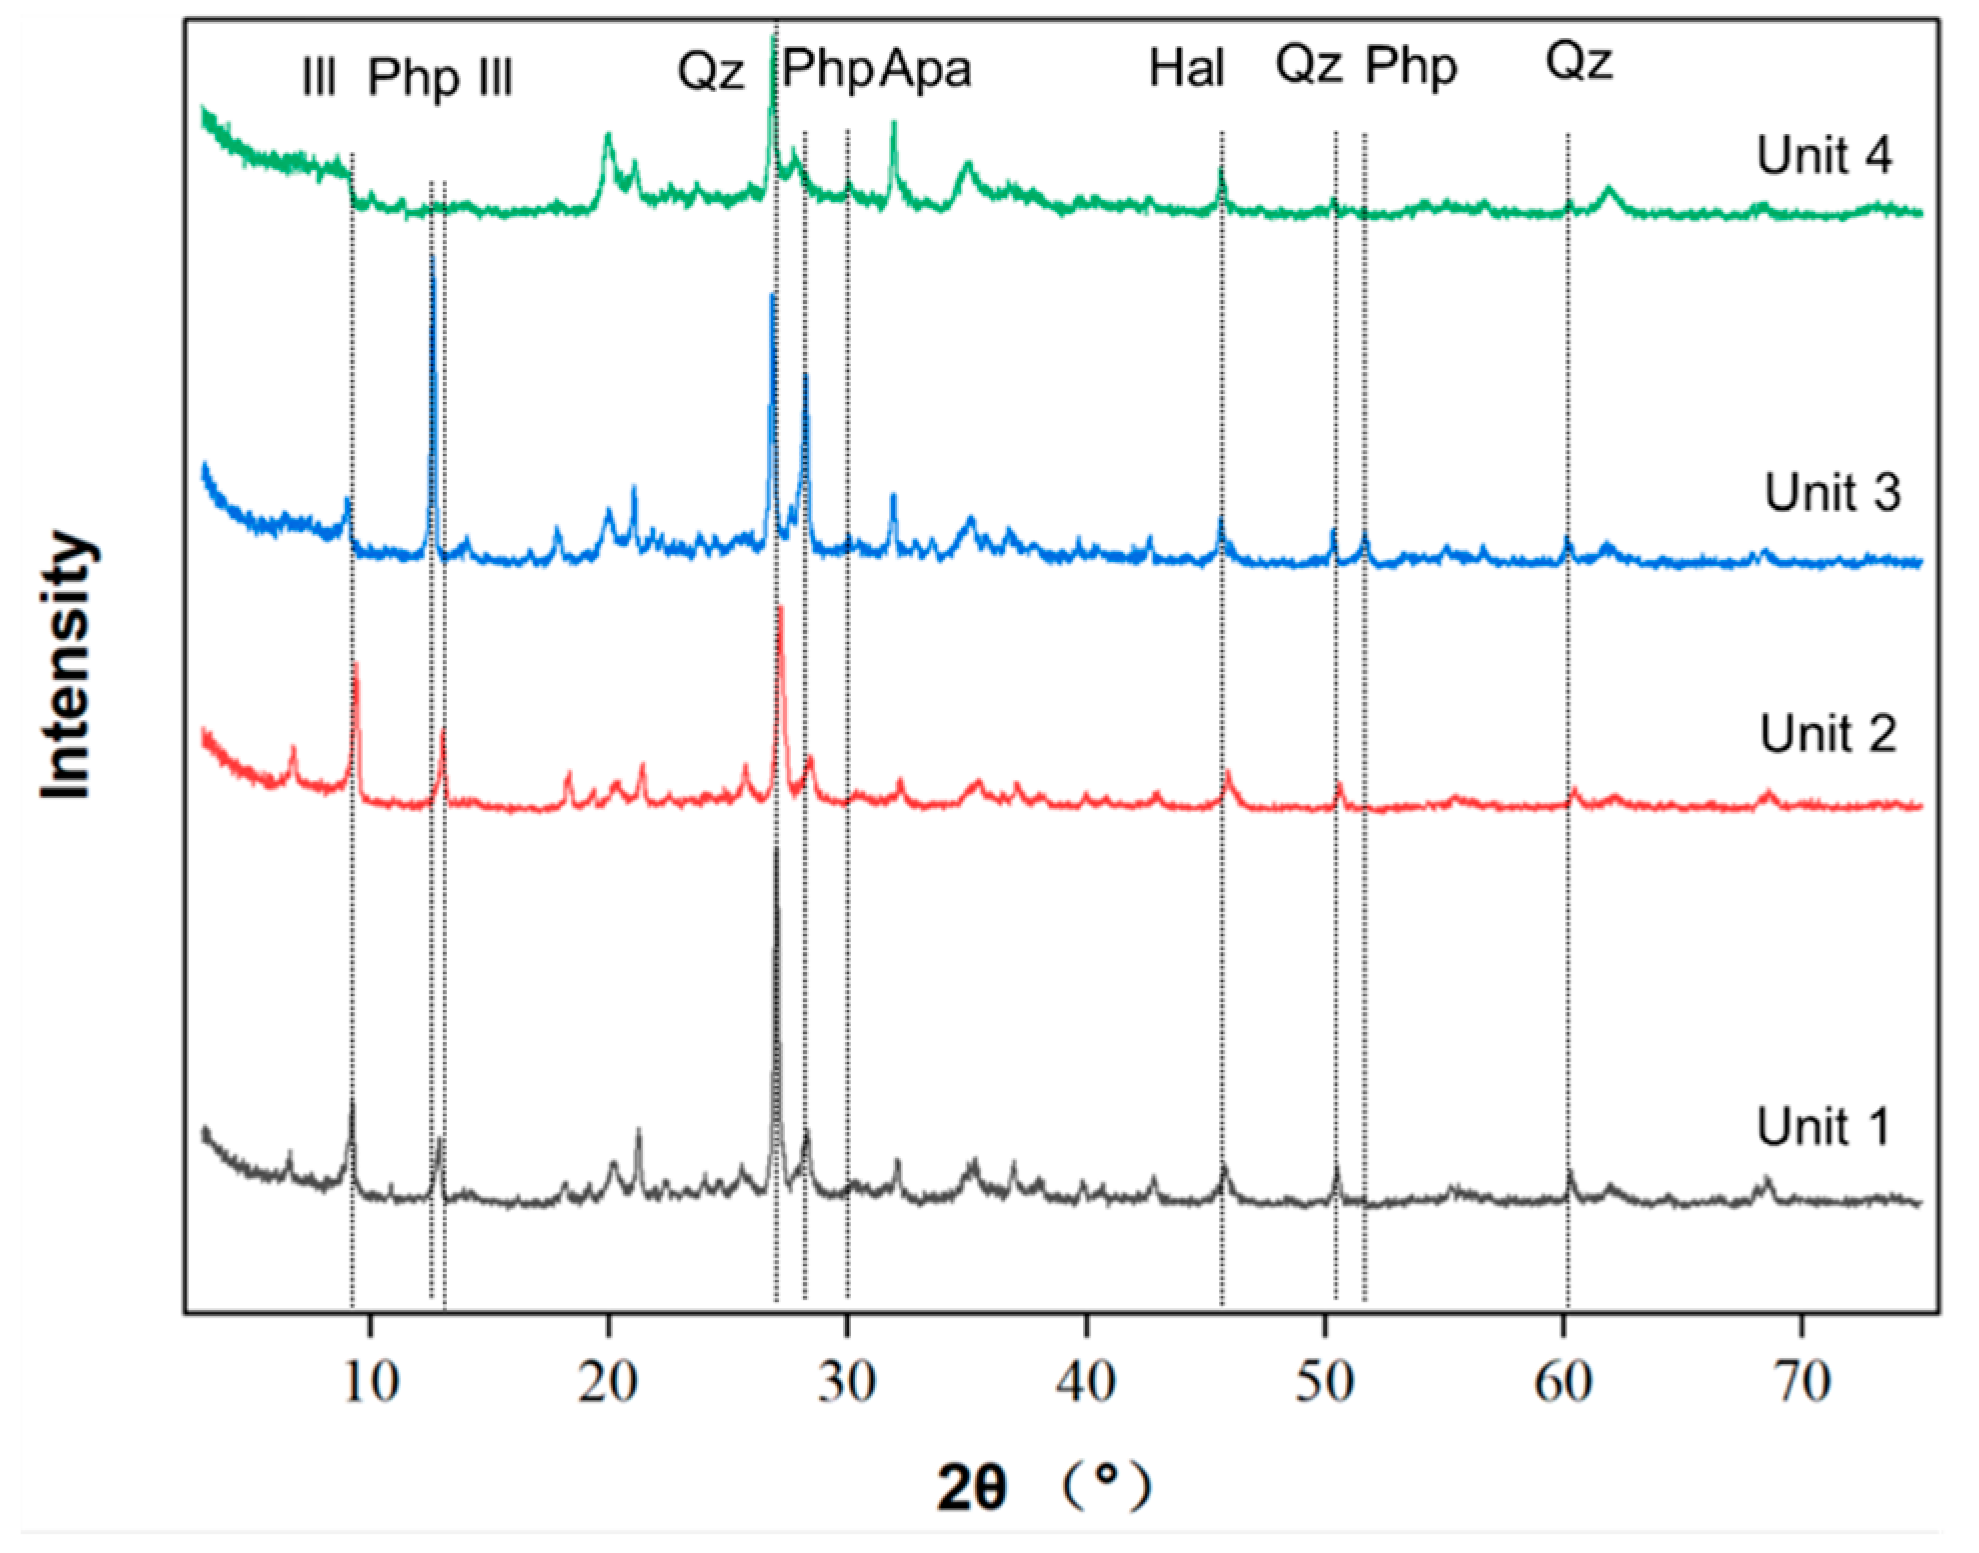
3.1.3. XRD Analysis

The bulk XRD analysis (Figure 4) revealed that unit 1 and unit 2 exhibit similar mineral compositions, primarily consisting of quartz and illite. In contrast, unit 3 is characterized by a significant abundance of phillipsite but with a decrease in quartz and illite. It is noteworthy to mention that apatite peak is present in unit 4, with a further reduction in quartz and illite. In conclusion, unit 1 and unit 2 are mainly composed of quartz and illite, while phillipsite and apatite are strikingly more abundant in unit 3 and unit 4 than those in unit 1 and unit 2.

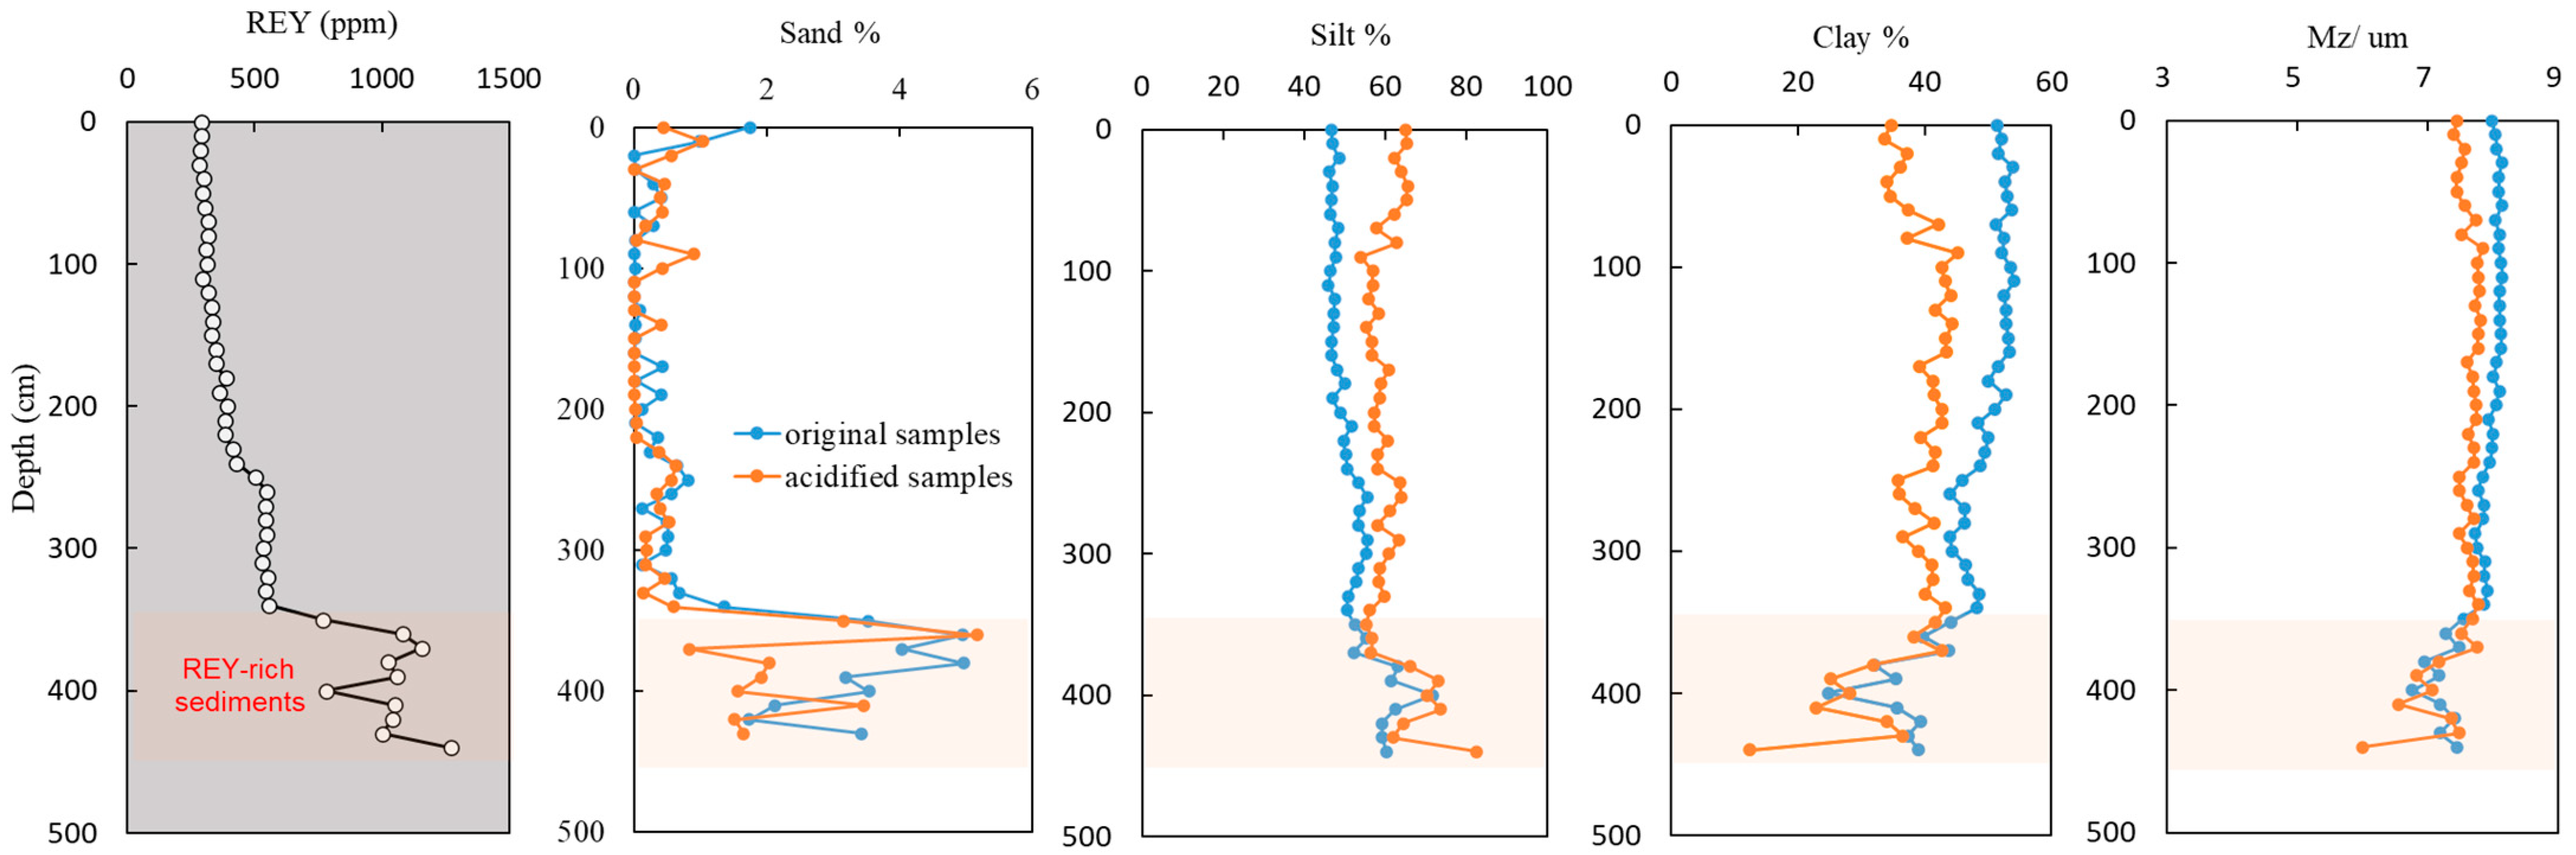
3.2. Grain Size Analyses

3.2.1. Grain Distribution Variation in Original Samples and Acidified Samples

Depth profiles of ΣREY, the percentages of sand, silt, and clay contents, and the mean grain size (Mz) of original samples and acidified samples are shown in Figure 5. Grain size analysis of the original samples reveals that silt and clay fractions are predominant, with no presence of gravels larger than 2000 μm. Furthermore, the grain size variation is minimal. The average contents of sand (63–2000 μm), silt (4–63 μm), and clay (<4 μm) are 0.98%, 51.67%, and 47.34%, respectively. According to Folk’s sediment ternary classification diagram [41], most of samples fall into the mud (M) class except for the sample at 400 cm, which belongs to the silt class. All granularity parameters are calculated using the formulas by Folk and Ward [41].
On the other hand, the addition of HCl leads to a total reduction of the acid-dissolvable calcium phosphate fraction, which is a major component of fish bones and fish detrital. Thus, the acidified samples can reflect the phosphate-free fractions, mainly terrestrial detritus. The average compositions of sand (63–2000 μm), silt (4–63 μm), and clay (<4 μm) are 0.81%, 61.19%, and 38.00%, respectively. According to Folk’s sediment ternary classification diagram [41], most samples belong to M (mud) class except for the five REY-rich samples at 380, 390, 400, 410, and 447 cm, which belong to the silt class.

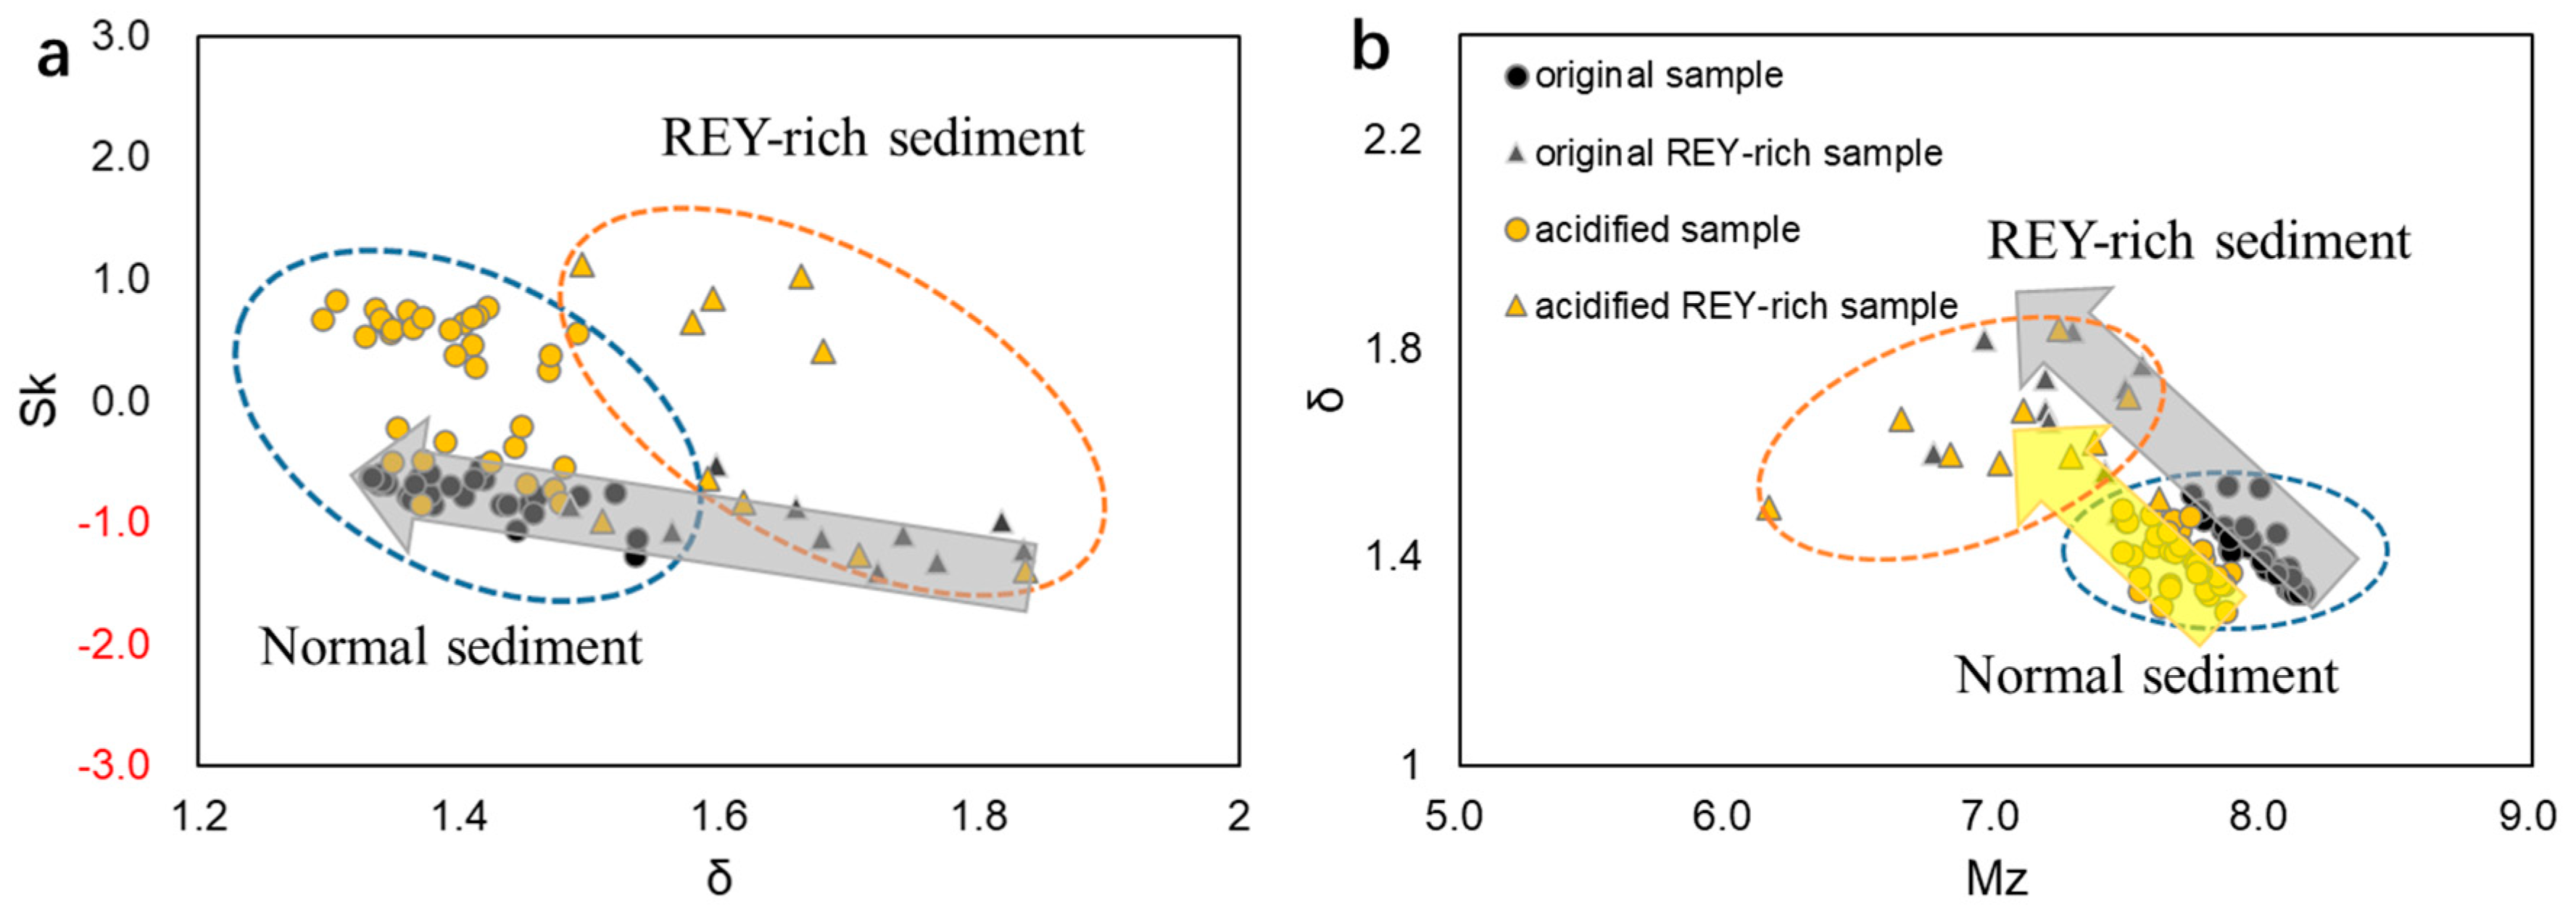
3.2.2. Granularity Structure

The granularity parameter of sediments could partially reflect the deposition environment of sediments. Sorting coefficient is used to determine the degree of uniformity of sediment particles, while skew can reflect the degree of asymmetry of grain size distribution. The original samples show a negative relationship between sorting coefficient (δ) and skew (Sk). However, this negative relationship is not observed in the acidified samples (Figure 6a). The acidified samples show a wider range of skew compared to the original samples, but the sorting coefficient remains similar, with the sorting coefficient ranging between 1.3 and 1.5, as seen in normal sediments. Conversely, REY-rich sediments display a larger sorting coefficient, ranging from 1.5 to 1.9, while the normal sediments only range from 1.3 to 1.6 (Figure 6a). Figure 6b depicts the relationship between the mean grain size (Mz) and sorting coefficient (δ) of REY-rich sediments, demonstrating that the acidified samples have a smaller Mz compared to the original samples, while maintaining a similar degree of sorting. However, REY-rich sediments exhibit both a higher sorting coefficient and a lower Mz than the normal sediments. The variations in sorting coefficient and mean grain size are similar between the original and acidified samples.

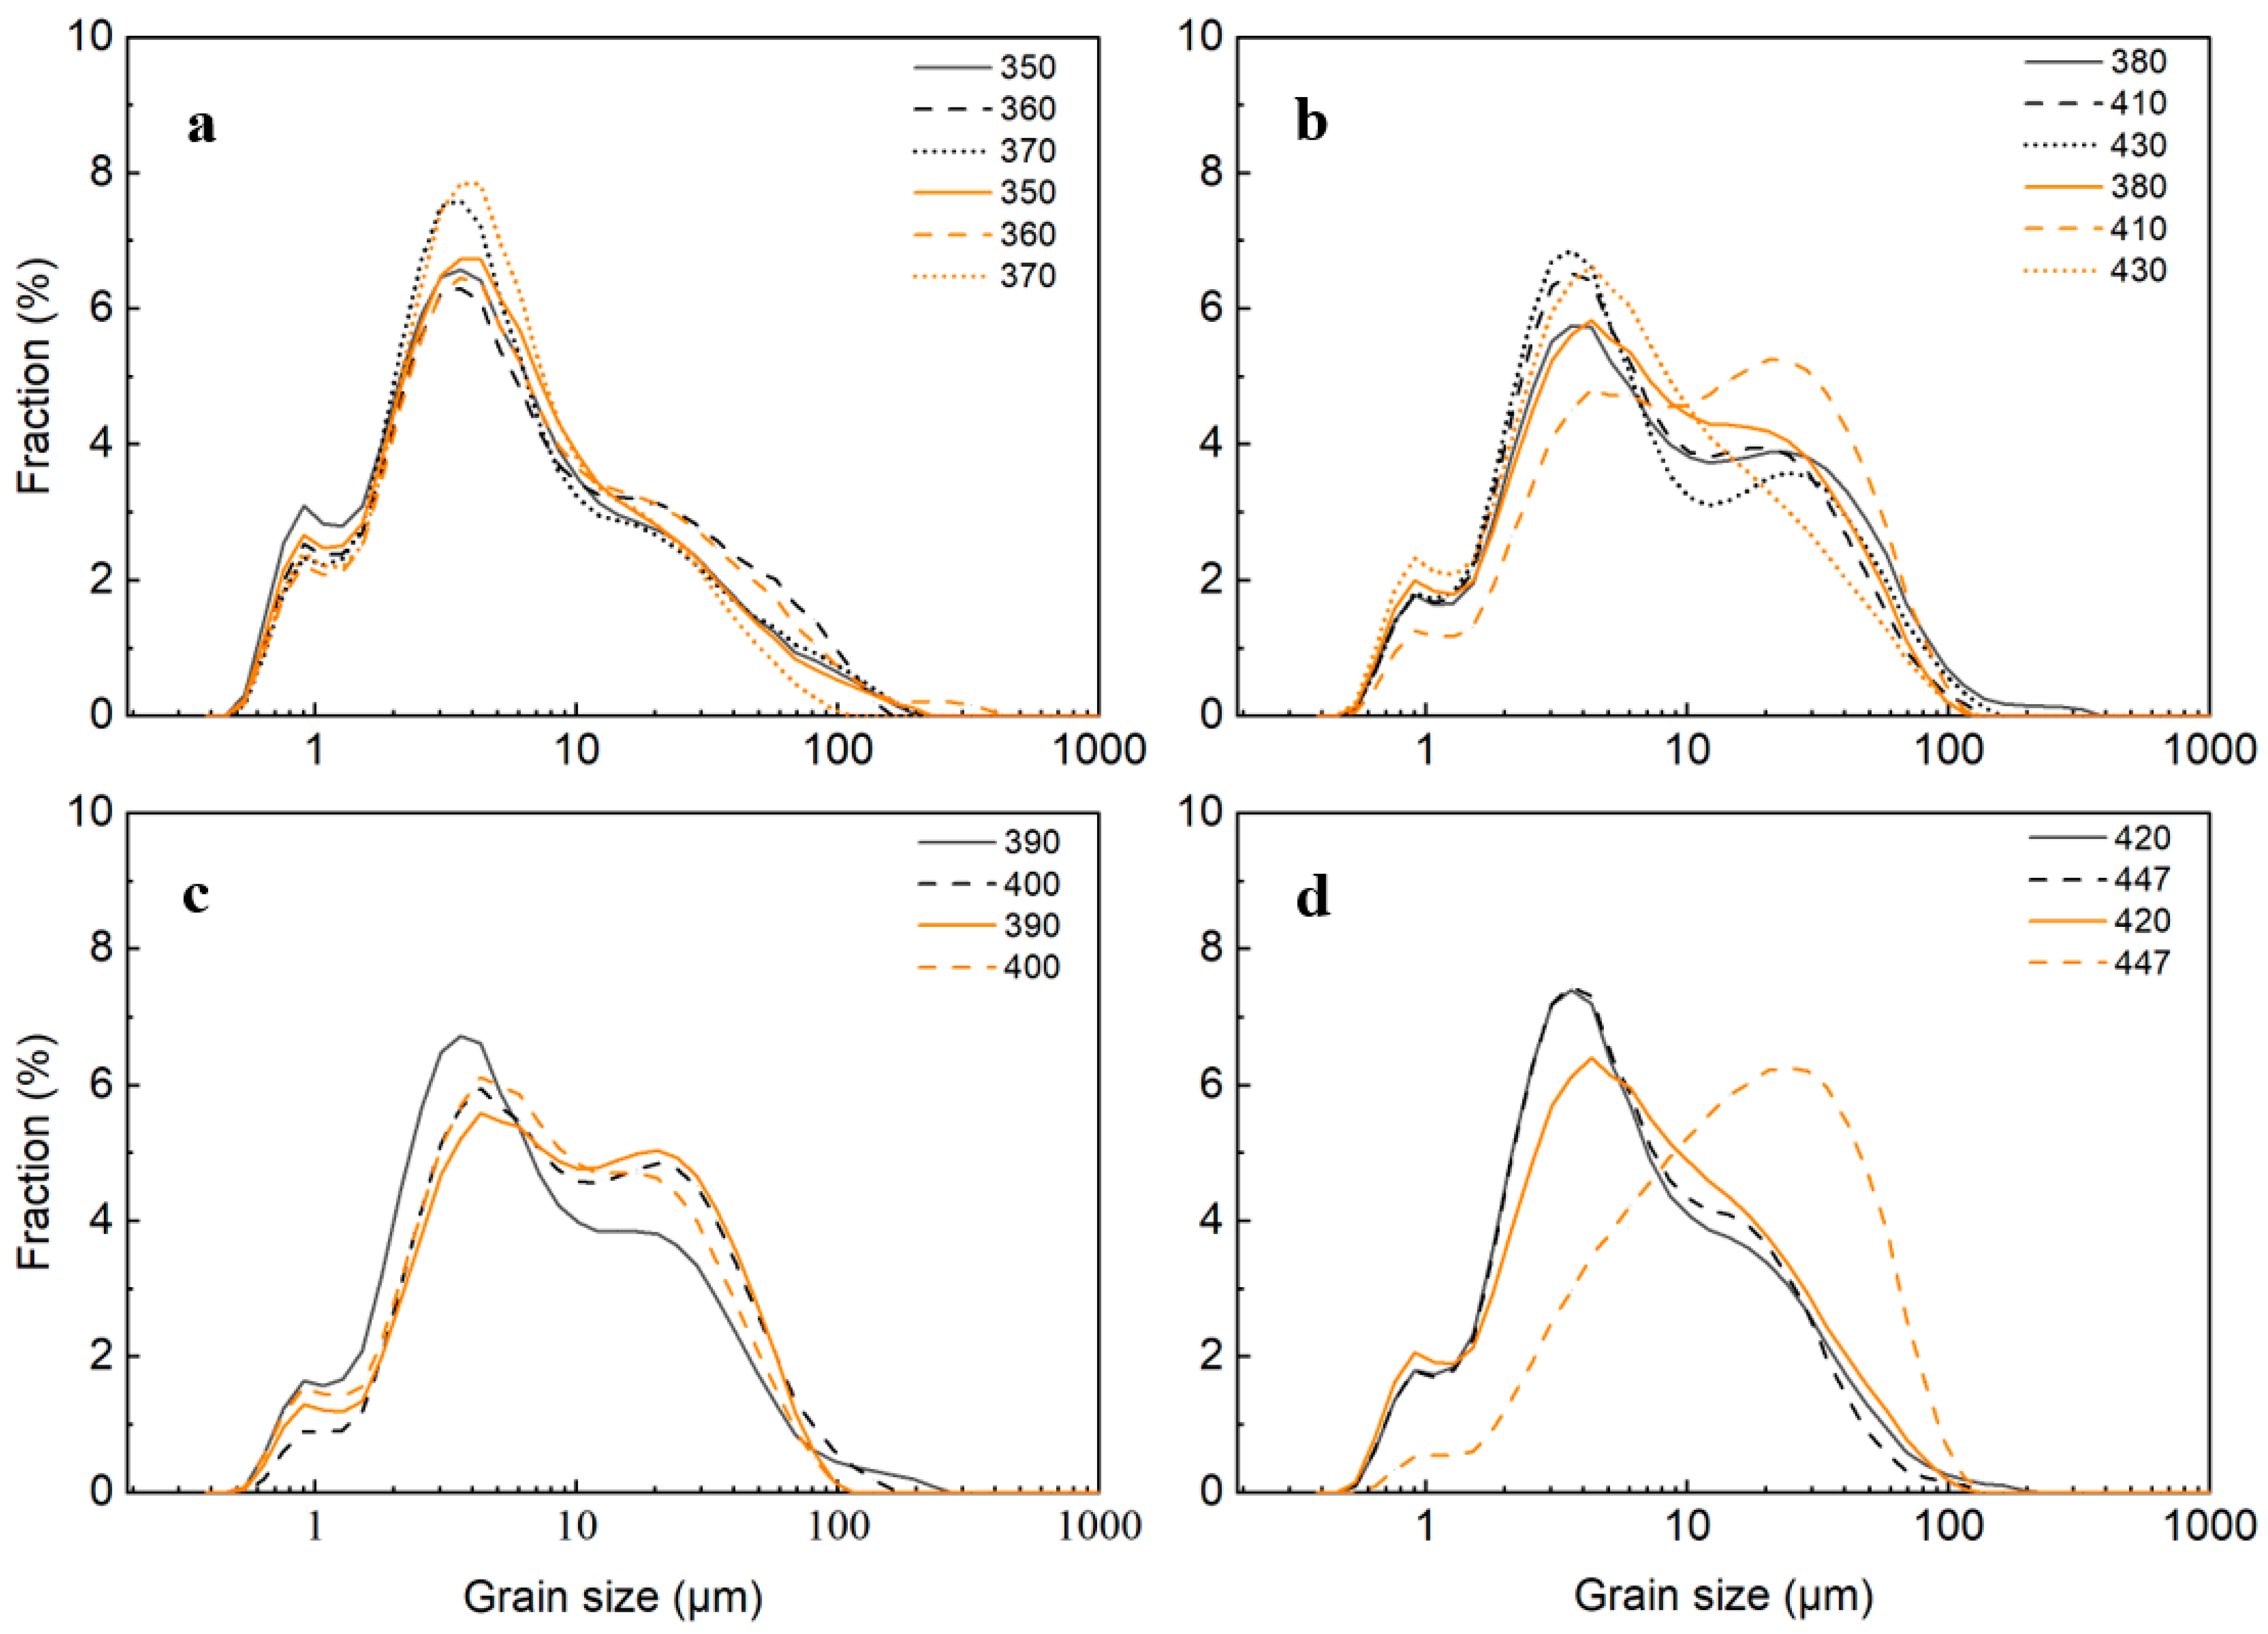
3.2.3. Grain Size Distribution (GSD)

The grain size distributions of the normal sediments (unit 1 and unit 2) all exhibited similar bimodal patterns, as shown in Figure S1 (similar to those in Figure 7a). These patterns featured smaller peaks at around 1 μm, representing clay-sized particles, and larger peaks at approximately 4–6 μm, representing silt-sized grains. In contrast, the grain size distributions of the original REY-rich sediments exhibited an additional prominent peak at approximately 20–40 μm, as illustrated in Figure 7b–d. Notably, only REY-rich samples in unit 3 displayed bimodal distributions that were in line with those observed in the normal sediments.
The grain size distributions of the acidified normal sediments displayed bimodal patterns resembling those observed in the original normal sediments (see Figure S1). The finer peak remained unchanged, while the coarser peak shifted to around 6 μm. In acidified REY-rich samples, the GSD exhibited significant variations in unit 4; however, unit 3 still showed a similar bimodal GSD like that of the original sediments (Figure 7a).

4. Discussion

4.1. Components Forming the Peaks in the GSDbulk

In the analysis of normal sediments, both original and acidified samples showed similar bimodal patterns with two distinct peaks at ~1 μm and ~4 μm for the original samples and ~1 μm and ~5 μm for the acidified samples. Due to the sampling depth being below the CCD, the contribution of carbonate components is limited [42]. In addition, the samples are collected far from land, resulting in limited terrigenous inputs. The occurrence of a finer peak at approximately 1 μm, observed in both the original and acidified samples, indicates the clay-sized particles resistant to dissolution in acid. Furthermore, a previous study by Takebe et al. [42] has confirmed the significant contribution of eolian dust input in the Western North Pacific Ocean, suggesting that the finer peak observed in the normal sediments probably originate from the eolian input. Ohta et al. [24] have also identified phillipsite and calcium phosphate as significant components in REY-rich sediments in the Western North Pacific Ocean. Phillipsite, as a silicate mineral, is resistant to erosion by HCl, whereas calcium phosphate may dissolve upon the addition of HCl. Therefore, variations in the granularity distribution can serve as a significant indicator to reflect the impact degree of calcium phosphate. The decline in Mz after the addition of HCl (Figure 5) in the normal sediments (unit 1 and unit 2) demonstrates that they only contain a minor amount of biogenic apatite; however, this does not apply to the REY-rich sediment with large contributions of phillipsite to its grain size. The similarities observed in the GSD of both the original and acidified samples indicate that the normal sediments deposited within unit 1 and unit 2 (0–340 cm) were subjected to a relatively stable environment, with no significant variations in granularity distribution.
In unit 3 (approximately at a depth of 350–370 cm), two distinct peaks at around 1 μm and 4 μm are still observed. Furthermore, an additional bulge is observed in the peak range of approximately 20 μm to 40 μm. Both the original and acidified samples exhibit a similar trend in GSD, suggesting that the dissolution influence of biogenic phosphate is likely limited. Microscopic observation and XRD results confirm the predominance of phillipsites in the coarse fractions. Therefore, it is hypothesized that the additional peak at ~20 μm to 40 μm compared with that of unit 1 and unit 2 (Figure S1) may represent the grain size range of phillipsite, which is partially consistent with the results of grain size of phillipsite conducted by Ohta et al. [24].
Unit 4 shows obvious distinction of GSD between original samples and acidified samples with only exception in the layer of 400 cm. All the original samples of unit 4 displayed an additional peak similar to that of unit 3. However, the participation of HCl resulted in two different results of GSD. One result demonstrated the disappearance of the additional peak at ~20 μm to 40 μm in the samples of 420 cm and 430 cm, indicating the dissolution of biogenic phosphate. Thus, it is suggested that biogenic apatite is mainly present in the grain size ranging from 20–40 μm. Conversely, the other result reflected the existence of an additional peak like that observed in unit 3. Based on the XRD results of bulk micronodules (data not published yet) and the discussion above, the additional peak likely represented phillipsite. The experimental data have proved that some of phillipsite may be completely wrapped by micronodule crust, which is mainly composed of Fe/Mn oxides. Therefore, they remain unchanged after acidification. Toyoda et al. [15] suggested that the larger fractions (10–38 μm and 38–100 μm) have remarkably high Ca, P, and REY contents, primarily because of an abundance of biogenic apatite grains in these larger fractions. Therefore, the additional peak observed at approximately 20 to 40 μm was probably composed of biogenic apatite and phillipsite.

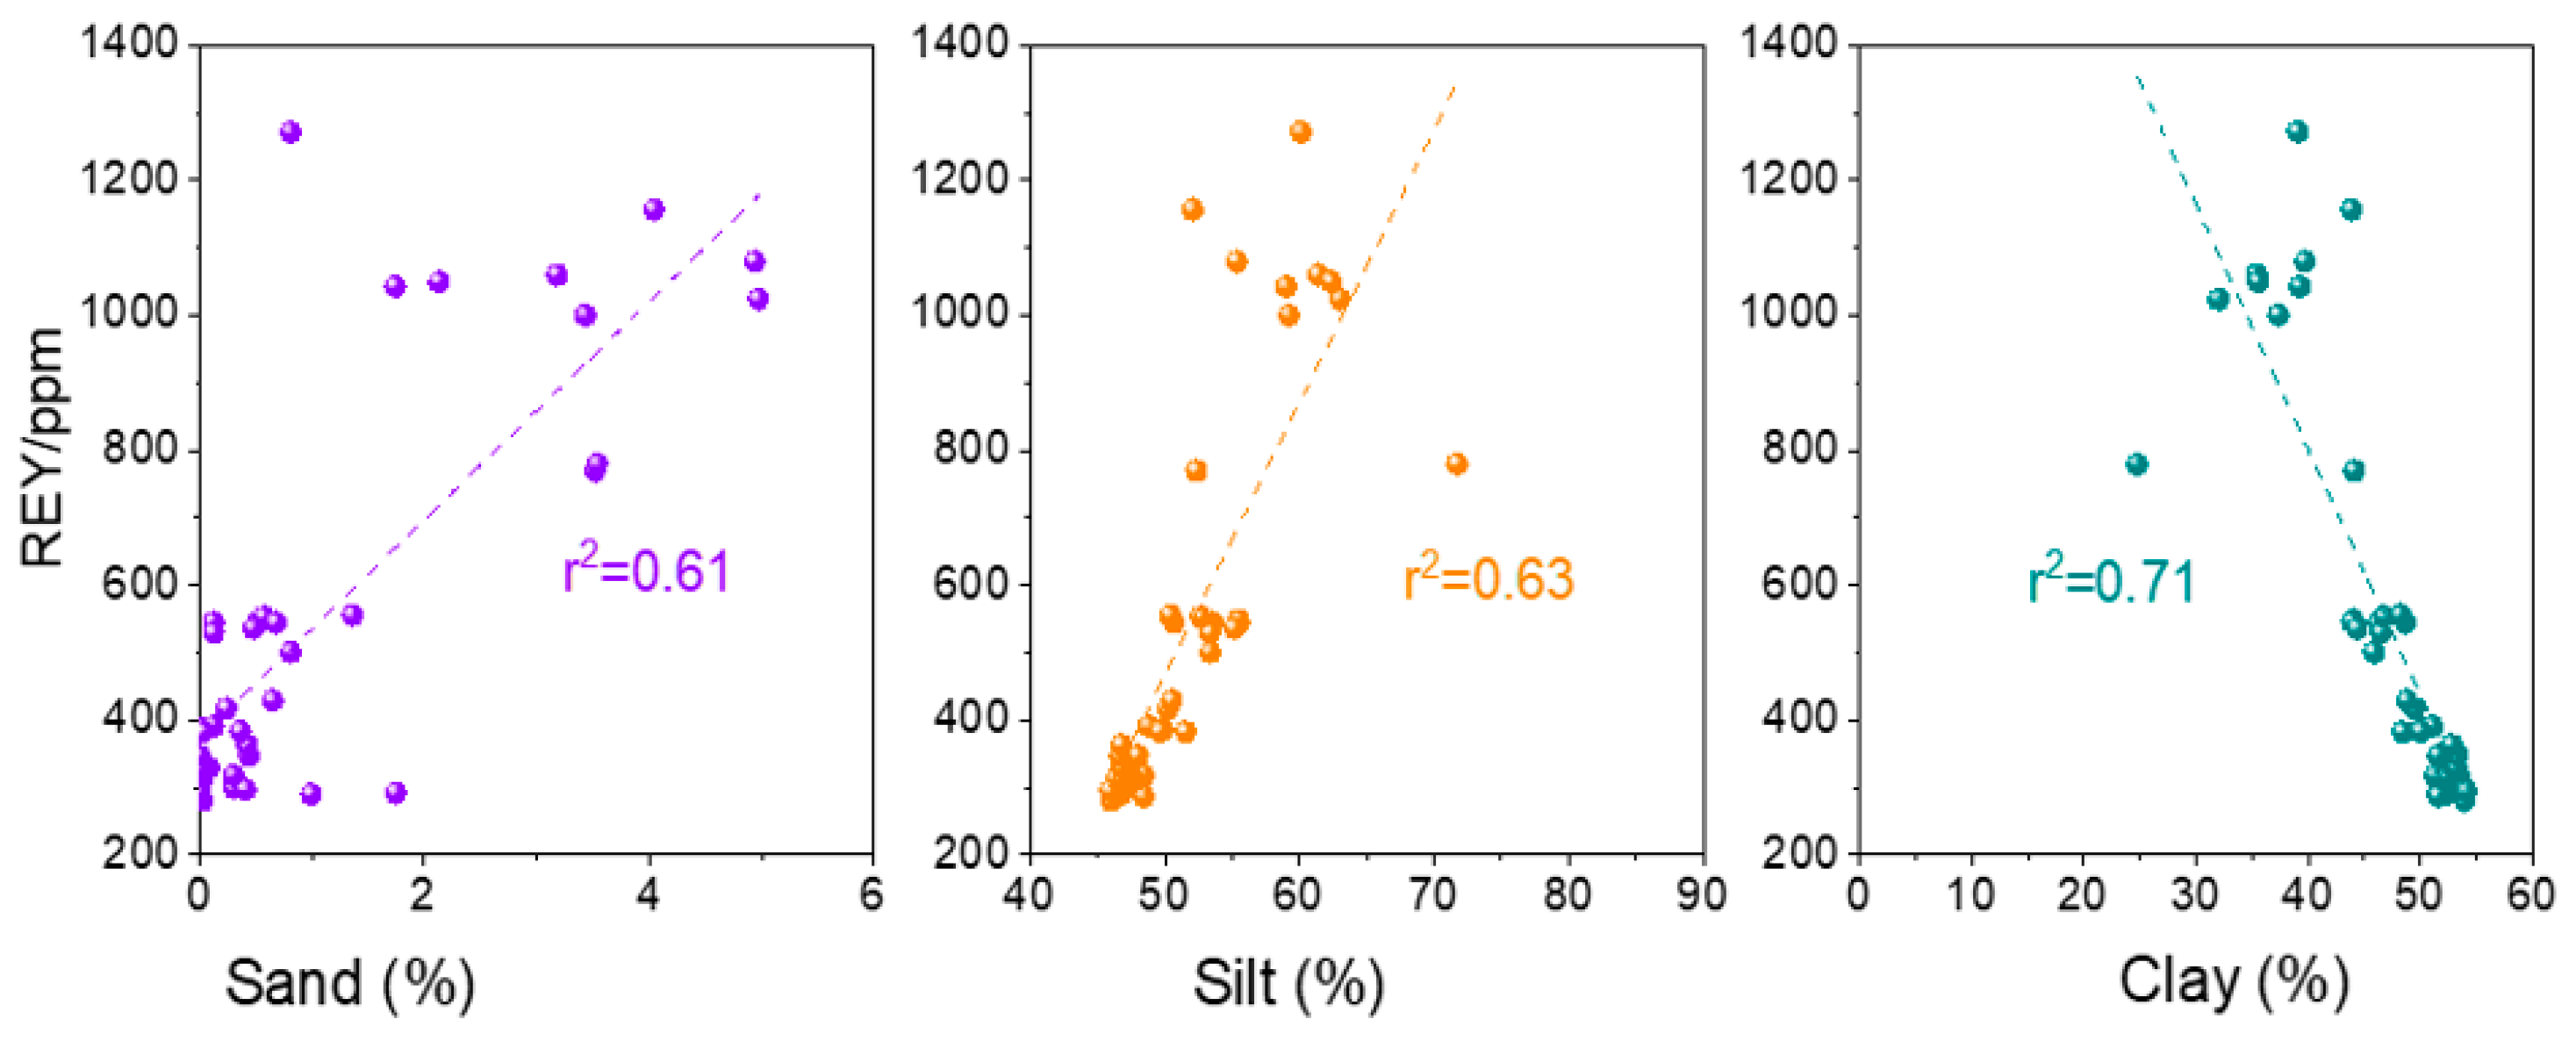
4.2. Analyses between ΣREY Contents and Grain Size Characteristics

To further elucidate the relationship between ΣREY and grain size, the percentages of sand, silt, and clay contents of the original sediments were analyzed in Figure 8. The results indicate that both the sand and silt fractions exhibit a positive correlation with ΣREY, with correlation coefficients of 0.61 and 0.63, respectively. Conversely, the clay fraction shows a negative correlation with ΣREY, with a correlation coefficient of −0.71. The result is consistent with the grain-sized separation experiments conducted by Takaya et al. [27] that showed that the smallest grain-sized fraction (<20 μm) had the lowest ΣREY, while the highest ΣREY was observed in the silt-sized fraction (~37–75 μm) of REY-rich mud. However, it is significantly different from the granularity analyses conducted by Sa et al. [35], who supported the notion that clay fractions were positively correlated with ΣREY. However, when considering the correlation relationship within the normal sediments, different grain sizes exhibit distinct correlations. Specifically, the correlation coefficients between the sand, silt, and clay fractions and ΣREY are 0.10, 0.82, and 0.84, respectively. The results indicate that there is no correlation between the sand fraction and ΣREY in normal sediments, whereas the silt and clay fractions are more strongly correlated with ΣREY in normal sediments. This is probably because the coarse-grained fraction found in normal sediments and mainly consists of terrestrial detritus and micronodules (some containing phillipsites), which have already been verified in the host phases of ΣREY [6]. In contrast, REY-rich sediments display a more scattered distribution due to the limited number of samples. Therefore, the silt fraction can serve as an important indicator to reflect the content of ΣREY combined with the discussion in Section 4.1, while the clay fraction contributes negatively to the enrichment of ΣREY.
Previous studies have confirmed that fish debris is the final host phase of REY [15,16,25,40,43,44,45]. Takaya et al. [27] had verified that most biogenic apatite grains were primarily found in the size fractions of larger than 20 μm. Combined with results discussed above, it is proposed that fish debris constitutes a major component of the silt fraction of the sediment. Sa et al. [35] once pointed that the ΣREY will increase with the decrease in grain size, presenting a contrasting conclusion to the findings of this study. Clay minerals are thought as an important transition “sink” of REY due to their strong ability of adsorption [31,46]. Therefore, clay minerals may serve as the major host of REY in normal sediments with a limited supply of biogenic phosphate (Figure 9), resulting in a positive correlation between the clay fraction and ΣREY, as observed in the results analyzed by Sa et al. [35]. Alternatively, in the condition that an abundant supply of biogenic apatite and a influence of bottom currents are present, biogenic apatite may concentrate in the sediments (Figure 9). Therefore, the silt fraction is mainly composed of fish debris, but clay minerals only act as an accessory component in the sediments. In such a case, a positive correlation is established between the silt fraction and ΣREY, but this is not applicable to the clay fraction (Figure 9).

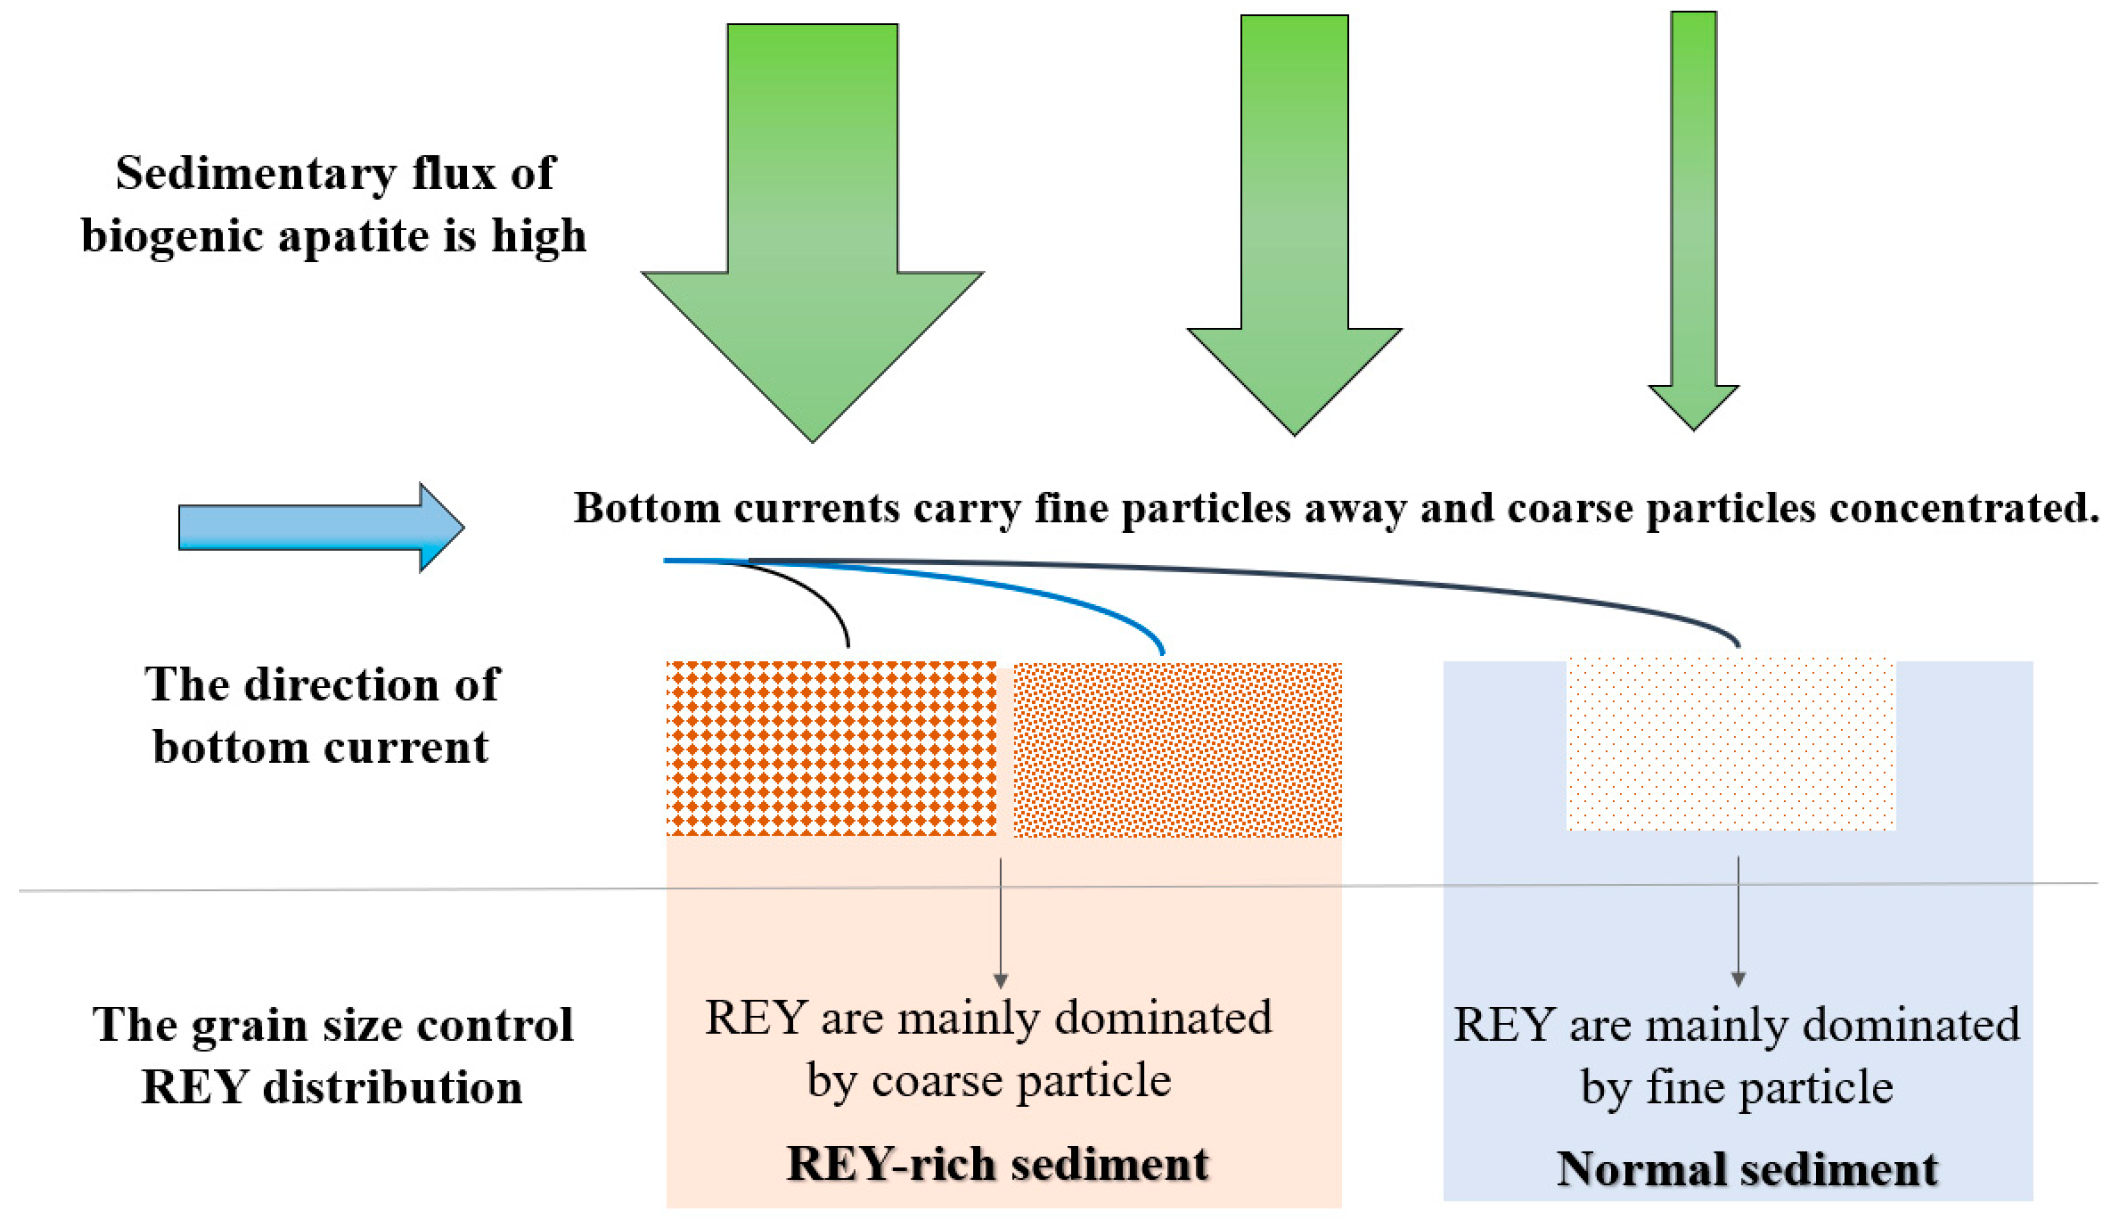
4.3. Implications for the Deposition Environment of REY-Rich Sediments

Depth profiles of different grain size fractions in the original sediments revealed very scarce amounts of sand fractions (approximately 0.00%–1.75%, with an average of 0.34%) in unit 1 and unit 2. The silt and clay fractions exhibited distinct predominance at different depths. Above 200 cm, clay fraction dominated the sediments with an average content of 52.49%, which decreased to an average of 46.96% below 200 cm. Conversely, the silt fraction displayed an opposite trend compared to the clay fractions, with averages of 47.28% and 52.55%, respectively. Variations of silt and clay percentage in different depth layers suggest slight differences in the provenance of the sediments. The sampling location was in the Marcus-Wake Seamounts area, where eolian dust was considered the primary source material [47]. The clay fraction-dominant compositions were consistent with those found in Asian loess [42], rather than with the terrestrial input. The depth profile distributions of each grain size fraction did not show any significant abrupt changes, indicating a relatively stable deposition environment in unit 1 and unit 2.
Phillipsite-rich layers, located at depths between approximately 350 cm and 370 cm, exhibit a significant increase in the sand fraction, ranging from 3.52% to 4.94%. Conversely, the clay fraction shows a further decreasing trend. Microscopic observation reveals an increase in the amounts of phillipsite crystals as well as the micronodules. The finding suggests the wide distribution of phillipsite crystals, indicating a relatively low sedimentation rate, as supported by previous studies [6]. Phillipsite is commonly formed through the interaction between volcanic glass alteration and cold bottom seawater, and it is widely distributed across the Pacific seafloor [48]. While phillipsite crystals themselves do not incorporate REY [16,29], they have been identified as important sinks for porewater PO43− in oxic pelagic environment [46]. Hence, phillipsite, as a significant adsorbent of PO43−, may contribute to the enrichment of REY. Additionally, the low sedimentation rate facilitates the adsorption of REY by bioapatite and Fe/Mn micronodule from bottom seawater in pelagic sediment [49]. In conclusion, unit 3 represents a relatively stable and slow deposition environment, which may be associated with volcanic activities.
Unit 4 represents a layer rich in biogenic apatite, exhibiting a decrease in the amount of phillipsite and an increase in large fragments of fish bone debris and other white material. Previous studies [37] have suggested that strong bottom currents can influence the distribution of particle size in pelagic sediments. The bottom currents tend to remove fine particles, such as clay-sized particles, and concentrate coarse particles, leading to a good sorting coefficient that is verified in this study. Consequently, it is suggested that the concentration of coarse fish bone debris and phillipsite in pelagic sediments increases after the removal of fine particles. The average fractions of sand, silt, and clay in unit 4 are 2.83%, 62.41%, and 34.76%, respectively. The results are consistent with the effect of bottom currents, indicating a lower proportion of fine fractions and a higher proportion of sand fraction. The accumulation of fish bone debris can contribute to the enrichment of REY, as fish bone debris serves as a host phase for these elements [6,8,13,16,19,23]. Fish bone debris is considered thermodynamically metastable, and the crystallites within the debris are prone to react, dissolve, or spontaneously recrystallize when exposed to pore water during the initial stages of deposition [49]. As the burial depth increases, the growth of crystals reduces their surface area, limiting intracrystalline porosity. This, in turn, effectively reduces the exchange rate of REY between fish bone debris and pore waters, resulting in the stability of REY within the fish bone debris. The depth profile of REY corresponds well with that of the sand and silt fractions in this study, suggesting that coarser particles are predominantly composed of fish bone debris. As a result, the effect of bottom currents plays a significant role in the formation of unit 4.
In conclusion, the sampled sediment core underwent at least three phases during the deposition process. Firstly, the upper layers (unit 1 and unit 2) were consistently deposited in a stable environment, where the main source of material was eolian dust. Secondly, the middle layers (unit 3) exhibited REY-rich thin sedimentary layer, indicating a relatively slow sedimentation rate, and suggesting the predominance of volcanic source rather than eolian input. Lastly, the bottom layers (unit 4) were influenced by strong bottom current activities, resulting in the accumulation of fish bones debris and the formation of highly REY-rich sediments. The schematic diagram, reflecting the grain size is influenced by bottom currents in biogenic apatite-rich and normal deposition areas, is illustrated in Figure 9. However, the extent of the influence of bottom currents on REY-rich sediments and their relative contribution remain unclear. Detailed chronological information may further provide insights into both the formation mechanisms of highly enriched REY and the potential distribution of REY resource.

5. Conclusions

We conducted a case study of grain size and mineral compositions for sediment samples from the core S027GC27 in Western Northern Pacific.
Four sedimentary units were classified in the core. The upper two units are characterized by the presence of Fe/Mn micronodules and other rock-forming minerals, with ΣREY ranging from 280.32 to 554.90 ppm (average: 392.83 ppm). In contrast, the lower two units are enriched with phillipsite and apatite, respectively. The ΣREY content in these two units ranges from 768.94 to 1271.82 ppm, with an average of 1023.20 ppm. The extensive presence of phillipsite grains in unit 3 suggests a relatively stable and slow deposition environment, probably associated with volcanic activities. The apatite-rich layer in unit 4 corresponds well with the high ΣREY content and a better sorting coefficient, indicating strong influences of bottom currents.
GSD of both original and acidified bulk sediments varies significantly, specifically in REY-rich sediments rather than normal sediments. The presence of an additional peak observed in the REY-rich sediments at approximately 20 to 40 μm is suggested to be mainly composed of biogenic apatite, with minor amounts of phillipsite.
Furthermore, a positive correlation between ΣREY and both the sand and silt fractions were observed, with correlation coefficients of 0.61 and 0.63, respectively. Conversely, there is a negative correlation between ΣREY and the clay fraction, with a correlation coefficient of 0.71.
In conclusion, for deep-sea sediments collected below the CCD, a sorting coefficient higher than 1.5, the presence of a peak at ~20–40 μm in the original samples, and distinct differences in GSD after HCl treatment can serve as important indicators to reflect the occurrence of REY-rich sediments.

Supplementary Materials

The following supporting information can be downloaded at: https://www.mdpi.com/article/10.3390/min13121470/s1, Figure S1: GSD analyses of normal samples (unit 1 and unit 2) of the core. The black line represents original samples and the orange line represents acidified samples.

Author Contributions

Writing—original draft preparation, Q.H.; writing—review and editing, M.Y. and D.B.; visualization, M.H.; Methodology, A.Z. supervision, J.L. and Z.S.; funding acquisition, X.S. All authors have read and agreed to the published version of the manuscript.

Funding

This research was funded by [Laoshan Laboratory] grant number [No. LSKJ202203601], funded by [National Natural Science Foundation of China] grant number [No. 42106085, 42249301, 92262304, 91858209, 42372116] and [Taishan Scholar Foundation of Shandong Province] grant number [tspd20181216]. The APC was funded by [National Natural Science Foundation of China 92262304].

Data Availability Statement

Data are contained within the article or Supplementary Material.

Acknowledgments

We thank the shipboard scientific party onboard R/V Xiang Yang Hong 01 for their dedicated work. Samples used in this study were provided by COMRA. We thank Mao Yuan for her support in the sample treatment. Also, we thank Xingchao Zhang for his help in explaining the data.

Conflicts of Interest

The authors declare no conflict of interest.

References

  1. Minowa, T. Rare earth meganets: Conservation of energy and the environment. Resour. Geol. 2008, 58, 414–422. [Google Scholar] [CrossRef]
  2. Gunn, G. Rare earth elements. In Critical Metals Handbook; British Geological Survey: Keyworth, UK, 2014; pp. 312–339. [Google Scholar]
  3. Alonso, E.; Sherman, A.M.; Wallington, T.J.; Everson, M.P.; Fileld, F.R.; Roth, R.; Kirchain, R.E. Correction to evaluating rare earth element availability: A case with revolutionary demand from clean technologies. Environ. Sci. Technol. 2012, 46, 3406–3414. [Google Scholar] [CrossRef] [PubMed]
  4. Kato, Y.; Fujinaga, K.; Nakamura, K.; Takaya, Y.; Kitamura, K.; Ohta, J.; Toda, R.; Nakashima, T.; Iwamori, H. Deep-sea mud in the Pacific Ocean as a potential resource for rare-earth elements. Nat. Geosci. 2011, 4, 535–539. [Google Scholar] [CrossRef]
  5. Jiang, X.D.; Sun, X.M.; Chou, Y.M.; Hein, J.R.; He, G.W.; Fu, Y.; Li, D.-F.; Liao, J.-L.; Ren, J.-B. Geochemistry and origins of carbonate fluorapatite in seamount Fe Mn crusts from the Pacific Ocean. Mar. Geol. 2020, 423, 106135. [Google Scholar] [CrossRef]
  6. Bi, D.; Shi, X.; Huang, M.; Yu, M.; Zhou, T.; Zhang, Y.; Zhu, A.; Shi, M.; Fang, X. Geochemical and mineralogical characteristics of deep-sea sediments from the western North Pacific Ocean: Constraints on the enrichment processes of rare earth elements. Ore Geol. Rev. 2021, 138, 104318. [Google Scholar] [CrossRef]
  7. Wang, F.; He, G.; Deng, X.; Yang, Y.; Ren, J. Fish Teeth Sr Isotope Stratigraphy and Nd Isotope Variations: New Insights on REY Enrichments in Deep-Sea Sediments in the Pacific. J. Mar. Sci. Eng. 2021, 9, 1379. [Google Scholar] [CrossRef]
  8. Yasukawa, K.; Kino, S.; Ohta, J.; Azami, K.; Tanaka, E.; Mimura, K.; Fujinaga, K.; Nakamura, K.; Kato, Y. Stratigraphic Variations of Fe–Mn Micronodules and Implications for the Formation of Extremely REY-Rich Mud in the Western North Pacific Ocean. Minerals 2021, 11, 270. [Google Scholar] [CrossRef]
  9. Deng, Y.; Guo, Q.; Zhu, J.; He, G.; Yang, Y.; Cao, J.; Ren, J.; Liu, Y.; Famiyeh, L.; Guo, B.; et al. Significant contribution of seamounts to the oceanic rare earth elements budget. Gondwana Res. 2022, 112, 71–81. [Google Scholar] [CrossRef]
  10. Qiu, Z.; Ma, W.; Tao, C.; Koschinsky, A.; Hu, S. Clay Minerals and Sr-Nd Isotope Compositions of Core CG 1601 in the Northwest Pacific: Implications for Material Source and Rare Earth Elements Enrichments. Minerals 2022, 12, 287. [Google Scholar] [CrossRef]
  11. Tanaka, E.; Yasukawa, K.; Nakamura, K.; Ohta, J.; Miyazaki, T.; Vaglarov, B.S.; Machida, S.; Fujinaga, K.; Iwamori, H.; Kato, Y. Secular Variations in Provenance of Sedimentary Components in the Western North Pacific Ocean Constrained by Sr Isotopic Features of Deep-Sea Sediments. Geochem. Geophys. Geosyst. 2022, 23, 1. [Google Scholar] [CrossRef]
  12. Fujinaga, K.; Yasukawa, K.; Nakamura, K.; Machida, S.; Takaya, Y.; Ohta, J.; Araki, S.; Liu, H.; Usami, R.; Maki, R.; et al. Geochemistry of REY-rich mud in the Japanese Exclusive Economic Zone around Minamitorishima Island. Geochem. J. 2016, 50, 575–590. [Google Scholar] [CrossRef]
  13. Iijima, K.; Yasukawa, K.; Fujinaga, K.; Nakamura, K.; Machida, S.; Takaya, Y.; Ohta, J.; Haraguchi, S.; Nishio, Y.; Usui, Y.; et al. Discovery of extremely REY-rich mud in the western North Pacific Ocean. Geochem. J. 2016, 50, 557–573. [Google Scholar] [CrossRef]
  14. Shi, X.; Bi, D.; Huang, M.; Yu, M.; Luo, Y.; Zhou, T.; Zhang, Z.; Liu, J. Distribution and metallogenesis of deep-sea rare earth elements. Geol. Bull. China 2021, 40, 195–208. [Google Scholar]
  15. Toyoda, K.; Tokonami, M. Toyoda Diffusion of rare-earth elements in fish teeth from deepsea sediments. Nature 1990, 345, 607–609. [Google Scholar] [CrossRef]
  16. Kon, Y.; Hoshino, M.; Sanematsu, K.; Morita, S.; Tsunematsu, M.; Okamoto, N.; Yano, N.; Tanaka, M.; Takagi, T. Geochemical Characteristics of Apatite in Heavy REE-rich Deep-Sea Mud from Minami-Torishima Area, Southeastern Japan. Resour. Geol. 2014, 64, 47–57. [Google Scholar] [CrossRef]
  17. Yasukawa, K.; Liu, H.; Fujinaga, K.; Machida, S.; Haraguchi, S.; Ishii, T.; Nakamura, K.; Kato, Y. Geochemistry and mineralogy of REY-rich mud in the eastern Indian Ocean. J. Asian Earth Sci. 2014, 93, 25–36. [Google Scholar] [CrossRef]
  18. Shi, X.; Fu, Y.; Li, B.; Huang, M.; Ren, X.; Liu, J.; Yu, M.; Li, C. Research on Deep sea Minerals in China: Progress and Discovery. Bull. Miner. Petrol. Geochem. 2021, 40, 305–318. [Google Scholar]
  19. Li, D.; Fu, Y.; Liu, Q.; Reinfelder, J.R.; Hollings, P.; Sun, X.; Tan, C.; Dong, Y.; Ma, W. High-resolution LA-ICP-MS mapping of deep-sea polymetallic micronodules and its implications on element mobility. Gondwana Res. 2020, 81, 461–474. [Google Scholar] [CrossRef]
  20. Tanaka, E.; Nakamura, K.; Yasukawa, K.; Mimura, K.; Fujinaga, K.; Ohta, J.; Iijima, K.; Nozaki, T.; Machida, S.; Kato, Y. Chemostratigraphic Correlations of Deep-Sea Sediments in the Western North Pacific Ocean: A New Constraint on the Distribution of Mud Highly Enriched in Rare-Earth Elements. Minerals 2020, 10, 575. [Google Scholar] [CrossRef]
  21. Yu, M.; Shi, X.; Huang, M.; Liu, J.; Yan, Q.; Yang, G.; Li, C.; Yang, B.; Zhou, T.; Bi, D.; et al. The transfer of rare earth elements during early diagenesis in REY-rich sediments: An example from the Central Indian Ocean Basin. Ore Geol. Rev. 2021, 136, 104269. [Google Scholar] [CrossRef]
  22. Zhou, T.; Shi, X.; Huang, M.; Yu, M.; Bi, D.; Ren, X.; Liu, J.; Zhu, A.; Fang, X.; Shi, M. Genesis of REY-rich deep-sea sediments in the Tiki Basin, eastern South Pacific Ocean: Evidence from geochemistry, mineralogy and isotope systematics. Ore Geol. Rev. 2021, 138, 104330. [Google Scholar] [CrossRef]
  23. Ren, J.; Jiang, X.; He, G.; Wang, F.; Yang, T.; Luo, S.; Deng, Y.; Zhou, J.; Deng, X.; Yao, H.; et al. Enrichment and sources of REY in phosphate fractions: Constraints from the leaching of REY-rich deep-sea sediments. Geochim. Cosmochim. Acta 2022, 335, 155–168. [Google Scholar] [CrossRef]
  24. Ohta, J.; Yasukawa, K.; Machida, S.; Fujinaga, K.; Nakamura, K.; Takaya, Y.; Iijima, K.; Suzuki, K.; Kato, Y. Geological factors responsible for REY-rich mud in the western North Pacific Ocean: Implications from mineralogy and grain size distributions. Geochem. J. 2016, 50, 591–603. [Google Scholar] [CrossRef]
  25. Zhang, X.; Lu, Y.; Miao, Y.; Huang, M.; Zhu, K.; Cai, L.; Wang, J.; Shi, X. Radiogenic Nd in bioapatite from rare earth elements rich deep sea sediments from Central Indian Oceanic Basin and its implication in material sources. Ore Geol. Rev. 2023, 154, 105295. [Google Scholar] [CrossRef]
  26. Kashiwabara, T.; Toda, R.; Fujinaga, K.; Honma, T.; Takahashi, Y.; Kato, Y. Determination of Host Phase of Lanthanum in Deep-sea REY-rich Mud by XAFS and µ-XRF Using High-energy Synchrotron Radiation. Chem. Lett. 2014, 43, 199–200. [Google Scholar] [CrossRef]
  27. Takaya, Y.; Yasukawa, K.; Kawasaki, T.; Fujinaga, K.; Ohta, J.; Usui, Y.; Nakamura, K.; Kimura, J.-I.; Chang, Q.; Hamada, M.; et al. The tremendous potential of deep-sea mud as a source of rare-earth elements. Sci. Rep. 2018, 8, 5763. [Google Scholar] [CrossRef]
  28. Mamurtry, G.; Yeh, H.-W. Hydrothermal clay mineral formation of East Pacific Rise and Bauer Basin sediments. Chem. Geol. 1981, 32, 189–205. [Google Scholar] [CrossRef]
  29. Dubinin, A.V.; Svalnov, V.N. Geochemistry of rare earth elements in ferromanganese micro- and macronodules from the Pacific nonproductive zone. Lithol. Miner. Res. 2000, 35, 520–537. [Google Scholar] [CrossRef]
  30. Liu, J.; Liang, H.; Xia, N.; Song, S. REE geochemistry of <2 μm fractions in deep-sea sediments from East Pacific. Geochemistry 1998, 27, 49–58. [Google Scholar]
  31. Liu, Y.; Jing, Y.; Zhao, W. Distribution of rare earth elements and implication for Ce anomalies in the clay-sized minerals of deep-sea sediment, Western Pacific Ocean. Appl. Clay Sci. 2023, 235, 106876. [Google Scholar] [CrossRef]
  32. Hu, Q.; Li, C.; Yang, B.; Fang, X.; Lv, H.; Shi, X.; Liu, J. Clay mineral distribution characteristics of surface sediments in the South Mid-Atlantic Ridge. J. Oceanol. Limnol. 2023, 41, 897–908. [Google Scholar] [CrossRef]
  33. Liao, J.; Sun, X.; Wu, Z.; Sa, R.; Guan, Y.; Lu, Y.; Li, D.; Liu, Y.; Deng, Y.; Pan, Y. Fe-Mn (oxyhydr)oxides as an indicator of REY enrichment in deep-sea sediments from the central North Pacific. Ore Geol. Rev. 2019, 112, 103044. [Google Scholar] [CrossRef]
  34. Lv, W.; Yi, L.; Fu, T.; Yang, J.; Chen, G.; Lin, Z.; Xu, X.; Yu, H. Grain-size characteristics and environmental significance of abyssal sediments from the southwest Indian Ridge. Adv. Mar. Sci. 2017, 35, 512–523. (In Chinese) [Google Scholar]
  35. Sa, R.; Sun, X.; He, G.; Xu, L.; Pan, Q.; Liao, J.; Zhu, K.; Deng, X. Enrichment of rare earth elements in siliceous sediments under slow deposition: A case study of the central North Pacific. Ore Geol. Rev. 2018, 94, 12–23. [Google Scholar] [CrossRef]
  36. Wei, X.; Shi, X.; Xu, Y.; Castillo, P.R.; Zhang, Y.; Zhang, L.; Zhang, H. Mid-Cretaceous Wake seamounts in NW Pacific originate from secondary mantle plumes with Arago hotspot composition. Chem. Geol. 2022, 587, 120632. [Google Scholar] [CrossRef]
  37. Hu, R.; Piotrowski, A.M. Neodymium isotope evidence for glacial-interglacial variability of deepwater transit time in the Pacific Ocean. Nat. Commun. 2018, 9, 4709. [Google Scholar] [CrossRef]
  38. Plank, T.; Ludden, J.N.; Escutia, C.; Party, S.S. Leg 185 summary: Inputs to the Izu–Mariana subduction system. In Ocean Drilling Program Proceedings, Initial Reports; Ocean Drilling Program: College Station, TX, USA, 2000; Volume 185, pp. 1–63. [Google Scholar]
  39. Takaya, Y.; Fujinaga, K.; Yamagata, N.; Araki, S.; Maki, R.; Nakamura, K.; Iijima, K.; Kato, Y. Chemical leaching of rare earth elements from highly REY-rich mud. Geochem. J. 2015, 49, 637–652. [Google Scholar] [CrossRef]
  40. Liao, J.; Sun, X.; Li, D.; Sa, R.; Lu, Y.; Lin, Z.; Xu, L.; Zhan, R.; Pan, Y.; Xu, H. New insights into nanostructure and geochemistry of bioapatite in REE-rich deep-sea sediments: LA-ICP-MS, TEM, and Z-contrast imaging studies. Chem. Geol. 2019, 512, 58–68. [Google Scholar] [CrossRef]
  41. Folk, R.L.; Andrews, P.B.; Lewis, D.W. Detrital sedimentary rock classification and nomenclature for use in New Zealand. N. Z. J. Geol. Geophys. 1970, 13, 937–968. [Google Scholar] [CrossRef]
  42. Takebe, M. Carriers of Rare Earth Elements in Pacific Deep-Sea Sediments. J. Geol. 2005, 113, 201–215. [Google Scholar] [CrossRef]
  43. Trueman, C.N.; Tuross, N. Trace Elements in Recent and Fossil Bone Apatite. Rev. Mineral. Geochem. 2002, 48, 489–521. [Google Scholar] [CrossRef]
  44. Nemliher, J.G.; Baturin, G.N.; Kallaste, T.E.; Murdmaa, I.O. Transformation of Hydroxyapatite of Bone Phosphate from the Ocean Bottom during Fossilization. Lithol. Miner. Resour. 2004, 39, 468–479. [Google Scholar] [CrossRef]
  45. Ohta, J.; Yasukawa, K.; Nozaki, T.; Takaya, Y.; Mimura, K.; Fujinaga, K.; Nakamura, K.; Usui, Y.; Kimura, J.-I.; Chang, Q.; et al. Fish proliferation and rare-earth deposition by topographically induced upwelling at the late Eocene cooling event. Sci. Rep. 2020, 10, 9896. [Google Scholar] [CrossRef] [PubMed]
  46. Ijiri, A.; Okamura, K.; Ohta, J.; Nishio, Y.; Hamada, Y.; Iijima, K.; Inagaki, F. Uptake of porewater phosphate by REY-rich mud in the western North Pacific Ocean. Geochem. J. 2018, 52, 373–378. [Google Scholar] [CrossRef]
  47. Nozaki, Y. Rare earth element and their isotopes in the ocean. In Encyclopedia of Ocean Science; Steele, J.H., Thorpe, S.A., Eds.; Academic Press: London, UK, 2001; pp. 2354–2366. [Google Scholar]
  48. Glaccum, R.; Bostrom, K. Na, K-phillipsite: Its stability conditions and geochemical role in the deep sea. Mar. Geol. 1976, 21, 47–58. [Google Scholar] [CrossRef]
  49. Deng, Y.; Guo, Q.; Liu, C.; He, G.; Cao, J.; Liao, J.; Liu, C.; Wang, H.; Zhou, J.; Liu, Y.; et al. Early diagenetic control on the enrichment and fractionation of rare earth elements in deep-sea sediments. Gondwana Res. 2022, 8, eabn5466. [Google Scholar] [CrossRef]
Figure 1. Geographic location of the core S027GC27. The pathways of the bottom currents were modified by Hu and Piotrowski [37] (gray arrow). Abbreviations: PC, pelagic clay; ZC, zeolitic-rich clay; and BAC, biogenic apatite-rich clay.
Minerals 13 01470 g001
Figure 2. (al): Photomicrographs of samples from the selected four units of the core; white arrow represents in (a) radiolarians, in (b) colored mineral, and in (e) benthic foraminifera. Abbreviations: Bia, bioapatite debris; Php, phillipsite; and Min, micronodule.
Minerals 13 01470 g002
Figure 3. Photos of the coarse fraction of samples from four units of the core under stereomicroscope; white arrow points at the following in the above images: (a) radiolarine; (b) sponge spicule; (c,d,f,g) Fe–Mn micronodule; (e) fish teeth; (h,i) phillipsite; (j) octopussy leg-shaped substance; (k) white large loose flakes; and (l) white small sphere. Scale bar represents 100 μm.
Minerals 13 01470 g003
Figure 4. Bulk XRD patterns of samples from four units. Abbreviations: Ill, illite; Php, phillipsite; Qz, quartz; Apa, apatite; and Hal, halite.
Minerals 13 01470 g004
Figure 5. Depth profiles of ΣREY, the percentages of sand, silt, and clay contents and the mean grain size (Mz) of original samples (blue) and acidified samples (orange).
Minerals 13 01470 g005
Figure 6. (a) Plot of skew (Sk) vs. sorting coefficient (δ), and (b) plot of sorting coefficient (δ) vs. mean grain size (Mz). Blue dashed circle represents normal samples, and orange dashed circle represents REY-rich samples. The gray arrow represents the distribution trend of the original samples, and the yellow arrow represents the distribution trend of the acidified samples.
Minerals 13 01470 g006
Figure 7. GSD analyses of REY-rich samples at the bottom of the core. The black line represents original samples, and the orange line represents acidified samples. (a) represents for samples from 350, 360 and 370 cm. (b) represents for samples from 380, 410 and 430 cm. (c) represents for samples from 390 and 400 cm. (d) represents for samples from 420 and 447 cm.
Minerals 13 01470 g007
Figure 8. Correlation diagrams of REY vs. percentage of sand, silt, and clay contents in the original sediments.
Minerals 13 01470 g008
Figure 9. The schematic diagram reflects that the grain size is influenced by bottom currents in biogenic apatite-rich and normal deposition areas.
Minerals 13 01470 g009
Disclaimer/Publisher’s Note: The statements, opinions and data contained in all publications are solely those of the individual author(s) and contributor(s) and not of MDPI and/or the editor(s). MDPI and/or the editor(s) disclaim responsibility for any injury to people or property resulting from any ideas, methods, instructions or products referred to in the content.

