Petrographic Microscopy with Ray Tracing and Segmentation from Multi-Angle Polarisation Whole-Slide Images
Abstract
:1. Introduction
2. Materials and Methods
2.1. Scanning Optical Microscopy
2.1.1. VS200 Slide Scanner
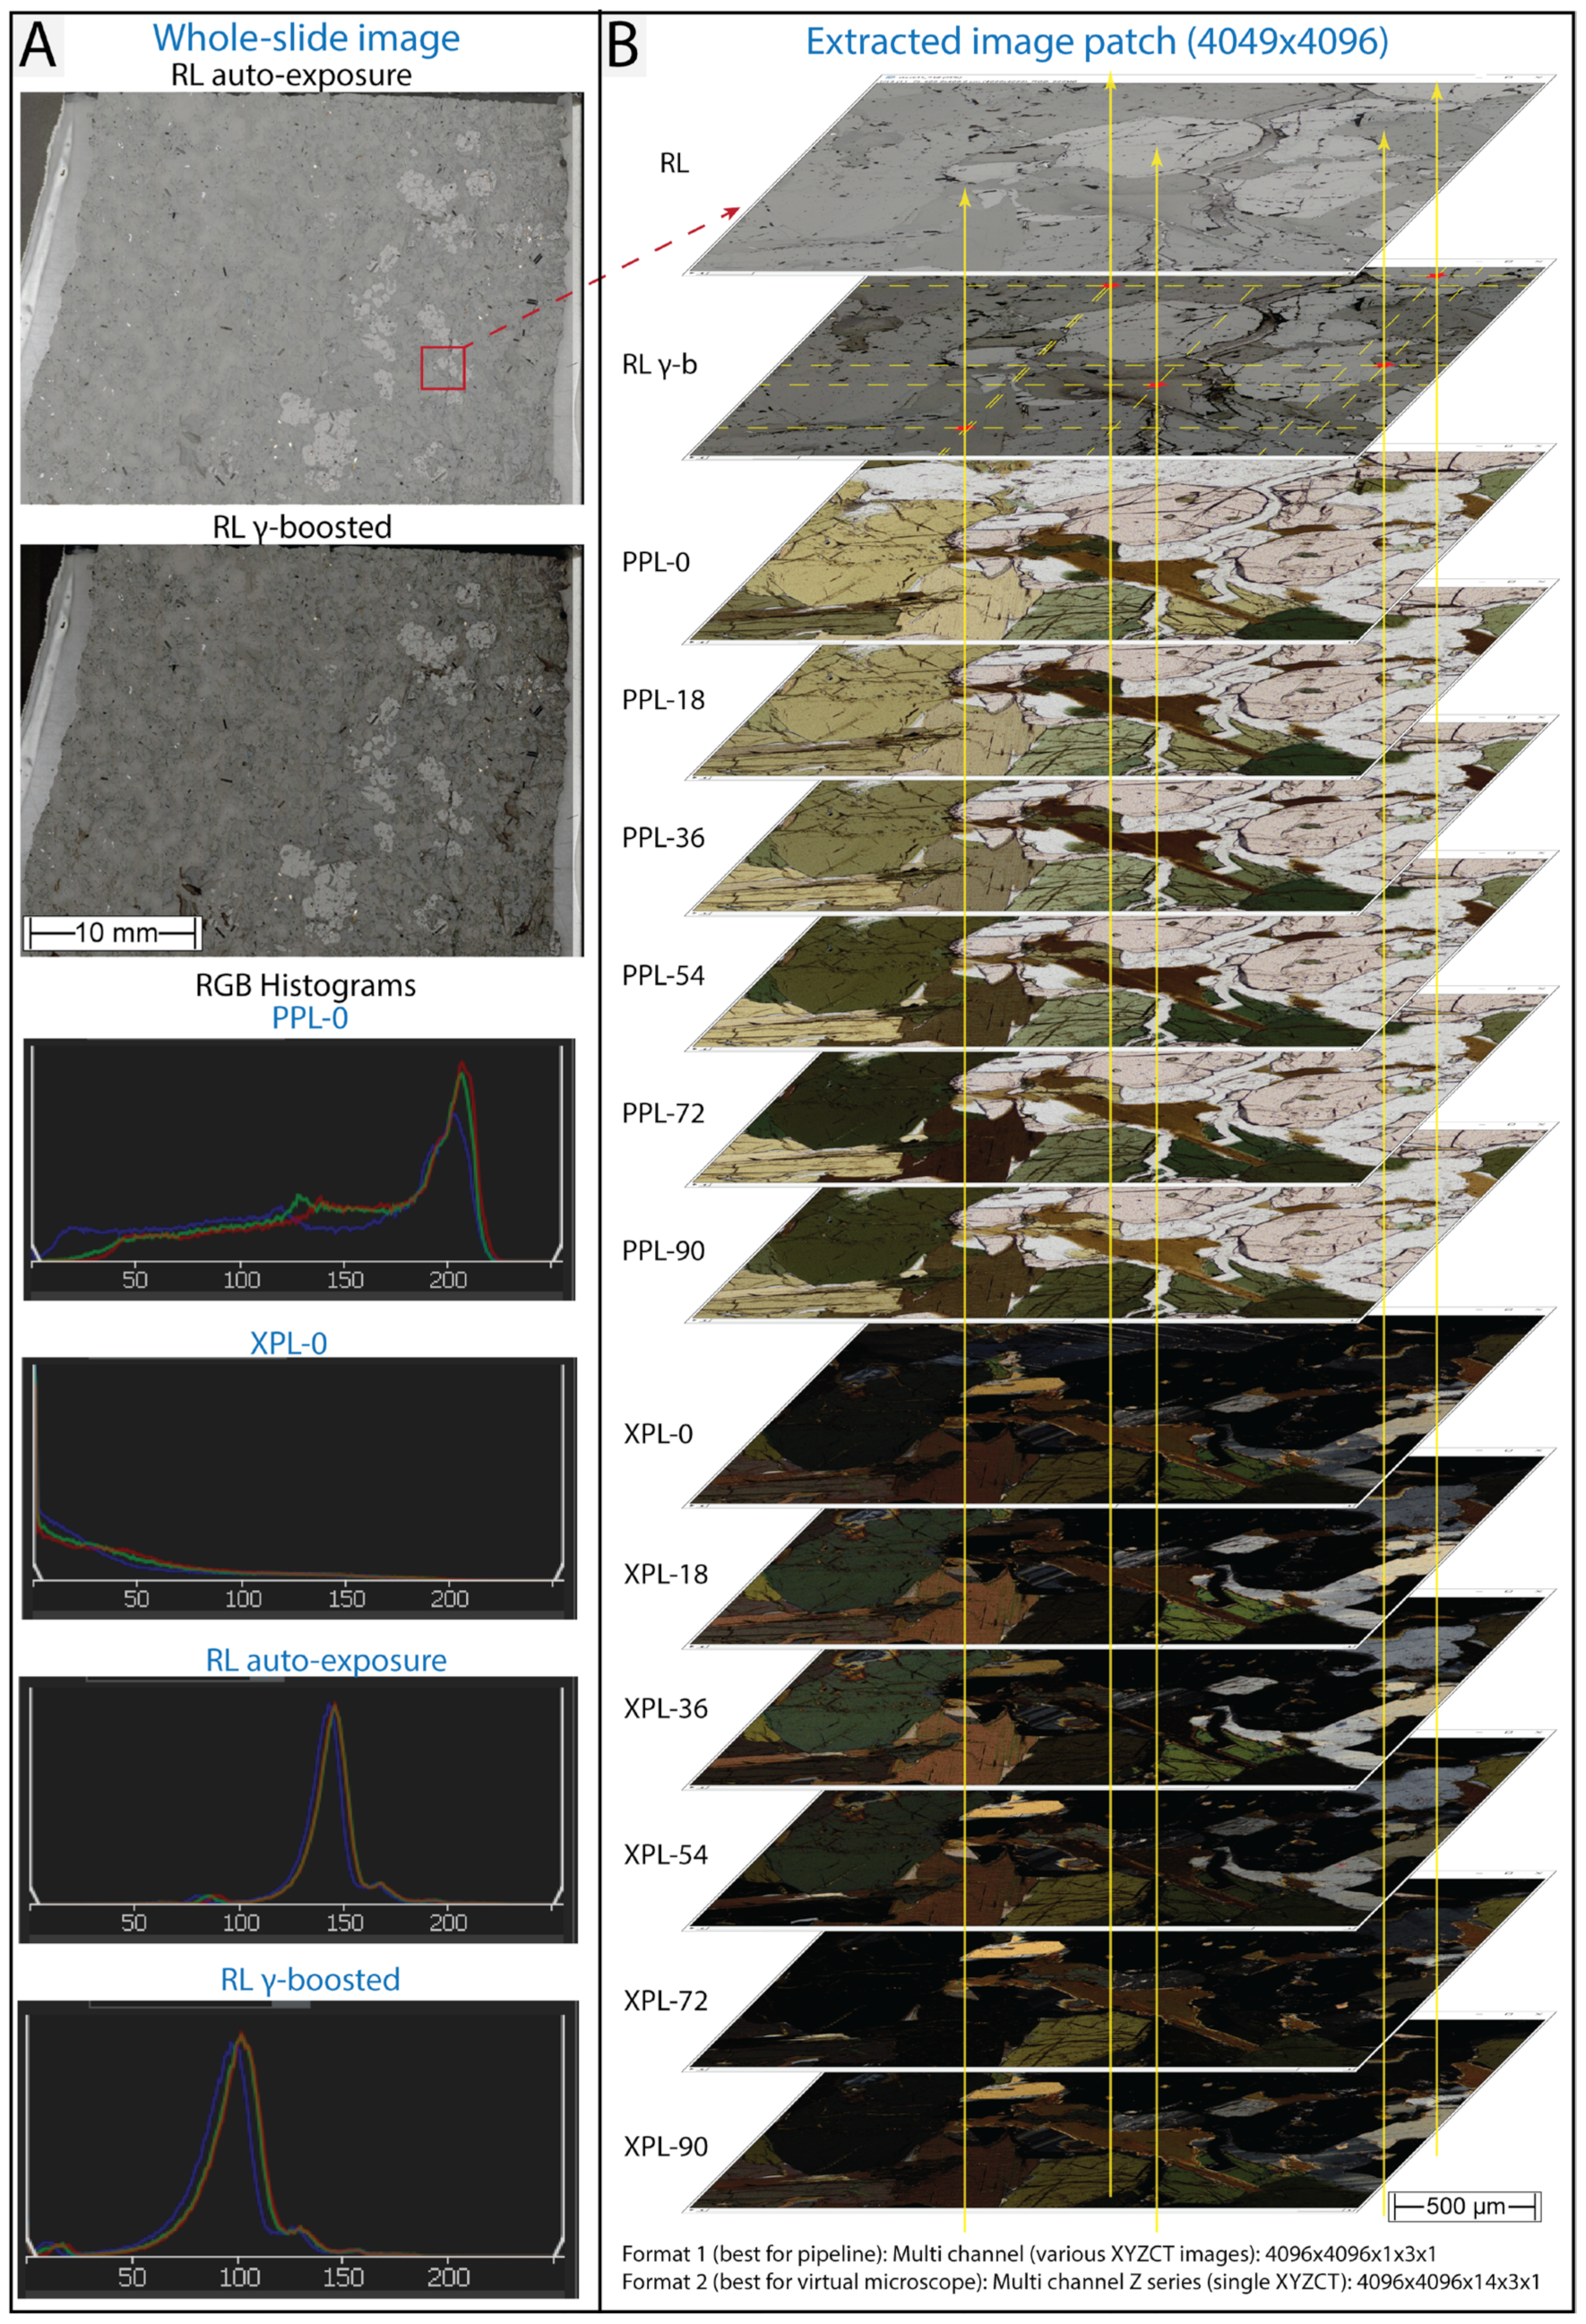
2.1.2. Repurposing the Scanner for Polarised Light Microscopy
- PLN 2X. Achromat: 2.691 µm/px. Working distance (WD) = 5.8 mm UIS 2 NA = 0.06.
- UPLFLN4X. Semi-apochromat: 1.369 µm/px. WD = 17 mm; OFN26 NA = 0.13.
- MPLFLN10X. Semi-apochromat for no glass cover slip: 0.547 µm/px. WD = 11 mm; OFN26 NA = 0.30.
- MPLAPON20XLEXT. Plan apochromat for no glass cover slip: 0.273 µm/px. WD = 1 mm FN18 NA = 0.6.
- MPLFLN40X. Semi-apochromat for no glass cover slip: 0.137 µm/px. WD = 0.63 mm; CFN26 NA = 0.75.
2.1.3. Olympus ASW Software
2.2. Image Analysis Pipeline
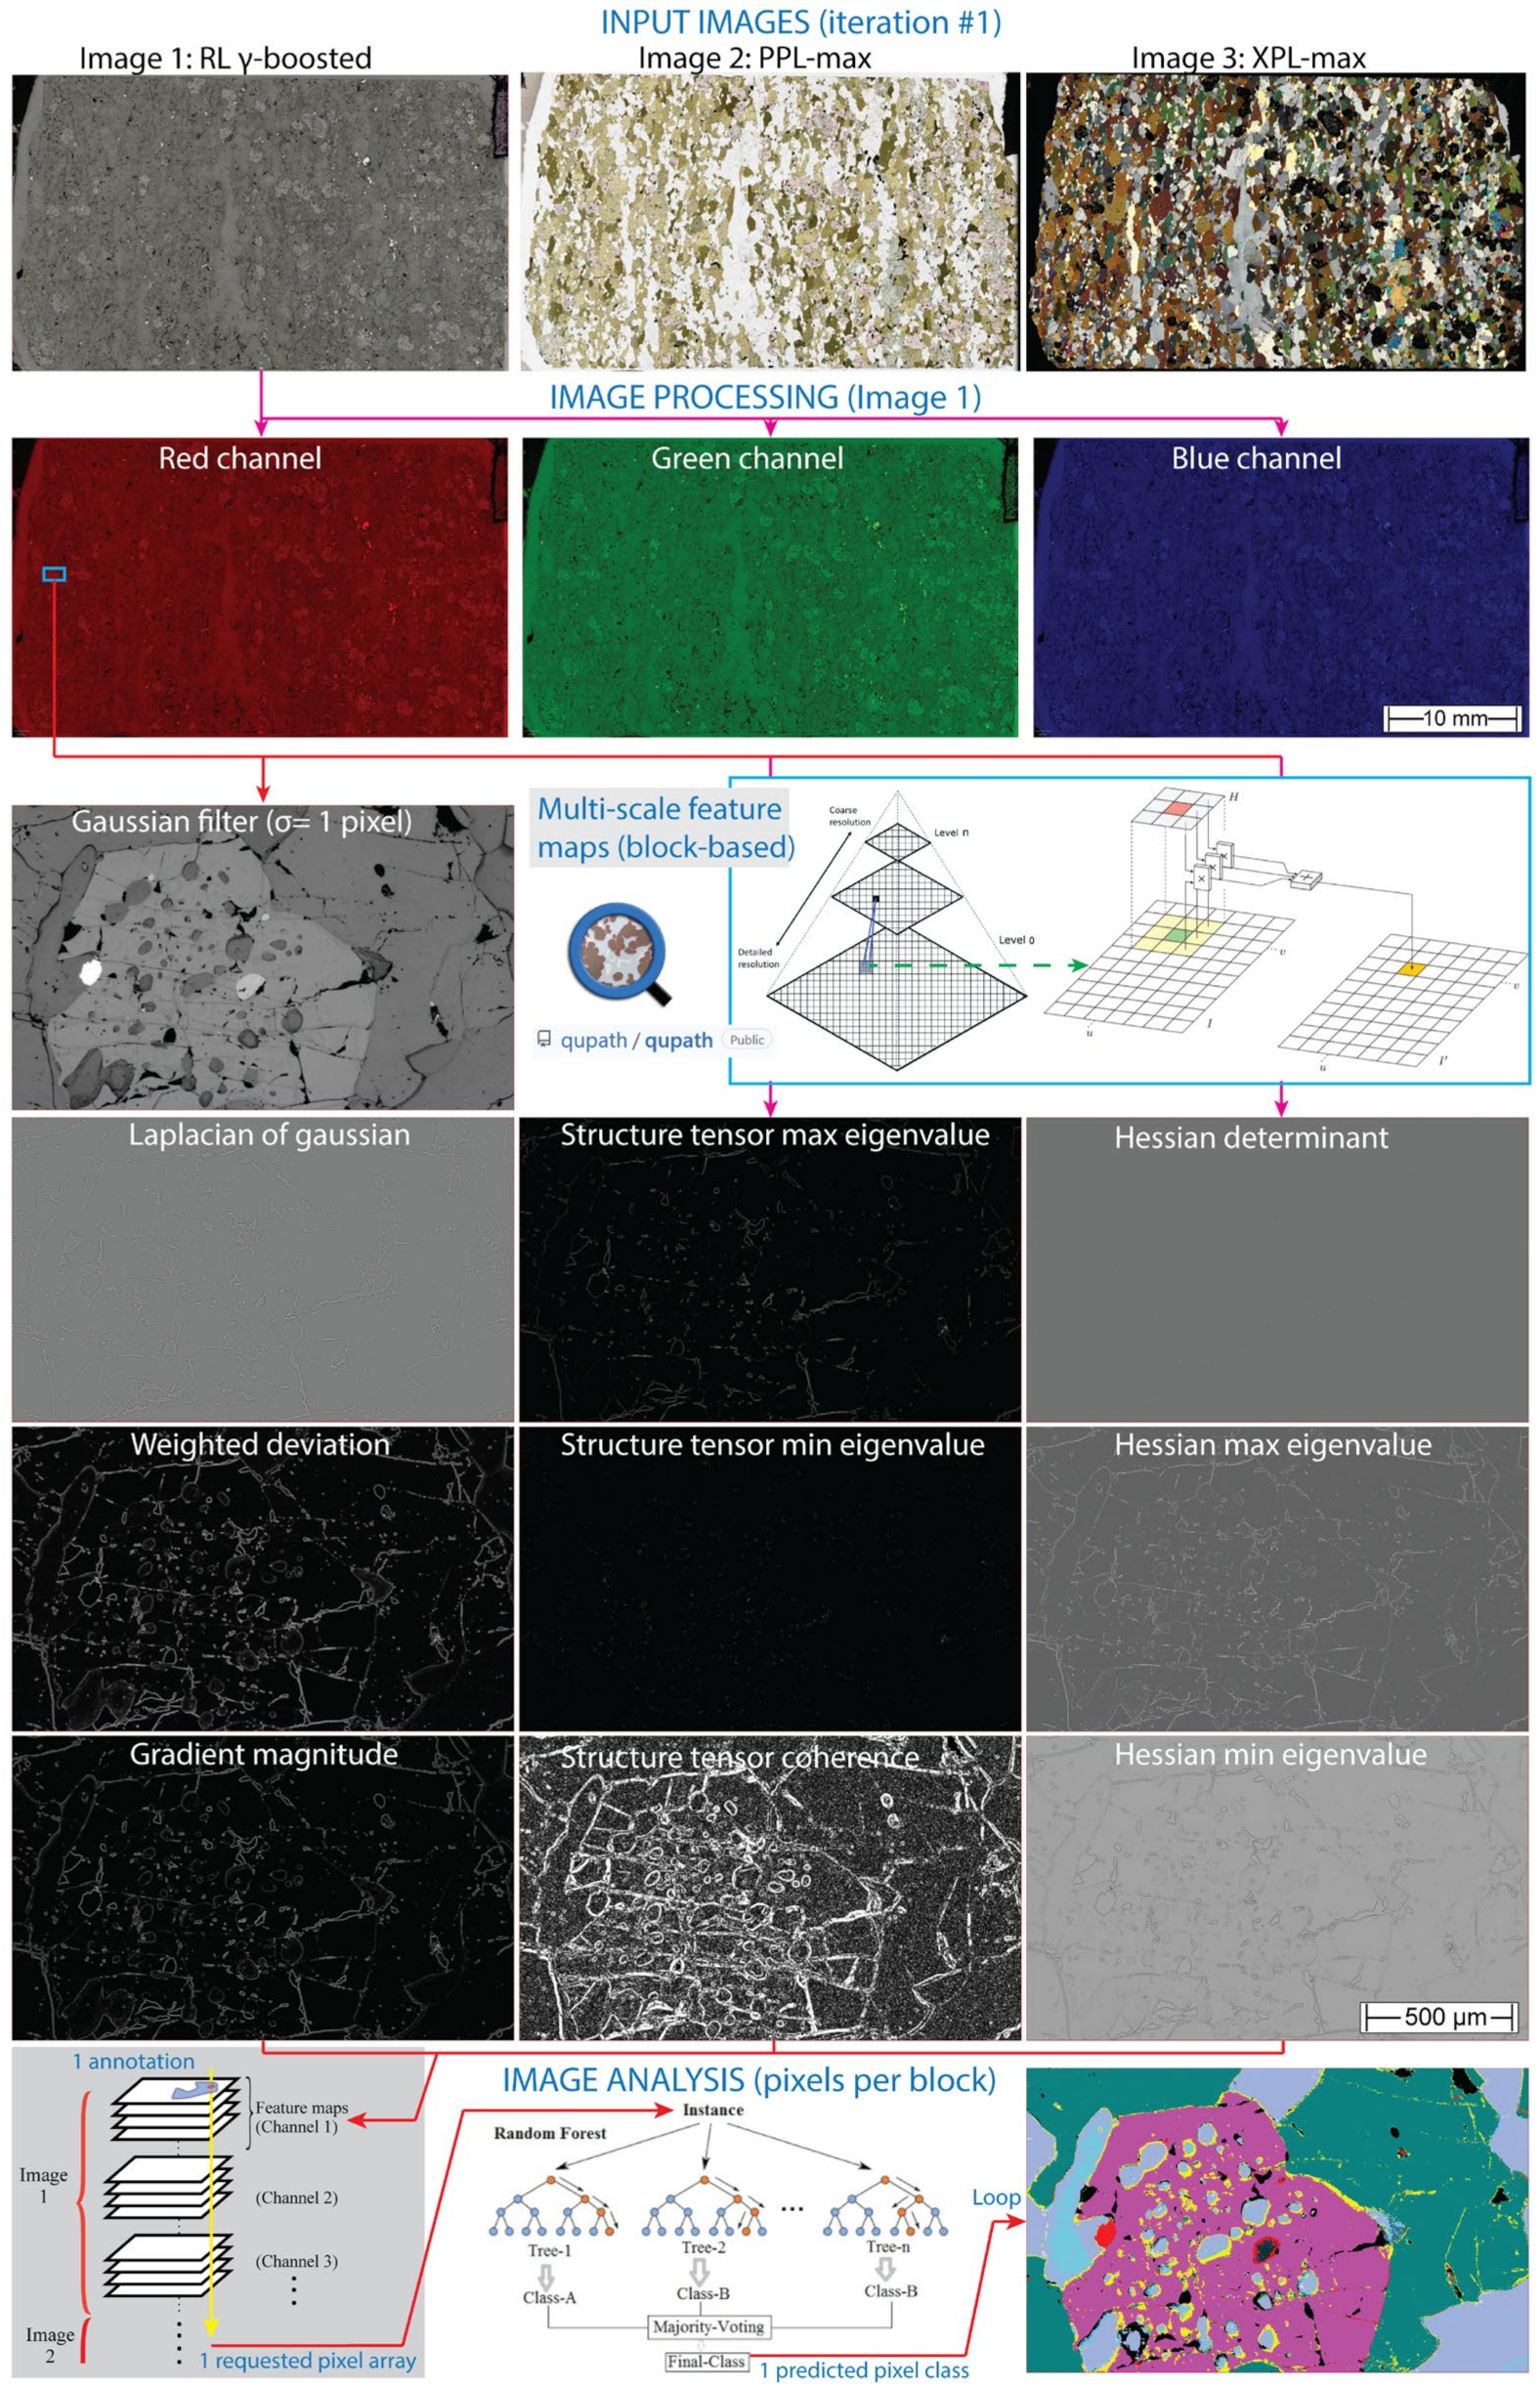
2.2.1. Image Analysis Pipeline Summary
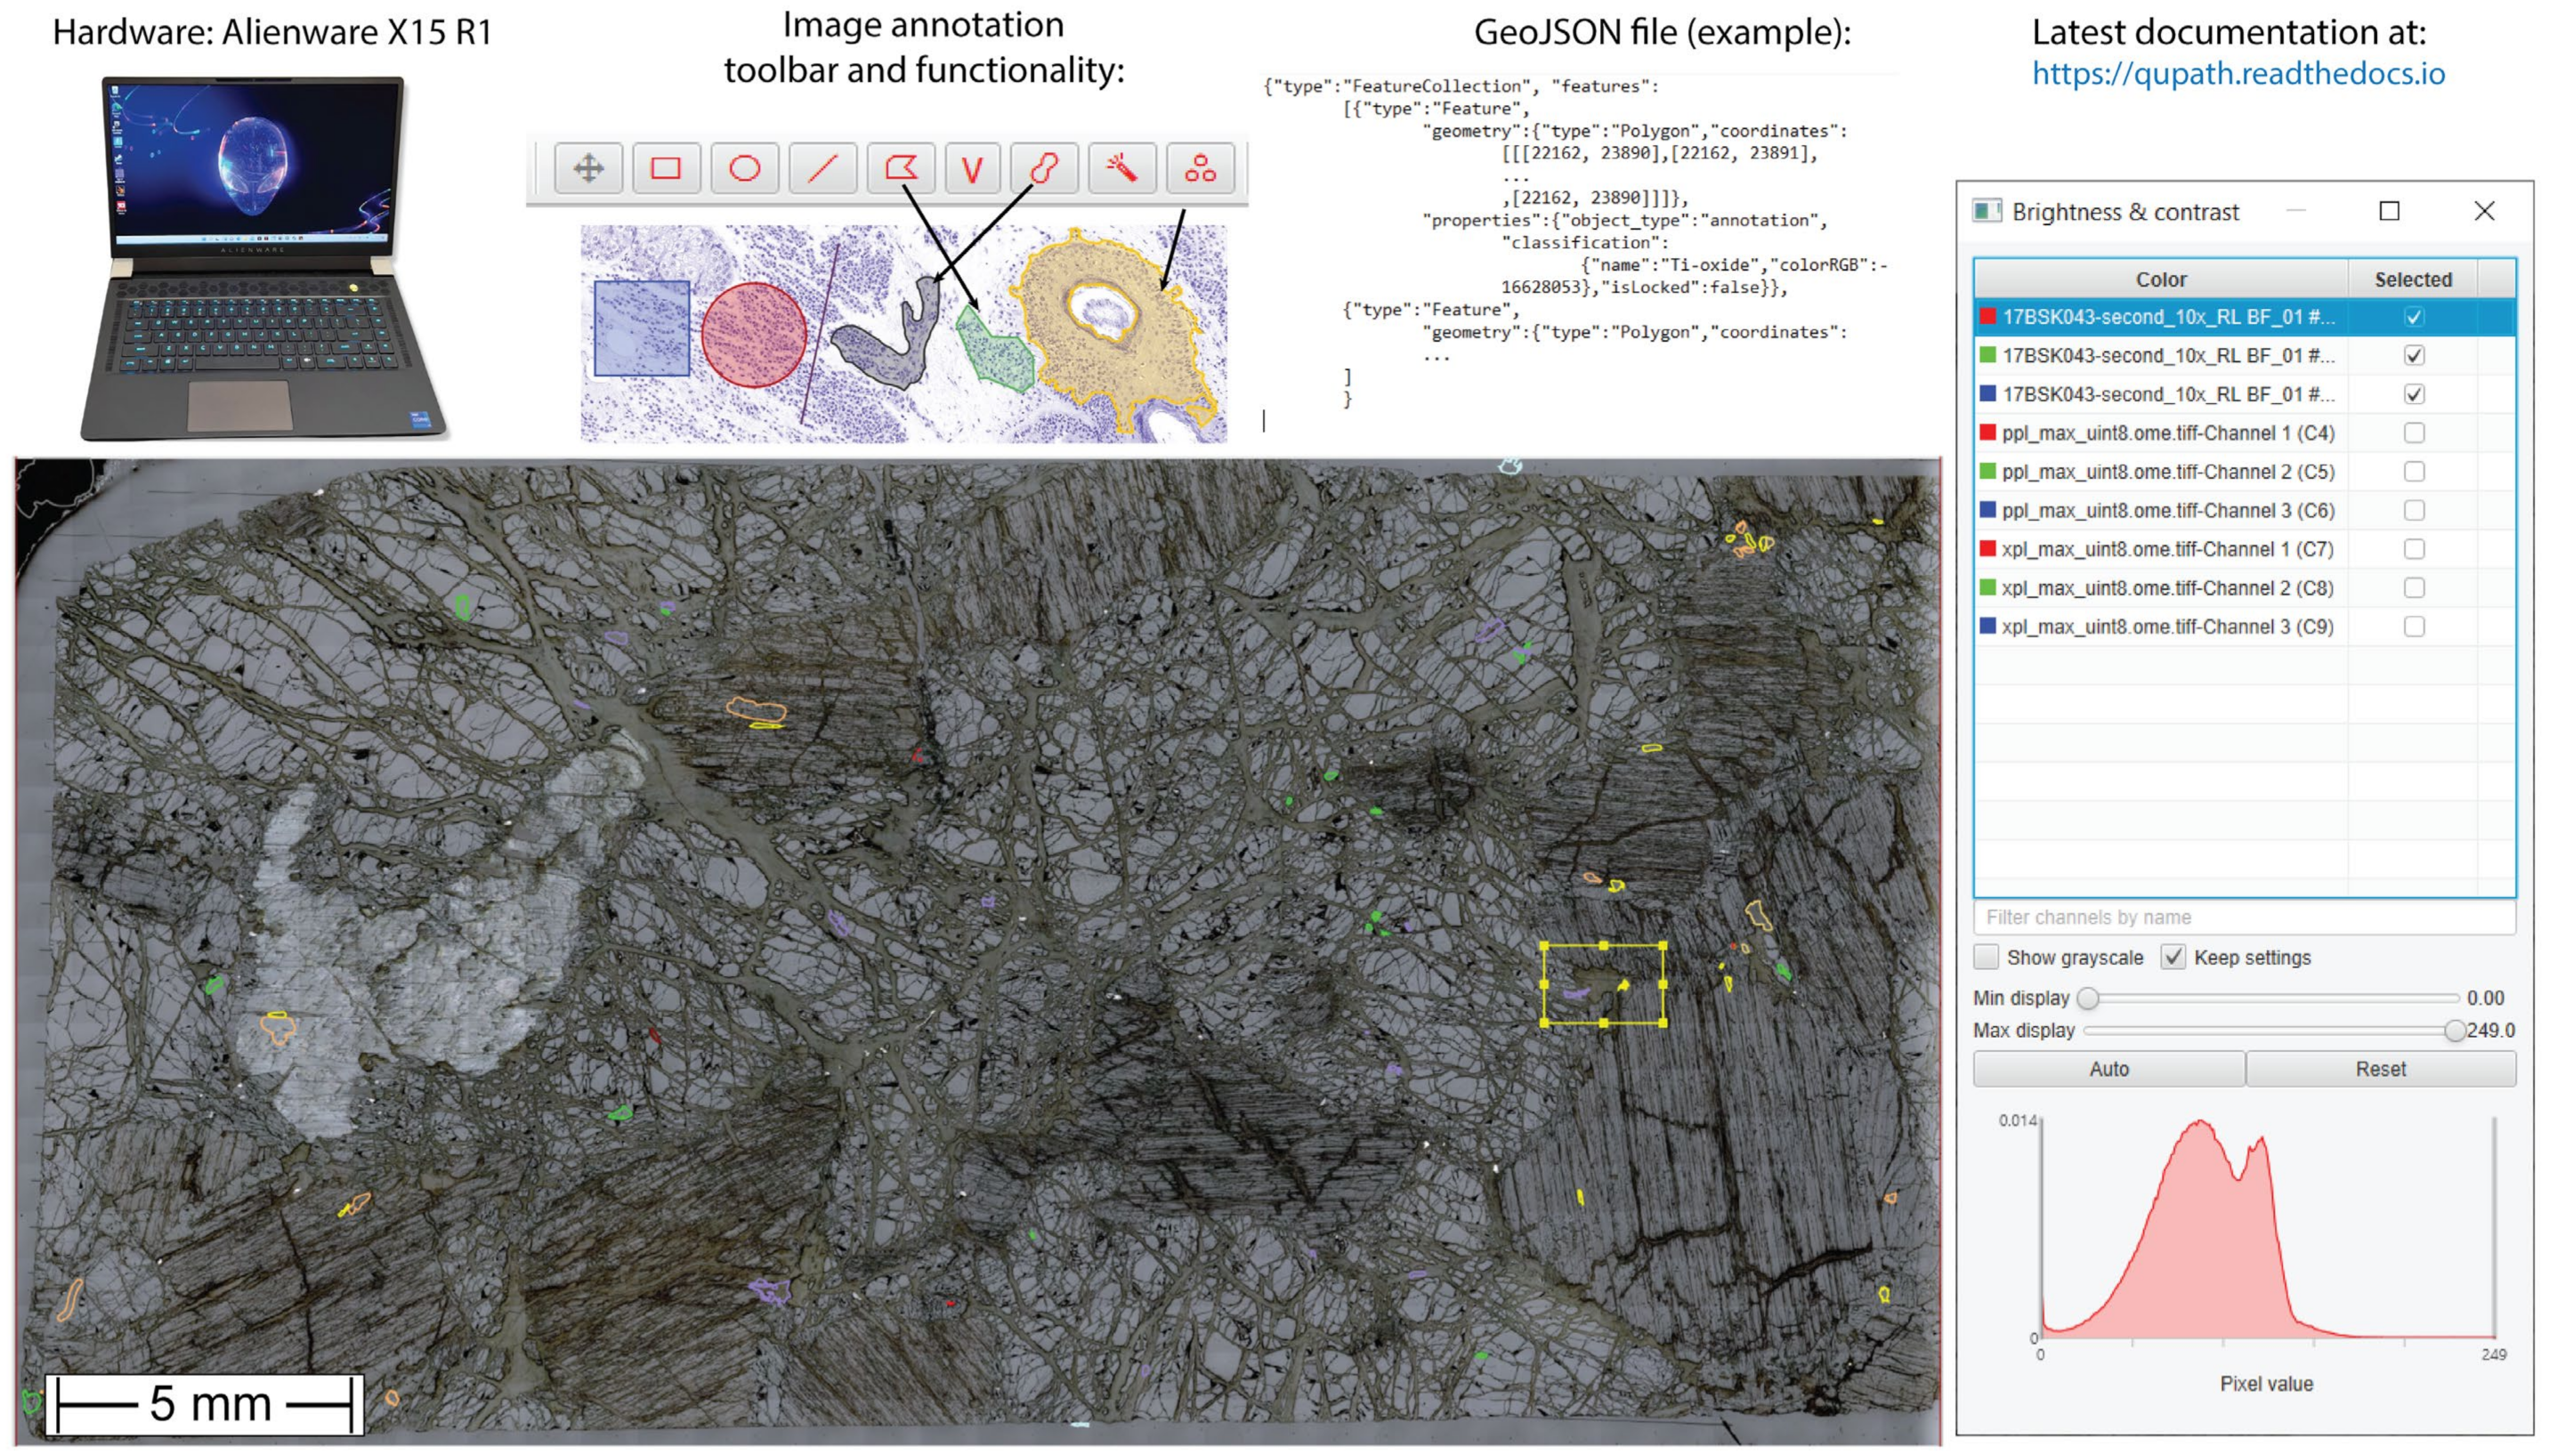
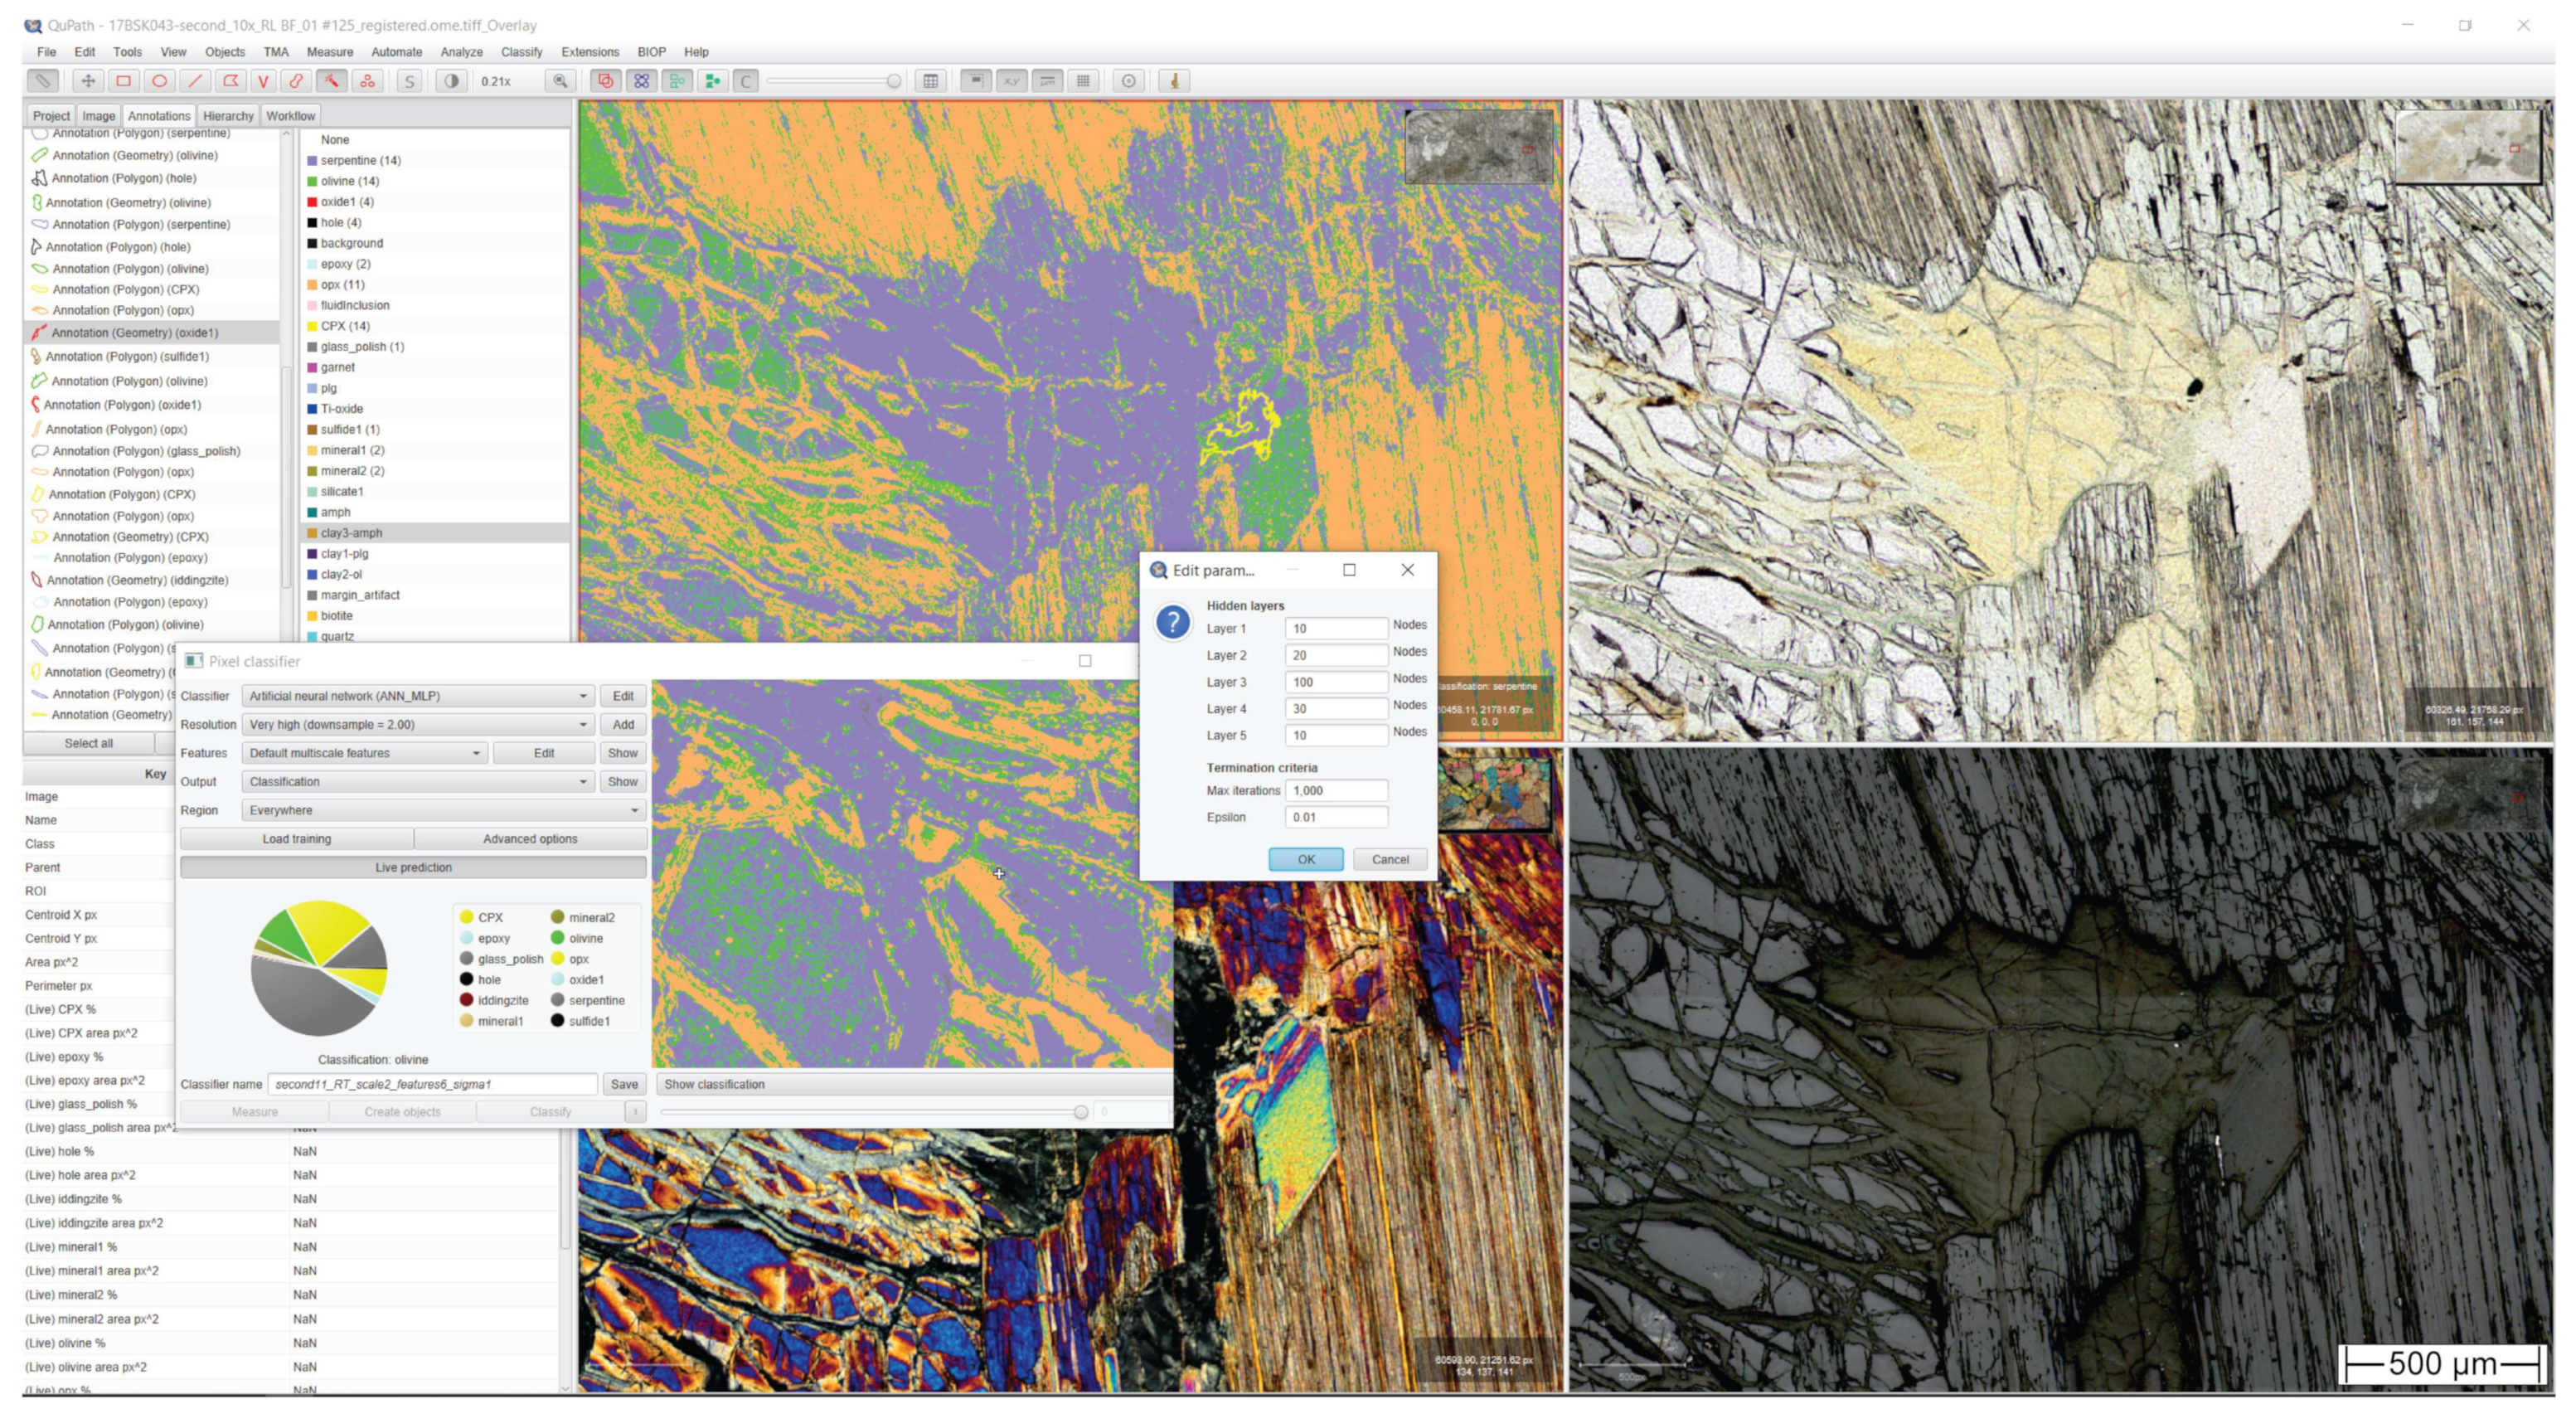
2.2.2. QuPath Software
3. Results
3.1. Findings from Instrument Calibration
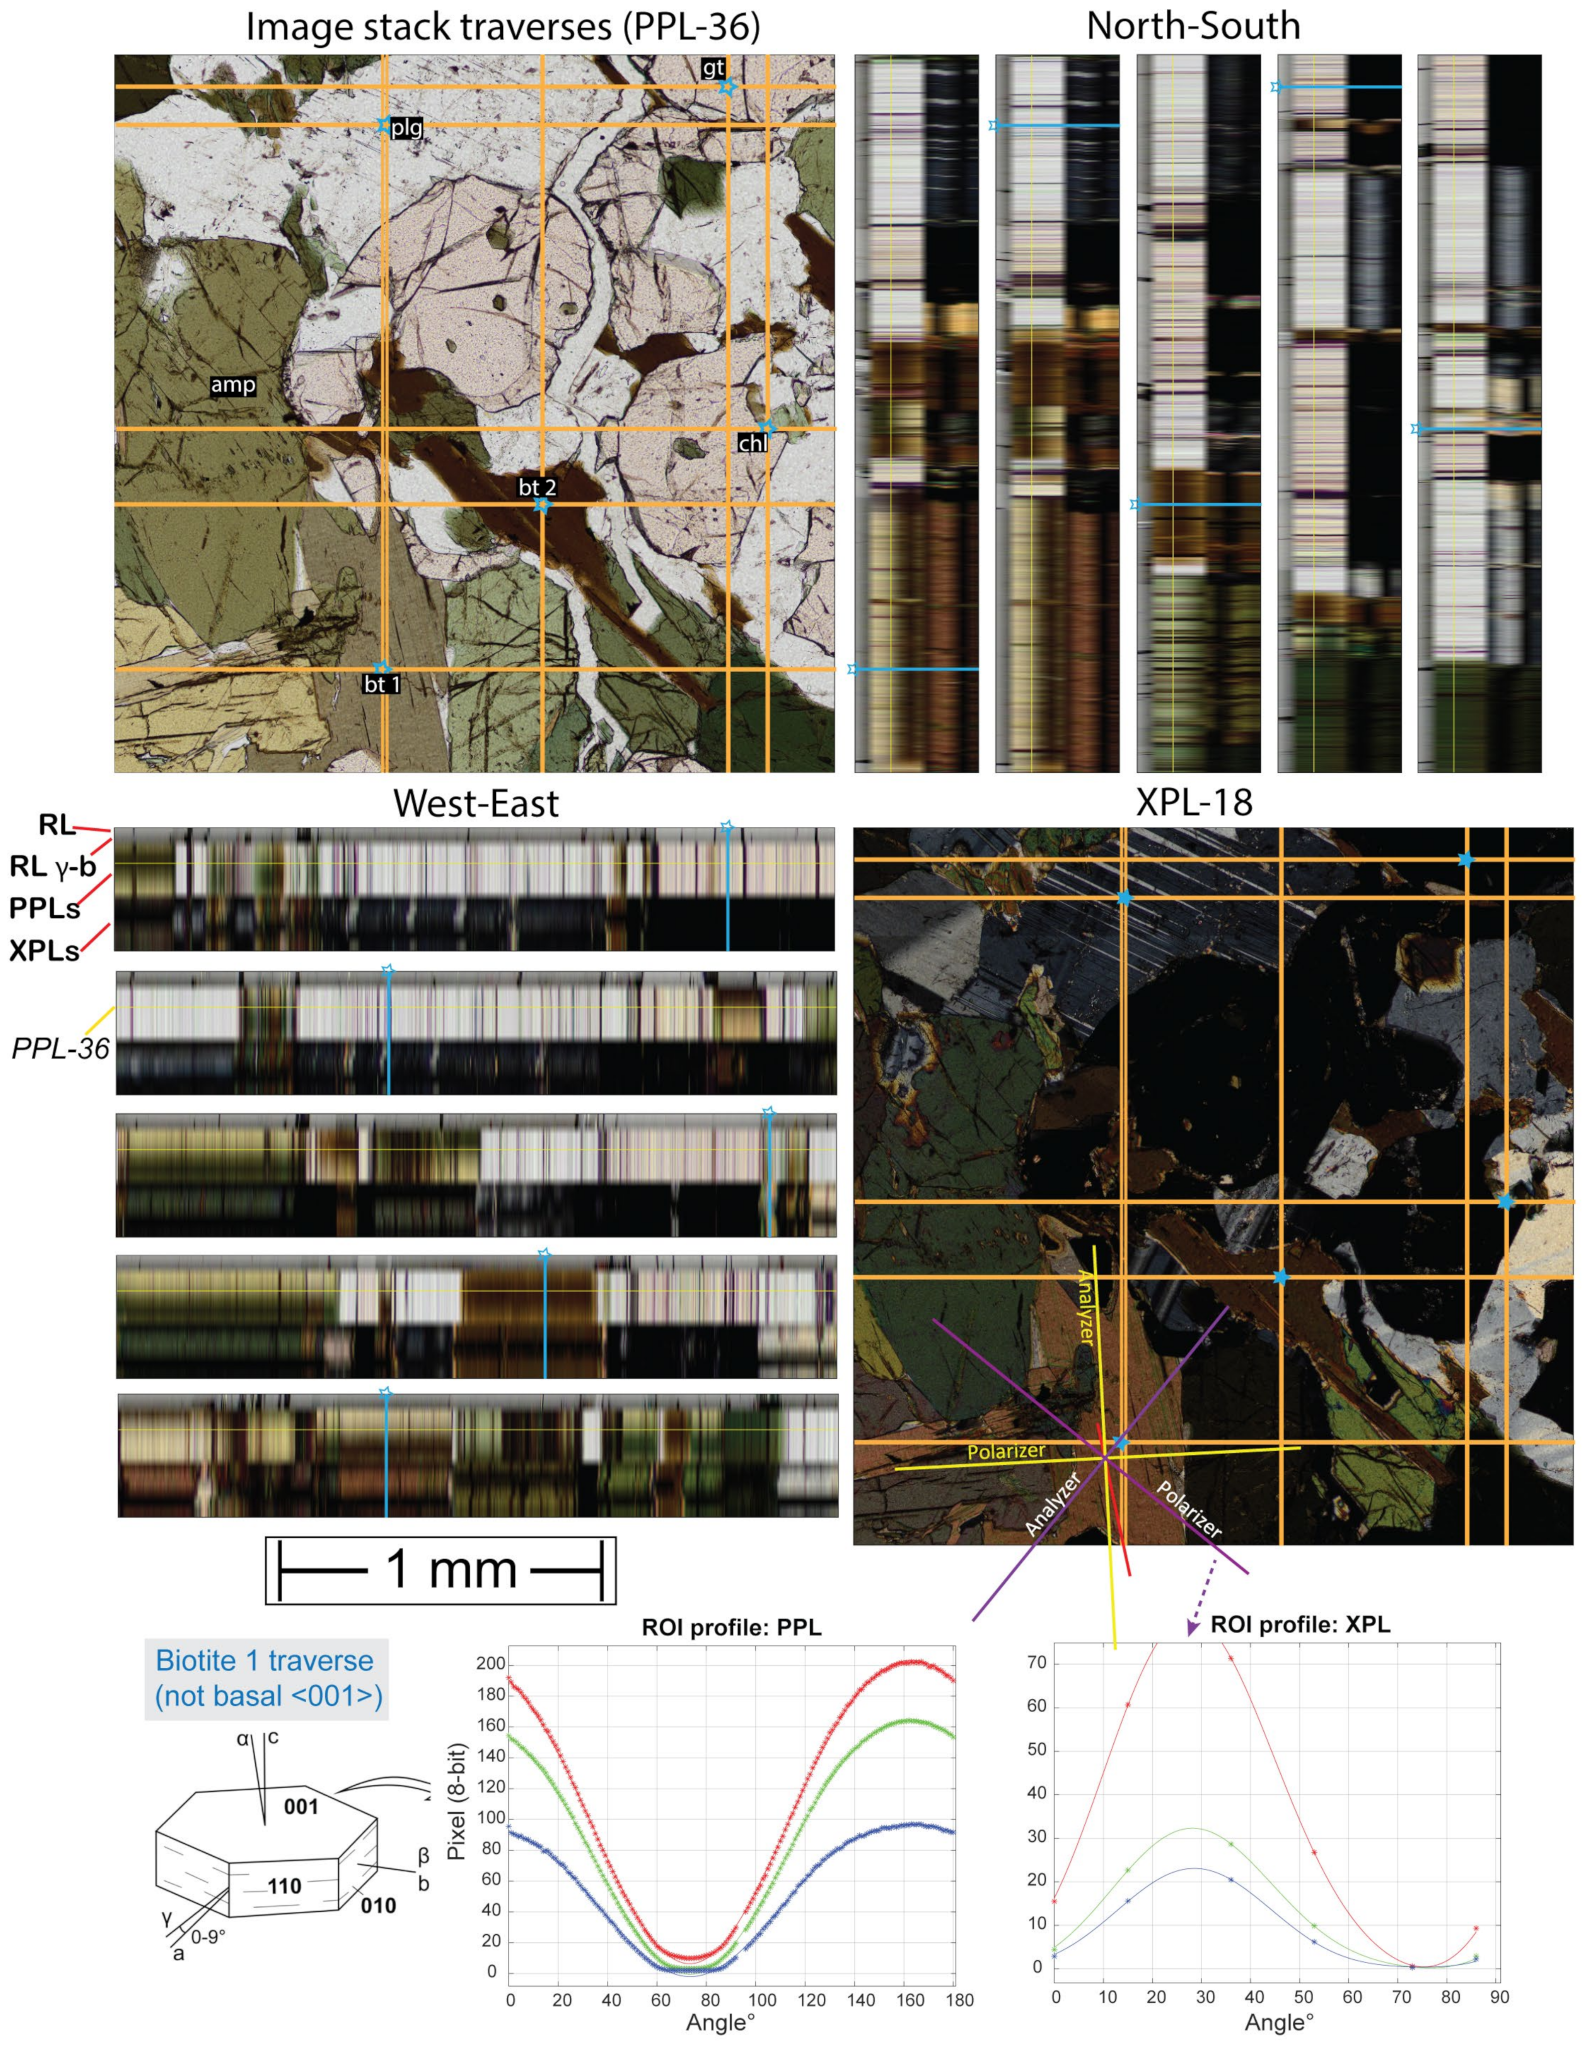
3.2. Optical Ray Tracing
3.3. Petrographic Observations on Ray Trace Images
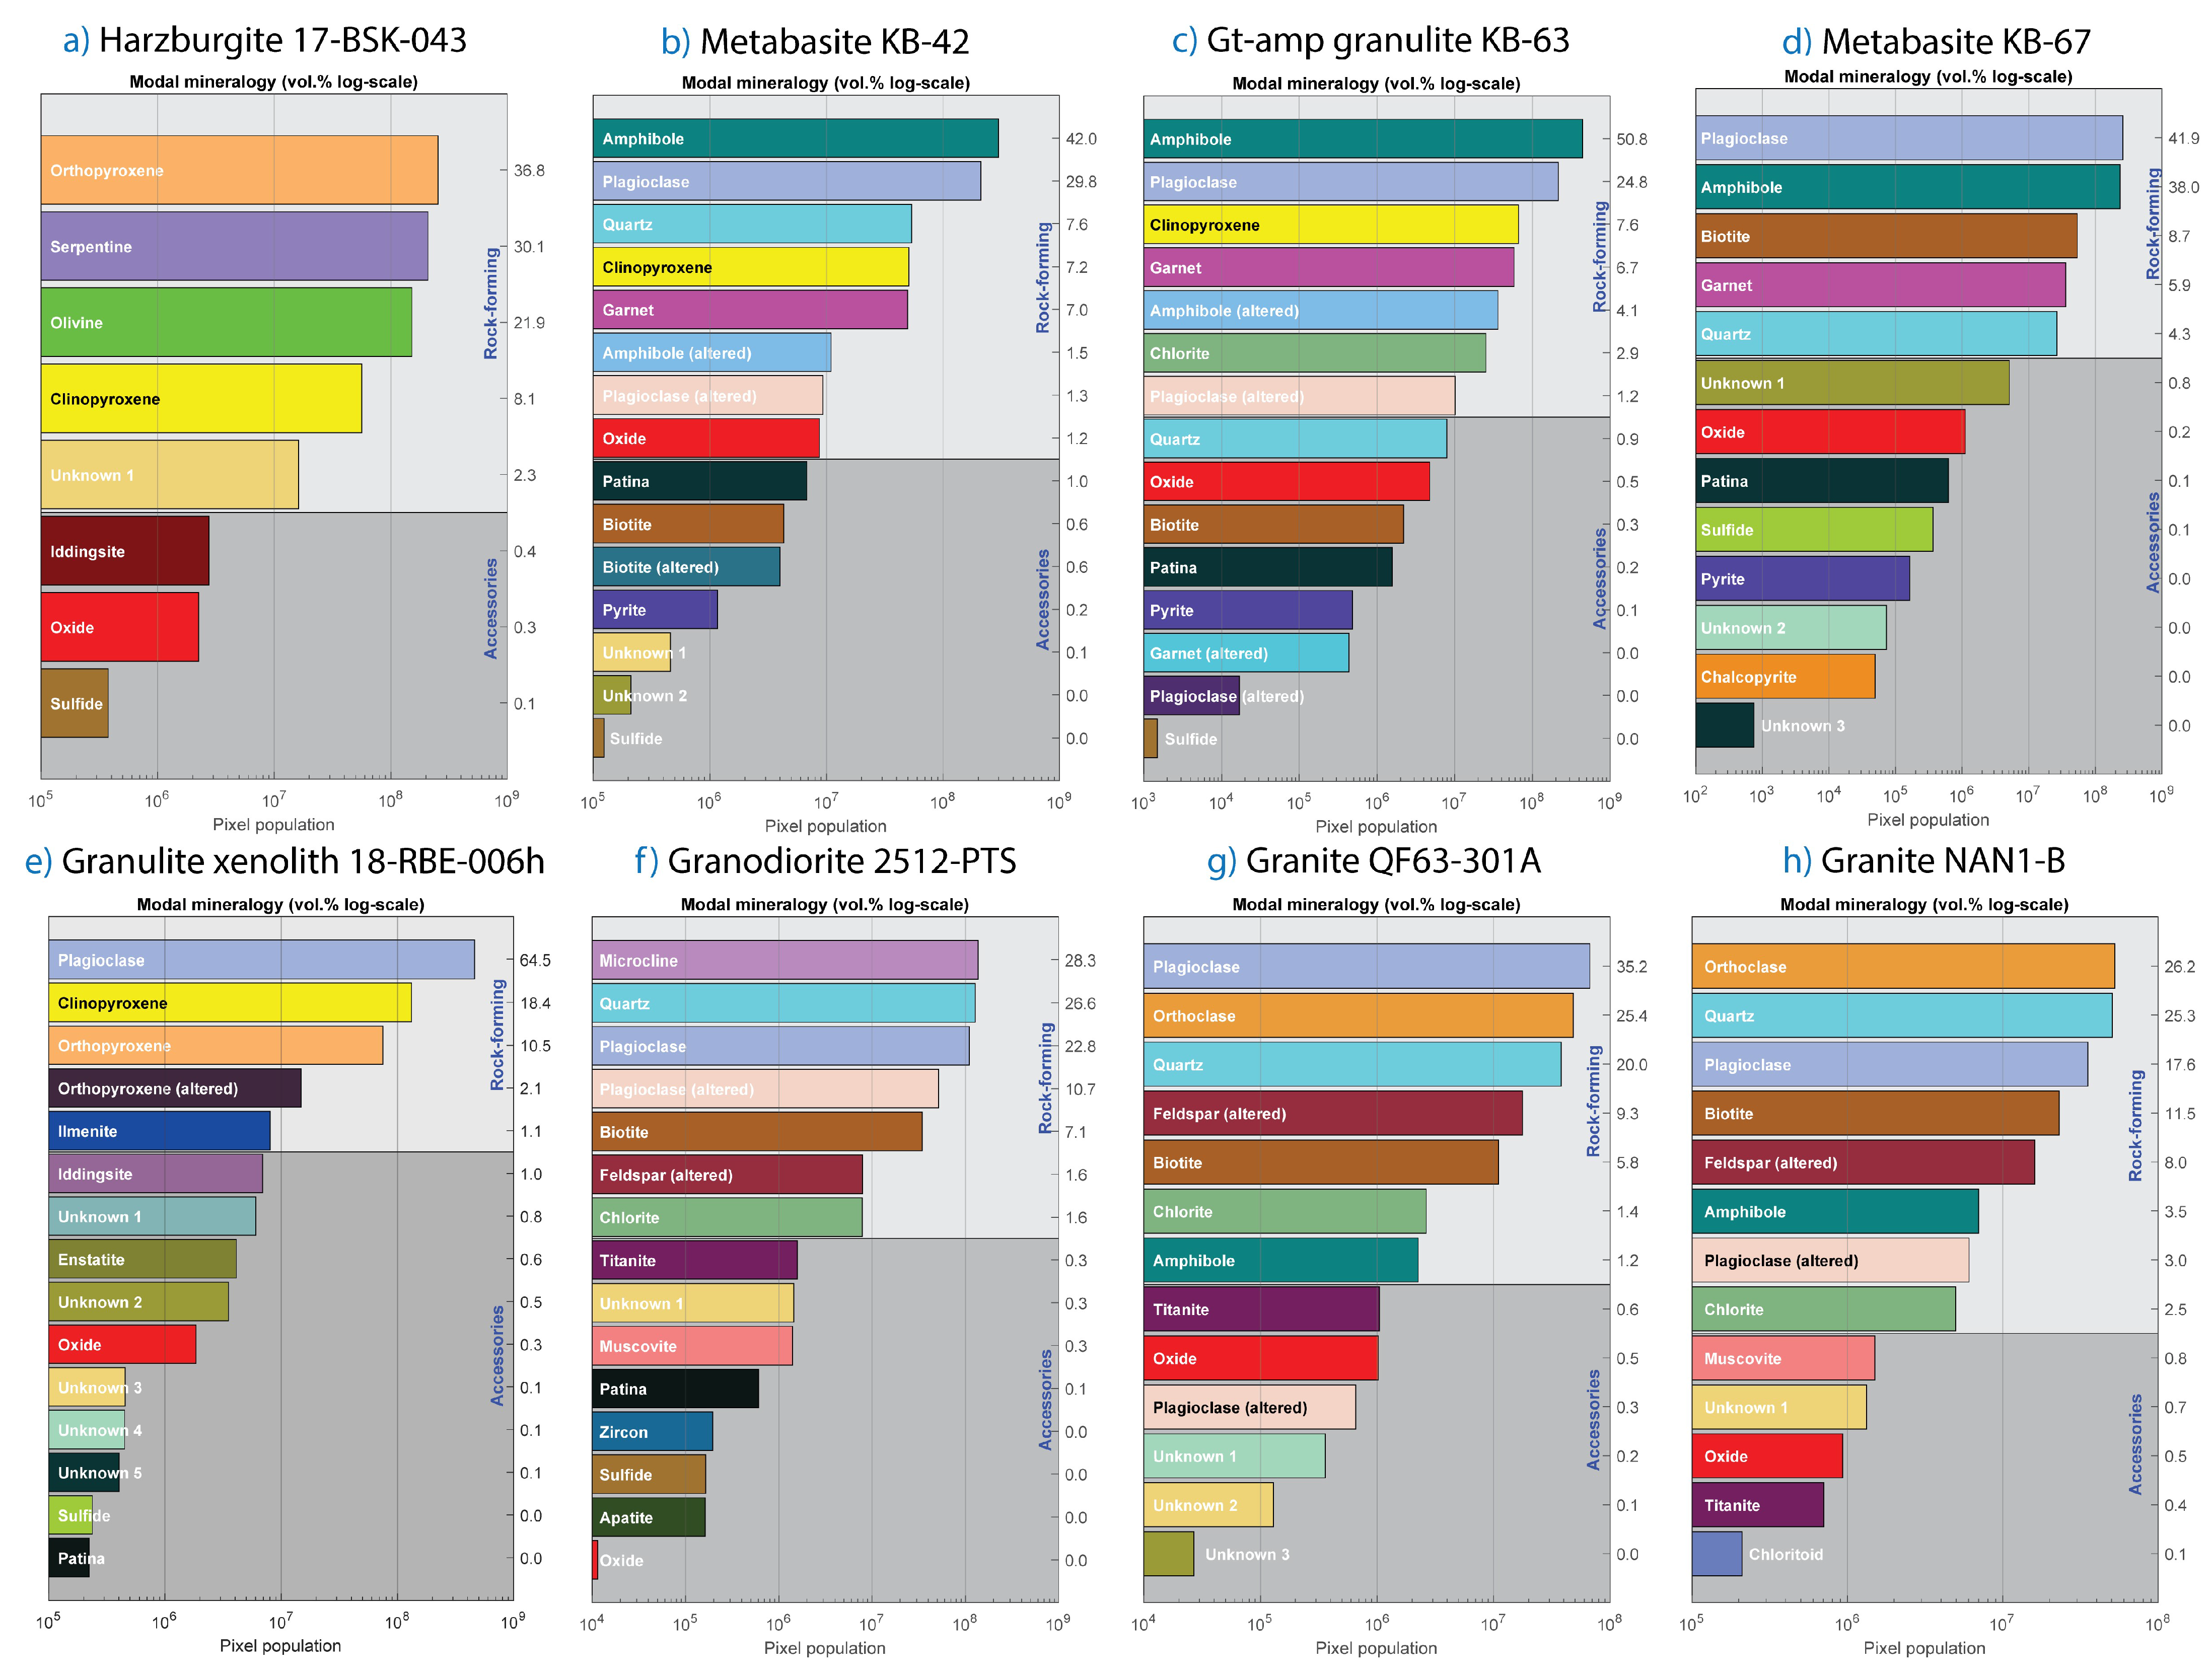
3.4. Phase Maps and Modal Mineralogy with Semantic Segmentation
4. Discussion
4.1. Comparison between Optical and SEM-EDX Modal Mineralogies
4.2. Examples of Challenging Segmentation of Optically Similar Phases and Very Fine-Grained Minerals
4.3. Ray Tracing Insights
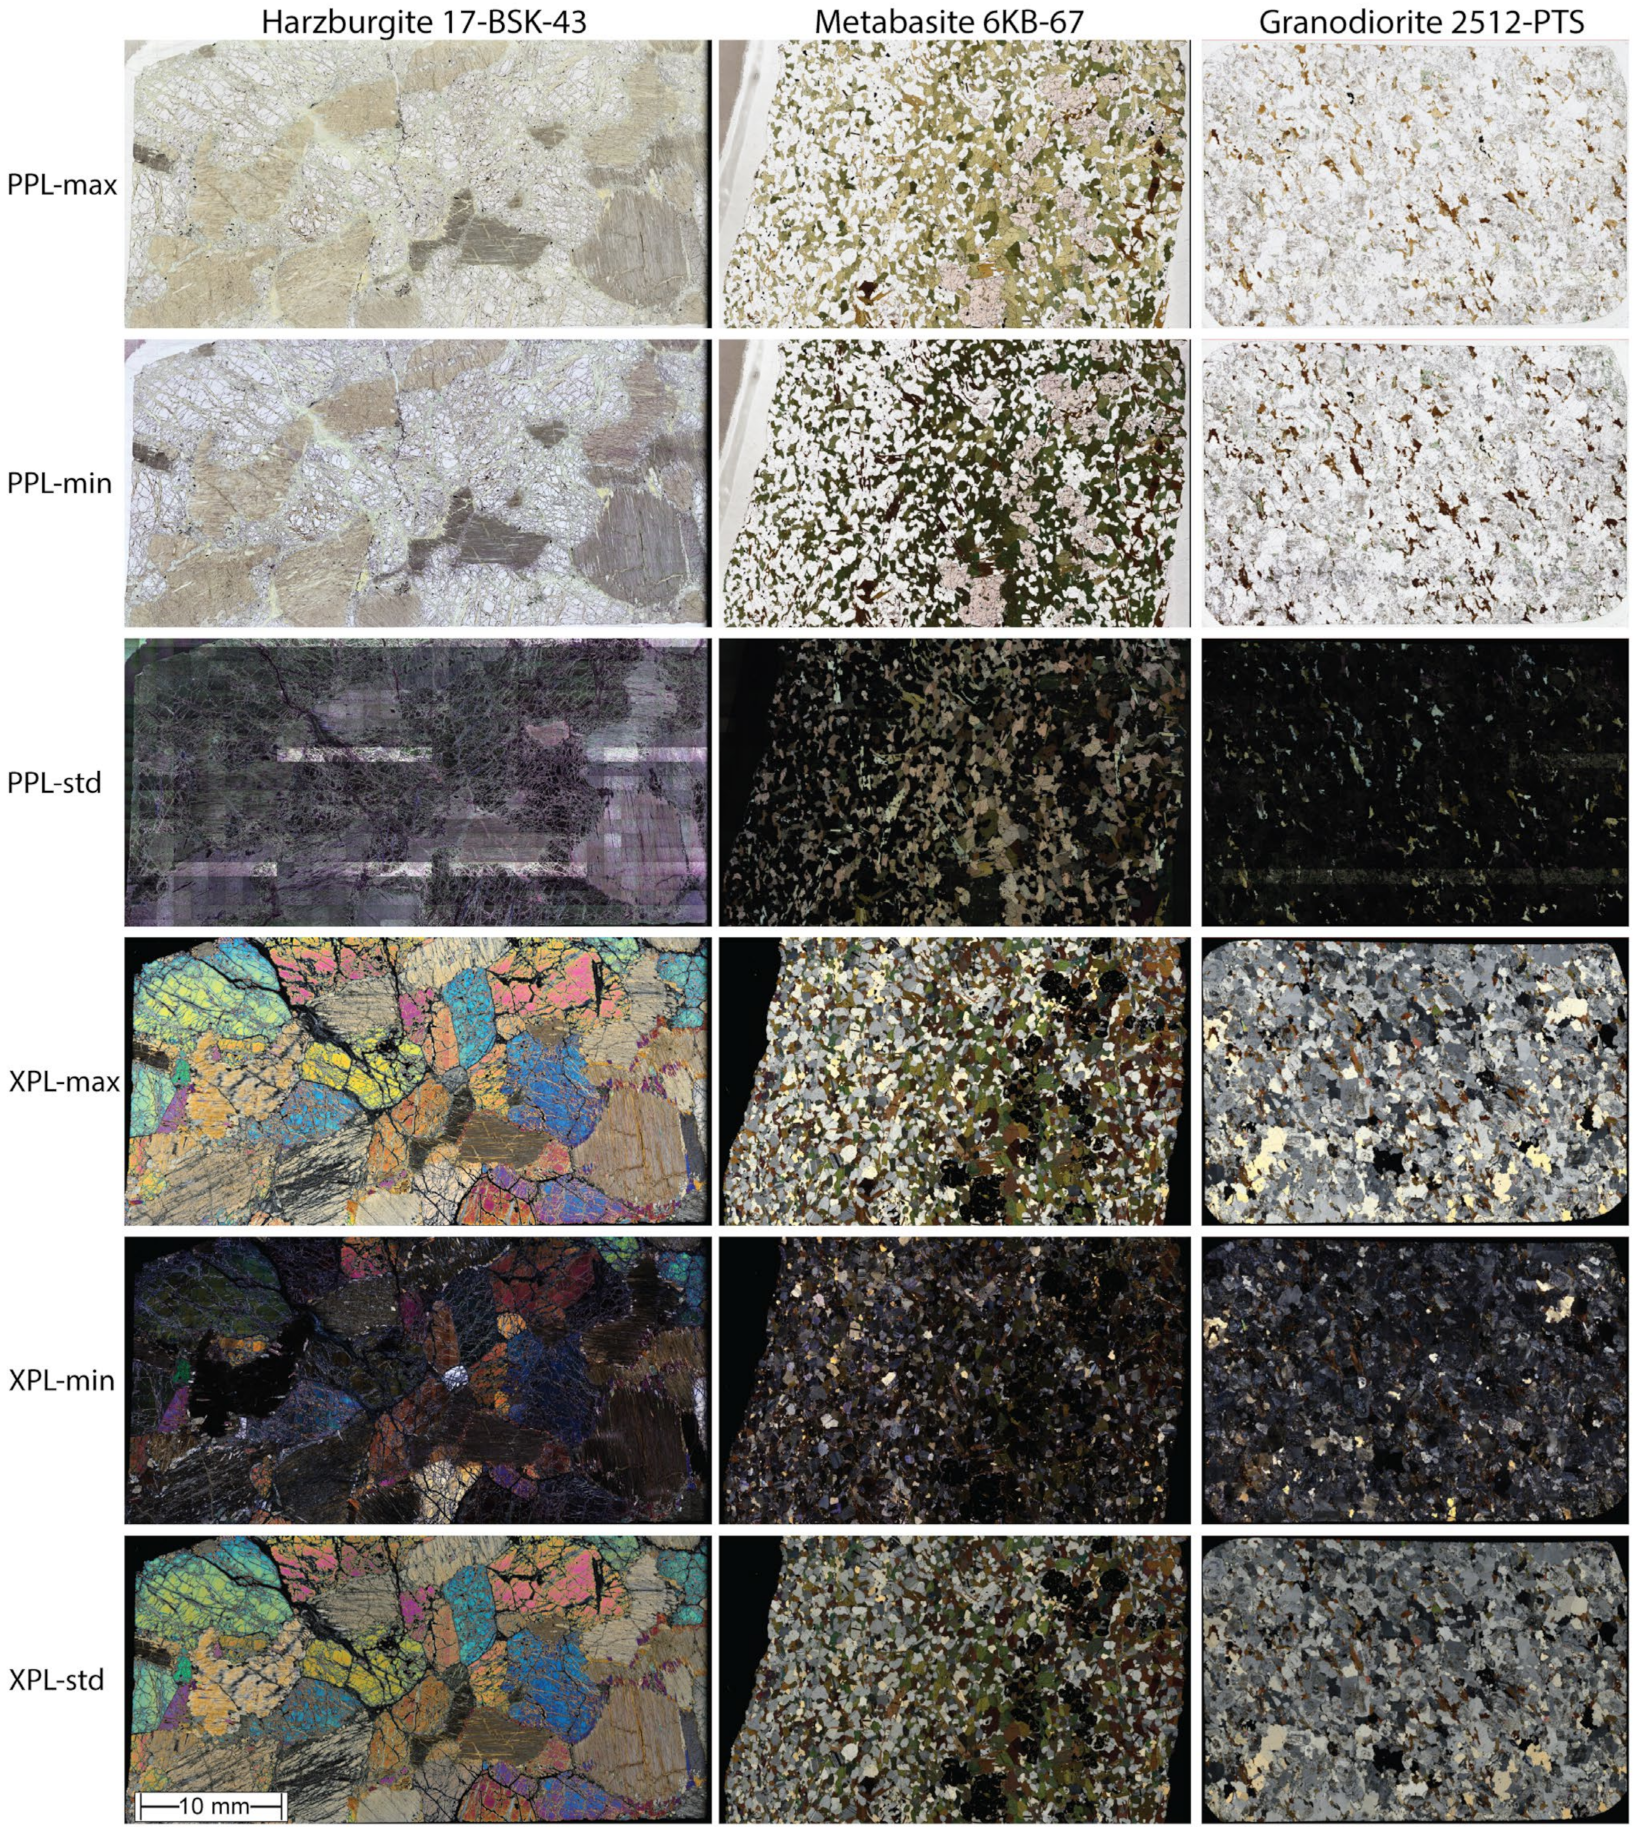
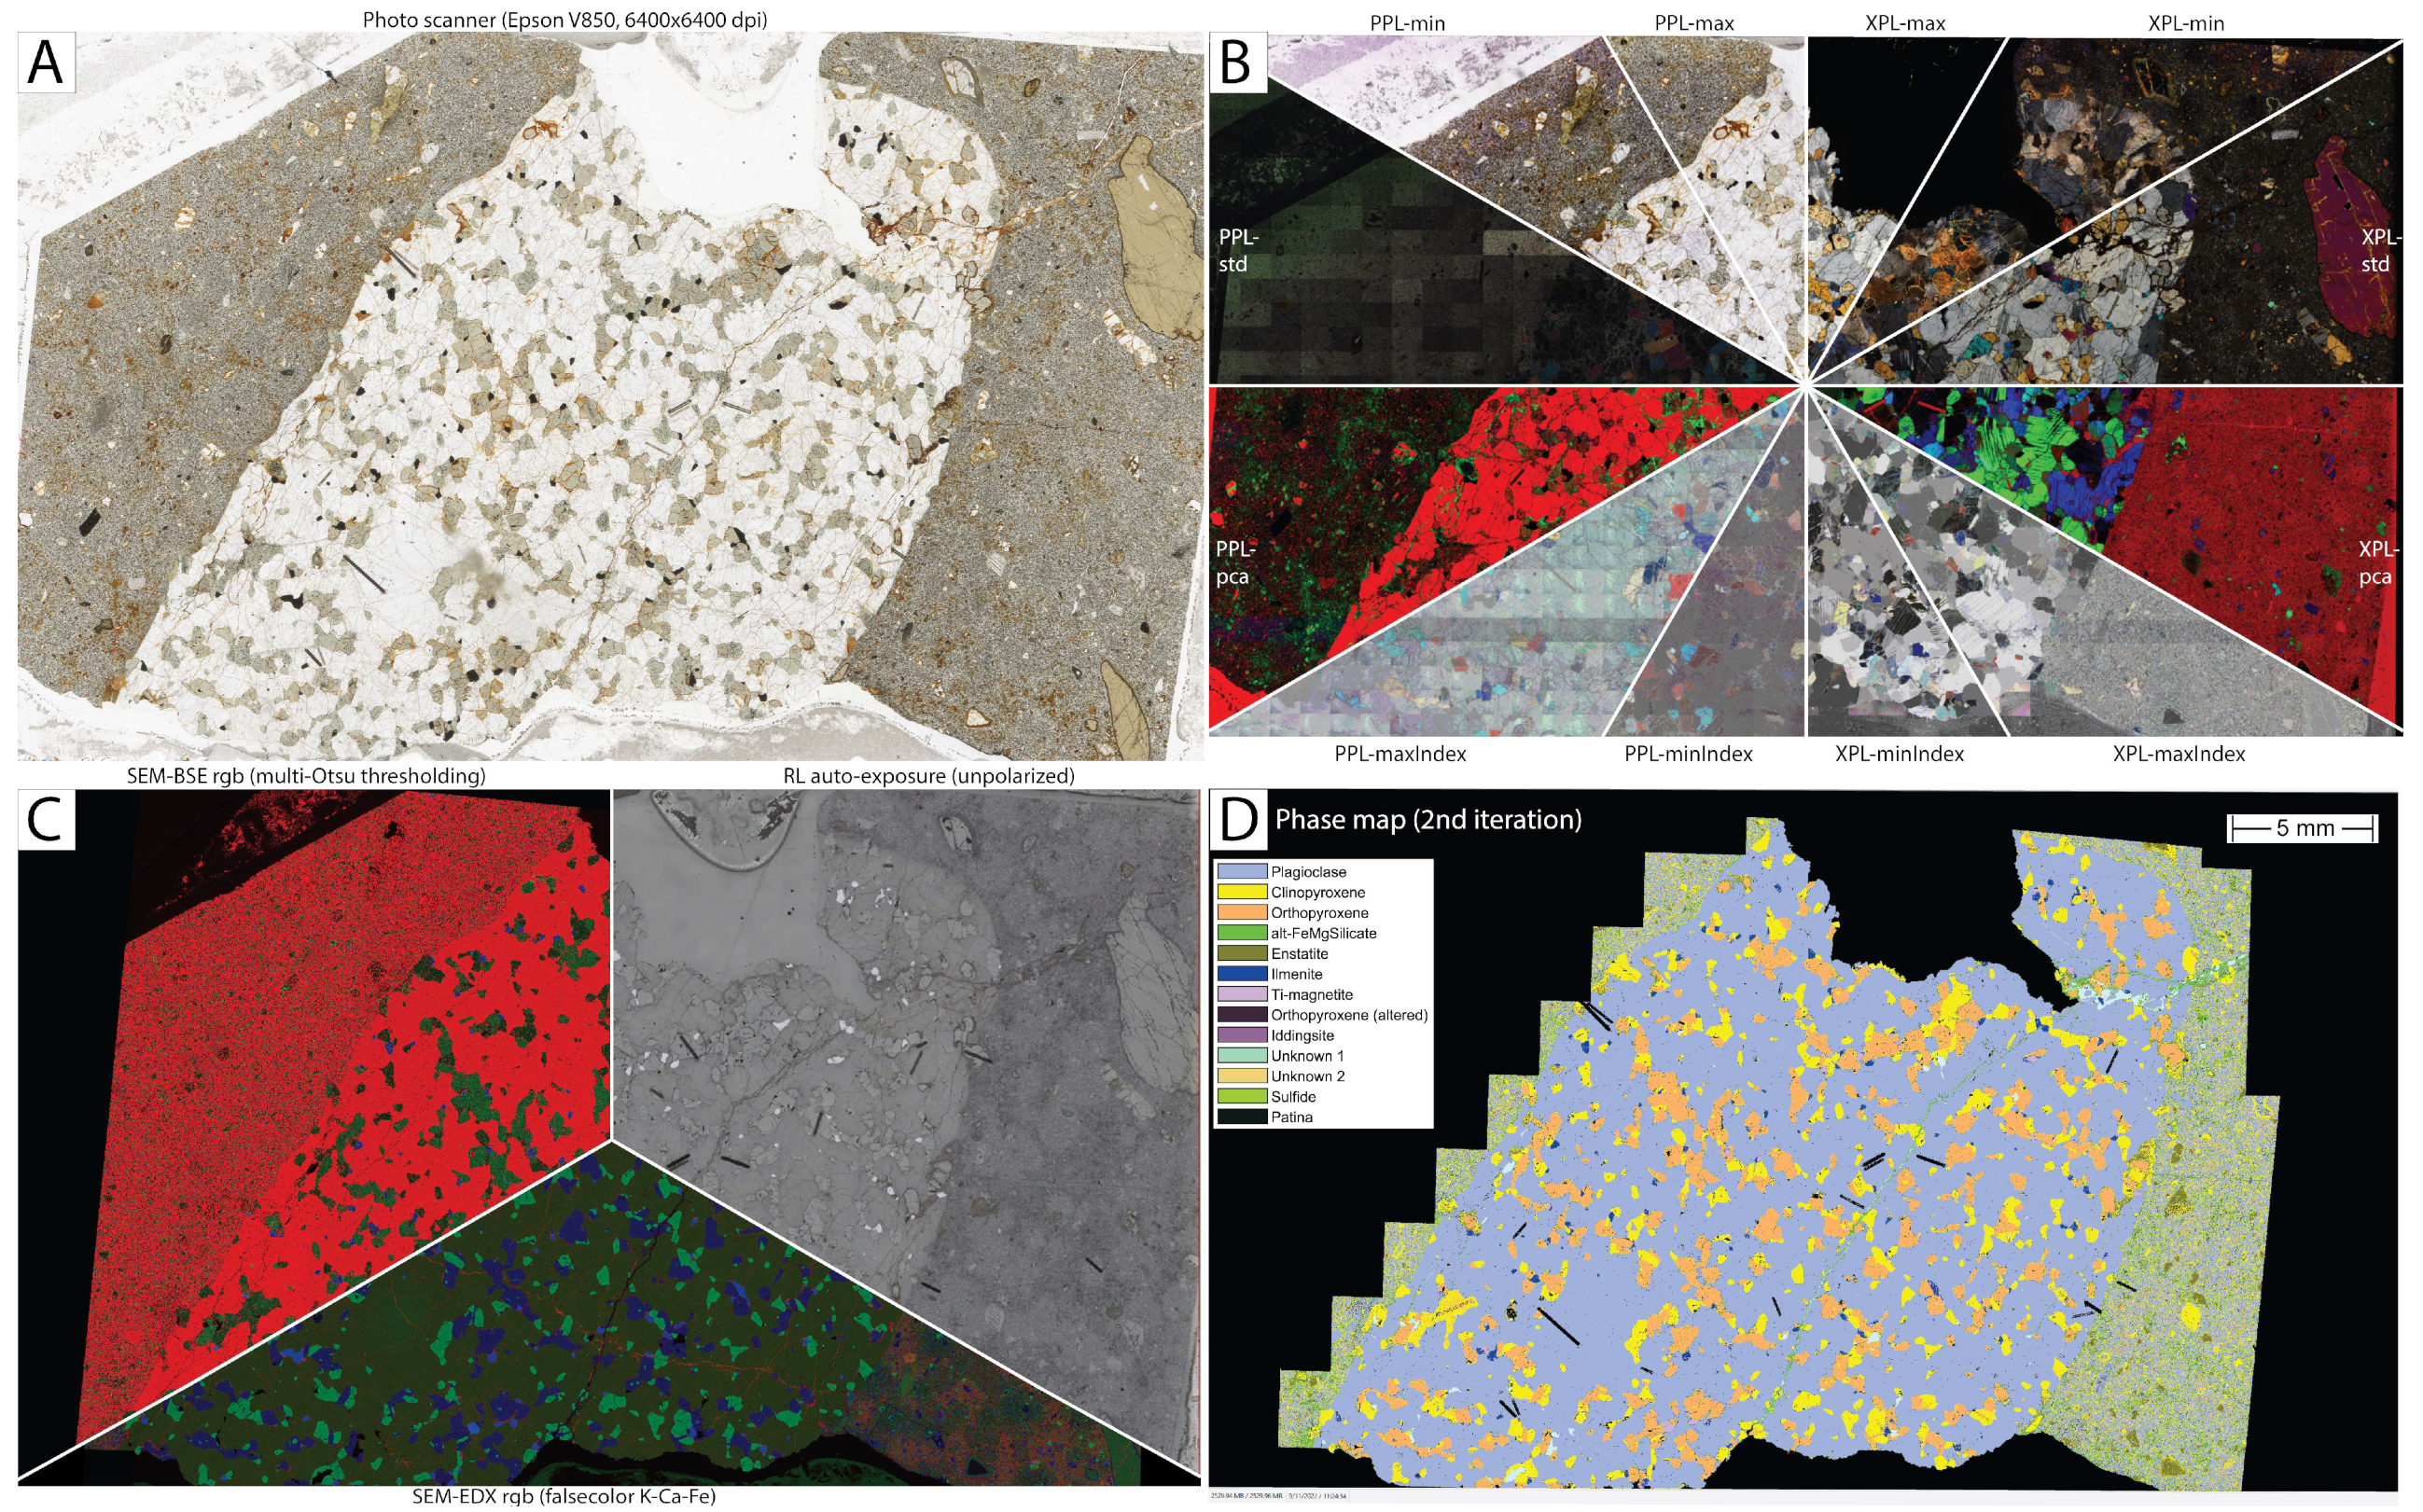
- PPL-min: best at exposing strongly translucent minerals (weak colour), dark inclusions, and micro-fractures;
- PPL-max: shows the pleochroism colour peak and slightly smoothens transparent mineral roughness due to the unpolished bottom of the section. This image orientation coincides with XPL-min due to the O-wave (isotropic) component behaviour;
- PPL-std: picks out strongly pleochroic minerals. It is very susceptible to uncorrected residual shading. In perfectly unshaded WSI, PPL-std can reveal otherwise invisible image stitching issues. It also exposes micro-structures with ‘wobbling’ shadows;
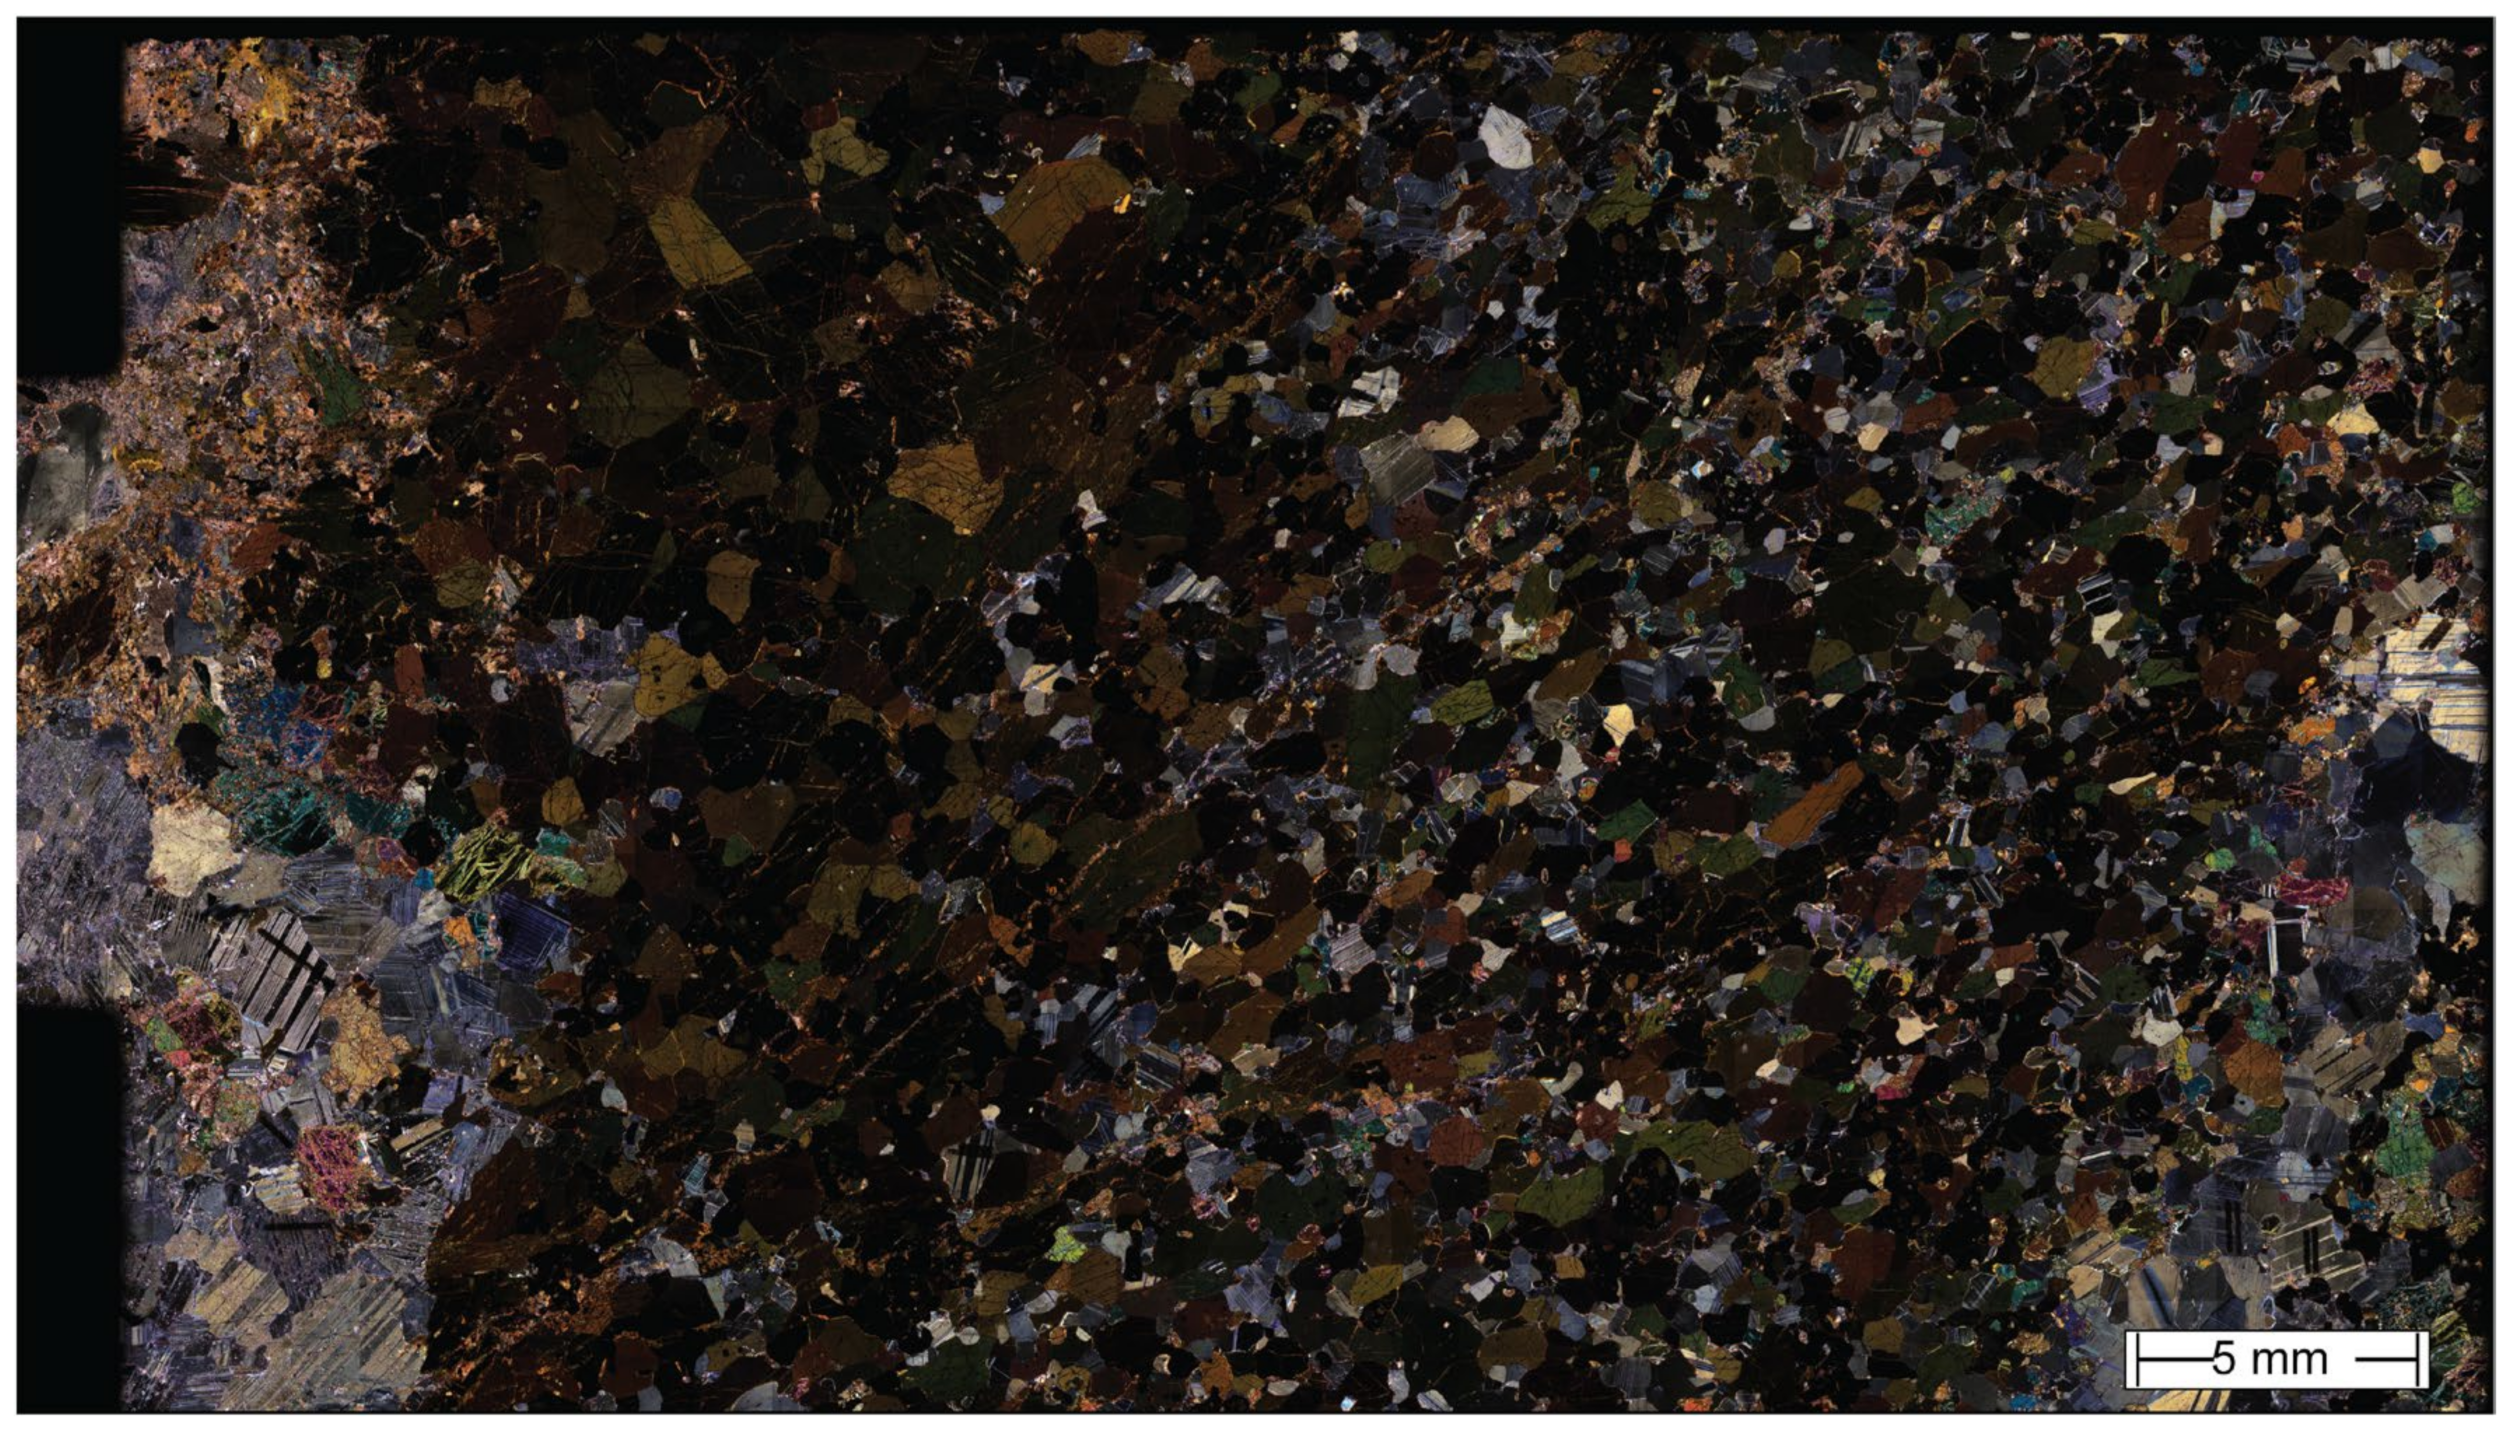
- XPL-min, e.g., [29]: displays mineral inclusions, micro-fractures, secondary alteration minerals within grains in extinction, and very low-angle contacts. It can solve the quartz colour overlap with plagioclase since quartz bands (metabasite 7KB-42) can appear in yellow and grey (not only grey), and also finds areas for producing interference figures;
- XPL-max and XPL-std, e.g., [30]: shows the approximate interference colour peak (not interpolated) of each pixel location that improves the rock texture visualisation. Therefore, slight colour intensity differences depend on grain crystallographic orientation, which might depend on rock fabric, but as shown with the last example in Figure 16, XPL-max can lead the segmentation algorithm to misidentify minerals that show a large range in birefringence (e.g., clinopyroxene);
- PPL-pca: helps visualise the altered Fe-Mg silicate networks and halos shown in the xenolith basaltic matrix. Very slight colour differences are also observed depending on crystal orientation;
- XPL-pca: highlights the grain boundaries and internal texture, such as twinning, fractures, and inclusion trails. The colouring mostly depends on the grain orientation and not on the mineral identity;
- PPL-maxIndex or -minIndex: the initial polarisation setup has not captured the full 180° period in PPL. A new setup covering 0, 30, 60, 90, 120, and 150° has solved this issue and improved spectral homogeneity (applied only to 18-RBE-006h);
- XPL-maxIndex or -minIndex: depending on the multi-pol step size, it can separate grains if they are oriented differently. It is useful for describing twinning and undulous extinction. As processing RGB channels works in the fourth-dimension, there is a chance of colouring the grains for certain indicatrix orientation that could become beneficial.
4.4. Combining Chemical Maps with Optical WSI (Second Iteration Phase Mapping)
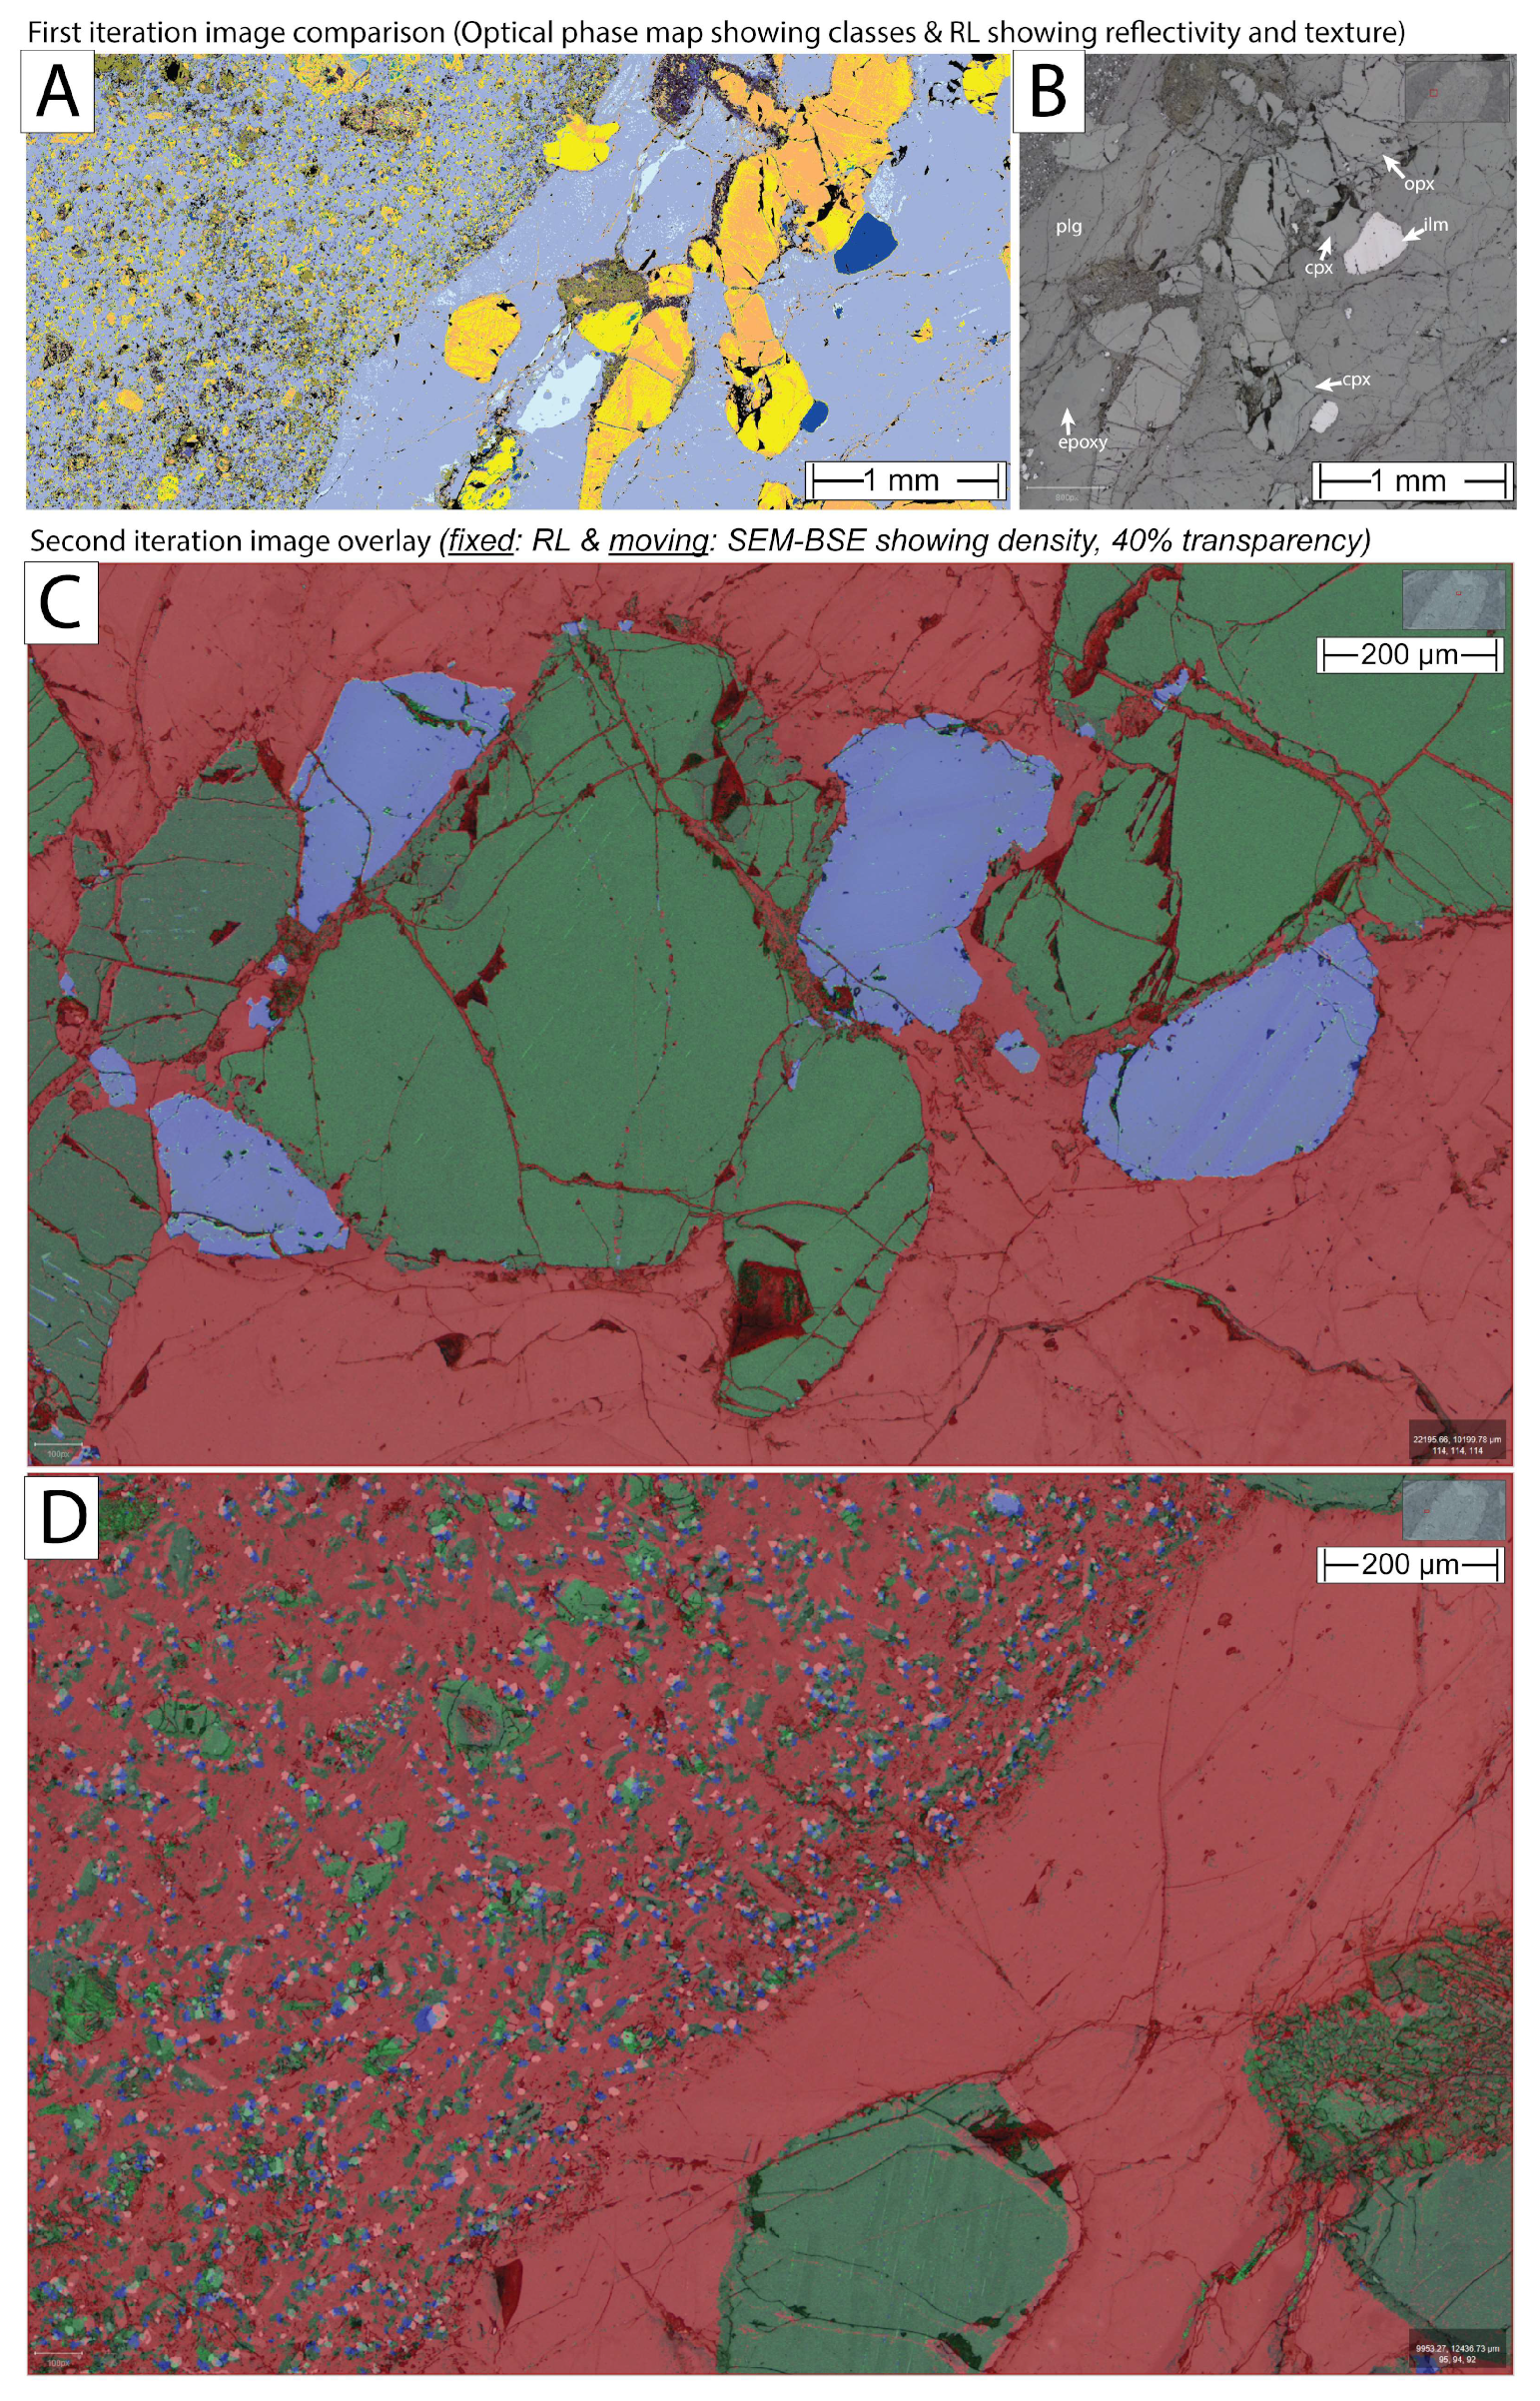
- It will be most economical, in terms of both SEM instrument time and computational effort, to use the iteration #1 optical phase map to generate an x-y-coordinate list for targeted chemical analysis and to retrieve this information back into QuPath as ‘point’ annotation training data. However, this will not resolve the issue of not having achieved more sophisticated grain segmentation. Hence, prior scalable object-based segmentation will need to be developed. This will produce edge maps independent of the sub-grain structure (twinning, inclusions, fractures, etc.) Ongoing work is exploring this way of avoiding ‘mixels’ and improving correlative microscopy time per grain.
- The SEM-EDX instrument software needs to provide full programming access to allow pre-setting strategic analytical grids beyond the auto-generated pre-segmentation already available to target accessory phases, avoid cracks, and refrain from oversampling large homogeneous grains.
- In terms of manufacturing, it would be beneficial to reach a consensus on standardised thin-section dimensions and stages; for instance, stage drift could be minimised upstream using motion-estimation-corrected trajectories with live feedback from faster and more sensitive detectors. This would significantly help register WSI from different modalities.
5. Summary and Outlook
Supplementary Materials
Author Contributions
Funding
Data Availability Statement
Acknowledgments
Conflicts of Interest
References
- Gunter, M.E. The Polarized Light Microscope: Should We Teach the use of a 19th Century Instrument in the 21st Century? J. Geosci. Educ. 2004, 52, 34–44. [Google Scholar] [CrossRef]
- Kile, D.E. The Universal Stage: The Past, Present, and Future of a Mineralogical Research Instrument. Geochem. News 2009, 140, 1–21. [Google Scholar]
- Frost, M.J. Refractive Index. In Mineralogy; Springer: Berlin/Heidelberg, Germany, 1983; pp. 438–441. [Google Scholar]
- Wallace, C.T.; St Croix, C.M.; Watkins, S.C. Data management and archiving in a large microscopy-and-imaging, multi-user facility: Problems and solutions. Mol. Reprod. Dev. 2015, 82, 630–634. [Google Scholar] [CrossRef] [PubMed] [Green Version]
- Marée, R.; Rollus, L.; Stevens, B.; Hoyoux, R.; Louppe, G.; Vandaele, R.; Begon, J.-M.; Kainz, P.; Geurts, P.; Wehenkel, L. Collaborative analysis of multi-gigapixel imaging data using Cytomine. Bioinformatics 2016, 32, 1395–1401. [Google Scholar] [CrossRef] [PubMed] [Green Version]
- Saalfeld, S. Computational methods for stitching, alignment, and artifact correction of serial section data. Methods Cell Biol. 2019, 152, 261–276. [Google Scholar] [CrossRef]
- Giesen, C.; Wang, H.A.O.; Schapiro, D.; Zivanovic, N.; Jacobs, A.; Hattendorf, B.; Schüffler, P.J.; Grolimund, D.; Buhmann, J.M.; Brandt, S.; et al. Highly multiplexed imaging of tumor tissues with subcellular resolution by mass cytometry. Nat. Methods 2014, 11, 417–422. [Google Scholar] [CrossRef]
- Raith, M.M.; Raase, P. Thin Section Microscopy: A Comprehensive Guide. Available online: http://nationalpetrographic.com/thin-section-microscopy-a-comprehensive-guide.html (accessed on 24 May 2022).
- Heilbronner, R.P.; Pauli, C. Integrated spatial and orientation analysis of quartz c-axes by computer-aided microscopy. J. Struct. Geol. 1993, 15, 369–382. [Google Scholar] [CrossRef]
- Heilbronner, R. Automatic grain boundary detection and grain size analysis using polarization micrographs or orientation images. J. Struct. Geol. 2000, 22, 969–981. [Google Scholar] [CrossRef]
- Ng, A. Sparse Autoencoder; CS294A Lecture Notes; Stanford Univ.: Stanford, CA, USA, 2011; Available online: https://web.stanford.edu/class/cs294a/sparseAutoencoder_2011new.pdf (accessed on 28 January 2022).
- Matthew, A. A Revolution in Quantitative Petrography_Digitization and Automation with Machine Learning; Carl Zeiss Microscopy GmbH: Pleasanton, CA, USA, 2021; Available online: https://www.zeiss.com/microscopy/en/c/rwm/22/natres/quantitative-petrography/quantitative-petrography.html (accessed on 16 January 2023).
- Koh, E.J.Y.; Amini, E.; McLachlan, G.J.; Beaton, N. Utilising convolutional neural networks to perform fast automated modal mineralogy analysis for thin-section optical microscopy. Miner. Eng. 2021, 173, 107230. [Google Scholar] [CrossRef]
- Dickson, J.A.D. Carbonate identification and genesis as revealed by staining. J. Sediment. Res. 1966, 36, 491–505. [Google Scholar] [CrossRef]
- Grove, C.; Jerram, D.A. jPOR: An ImageJ macro to quantify total optical porosity from blue-stained thin sections. Comput. Geosci. 2011, 37, 1850–1859. [Google Scholar] [CrossRef]
- Roduit, N. JMicroVision: Un Logiciel d‘Analyse d‘Images Pétrographiques Polyvalent. Monograph, Section des Sciences de la Terre, Université de Genève 2007. Available online: http://archive-ouverte.unige.ch/unige:468 (accessed on 16 January 2023).
- Fueten, F. A computer-controlled rotating polarizer stage for the petrographic microscope. Comput. Geosci. 1997, 23, 203–208. [Google Scholar] [CrossRef]
- Ogliore, R.; Jilly-Rehak, C. Gigapixel Optical Microscopy for Meteorite Characterization. Planet. Sci. 2013, 2, 1023. [Google Scholar] [CrossRef] [Green Version]
- Axer, M.; Strohmer, S.; Gräßel, D.; Bücker, O.; Dohmen, M.; Reckfort, J.; Zilles, K.; Amunts, K. Estimating Fiber Orientation Distribution Functions in 3D-Polarized Light Imaging. Front. Neuroanat. 2016, 10, 40. [Google Scholar] [CrossRef] [Green Version]
- Koike-Tani, M.; Tani, T.; Mehta, S.B.; Verma, A.; Oldenbourg, R. Polarized light microscopy in reproductive and developmental biology. Mol. Reprod. Dev. 2015, 82, 548–562. [Google Scholar] [CrossRef] [Green Version]
- Pirnstill, C.W.; Cote, G.L. Malaria Diagnosis Using a Mobile Phone Polarized Microscope. Sci Rep 2015, 5, 13368. [Google Scholar] [CrossRef] [Green Version]
- Buchrieser, J.; Dufloo, J.; Hubert, M.; Monel, B.; Planas, D.; Rajah, M.M.; Planchais, C.; Porrot, F.; Guivel-Benhassine, F.; Van der Werf, S.; et al. Syncytia formation by SARS-CoV-2-infected cells. EMBO J. 2020, 39, e106267. [Google Scholar] [CrossRef]
- Emo, R.B.; Kamber, B.S. Evidence for highly refractory, heat producing element-depleted lower continental crust: Some implications for the formation and evolution of the continents. Chem. Geol. 2021, 580, 120389. [Google Scholar] [CrossRef]
- Emo, R.B.; Kamber, B.S. A Reconstitution Approach for Whole Rock Major and Trace Element Compositions of Granulites from the Kapuskasing Structural Zone. Minerals 2020, 10, 573. [Google Scholar] [CrossRef]
- Bankhead, P.; Loughrey, M.B.; Fernandez, J.A.; Dombrowski, Y.; McArt, D.G.; Dunne, P.D.; McQuaid, S.; Gray, R.T.; Murray, L.J.; Coleman, H.G.; et al. QuPath: Open source software for digital pathology image analysis. Sci. Rep. 2017, 7, 16878. [Google Scholar] [CrossRef] [Green Version]
- Caja, M.Á.; Pena, A.; Campos, J.; Diego, L.; Tritlla, J.; Bover-Arnal, T.; Martín-Martín, J.D. Image Processing and Machine Learning Applied to Lithology Identification, Classification and Quantification of Thin Section Cutting Samples. In Proceedings of the SPE Annual Technical Conference and Exhibition, Calgary, AL, Canada, 30 September–2 October 2019. Paper SPE-196117-MS 2019. [Google Scholar]
- Bankhead, P. Analyzing Fluorescence Microscopy Images with ImageJ; Queen’s University Belfast: Belfast, UK, 2014. [Google Scholar]
- Schneider, C.A.; Rasband, W.S.; Eliceiri, K.W. NIH Image to ImageJ: 25 years of image analysis. Nat. Methods 2012, 9, 671–675. [Google Scholar] [CrossRef] [PubMed]
- Yesiloglu-Gultekin, N.; Keceli, A.S.; Sezer, E.A.; Can, A.B.; Gokceoglu, C.; Bayhan, H. A computer program (TSecSoft) to determine mineral percentages using photographs obtained from thin sections. Comput. Geosci. 2012, 46, 310–316. [Google Scholar] [CrossRef]
- Jungmann, M.; Pape, H.; Wißkirchen, P.; Clauser, C.; Berlage, T. Segmentation of thin section images for grain size analysis using region competition and edge-weighted region merging. Comput. Geosci. 2014, 72, 33–48. [Google Scholar] [CrossRef]
- Fueten, F.; Mason, J. An artificial neural net assisted approach to editing edges in petrographic images collected with the rotating polarizer stage. Comput. Geosci. 2007, 33, 1176–1188. [Google Scholar] [CrossRef]
- Zhou, Y.; Starkey, J.; Mansinha, L. Identification of Mineral Grains in a Petrographic Thin Section Using Phi- and Max-Images. Math. Geol. 2004, 36, 781–801. [Google Scholar] [CrossRef]
- Zhang, Y.; Zhong, H.-R.; Zhang, X.; Gao, S.-C.; Zhang, D. Orthogonal microscopy image acquisition analysis technique for rock sections in polarizer angle domain. J. Struct. Geol. 2020, 140, 104174. [Google Scholar] [CrossRef]
- Thomas, S.A. Fast Data Driven Estimation of Cluster Number in Multiplex Images using Embedded Density Outliers. In Proceedings of the 2022 IEEE Conference on Computational Intelligence in Bioinformatics and Computational Biology (CIBCB), Ottawa, ON, Canada, 15–17 August 2022. [Google Scholar]
- Bogovic, J.A.; Hanslovsky, P.; Wong, A.; Saalfeld, S. Robust registration of calcium images by learned contrast synthesis. In Proceedings of the 2016 IEEE 13th International Symposium on Biomedical Imaging (ISBI), Prague, Czech Republic, 13–16 April 2016; pp. 1123–1126. [Google Scholar] [CrossRef] [Green Version]
- Cardona, A.; Saalfeld, S.; Schindelin, J.; Arganda-Carreras, I.; Preibisch, S.; Longair, M.; Tomancak, P.; Hartenstein, V.; Douglas, R.J. TrakEM2 software for neural circuit reconstruction. PLoS One 2012, 7, e38011. [Google Scholar] [CrossRef] [Green Version]
- Chalfoun, J.; Majurski, M.; Blattner, T.; Bhadriraju, K.; Keyrouz, W.; Bajcsy, P.; Brady, M. MIST: Accurate and Scalable Microscopy Image Stitching Tool with Stage Modeling and Error Minimization. Sci. Rep. 2017, 7, 4988. [Google Scholar] [CrossRef] [Green Version]
- Chiaruttini, N.; Burri, O.; Haub, P.; Guiet, R.; Sordet-Dessimoz, J.; Seitz, A. An Open-Source Whole Slide Image Registration Workflow at Cellular Precision Using Fiji, QuPath and Elastix. Front. Comput. Sci. 2022, 3, 780026. [Google Scholar] [CrossRef]
- Gunter, M.E. Polarized light reflection from minerals; a matrix approach. Eur. J. Mineral. 1989, 1, 801–814. [Google Scholar] [CrossRef]
- Hrstka, T.; Gottlieb, P.; Skala, R.; Breiter, K.; Motl, D. Automated mineralogy and petrology—Applications of TESCAN Integrated Mineral Analyzer (TIMA). J. Geosci. 2018, 63, 47–63. [Google Scholar] [CrossRef] [Green Version]
- Maitre, J.; Bouchard, K.; Bédard, L.P. Mineral grains recognition using computer vision and machine learning. Comput. Geosci. 2019, 130, 84–93. [Google Scholar] [CrossRef]
- Higgins, M. Advances in the textural quantification of crystalline rocks. Geosci. Can. 2015, 42, 263–270. [Google Scholar] [CrossRef] [Green Version]
- Latif, G.; Bouchard, K.; Maitre, J.; Back, A.; Bédard, L.P. Deep-Learning-Based Automatic Mineral Grain Segmentation and Recognition. Minerals 2022, 12, 455. [Google Scholar] [CrossRef]
- Yu, J.; Wellmann, F.; Virgo, S.; von Domarus, M.; Jiang, M.; Schmatz, J.; Leibe, B. Superpixel segmentations for thin sections: Evaluation of methods to enable the generation of machine learning training data sets. Comput. Geosci. 2023, 170, 105232. [Google Scholar] [CrossRef]
- Goodchild, J.S. Geological Image Processing of Petrographic Thin Sections Using the Rotating Polarizer Stage. Brock University. 1998. Available online: http://hdl.handle.net/10464/1891 (accessed on 9 July 2009).
- Ross, D. A.; Lim, J.; Lin, R.-S.; Yang, M.-H. Incremental Learning for Robust Visual Tracking. Int. J. Comput. Vis. 2008, 77, 77–125. [Google Scholar] [CrossRef]
- Schroeder, A. B.; Dobson, E. T. A.; Rueden, C. T.; Tomancak, P.; Jug, F.; Eliceiri, K. W. The ImageJ ecosystem: Open-source software for image visualization, processing, and analysis. Protein Science 2021, 30, 234–249. [Google Scholar] [CrossRef]
- Cupitt, J.; Martinez, K. VIPS: An imaging processing system for large images. Proc. SPIE—Int. Soc. Opt. Eng. 1996, 1663. [Google Scholar] [CrossRef] [Green Version]
- Otsu, N. A Threshold Selection Method from Gray-Level Histograms. IEEE Trans. Syst. Man Cybern. 1979, 9, 62–66. [Google Scholar] [CrossRef] [Green Version]
- Gunter, M. E. Refractometry by Total Reflection; Virginia Polytechnic Institute and State University: Blacksburg, VA, USA, 1987. [Google Scholar]
- Sørensen, B. E. A revised Michel-Lévy interference colour chart based on first-principles calculations. Eur. J. Mineral. 2013, 25, 5–10. [Google Scholar] [CrossRef]
- Axer, M.; Graessel, D.; Kleiner, M.; Dammers, J.; Dickscheid, T.; Reckfort, J.; Huetz, T.; Eiben, B.; Pietrzyk, U.; Zilles, K.; et al. High-Resolution Fiber Tract Reconstruction in the Human Brain by Means of Three-Dimensional Polarized Light Imaging. Front. Neuroinformatics 2011, 5, 34. [Google Scholar] [CrossRef] [PubMed]
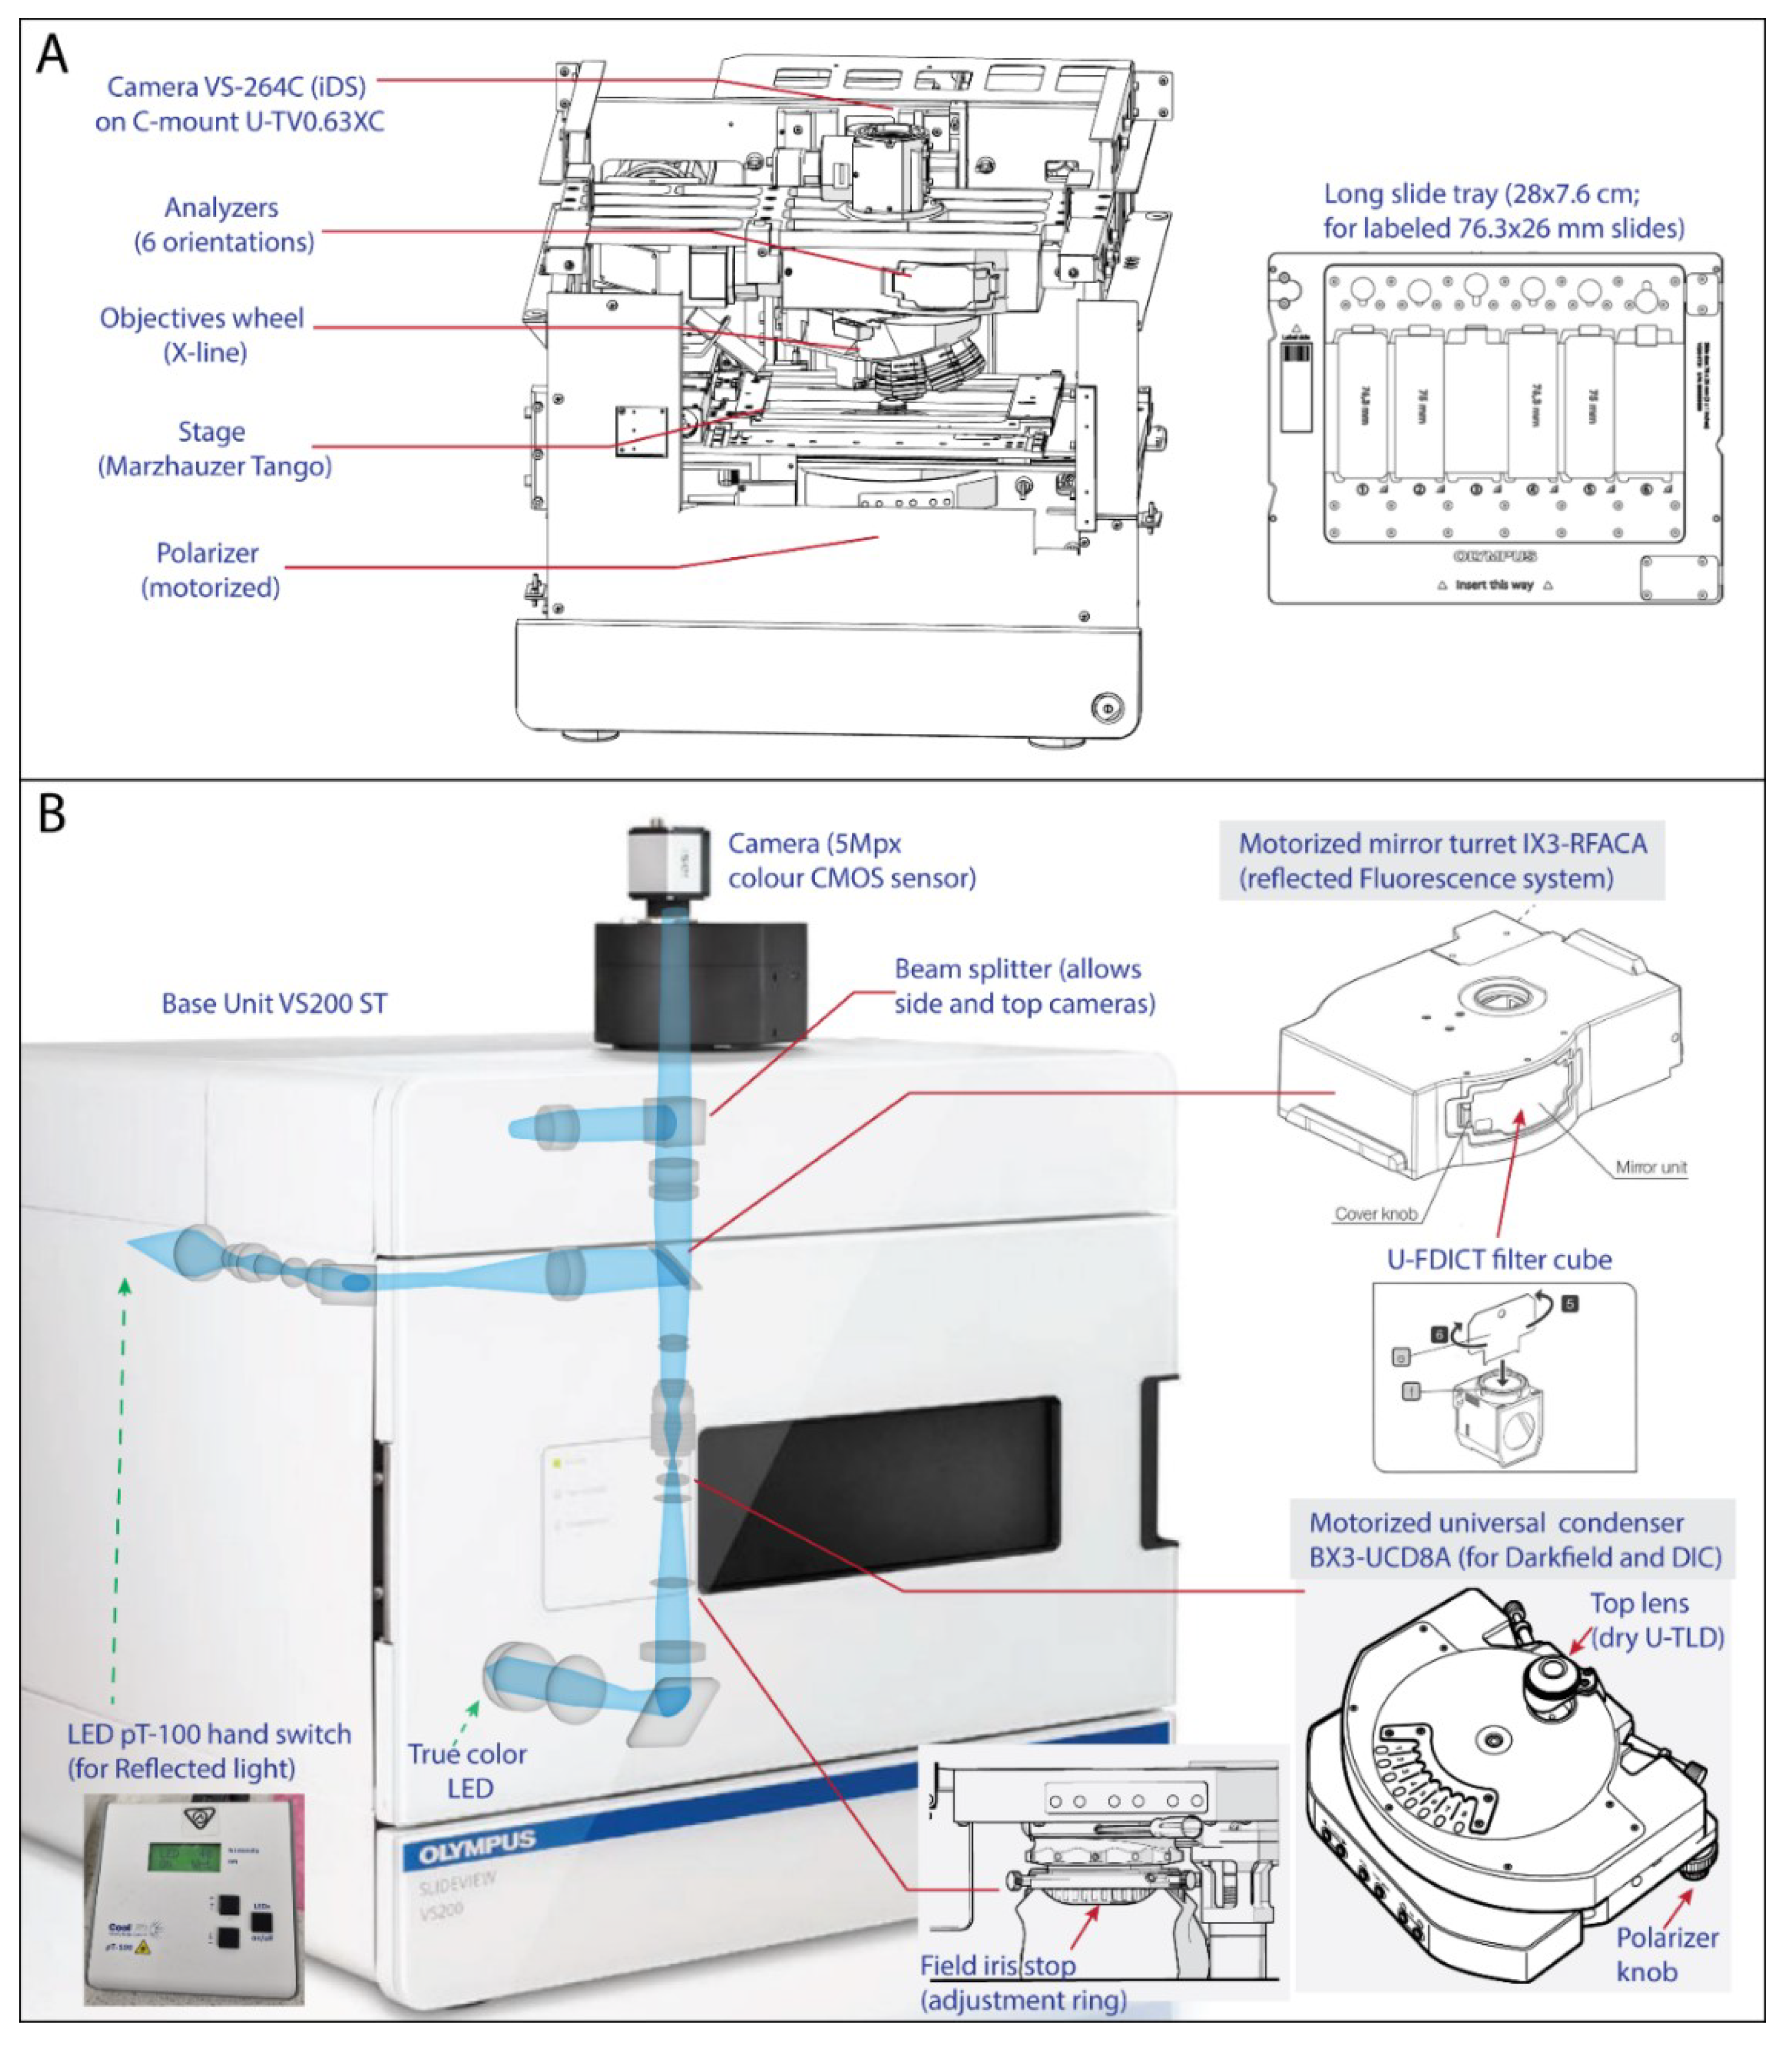
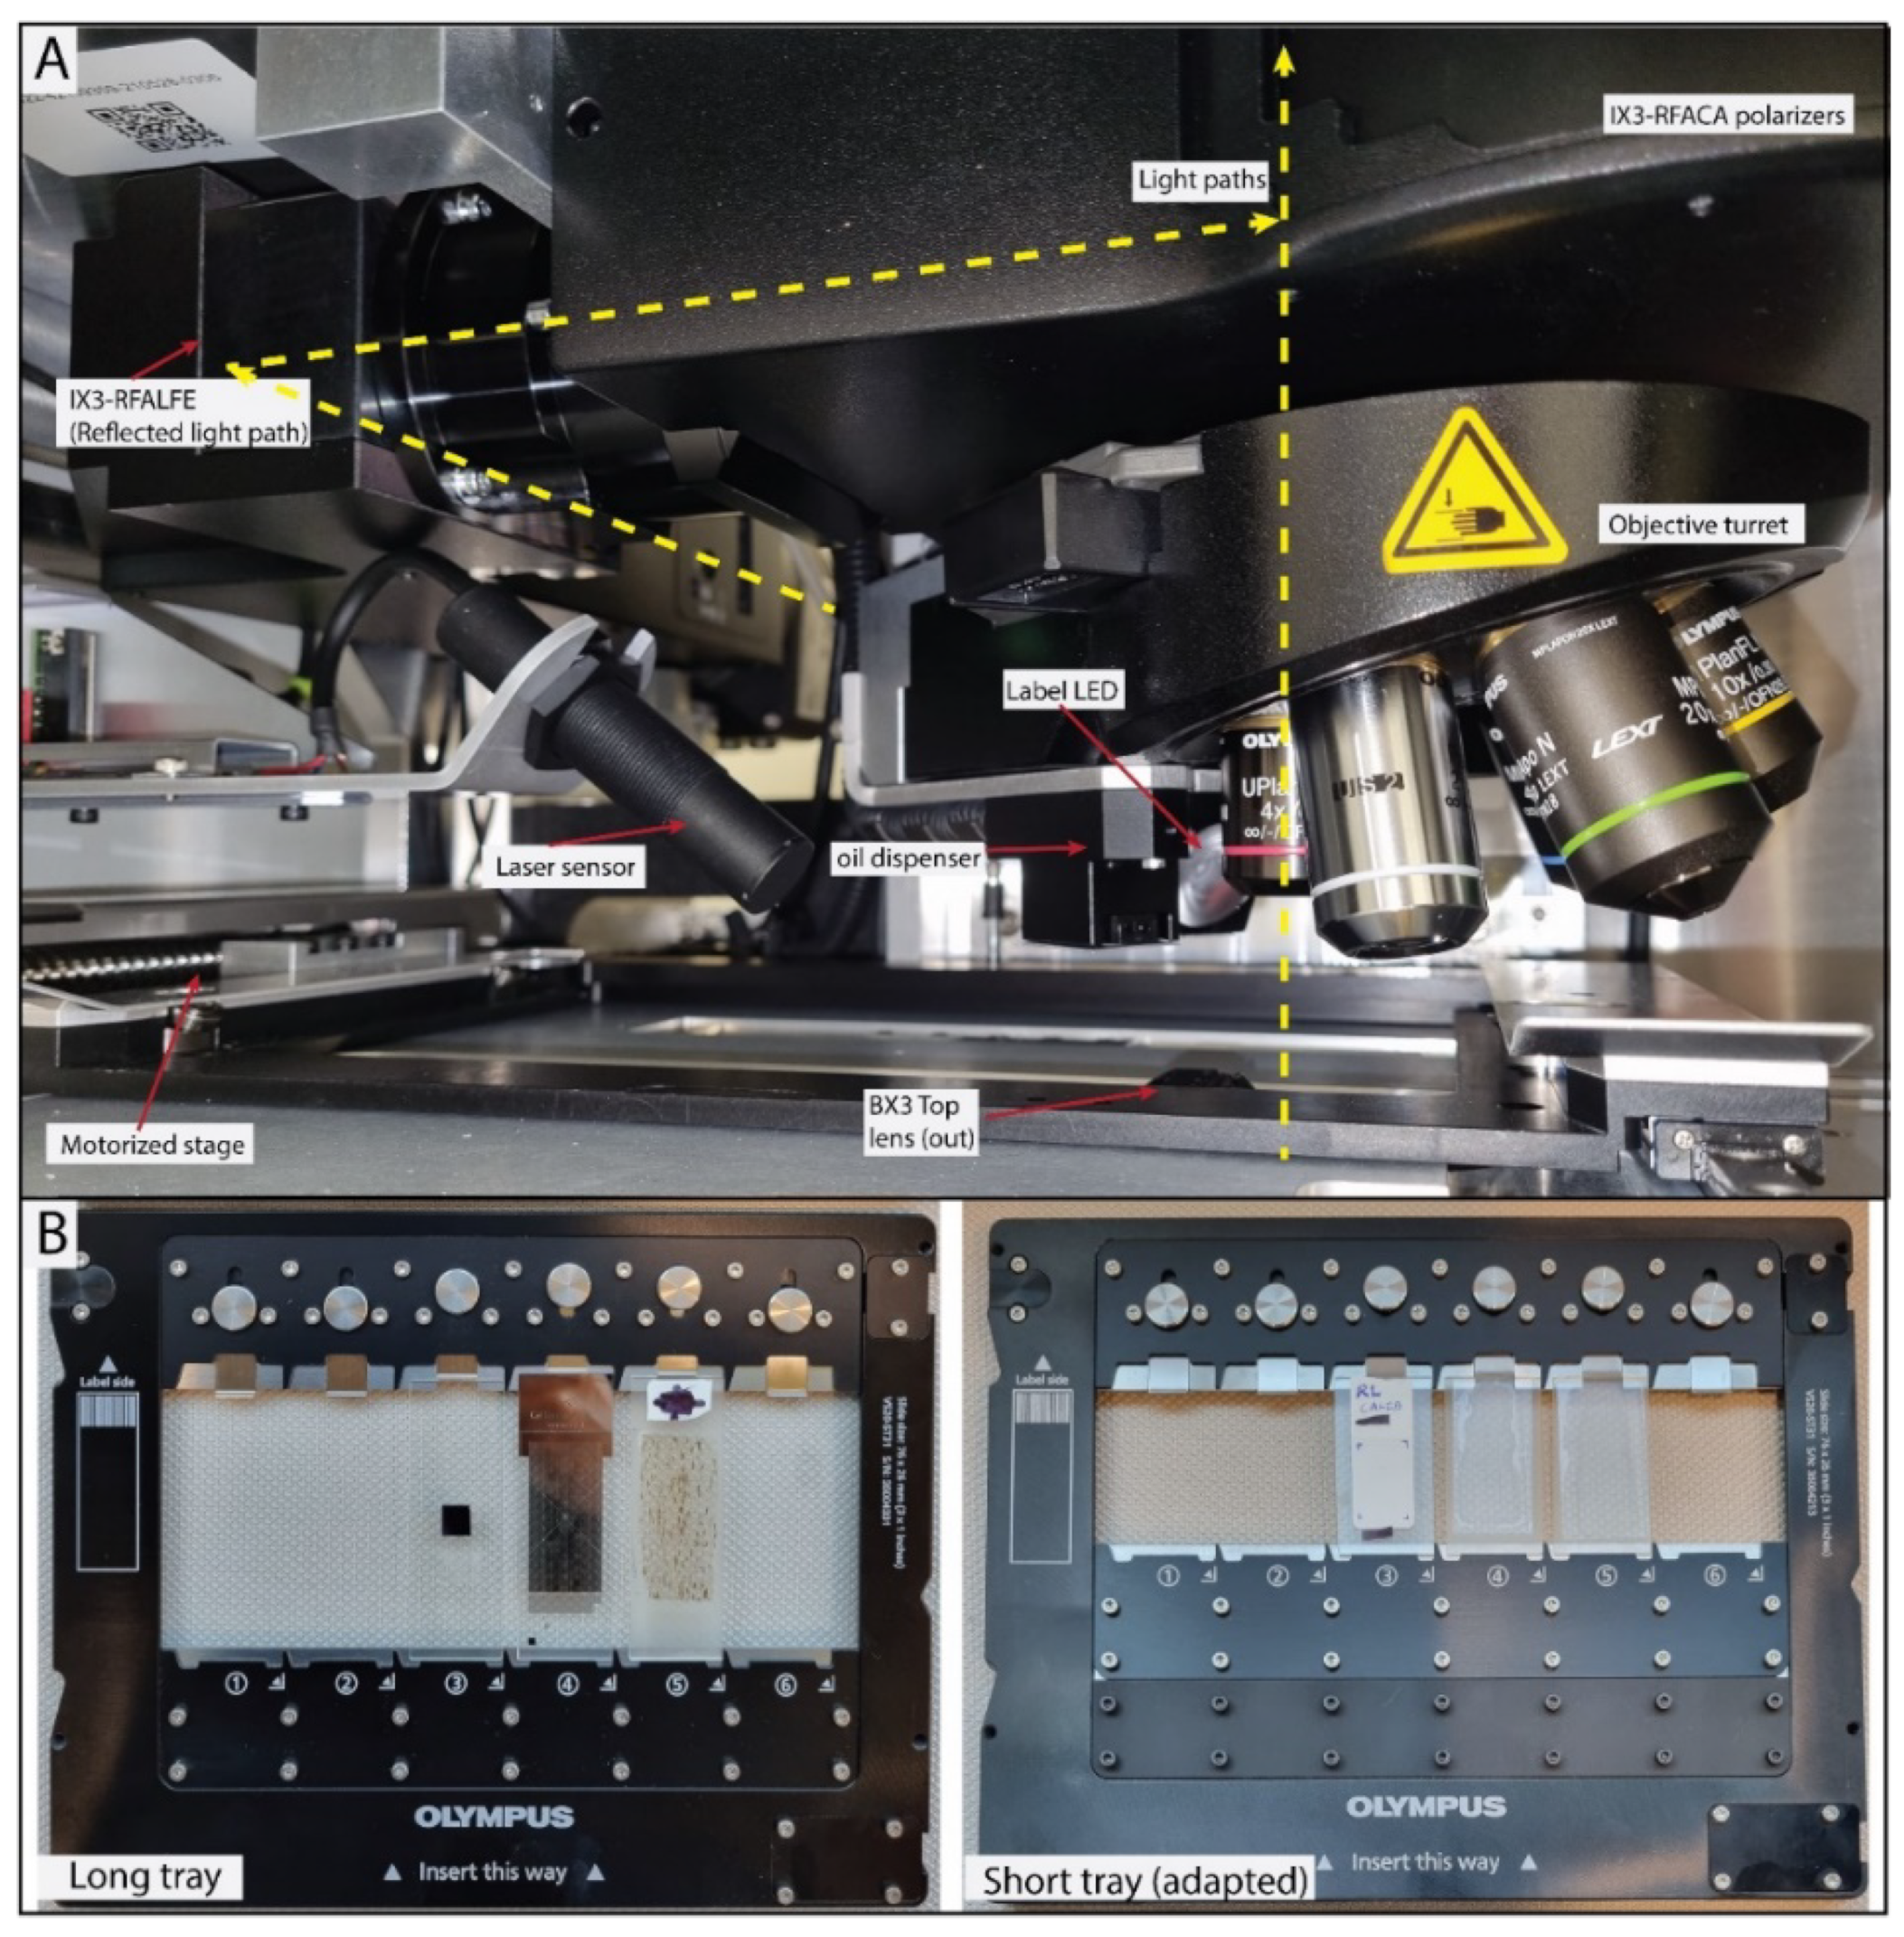

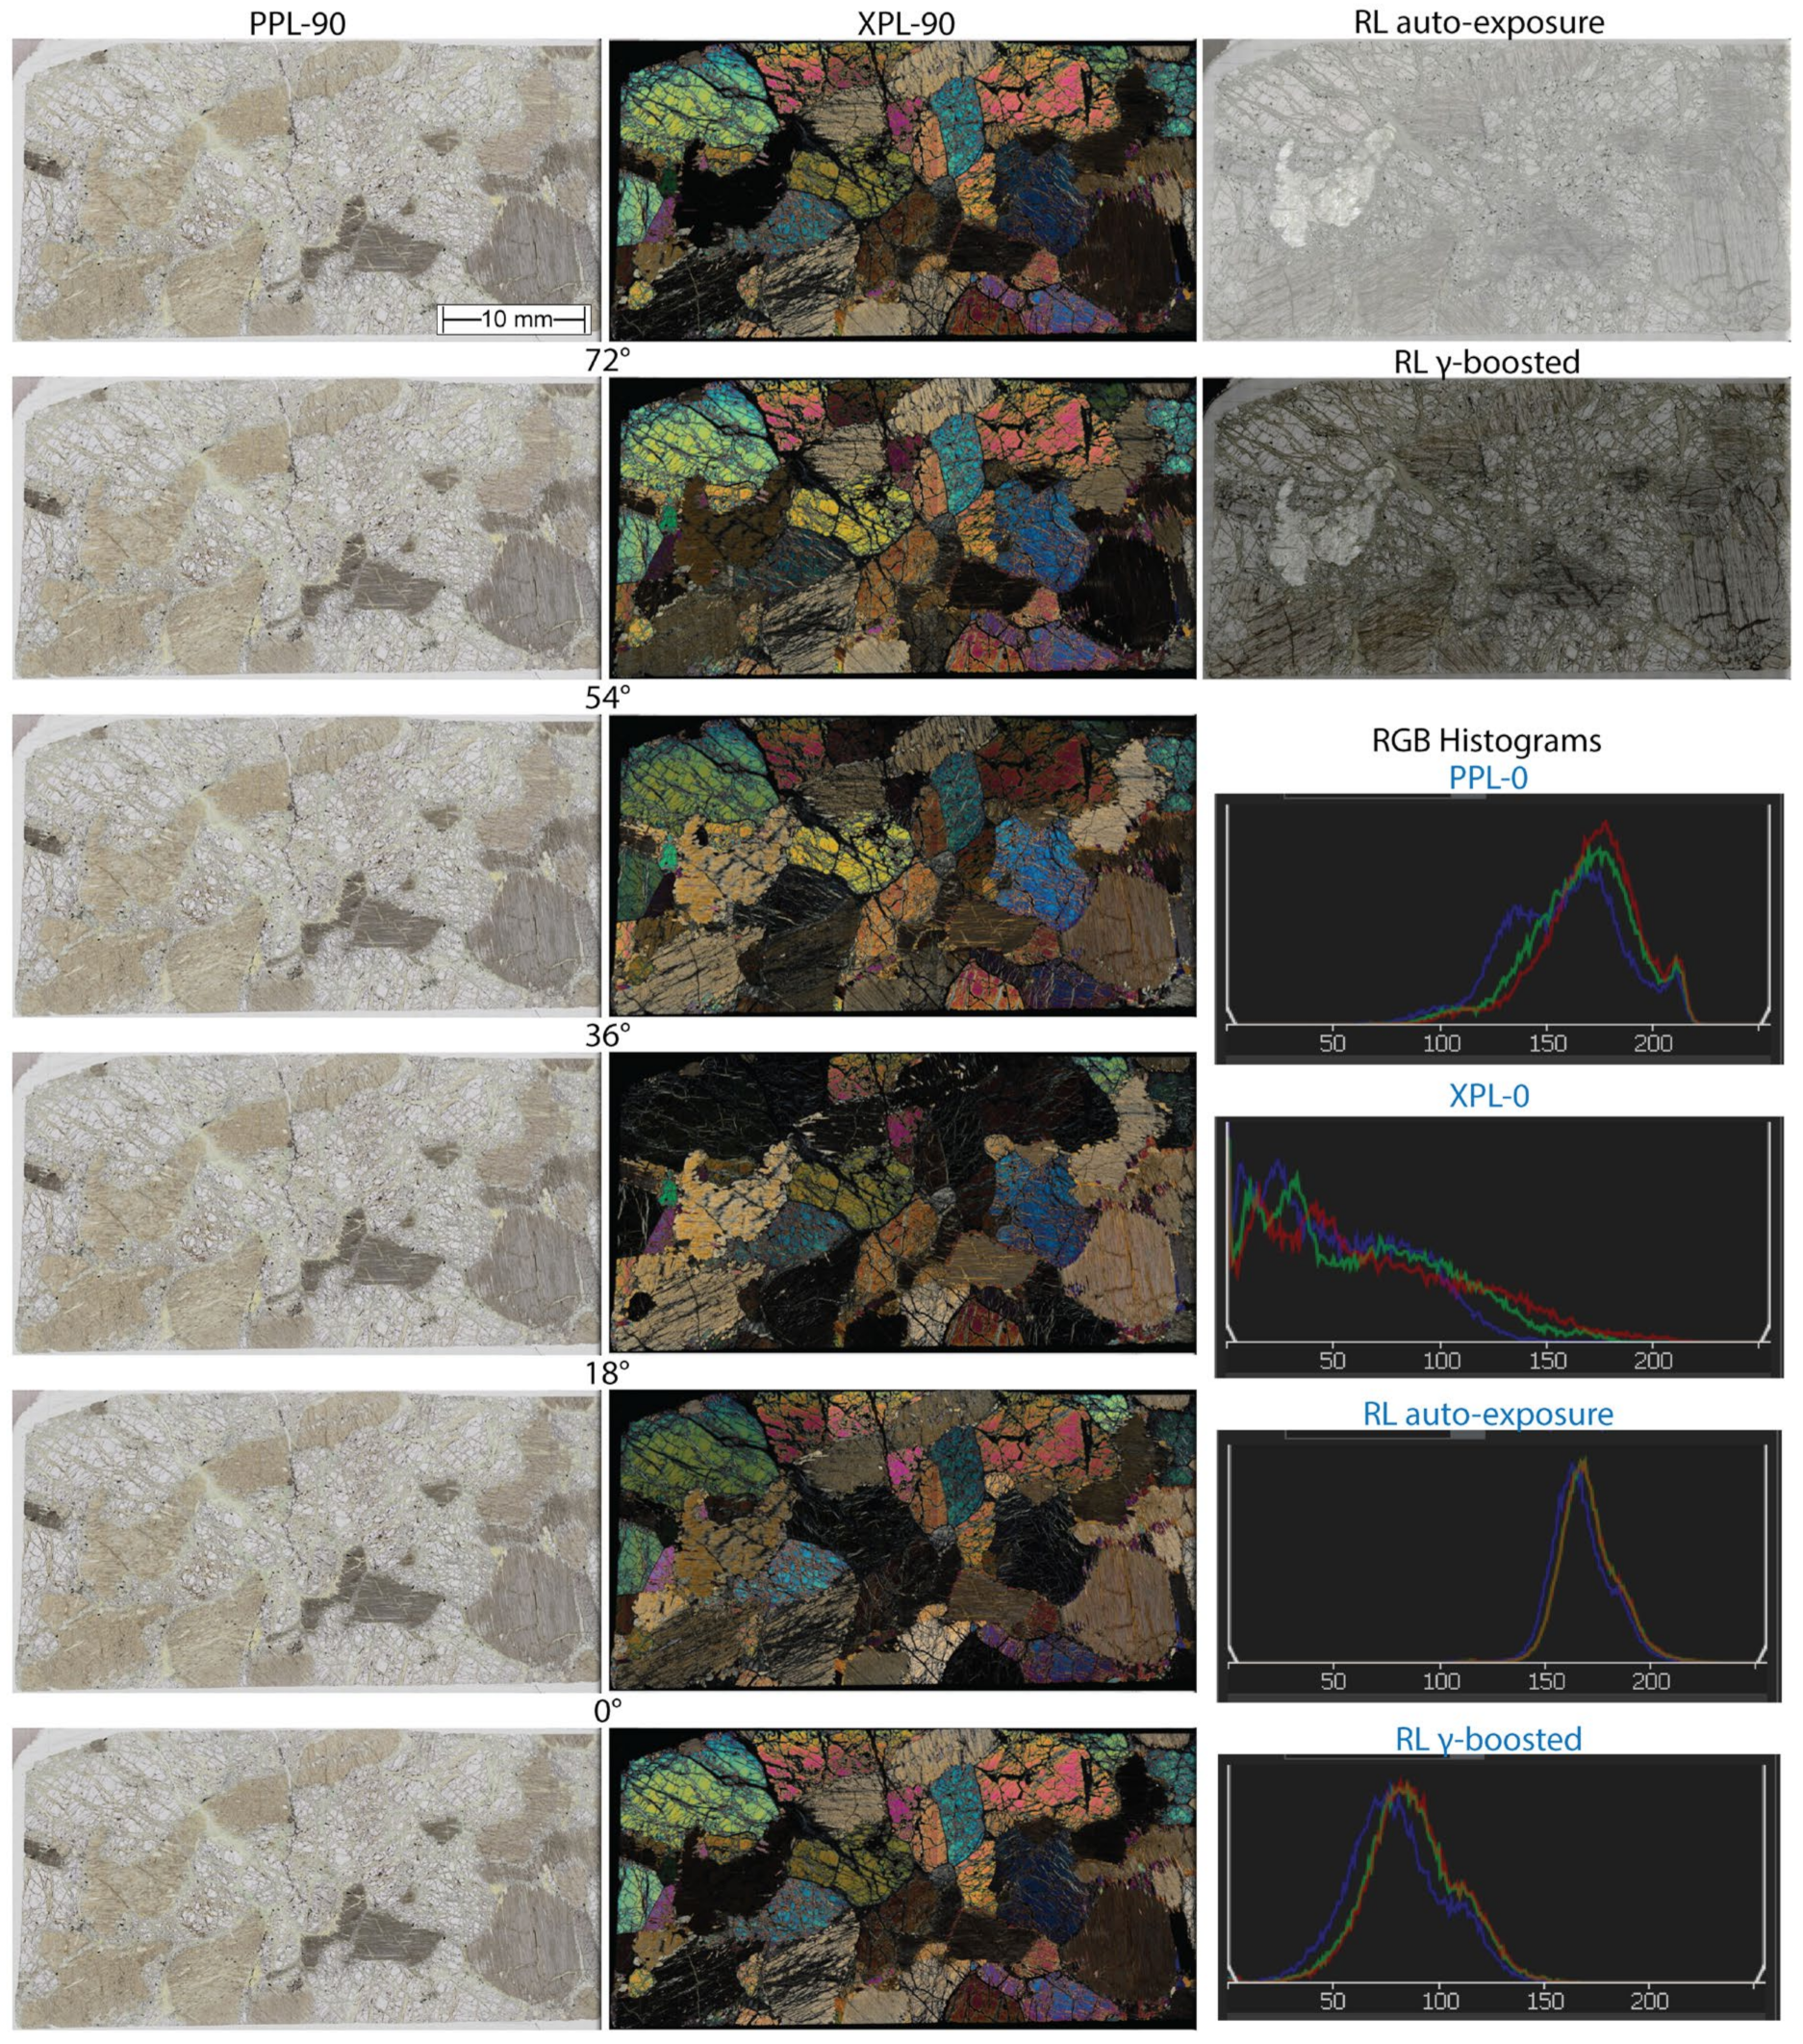
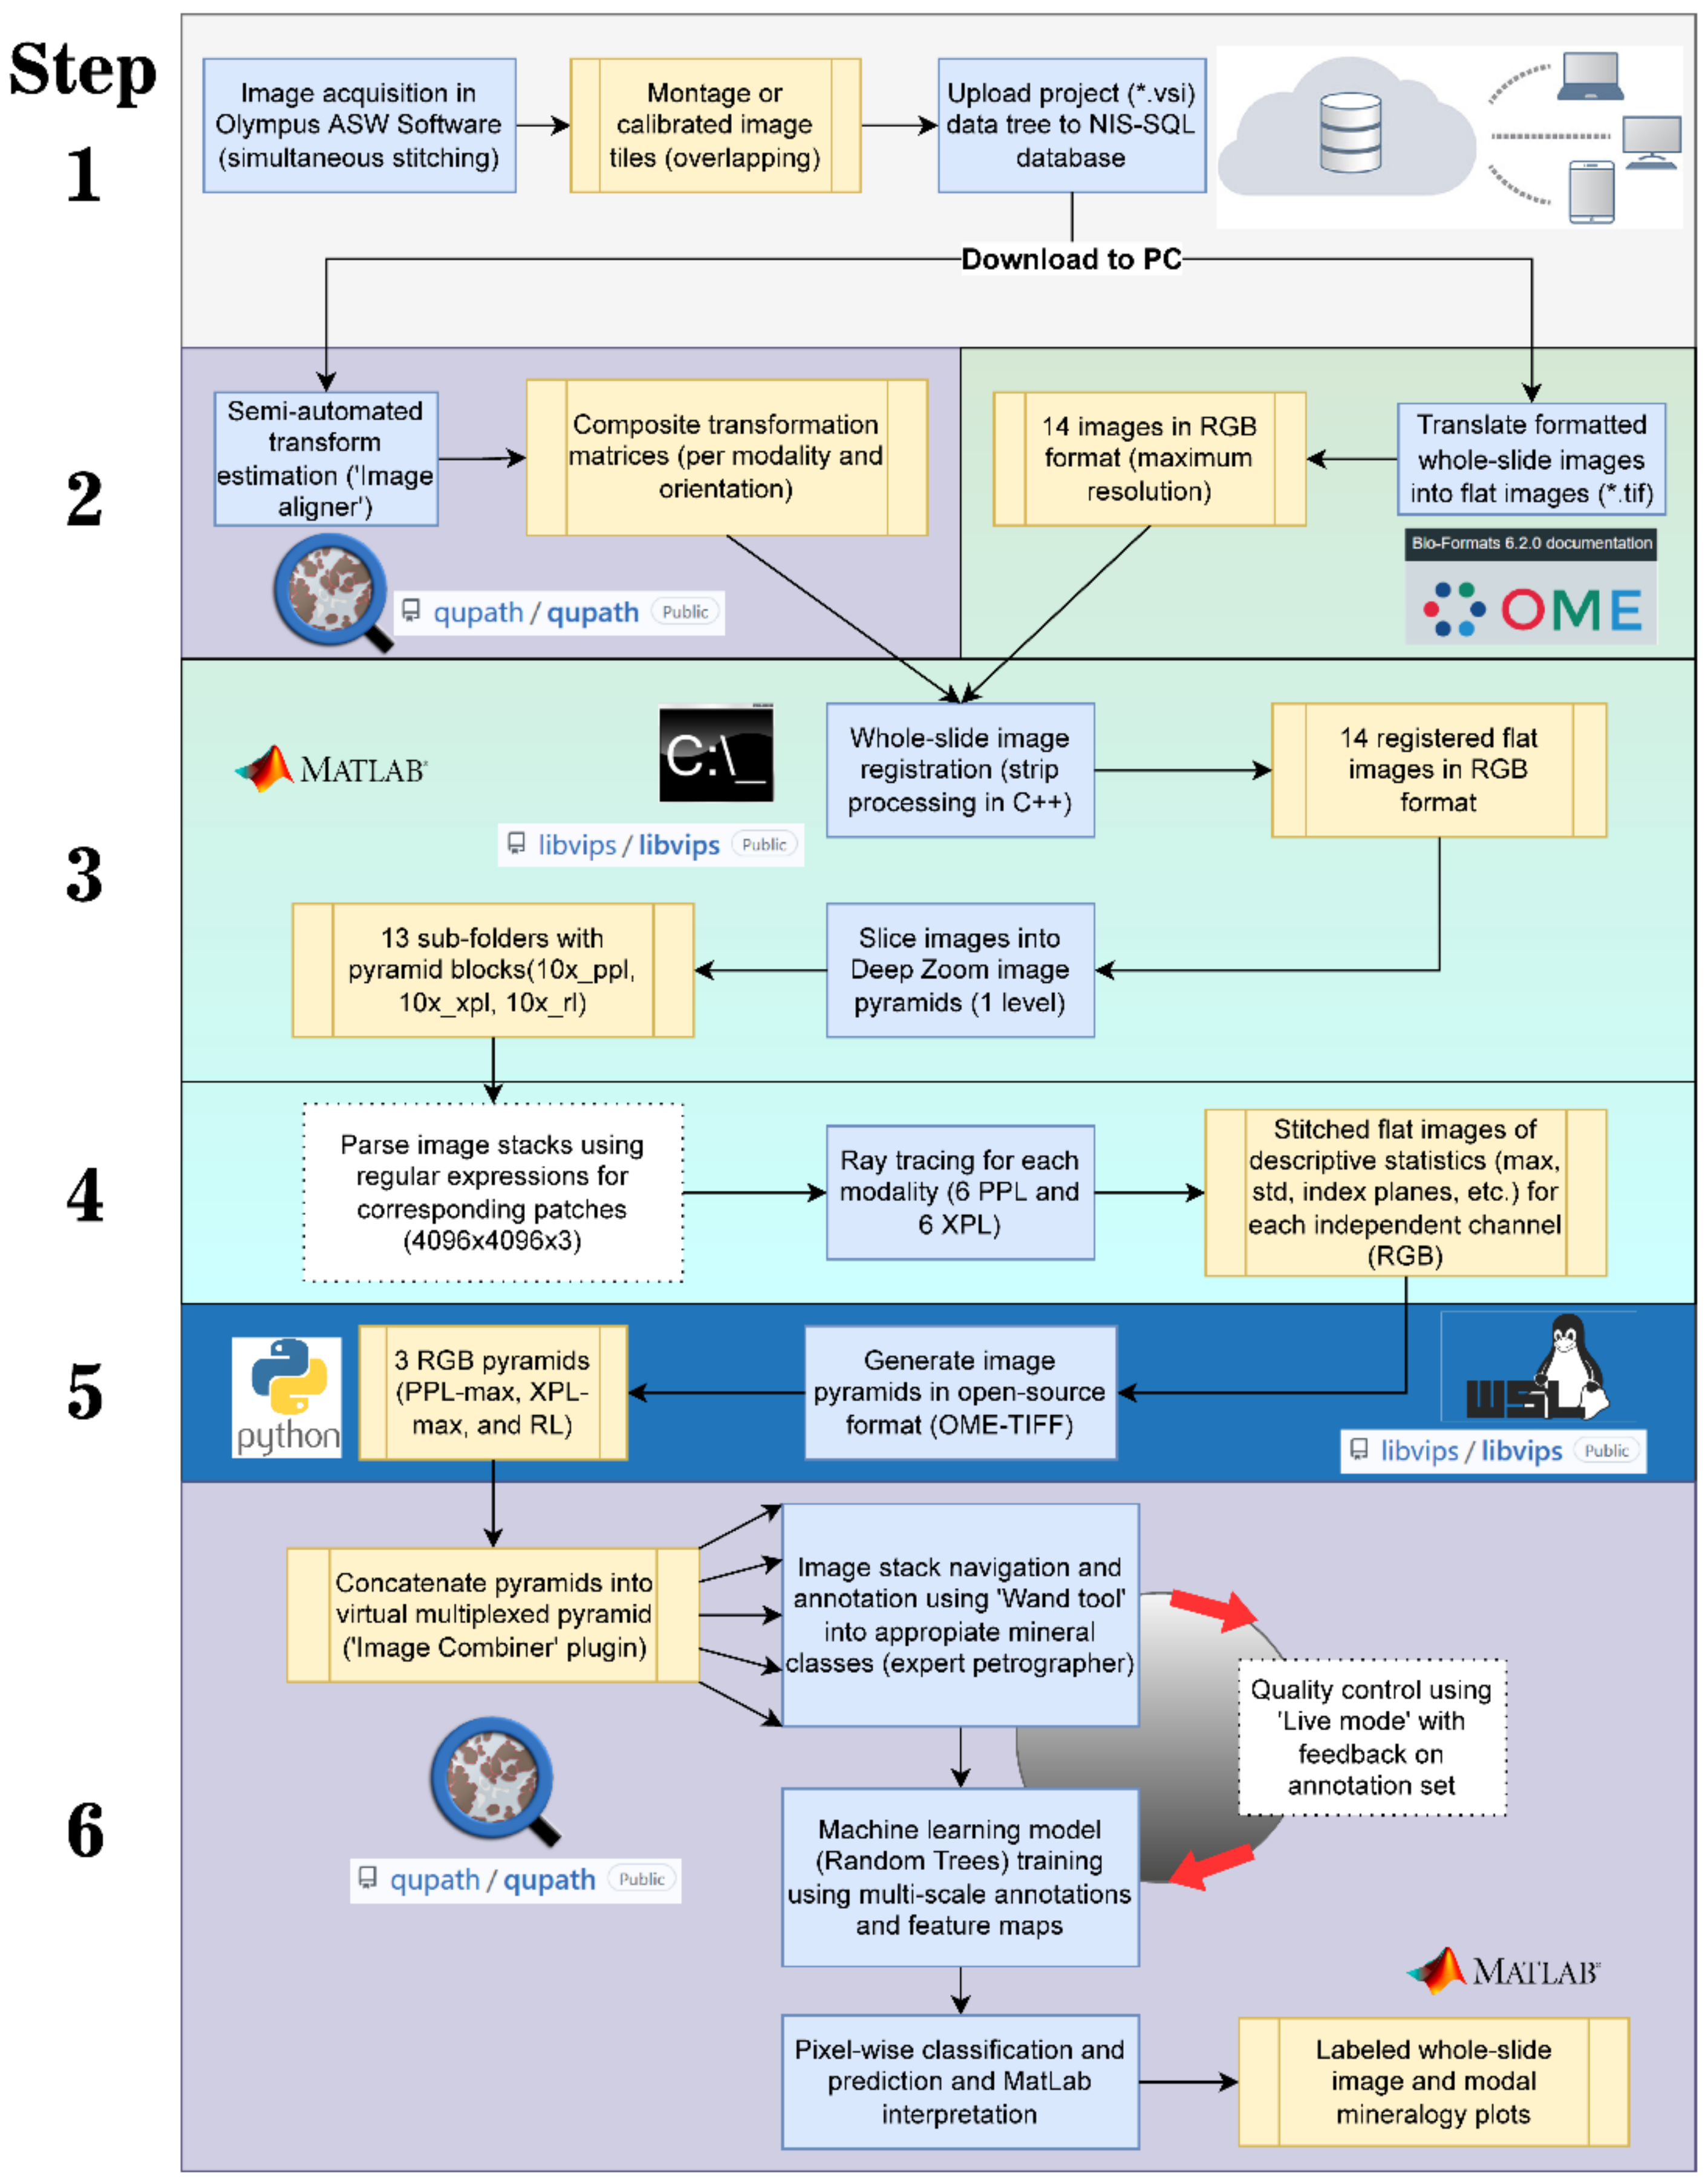



| Calibration Item | Optical Light Path (Camera at the Top) | Illumination Modality (Detailed Scan) | Label Scan | |||
|---|---|---|---|---|---|---|
| Brightfield | Plane Polarised | Cross-Polarised | Reflected Light | |||
| VS Olympus calibration slide v2.0 | stage XYZ calbration, distortion, rotation, objective XY shift, parfocality, etc. | shading (dark-field and flat-field) | WB, shading | |||
| Bt-gt gneiss | WB targeting epoxy | orientation targeting biotite, WB targeting epoxy | orientations cross-polarisation targeting garnet, WB targeting quartz | |||
| Semi-conductor silicon wafer (bluish color) | shading (unfocusing dust) | |||||
| Natural quartz slide (yellowish color, nearly perpendicular to C-axis) | shading (unfocusing inclusions or dust) | |||||
| White label (pasted on glass slide) | WB | WB, shading | ||||
| Added part (not default): | ||||||
| Objective PLN 2× (achromat) | X (overview scan) | X | ||||
| Objectives MPLFLN 10× and 40× (no cover glass semi-apochromat) | X | X | X | X | X | |
| Objective MPLAPON 20× LEXT (no cover glass plan-apochromat) | X | X | X | X | X | |
| pT-100 LED (CoolLED) | X | |||||
| Mounted wire grid polariser φ = 25 mm for 420–700 nm. Installed within U-FDICT cubes of IX3 (6 units) | X | |||||
| Ø1.5” (φ = 38.1 mm, thick= 9.53 mm) N-BK7 Plano-Convex Lenses (Uncoated) (2 units) | demagnification required before C-mount (replaced the beam splitter) | |||||
| Short-slide tray (51 × 26 mm slides) | X | |||||
Disclaimer/Publisher’s Note: The statements, opinions and data contained in all publications are solely those of the individual author(s) and contributor(s) and not of MDPI and/or the editor(s). MDPI and/or the editor(s) disclaim responsibility for any injury to people or property resulting from any ideas, methods, instructions or products referred to in the content. |
© 2023 by the authors. Licensee MDPI, Basel, Switzerland. This article is an open access article distributed under the terms and conditions of the Creative Commons Attribution (CC BY) license (https://creativecommons.org/licenses/by/4.0/).
Share and Cite
Acevedo Zamora, M.A.; Kamber, B.S. Petrographic Microscopy with Ray Tracing and Segmentation from Multi-Angle Polarisation Whole-Slide Images. Minerals 2023, 13, 156. https://doi.org/10.3390/min13020156
Acevedo Zamora MA, Kamber BS. Petrographic Microscopy with Ray Tracing and Segmentation from Multi-Angle Polarisation Whole-Slide Images. Minerals. 2023; 13(2):156. https://doi.org/10.3390/min13020156
Chicago/Turabian StyleAcevedo Zamora, Marco Andres, and Balz Samuel Kamber. 2023. "Petrographic Microscopy with Ray Tracing and Segmentation from Multi-Angle Polarisation Whole-Slide Images" Minerals 13, no. 2: 156. https://doi.org/10.3390/min13020156
APA StyleAcevedo Zamora, M. A., & Kamber, B. S. (2023). Petrographic Microscopy with Ray Tracing and Segmentation from Multi-Angle Polarisation Whole-Slide Images. Minerals, 13(2), 156. https://doi.org/10.3390/min13020156


