Article

Provenance Analysis of Marbles by Combination of Cathodoluminescence Spectroscopy and Electron Microprobe Analyses—Methodological Comments

by
Jiří Zachariáš
1,*,
Aneta Kuchařová
1 and
Marek Kotrlý
2
1
Institute of Geochemistry, Mineralogy and Mineral Resources, Faculty of Science, Charles University, Albertov 6, 128 43 Prague, Czech Republic
2
Institute of Criminalistics, Bartolomejska 12, 110 00 Prague, Czech Republic
*
Author to whom correspondence should be addressed.
Minerals 2023, 13(2), 244; https://doi.org/10.3390/min13020244
Submission received: 9 January 2023 / Revised: 3 February 2023 / Accepted: 7 February 2023 / Published: 9 February 2023

Abstract

:
Various marbles from historic quarries of the Czech Republic were examined by means of cathodoluminescence (CL) spectroscopy (quantitative data) to determine the possible inclusion of the method in marble provenance studies. The methodology used was based on a combination of electron microprobe analysis (Ca, Mg, Fe and Mn composition) and CL spectroscopy (intensity) of calcite and dolomite grains of the marbles studied. Several statistical techniques were applied to the CL-spectra to find the most effective way of characterization of the CL-spectra for provenance discrimination. The combination of Mg-admixture of calcite and position of the maximum (i.e., centre) of a single Gaussian curve was revealed to be the most discriminative dependence of the marbles studied.

Graphical Abstract

1. Introduction

Cathodoluminescence (CL) is the process in which mineral phases are bombarded by a source of high-energy electrons which cause the emission of photons with various wavelengths [1]. The different colours of the luminescence of marbles depend on impurities hosted in the crystal (extrinsic centres) or on lattice defects (intrinsic centres) of the carbonate minerals [2]. The intrinsic structural defect of calcite in the UV spectral region (at ~400 nm) related to very dark blue CL has been described elsewhere [1,3,4]. The blue luminescence is typical of modern (recent to subrecent) samples that have not undergone recrystallization, while in many ancient geological samples (rocks), its manifestation is suppressed by the intensity of Mn2+-activated extrinsic luminescence. Mn2+ is the principal CL activator which can easily substitute Ca2+ and Mg2+ in carbonate minerals, notably within the calcite, dolomite and aragonite group [5]. Less is known about activators of extrinsic CL via trivalent Rare Earth elements [1,6]. By contrast, the most common quencher of luminescence is Fe2+ [1,6]. The CL spectra of calcite are dominated by yellow to orange CL emission at ~605–620 nm related to Mn2+ substitution [3,7]. Dolomite exhibits CL emission predominantly at 649–659 nm in the red spectral region (Mn2+ in Mg-lattice-position) and can display a second overlapping peak at 570–583 nm in yellow CL (Mn2+ in Ca-lattice-position) [7,8,9,10]. Aragonite displays yellow-green and green CL at ~540 and 560 nm related to Mn2+ substitution [1,7].
The CL of carbonates has been used for examination of various research questions including diagenetic processes in carbonate formations, the identification of geochemically non-altered fossils and the reconstruction of crystallization sequence of hydrothermal veins. Here we explore the composition of marbles, with the aim of determining whether CL characteristics can be used for the provenance determination of marbles from historical artefacts [11,12,13]. Qualitative CL based on optical (light) microscopy (a cold or hot cathode CL device attached to a polarizing microscope) using polished thin sections represents the first CL methodological approach. Carbonates were compared according to their CL colour, intensity and distribution in microphotographs, which represents a subjective process. Second, quantitative CL characteristics (intensity) were established by means of spectral analysis (CL-spectrometer coupled with optical or electron microscope/probe microanalyzer) [14,15]. Until recently, the spectral CL has rarely been applied for such provenance analysis [13,16,17].
It must be recognized from the outset that the examination of regional marble sources is a difficult task. First, the geologic units commonly exhibit significant variation in the examined properties, even within a single quarry, due to e.g., primary or secondary compositional variation, post-peak metamorphic veining and variability in the style and intensity of deformation (at the dm-to-m scale). Second, stone coming from different localities may exhibit similar macroscopic and microscopic characteristics. Finally, intensive international trade since antiquity commonly resulted in the trade of highly valued stone varieties and their transportation over large distances. In addition, highly valued marble layers were also often quarried in their entirety, making sampling of these regions difficult. Moreover, the fingerprinting of archaeological marbles requires the application of non-destructive methods (or very low-destructive when only a small amount of the material is sufficient for the analysis). To overcome the difficulties, various combinations of analytical techniques have been suggested, mainly for white Mediterranean marbles [18,19,20]. The complex methodology including CL was recently also evaluated for other European countries where local marbles differ from most white marbles from “classical” marble-producing regions (e.g., presence of a higher amount of non-carbonate phases or various microfabric) that affects the proper selection of provenancing techniques [17,21,22].
The main aim of the study consists in exploring the potential of CL spectroscopy in the provenance determination of Czech marbles in conjunction with high-quality chemical microanalyses of the major and minor elements (i.e., Ca, Mg, Fe and Mn) in calcite and dolomite grains. Several statistical techniques were then applied to all CL-spectra to find the most effective characterization of CL-spectra for provenance discrimination.

2. Geological Setting, Previous Petrographic Data and Marble Employment for Decorative Purposes

2.1. Geological Setting

The three historic quarries (Raspenava, Bohdaneč and Nedvědice) examined in this study are located in the Bohemian Massif (Czech Republic), specifically within the Lugicum (Krkonoše-Jizera Terrane), the Kutná Hora and Svratka Crystalline Complex (Table 1). The geological map, including the position of the quarries examined in this study, was described in [23] (Raspenava—No. 6, Nedvědice No. 24, Bohdaneč—No. 28 in Figure 1 of the article). They all represent important quarrying areas where marbles were produced in the past; however, only the Bohdaneč quarry is still operating. These marbles represent original marine limestone units with clay and silicate layers that underwent a complex polyphase metamorphic evolution [24,25,26,27,28] (Table 1). The marbles were affected by regional Variscan metamorphism (ca. 350–330 Ma) at variable intensity; the contact metamorphism played a minor role only within certain phases of the metamorphism (e.g., marbles from Nedvědice) (Table 1). Marbles occur as thin lenticular bodies (~200 m long and 50 m thick) that form intercalations in mica shists and paragneisses (see Table 1). The age deposition of local metasediments is still a matter of dispute, and instead of what was formerly often referred to as the Proterozoic age (e.g., marbles from Raspenava) is more recently respected as the Early Palaeozoic age [24,25,26,27].

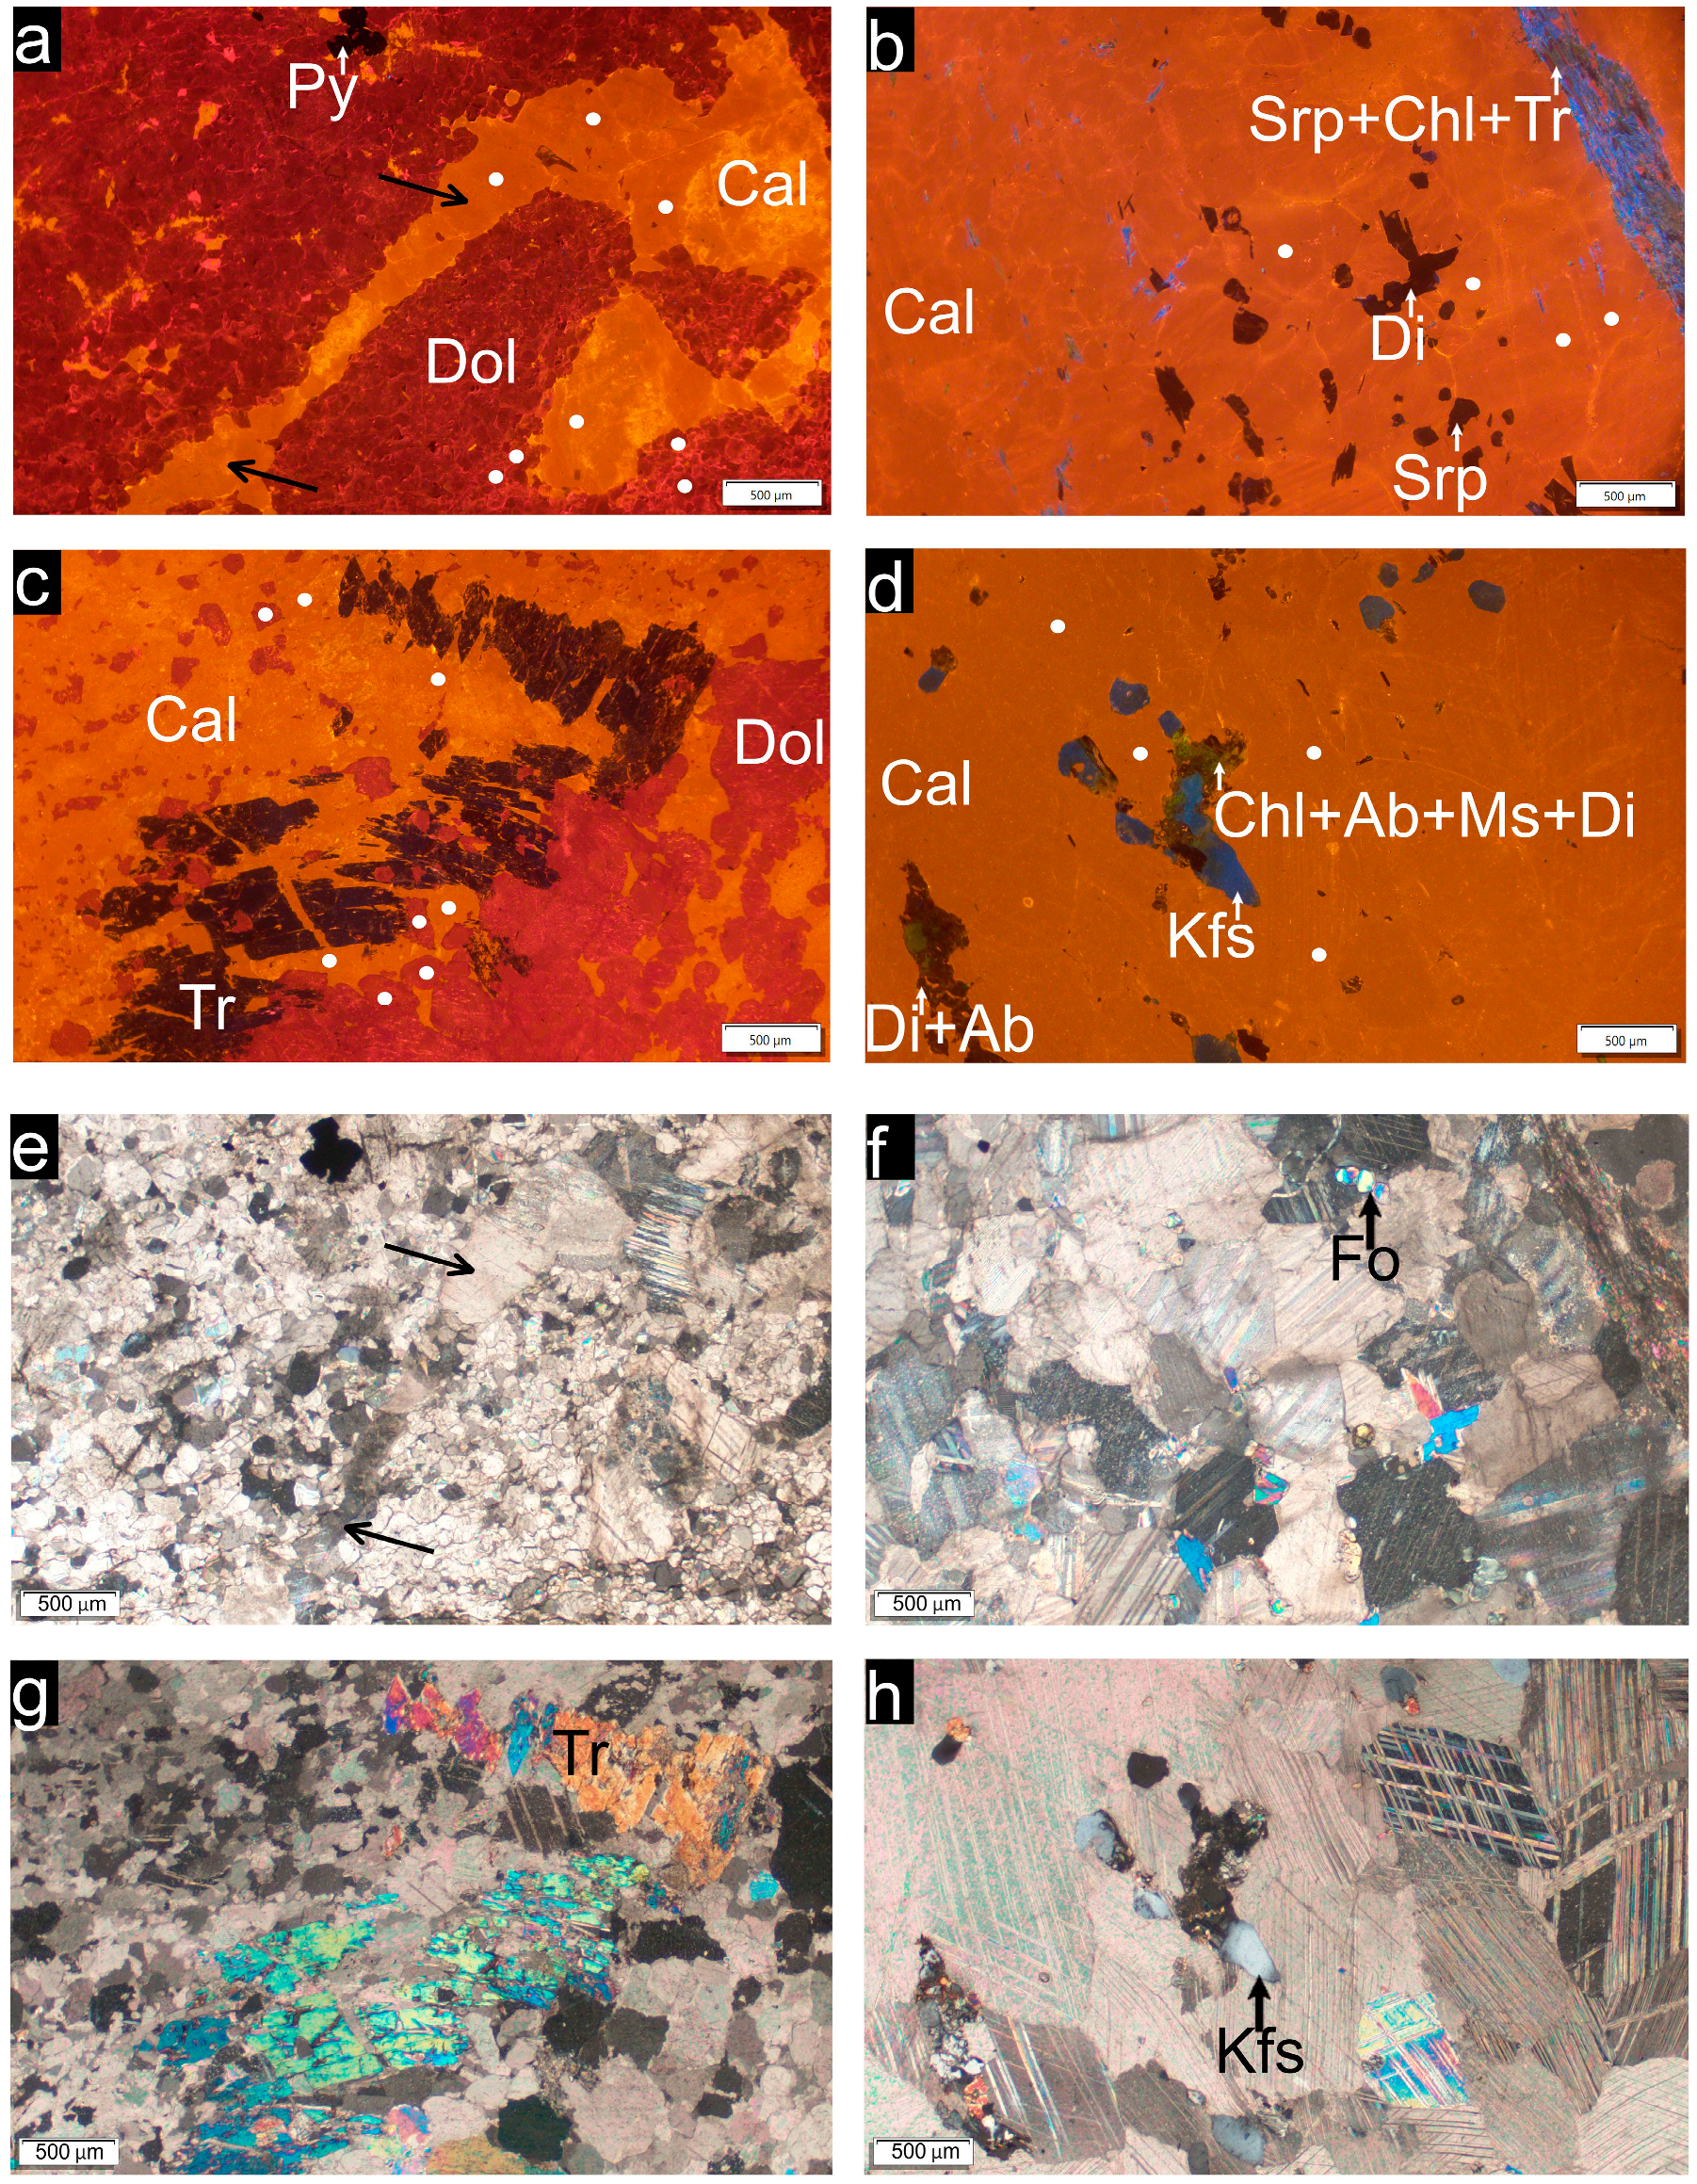
2.2. Mineralogical-Petrographic Description of Studied Samples

The mineralogical-petrographic characteristics of the marbles studied have been described in detail elsewhere [23]. They differ in their mineralogical composition (type of mineral phases and their abundances), as well as in their microfabrics (Table 2 and data within [23]). Based on these characteristics, the marbles studied correspond to fine-grained dolomitic marbles from Raspenava (forsterite and serpentine minerals serve as possible additional provenance indicators) and Bohdaneč (absence of diopside), as well as fine-grained calcitic marble from Nedvědice (wollastonite as distinctive accessory mineral) (Table 2). The presence of tremolite is typical for all the three studied marbles (Figure 1, Table 2). Dolomitic marbles (Raspenava and Bohdaneč) show conformable grain size and grain shape characteristics. More heteroblastic fabric with larger calcite grains occurs in calcitic marble from Nedvědice (Figure 1h, Table 2). Marbles exhibit a quasi-isotropic fabric without shape-preferred orientation.
Despite some distinct mineralogical-petrographic characteristics (including mineral content and fabric parameters), the marbles studied still exhibit significant variability, even within a single quarry [22,23]. In this study, different types in the single quarry were not distinguished, except two types of Raspenava marble (dolomitic marble type with secondary calcite veins and calcitic marble with various non-carbonate phases; Figure 1a,b,e,f).
The term “secondary calcite veins” or “veinlets” used below refers to very thin and short, visually almost invisible veinlets of the same colour as the host-marble. Under the microscope, they show highly irregular non-planar vein margins (Figure 1e) and very intense orange cathodoluminescence colour (Figure 1a). Locally, they pass into void fillings. Samples representing visually well-discernible veins (e.g., >5 mm thick) have not been included in this study (and are rare at the studied sites).

2.3. Decorative Applications of Studied Samples

The Raspenava marble was formerly used for industrial applications (production of lime, cement, finely ground agricultural limestone); however, exploitation of dimension stones has also been documented (e.g., burial chapel of the Redern family in Dean Church of Frýdlant) [28,29]. The main exploitation of the Raspenava marble occurred in the 16th–18th centuries when the marble was popular for polished stonemason and sculptural applications [30,31]. The Bohdaneč marble was popular for paving cubes in the 20th century, which continues to the present [31]. The Nedvědice marble (also called Pernštejn marble) has a privileged position with respect to its utilization for decorative purposes. Local marbles have been quarried exclusively as dimension stone since the 14th century, and later on, more intensively in the 16th century when the Pernštejn Castle and the Castle in Doubravník were built [30,31]. More decorative components of this marble can be found in the cities of Žďár nad Sázavou and Brno [32].

3. Materials and Methods

3.1. Sampling

Marbles of the three quarries (Raspenava, Bohdaneč and Nedvědice) were sampled in blocks weighing between 10 and 20 kg, from the layer that had been most commonly exploited for decorative purposes (if this still existed). Four petrographic types of each quarry were sampled depending on the macroscopic homogeneity and variability of the rock fabric (foliation, grain size and shape). From each petrographic type, a polished uncovered thin section was prepared for CL and electron microprobe analyses (EMPA) (CL optical microscopy (Figure 1), CL spectroscopy and electron chemical microanalysis). Thin sections were carbon-coated for the EMPA.

3.2. EMPA

The main and trace element composition (Ca, Mg, Fe and Mn) of calcite and dolomite was measured by wavelength-dispersive Xray spectroscopy (WDS) using the JEOL EMPA with a field emission gun (FEG) electron source (JXA-8530F) hosted at the Institute of Petrology and Structural Geology, Faculty of Science, Charles University. The following instrumental settings were applied: 15 kV, 10 nA, beam diameter 5 µm, element (standards, dwell time peak/background): Ca (diopside, 20/10), Fe (magnetite, 20/10), Mn (rhodonite (20/10), Mg (periclase, 20/10). The measured analytical points were located as close as possible to areas (20 × 20 µm) where the CL-spectra were collected. The data were pre-processed in Excel® [33], and all graphs were prepared using Origin® [34]. The carbonate phases are presented as weight percent of oxides (wt.%).

3.3. CL Spectroscopy and CL Optical Microscopy

CL-spectra were collected using the “xCLent” spectroscopy system for combined CL and X-ray acquisition installed in the JEOL hyperprobe (see above). The CL detector is 1024 × 58 Hamamatsu S7031-1006 with a spectral range of 200–1000 nm (effectively 400–1000 nm due to the glass compounds of the optical microscope) and a spectral resolution of ca 8 nm. Each studied spectrum represents a summary of 10 individual spectra measured successively in a homogeneous area of 20 × 20 µm inside grains (step size 5 µm). Probe settings: 14 kV; 10 nA; beam diameter, 5 µm; dwell time, 60 ms. In total, 184 summary CL-spectra were measured; these included 113 spectra of calcite and 55 spectra of dolomite representing the groundmass of marbles and 16 calcite spectra of calcite veinlets occurring in the Raspenava marble (sample No. 174). Qualitative CL-microphotographs were collected using the Olympus DP-74 camera and the cold-stage CL instrument (Technosyn CL8200 Mk4, provided by CITL of Cambridge) for documentation purposes (see Figure 1). The applied electron energy was 14–15 kV, and the beam current operated at 320–350 µA. Optical CL analysis was conducted at the Institute of Geochemistry, Mineralogy and Mineral Resources, Faculty of Science, Charles University.

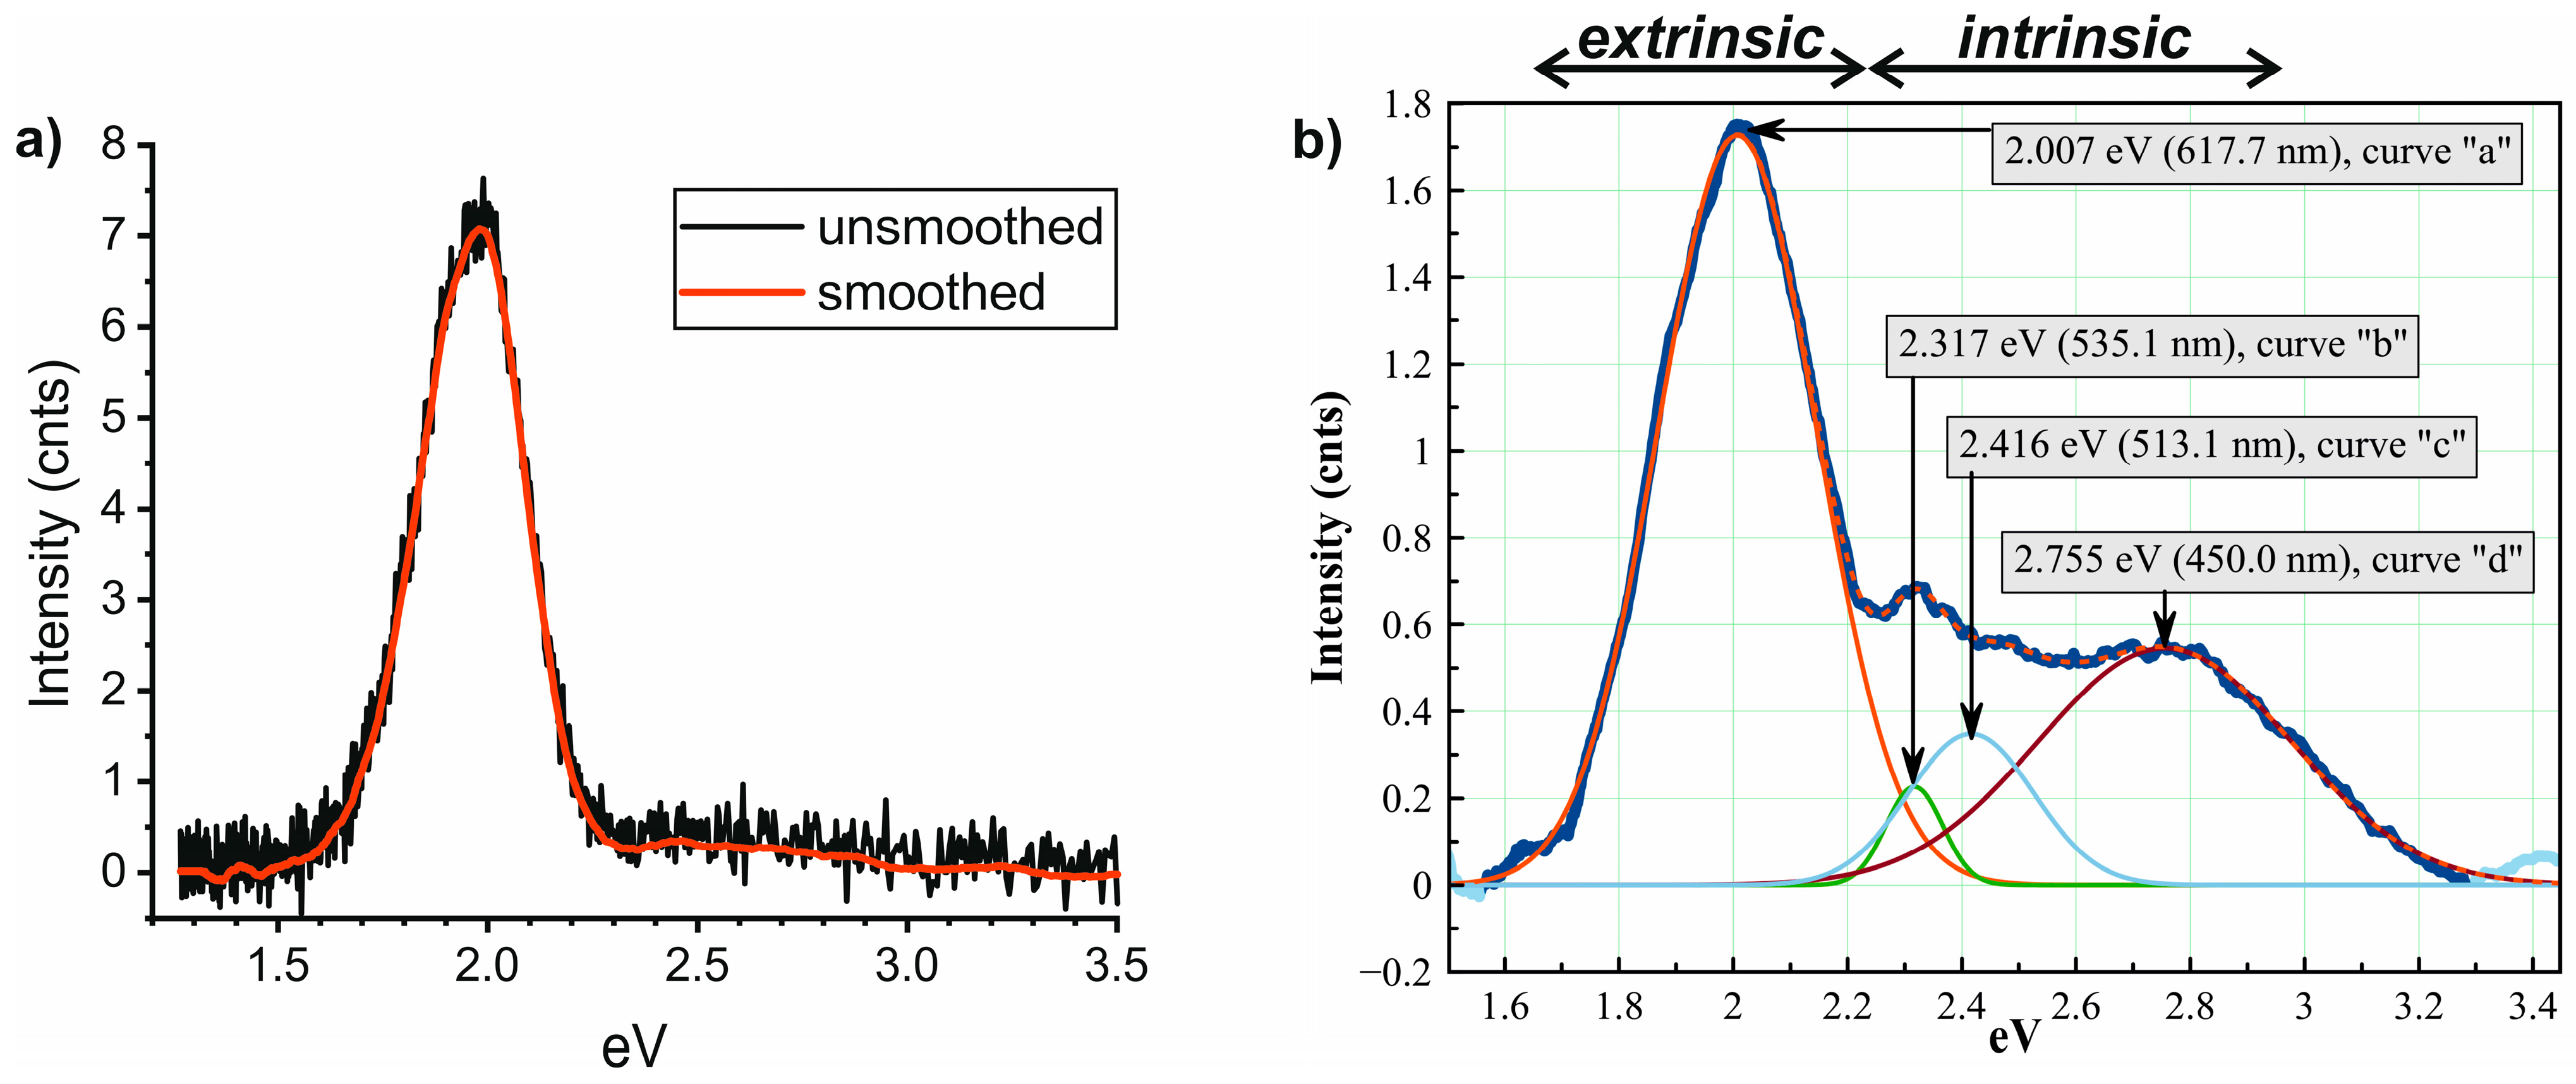
3.4. Processing of CL-Spectra

All CL-spectra were checked first for the presence of narrow peaks caused by CCD detector incidence with random cosmic rays. All spectra were then smoothed (Figure 2a) using the Savitzky–Golay quartic/quintic algorithm implemented in the Essential FTIR® software (v.3.50.114) [35]. The same spectra were also left unsmoothed as a separate group of data. A base-line correction (linear) was applied to smoothed spectra only, and it was numerically very small. Therefore, it was neglected for the unsmoothed spectra.
The next step included the conversion of wavelength-based spectra into photon-energy-based spectra. This included the conversion of the wavelength (λ, in nm) into the photon energy (E, in eV):
E = 1239.85/λ,
and conversion of the wavelength-based intensity (I(λ)) into the photon-energy based intensity (I(E)):
I(E) = λ2 I(λ),
The converted smoothed spectra were then fitted by Gaussian curves (Figure 2b). Fitting was carried out in MagicPlot® software (v.3.0.1; [36]), using an automated or semiautomated procedure. All fit results, both graphs and summary numerical table output, were checked for the presence of processing artefacts. Spectra exhibiting sufficiently high differences in intensities between the main CL-band (Figure 2b; “extrinsic”) and its peripheral “band/shoulder” (Figure 2b; “intrinsic”) were processed without problems, while unstable and problematic results were encountered when the intensity difference was small (extrinsic-to-intrinsic luminescence intensity ratio lower than about 2). Some spectra therefore must be refitted manually or by setting additional restrictions to the fitting procedure. The Gaussian curve is characterized by three parameters: position of the maximum (i.e., centre), amplitude (corresponding to intensity of CL) and/or area and HWHM (half width at half maximum). See the manual for the definition of mathematical formulas used in the fitting procedure (“Predefined Fit Curves Equations;” [37]).

4. Results

In total, 129 calcite and 55 dolomite CL spectra were collected and paired with 184 EMPA analyses (Ca, Mg, Fe and Mn). The composition of calcite was more variable than that of dolomite, and the Mg-admixture in calcite dominated significantly over that of Mn and Fe (see Figure 3a). A positive linear correlation between Mn- and Mg-admixture in calcite was identified in the sample No. 174 only (see Figure 3b).

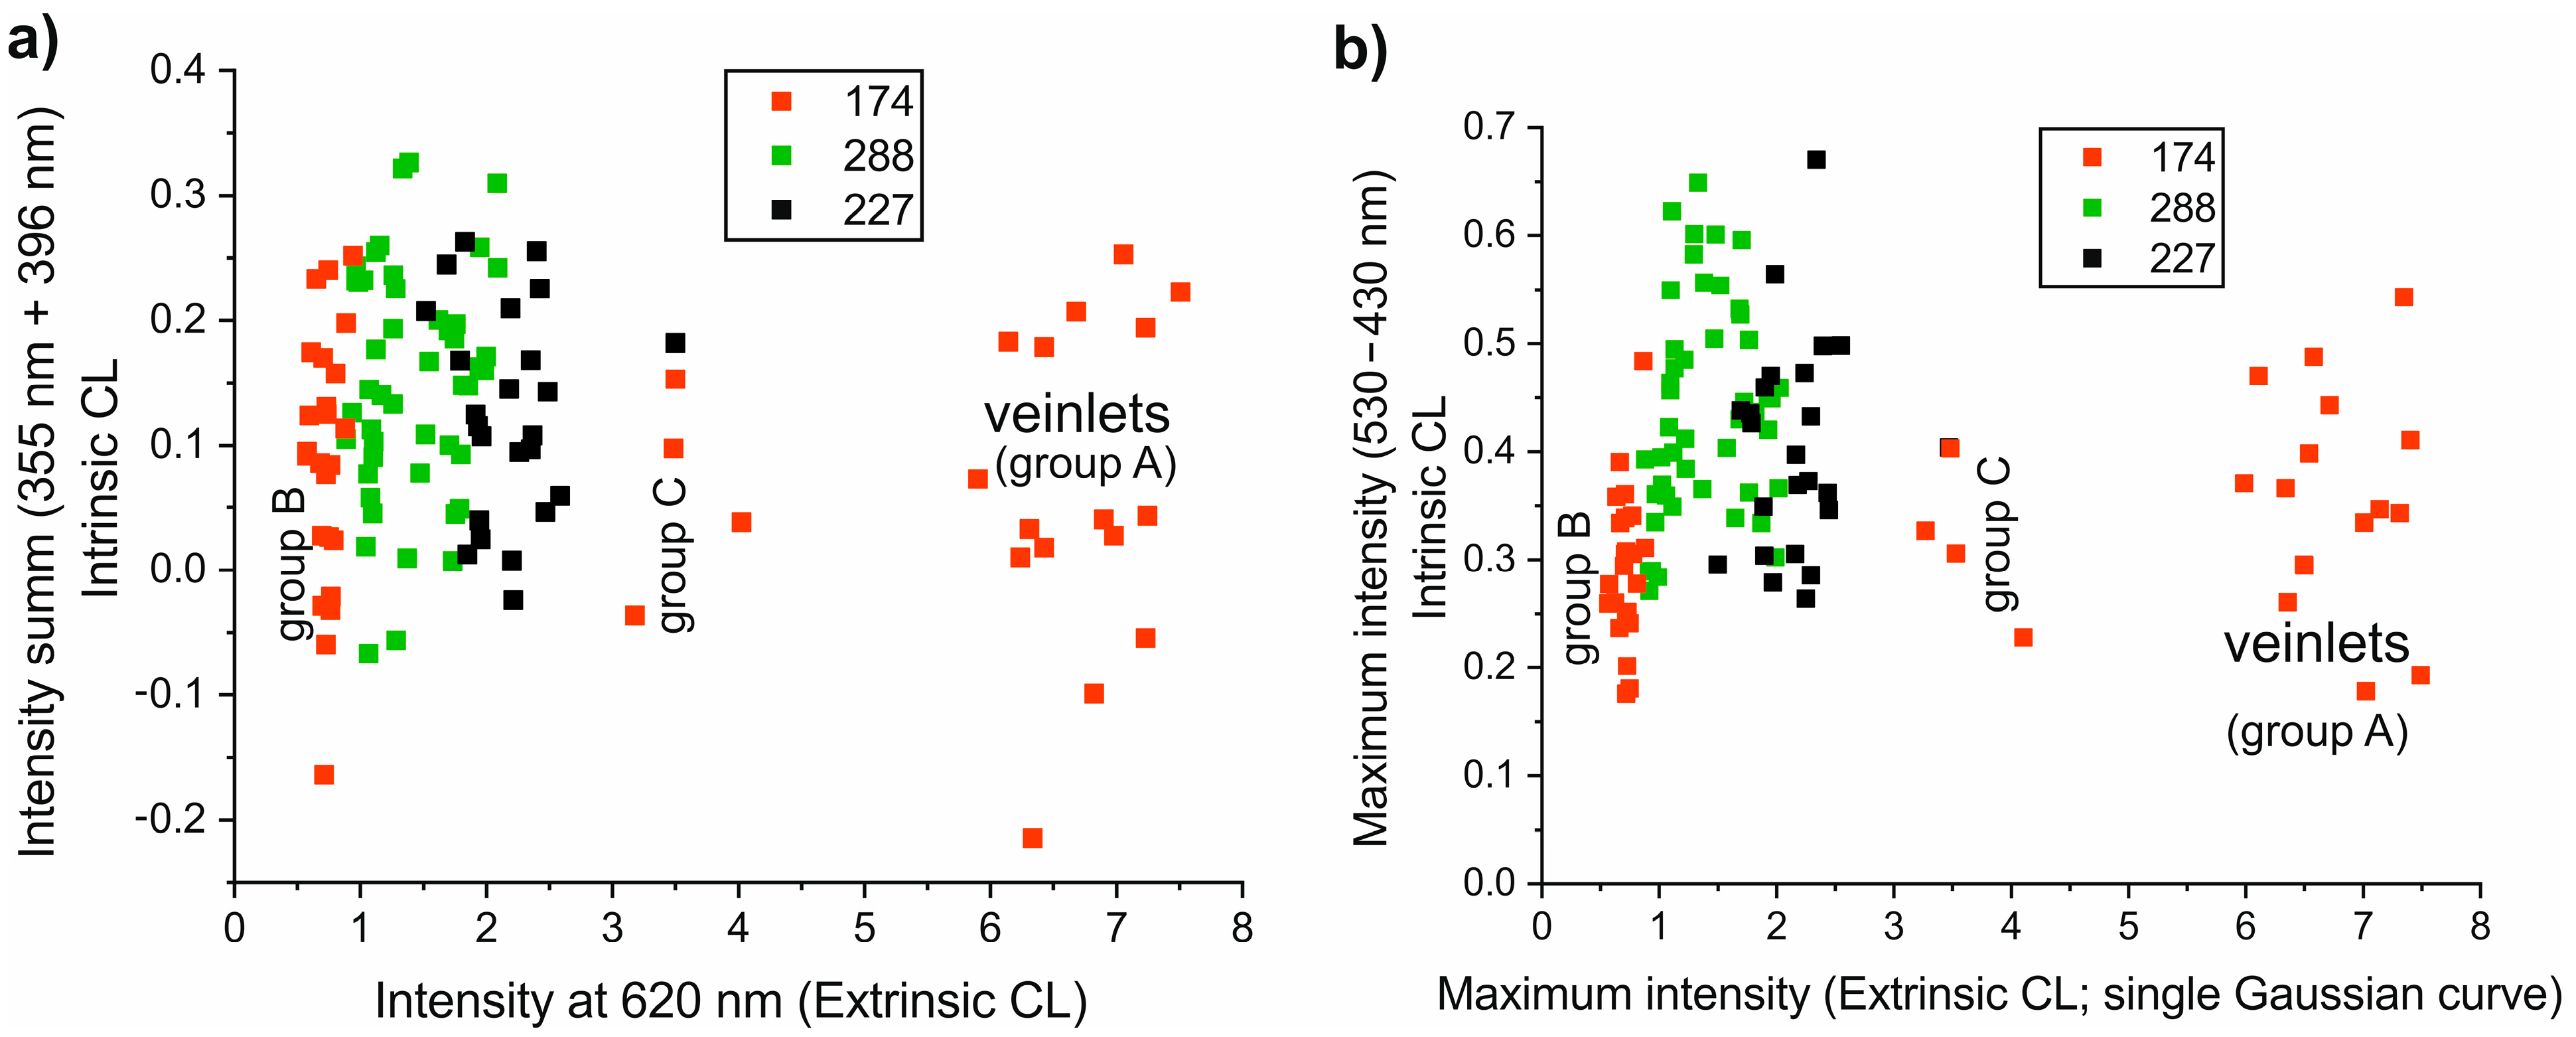
4.1. Provenance Discrimination of Samples Using Spectral Data Only

Comparison of the intensity of the extrinsic and the intrinsic luminescence (the parameter’s dependence was used according to [16]) of calcite of the studied marbles is depicted in Figure 4a. Data representing various spectra of the same sample usually form a single tight cluster. The clusters either did not overlap (in our case, samples No. 174 and 227) or overlapped in part (our samples No. 227 and 288). Provenance discrimination of quarries based on these two parameters inferred from individual CL-spectra is therefore unequivocal for some localities only (sample No. 174 vs. No. 227). Compared to other samples, the data of sample No. 174 (Raspenava marble) formed three markedly separated clusters. Data with the highest observed intensities (6–7.5 counts) corresponded to veinlets of hydrothermal calcite crosscutting the marble (compare Figure 4 vs. Figure 1a). The two lower intensity clusters represented groundmass calcite grains of two different petrographic types (calcitic vs. dolomitic marble) coming from the single quarry (compare Figure 4 vs. Figure 1a,b). The lowest intensity (0.5–1 counts) of calcite groundmass grains showed dolomitic marble with calcite veins. However, the calcitic type of dolomitic marble from Raspenava (Figure 1b) exhibited medium intensities (3–4 counts) (see Figure 4). The single cluster was identified in the case of sample No. 227 (Bohdaneč marble) with intensities from 1.5 to 2.5 counts, as well as of sample No. 288 (Nedvědice marble) with intensities from 1 to 2 counts (Figure 4). The intensity of the main peak was the most variable parameter of the plot, while that of the peripheral shoulder varied slightly in general.
The CL-intensity dependence (intrinsic vs. extrinsic intensity) used by [16] was modified comparing data derived from fitting the smoothed spectra by a single Gaussian plot and using slightly different wavelength range/value for reading the intensity of intrinsic luminescence (Figure 4b). Substantial differences were not identified between the two versions of the intensity plot, particularly with respect to the better discrimination of the localities studied. Another option of the (partial) discrimination among studied marbles was achieved by depiction of the position of the single Gaussian curve maximum/centre (see Figure 5).

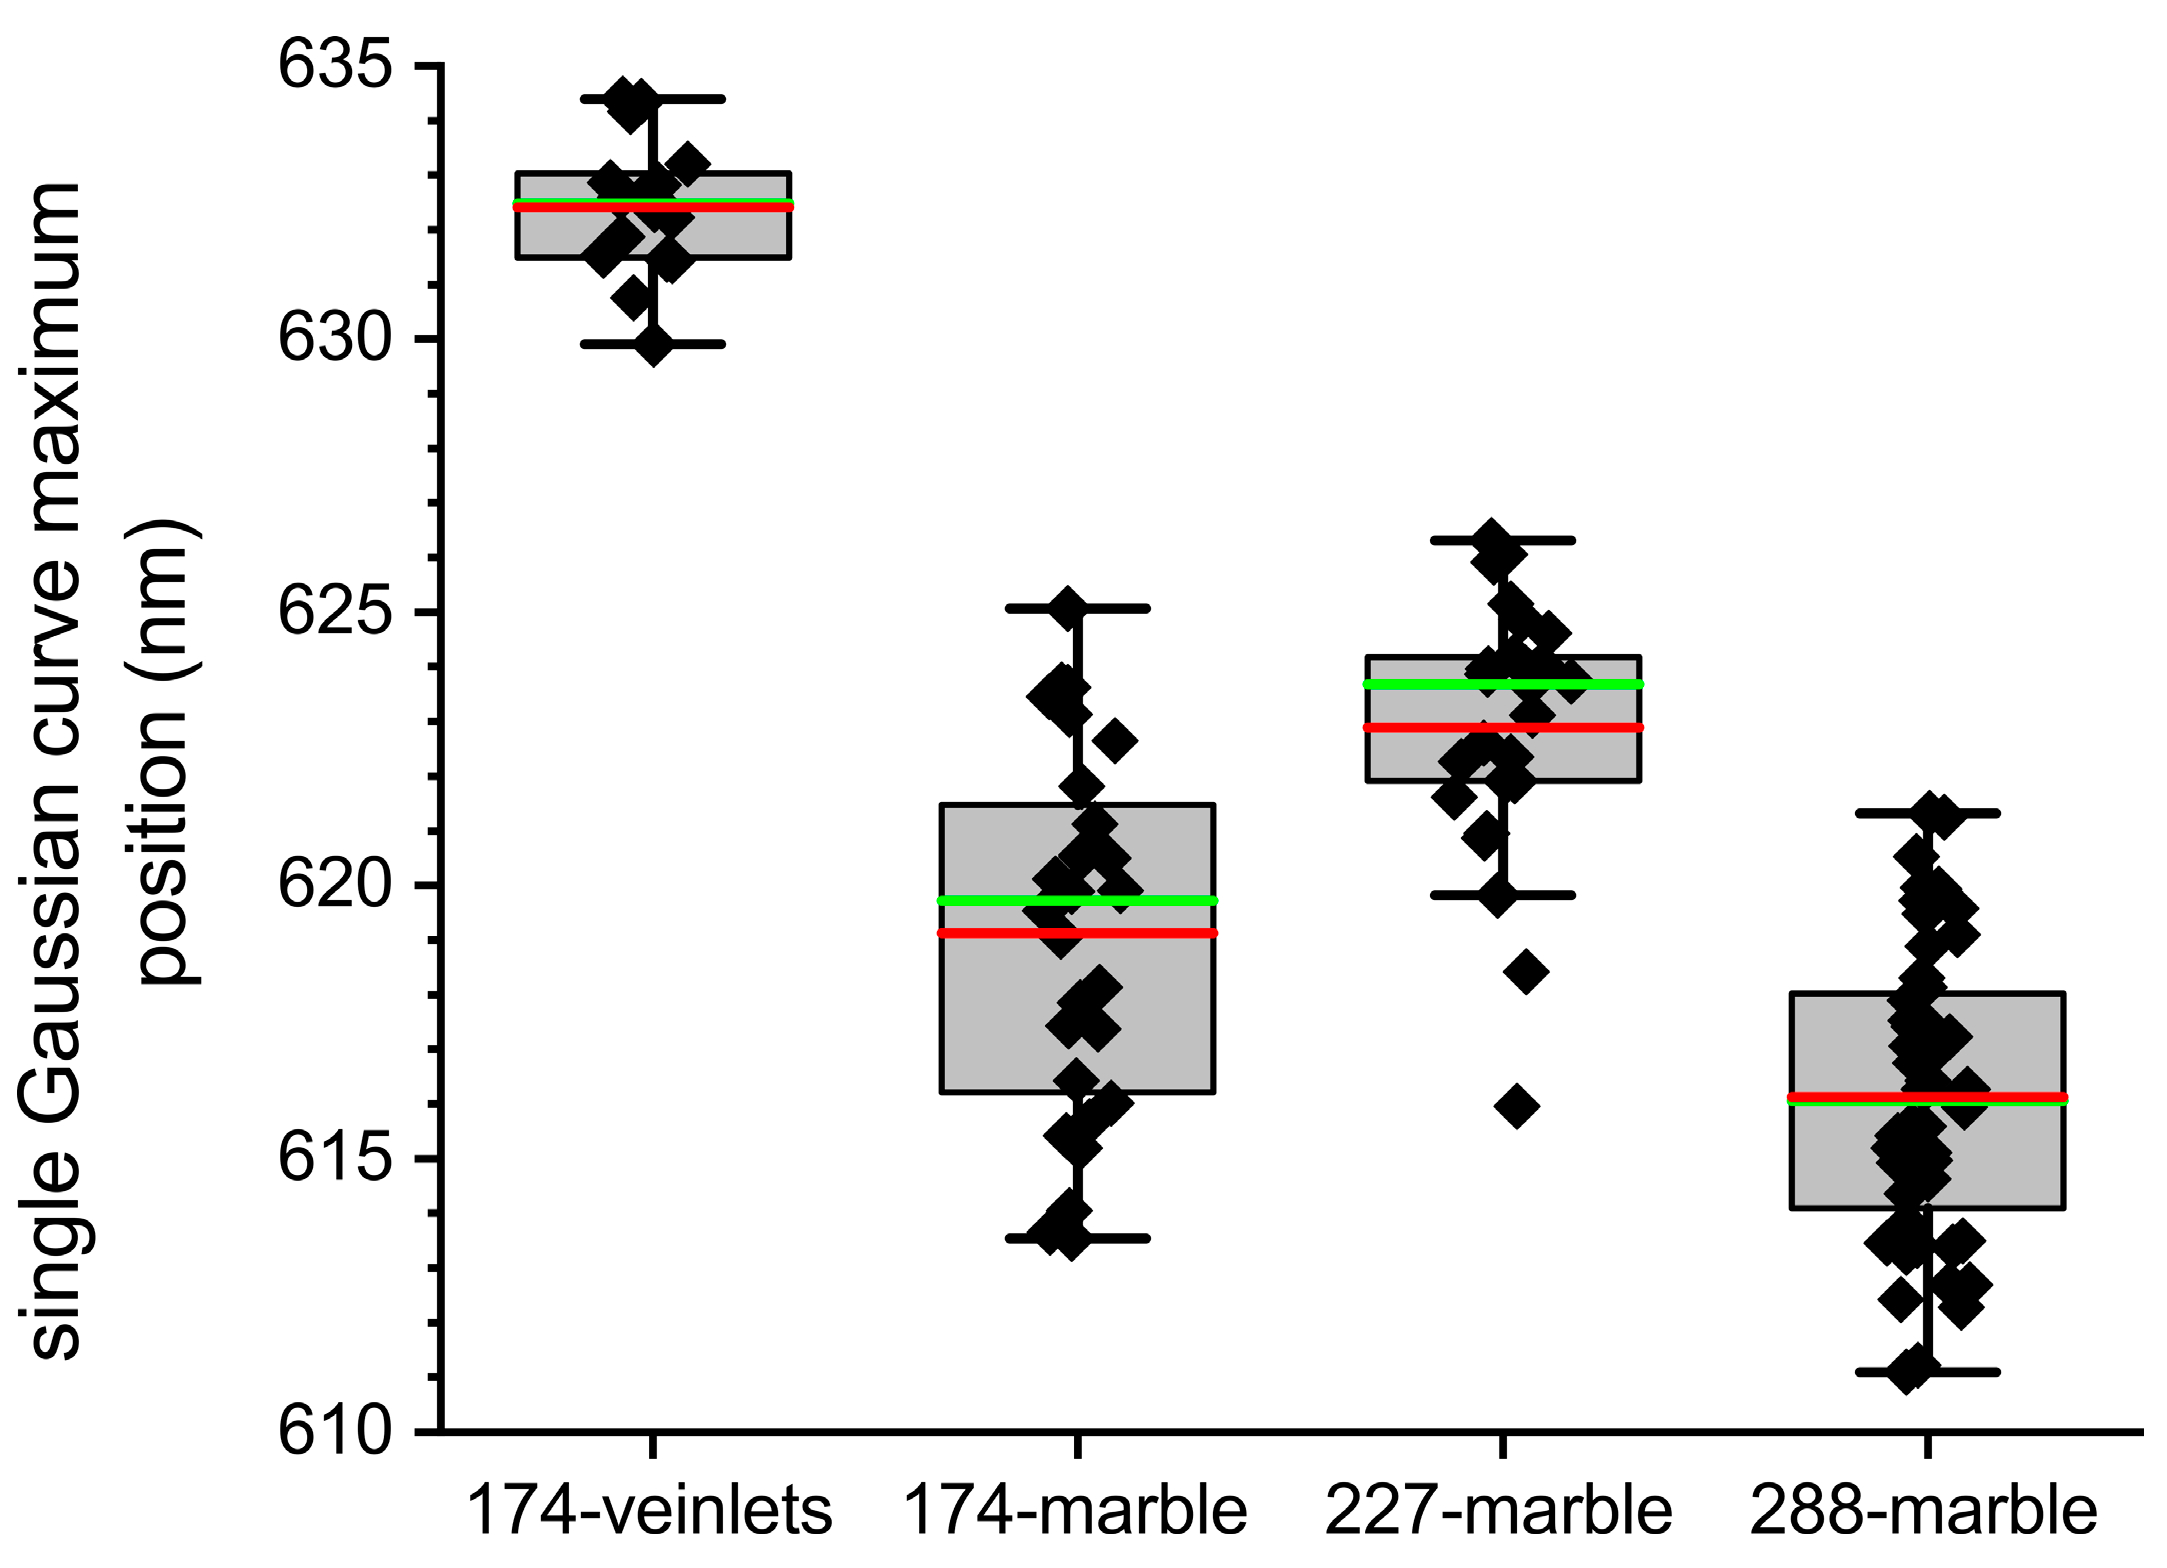
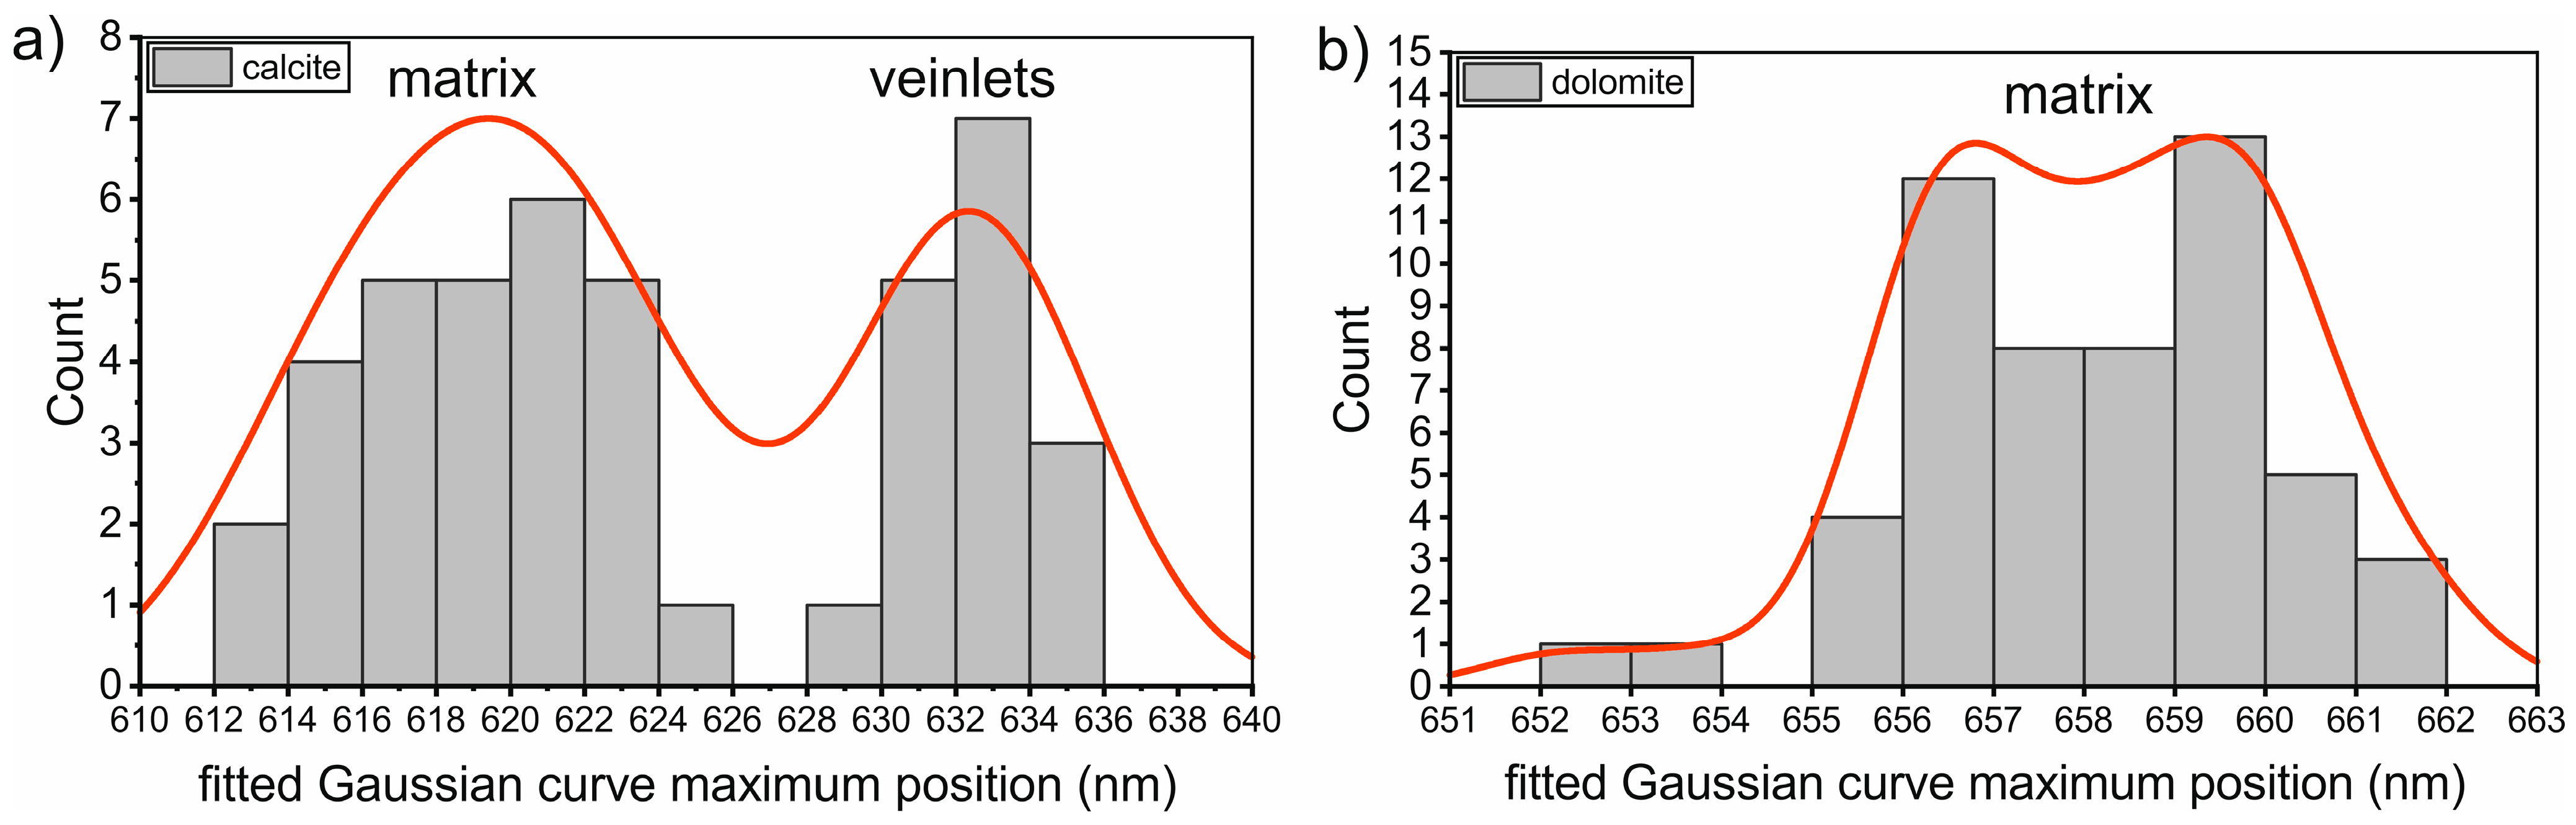
4.2. Fitting Calcite and Dolomite Spectra by a Single Gaussian Curve

The position of the maximum (i.e., centre) of the Gaussian curve is more variable and apparently bimodal for calcite because of clear separation between the groundmass and the veinlets (Figure 6a; 612–626 nm-groundmass; 629–636 nm—veinlets), while the position is unimodal and much narrower for dolomite (Figure 6b; 652–662 nm). The position of the maximum and the amplitude or area of the single Gaussian curve were found to be the most valuable parameters to describe the spectra among and within the studied samples.

4.3. Fitting Calcite and Dolomite Spectra by Two or More Gaussian Curves

The main CL-band (i.e., extrinsic) of most calcite and dolomite spectra, converted to photon energy scales, was slightly or more asymmetric. Therefore, deconvolution by two or three Gaussian curves, rather than by a single curve, is adequate. To reduce the ambiguity of the deconvolution results of the spectra, we decided that one of the two curves (or two of the three curves) should be fixed at specific energy/wavelength positions (615 nm/typical position of the extrinsic CL of Mg-free calcite activated by admixture of Mn/, and at 655 nm/typical position of the extrinsic CL of dolomite activated by admixture of Mn2+ occupying Mg sites in the structure of dolomite/). The difference between the results of deconvolution based on “totally unfixed” or “partly fixed” parameters of the Gaussian curves was small or negligible (see Figure 7c vs. Figure 7d).
Although there is no doubt that the CL-spectra can be better characterized by two Gaussian curves than by a single curve, any special benefit was not identified with respect to the provenance discrimination in case of application of the more time-consuming and artefact-prone methodological approach. However, the fitting by two curves was helpful to understand the nature of variation of parameters derived from the single Gaussian curve fit, specifically the extremely wide range of the position of maximum of the fit (ca 610–640 nm). The areas and amplitudes of the two curves (Figure 7b) and, consequently, the ratio of curve-1 and curve-2 areas (Figure 8a) and the ratio of curve-1 and curve-2 amplitudes (Figure 8b,c) can be correlated with the shift in the position of maximum of single Gaussian curve (data points show non-linear negative correlation resembling hyperbola-like curve). Calcite spectra dominated by curve-1 (cantered at 615 nm) exhibit low(-er) values of position of the maximum of a single curve than spectra dominated by curve-2 (centred at >615 nm). The position of maximum and area of curve-2 reflect the amount of Mg-admixture in calcite. All four parameters (i.e., position of single Gaussian curve maximum, ratio of curve-1/curve-2 areas, ratio of curve-1/curve-2 amplitudes and Mg-admixture) were mutually intercorrelated (Figure 8).

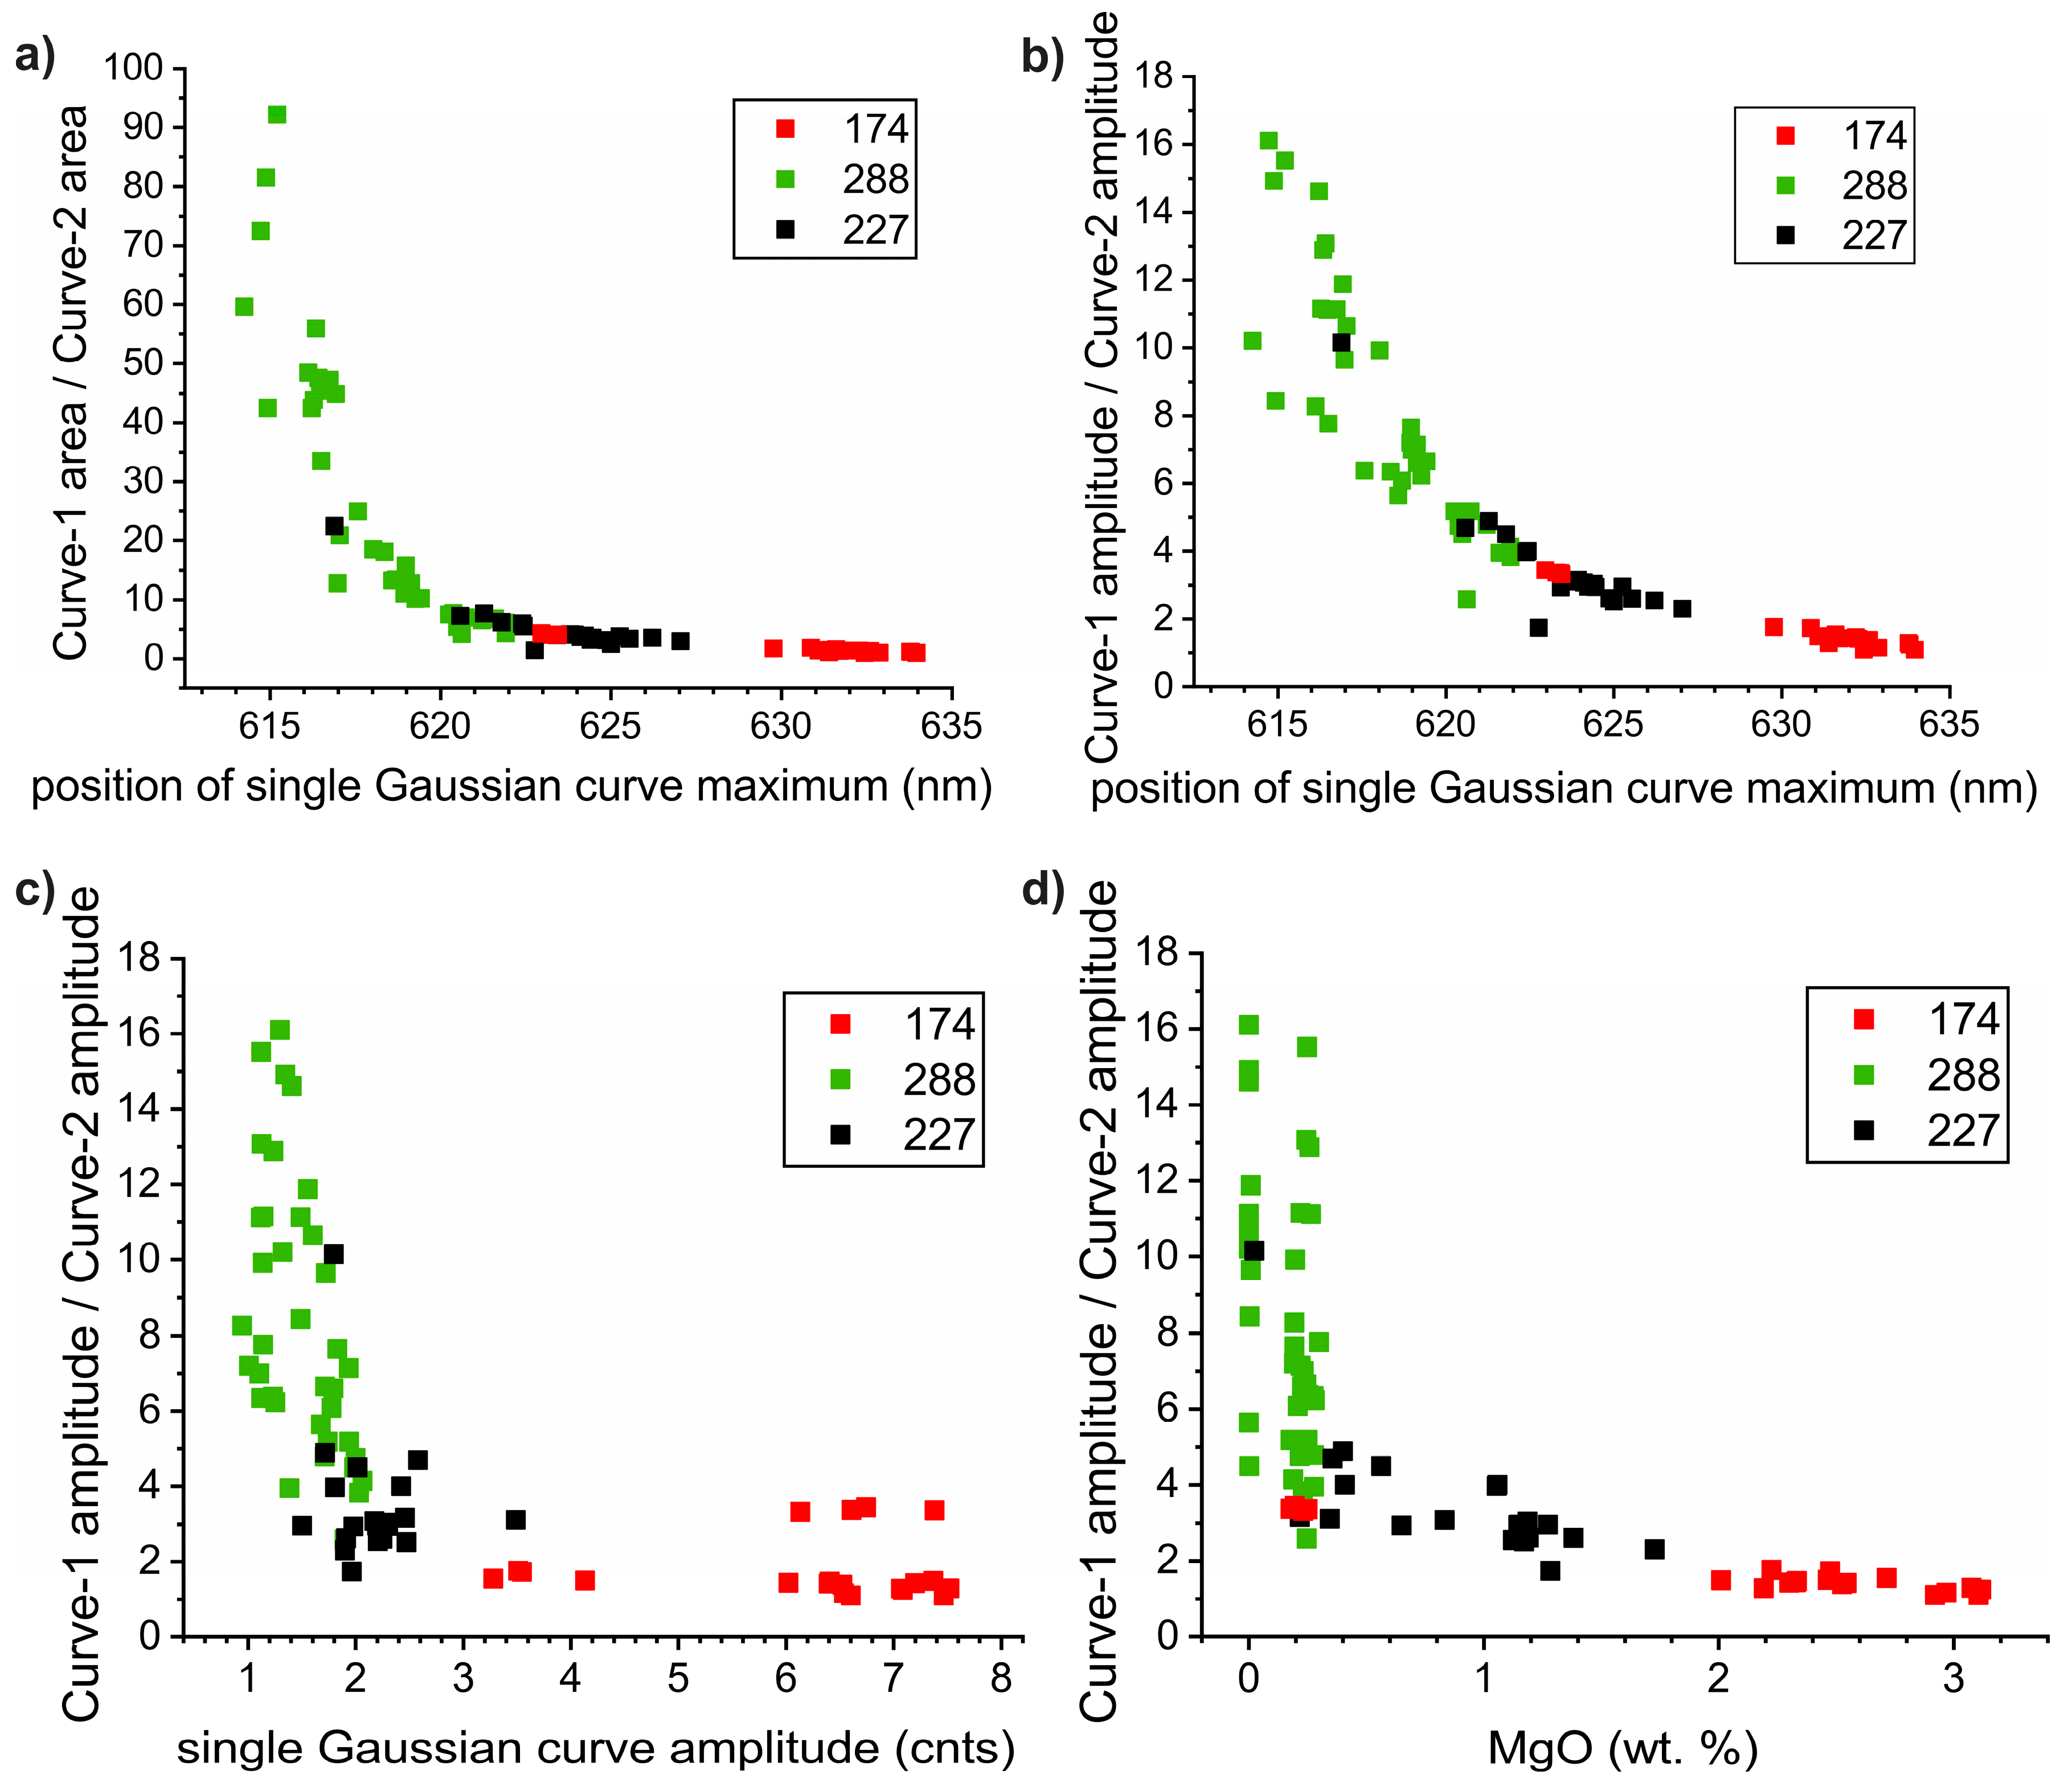
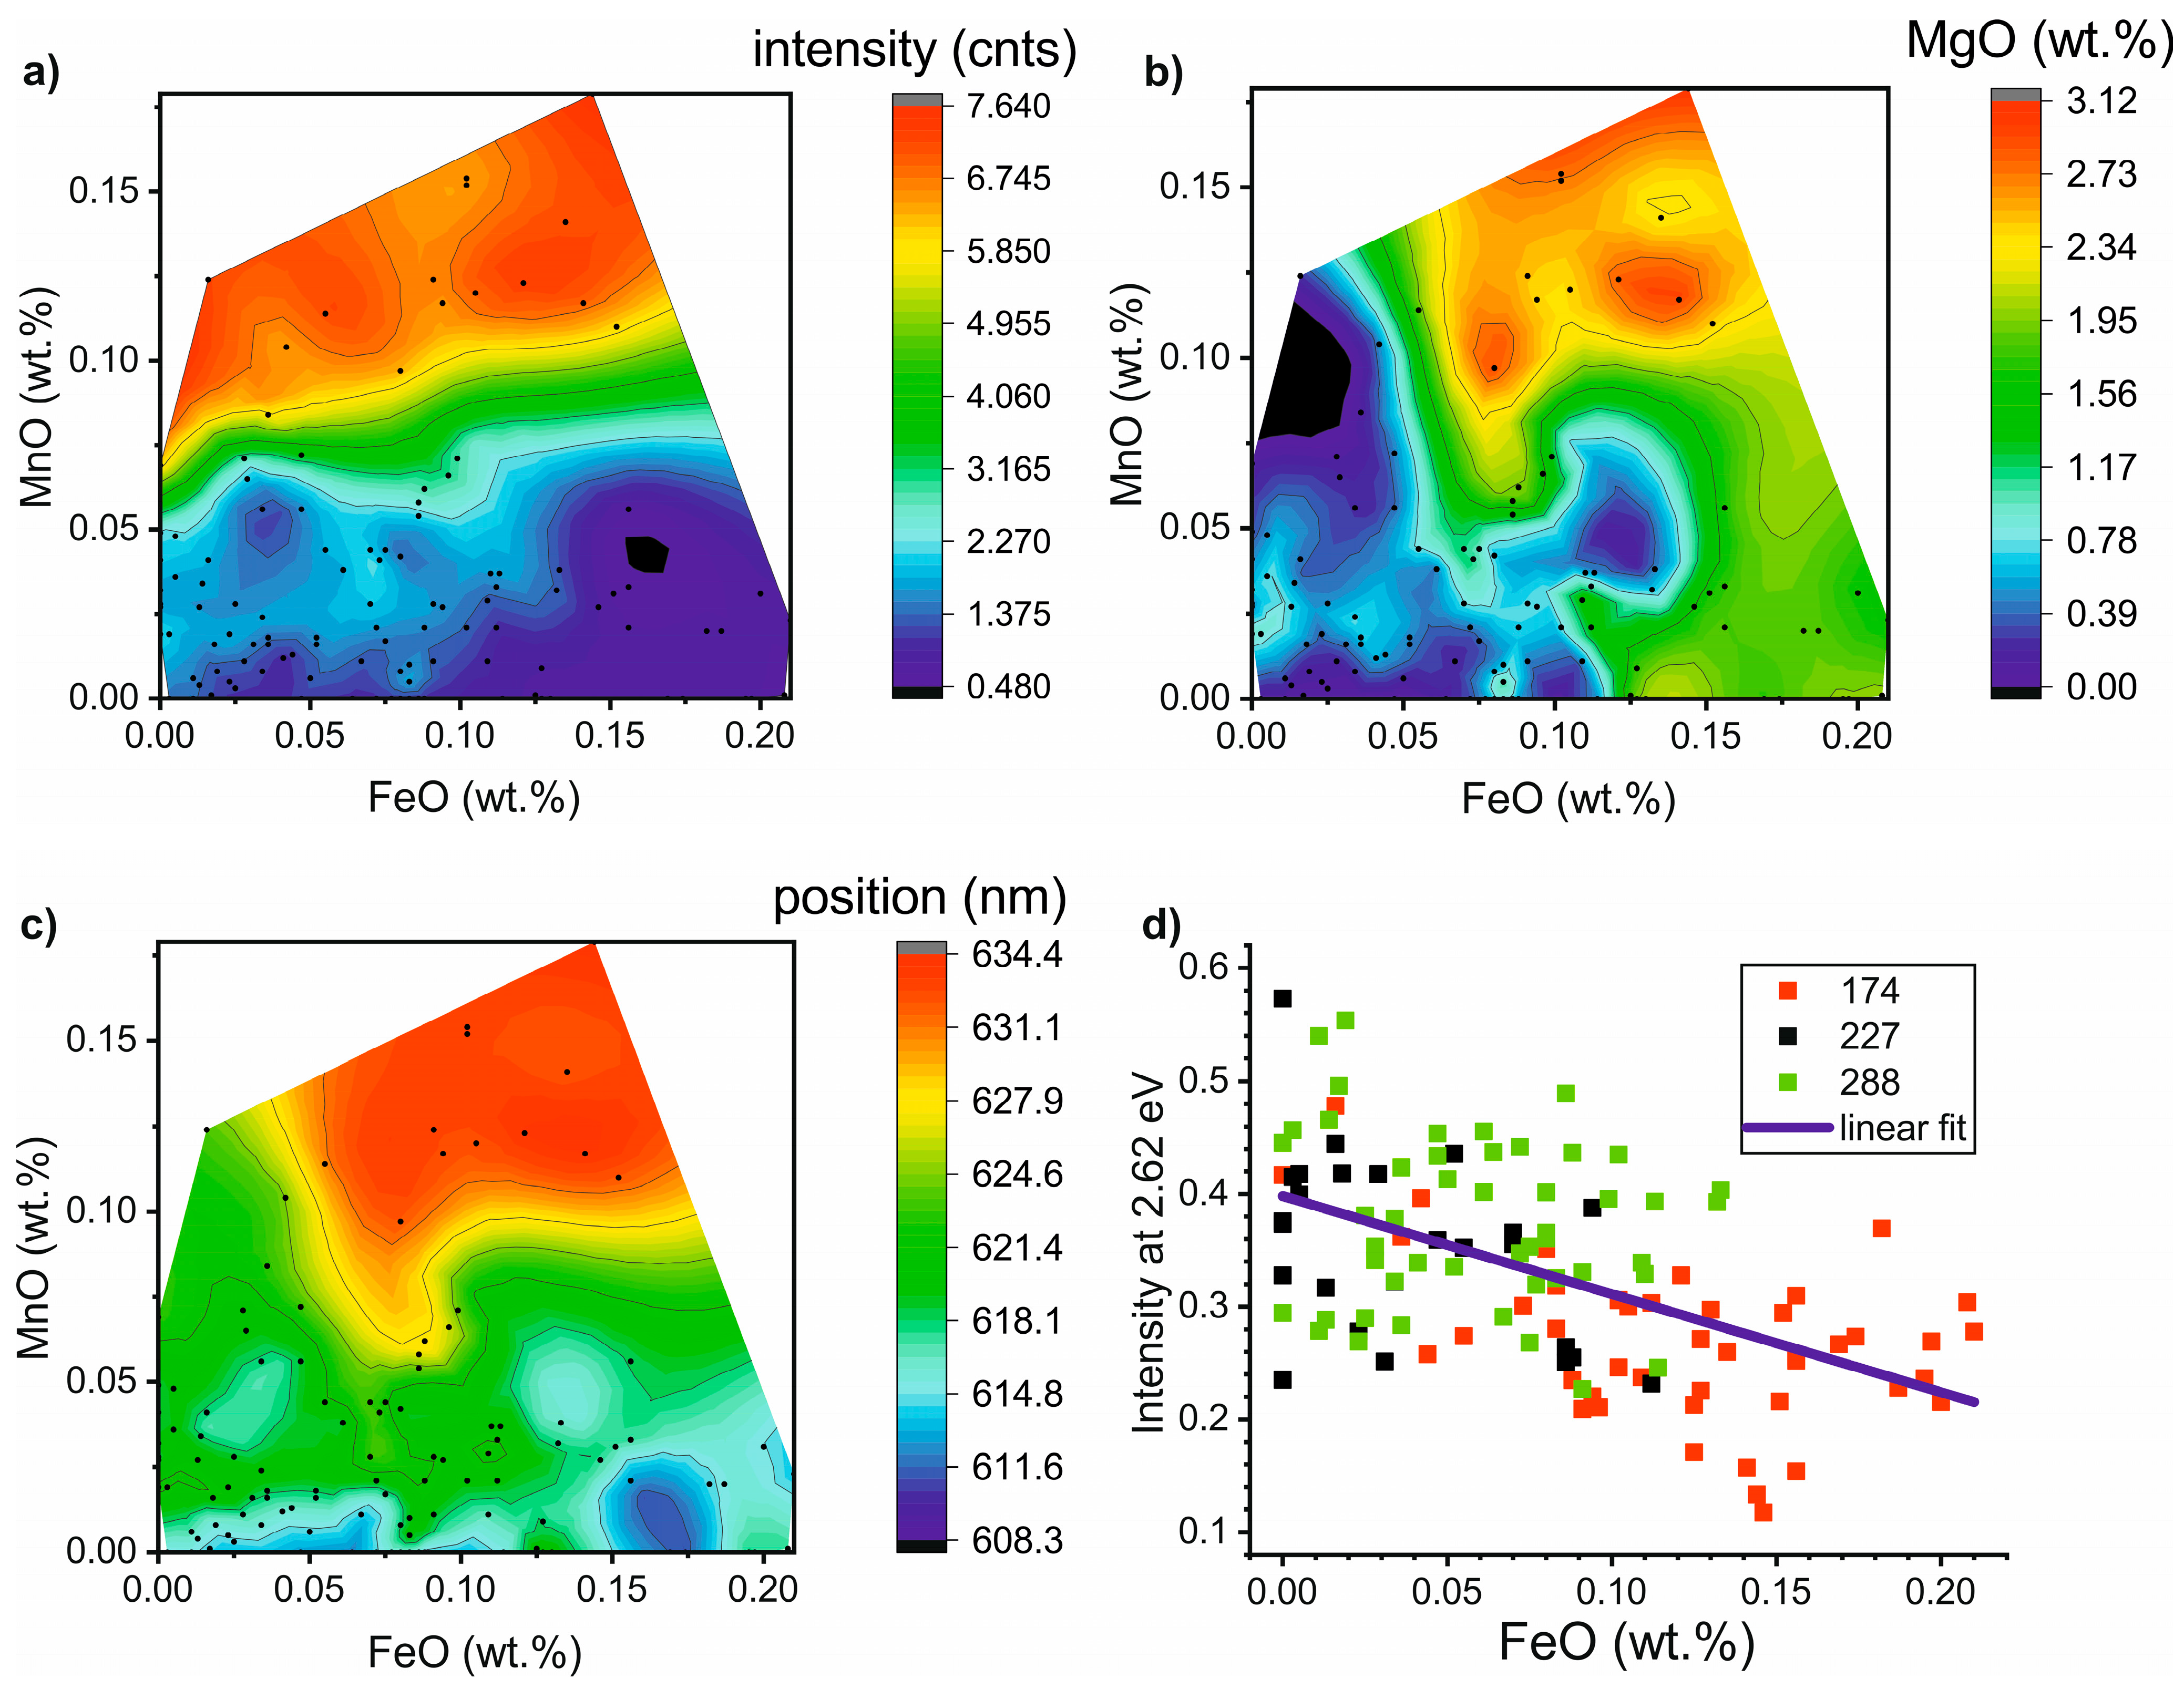
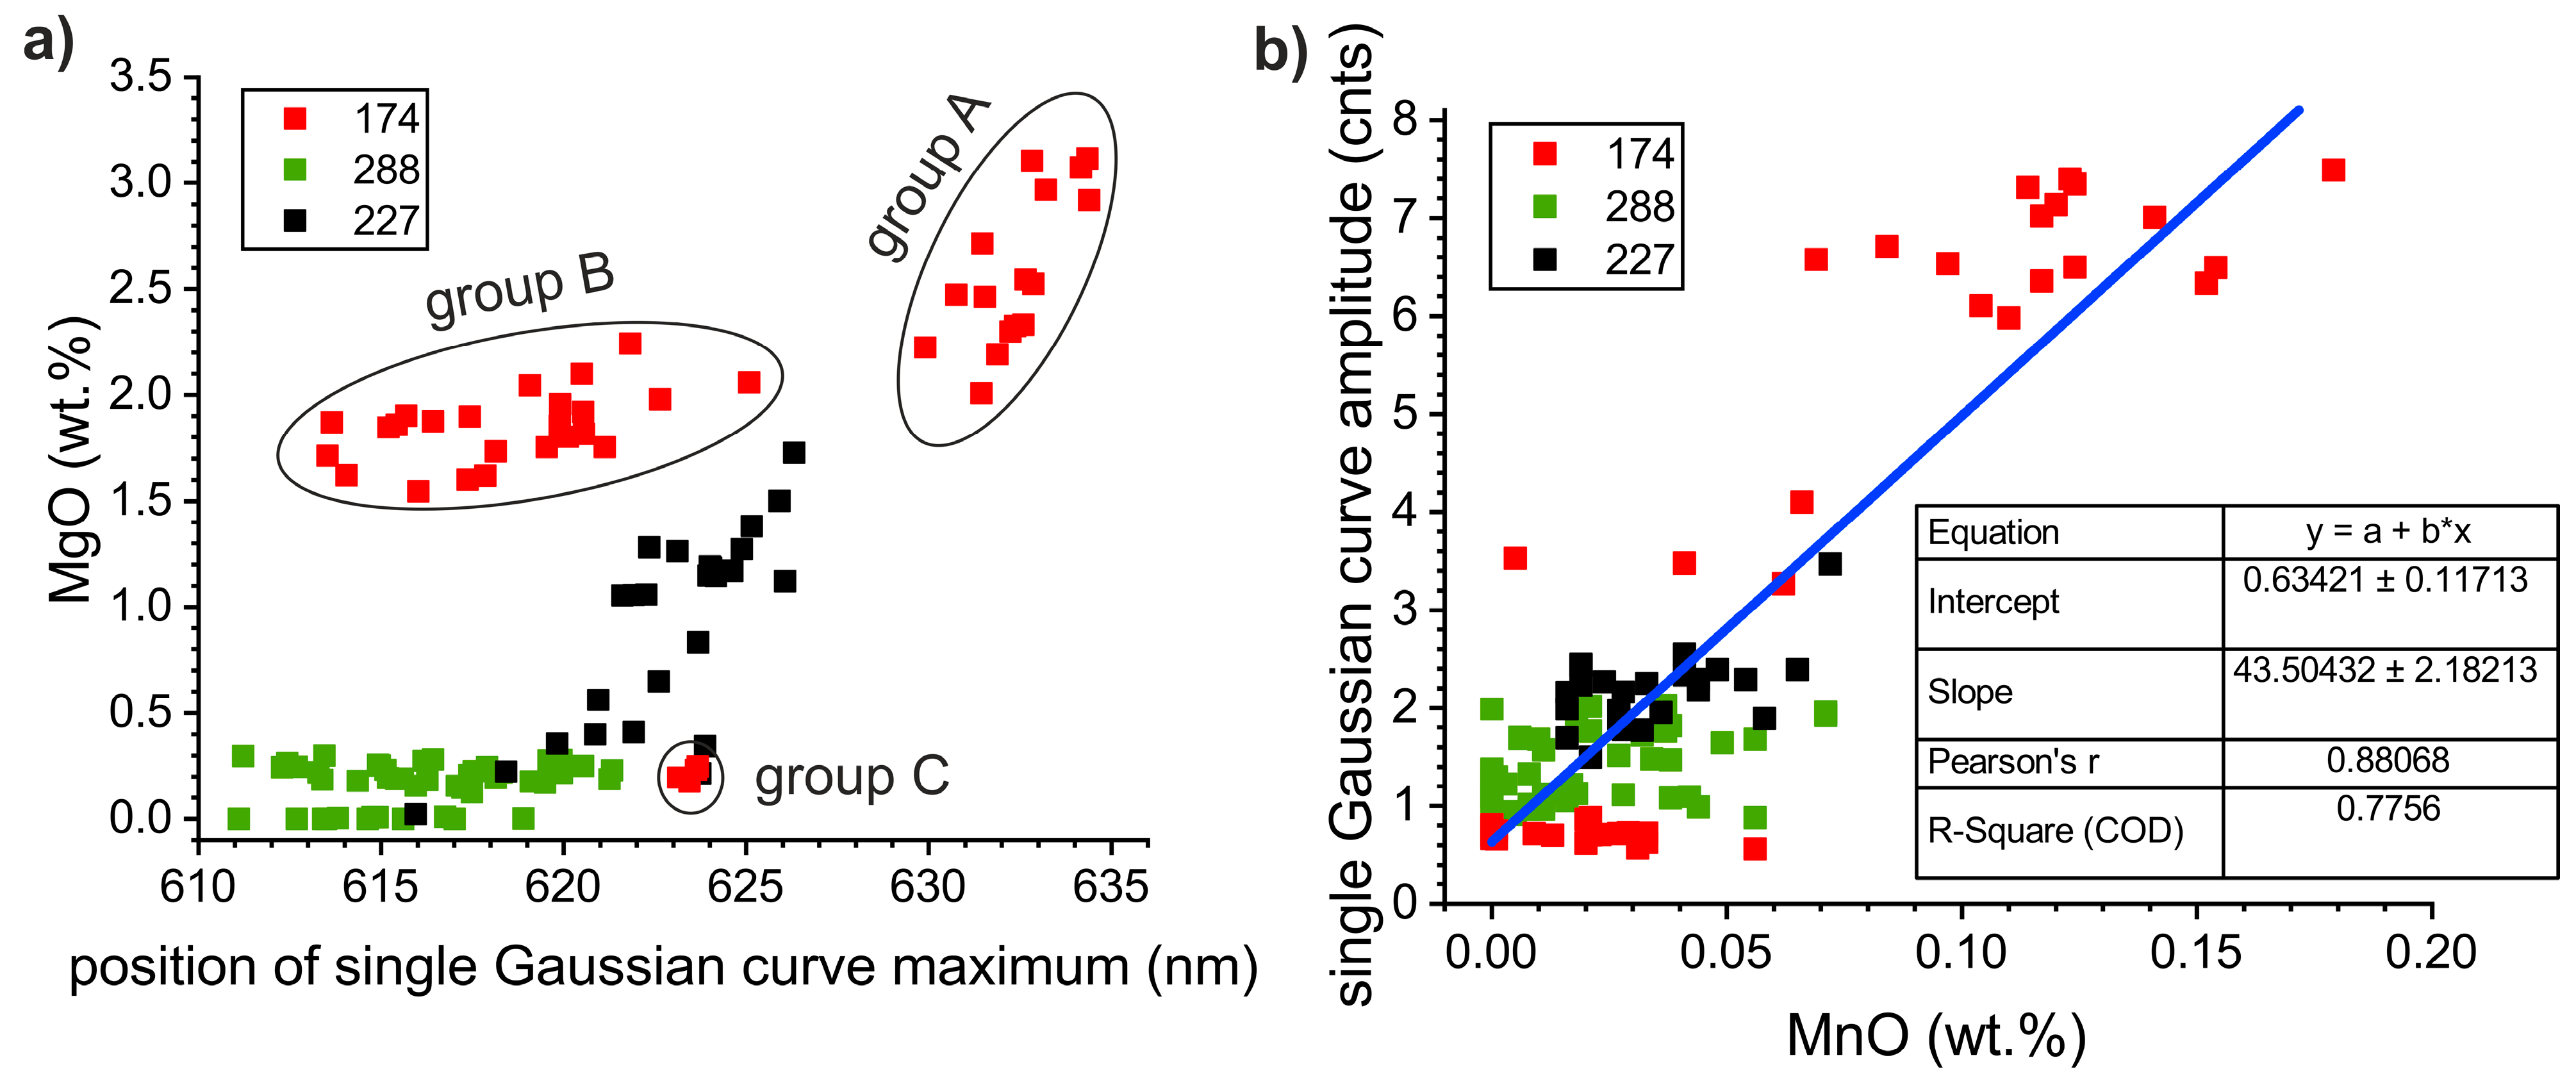
4.4. Correlation between CL-Spectra Parameters and Calcite Chemistry

EMPA analyses of all the studied samples allowed correlation between the CL-intensity, the Gaussian curve parameters and the chemistry of the main/trace element (Ca, Mg, Fe and Mn) of the carbonate phases studied. The intensity (and area) of the main peak of the calcite CL-spectra correlates positively with the admixture of Mn and negatively with that of Fe (Figure 9a and Figure 10b). The elevated content of Mn is, however, also accompanied by increased Mg-admixture (notably for sample No. 174; Figure 3b and Figure 9b). Consequently, a shift in the position of the maximum of the single Gaussian curve to higher values correlates with both intensity (area) of the main CL band (extrinsic) and with Mn- and Mg-admixture. However, the relation is difficult to quantify using a simple regression function. Similarly, we can observe the quenching effect of Fe-admixture on the intensity of the intrinsic luminescence of calcite (Figure 9a,d).
The complex relations between Mg- and Mn-admixture in calcite and CL-spectra is also apparent from two markedly different slopes of positive correlation between Mg-admixture and the position of single Gaussian curve maximum (Figure 10a). The onset of a higher slope linear regression trend seems to correlate with a certain minimum value of the Mg-admixture (>0.5 wt.% MgO) and with higher values of the position of the maximum of the single Gaussian curve maximum (>620 nm). On the other hand, the two separate quasi-subhorizontal trends are restricted to the lower values of the single Gaussian curve maximum and apparently independent of the Mg-admixture (occurring at 0–0.5 and 1.5–2.2 wt.% MgO).

4.5. Correlation between CL-Spectra Parameters and Dolomite Chemistry

The correlations between various spectral parameters and dolomite composition were less complex than for calcite. Similarly to the calcite, a positive correlation was recognized between the intensity/amplitude, area, position of maximum of the single Gaussian curve and the increasing admixture of Mn (overprinted by the quenching effect of the Fe-admixture; Figure 11).

5. Discussion

CL spectra (quantitative data) and CL-microphotographs (qualitative data) represent relatively cheap and easy to obtain characteristics that expand already extensive data of multidisciplinary techniques used in provenance studies (e.g., thin section petrography including image analysis, X-ray diffractometry, stable C and O/Sr isotope geochemistry, various trace element analyses, etc.). Both the application principles and nature of CL in various carbonate phases (e.g., calcite, aragonite, dolomite and magnesite) are well understood [5,6,8]. The spectra usually show intense single main band (centred at ca. 540–560, 605–620 and 649–659 nm, for aragonite, calcite and dolomite, respectively), and much less intense peripheral multiple band/shoulder (located approximately at 400–700 nm) [5].
Three markedly different approaches of processing of CL-spectra exist: (1) deconvolution of spectra by up to five Gaussian curves, which is usually applied when authors aim to decipher/quantify presence of various activators and correlate them with mineral chemistry and/or with structure of the studied phase; (2) simple processing of a large number of spectra based on mutual comparison CL intensities at one, two or three spectral wavelengths or narrow wavelength intervals. This is the common practice in provenance studies [16] and the advanced statistical processing of spectral data (e.g., multifactorial analysis).

5.1. Provenance Discrimination of Studied Samples

Unfortunately, no straightforward and unequivocal discrimination of carbonates from the three studied quarries is possible solely on the CL-spectra. CL intensities plots (Figure 4) unambiguously discriminated calcites from Raspenava (sample No. 174) and Bohdaneč (sample No. 227), but the data clusters from Bohdaneč (sample No. 227) and Nedvědice (sample No. 288) significantly overlapped. The position of maximum of a single Gaussian curve (see Figure 5) was statistically different for most calcite spectra from Bohdaneč (sample No. 227) and Nedvědice (sample No. 288), but those from Raspenava (sample No. 174) and Nedvědice (sample No. 288) overlapped in part again. The group of late metamorphic calcite veinlets that crosscut the Raspenava marble stood isolated from most of the marble groundmass data of the three localities in all plots. The results obtained indicate that the combination of Mg-admixture of calcite and position of the maximum (i.e., centre) of a single Gaussian curve provided better discrimination of individual quarries and even of individual subgroups of samples within a locality for the studied marbles (compare Figure 4 and Figure 10a). More detailed and computationally complex approaches (i.e., fitting by two or more Gaussian curves) and combining various parameters of individual Gaussian curves did not result in better discrimination of the localities.
Although not rigorously tested, it seems that a possible solution to the poor discrimination between certain localities could result from comparing summary descriptive statistics (mean, median, interquartile range) based on at least 30–50 individual spectra (when the spectra are measured directly from thin sections), rather than the comparison of individual data and spectra. The sample type used for CL-spectral analysis may also influence the final CL-data. Blanc et al. (2020) [16] used homogenized marble powders that should produce more homogeneous data than the approach based on single spot analyses (this article), as can be documented on three types of calcite grains found in the single quarry (see Figure 10a). Data published by these authors, however, still retain extreme variations in intensities of CL-spectra (e.g., Figure 4, Figure 5 and Figure 8 of [16]).
The results obtained demonstrate the general fact that a single characteristic/method usually does not provide a stringent criterion for a provenance determination. Taking into account previously applied methods, the studied dolomitic marbles (Raspenava vs. Bohdaneč) can be distinguished based on a combination of CL-spectral and -optical data, as well as C and O isotope values (Raspenava exhibited unique very low O isotope values within marbles of the Bohemian Massif) and the mineralogical composition (this study; [23,38]). The calcitic marble (Nedvědice) was characterized by a higher carbonate grain size compared to dolomitic marbles (Table 2) [23].

5.2. Correlation between the Carbonate Chemistry and CL-Spectra Parameters

Both the calcite and dolomite spectra showed increasing intensities of the main CL-band (extrinsic CL) with the increasing admixture of Mn (Figure 10b). This is in agreement with various previous results [1,5,14]. However, our data showed a much lower degree of this linear correlation between the two parameters than in previous studies. This may consist of a positive correlation between the Mn and Mg concentrations in the calcites and a higher Mg concentration in the calcite of the studied samples (Figure 3). The data obtained also documented the quenching effect of increasing Fe content on intensities in both the main (extrinsic; Figure 10b) and peripheral (intrinsic; Figure 9d) bands.

5.3. Position of the Main CL-Band of the Calcite and Dolomite Spectra

The calcite spectra showed wide variation in the position of the main band (ca 610–635 nm; see Figure 10a). It is apparent that the shift from lower to higher values of this range correlates with increasing admixture of Mg in the calcite. The linear relations, however, showed different slopes for various samples or groups of data (Figure 10a). This suggests an interaction of more reasons in addition to the Mg-admixture, probably lattice defects resulting from deformation and recrystallization of marbles. Our data also do not allow for quantifying/evacuating the possible effects of various sensitizers (e.g., Pb).
Another important outcome of spectra deconvolution done in this study is the systematic presence of two components in calcite and three to two components in dolomite, while all dolomite spectra lacked any indication of presence of Mn (luminescence activator) in the position of Ca in the lattice of dolomite (as published, e.g., in [9]). We also did not find a published detailed explanation for the observed extremely wide range of position of single Gaussian curve maximum of studied calcite grains (Figure 6a).

5.4. Provenance Discrimination of Studied Samples

The CL-intensity dependence (intrinsic vs. extrinsic intensity) used by [16] was modified comparing data derived from fitting the smoothed spectra by a single Gaussian plot and using slightly different wavelength range/value for reading the intensity of intrinsic luminescence (Figure 4b). Substantial differences were not identified between the two versions of the intensity plot, particularly with respect to the better discrimination of the localities studied. Another option of the (partial) discrimination among studied marbles was achieved by depiction of the position of the single Gaussian curve maximum/centre (see Figure 5). The best discrimination was achieved by combination of Mg-admixture and position of the single Gaussian curve maximum (Figure 10a).

6. Conclusions

A total of 184 CL spectra (129 calcite and 55 dolomite grains) associated with the same amount of high-quality EMPA microanalyses were measured from three quarries of the Bohemian Massif (Czech Republic) to evaluate the potential of CL spectroscopy for provenance studies of marbles. The combination of Mg-admixture of calcite and position of the maximum (i.e., centre) of the single Gaussian curve was revealed to be the most discriminative dependence of the studied marbles. Based on the results obtained, two dolomitic marbles (Raspenava vs. Bohdaneč) were straightforward and unequivocally discriminated from each other; however, the data of dolomitic marbles (Raspenava and Bohdaneč) vs. calcitic marble (Nedvědice) partially overlapped. Moreover, three types of calcite grains were identified in the single quarry of Raspenava based on a comparison of chemical microanalyses (content of Mg-admixture) and CL spectroscopy (position of the Gaussian curve), while only one type of calcite were present in both Bohdaneč and Nedvědice marbles.
Although the results obtained were not unambiguous in all cases, regarding the discrimination of the marbles studied, CL spectroscopy in combination with EMPA chemical microanalysis can be useful as a complementary tool to other provenancing methods (such as C-O stable isotope geochemistry and mineralogical-petrographic analysis of thin sections).

Author Contributions

Conceptualization, J.Z. and A.K.; methodology, J.Z.; software, J.Z.; validation, J.Z., A.K. and M.K.; investigation, J.Z. and A.K.; data curation, J.Z. and A.K.; writing—original draft preparation, J.Z. and A.K.; writing—review and editing, J.Z. and A.K.; visualization, J.Z. and A.K.; project administration, M.K.; funding acquisition, M.K. All authors have read and agreed to the published version of the manuscript.

Funding

This research was funded by Ministry of the Interior of the Czech Republic, grant number VI20152020035.

Institutional Review Board Statement

Not applicable.

Informed Consent Statement

Not applicable.

Data Availability Statement

Data available on request.

Acknowledgments

The authors are thankful to Martin Racek, Institute of Petrology and Structural Geology, Faculty of Science, Charles University, for technical assistance with EMPA analyses and CL-spectra collection.

Conflicts of Interest

The authors declare no conflict of interest.

References

  1. Marschall, D.J. Cathodoluminescence of Geological Materials; Unwin Hyman Ltd.: London, UK, 1988. [Google Scholar]
  2. Machel, H.G. Application of cathodoluminescence to carbonate diagenesis. In Cathodoluminescence in Geosciences; Pagel, M., Barbin, V., Blanc, P.H., Ohnenstetter, D., Eds.; Springer: Berlin/Heidelberg, Germany, 2000; pp. 271–301. [Google Scholar]
  3. Habermann, D.; Neuser, R.D.; Richter, D.K. Quantitative high resolution analysis of Mn2+ in sedimentary calcite. In Cathodoluminescence in Geosciences; Pagel, M., Barbin, V., Blanc, P., Ohnenstetter, D., Eds.; Springer: Berlin/Heidelberg, Germany, 2000; pp. 331–358. [Google Scholar]
  4. Calderón, T.; Aguilar, M.; Jaque, F.; Coy-Ill, R. Thermoluminescence from natural calcite. J. Phys. C Solid State Phys. 1984, 17, 2027–2038. [Google Scholar] [CrossRef]
  5. Boggs, S., Jr.; Krinsley, D. Application of Cathodoluminescence Imaging to the Study of Sedimentary Rocks; Cambridge University Press: Cambridge, UK, 2006. [Google Scholar]
  6. Pagel, M.; Barbin, V.; Blanc, P.H.; Ohnenstetter, D. (Eds.) Cathodoluminescence in Geosciences; Springer: Berlin/Heidelberg, Germany, 2000. [Google Scholar]
  7. Richter, D.; Götte, T.; Götze, J.; Neuser, R.D. Progress in application of cathodoluminescence (CL) in sedimentary petrology. Miner. Petrol. 2003, 79, 127–166. [Google Scholar] [CrossRef]
  8. El Ali, A.; Barbin, V.; Calas, G.; Cervelle, B.; Ramseyer, K.; Bouroulec, J. Mn2+-activated luminescence in dolomite, calcite and magnesite: Quantitative determination of manganese and site distribution by EPR and CL spectroscopy. Chem. Geol. 1993, 104, 189–202. [Google Scholar] [CrossRef]
  9. Gillhaus, A.; Habermann, D.; Meijer, J.; Richter, D.K. Cathodoluminescence spectroscopy and micro-PIXE: Combined high resolution Mn-analyses in dolomites—First results. Nucl. Instrum. Methods Phys. Res. Sect. B Beam Interact. Mater. At. 2000, 161–163, 842–845. [Google Scholar] [CrossRef]
  10. Gillhaus, A.; Richter, D.K.; Meijer, J.; Neuser, R.D.; Stephan, A. Quantitative high resolution cathodoluminescence spectroscopy of diagenetic and hydrothermal dolomites. Sediment. Geol. 2001, 140, 191–199. [Google Scholar] [CrossRef]
  11. Barbin, V.; Ramseyer, K.; Decrouez, D.; Burns, S.J.; Chamay, J.; Maier, J.L. Cathodoluminescence of white marbles: An overview. Archaeometry 1992, 34, 175–183. [Google Scholar] [CrossRef]
  12. Herrmann, J.J.; Barbin, V. The exportation of marble from the Aliki quarries on Thasos: Cathodoluminescence of samples from Turkey and Italy. Am. J. Archaeol. 1993, 97, 91–103. [Google Scholar] [CrossRef]
  13. Lapuente, M.P.; Turi, B.; Blanc, P.H. Marbles from Roman Hispania: Stable isotope and cathodoluminescence characterization. App. Geochem. 2000, 15, 1469–1493. [Google Scholar] [CrossRef]
  14. Habermann, D. Quantitative cathodoluminescence (CL) spectroscopy of minerals: Possibilities and limitations. Mineral. Petrol. 2002, 76, 247–259. [Google Scholar] [CrossRef]
  15. Götze, J. Application of Cathodoluminescence Microscopy and Spectroscopy in Geosciences. Microsc. Microanal. 2012, 18, 1270–1284. [Google Scholar] [CrossRef] [Green Version]
  16. Blanc, P.; Mercadal, M.P.L.; Garcia-Moreno, A.G. A new database of the quantitative cathodoluminescence of the main quarry marbles used in antiquity. Minerals 2020, 10, 381. [Google Scholar] [CrossRef]
  17. Mercadal, M.P.L.; Oterino, J.A.C.; Blanc, P.; Brilli, M. Louvie-Soubiron Marble: Heritage Stone in the French Pyrenean Ossau Valley-First Evidence of the Roman Trans-Pyrenean Use. Geoheritage 2021, 13, 17. [Google Scholar] [CrossRef]
  18. Antonelli, F.; Lazzarini, L. An updated petrographic and isotopic reference database for white marbles used in antiquity. Rend. Lincei 2015, 26, 399–413. [Google Scholar] [CrossRef]
  19. Prochaska, W.; Attanasio, D. The challenge of a successful discrimination of ancient marbles (part I): A databank for the marbles from Paros, Prokonnesos, Heraklea/Miletos and Thasos. J. Archaeol. Sci. Rep. 2021, 35, 102676. [Google Scholar] [CrossRef]
  20. Prochaska, W.; Attanasio, D. The challenge of a successful discrimination of ancient marbles (part III): A databank for Aphrodisias, Carrara, Dokimeion, Göktepe, Hymettos, Parian Lychnites and Pentelikon. J. Archaeol. Sci. Rep. 2022, 45, 103582. [Google Scholar]
  21. Jarč, S.; Zupančič, N. A cathodoluminescence and petrographical study of marbles from Pohorje area in Slovenia. Geochemistry 2009, 69, 75–80. [Google Scholar] [CrossRef]
  22. Kuchařová, A.; Přikryl, R. Mineralogical and geochemical (stable C and O isotopes) variability of marbles from the Moldanubian Zone (Bohemian Massif, Czech Republic): Implications for provenance studies. Environ Earth Sci. 2017, 76, 48. [Google Scholar] [CrossRef]
  23. Šťastná, A.; Přikryl, R.; Černíková, A. Comparison of quantitative petrographic, stable isotope and cathodoluminescence data for fingerprinting Czech marbles. Environ. Earth Sci. 2011, 63, 1651–1663. [Google Scholar] [CrossRef]
  24. Winchester, J.A.; Patočka, F.; Kachlík, V.; Melzer, M.; Nawakowski, C.; Crowley, Q.G.; Floyd, P.A. Geochemical discrimination of metasedimentary sequences in the Krkonoše-Jizera Terrane (West Sudetes, Bohemian Massif): Palaeotectonic and stratigraphic constraints. Geol. Carpathica. 2003, 54, 267–280. [Google Scholar]
  25. Kachlík, V. Relationship between Moldanubicum, the Kutná Hora Crystalline Unit and Bohemicum (Central Bohemia, Czech Republic): A result of the polyphase Variscan nappe tectonics. J. Czech Geol. Soc. 1999, 44, 201–291. [Google Scholar]
  26. Mazur, S. Geology of the Karkonosze-Izera Massif: An overview. Miner. Soc. Pol. Spec. Pap. 2002, 20, 22–34. [Google Scholar]
  27. Houzar, S.; Novák, M.; Doležalová, H.; Hrazdil, V.; Pfeiferová, A. Mineralogy, petrography and geology of the Nedvědice marbles, Svratka Crystalline Complex: A review. Acta Mus. Morav. Sci. Geol. 2006, LXXXXI, 3–77. (In Czech) [Google Scholar]
  28. Hladká, N. Mineralogical-petrographic conditions in the Vápenný Vrch near Raspenava and its wider surrounding. Sbor. Ústř. Úst. Geol. Odd. Geol. 1957, 24, 169–207. (In Czech) [Google Scholar]
  29. Krutský, N. From the History of stones mining and exploitation in the Northen Bohemia. Geolog. Průzkum 1993, 35, 261–264. (In Czech) [Google Scholar]
  30. Krutský, N. From the history of exploitation and utilization of limestones in ČSR. In History of the Exploitation of Non-Ore Resources; Kužvart, M., Ed.; NTM Prague: Prague, Czech Republic, 1986; pp. 70–79. (In Czech) [Google Scholar]
  31. Rybařík, V. Dimension Stones from the Czech Republic; Nadace Střední průmyslové školy kamenické a sochařské v Hořicích v Podkrkonoší: Hořice, Czech Republic, 1994; pp. 1–218. (In Czech) [Google Scholar]
  32. Houzar, S.; Malý, K. Marbles of the Bohemian-Moravian Highlands as a source of materials for historic buildings: An overview of localities and research methodology. Acta Rerum Nat. 2021, 26, 19–46. (In Czech) [Google Scholar]
  33. Microsoft Excel Software. Available online: https://www.microsoft.com/cs-cz/microsoft-365/excel (accessed on 6 January 2023).
  34. Origin Software. Available online: https://www.originlab.com/Origin (accessed on 6 January 2023).
  35. Essential FTIR Software. Available online: https://www.essentialftir.com/ (accessed on 6 January 2023).
  36. Magicplot Software. Available online: https://magicplot.com/ (accessed on 6 January 2023).
  37. MagicPlot Manual. Available online: https://magicplot.com/wiki/ (accessed on 6 January 2023).
  38. Šťastná, A.; Přikryl, R. Decorative marbles from the Krkonoše-Jizera Terrane (Bohemian Massif, Czech Republic): Provenance criteria. Int. J. Earth Sci. 2009, 98, 357–366. [Google Scholar] [CrossRef]
Figure 1. CL-microphotographs of the studied marbles obtained by cold-stage CL (CL8200 Mk4) (ad) and microphotographs in crossed nicols of the same area as in CL obtained by polarizing microscope (Leica DMPL) (eh). (a,e) Dolomitic marble from Raspenava with secondary calcite veins (veinlets are highlighted by black arrows) (sample No. 174); (b,f) calcitic type of dolomitic marble from Raspenava with higher amount of non-carbonate phases (sample No. 174); (c,g) dolomitic marble from Bohdaneč (sample No. 227); (d,h) calcitic marble from Nedvědice (sample No. 288). The white dots represent areas where the CL-spectra were measured (by xCLent spectroscopy at the JEOL hyperprobe). Abbreviations: Ab albite, Cal-calcite, Fo-forsterite, Chl-chlorite, Di-diopside, Dol-dolomite, Kfs-K-feldspar, Ms-muscovite, Py-pyrite, Srp-serpentine minerals (antigorite replacing forsterite grains, and chrysotile in bands), Tr-tremolite.
Minerals 13 00244 g001
Figure 2. Examples of CL-spectra of calcite with both scales converted with respect to photon energy: (a) smoothed vs. unsmoothed spectrum; (b) fitting of the smoothed spectrum with several Gaussian curves. The curve “a” corresponds to the main CL-band of extrinsic nature (centred at 618 nm). The curves “b, c, d” (centred around 535, 513 and 450 nm, respectively) resulted from the deconvolution of the wide peripheral CL band of intrinsic nature. Note that the main CL-band is sufficiently fitted with single Gaussian curve. The difference between the position of the maximum of smoothed data (617.9 nm) and the maximum of the single Gaussian cure (617.7 nm); curve “a” is, in this case, statistically indistinguishable.
Minerals 13 00244 g002
Figure 3. Summary of the chemical composition of the carbonate grains studied: (a) triangular plot of the main carbonate components. The composition of pure calcite and pure dolomite is indicated by green circles. The small triangle localizes the position of the two large triangles in the full-size plot; (b) the distribution of Mg- and Mn-admixture in calcite. Note the positive linear correlation between Mg and Mn for most of the data of sample No. 174. Sample No. 174—Raspenava; sample No. 227—Bohdaneč; sample No. 288—Nedvědice. Data of sample No. 174 can be subdivided into three groups (A—veinlets, B—groundmass of the calcitic type of dolomitic marble, C—groundmass of the dolomitic marble type with secondary calcite veins).
Minerals 13 00244 g003
Figure 4. Comparison of data derived from calcite CL-spectra: (a) discrimination of the studied samples using the intensity plot after [16] (Figure 3 in the article); (b) modified plot of [16], with maximum intensity of extrinsic CL based on the fitting of the main band by a single Gaussian curve (centred between 605 and 638 nm) and the intensity of intrinsic luminescence plotted as the maximum intensity value of the wavelength range of 430–530 nm. Although the two graphs (a,b) are slightly different, neither of them provide straightforward discrimination of calcite samples from the three studied localities, based on statistical parameters of CL-spectra only. Most of the data represent the groundmass calcite of the studied samples, except for the “veinlets” data. Sample No. 174—Raspenava, sample No. 227—Bohdaneč, sample No. 288—Nedvědice. Three groups of sample No. 174 (A—veinlets, B—groundmass of the calcitic type of dolomitic marble, C—groundmass of the dolomitic marble type with secondary calcite veins) are indicated by labels.
Minerals 13 00244 g004
Figure 5. Box plot of the position of the maximum extrinsic luminescence derived from a single Gaussian curve fit. The extent of the box is the 25–75 percentile (Q1–Q3 quartile), the red line = mean, the green line = median. The data for veinlets and groundmass were processed separately (sample No. 174). Sample No. 174—Raspenava, sample No. 227—Bohdaneč, sample No. 288—Nedvědice.
Minerals 13 00244 g005
Figure 6. Comparison of the position of the centre of a single Gaussian curve for CL-spectra corresponding to calcite (a) and dolomite (b). Note a clear bimodal distribution for calcite data and rather unimodal for dolomite ones. Note that there is a much smaller range of data plotted along the horizontal axis for dolomite than for calcite grains.
Minerals 13 00244 g006
Figure 7. Examples of spectra fitted by single (a), two (b) and three (c,d) Gaussian curves. The plots represent two spectra, calcite (a,b) and dolomite (c,d). Both spectra represent “anomalous” spectra of each mineral in two respects: (i) they represent spectra with the highest value of the maximum position (centre) of a single Gaussian curve of each mineral group; (ii) the main CL-band is asymmetric and is therefore better fitted by two or three Gaussian curves than by a single curve. Individual curves are labelled by the position of their centres (maxima). The dolomite spectrum was fitted twice, first with the centre position of two curves fixed at 615 (curve “a”) and 655 (curve “b”) nm, based on the typical position corresponding to Mn-extrinsic luminescence in calcite and dolomite, respectively. The position of the third curve “c” was “unfixed” and therefore varies from spectrum to spectrum. (d) The deconvolution of the same dolomite spectrum as in (c), but all curves were allowed to fit the spectrum freely.
Minerals 13 00244 g007
Figure 8. Overview of various parameters derived from fitting of CL-spectra of calcite by one- and two- Gaussian curves. About 10 low-intensity spectra that were difficult to fit by the two Gaussian curves were excluded from these plots. The ratio of amplitudes (intensity of extrinsic CL) or areas of curve-1 (fixed at 615 nm) and curve-2 (unfixed, >615 nm) is plotted along the vertical axis, while a similar parameter of a single Gaussian curve is plotted along the horizontal axis. (d) Documentation of the fact that the trends presented in figures (ac) reflect an increasing admixture of Mg in the studied calcites. Note high correlation between the position of single Gaussian curve maximum and the ratio of parameters derived from two-Gaussian curves fit (a,b). Sample No. 174—Raspenava, sample No. 227—Bohdaneč, sample No. 288—Nedvědice.
Minerals 13 00244 g008
Figure 9. Correlation between calcite chemistry and CL-spectra parameters: (a) intensity of extrinsic luminescence (approximated by amplitude of single Gaussian curve) versus molar fraction of Fe and Mn; (b) molar fraction of Fe- and Mn- vs. Mg-admixture of calcite; (c) position of the maximum of single Gaussian curve vs. molar fractions of Fe and Mn; (d) quenching effect of Fe-admixture on the intensity of intrinsic luminescence of calcite. Sample No. 174—Raspenava, sample No. 227—Bohdaneč, sample No. 288—Nedvědice.
Minerals 13 00244 g009
Figure 10. Correlation of parameters derived from Gaussian fits of CL-spectra and Mg- (a) and Mn- (b) admixtures of calcite: (a) plot of all spectra with highlighted three groups (A—veinlets, B—groundmass of the calcitic type of dolomitic marble, C—groundmass of the dolomitic marble type with secondary calcite veins) of data of sample No. 174; (b) correlation between intensity of extrinsic CL of calcite and Mn content. Sample No. 174—Raspenava, sample No. 227—Bohdaneč, sample No. 288—Nedvědice.
Minerals 13 00244 g010
Figure 11. Correlation of parameters derived from the single Gaussian curve fit of CL-spectra of dolomite and the Mg- and Fe-admixture: (a) position of the centre of the single Gaussian curve vs. the amplitude of the curve (i.e., the maximum intensity); (b) correlation among CL intensity and dolomite chemistry. Sample No. 174—Raspenava, sample No. 227—Bohdaneč.
Minerals 13 00244 g011
Table 1. Locations and geological descriptions of studied samples. Data modified after [23]. Abbreviations: S. No.—sample code; GPS—Global Positioning System; N—latitude, E—longitude.
Sample No.:
Locality
GPS
Geological Unit
(Bohemian Massif)
Geological Description
174
Raspenava
50°53′32″ N, 15°8′11″ E
Lugicum (Krkonoše-Jizera Terrane)Palaeozoic, elongated marble lenses in mica shists to paragneisses, mesozonal peak metamorphism in amphibolite facies [26,28]
227
Bohdaneč
49°46′19″ N, 15°13′13″ E
Kutná Hora Crystalline ComplexPalaeozoic, marble lenses in two-mica gneisses (Micashist Zone), sillimanite zone peak metamorphism (affected by younger retrogression) [25]
288
Nedvědice
49°27′24″ N, 16°19′43″ E
Svratka Crystalline ComplexPalaeozoic, elongated marble lenses in muscovite-biotite paragneisses, polyphase amphibolite facies (T > 550 °C at P = 200 MPa, XCO2 < 0.2–0.1) [27]
Table 2. Mineralogical-petrographic characteristics of studied samples. Data were adopted from [23]. Abbreviations: CG—carbonate grains, ED—equivalent diameter (mean of at least 800 CG from each locality obtained by petrographic image analysis), GB-grain boundaries, HE—heteroblastic (i.e., CG of different size), HO—homeoblastic (i.e., CG of uniform size), S. No.—sample code. Mineral phases: Ap—apatite, Cal—calcite, CM—carbonaceous matter, Di—diopside, Dol—dolomite, Fo—forsterite, Chl—chlorite, Kfs—K-feldspar, Phl—phlogopite, Pl—plagioclase, Py—pyrite, Qtz—quartz, Srp—serpentine minerals, Ti—titanite Tlc—talc, Tr—tremolite, Wo—wollastonite, Zrn—zircon.
Sample (Locality)GroupNon-Carbonate
Mineral Assemblage
ED of CG (mm)Microfabric
174 (Raspenava)Dolomitic marble (Dol+Cal)Tr+Srp+Chl+Py±Fo±Di0.20Polygonal fabric, HO, straight/curved GB, short irregular calcite filling (veinlets)
227 (Bohdaneč)Dolomitic marble (Dol+Cal)Phl+Tr+Qtz
±Pl±Kfs±Chl±Tlc±Zrn±Ap
±Ti±Py±CM
0.31Polygonal fabric, HO, embayed/curved/straight GB
288 (Nedvědice)Calcitic marble
(Cal)
Phl+Tr+Di+Qtz ±Pl±Kfs±Chl±Wo±Zrn
±Ti±Py±CM
0.71Polygonal fabric, HE, embayed GB
Disclaimer/Publisher’s Note: The statements, opinions and data contained in all publications are solely those of the individual author(s) and contributor(s) and not of MDPI and/or the editor(s). MDPI and/or the editor(s) disclaim responsibility for any injury to people or property resulting from any ideas, methods, instructions or products referred to in the content.

