Article

Mechanisms for the Accumulation of Organic Matter in Sediments of the Middle Permian around Bogda Mountain, Southern Junggar Basin, NW China

1
Development and Research Center, National Geological Archives of China, China Geological Survey, Beijing 100037, China
2
Command Center of Natural Resource Comprehensive Survey, Beijing 100055, China
3
State Key Laboratory of Petroleum Resources and Prospecting, College of Geoscience, China University of Petroleum, Beijing 102249, China
4
Institute of Geochemistry, Chinese Academy of Sciences, Guiyang 550081, China
5
China Ordins Group Company, Beijing 100089, China
6
Daqing Oilfield of CNPC, Daqing 163002, China
*
Author to whom correspondence should be addressed.
Minerals 2023, 13(3), 332; https://doi.org/10.3390/min13030332
Submission received: 18 January 2023 / Revised: 22 February 2023 / Accepted: 24 February 2023 / Published: 27 February 2023
(This article belongs to the Section Mineral Geochemistry and Geochronology)

Abstract

:
The organic-rich shales and mudstones of the Middle Permian are the most important unconventional petroleum targets in the southern Junggar Basin of northwestern China. Although numerous studies have been vigorously conducted on paleoenvironment reconstructions, the organic matter enrichment mechanism is still controversial due to the utilization of problematic geochemical proxies established in early studies. In this study, major and trace elemental compositions, molecular markers, stable carbon isotopic compositions, and organic petrology were used to study multiple factors affecting the accumulation of organic matter in sediments. According to the results, a relatively hydrostatic, brackish, anoxic environment is proposed in the northern periphery of the Bogda Mountain, where the original structure of organic matter could be preserved with non-correlations between the productivity proxies (P and Ba) and TOC. In the western Bogda area, organic-rich sediments were deposited under suboxic conditions, with frequent fluctuation occurring between the top and bottom water columns. The accumulation of organic matter was the result of productivity blooms and rapid sedimentation. This improved study of the enrichment of organic matter in the Middle Permian around the Bogda Mountain can contribute to improved evaluations of the petroleum potential and distinguishing the characteristics of different organic matter enrichment models.

1. Introduction

Unconventional petroleum, tight/shale oil, and shale gas have received increasing interest from the scientific community, economic hierarchies, and political systems [1,2]. Researchers have vigorously evaluated organic-rich shale and studied the mechanisms responsible for the accumulation of organic matter [3,4,5,6,7,8,9,10,11,12]. The organic-rich shale in the middle Permian Lucaogou Formation of the southern Junggar Basin, is famous for its high grade, economic value, and large quantity [5,6,13,14]. There is a significant petroliferous basin located in the Junggar Basin (Xinjiang Uygur Autonomous Region in Northwest China), Figure 1 [15,16]. Numerous studies focused on oil shale in the Lucaogou Formation have been conducted in the Jimusar sag, northern periphery of Bogda Mountain [13,17,18,19,20,21,22]; however, the mechanism for the enrichment of organic matter in the Lucaogou Formation around the Bogda Mountain is still controversial due to the utilization of problematic geochemical proxy established in earlier published studies [23,24,25]. The origin of the enrichment of C28 and C29 regular steranes in organic rich sediments in the Lucaogou Formation is still unknown [21,26]. Most of the paleoredox reconstructions have been conducted by bimetal ratios (V/V + Ni; V/Cr) that were discouraged by Algeo and Liu (2020), because all transition group metals are enriched authigenically to some degree under reducing conditions [27,28]. The hypersaline environment of the Lucaogou Formation was still controversial, due to the geochemical proxies from biomarkers and trace metal indicating different paleosalinity [3,29,30]. On the other hand, a large amount of organic-rich shales and mudstones developed in the fold belt (in Figure 1) was destroyed by the tectonic evolution of the Bogda Mountain, leading to high heterogeneity in the planar and longitudinal distributions of organic-rich sediments [31,32]. In summary, the accumulation of organic matter in the Lucaogou Formation around the Bogda Mountain should be restudied using a variety of valid geochemical proxies.
In this study, the samples were collected from Middle Permian around Bogda Mountains. The molecular markers [33,34,35,36,37] and organic petrology were utilized to study the source of organic matter, the enrichment factors (EFs) of trace metals were used to reconstruct the paleoredox conditions [27,38], and S/TOC and Sr/Ba were used to reassess the paleosalinity of organic-rich sediments in the Lucaogou Formation and Pingdiquan Formation from different areas around the Bogda Mountain. An improved understanding of the accumulation of organic matter in the Lucaogou Formation around the Bogda Mountain would contribute to improving the research involving petroleum potential evaluations and distinguishing the characteristics of different organic matter enrichment models.

2. Geological Setting

This study focuses on the fold belt around the Bogda Mountains in the southern Junggar Basin and the eastern segment of the Chinese North Tianshan (NTS). The main bodies of the Bogda Mountain are carboniferous volcanic rocks and contemporaneous submarine pyroclastic deposits [32]. During the Early and Middle Permian, the Bogda region was an intracontinental rift with extensive magmatic intrusion. At the beginning of the Late Permian, the initial uplift of the Bogda Mountain occurred [32]. From the latest Permian to the Early Jurassic, the South Junggar Basin became a passively subsiding basin [39]. From the Late Jurassic to the Early Cretaceous, the rapid uplift and exhumation of the Bogda area occurred [31,40].
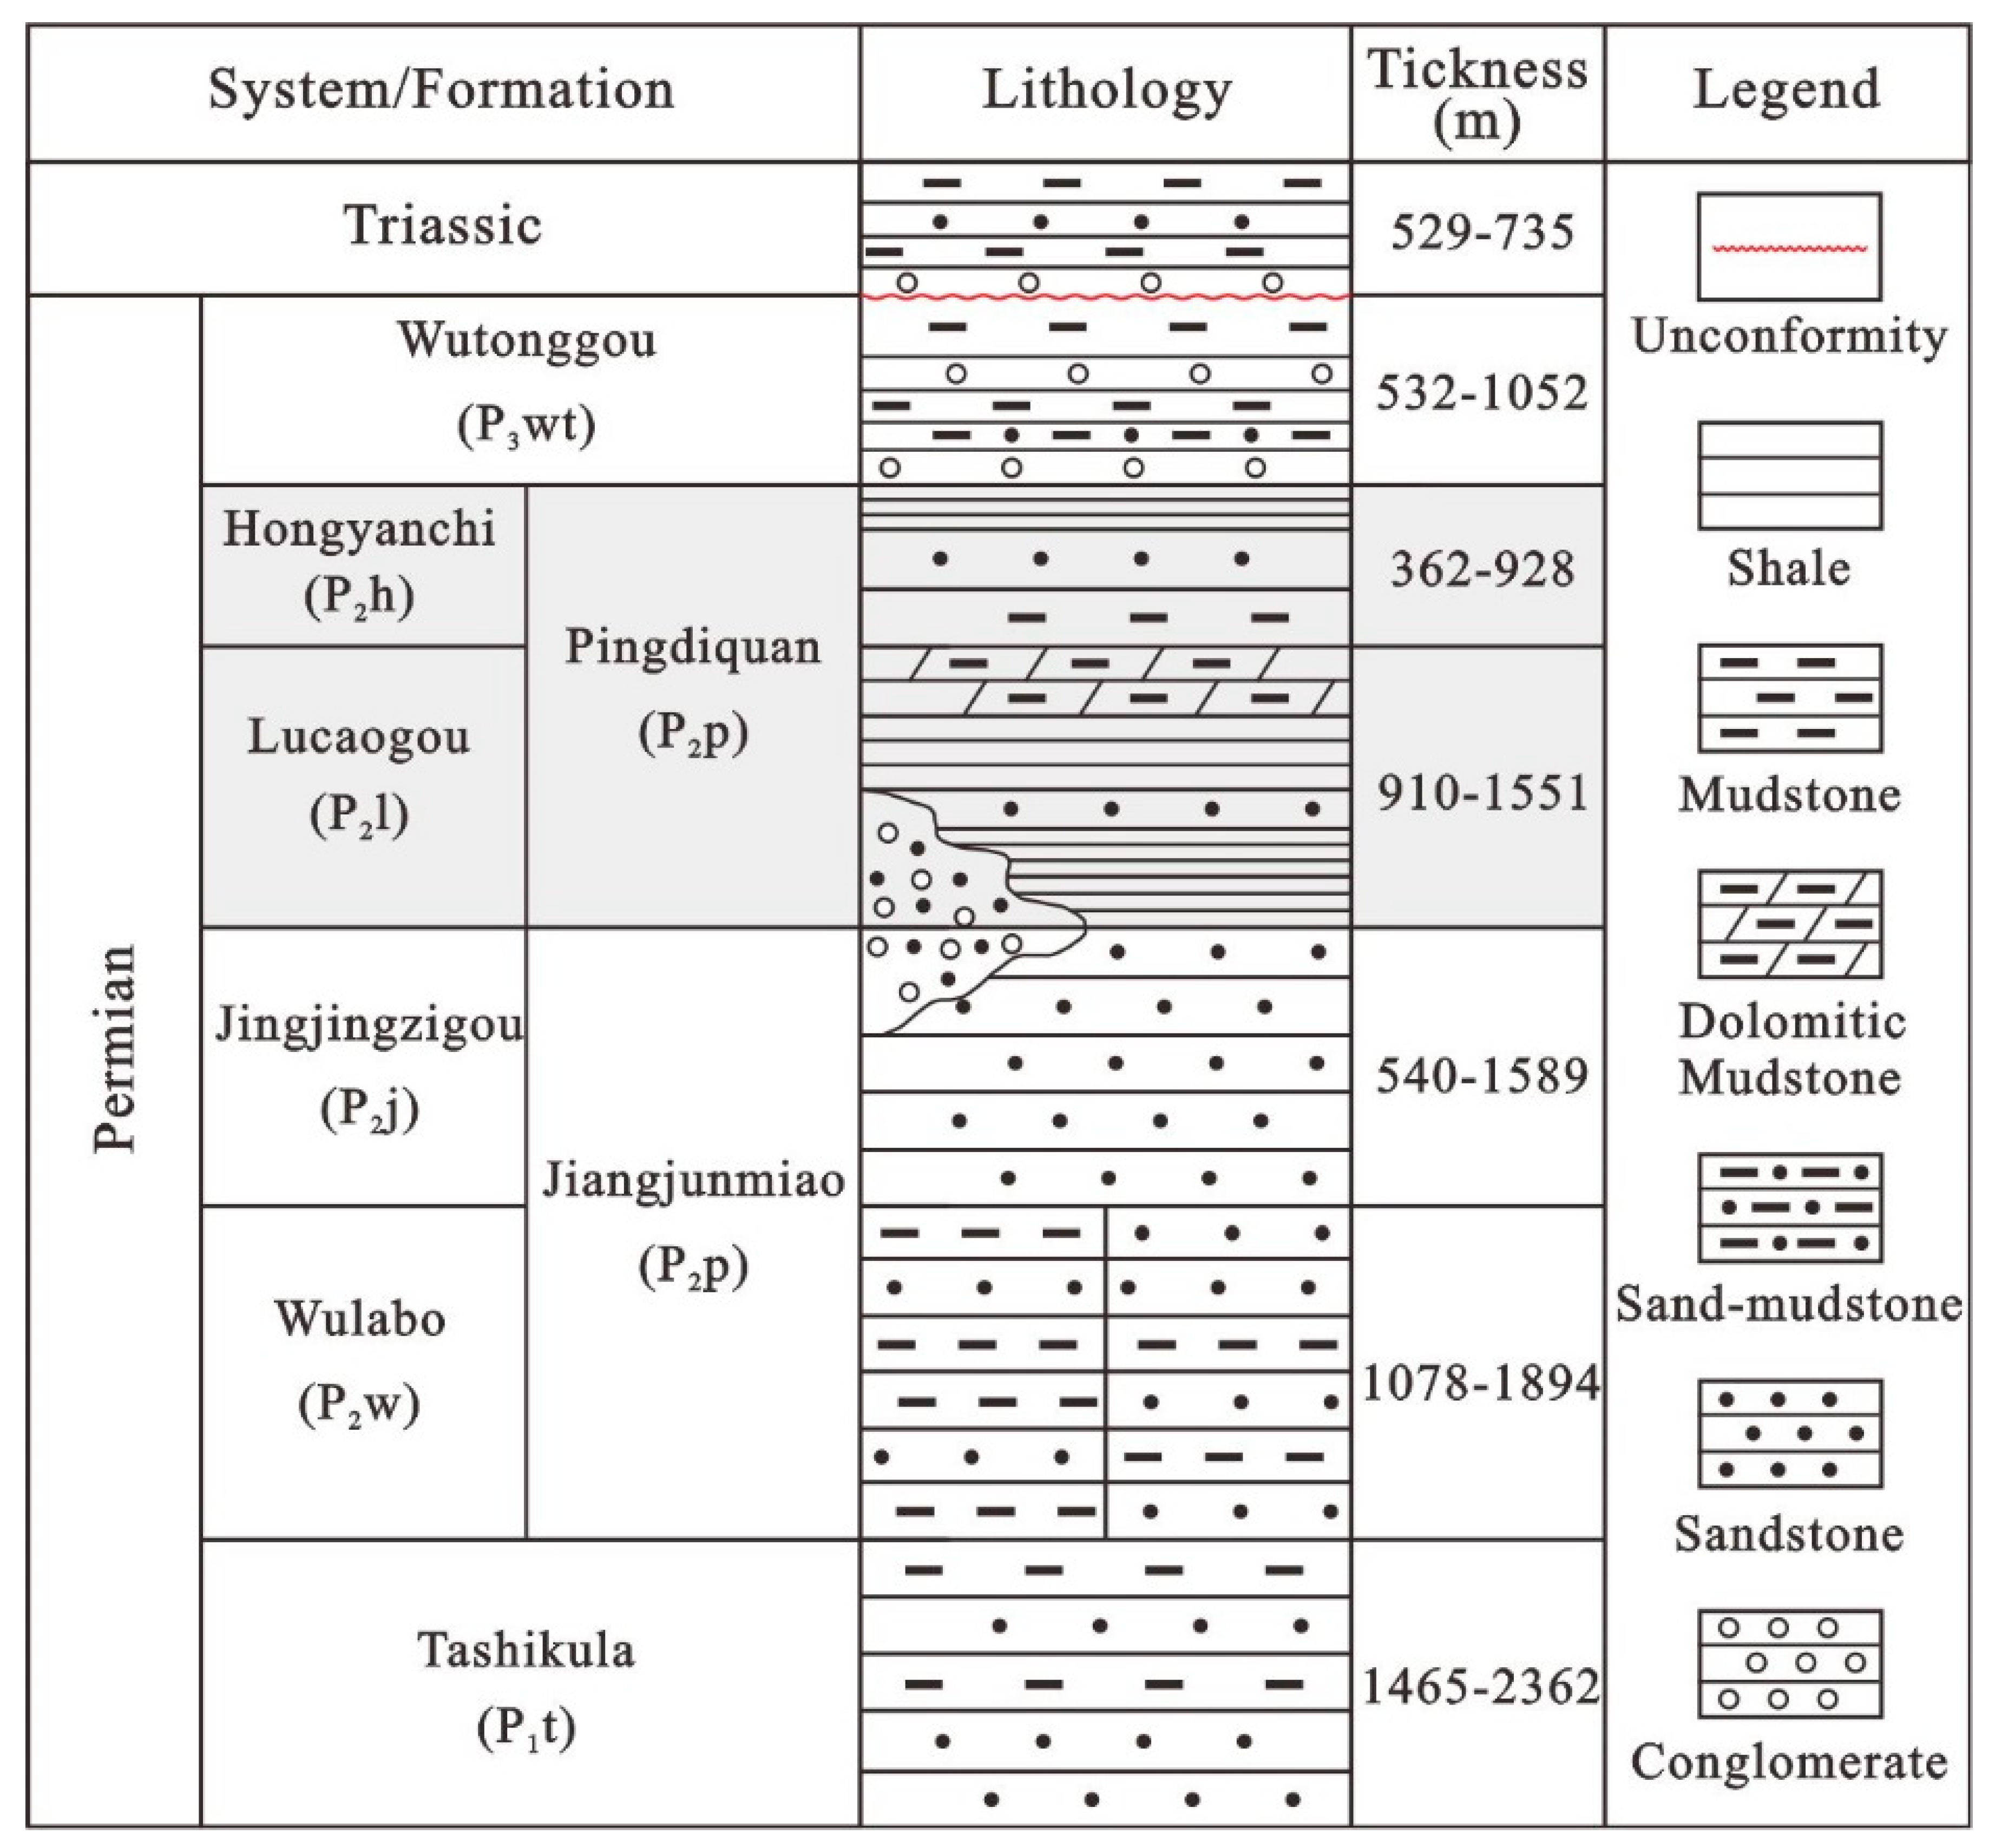
Sediments from Paleozoic to Cenozoic were deposited around the Bogda Mountain, and the thickness of the sedimentary rocks reached 5000 m during the Permian. The Middle Permian around the Bogda Mountain can be divided into four formations (see Figure 2), which are, from the base to the top: the Wulabo (P2w), Jingjingzigou (P2jj), Lucaogou (P2l), and Hongyanchi Formations (P2h); while the northeastern area is divided into two formations: the Jiangjunmiao (P2j) and Pingdiquan Formations (P2p). The best organic-rich sediments were deposited in the Middle Permian Lucaogou Formation (P2l) and Pingdiquan Formation (P2p), which consist of from semi-deep to deep lacustrine shale rich in organic matter with average vertical thicknesses of 900–1500 m (target formation in gray). Shale, mudstone, sandstone, pebbly sandstone, conglomerate, and dolomitic mudstone were discovered in the study area.

3. Material and Methods

3.1. Sampling

A total of 130 samples were obtained from 1 drill core and 3 outcrops of the Lucaogou Formation around the Bogda Mountain, southern Junggar Basin. The total organic carbon (TOC) measurements and Rock-Eval analysis were conducted on all organic-rich mudstones and shales. The molecular marker compositions, major oxides, and trace elements were conducted on 53 collected samples.

3.2. Measurement of Total Organic Carbon and Rock-Eval Pyrolysis

The selected samples were crushed into 100-mesh grains to measure the TOC content and conduct Rock-Eval analysis at the State Key Laboratory of Petroleum Resources and Prospecting, China University of Petroleum (Beijing). The samples were treated with 10% (vol) HCl at 60 °C to remove carbonate minerals and were cleaned with distilled water to remove any residual HCl. Then, the sample powders were dried at 50 °C for 10 h. Finally, an iron-tungsten cosolvent was added, and TOC analysis was conducted using a Leco CS-230 carbon analyzer with 99.5% oxygen as the carrier gas at 24 °C and a relative humidity of 48%. The accuracy of TOC is ( 0.1186   ×   TOC + 0.05 ) 2   ( 0.0384   ×   TOC + 0.05 ) 2 2 based on Chinese National Standard GB/T 19145-2022. Rock-Eval pyrolysis was conducted using a Rock-Eval II instrument, and the samples were heated to 600 °C in a helium atmosphere; three parameters, S1, S2, and Tmax, were generated in this process with the relative errors <10% based on the Chinese National Standard GB/T 18602-2012. The hydrogen index (HI = S2/TOC) was used to study the types of organic matter.

3.3. Analysis of Molecular Markers

The soluble bitumen extraction was conducted on 53 samples with a dichloromethane/methanol mixture (93/7 v/v) using a Soxhlet apparatus for 24 h. After extraction, petroleum ether was used to dissolve the de-asphalted components and filter the bitumen. Then, the de-asphalted extracts were fractionated into saturated hydrocarbons, aromatic hydrocarbons, and polar compounds using column chromatography with alumina-silica gel (2:3) as the stationary phase. The saturated hydrocarbons were eluted using petroleum ether; petroleum ether with dichloromethane (1/2, v/v) for aromatic hydrocarbon fractions; and dichloromethane with methanol for the polar compounds. The biomarker compositions of the samples were analyzed using Agilent 5975i mass spectrometry (MS) coupled with an Agilent 6890 gas chromatography (GC), equipped with an HP-5MS fused silica column (60 m × 0.25 mm inner diameter; film thickness, 0.25 μm). The GC oven temperature for analysis of the saturated fractions was initially held at 50 °C for 1 min; programmed to 120 °C at 20 °C/min, to 250 °C at 4°C/min, and to 310 °C at 3 °C/min; and held at 310 °C for 30 min. Helium was used as carrier gas. The ion source was operated in the electron in both scan (m/z 50–500) and single-ion monitoring mode (m/z 85–365). An internal standard, perdeuterated n-tetracosane, was added to quantify the specific molecular markers.

3.4. Major Oxides and Trace Elements

The analysis of the major oxides, including SiO2, Al2O3, Fe2O3, MgO, Na2O, K2O, MnO, TiO2, and P2O5, was conducted on an Axiosm AX X-ray fluorescence (XRF, Analtical Laboratory of BRIUG, Beijing, China) spectrometer using fused discs at the analytical laboratory of the Beijing Research Institute of Uranium Geology. The Chinese National Standard GB/T 14506.28-2010 was used as a reference.
The trace elements (V, Ni, Sr, Ba, Th, U, Co, Cr, Cu, Mo, Zr, Zn, Y, Ho, La, and Yb) were analyzed using inductively coupled plasma–mass spectrometry (ICP–MS) on a NexION 300D plasma mass spectrometer and quantified based on the Chinese National Standard GB/T 14506.30-2010. Briefly, each ground sample was dissolved in a mixed solvent of 30% HF and 68% HNO3 at 190 °C for 24 h. Then, the solvent was removed by heating in a water bath, and the dried solid was redissolved in 2 mL of 6 mol/L HNO3 in capped Teflon bombs at 150 °C for 48 h. The resultant solution was evaporated to near dryness again, followed by the addition of 1 mL of 6 mol/L HNO3. All the samples were diluted for analysis. The detection limits for the evaluated elements were in the range of from 0.1 to 9 ppb.
To evaluate the extent of enrichment for each major and trace element, we calculated the enrichment factor (EF) based on Equation (1):
EFx = (X/Al)sample/(X/Al)PAAS
where (X/Al)sample and (X/Al)PAAS represent the abundance ratios of element X to aluminum (Al) in the samples and in post-Archean Australian shales PAAS, respectively [41]. The studied element was considered enriched in the sample relative to the PAAS if EF > 1 and depleted if EF < 1 [42].
Biogenic barium (Babio) associated with the sinking flux of organic matter was used as a geochemical proxy of the paleoproductivity in this study. Babio was determined by calculating the amount of barium in excess of the expected detrital Ba concentration (Badetr) as follows.
[Babio] = [Batotal] − [Al] × (Ba/Al)detr
We assumed that all non-detrital Ba was biogenic in origin. The value of (Ba/Al)detr was set to 0.0065 according to the average crustal (Ba/Al)detr ratio [43,44].

3.5. Organic Petrology

The polished blocks of the samples were prepared for organic petrography using the American Society for Testing and Materials procedure [45]. The maceral observation was carried out on a Leica microscope with a 50× oil-immersion objective under reflected and fluorescent light [3]. Alginite, vitrinite, inertinite, and mineral-bituminous groundmasses were identified.

3.6. Stable Carbon Isotope

Following the fractionation of de-asphalted bitumens (Chapter 3.3), the measurement of the stable carbon isotope of saturated hydrocarbons were performed using a Thermo MAT-253 mass spectrometer coupled with an Agilent 7890 gas chromatograph. PDB was the standard, and the accuracy was estimated to be ±0.2‰.

4. Results

4.1. Distribution and Evaluation of Organic Rich Shales and Mudstones

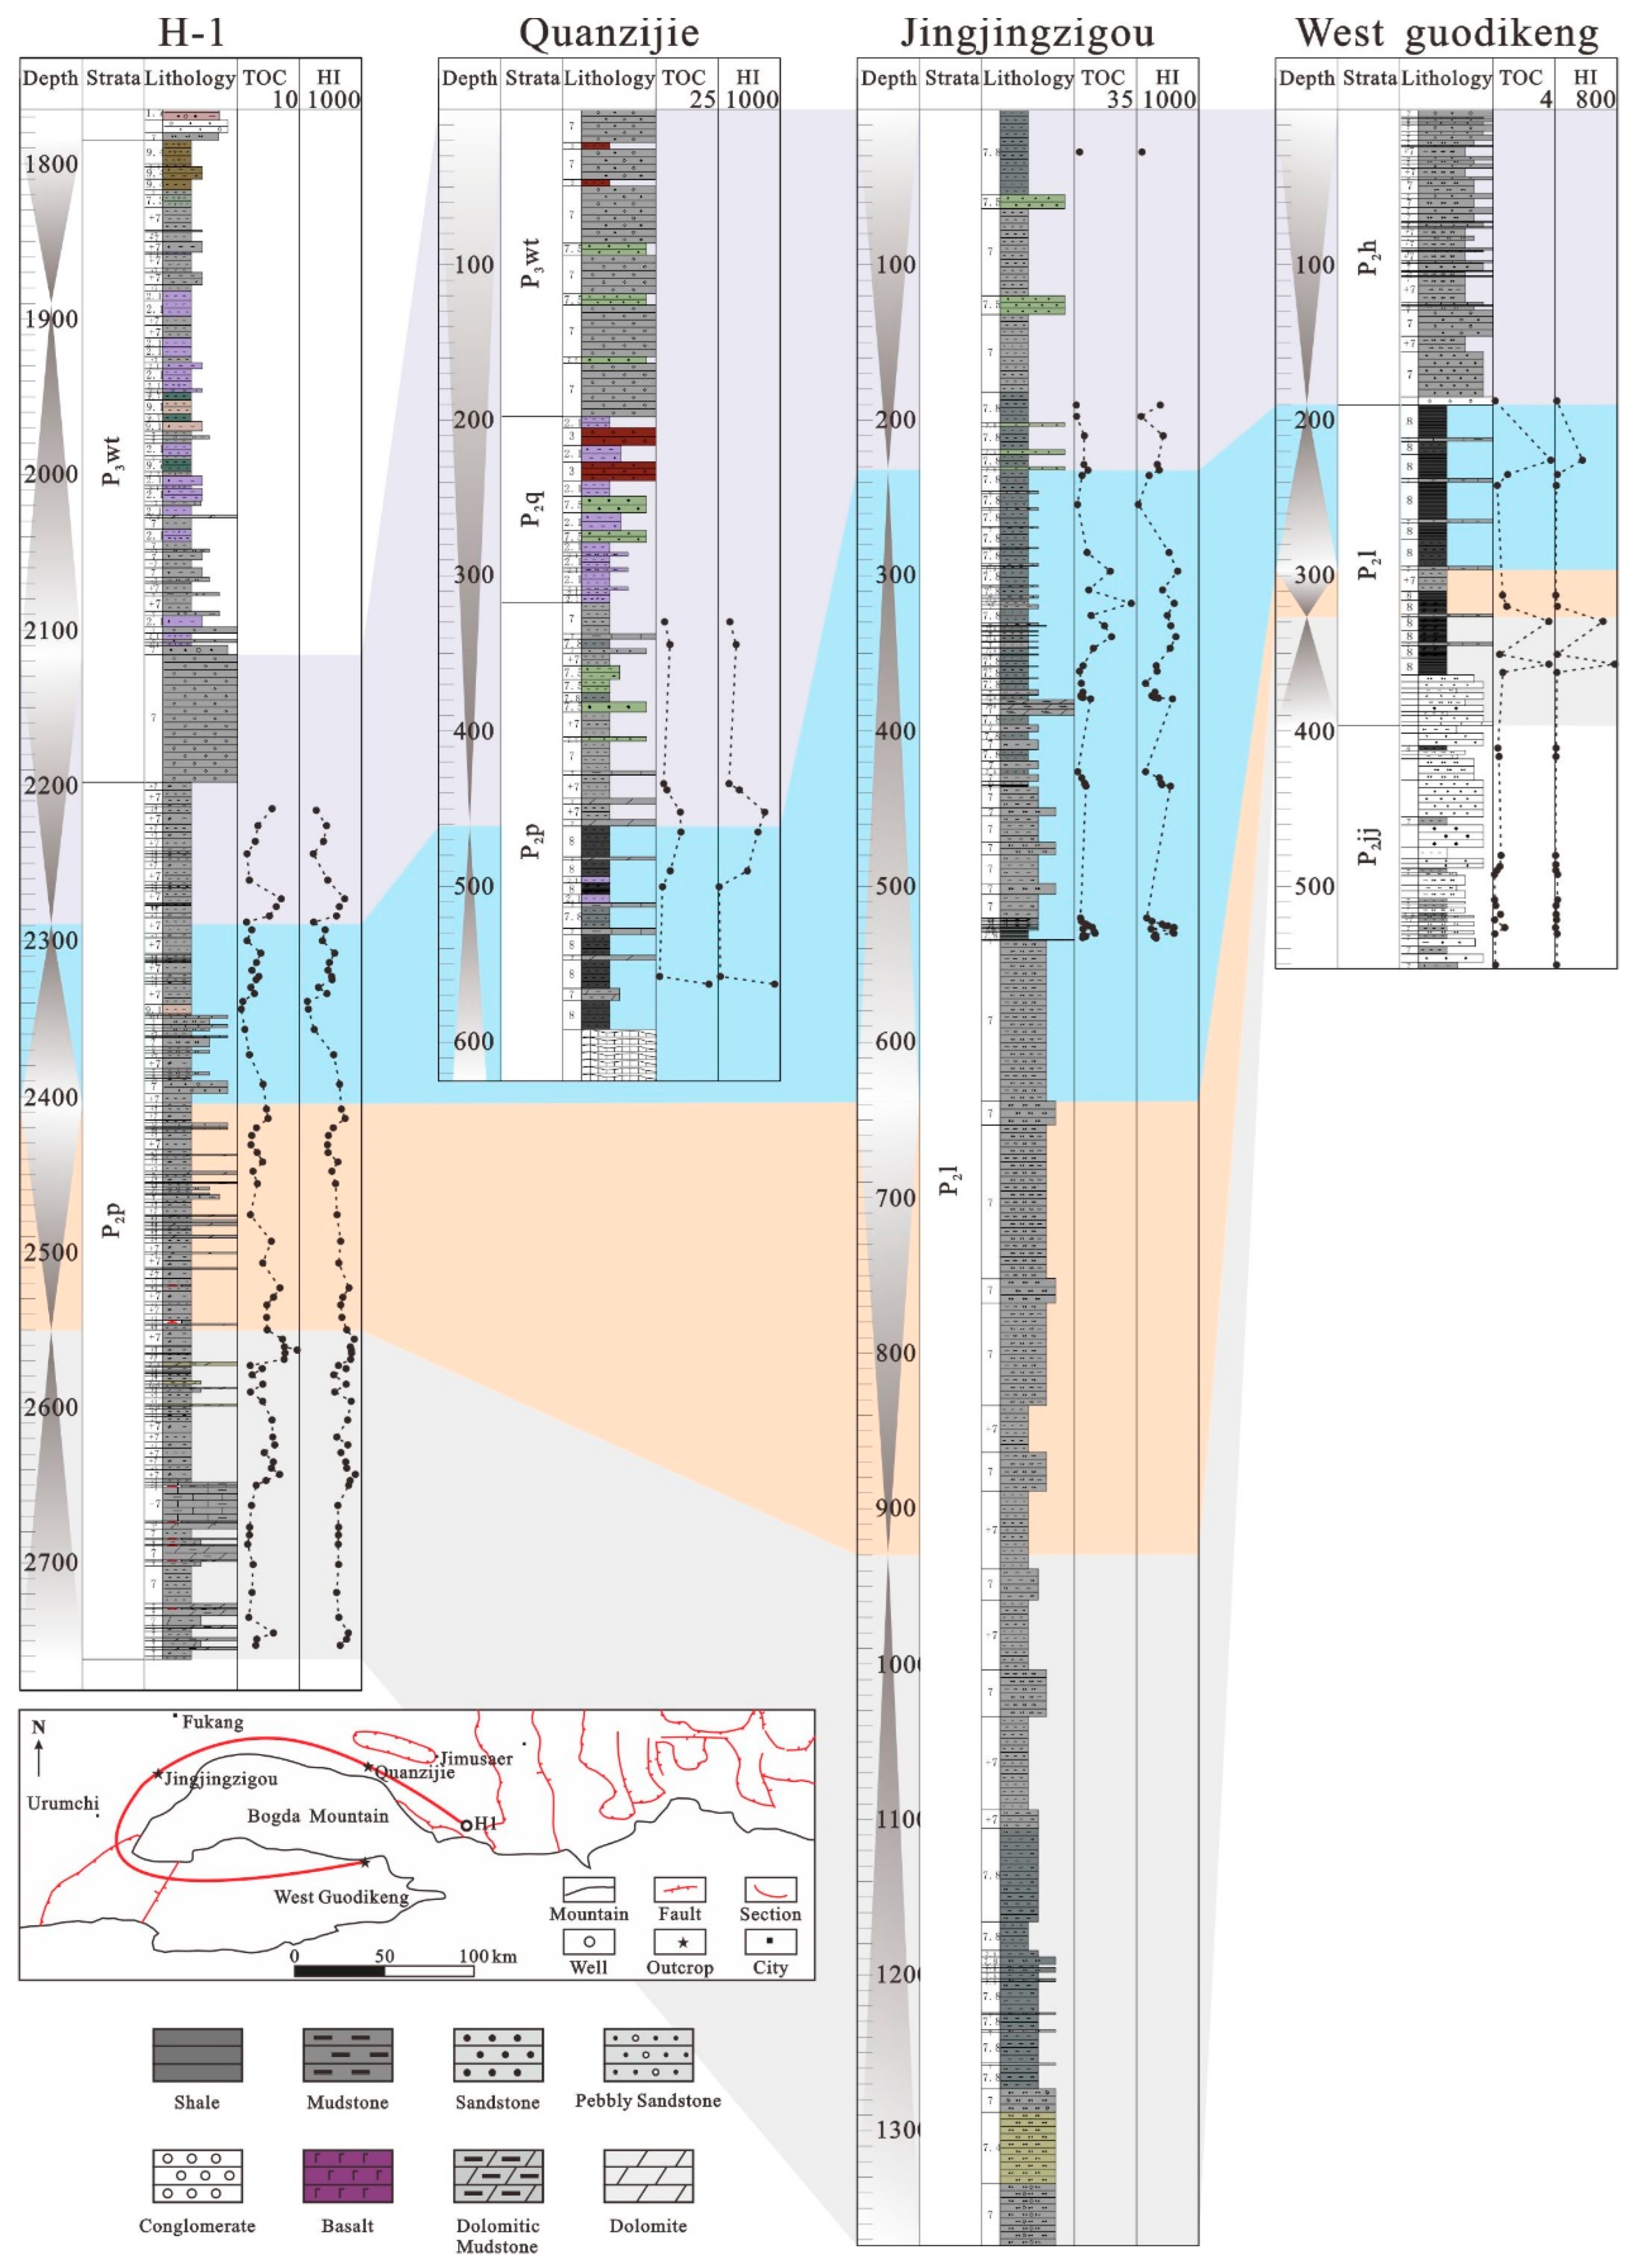
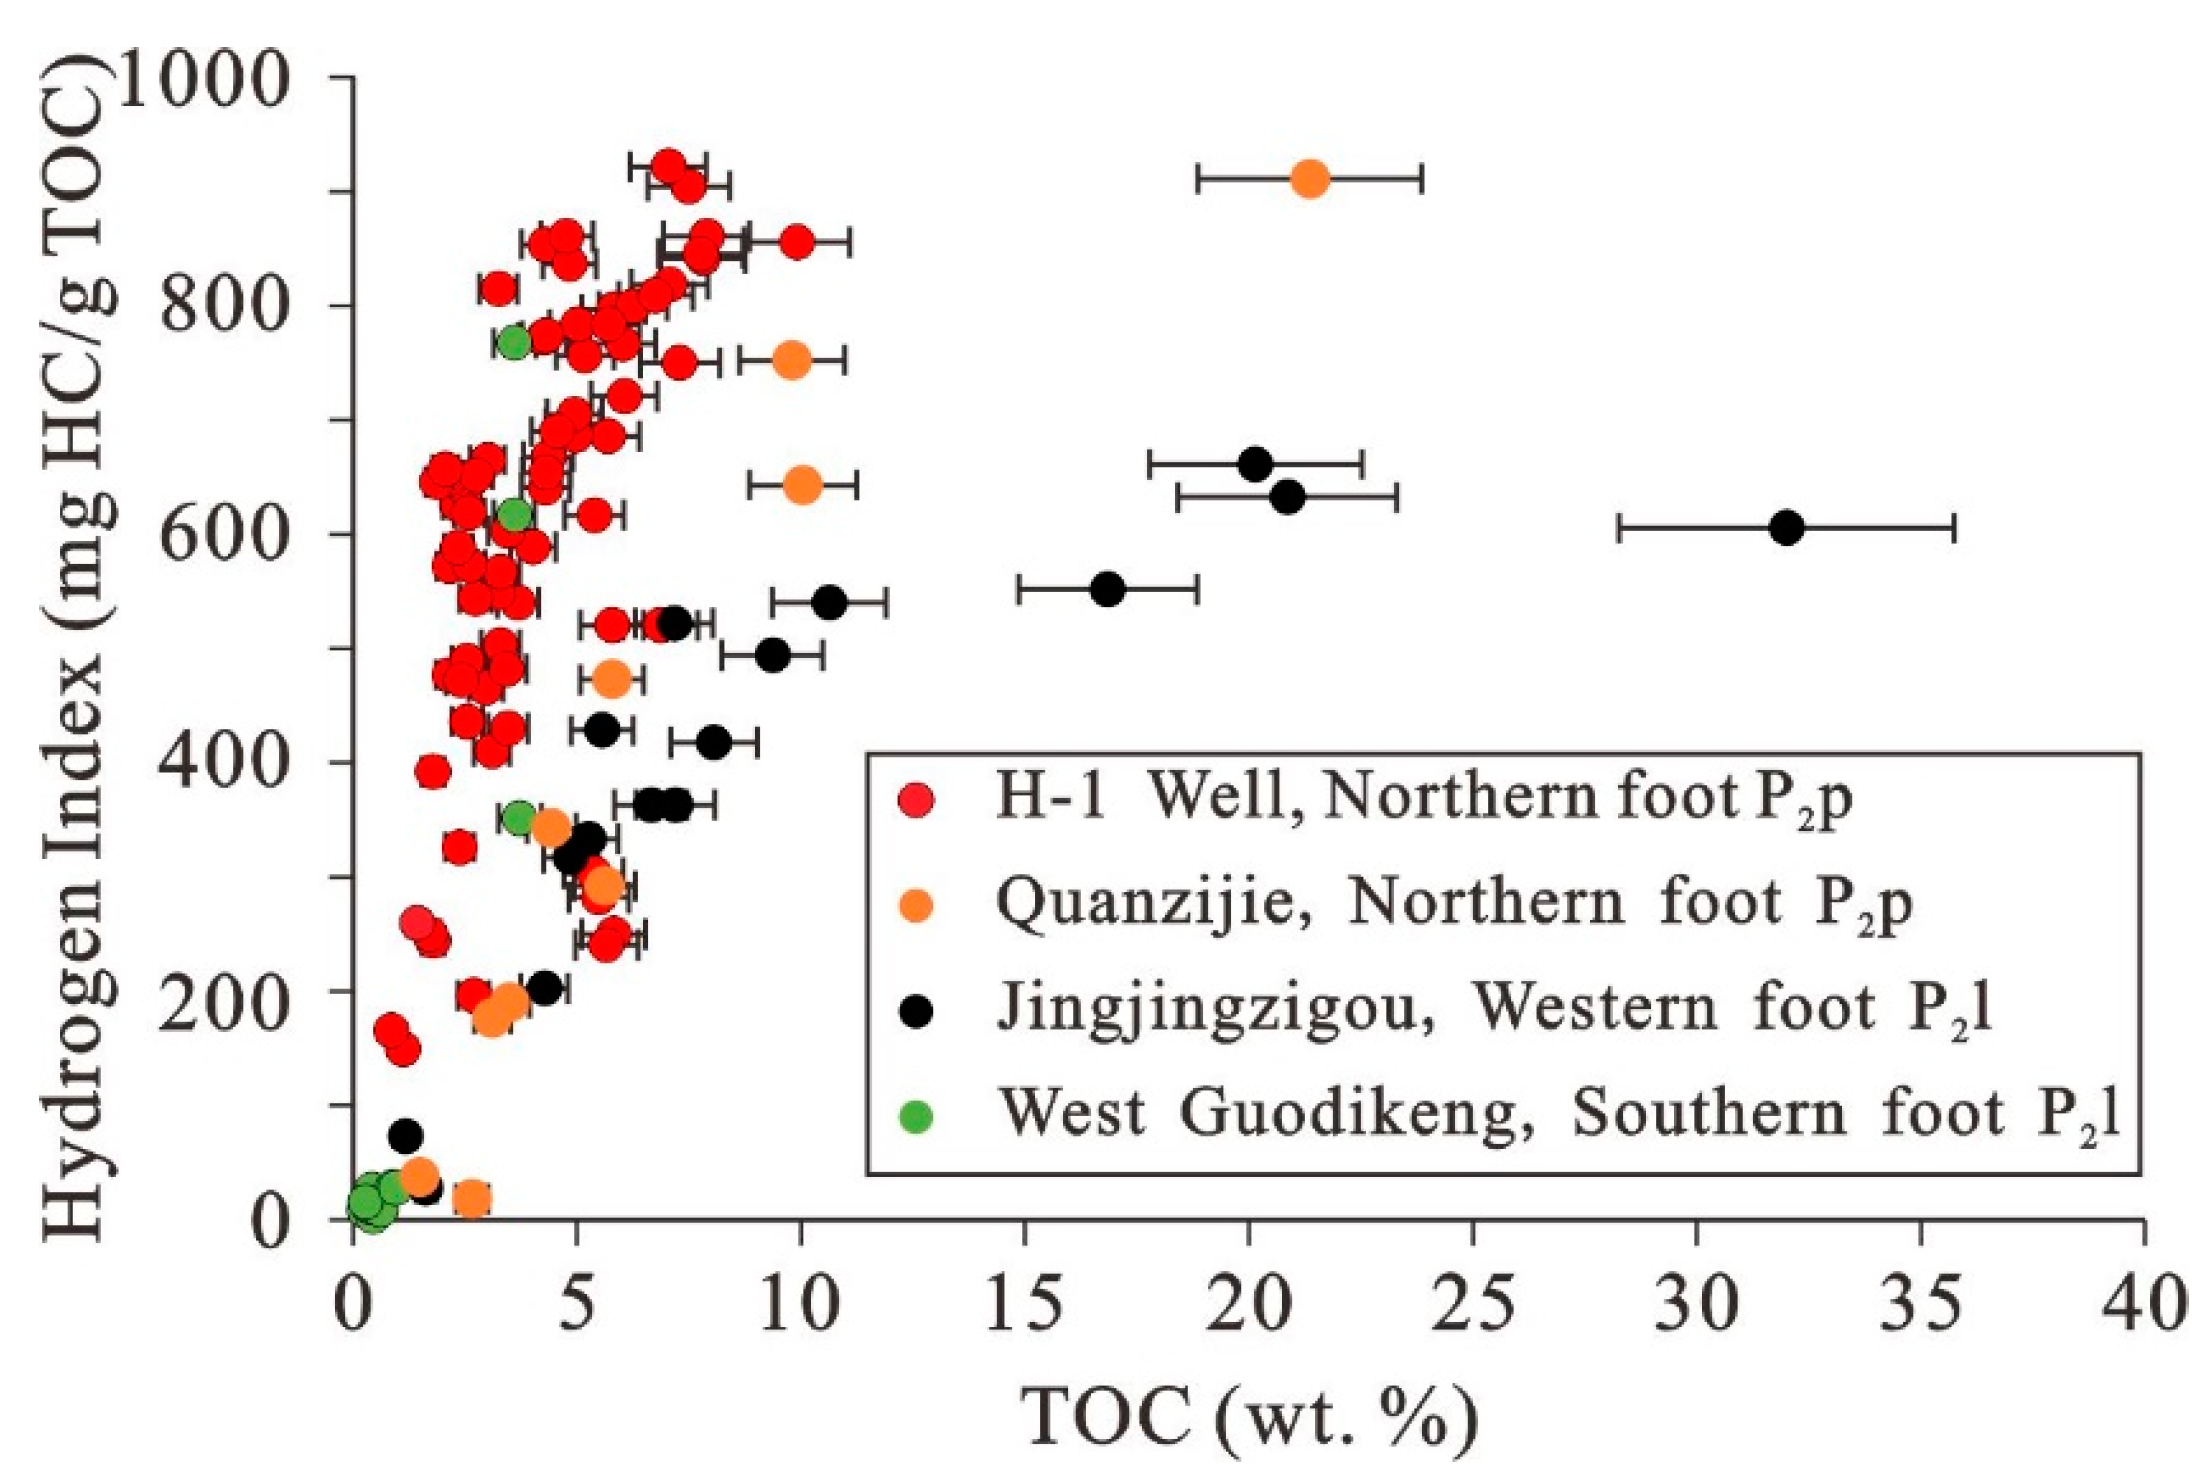
Organic-rich shales are developed in the middle Permian around the Bogda Mountains, and the distributions of these shales are uneven. Two sedimentary cycles can be widely recognized in the middle Permian (P2l and P2p) around Bogda Mountain, which echoes the study conducted in the Jimusaer sag, northeast Bogda Mountain [46,47]. The boundary between these two cycles is formed by a maximum regressive surface, with the granularity of lithology changes from coarse to fine to coarse in each cycle. Organic-rich sediments can be identified in both cycles, with similar abundances and types of organic matter (Figure 3). TOC versus HI is shown in Figure 4. The shales and mudstones collected from both cycles of P2p in the northern Bogda Mountains (the H-1 well and Quanzijie outcrop) were measured to contain 1.48–21.35 wt. % TOC, with HIs of 149-922 mg HC/g TOC. In the western Bogda Mountains, shales and mudstones from the upper cycle in the Jingjingzigou outcrop had TOC contents between 1.16 wt. % and 31.99 wt. %, and the HIs ranged from 27 to 661 mg HC/g TOC. The TOCs of the West Guodikeng outcrops (southern Bogda Mountain) were between 0.27 wt. % and 3.72 wt. %, with the HIs reaching as high as 767 mg HC/g TOC. Table 1 shows the organic geochemical data of the samples analyzed in the laboratory.

4.2. Saturated Hydrocarbon Species

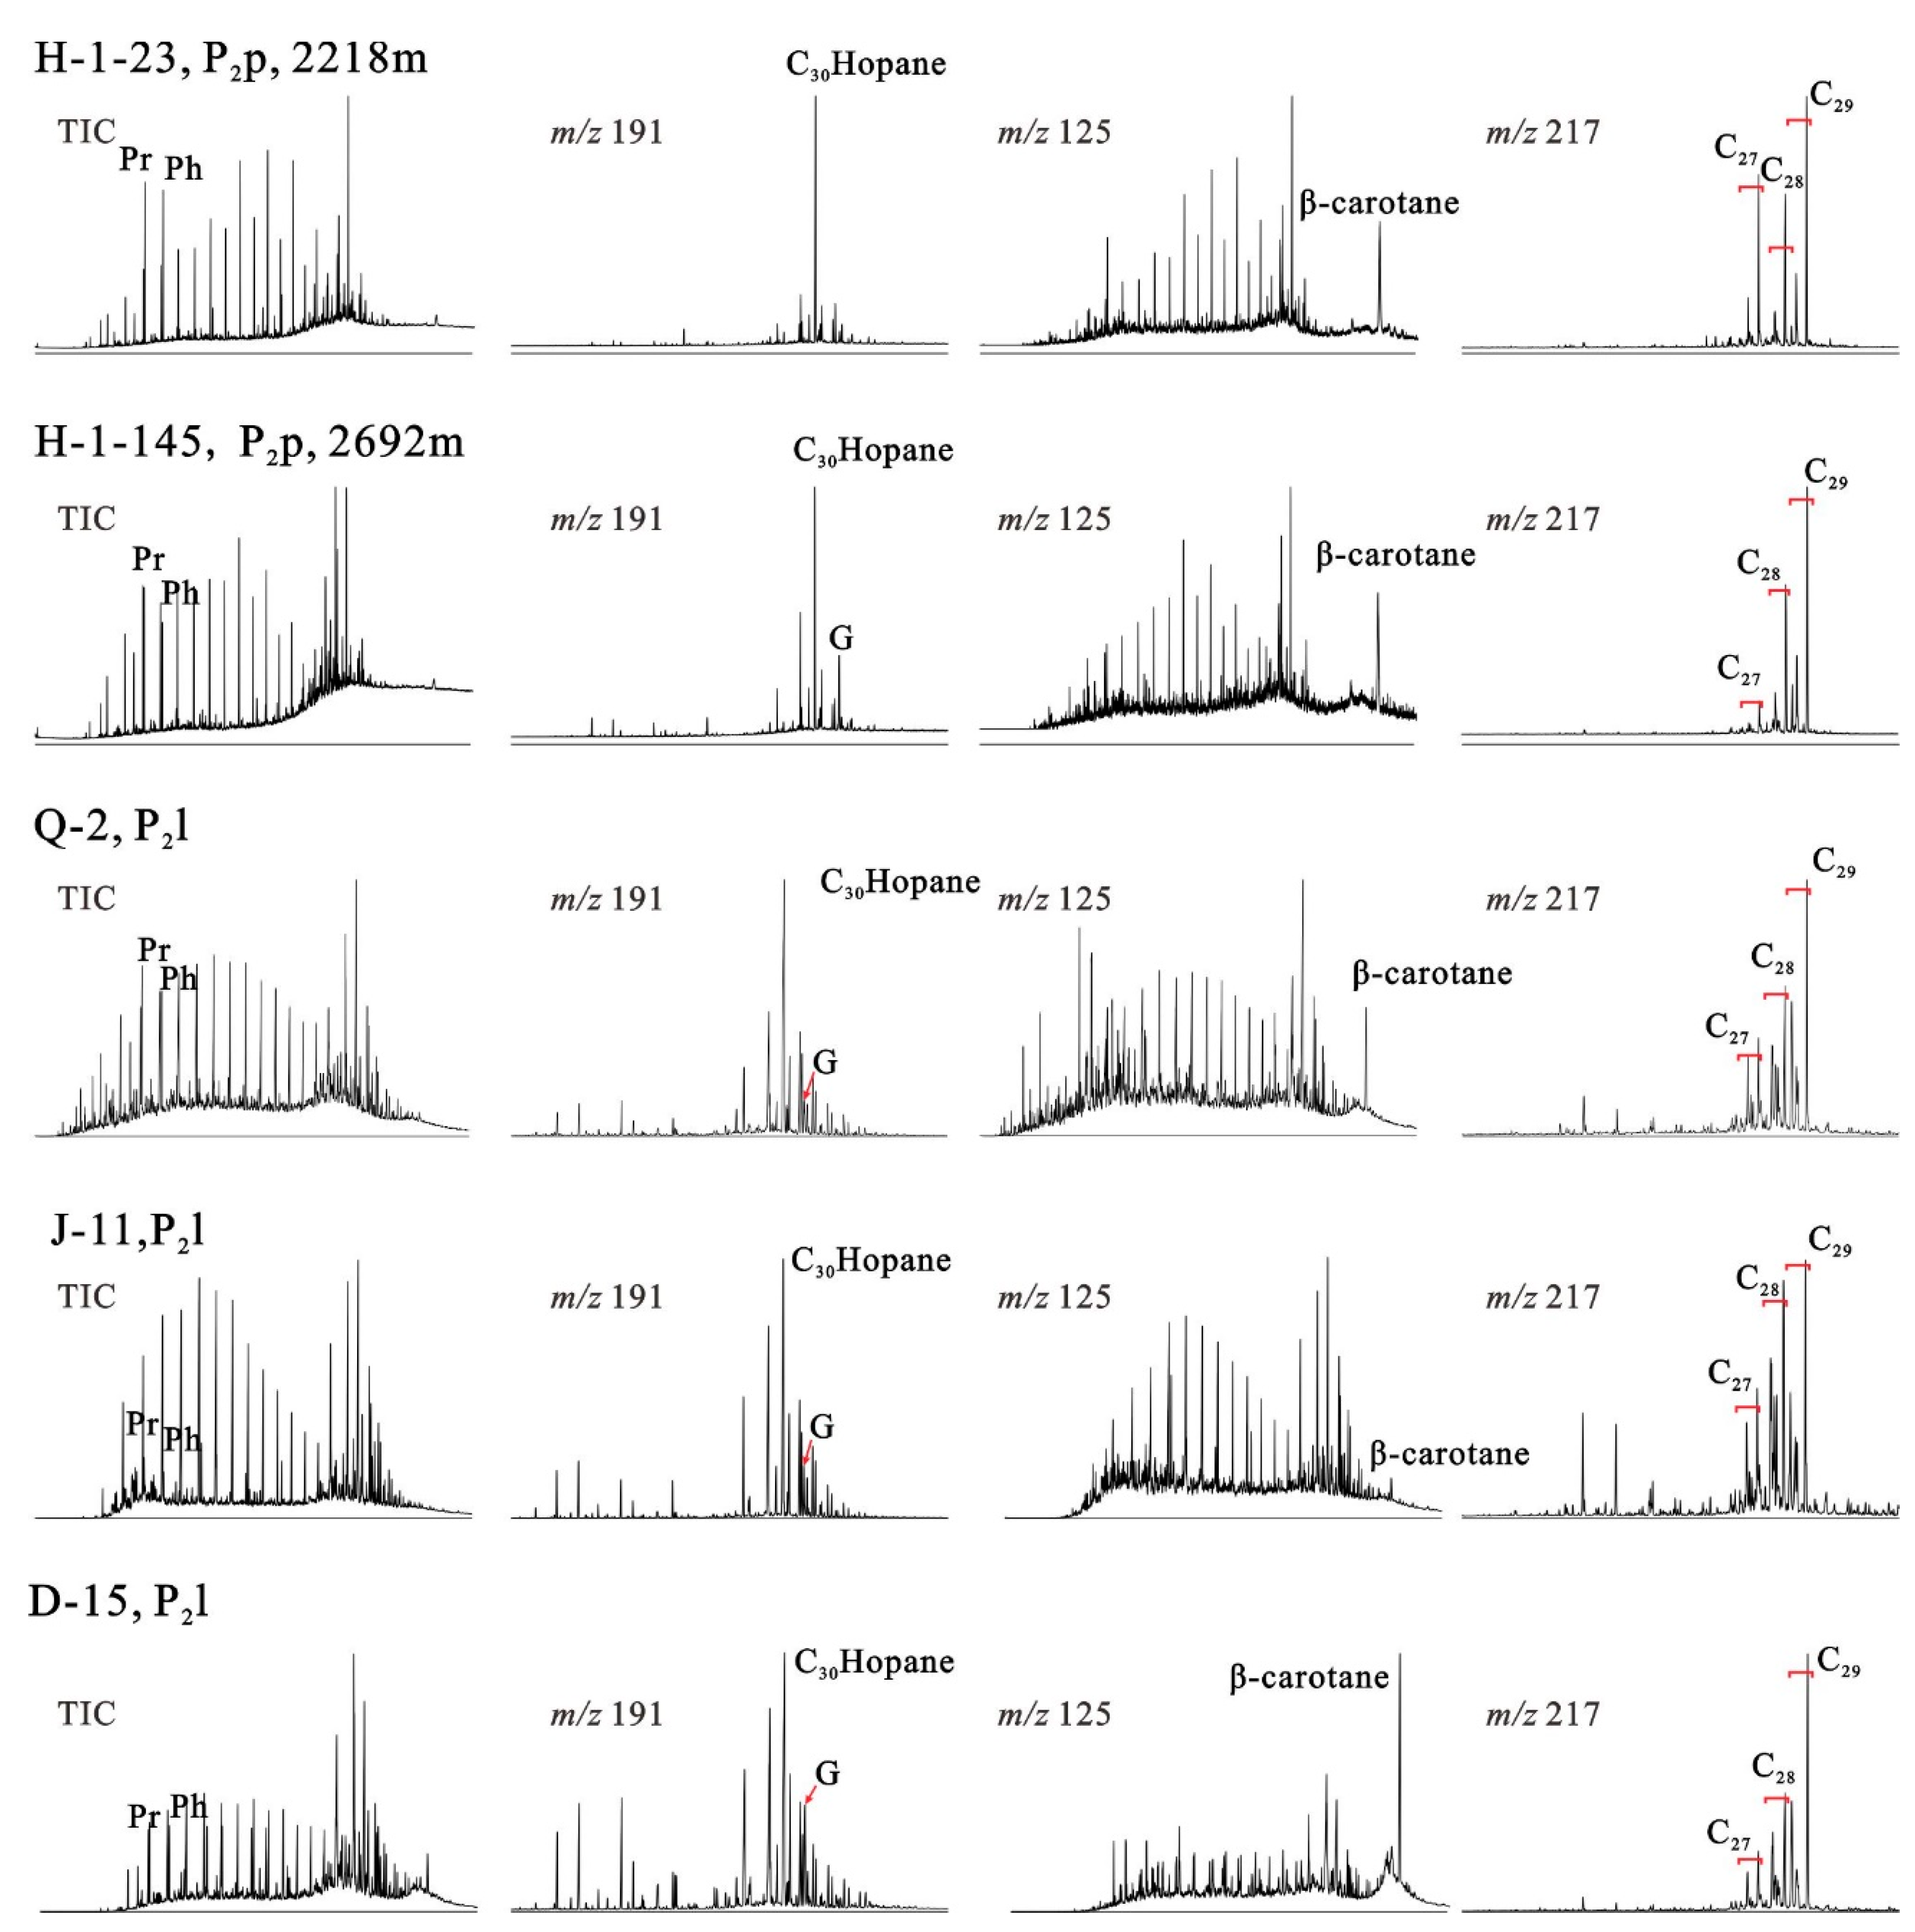
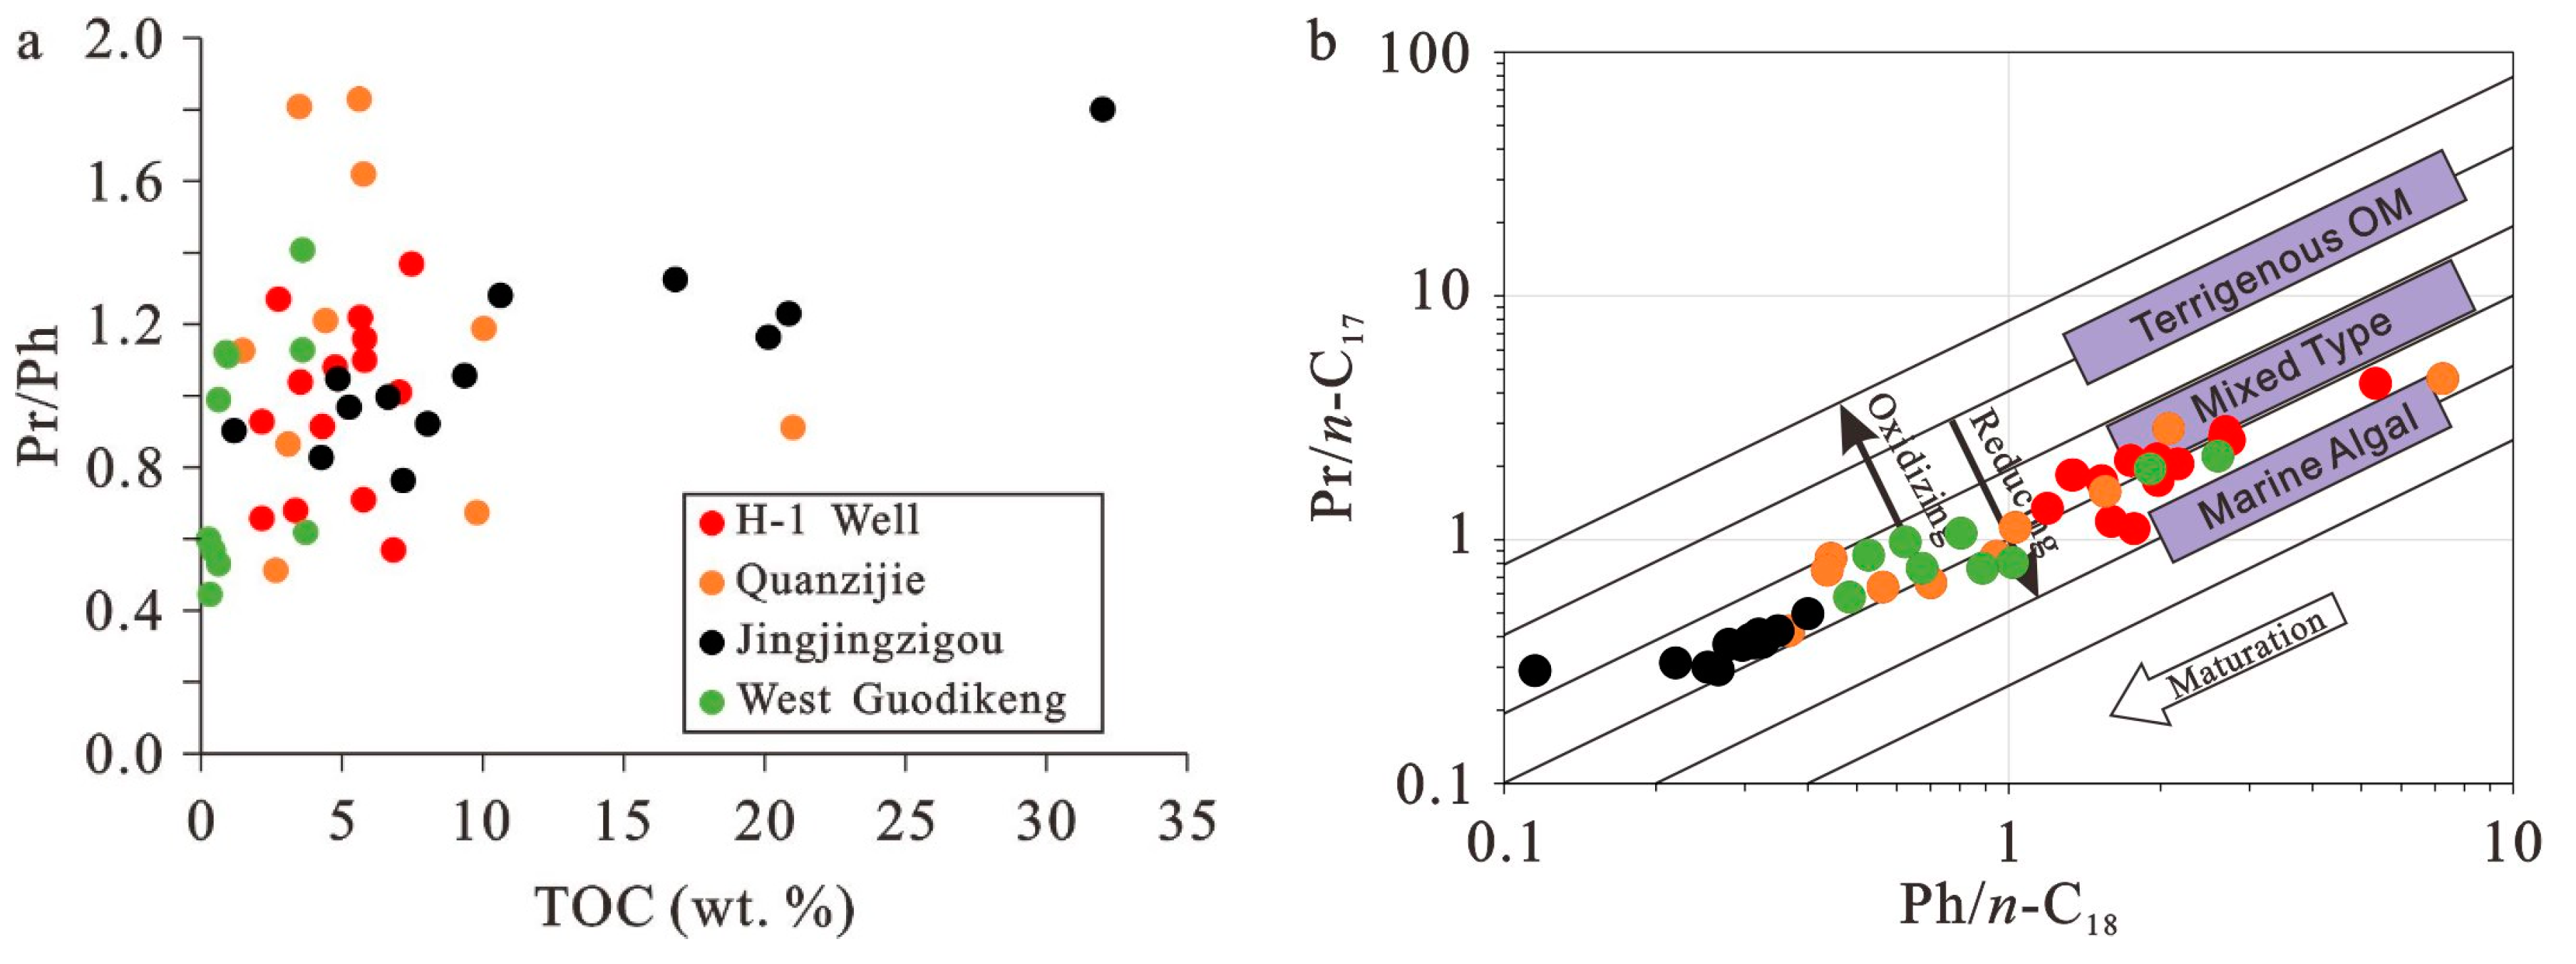
The samples selected in this study were not significantly biodegraded (see TIC in Figure 5), the content of biomarkers is effective in studying the paleoenvironment. The odd-even predominance of n-alkanes can be clearly observed in samples from the H-1 well with CPIs of 1.10-1.55 but is unclear in other outcrops (see Figure 5). The results of the calculated CPI and OEP are shown in Table 1. The pristane/phytane (Pr/Ph) ratios of all the samples ranged from 0.62 to 1.83 (see Figure 6a). Pr/C17 versus Ph/C18 clearly shows the variation characteristics of Pr/Ph and maturity in different regions (Figure 6b). Gammacerane can be identified (see Figure 5) but the levels are generally low (Table 1). The C29 regular steranes showed relative enrichment over C28 and C27 regular steranes in the majority of the samples. β-Carotane was ubiquitous in the middle Permian around the Bogda Mounrains and was quantified by examining the peak area relative to the internal standard.

4.3. Major and Trace Elements

The major elemental oxides analyzed herein are shown in Table 2: SiO2 was the major component, constituting 25.19–69.97 wt. % of the shales and mudstones, followed by Al2O3, with an abundance of 4.24–16.87 wt. %. Other significant oxides included Fe2O3 (1.87–7.4 wt. %), MgO (0.38–10.99 wt. %), CaO (0.37–19.99 wt. %), Na2O (0.66–5.16 wt. %), and K2O (0.88–5.26 wt. %). The abundances of MnO, TiO2, and P2O5 were all less than 1.0 wt. %. Based on these major components, the enrichment factors (EFs) of trace metal elements were calculated with the results listed in Table 3.

4.4. Stable Carbon Isotopes

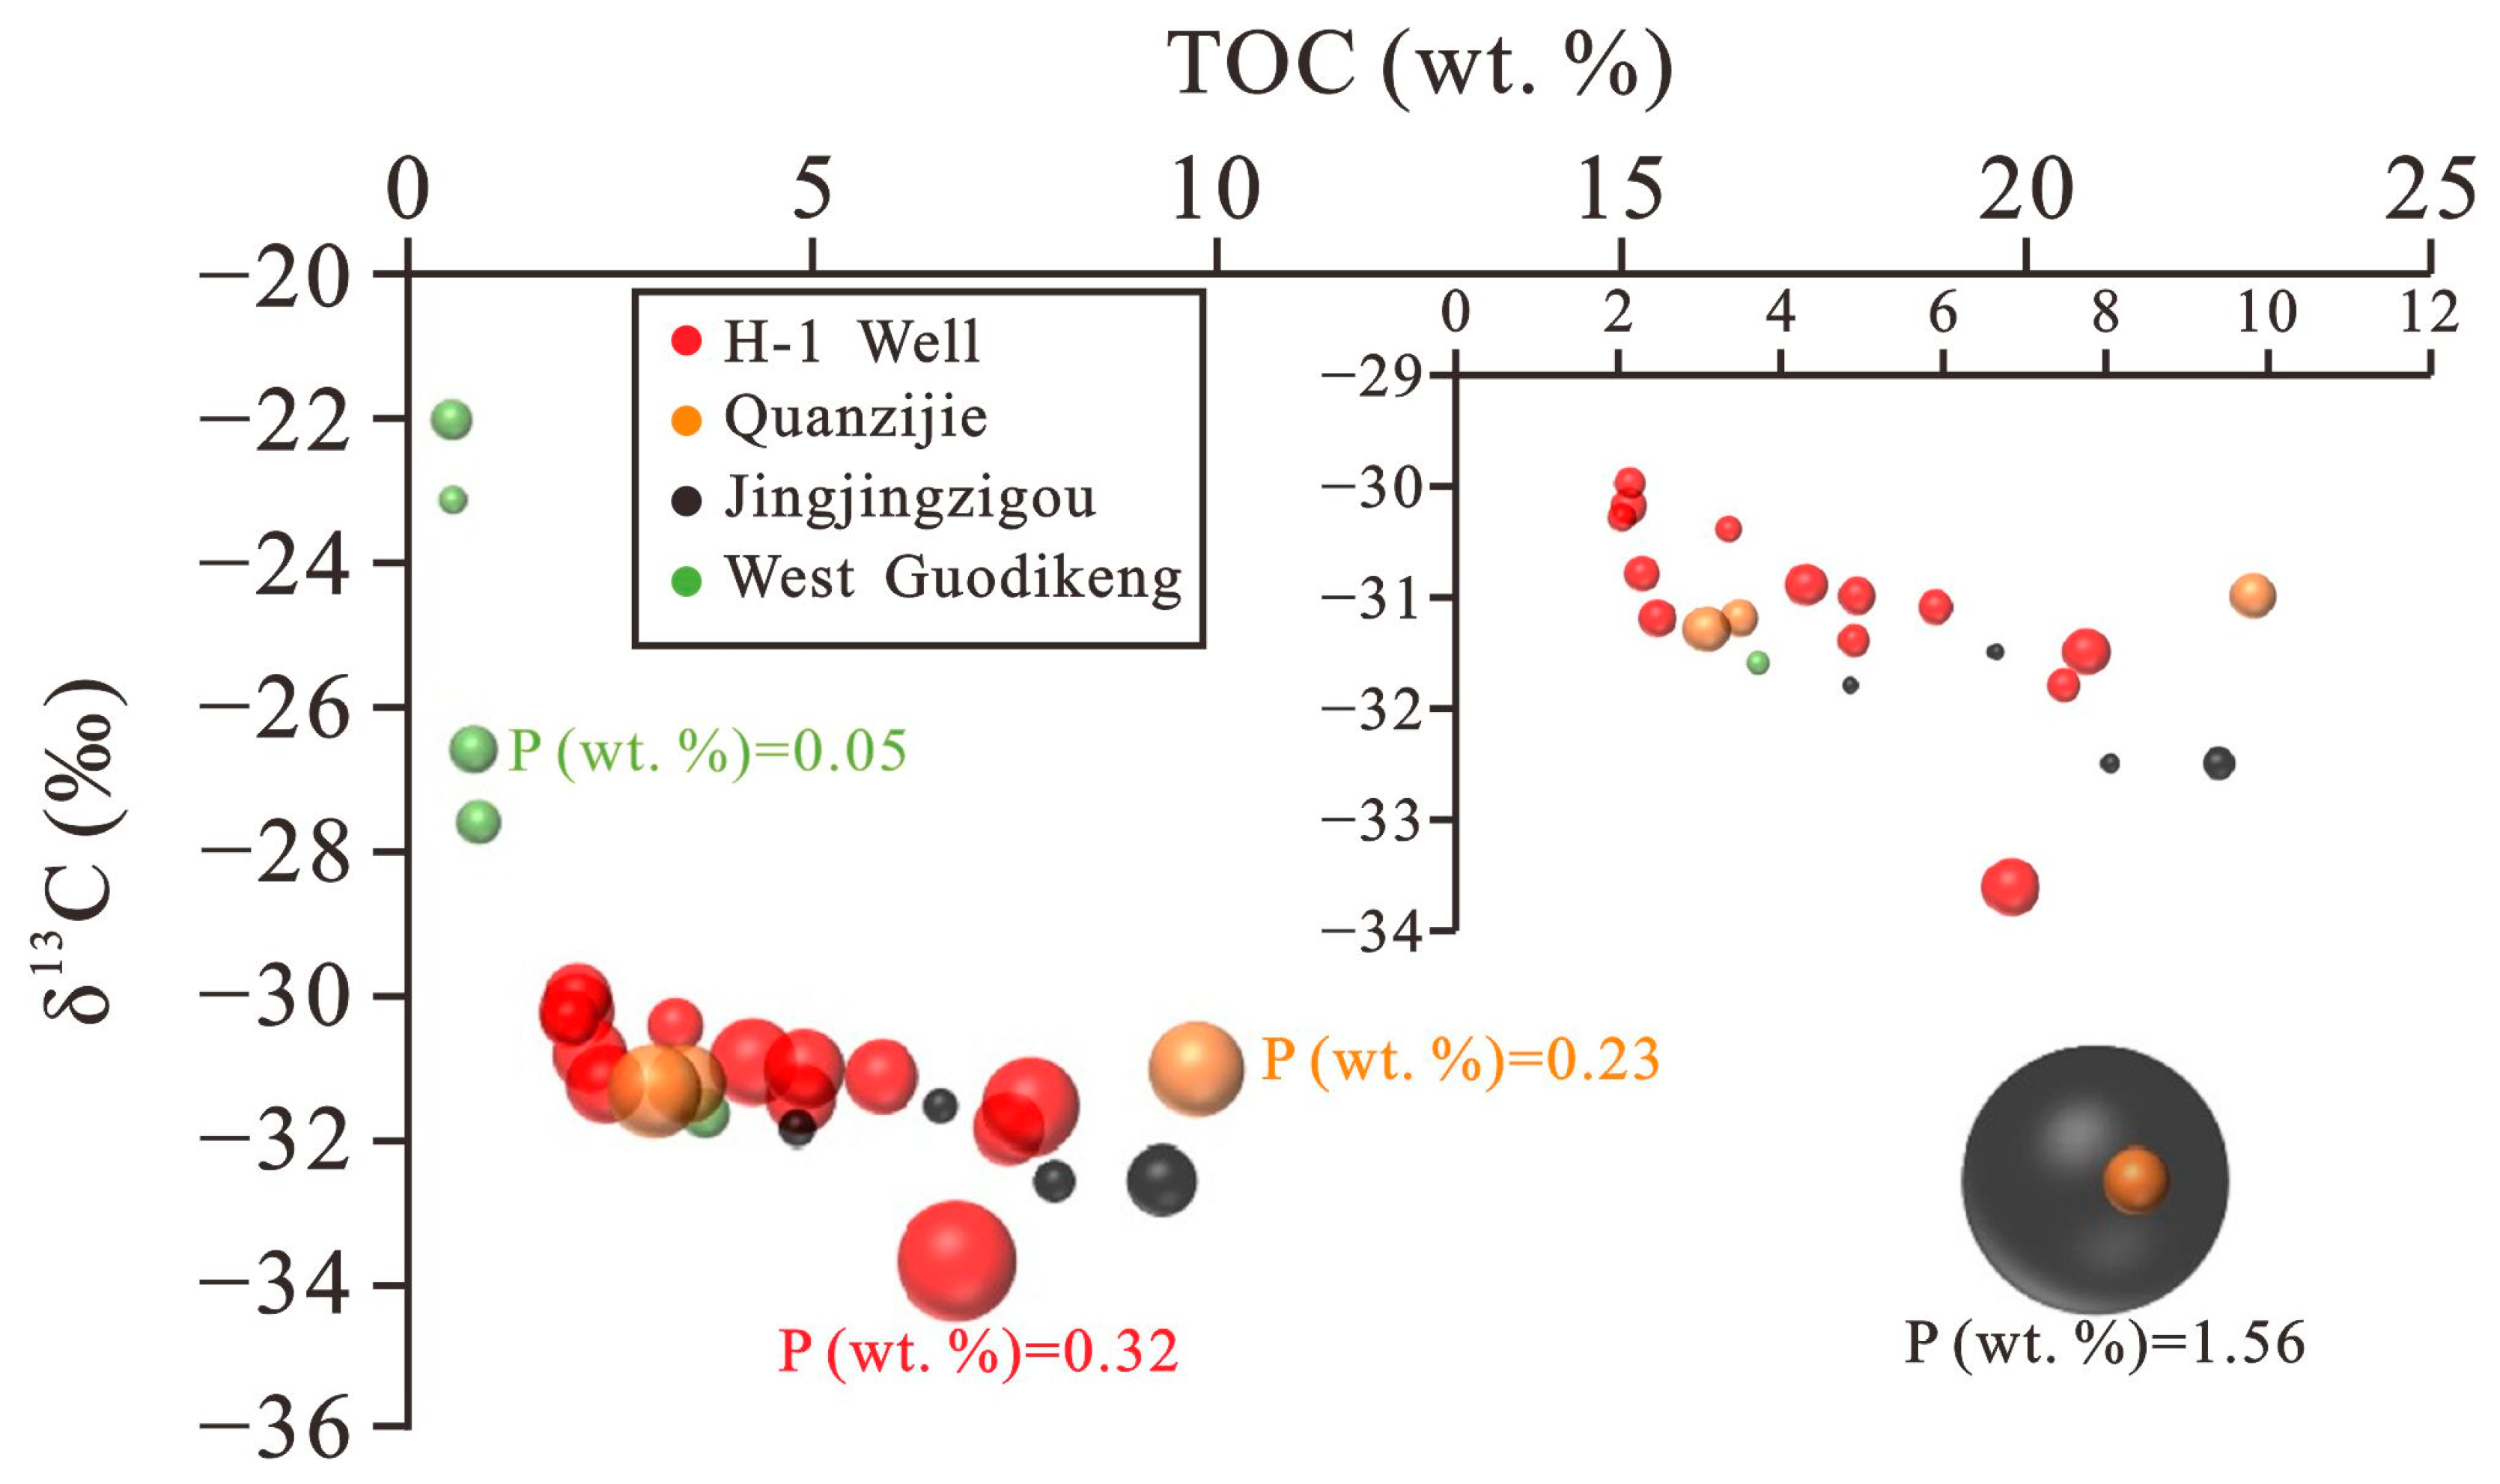
The stable carbon isotopic composition of soluble organic matter extracted from the sediments is shown in Table 1. A negative correlation exists between TOC and δ13C (Figure 7). The areal size of the point in the figure is the abundance of P, which will be discussed later. When TOC is greater than 2 wt. %, the δ13C values are generally less than -30‰, with the maximum negative value reaching −33.6‰. The samples collected from the southern Bogda Mountains with TOC <1% tend to have high δ13C values.

5. Discussion

5.1. Source of Organic Matter in Shales and Mudstones

In this study, the samples with high TOCs tended to have high HIs, indicating that the hydrogen-rich components were the main source of organic matter in organic-rich sediments. For the samples containing unusually high TOCs (~32 wt. %), the HIs were also higher than 600 (mg HC/g TOC), which ruled out the possibility of the samples originating from coal measure strata (see Figure 4). The difference between the slopes of HI and TOC revealed the different source inputs of organic matter from different regions around the Bogda Mountains. In the western Bogda Mountains region (W Bogda), the HIs of organic-rich sediments reached 600 (mg HC/g TOC), while those in the northern area (N Bogda) exceeded 900 (mg HC/g TOC).
To clarify the organic source inputs in different regions, organic petrography analysis was conducted to study the morphological structure of organic matter, Figure 8. A study on samples from the H-1 well was conducted in the previous research [3]. In the Quanzijie area and H-1 well (N Bogda), the sedimentary organic matter was mainly composed of structural alginate (bright yellow fluorescence) and mineral-bituminous groundmasses, with little structural vitrinite and inertinite from higher plants. However, in the Jingjingzigou area (W Bogda), the organic matter accumulated in sediments was mainly in the form of mineral-bituminous groundmasses, without any original structure. It is difficult to observe structural alginate; instead, the vitrinite structure is intact. These differences in the organic maceral compositions can effectively explain the variations among HIs from the different regions shown in Figure 4.
Furthermore, the gross composition of soluble organic matter extracted from sediments was separated into saturated hydrocarbons, aromatic hydrocarbons, and polar components, and the relative abundances of these components are shown in a ternary plot (Figure 9). The polar organic macromolecules containing heteroatoms such as NSO were more abundant in sediments from western Bogda than in samples from the H-1 well and Quanzijie (N Bogda). These results again echo the differences in the HI and organic maceral compositions described above.
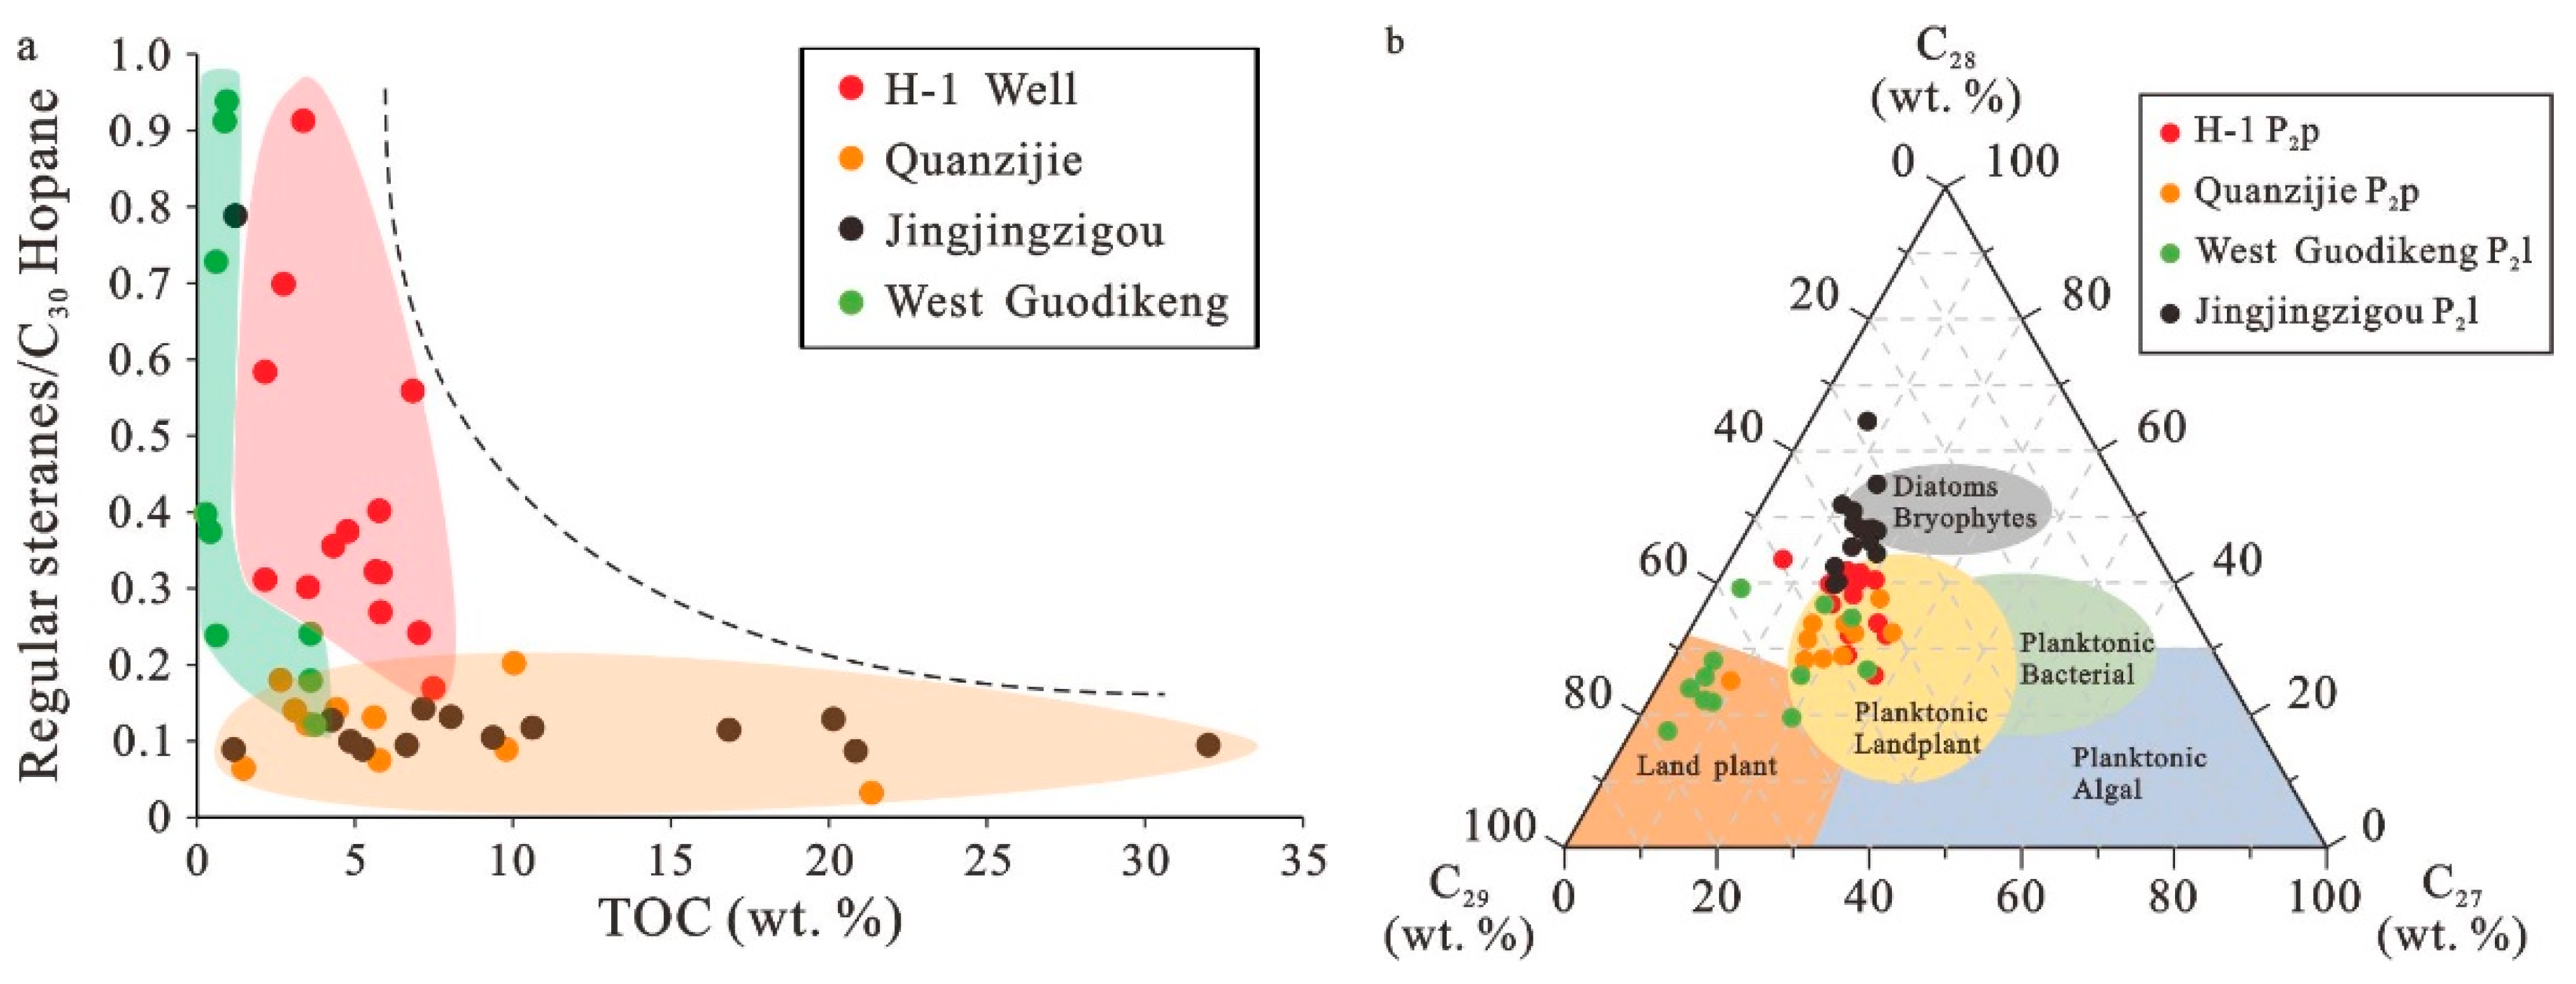
The biomarkers in saturated hydrocarbon fractions are often used to study the sources of organic matter [33,34,35,37]. Hopanes have been proposed to be derived from the cyclization of squalene precursors, which could be biomarkers of bacteria [48,49], and steranes are derived from eukaryotes, likely algae and higher plants [50]. The relative abundances of C30 hopane to regular steranes are shown in Figure 10a. Compared to the H-1 well (NE Bogda) and West Guodikeng outcrop (S Bogda), the contribution of bacteria from Jingjingzigou (W Bogda) was relatively higher, potentially indicating that bacterial reactions consumed the native structure of algae, leading to the accumulation of amorphous organic matter (see Figure 8c). For eukaryotes, the relative abundances of C27, C28, and C29 regular steranes were used to distinguish the aquatic contributions to the organic matter in the sediments from land-derived material [25,51,52,53]. C27 regular steranes have long been considered markers for zooplankton and algae, while C29 steranes are considered markers for land vascular plants [50,54,55,56]. The origin of C28 steranes was proposed to be chlorophyll c-containing phytoplankton, including diatoms, coccolithophores, and dinoflagellates, by Zhang and Sun [26]. The ternary diagram of the relatively regular steranes shows that C29 steranes, followed by ααα20R C28 steranes, were predominant in the sediments sampled in this study (Figure 10b). The source of organic matter in West Guodikeng (S Bogda) was mainly of land vascular plants, which is consistent with the HI data. Multiple inputs from plankton and land plants have been interpreted to form organic-rich sediments in the H-1 well and Quanzijie outcrop; these findings are consistent with the data shown in Figure 6b. On the western side of the Bogda Mountains, the abundance of ααα20R C28 steranes may indicate phytoplankton inputs. However, the absence of any native organic source structure causes it to be difficult to discern the primary input sources. As a result, the organic-rich sediments of Jingjingzigou were thought to be more likely to come from bacterial alteration forming amorphous organic matter.

5.2. Paleoproductivity Study

The abundances of P and Ba in sediments have been proposed as proxies of paleoproductivity [42,44,57,58]. P is a structural element in many enzymes, phospholipids, and other biomolecules, and is regarded as a nutrient element that plays a fundamental role in many metabolic processes [59]. However, under anoxic conditions, phosphorus generally diffuses upward from the sediment and returns to the water column, leading to depleted P in sediments. The correlations of P with the TOC contents in the overall samples are shown in Figure 11a. Positive relationships between P and TOC can be observed in the samples collected from Jingjingzigou outcrops (W Bogda; black dots in Figure 11a). However, the enrichment of P did not occur in the organic-rich samples of the H-1 well and Quanzijie outcrops, even though the 13C-depleted organic carbon isotopic composition indicated vigorous primary productivity (Figure 7; red and orange dots in Figure 11a).
The biogenic barium (Babio) associated with the sinking flux of organic matter has been considered a geochemical proxy of paleoproductivity [44]. Some phytoplankton and zooplankton assimilate Ba intracellularly, leading to the accumulation of Ba along with organic matter in the sediments [60,61]. However, a significant inverse correlation between Babio and TOC occurred in the sediments from the H-1 well (N Bogda), as shown in Figure 11b. The reduction in sulfate in an anoxic environment could lead to barite dissolution and Ba migration through the water column. Both P and Ba failed to show a positive correlation with TOC, while 13C was depleted in organic-rich sediments, potentially indicating that paleoredox also affected the accumulation of these elements in sediments. On the other hand, both P and Ba exhibited positive correlations to TOC in the Jingjingzigou outcrops to different degrees, seeming to indicate that the reduction degree was not intense in the western Bogda area. In summary, the stable carbon isotopic composition suggests that elevated microbial productivity played an important role in organic carbon burial.

5.3. Paleoredox Conditions

To identify the paleoredox conditions of the sediments, the ratios of pristane/phytane (Pr/Ph) were used as paleoredox indicators (Figure 6a,b). Both pristane and phytane have been proposed from the side chain of chlorophyll [34,62]. Under reducing conditions, phytol undergoes dehydroxylation and forms phytane. However, oxic conditions may promote the conversion of phytol to pristane through the oxidation of phytol to phytanic acid, followed by decarboxylation. High Pr/Ph ratios (>3) are indicative of oxic deposition, while low ratios (<1) typify anoxic deposition, which is common in hypersaline or carbonate environments [49]. Around the Bogda Mountains, the Pr/Ph of dark shale (TOC < 4 wt. %) in P2l ranges from 0.5 to 2.0, indicating mild redox conditions during the sedimentation of organic matter. Additionally, it is difficult to clearly study the ways in which the accumulation of organic matter is affected by redox due to the relatively wide redox threshold of Pr/Ph. The U and Mo covariation patterns derived based on redox thresholds were used as a superior proxy in a paleoredox study performed by Algeo and Liu [27].
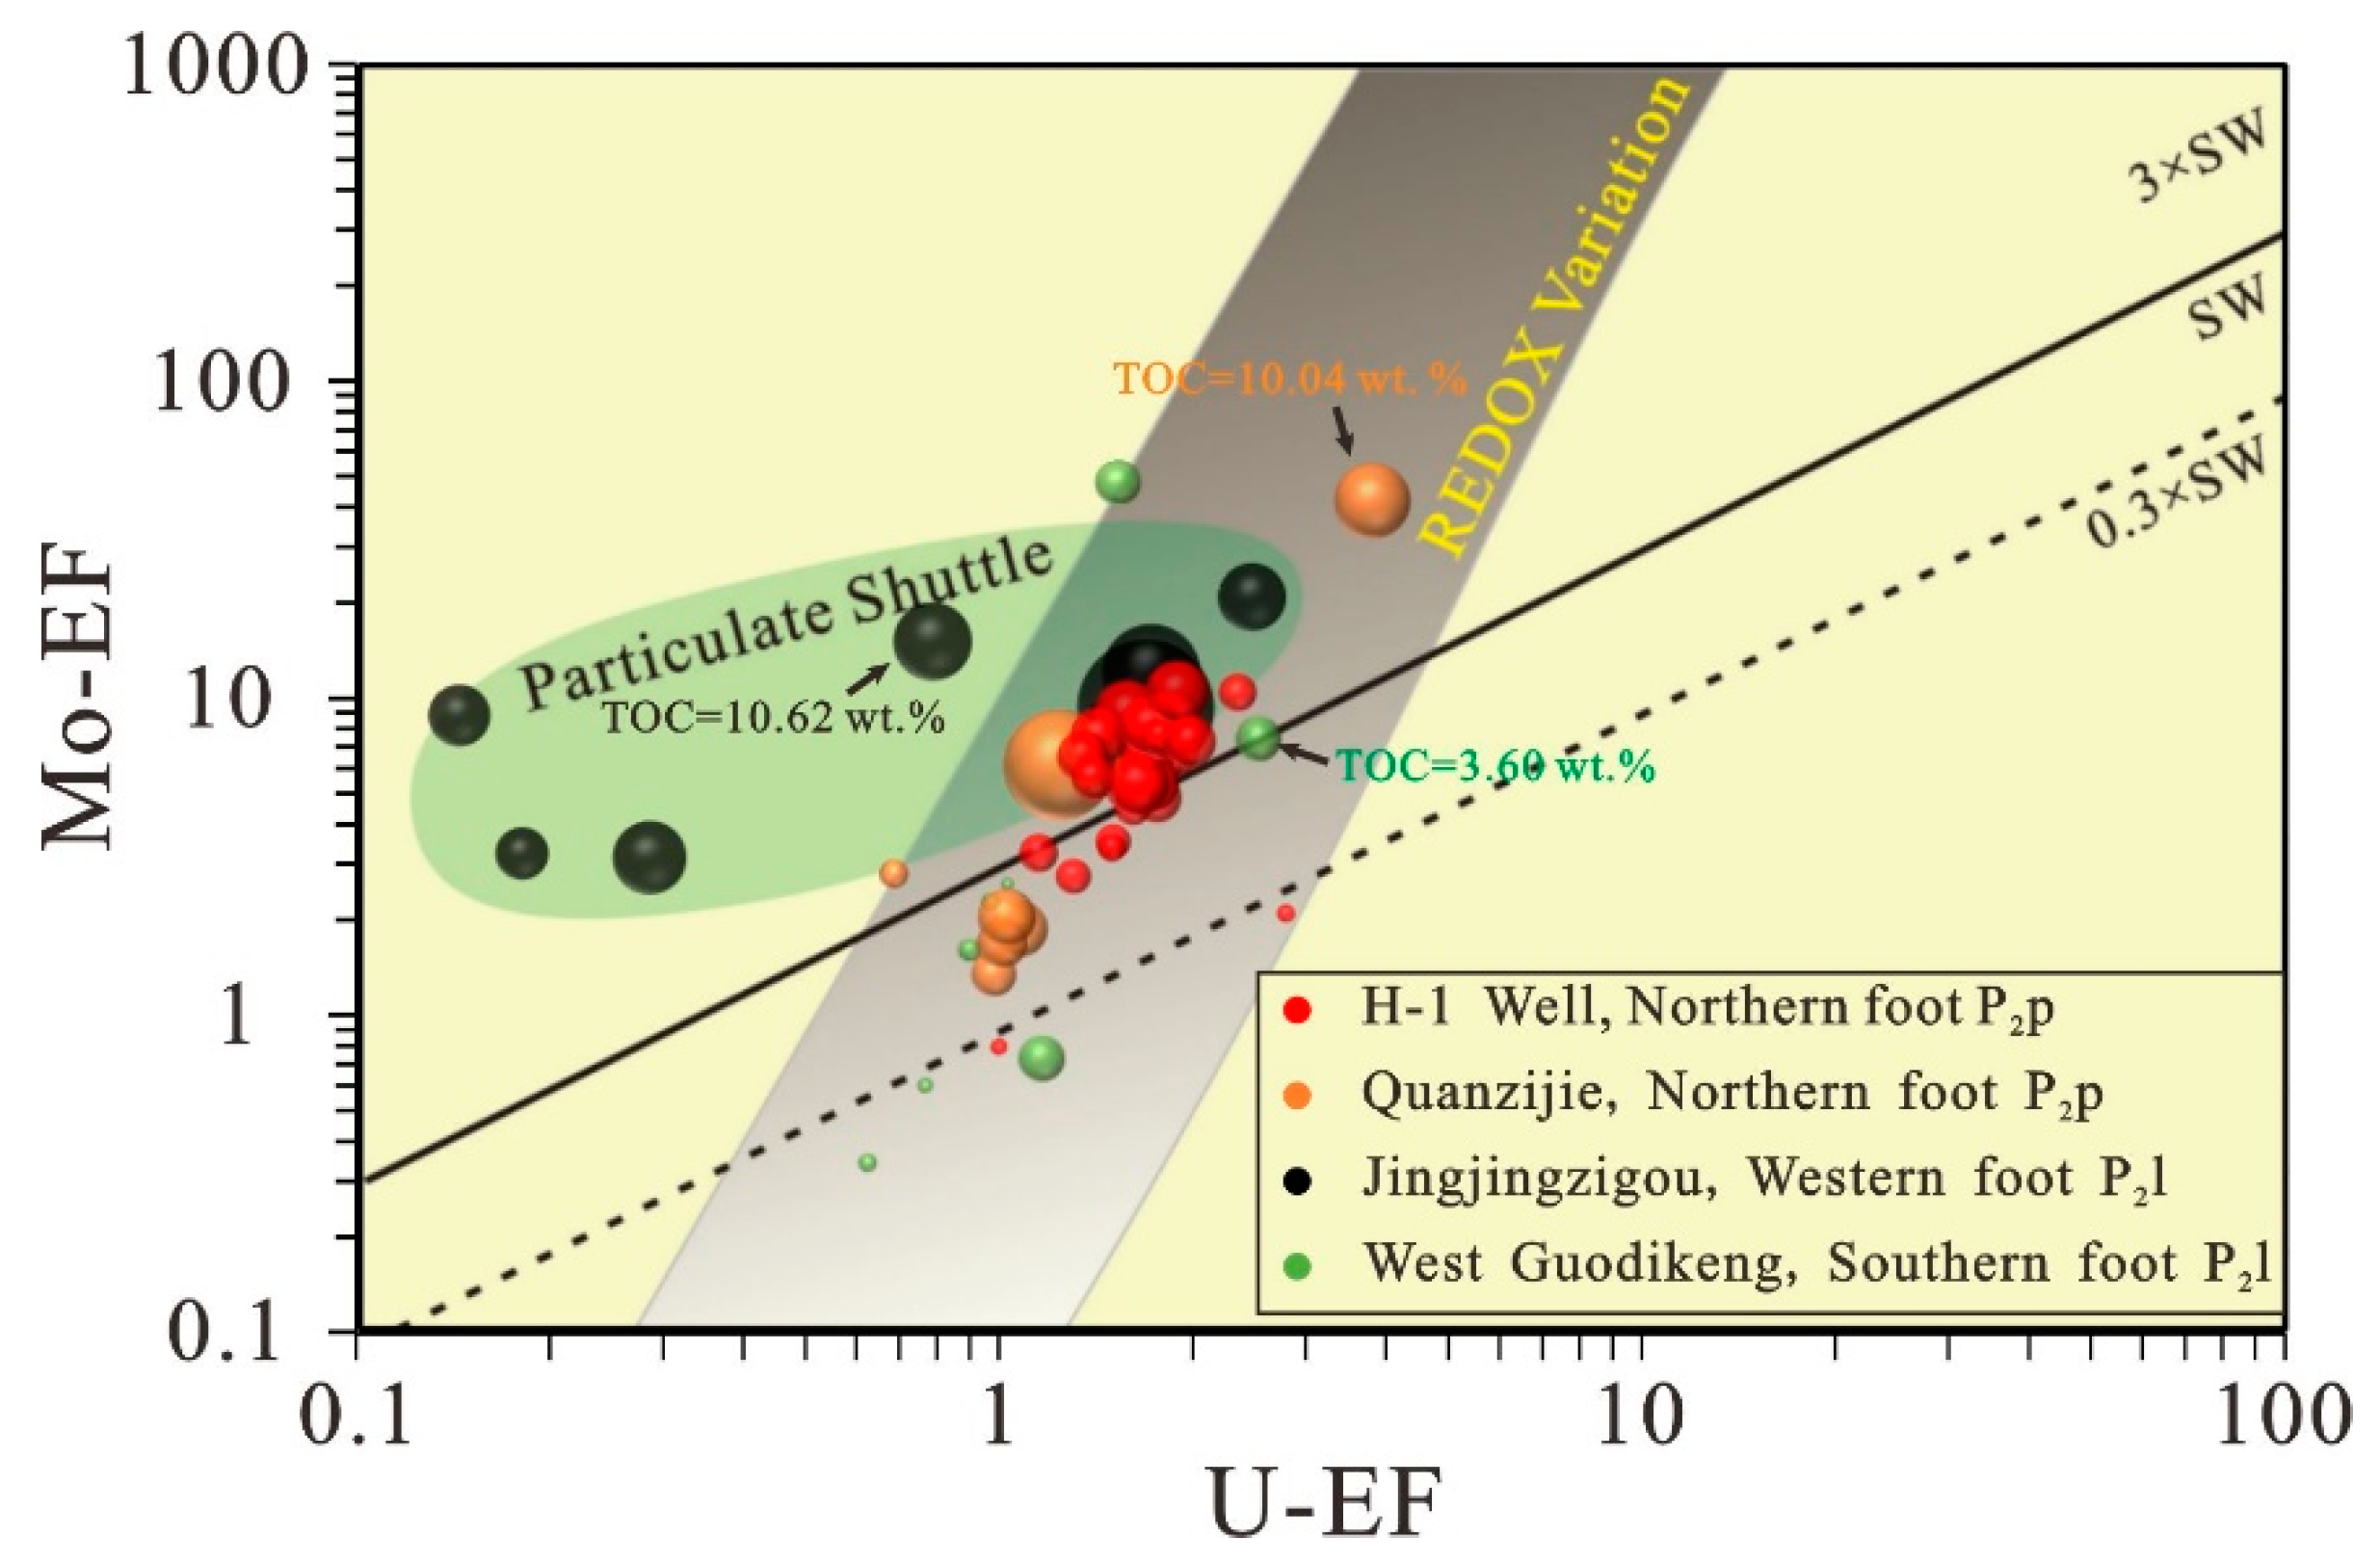
In modern unrestricted marine systems, oxic environments show at most minor enrichments in both U and Mo; modest enrichments of U and Mo with UEF values greater than MoEF always occur in suboxic environments (EFs < 10); and anoxic to euxinic conditions record intense enrichments of Mo and U at relatively high EFs > 10; [63,64]. On the other hand, in terrestrial environments, more reducing water conditions should still promote the enrichment of U and Mo in sediments due to the generality of the redox mechanism associated with U and Mo, so we tried to use this pattern in this study [63]. Two distinct processes of organic matter accumulation are shown in Figure 12. The areal sizes of the points represent the TOC contents. A redox controlling sedimentary of organic matter can be observed in samples from the H-1 well, Quanzijie, and West Guodikeng outcrops (N and S Bogda). Organic matter is richer under more reducing conditions. Most of the organic-rich shales and mudstones were deposited in anoxic environments, with MoEF < 10. On the other hand, the strong enrichment of Mo relative to U was shown in black shales from Jingjingzigou (W Bogda), with MoEF (3.08~20.54) >> UEF (0.18~2.47). This may indicate the efficient transport of aqueous Mo migration to the sediments through the operation of metal-oxyhydroxide particulate shuttles (black dot in Figure 12). As a result, the samples from Jingjingzigou (W Bogda) that are considerably rich in Mo relative to U may indicate a fluctuating depositional system with intermittent episodes of suboxic-anoxic conditions [65]. The paleoredox conditions of different study areas could explain the different relationships between paleoproductivity proxies (P and Ba) and TOC discussed in the previous chapter. Because of the anoxic environment in the northern periphery of the Bogda Mountains, P and Ba do not show a clear positive correlation with TOC, while a covariation can be observed in the western area of the Bogda Mountains with suboxic conditions.

5.4. Paleosalinity

The compositions of tricyclic terpanes, gammacerane index, β-carotane, Sr/Ba, and S/TOC ratios were used to study the paleosalinity of water. However, different geochemical indicators offer different explanations. Tricyclic terpanes are important biomarkers and ubiquitous in source rock extracts and crude oils [66]. Peters et al., 2005 [34], suggested that C19 and C20 tricyclic terpanes (C19 and C20TT) are relatively rich in terrigenous oils, while C23 tricyclic terpane (C23TT) indicates a marine source. Here, a ternary plot of (C19+C20)TT, C21TT, and C23TT was established to distinguish the depositional environments of source rocks [67]. Marine/saline lacustrine, freshwater, fluvial/deltaic, and mire environments can be readily divided (see Figure 13). Most of the samples analyzed in this study fell within the freshwater zone. However, the results would be problematic due to the lack of marine sources in this terrestrial basin. Instead, the ternary diagram is probably more reflective of the source of organic matter and thus may indicate a terrigenous source.
The viabilities of Sr/Ba and S/TOC as elemental proxies for paleosalinity reconstruction have been studied by Wei and Algeo [29]. The solubility of BaSO4 was much less than that of SrSO4, leading to a positive correlation between Sr/Ba and paleosalinity [29,68,69]. The salinity thresholds of Sr/Ba are <0.2 in freshwater, 0.2-0.5 in brackish water, and >0.5 in marine facies. However, a potential issue in using the bulk Sr/Ba value as a paleosalinity proxy of sediments is the alteration of the clay fraction signal by carbonate-hosted Sr. To screen out the influence of carbonate-hosted Sr, the contents of Sr versus CaO were studied as a carbonate proxy, as shown in Figure 14a. A significant positive relationship between Sr and CaO indicates that the influence of carbonate-hosted Sr cannot be ignored when using the bulk Sr/Ba values of the samples in this study. A CaO threshold of 5 wt. % was used to eliminate the samples that probably contained carbonate-hosted Sr [29]. As a result, the Sr/Ba ratios of the H-1 well, Quanzijie, and Jingjingzigou outcrops were mainly of 0.2-0.5 (N and W Bogda), indicating a brackish environment, and those of West Guodikeng in southern Bogda showed a saline lacustrine environment.
S/TOC is another feasible proxy for paleosalinity [29,30]. Aqueous S migrates into sediments and is mainly in the form of sulfide and organic S, driven by microbial sulfate reduction (MSR). Sulfate concentrations vary strongly between freshwater and brine, leading to S/TOC as a salinity proxy effectively discriminating between freshwater and brackish/marine facies [29,30]. The salinity thresholds for S/TOC are <0.1 in freshwater and >0.1 in brackish and marine facies. The relationship of S/TOC and Sr/Ba can be observed in Figure 15a, with the areal sizes of the points representing the TOC contents. As described above, the valid Sr/Ba ratios of the H-1 well, Quanzijie, and Jingjingzigou outcrops ranged from 0.2 to 0.5. For the H-1 well (red point), the positive covariation of Sr/Ba and S/TOC verifies a change in salinity during sedimentation. However, the relatively low S/TOC values observed in other outcrops may result from the maturation by burial diagenesis leading to a net loss of sulfur [70,71]; this process is also supported by the compositions of i-alkanes and n-alkanes shown in Figure 6b.
The relative concentration of gammacerane was used to indicate paleosalinity, with the ratio of gammacerane/C30 hopane (G/C30Hopane) widely applied [34,53,72]. However, due to the lack of research on the threshold values, the use of G/C30Hopane is often empirical. The relationship of G/C30Hopane and TOC is shown in Figure 15b with the data in Table 1. High levels of gammacerane can be detected in the samples from the West Guodikeng outcrop, which is consistent with the Sr/Ba data indicating a saline lacustrine environment. On the northern and western part of the aBogda Mountain, the values of G/C30Hopane in organic rich samples range from 0.1 to 0.2. Although there is a lack of a threshold reported in the previous reference, the relatively low levels of G/C30Hopane compared to the West Guodikeng outcrop may indicate a brackish water, which echoes the results of Sr/Ba. In the study of paleosalinity, it is necessary to verify multiple proxies to avoid any misunderstanding caused by the low robustness of the single indicators.

5.5. Accumulation of Organic Matter in Different Study Areas

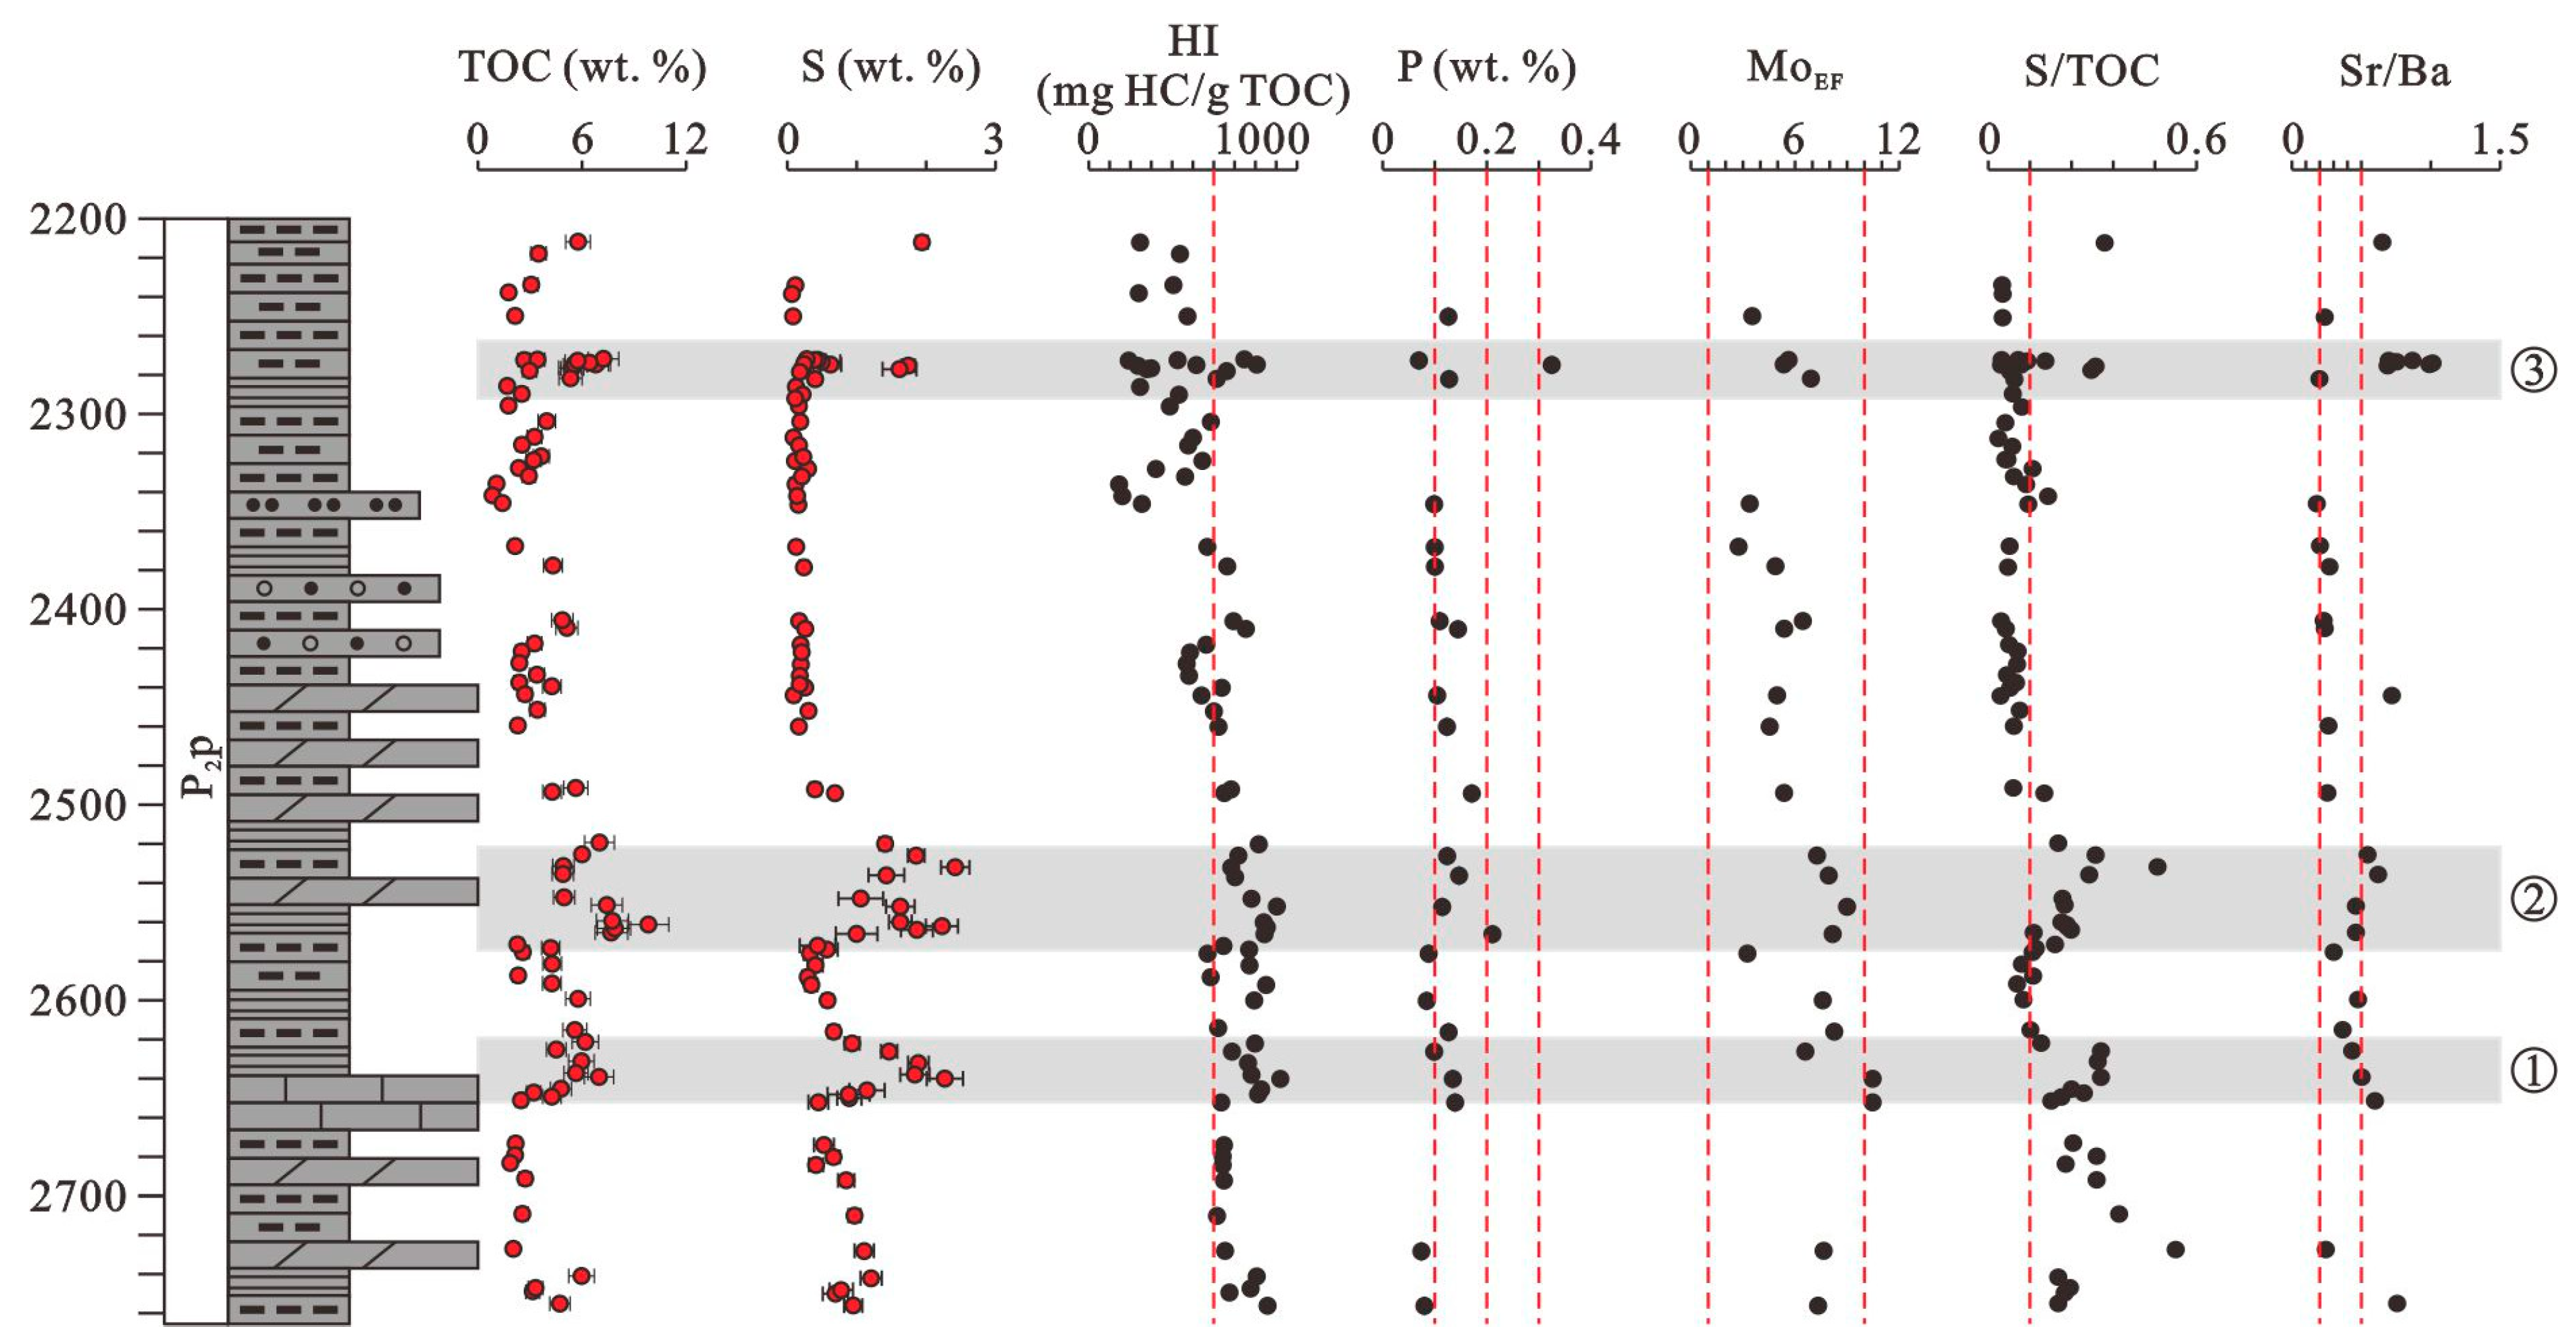
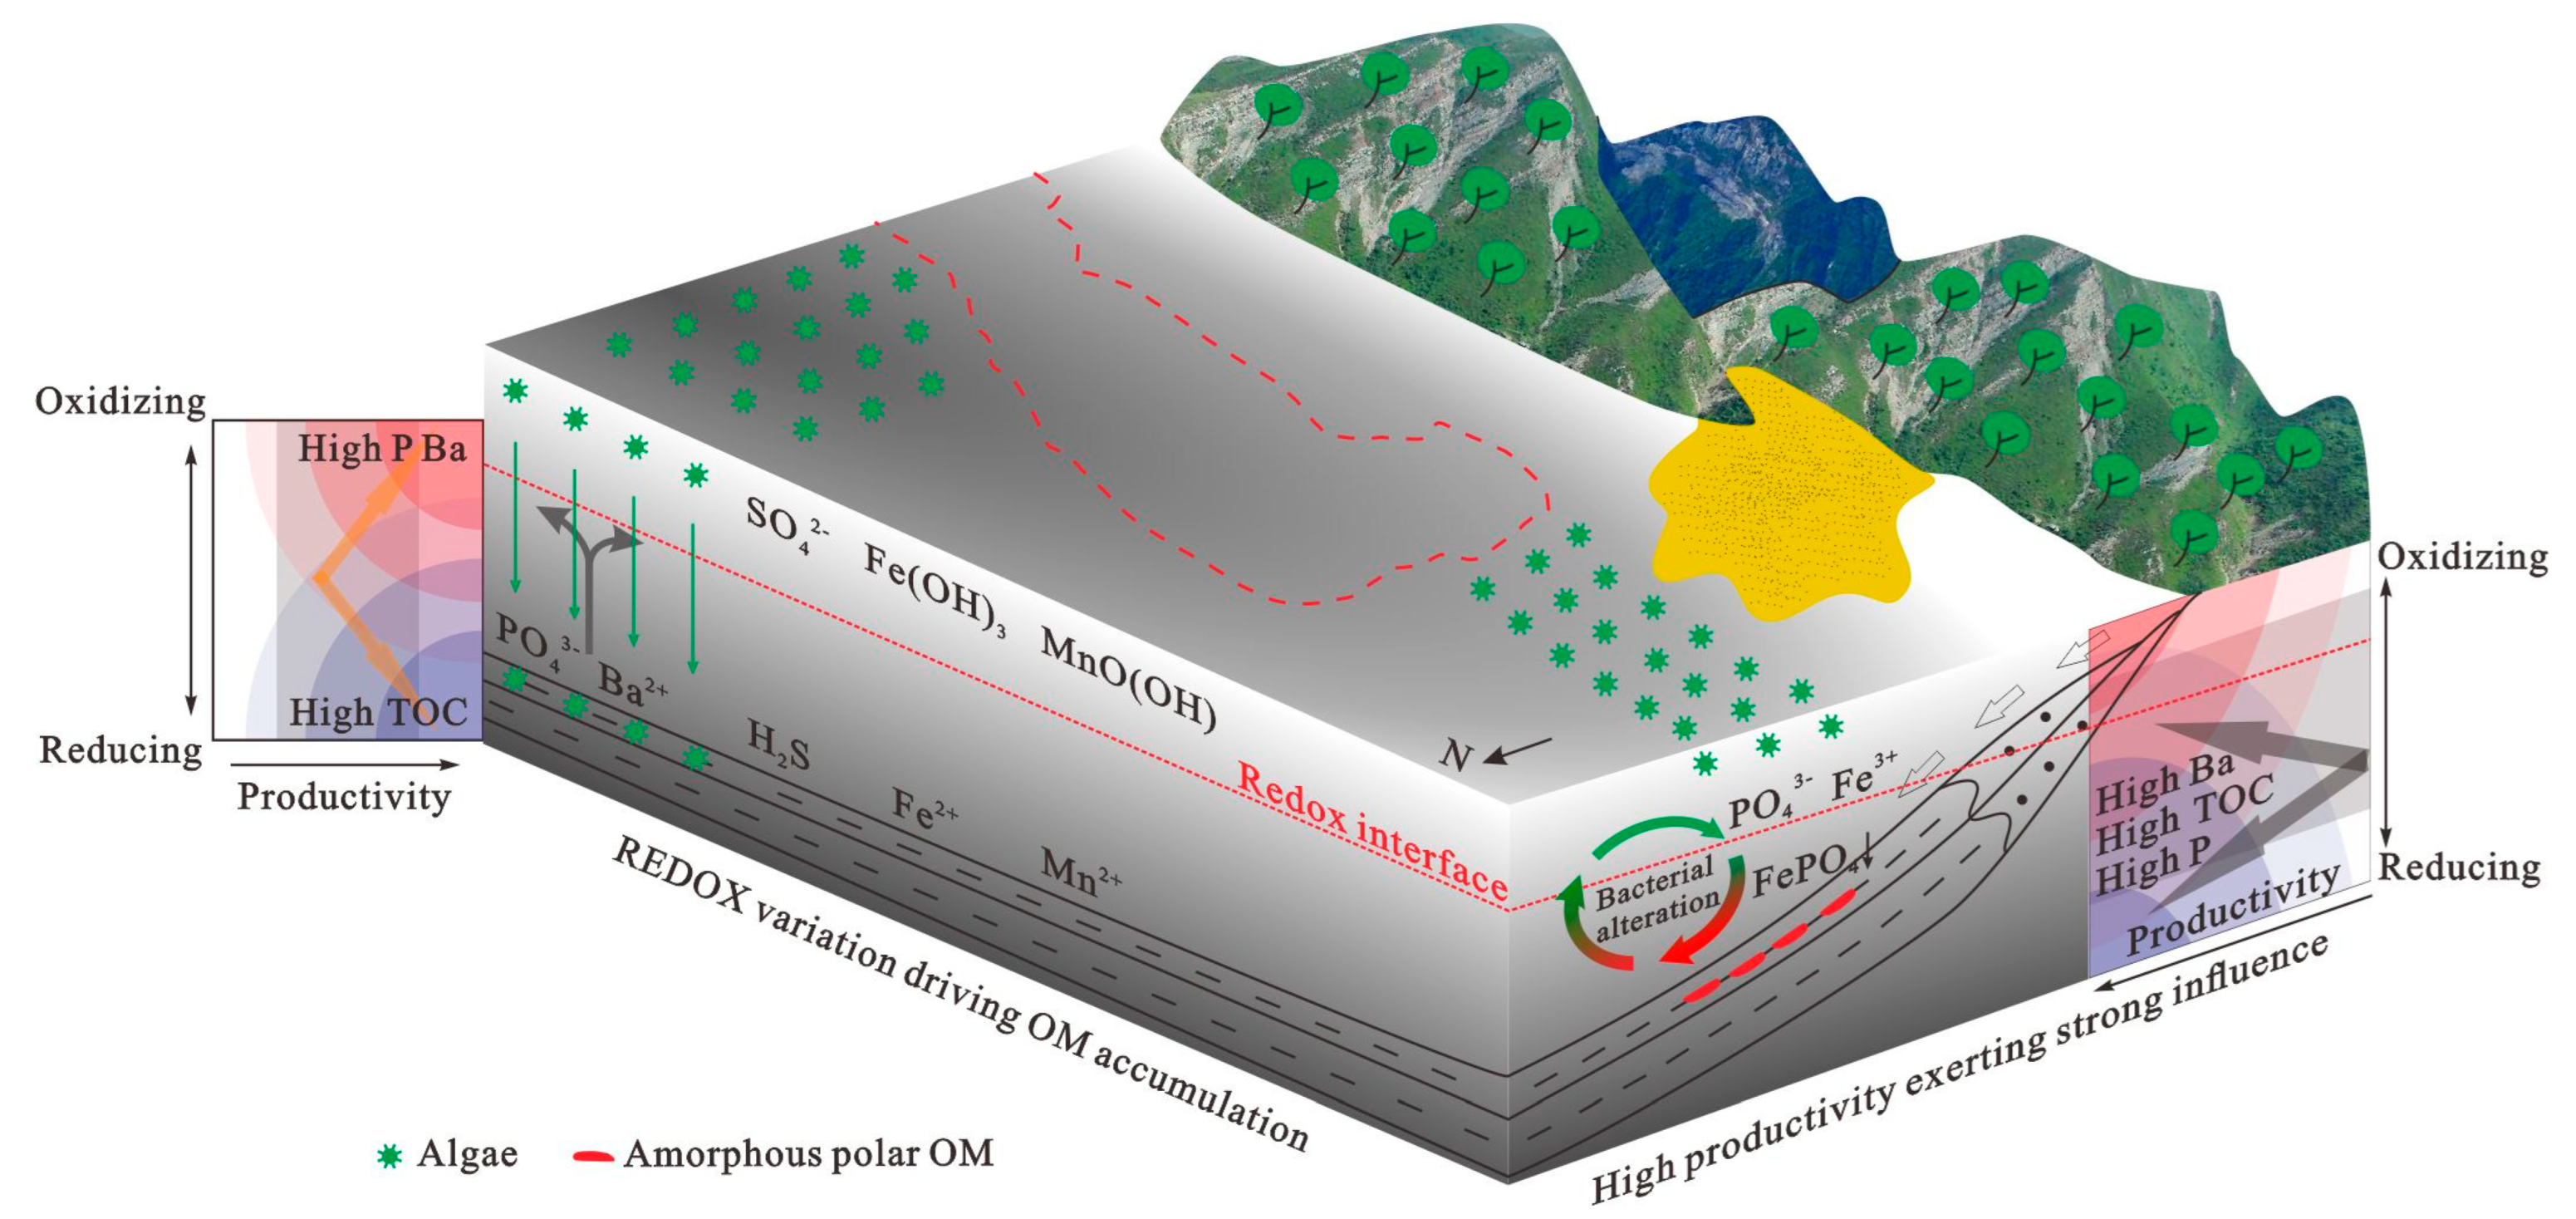
According to the previous discussion, the source of organic matter and paleoredox conditions differed between the H-1 well (N Bogda) and Jingjingzigou outcrop (W Bogda), during middle Permian sedimentation. The geochemical profile of well H-1 is shown in Figure 16. Three organic-rich sedimentary layers can be observed with TOC contents higher than 5 wt. %. Based on Figure 12, the accumulation of organic matter was mainly controlled by the variation in redox conditions. Hydrogen-rich organic matter with high HI values formed in member 1 and member 2 potentially due to better preservation. P and Ba showed an inverse correlation with TOC, indicating an anoxic sedimentary environment, where the reduction in SO42− and hydroxides of Fe3+ and Mn3+ to S2−, Fe2+, and Mn2+ led to the release of P and Ba from the sediments back into the water. In the organic-rich member, the values of both S/TOC and Sr/Ba showed clear, positive relationships to TOC, indicating that an increase in the salinity played a positive role during the accumulation process of organic matter. The relatively hydrostatic, brackish, and stratified anoxic conditions can be outlined in Figure 17. The surface productivity with some original structures could be well preserved during the sinking process, in this less-turbulent water column with stratification.
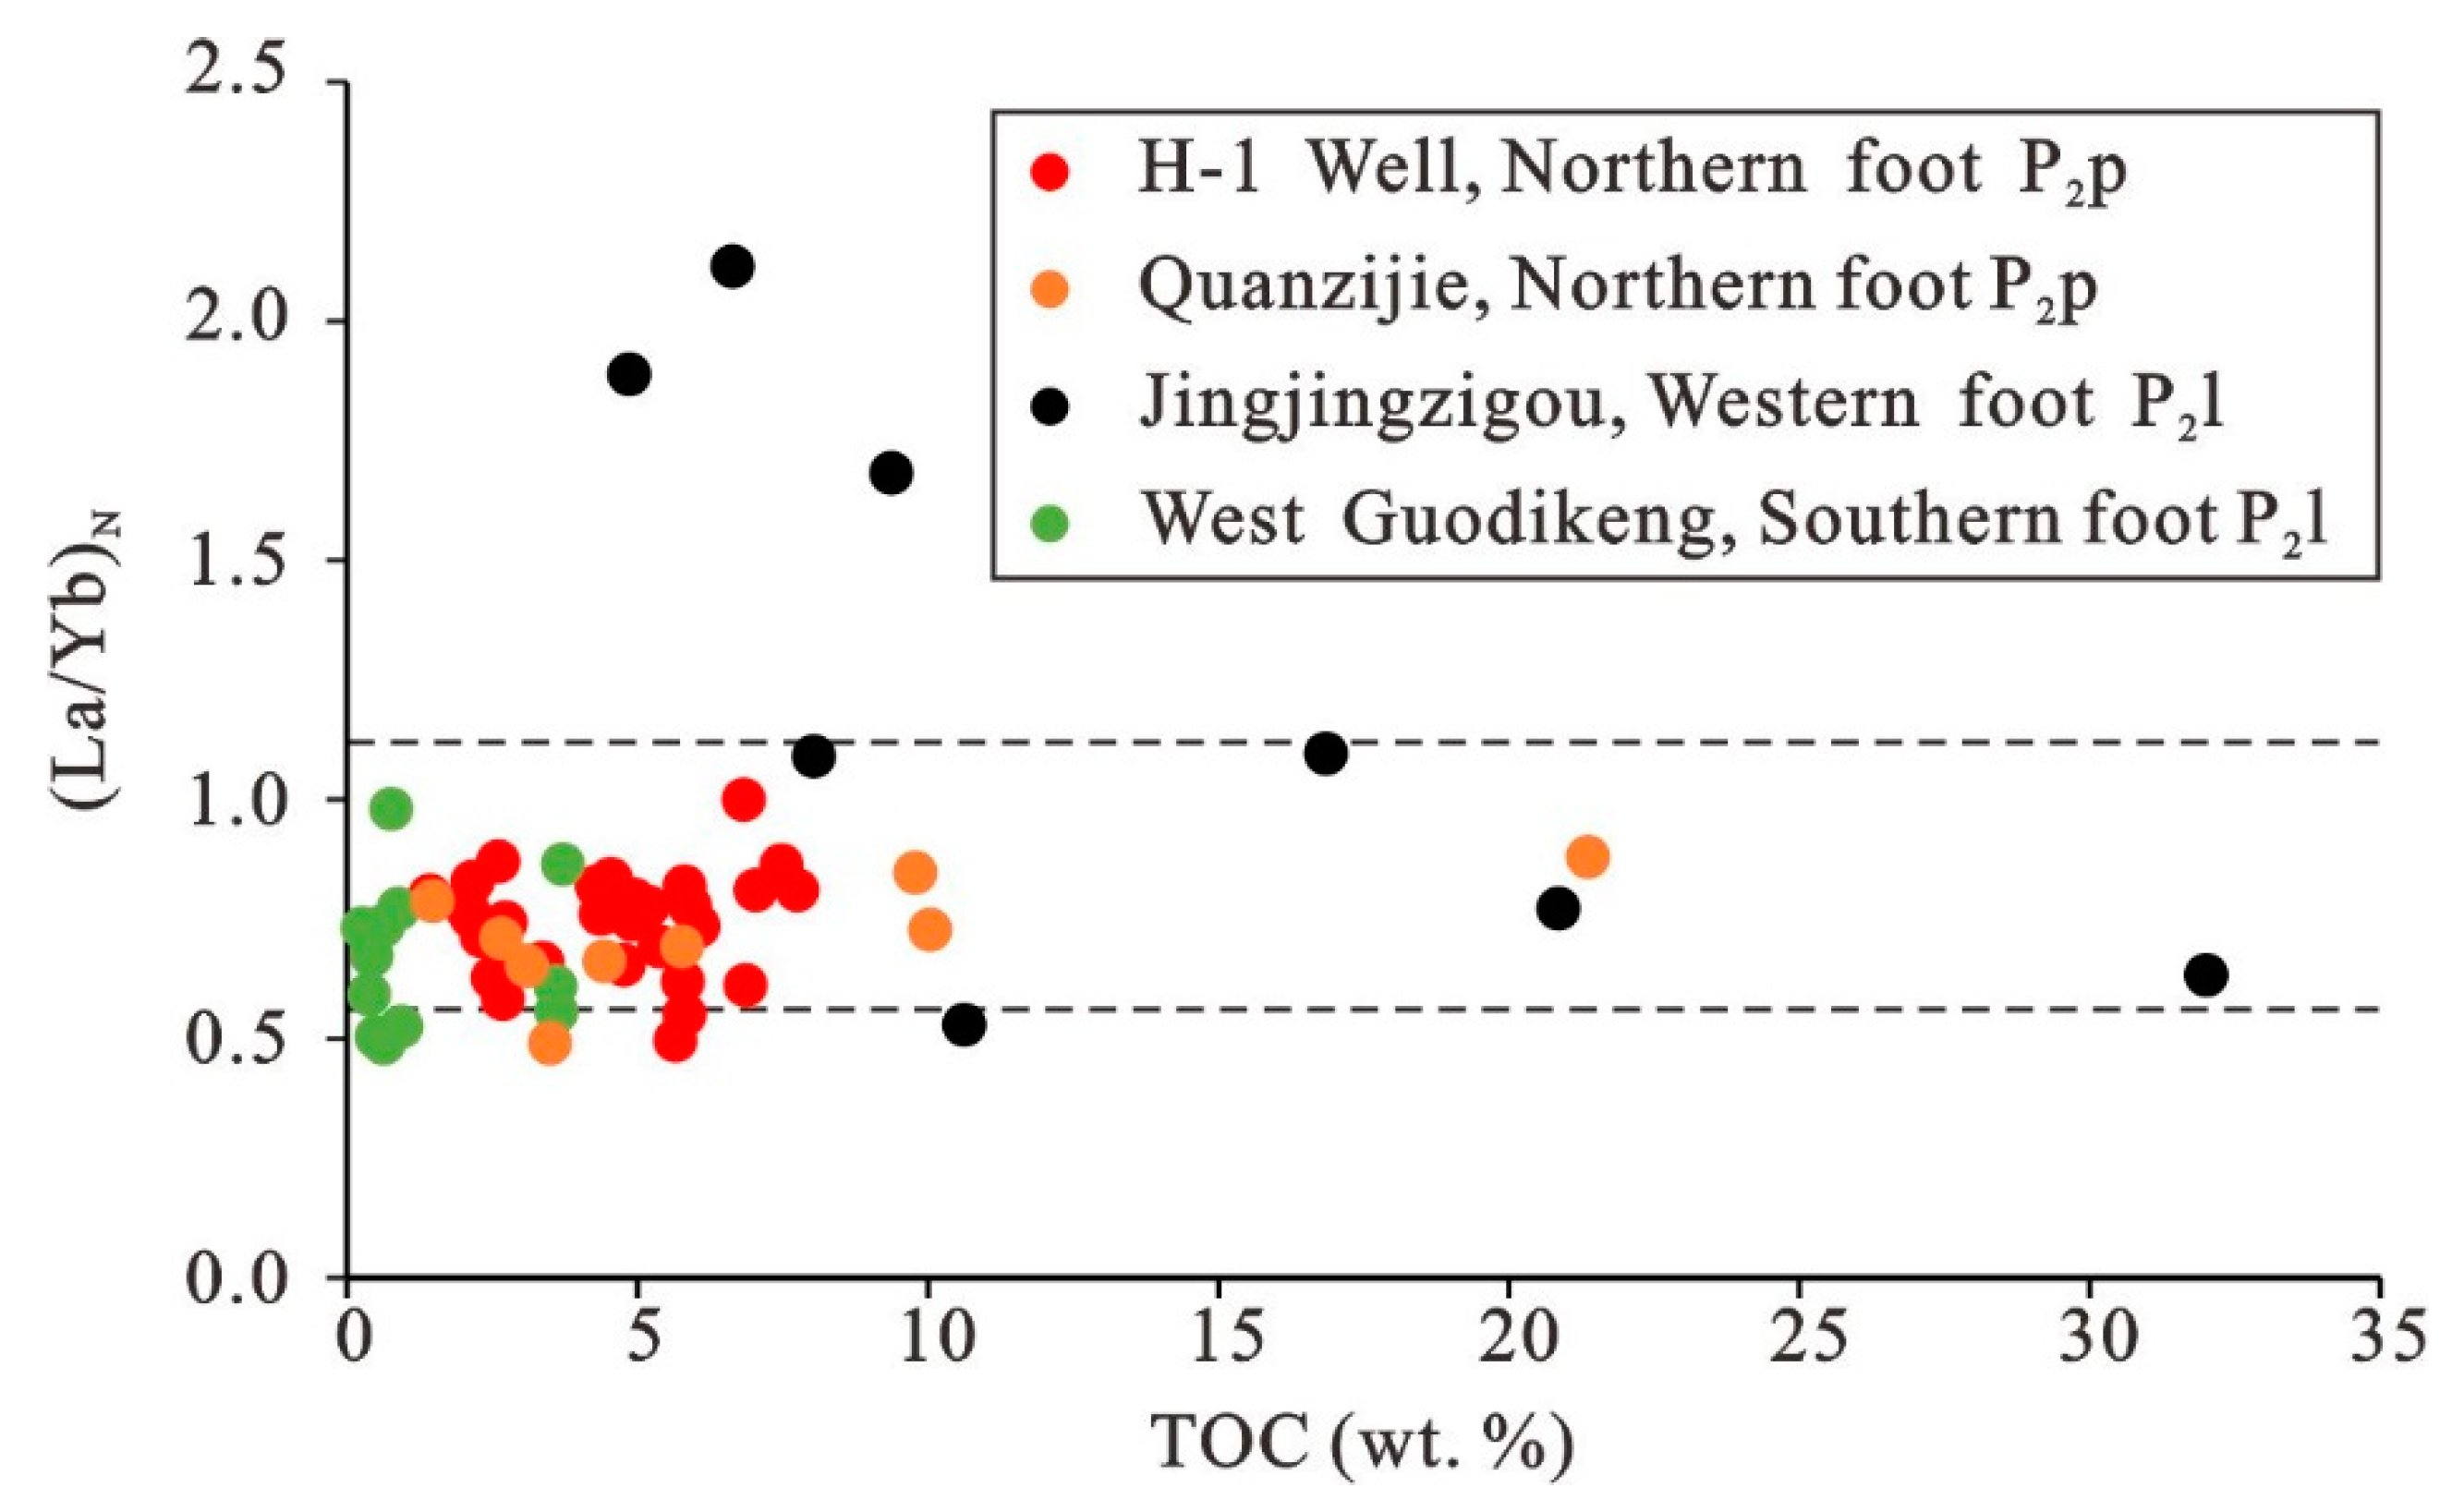
On the western part of the Bogda Mountains, the formation of organic-rich shales followed another mechanism (Figure 17). The enrichment of Mo relative to U in sediments triggered by the Mn-Fe-oxyhydroxide shuttle indicates a suboxic conditions with frequent exchanges of the top and bottom water. The low abundance of gammacerane showed a non-stratification of the water column. This suboxic condition causes it to be difficult to preserve the organic matter well, causing the original structures to be hard to observe in the maceral composition. The relative enrichment of hopanes indicates a vigorous bacterial reaction during the sedimentary of organic matter, followed by the formation of amorphous organic matter rich in polar macromolecules. The accumulation of organic matter in this study area is rigorously driven by strong productivity triggered by nutrient supplementation, as manifested by the enrichment of P. On the other hand, the sedimentation rate played a positive role in the accumulation of organic matter. A long residence time in the water column could result in a large fractionation of light and heavy rare earth elements in sediments [73]. It is noteworthy that an inverse correlation between the (La/Yb)N ratio and TOC can be observed in the sediments of the western Bogda Mountains, potentially indicating that the rapid sedimentation facilitated the preservation of organic matter in these sediments (black dots in Figure 18). Ding and Liu [74] proposed that the sedimentation rate is not linearly related to TOC. The rapid deposition in favor of organic matter accumulation rather than dilution occurs mainly in suboxic environments. In addition, the rapid deposition leads to a mix of aquatic organisms and higher plants being preserved in sediments, leaving structural vitrinite to be observed in the maceral compositions.

6. Conclusions

Organic-rich shales and mudstones are developed in the middle Permian strata of northern and western Bogda Mountains. A relatively hydrostatic, brackish, stratified, anoxic environment is proposed in the northern periphery of the Bogda Mountains. The enrichment of organic matter in the sediments was derived from the good preservation of productivity during the sinking process in the unperturbed water column. The typical features of this preservation model include: (1) the preservation of the original structure of alginite; (2) non-correlations or negative correlations between TOC and elemental proxies (P and Ba); and (3) the presence of brackish or saline water with a stratified water column. The west side of the Bogda Mountains characterized a suboxic environment, with frequent water exchanges between the top and bottom water columns. The accumulation of organic matter was mainly driven by high productivity triggered by supplementation with nutrient elements. Due to the suboxic conditions, the characteristics of the productivity model were: (1) the enrichment of Mo relative to U; (2) a clear positive correlation between TOC and elemental proxies (P and Ba); (3) rapidly deposited inorganic detritus playing a positive role in the accumulation of organic matter rather than dilution; (4) amorphous organic matter (mineral-bitumen groundmasses) being abundant in the maceral compositions; and (5) polar macromolecules being relatively enriched in the soluble organic matter of sediments. Different models of organic matter accumulation led to differences in lithology, granularity, and type of organic matter. An improved understanding of the enrichment of organic matter would contribute to improve research involving petroleum exploration and development.

Author Contributions

Conceptualization, Z.Z. and X.J.; methodology, X.W. and S.Z.; validation, X.J., Y.F. and Z.Z.; formal analysis, Y.F.; investigation, X.L.; resources, X.W.; data curation, S.Z. and W.J.Q.; writing—original draft preparation, X.J.; writing—review and editing, X.J.; visualization, X.J.; supervision, Z.Z. and Y.F.; project administration, Y.F. and Z.Z.; funding acquisition, Y.F. All authors have read and agreed to the published version of the manuscript.

Funding

This research was financially supported by Standardization and Revision of Geological Survey Standards (No. DD20221826), the National Science and Technology Major Project (No. 2017ZX05049-006-001), SINOPEC Shengli Oilfield and China Scholarship Council (No. 201906440182).

Data Availability Statement

Data available on request due to restrictions ethical. The data presented in this study are available on request from the corresponding author.

Acknowledgments

We would like to thank the reviewers for their helpful comments, suggestions, scientific and linguistic revisions of the manuscript. Lei Zhu and Shengbao Shi are thanked for their contribution of sample analyses. We would like to thank the State Key Laboratory of Petroleum Resources and Prospecting for GC-MS analysis and Laboratory of the Beijing Research Institute of Uranium Geology for element analysis.

Conflicts of Interest

The authors declare no conflict of interest.

References

  1. Ghanizadeh, A.; Clarkson, C.; Aquino, S.; Ardakani, O.; Sanei, H. Petrophysical and geomechanical characteristics of Canadian tight oil and liquid-rich gas reservoirs: I. Pore network and permeability characterization. Fuel 2015, 153, 664–681. [Google Scholar] [CrossRef]
  2. Curtis, J.B. Fractured shale-gas systems. AAPG Bull. 2002, 86, 1921–1938. [Google Scholar] [CrossRef]
  3. Luo, Q.; Gong, L.; Qu, Y.; Zhang, K.; Zhang, G.; Wang, S. The tight oil potential of the Lucaogou Formation from the southern Junggar Basin, China. Fuel 2018, 234, 858–871. [Google Scholar] [CrossRef]
  4. Cao, L.; Zhang, Z.; Li, H.; Zhong, N.; Xiao, L.; Jin, X.; Li, H. Mechanism for the enrichment of organic matter in the Liushagang Formation of the Weixinan Sag, Beibuwan Basin, China. Mar. Pet. Geol. 2020, 122, 104649. [Google Scholar] [CrossRef]
  5. Liu, B.; Bechtel, A.; Sachsenhofer, R.F.; Gross, D.; Gratzer, R.; Chen, X. Depositional environment of oil shale within the second member of Permian Lucaogou Formation in the Santanghu Basin, Northwest China. Int. J. Coal Geol. 2017, 175, 10–25. [Google Scholar] [CrossRef]
  6. Liu, B.; Song, Y.; Zhu, K.; Su, P.; Ye, X.; Zhao, W. Mineralogy and element geochemistry of salinized lacustrine organic-rich shale in the Middle Permian Santanghu Basin: Implications for paleoenvironment, provenance, tectonic setting and shale oil potential. Mar. Pet. Geol. 2020, 120, 104569. [Google Scholar] [CrossRef]
  7. Burton, Z.F.M.; Moldowan, J.M.; Magoon, L.B.; Sykes, R.; Graham, S.A. Interpretation of source rock depositional environment and age from seep oil, east coast of New Zealand. Int. J. Earth Sci. 2019, 108, 1079–1091. [Google Scholar] [CrossRef]
  8. Dow, W.G. Kerogen studies and geological interpretations. J. Geochem. Explor. 1977, 7, 79–99. [Google Scholar] [CrossRef]
  9. Hutton, A.; Kantsler, A.; Cook, A.; McKirdy, D. Organic matter in oil shales. APPEA J. 1980, 20, 44–67. [Google Scholar] [CrossRef]
  10. Schulz, H.-M.; Yang, S.; Schovsbo, N.H.; Rybacki, E.; Ghanizadeh, A.; Bernard, S.; Mahlstedt, N.; Krüger, M.; Amann-Hildebrandt, A.; Krooss, B.M.; et al. The Furongian to Lower Ordovician Alum Shale Formation in conventional and unconventional petroleum systems in the Baltic Basin—A review. Earth-Science Rev. 2021, 218, 103674. [Google Scholar] [CrossRef]
  11. Slatt, R.M. Important geological properties of unconventional resource shales. Open Geosci. 2011, 3, 435–448. [Google Scholar] [CrossRef] [Green Version]
  12. Vandenbroucke, M.; Largeau, C. Kerogen origin, evolution and structure. Org. Geochem. 2007, 38, 719–833. [Google Scholar] [CrossRef]
  13. Liu, S.; Gao, G.; Jun, J.; Misch, D.; Xinsong, W.; Gang, W.; Wang, M.; Baoli, X.; Wanyun, M. Mechanism of differential enrichment of shale oils in the upper and lower members of the Lucaogou Formation in the Jimusaer Sag, Junggar Basin. Mar. Pet. Geol. 2022, 142, 105747. [Google Scholar] [CrossRef]
  14. Liu, B.; Bechtel, A.; Gross, D.; Fu, X.; Li, X.; Sachsenhofer, R.F. Middle Permian environmental changes and shale oil potential evidenced by high-resolution organic petrology, geochemistry and mineral composition of the sediments in the Santanghu Basin, Northwest China. Int. J. Coal Geol. 2017, 185, 119–137. [Google Scholar] [CrossRef]
  15. Nesbitt, H.W.; Young, G.M. Early Proterozoic climates and plate motions inferred from major element chemistry of lutites. Nature 1982, 299, 715–717. [Google Scholar] [CrossRef]
  16. Yang, Y.; Zhang, J.; Zhang, J.; Gao, Y.; Zhou, X.; Sun, X.; Wen, L.; Miao, M. Sedimentary characteristics and main controlling factors of the Middle-Upper Permian and Middle-Upper Triassic around Bogda Mountain of Xinjiang, NW China. Pet. Explor. Dev. 2022, 49, 770–784. [Google Scholar] [CrossRef]
  17. Zhang, M.; Li, Z. Thermal maturity of the Permian Lucaogou Formation organic-rich shale at the northern foot of Bogda Mountains, Junggar Basin (NW China): Effective assessments from organic geochemistry. Fuel 2018, 211, 278–290. [Google Scholar] [CrossRef]
  18. Wang, Z.; Pan, J.; Hou, Q.; Yu, B.; Li, M.; Niu, Q. Anisotropic characteristics of low-rank coal fractures in the Fukang mining area, China. Fuel 2017, 211, 182–193. [Google Scholar] [CrossRef]
  19. Hu, T.; Pang, X.; Jiang, S.; Wang, Q.; Zheng, X.; Ding, X.; Zhao, Y.; Zhu, C.; Li, H. Oil content evaluation of lacustrine organic-rich shale with strong heterogeneity: A case study of the Middle Permian Lucaogou Formation in Jimusaer Sag, Junggar Basin, NW China. Fuel 2018, 221, 196–205. [Google Scholar] [CrossRef]
  20. Liu, D.; Fan, Q.; Zhang, C.; Gao, Y.; Du, W.; Song, Y.; Zhang, Z.; Luo, Q.; Jiang, Z.; Huang, Z. Paleoenvironment evolution of the Permian Lucaogou Formation in the southern Junggar Basin, NW China. Palaeogeogr. Palaeoclim. Palaeoecol. 2022, 603, 111198. [Google Scholar] [CrossRef]
  21. Meng, Z.; Liu, Y.; Jiao, X.; Ma, L.; Zhou, D.; Li, H.; Cao, Q.; Zhao, M.; Yang, Y. Petrological and organic geochemical characteristics of the Permian Lucaogou Formation in the Jimsar Sag, Junggar Basin, NW China: Implications on the relationship between hydrocarbon accumulation and volcanic-hydrothermal activities. J. Pet. Sci. Eng. 2021, 210, 110078. [Google Scholar] [CrossRef]
  22. Liu, Y.; Zeng, J.; Jin, J.; Yang, G.; Xiang, B.; Zhou, N.; Ma, W.; Qiao, J.; Li, S.; Liu, S. Geochemical evaluation of produced petroleum from the Middle Permian Lucaogou reservoirs Junggar Basin and its implication for the unconventional shale oil play. J. Pet. Sci. Eng. 2022, 211, 110202. [Google Scholar] [CrossRef]
  23. Jones, B.; Manning, D.A. Comparison of geochemical indices used for the interpretation of palaeoredox conditions in ancient mudstones. Chem. Geol. 1994, 111, 111–129. [Google Scholar] [CrossRef]
  24. Damsté, J.S.S.; Kenig, F.; Koopmans, M.P.; Köster, J.; Schouten, S.; Hayes, J.; de Leeuw, J.W. Evidence for gammacerane as an indicator of water column stratification. Geochim. et Cosmochim. Acta 1995, 59, 1895–1900. [Google Scholar] [CrossRef] [Green Version]
  25. Meyers, P.A. Organic geochemical proxies of paleoceanographic, paleolimnologic, and paleoclimatic processes. Org. Geochem. 1997, 27, 213–250. [Google Scholar] [CrossRef]
  26. Zhang, Y.; Sun, Y.; Chen, J. Stable carbon isotope evidence for the origin of C28 steranes in lacustrine source rocks from the Qikou Sag, Bohai Bay Basin, Eastern China. Org. Geochem. 2020, 145, 104028. [Google Scholar] [CrossRef]
  27. Algeo, T.J.; Liu, J. A re-assessment of elemental proxies for paleoredox analysis. Chem. Geol. 2020, 540, 119549. [Google Scholar] [CrossRef]
  28. Cao, L.; Zhang, Z.; Zhao, J.; Jin, X.; Li, H.; Li, J.; Wei, X. Discussion on the applicability of Th/U ratio for evaluating the paleoredox conditions of lacustrine basins. Int. J. Coal Geol. 2021, 248, 103868. [Google Scholar] [CrossRef]
  29. Wei, W.; Algeo, T.J. Elemental proxies for paleosalinity analysis of ancient shales and mudrocks. Geochim. et Cosmochim. Acta 2019, 287, 341–366. [Google Scholar] [CrossRef]
  30. Wei, W.; Algeo, T.J.; Lu, Y.; Lu, Y.; Liu, H.; Zhang, S.; Peng, L.; Zhang, J.; Chen, L. Identifying marine incursions into the Paleogene Bohai Bay Basin lake system in northeastern China. Int. J. Coal Geol. 2018, 200, 1–17. [Google Scholar] [CrossRef]
  31. Tang, W.; Zhang, Z.; Li, J.; Li, K.; Chen, Y.; Guo, Z. Late Paleozoic to Jurassic tectonic evolution of the Bogda area (northwest China): Evidence from detrital zircon U–Pb geochronology. Tectonophysics 2014, 626, 144–156. [Google Scholar] [CrossRef]
  32. Shi, Y.; Ji, H.; Yu, J.; Xiang, P.; Yang, Z.; Liu, D. Provenance and sedimentary evolution from the Middle Permian to Early Triassic around the Bogda Mountain, NW China: A tectonic inversion responding to the consolidation of Pangea. Mar. Pet. Geol. 2020, 114, 104169. [Google Scholar] [CrossRef]
  33. Peters, K.; Moldowan, J.; Schoell, M.; Hempkins, W. Petroleum isotopic and biomarker composition related to source rock organic matter and depositional environment. Org. Geochem. 1986, 10, 17–27. [Google Scholar] [CrossRef]
  34. Peters, K.E.; Peters, K.E.; Walters, C.C.; Moldowan, J.M. The Biomarker Guide; Cambridge University Press: Cambridge, UK, 2005; Volume 1. [Google Scholar]
  35. Hanson, A.D.; Ritts, B.D.; Zinniker, D.; Moldowan, J.M.; Biffi, U. Upper Oligocene lacustrine source rocks and petroleum systems of the northern Qaidam basin, northwest China. AAPG Bull. 2001, 85, 601–619. [Google Scholar]
  36. Burton, Z.F.M.; Moldowan, J.M.; Sykes, R.; Graham, S.A. Unraveling Petroleum Degradation, Maturity, and Mixing and Addressing Impact on Petroleum Prospectivity: Insights from Frontier Exploration Regions in New Zealand. Energy Fuels 2018, 32, 1287–1296. [Google Scholar] [CrossRef]
  37. Yurchenko, I.A.; Moldowan, J.M.; Peters, K.E.; Magoon, L.B.; Graham, S.A. The role of calcareous and shaly source rocks in the composition of petroleum expelled from the Triassic Shublik Formation, Alaska North Slope. Org. Geochem. 2018, 122, 52–67. [Google Scholar] [CrossRef]
  38. Algeo, T.J.; Li, C. Redox classification and calibration of redox thresholds in sedimentary systems. Geochim. Cosmochim. Acta 2020, 287, 8–26. [Google Scholar] [CrossRef]
  39. Liu, D.; Jolivet, M.; Yang, W.; Zhang, Z.; Cheng, F.; Zhu, B.; Guo, Z. Latest Paleozoic–Early Mesozoic basin–range interactions in South Tian Shan (northwest China) and their tectonic significance: Constraints from detrital zircon U–Pb ages. Tectonophysics 2013, 599, 197–213. [Google Scholar] [CrossRef]
  40. Fang, S.H.; Guo, Z.J.; Song, Y.; Wu, C.D.; Zhang, Z.C.; Wang, M.N.; Fan, R.D. Sedimentary facies evolution and basin pattern of the Jurassic in southern margin area of Junggar Basin. J. Palaeogeogr 2005, 7, 347–356. [Google Scholar]
  41. Taylor, S.R.; McLennan, S.M. An Examination of the Geochemical Record Preserved in Sedimentary Rocks. In The Continental Crust: Its Composition and Evolution; Blackwell Scientific Publications: Oxford, UK, 1985; p. 312. [Google Scholar]
  42. Tribovillard, N.; Algeo, T.J.; Lyons, T.; Riboulleau, A. Trace metals as paleoredox and paleoproductivity proxies: An update. Chem. Geol. 2006, 232, 12–32. [Google Scholar] [CrossRef]
  43. McLennan, S.M. Relationships between the trace element composition of sedimentary rocks and upper continental crust. Geochem. Geophys. Geosystems 2001, 2, 2000GC000109. [Google Scholar] [CrossRef]
  44. Schoepfer, S.D.; Shen, J.; Wei, H.; Tyson, R.V.; Ingall, E.; Algeo, T.J. Total organic carbon, organic phosphorus, and biogenic barium fluxes as proxies for paleomarine productivity. Earth-Sci. Rev. 2014, 149, 23–52. [Google Scholar] [CrossRef]
  45. ASTM, D2797; Standard Practice for Preparing Coal Samples for Microscopical Analysis by Reflected Light. ASTM International: West Conshohocken, PA, USA, 2011.
  46. Zhang, J.; Liu, G.; Cao, Z.; Tao, S.; Felix, M.; Kong, Y.; Zhang, Y. Characteristics and formation mechanism of multi-source mixed sedimentary rocks in a saline lake, a case study of the Permian Lucaogou Formation in the Jimusaer Sag, northwest China. Mar. Pet. Geol. 2019, 102, 704–724. [Google Scholar] [CrossRef]
  47. Cao, Z.; Liu, G.; Zhan, H.; Gao, J.; Zhang, J.; Li, C.; Xiang, B. Geological roles of the siltstones in tight oil play. Mar. Pet. Geol. 2017, 83, 333–344. [Google Scholar] [CrossRef]
  48. Moldowan, J.; Fago, F.J.; Carlson, R.M.; Young, D.C.; Duvne, G.A.; Clardy, J.; Schoell, M.; Pillinger, C.T.; Watt, D.S. Rearranged hopanes in sediments and petroleum. Geochim. et Cosmochim. Acta 1991, 55, 3333–3353. [Google Scholar] [CrossRef]
  49. Peters, K.E.; Peters, K.E.; Walters, C.C.; Moldowan, J.M. Biomarkers and Isotopes in Petroleum Systems and Earth History. In The Biomarker Guide; Cambridge University Press: Cambridge, UK, 2007; Volume 2. [Google Scholar]
  50. Volkman, J.K. A review of sterol markers for marine and terrigenous organic matter. Org. Geochem. 1986, 9, 83–99. [Google Scholar] [CrossRef]
  51. Xu, H.; George, S.C.; Hou, D. Algal-derived polycyclic aromatic hydrocarbons in Paleogene lacustrine sediments from the Dongying Depression, Bohai Bay Basin, China. Mar. Pet. Geol. 2019, 102, 402–425. [Google Scholar] [CrossRef]
  52. Huang, W.-Y.; Meinschein, W. Sterols as ecological indicators. Geochim. Cosmochim. Acta 1979, 43, 739–745. [Google Scholar] [CrossRef]
  53. Moldowan, J.M.; Seifert, W.K.; Gallegos, E.J. Relationship between petroleum composition and depositional environment of petroleum source rock. AAPG Bull. 1985, 69, 1255–1268. [Google Scholar]
  54. Sepúlveda, J.; Wendler, J.; Leider, A.; Kuss, H.-J.; Summons, R.E.; Hinrichs, K.-U. Molecular isotopic evidence of environmental and ecological changes across the Cenomanian–Turonian boundary in the Levant Platform of central Jordan. Org. Geochem. 2009, 40, 553–568. [Google Scholar] [CrossRef]
  55. Grantham, P. The occurence of unusual C27 and C29 sterane predominances in two types of Oman crude oil. Org. Geochem. 1986, 9, 1–10. [Google Scholar] [CrossRef]
  56. Rielley, G.; Collier, R.J.; Jones, D.M.; Eglinton, G. The biogeochemistry of Ellesmere Lake, U.K.—I: Source correlation of leaf wax inputs to the sedimentary lipid record. Org. Geochem. 1991, 17, 901–912. [Google Scholar] [CrossRef]
  57. Algeo, T.J.; Henderson, C.M.; Tong, J.; Feng, Q.; Yin, H.; Tyson, R.V. Plankton and productivity during the Permian–Triassic boundary crisis: An analysis of organic carbon fluxes. Glob. Planet. Chang. 2012, 105, 52–67. [Google Scholar] [CrossRef]
  58. Bostick, B.C.; Fendorf, S.; Helz, G.R. Differential Adsorption of Molybdate and Tetrathiomolybdate on Pyrite (FeS2). Environ. Sci. Technol. 2002, 37, 285–291. [Google Scholar] [CrossRef] [PubMed]
  59. Tyrrell, T. The relative influences of nitrogen and phosphorus on oceanic primary production. Nature 1999, 400, 525–531. [Google Scholar] [CrossRef]
  60. González-Muñoz, M.T.; Martinez-Ruiz, F.; Morcillo, F.; Martin-Ramos, J.; Paytan, A. Precipitation of barite by marine bacteria: A possible mechanism for marine barite formation. Geology 2012, 40, 675–678. [Google Scholar] [CrossRef]
  61. Rieder, N.; Ott, H.A.; Pfundstein, P.; Schoch, R. X-ray Microanalysis of the Mineral Contents of Some Protozoa. J. Protozool. 1982, 29, 15–18. [Google Scholar] [CrossRef]
  62. Brooks, J.D.; Gould, K.; Smith, J.W. Isoprenoid Hydrocarbons in Coal and Petroleum. Nature 1969, 222, 257–259. [Google Scholar] [CrossRef]
  63. Tribovillard, N.; Algeo, T.; Baudin, F.; Riboulleau, A. Analysis of marine environmental conditions based onmolybdenum–uranium covariation—Applications to Mesozoic paleoceanography. Chem. Geol. 2012, 324, 46–58. [Google Scholar] [CrossRef]
  64. Algeo, T.; Tribovillard, N. Environmental analysis of paleoceanographic systems based on molybdenum–uranium covariation. Chem. Geol. 2009, 268, 211–225. [Google Scholar] [CrossRef]
  65. Ai, J.; Zhong, N.; Zhang, T.; Zhang, Y.; Wang, T.; George, S.C. Oceanic water chemistry evolution and its implications for post-glacial black shale formation: Insights from the Cryogenian Datangpo Formation, South China. Chem. Geol. 2021, 566, 120083. [Google Scholar] [CrossRef]
  66. Tao, S.; Wang, C.; Du, J.; Liu, L.; Chen, Z. Geochemical application of tricyclic and tetracyclic terpanes biomarkers in crude oils of NW China. Mar. Pet. Geol. 2015, 67, 460–467. [Google Scholar] [CrossRef]
  67. Fu, J.; Zhang, Z.; Chen, C.; Wang, T.-G.; Li, M.; Ali, S.; Lu, X.; Dai, J. Geochemistry and origins of petroleum in the Neogene reservoirs of the Baiyun Sag, Pearl River Mouth Basin. Mar. Pet. Geol. 2019, 107, 127–141. [Google Scholar] [CrossRef]
  68. Jaraula, C.M.B.; Siringan, F.P.; Klingel, R.; Sato, H.; Yokoyama, Y. Records and causes of Holocene salinity shifts in Laguna de Bay, Philippines. Quat. Int. 2014, 349, 207–220. [Google Scholar] [CrossRef]
  69. Wang, A.; Wang, Z.; Liu, J.; Xu, N.; Li, H. The Sr/Ba ratio response to salinity in clastic sediments of the Yangtze River Delta. Chem. Geol. 2020, 559, 119923. [Google Scholar] [CrossRef]
  70. Ho, T.Y.; Rogers, M.A.; Drushel, H.V.; Koons, C.B. Evolution of Sulfur Compounds in Crude Oils. AAPG Bull. 1974, 58, 2338–2348. [Google Scholar]
  71. Jin, X.; Wu, J.; Fang, P.; Zhang, Z.; Li, M.; Zhong, N. Kinetics and fate of organosulphur compounds during the metagenesis stage of thermal maturation: Hydrous pyrolysis investigations on dibenzothiophene. Mar. Pet. Geol. 2021, 130, 105129. [Google Scholar] [CrossRef]
  72. Jin, X.; Zhang, Z.; Wu, J.; Zhang, C.; He, Y.; Cao, L.; Zheng, R.; Meng, W.; Xia, H. Origin and geochemical implication of relatively high abundance of 17α (H)-diahopane in Yabulai basin, northwest China. Mar. Pet. Geol. 2019, 99, 429–442. [Google Scholar] [CrossRef]
  73. Elderfield, H.; Greaves, M.J. The rare earth elements in seawater. Nature 1982, 296, 214–219. [Google Scholar] [CrossRef]
  74. Ding, X.; Liu, G.; Zha, M.; Huang, Z.; Gao, C.; Lu, X.; Sun, M.; Chen, Z.; Liuzhuang, X. Relationship between total organic carbon content and sedimentation rate in ancient lacustrine sediments, a case study of Erlian basin, northern China. J. Geochem. Explor. 2015, 149, 22–29. [Google Scholar] [CrossRef]
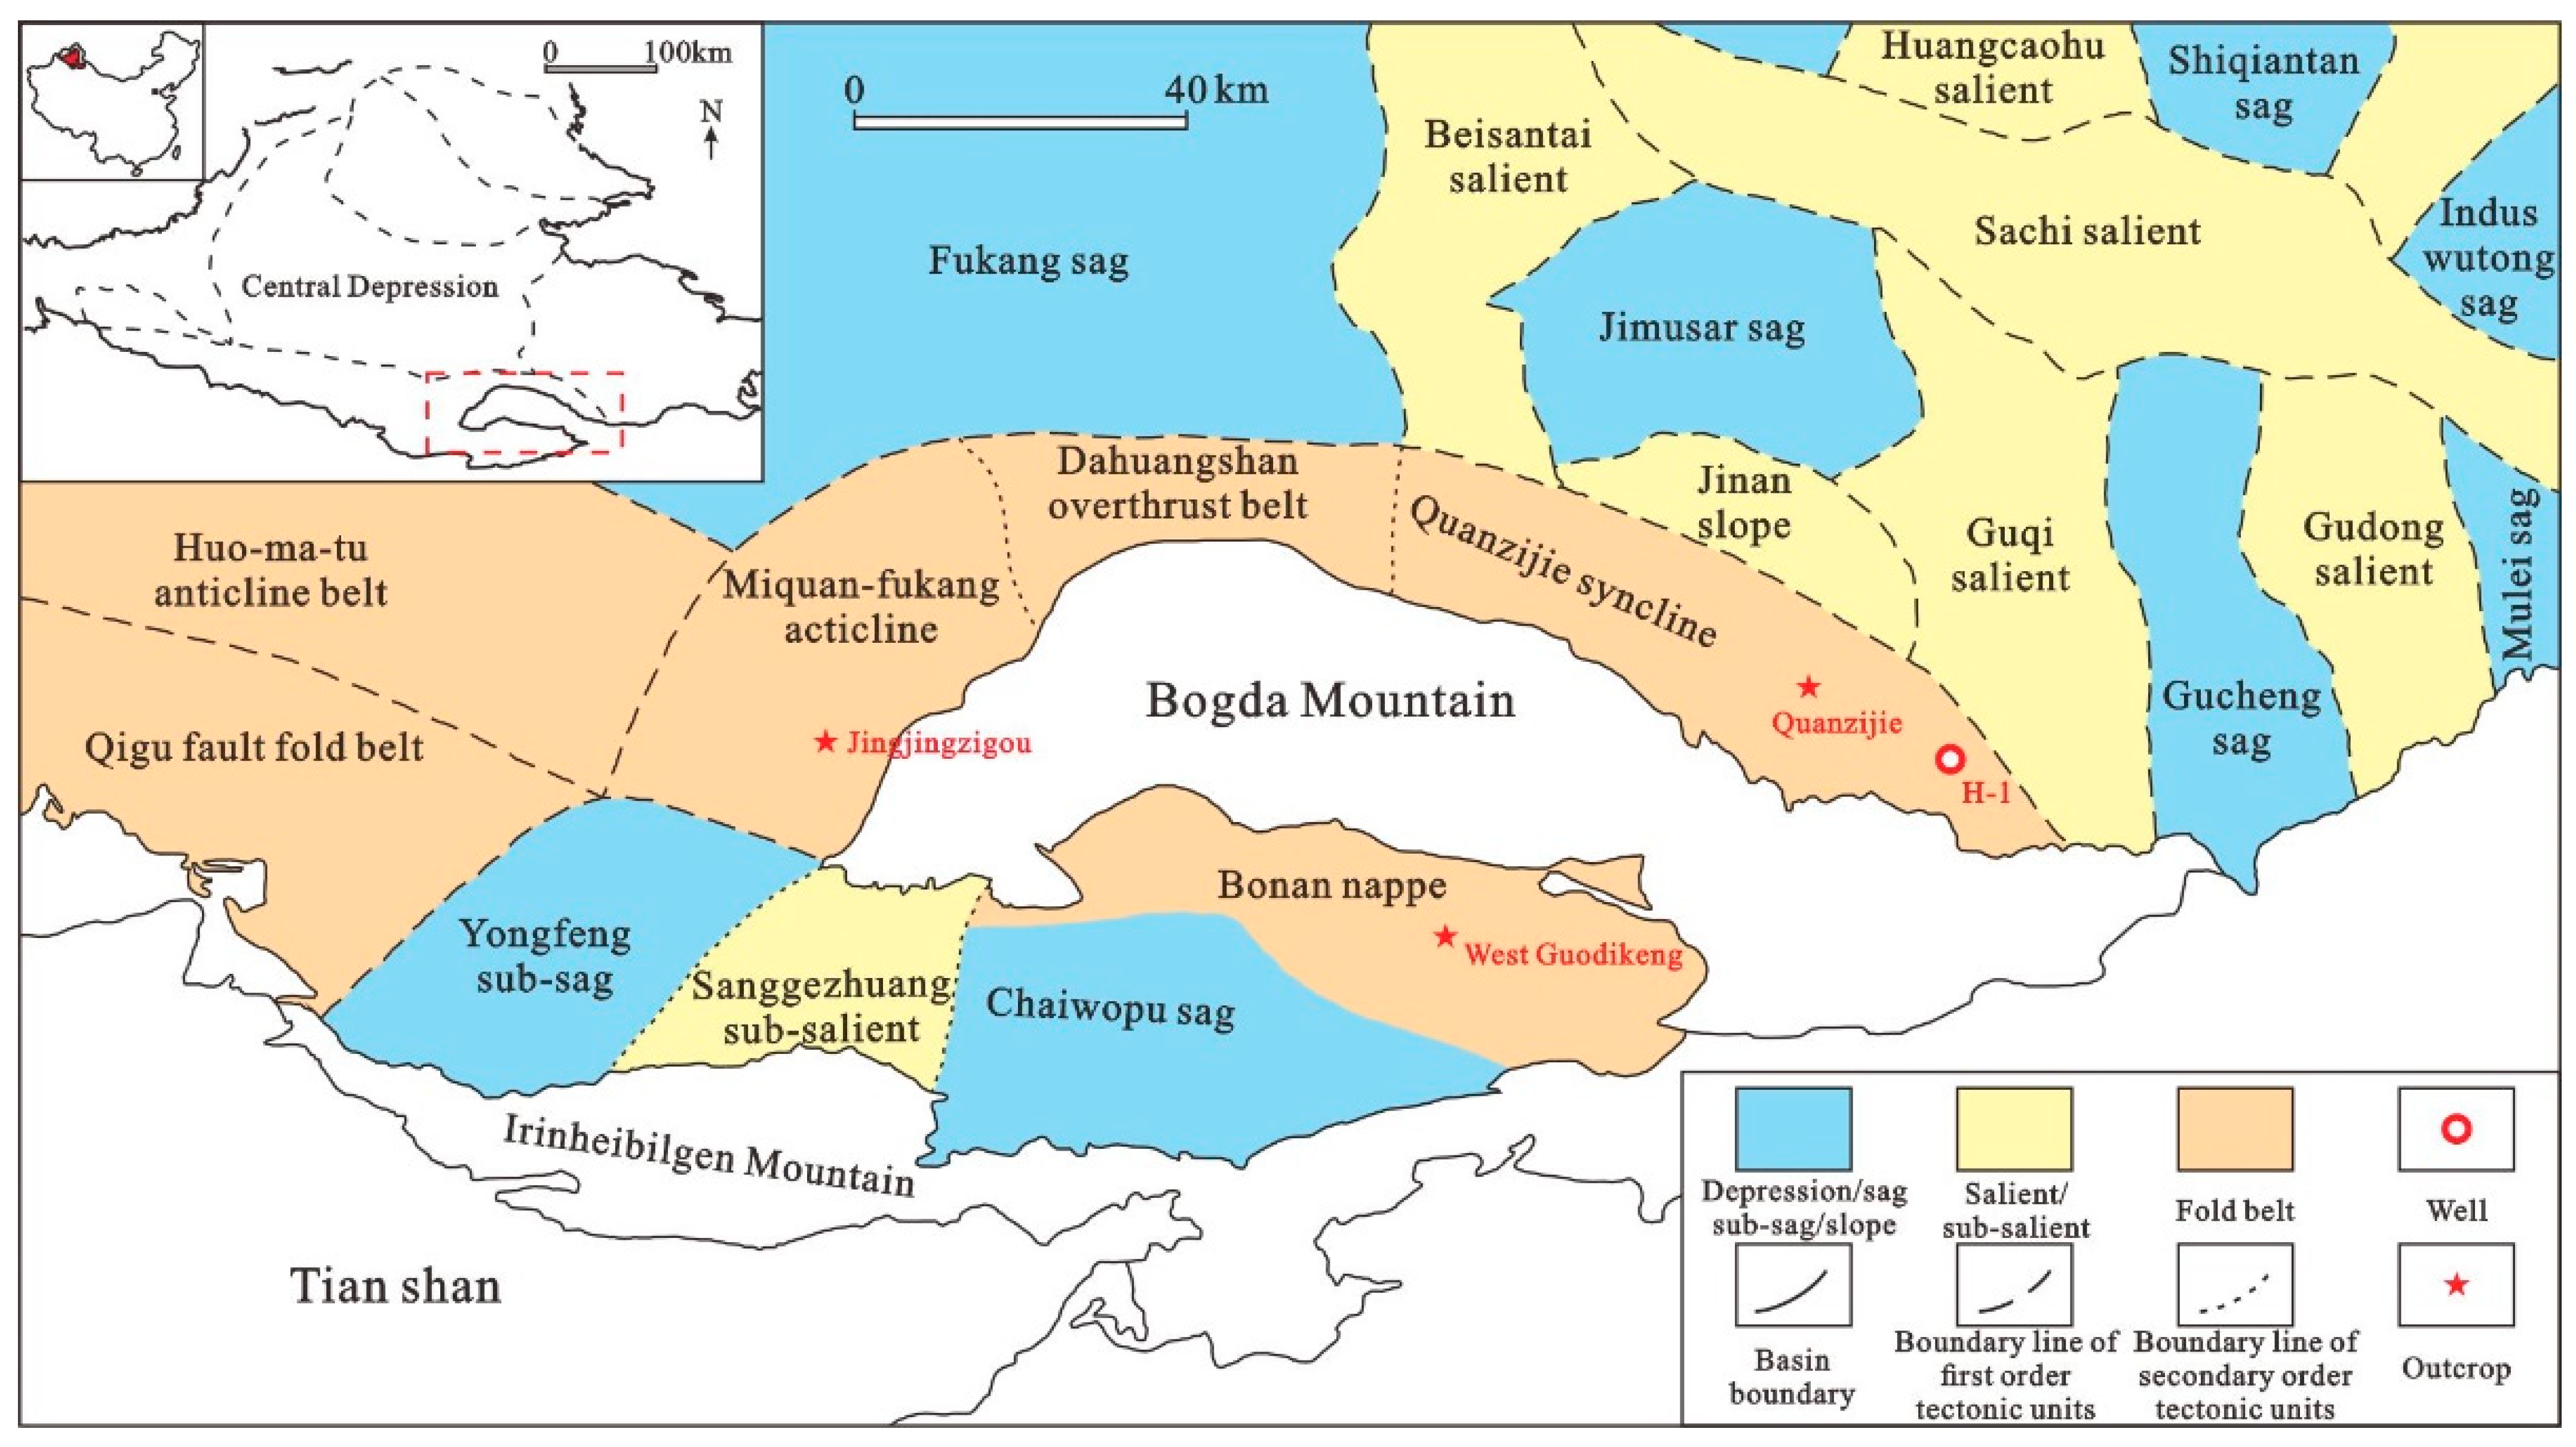
Figure 1. Map showing the location of outcrops and wells around Bogda Mountain in the Junggar Basin, northwestern China [16].
Minerals 13 00332 g001
Figure 2. Stratigraphic and lithological columns of Permian sediments around the Bogda Mountains (abbreviations in parentheses).
Minerals 13 00332 g002
Figure 3. Cross-section showing the stratigraphy, lithologic columns, sedimentary cycles, and abundance of organic matter in the Middle Permian around Bogda Mountain. Note: TOC = Total Organic Content; HI = Hydrogen Index.
Minerals 13 00332 g003
Figure 4. Positive relationship between TOC and hydrogen index (HI) in different study regions around the Bogda Mountain.
Minerals 13 00332 g004
Figure 5. Mass chromatograms (TIC, m/z 191, m/z 125, and m/z 217) showing the distributions of hopanes, steranes, and β-carotanes of sediments in Lucaogou Formation around Bogda Mountain. Note: TIC = Total ion chromatogram; Pr = Pristane; Ph = Phytane; and G = Gammacerane.
Minerals 13 00332 g005
Figure 6. Pristane, Phytane, and n-alkanes are used to study the source input and paleoredox of organic rich sediments in the Lucaogou Formation around the Bogda Mountain [34]. (a): Relationship between Pr/Ph and TOC; (b): Relationship between Pr/n-C17 and Ph/n-C18.
Minerals 13 00332 g006
Figure 7. Relationship between TOC and stable carbon isotopic composition. The areal size of points is the abundance of P.
Minerals 13 00332 g007
Figure 8. Photomicrographs showing macerals in organic rich sediments from Quanzijie outcrop and Jingjingzigou outcrop. (a) Structural alginite under fluorescent light in Q-6 (HI = 643 mg HC/g TOC); sample from Quanzijie outcrops, northern Bogda Mountain. (b) Same field as (a) under reflected light; clastic vitrinite and inertinite dispersed among minerals. (c) Mineral-bituminous groundmasses under fluorescent light in J-11; sample from Jingjingzigou outcrops, western Bogda Mountain. (d) Same field as (d) under reflected light; structural vitrinite and inertinite detected in sediments.
Minerals 13 00332 g008
Figure 9. Ternary diagram showing the group components of soluble organic matter from sediments of P2l and P2p.
Minerals 13 00332 g009
Figure 10. Biomarker compositions for the study of organic matter source. (a) Relationship between regular steranes/C30 hopane and TOC; (b) Ternary diagram showing the relative abundance of C27, C28 and C29 ααα20R regular steranes. The fields in the sterane diagram are from Xu et al. [47].
Minerals 13 00332 g010
Figure 11. Relationship between paleoproductivity proxies and TOC in shales and mudstones collected from P2l and P2p. P is proportional to TOC in western Bogda Mountain, while there is an inverse correlation between Babio and TOC. (a): Relationship between P and TOC; (b): Relationship between Babio and TOC.
Minerals 13 00332 g011
Figure 12. General patterns of UEF and MoEF covariation in modern marine environments were used to assess the paleoredox of samples from Lucaogou Formation [63]. The area size of points shows TOC.
Minerals 13 00332 g012
Figure 13. Ternary diagram showing the relative abundance of C19+20TT, C21TT, and C23TT. Based on early published: Zone1 is Marine/salt water lacustrine; Zone2 is Fresh water lacustrine; Zone3 is Coaly source rock; and Zone4 is Fluvial/deltaic [67]; TT = Tricyclic terpane.
Minerals 13 00332 g013
Figure 14. Sr/Ba ratios for the study of paleo-salinity. (a) Sr versus CaO, CaO used as a proxy of carbonate content; (b) Application of a CaO cutoff of 5% as the threshold of valid Sr/Ba.
Minerals 13 00332 g014
Figure 15. Geochemical proxies showing the paleo-salinity by use of S/TOC, Sr/Ba and G/C30Hopane. The area size of points shows TOC. (a): Relationship between S/TOC and Sr/Ba; (b): Relationship between G/C30Hopane and TOC.
Minerals 13 00332 g015
Figure 16. Vertical variation of TOC, S, and geochemical proxies (P, MoEF, S/TOC, Sr/Ba) in Pingdiquan Formation of H-1 Well. The grey shaded zone represents the strata where organic-rich shales are present.
Minerals 13 00332 g016
Figure 17. Scheme for the enrichment of organic matter in middle Permian around the Bogda Mountain. Organic-rich shales and mudstones in northern Bogda Mountain were deposited in a hydrostatic, brackish, anoxic condition; that of western Bogda Mountain were in suboxic, non-stratified, rapidly depositing sedimentary environment.
Minerals 13 00332 g017
Figure 18. Relationship between the differentiation of REEs and TOC. An inverse correlation between the (La/Yb)N ratio and TOC has been observed in samples from Jingjingzigou outcrops, western periphery of Bogda Mountain.
Minerals 13 00332 g018
Table 1. Organic geochemical data of samples from outcrops and drill core around the Bogda Mountain (unit of TOC and S in wt. %; HI in mg HC/g TOC; δ13C in ‰; β-carotane in μg/g).
Sample IDH1-23H1-30H1-54H1-83H1-100H1-118H1-134H1-145H1-153H1-154H1-155B-1B-3B-5D-13
StratumP2pP2pP2pP2pP2pP2pP2pP2pP2pP2pP2pP2pP2pP2pP2l
Well/OutcropsH-1H-1H-1H-1H-1H-1H-1H-1H-1H-1H-1H-1H-1H-1W
TOC3.522.152.164.317.485.817.032.744.763.366.835.815.775.650.31
S0.120.080.130.691.630.582.270.850.950.380.631.940.51.740.04
HI41047757265490579792265286143080925052124013
Pr/Ph1.040.930.660.911.371.11.011.271.080.680.571.160.711.220.45
CPI1.471.11.491.261.21.311.231.241.251.551.51.51.441.441.07
OEP1.611.161.631.421.31.441.311.321.331.671.611.681.51.581.13
G/C30H0.070.080.070.080.220.20.220.420.150.040.040.070.040.080.1
Steranes/C30H0.30.310.580.360.170.320.240.70.370.910.560.270.40.320.23
β-carotane0.170.010.070.470.630.090.110.050.080.080.430.290.240.140.01
δ13C −0.2−30−30.9−31.8 −30.4−33.6−30.9−33.3−30.9
Sample IDD-14D-15D-16D-17D-18D-19D-20D-21D-22J-2J-4J-6J-8J-9J-10
StratumP2lP2lP2lP2lP2lP2lP2lP2lP2lP2lP2lP2lP2lP2lP2l
Well/OutcropsWWWWWWWWWJJJJJJ
TOC0.633.60.423.590.880.610.270.943.721.175.264.267.1620.148.04
S0.090.020.010.020.010.010.010.030.020.010.030.030.070.070.03
HI2276726617288152835173333202522661417
Pr/Ph0.991.130.571.411.120.530.61.110.620.90.970.830.761.160.92
CPI1.221.161.121.21.251.121.061.471.381.1411.11.081.061.05
OEP1.21.21.161.131.251.090.931.331.141.130.951.091.0811.02
G/C30H0.090.310.160.280.630.120.130.280.360.130.080.060.10.130.13
Steranes/C30H0.240.180.370.240.910.730.40.940.120.090.090.130.140.130.13
β-carotane0.010.20.010.380.010.010.010.010.290.030.010.010.010.020.01
δ13C−23.2 −26.6−22.1 −27.6−31.6 −32.5
Sample IDJ-11J-12J-13J-14J-15J-16J-17Q-1Q-2Q-3Q-4Q-5Q-6Q-7Q-10
StratumP2lP2lP2lP2lP2lP2lP2lP2pP2pP2pP2pP2pP2pP2pP2p
Well/OutcropsJJJJJJJQQQQQQQQ
TOC31.999.3616.8420.8510.624.856.643.495.613.14.439.7910.045.7721
S0.040.040.060.060.040.080.040.030.050.030.020.060.40.120.06
HI606494552632540317363190292176342753643473912
Pr/Ph1.81.061.331.231.281.0511.811.830.871.210.671.191.620.91
CPI0.910.951.091.11.091.141.061.251.21.141.231.141.111.110.9
OEP0.880.951.11.11.071.191.071.311.261.141.091.091.141.130.89
G/C30H0.120.120.150.150.150.10.10.040.050.030.070.050.070.10.15
Steranes/C30H0.090.10.110.090.120.10.090.120.130.140.140.090.20.070.03
β-carotane0.010.010.030.010.040.010.010.030.10.10.240.230.150.130.09
δ13C −32.5 −32.5 −31.8−31.5−31.2 −31.3 −31 −32.5
Note: H-1 = H-1 well; W= West Guodikeng (southern Bogda Mountain); J = Jingjingzigou (western Bogda Montain); and Q = Quanzijie (northern Bogda Mountain).
Table 2. Major oxides components of sediments from the Lucaogou Formation around the Bogda Mountain (unit in wt. %).
Sample IDPAASH1-14H1-21H1-30H1-35H1-51H1-54H1-56H1-61H1-62H1-71H1-75H1-83H1-91H1-94H1-100H1-106H1-110
Well/Outcrops H-1H-1H-1H-1H-1H-1H-1H-1H-1H-1H-1H-1H-1H-1H-1H-1H-1
TOC 2.25.41.42.24.44.95.22.72.34.36.14.97.57.82.6
SiO262.858.653.851.256.85555.155.655.355.847.457.753.355.35354.453.254.6
Al2O318.916.911.311.110.912.512.511.111.111.39.211.210.810.911.310.310.812
Fe2O37.26.964.646.15.74.24.95.14.454.54.14.13.744.5
MgO2.21.31.82.1222.72.82.72.45.22.42.41.81.92.12.12.7
CaO1.31.18.69.95.35.544.54.64.19.747.15.97.55.75.56
Na2O1.212.11.81.722.121.61.71.51.71.91.92.32.32.31.9
K2O3.71.41.41.81.922.12.12.12.11.72.12.22.52.42.42.52.7
MnO0.10.10.10.10.10.10.10.10.10.10.10.10.10.10.10.10.10.1
TiO210.90.80.60.50.80.70.50.60.70.50.60.50.50.50.50.50.6
P2O50.20.10.30.30.30.20.20.20.30.30.20.30.40.30.30.30.50.2
Sample IDH1-118H1-123H1-128H1-134H1-140H1-148H1-153H1-154H1-155D-14D-15D-16D-17D-18D-19D-20D-21D-22
Well/OutcropsH-1H-1H-1H-1H-1H-1H-1H-1H-1WWWWWWWWW
TOC5.85.94.572.52.14.83.46.80.63.60.43.60.90.60.30.93.7
SiO252.855.855.652.739.749.649.9655547.340.158.537.259.558.160.860.561.2
Al2O310.111.211.69.78.510.49.310.310.213.34.213.77.214.314.713.112.112.9
Fe2O344.74.83.53.743.65.84.33.64.45.74.16.17.44.34.14.1
MgO32.12.121.934.22.32.42.38.32.48.52.83.12.52.32.3
CaO6.44.25.57.82010.38.21.5510.814.23.812.91.523.83.41.7
Na2O2.22.221.81.62.72.31.31.33.61.34.52.545.23.63.33.3
K2O2.32.6332.12.92.51.51.65.31.63.91.74.32.73.83.53.5
MnO0.10.10.10.10.10.10.10.10.10.10.20.10.20.10.10.10.20
TiO20.50.60.60.50.50.50.40.50.50.60.20.60.30.60.50.50.50.5
P2O50.20.30.20.30.30.20.20.20.7000.10.10.10.10.10.10.1
Sample IDJ-10J-11J-12J-13J-14J-15J-16J-17Q-1Q-2Q-3Q-4Q-5Q-6Q-7Q-8Q-9Q-10
Well/OutcropsJJJJJJJJQQQQQQQQQQ
TOC8329.416.820.910.64.96.63.55.63.14.49.8105.82.61.521.4
SiO253.4405950.445.825.261.655.563.564.27068.354.847.958.951.469.556.3
Al2O326.313.89.58.15.212.313.812.412.310.213.495.311.510.914.110.1
Fe2O36.53.244.73.93.156.13.22.93.41.93.34.95.152.33.1
MgO1.51.80.41.52.9111.21.41.81.70.81.32.94.62.53.80.50.4
CaO2.87.3136.215.61.81.521.81.90.55.810.71.65.40.40.9
Na2O4.12.743.63.31.75.14.71.11.11.31.21.20.71.72.24.53.9
K2O2.50.92.91.61.21.123.121.91.92.11.512.12.52.41.4
MnO0.10.10.10.10.10.10.10.1000.100.10.20.10.100
TiO20.60.30.60.40.40.30.60.70.60.60.50.60.40.30.50.50.60.5
P2O50.12.80.30.83.60.10.10.10.30.40.50.20.50.50.30.40.10.2
Table 3. Enrichment factors (EFs) of some trace elements and bi-elemental ratio of sediments from the Lucaogou Formation.
Sample IDH1-14H1-21H1-30H1-35H1-51H1-54H1-56H1-61H1-62H1-71H1-75H1-83H1-91H1-94H1-100H1-106H1-110H1-118
MoEF0.782.053.466.763.312.684.766.315.264.854.445.257.17.778.87.993.187.43
VEF0.831.511.131.251.11.11.151.231.191.461.191.191.21.141.231.231.071.16
CuEF0.921.241.121.380.991.071.351.371.421.291.251.321.691.411.731.71.261.5
UEF0.992.791.51.851.491.31.751.691.721.621.611.681.691.871.571.81.151.42
BaEF5.9613.284.063.833.723.32.863.243.222.092.884.942.042.132.272.553.192.76
Sr/Ba0.050.060.240.20.180.20.270.240.240.720.260.260.550.620.460.460.30.48
(La/Yb)N0.620.560.590.540.620.650.590.590.610.580.560.640.570.620.670.630.680.64
Sample IDH1-123H1-128H1-134H1-140H1-148H1-153H1-154H1-155D-14D-15D-16D-17D-18D-19D-20D-21D-22J-10
MoEF8.076.4410.2310.247.487.165.55.232.2347.250.597.31.820.332.541.570.7120.54
VEF1.381.231.31.11.091.161.361.371.473.030.721.250.790.760.60.790.682.82
CuEF1.741.591.561.111.291.221.621.471.612.041.141.641.191.110.931.431.077.5
UEF1.71.341.882.341.771.971.41.630.971.520.762.5210.621.020.891.162.47
BaEF2.572.593.295.986.931.891.031.291.311.690.791.540.840.650.960.970.843.08
Sr/Ba0.370.440.50.60.250.760.71.011.293.090.631.890.610.580.710.570.460.62
(La/Yb)N0.610.650.630.490.60.510.510.780.380.430.530.480.60.570.570.410.680.85
Sample IDJ-11J-12J-13J-14J-15J-16J-17Q-1Q-2Q-3Q-4Q-5Q-6Q-7Q-8Q-9Q-10
MoEF9.163.0811.787.1914.863.178.671.321.836.71.655.9241.371.996.672.746.04
VEF1.080.421.081.012.580.770.711.020.861.120.831.131.611.021.50.520.67
CuEF1.511.041.831.751.621.011.361.21.211.441.151.73.521.431.640.831.32
UEF1.680.281.721.620.780.180.140.981.071.2911.643.81.021.850.681.23
BaEF1.970.390.911.724.10.480.510.540.511.250.651.042.051.020.990.520.75
Sr/Ba1.080.470.411.391.140.380.310.650.580.330.281.160.590.430.940.330.39
(La/Yb)N0.491.310.860.60.411.481.650.380.420.510.520.660.570.540.550.620.69
Disclaimer/Publisher’s Note: The statements, opinions and data contained in all publications are solely those of the individual author(s) and contributor(s) and not of MDPI and/or the editor(s). MDPI and/or the editor(s) disclaim responsibility for any injury to people or property resulting from any ideas, methods, instructions or products referred to in the content.