Article

Probing the Pore Structure of the Berea Sandstone by Using X-ray Micro-CT in Combination with ImageJ Software

1
School of Energy Science and Engineering, Henan Polytechnic University, Jiaozuo 454003, China
2
Henan Key Laboratory for Green and Efficient Mining & Comprehensive Utilization of Mineral Resources, Henan Polytechnic University, Jiaozuo 454003, China
3
Institute of Energy, School of Earth and Space Sciences, Peking University, Beijing 100871, China
4
School of Energy Resources, China University of Geosciences (Beijing), Beijing 100083, China
5
Institute of Resources and Environment, Henan Polytechnic University, Jiaozuo 454003, China
*
Author to whom correspondence should be addressed.
Minerals 2023, 13(3), 360; https://doi.org/10.3390/min13030360
Submission received: 7 February 2023 / Revised: 26 February 2023 / Accepted: 2 March 2023 / Published: 4 March 2023
(This article belongs to the Section Mineral Deposits)

Abstract

:
During diagenesis, the transformation of unconsolidated sediments into a sandstone is usually accompanied by compaction, water expulsion, cementation and dissolution, which fundamentally control the extent, connectivity and complexity of the pore structure in sandstone. As the pore structure is intimately related to fluid flow in porous media, it is of great importance to characterize the pore structure of a hydrocarbon-bearing sandstone in a comprehensive way. Although conventional petrophysical methods such as mercury injection porosimetry, low-pressure nitrogen or carbon dioxide adsorption are widely used to characterize the pore structure of rocks, these evaluations are based on idealized pore geometry assumptions, and the results lack direct information on the pore geometry, connectivity and tortuosity of pore channels. In view of the problems, X-ray micro-CT was combined with ImageJ software (version 1.8.0) to quantitatively characterize the pore structure of Berea Sandstone. Based on its powerful image processing function, a series of treatments such as contrast enhancement, noise reduction and threshold segmentation, were first carried out on the micro-CT images of the sandstone via ImageJ. Pores with sizes down to 2.25 μm were accurately identified. Geometric parameters such as pore area, perimeter and circularity could thus be extracted from the segmented pores. According to our evaluations, pores identified in this study are mostly in the range of 30–180 μm and can be classified into irregular, high-circularity and slit-shaped pores. An irregular pore is the most abundant type, with an area fraction of 72.74%. The average porosity obtained in the image analysis was 19.10%, which is fairly close to the experimental result determined by a helium pycnometer on the same sample. According to the functional relationship between tortuosity and permeability, the tortuosity values of the pore network were estimated to be in the range of 4–6 to match the laboratory permeability data.

1. Introduction

Sandstone is a clastic sedimentary rock consisting of minerals, rock debris or organic matter which originate from bedrock [1]. Original grains of these rocks are reduced to sand size by physical and chemical weathering and the action of moving water, wind or ice during the transportation to the sedimentary environment [2,3]. Once deposited, these sediments undergo complex diagenesis, including compaction, cementation and dissolution [4]. The pore size and morphology thus become diversified, and the connectivity of the pore network turns worse, leading to a complex pore structure where fluid flow takes place [5]. The minimum pore throat size of the percolation path largely controls the replacement of pore water by oil and gas and the transport of oil and gas in the pore network, affecting the differential distribution of oil and gas in the reservoirs and the final production capacity [6,7]. Therefore, comprehensive characterization of the pore structure of a hydrocarbon-bearing sandstone lays a basis for evaluating fluid storage and transport characteristics, which is of fundamental significance to the exploration and exploitation of oil and gas.
A wide range of approaches for characterizing the pore structure have been put forward and can generally be classified as fluid-invasive petrophysical techniques and indirect imaging methods [6,8]. Direct petrophysical techniques such as helium pycnometry (HP), water immersion porosimetry (WIP), mercury injection porosimetry (MIP), low-pressure N2 and CO2 adsorption are widely used to determine the accessible and connected pore volumes of rocks [9,10]. Although HP and WIP are able to detect a wide range of pore sizes (down to 0.26 mm), no information about the pore geometry or pore size distribution could be obtained from these techniques. Interpretation of pore size distributions from MIP and low-pressure N2 or CO2 adsorption is based on assumptions of “uniform” cylindrical or slit-shaped pores, which can only be taken as rough estimates. In addition, inevitable sample deformation induced by high-pressure mercury and false allocation of pore volumes to pore sizes due to the “ink-bottle” effect have been revealed by researchers, and the validity of the MIP is thus controversial [11,12,13]. It is worth noting that information on the pore geometry, connectivity and tortuosity of pore channels is absent in these evaluations.
With the development of imaging technologies, various imaging techniques such as scanning electron microscopy (SEM), transmission electron microscopy (TEM), atomic force microscopy (AFM), helium ion microscopy (HIM) and X-ray micro-computed tomography (micro-CT) can be utilized for pore structure characterization [6]. In comparison to the conventional SEM, TEM, AFM and HIM are able to provide images with higher resolution (below 1 nm) and better quality [14]. However, the view field of these new methods is limited to a small scale in 2D, and hence, the pore space connectivity in 3D is unknown. X-ray micro-CT is considered to be a non-destructive technique to reconstruct the 3D microstructure from cylindrical rocks with sizes in the centimeter range [15]. In conventional rocks such as sandstones, micro-CT is successfully applied to capture a representative elementary volume and create a 3D pore network from which simulation results on permeabilities match well with petrophysical measurements [16,17]. Normally, image processing on a large number of high-resolution images is the first step in digital rock analysis, which can be facilitated by software such as ImageJ. ImageJ is a Java-based image processing program running on multiple operating systems such as Microsoft Windows, macOS and Linux. In recent years, several plugins (e.g., DeepImageJ) in ImageJ have enabled the use of a variety of pre-trained neural networks in image processing and analysis [18,19,20]. Due to its plugin architecture and built-in development environment, ImageJ has become a popular platform for image processing and is widely applied in medical, biological and agricultural sciences [21,22,23]. Irving et al. [24] applied the commercial medical imaging program Slice-O-Matic and the freeware ImageJ in the measurements of adipose tissue and skeletal muscle cross-sectional areas. Both software systems provide fairly reliable and comparable measurements. Grishagin [25] reported an automatic cell counting method based on ImageJ, which is about 10 times faster and yields more reliable and consistent results compared to manual counting. Lumagui et al. [26] utilized ImageJ to extract information about the color, size, shape and crack features of Green Coffee Beans for varietal classification. A classification model using combined features of color and size was devised, which efficiently surpassed the performance of manual bean sorting. However, the application of ImageJ software in the earth science field was rarely reported in recent years. Grove and Jerram [27] developed the jPOR macro for ImageJ to quantify total porosity from blue-stained thin sections of aeolian sandstone. This method provided comparable results with less error when compared to more time-consuming point counting methods. Wopara and Lyuke [28] used ImageJ to process and analyze X-ray micro-CT images of the Agbada sandstone from Nigeria. The average porosity of 33.8% obtained is close to the average porosity of 28.2% measured by helium pycnometry.
With regard to pore structure evaluations, petrophysical methods still have some limitations in reflecting information about the real pore morphology, connectivity and tortuosity of pore channels. The non-destructive X-ray micro-CT has great potential to overcome these drawbacks and could provide a better solution for pore structure characterization in combination with the powerful ImageJ software. In this study, we provided a workflow for processing and analyzing X-ray micro-CT images of Berea Sandstone, and the porosity, pore morphology, pore size distribution and tortuosity of the sandstone were investigated in detail based on the image analysis.

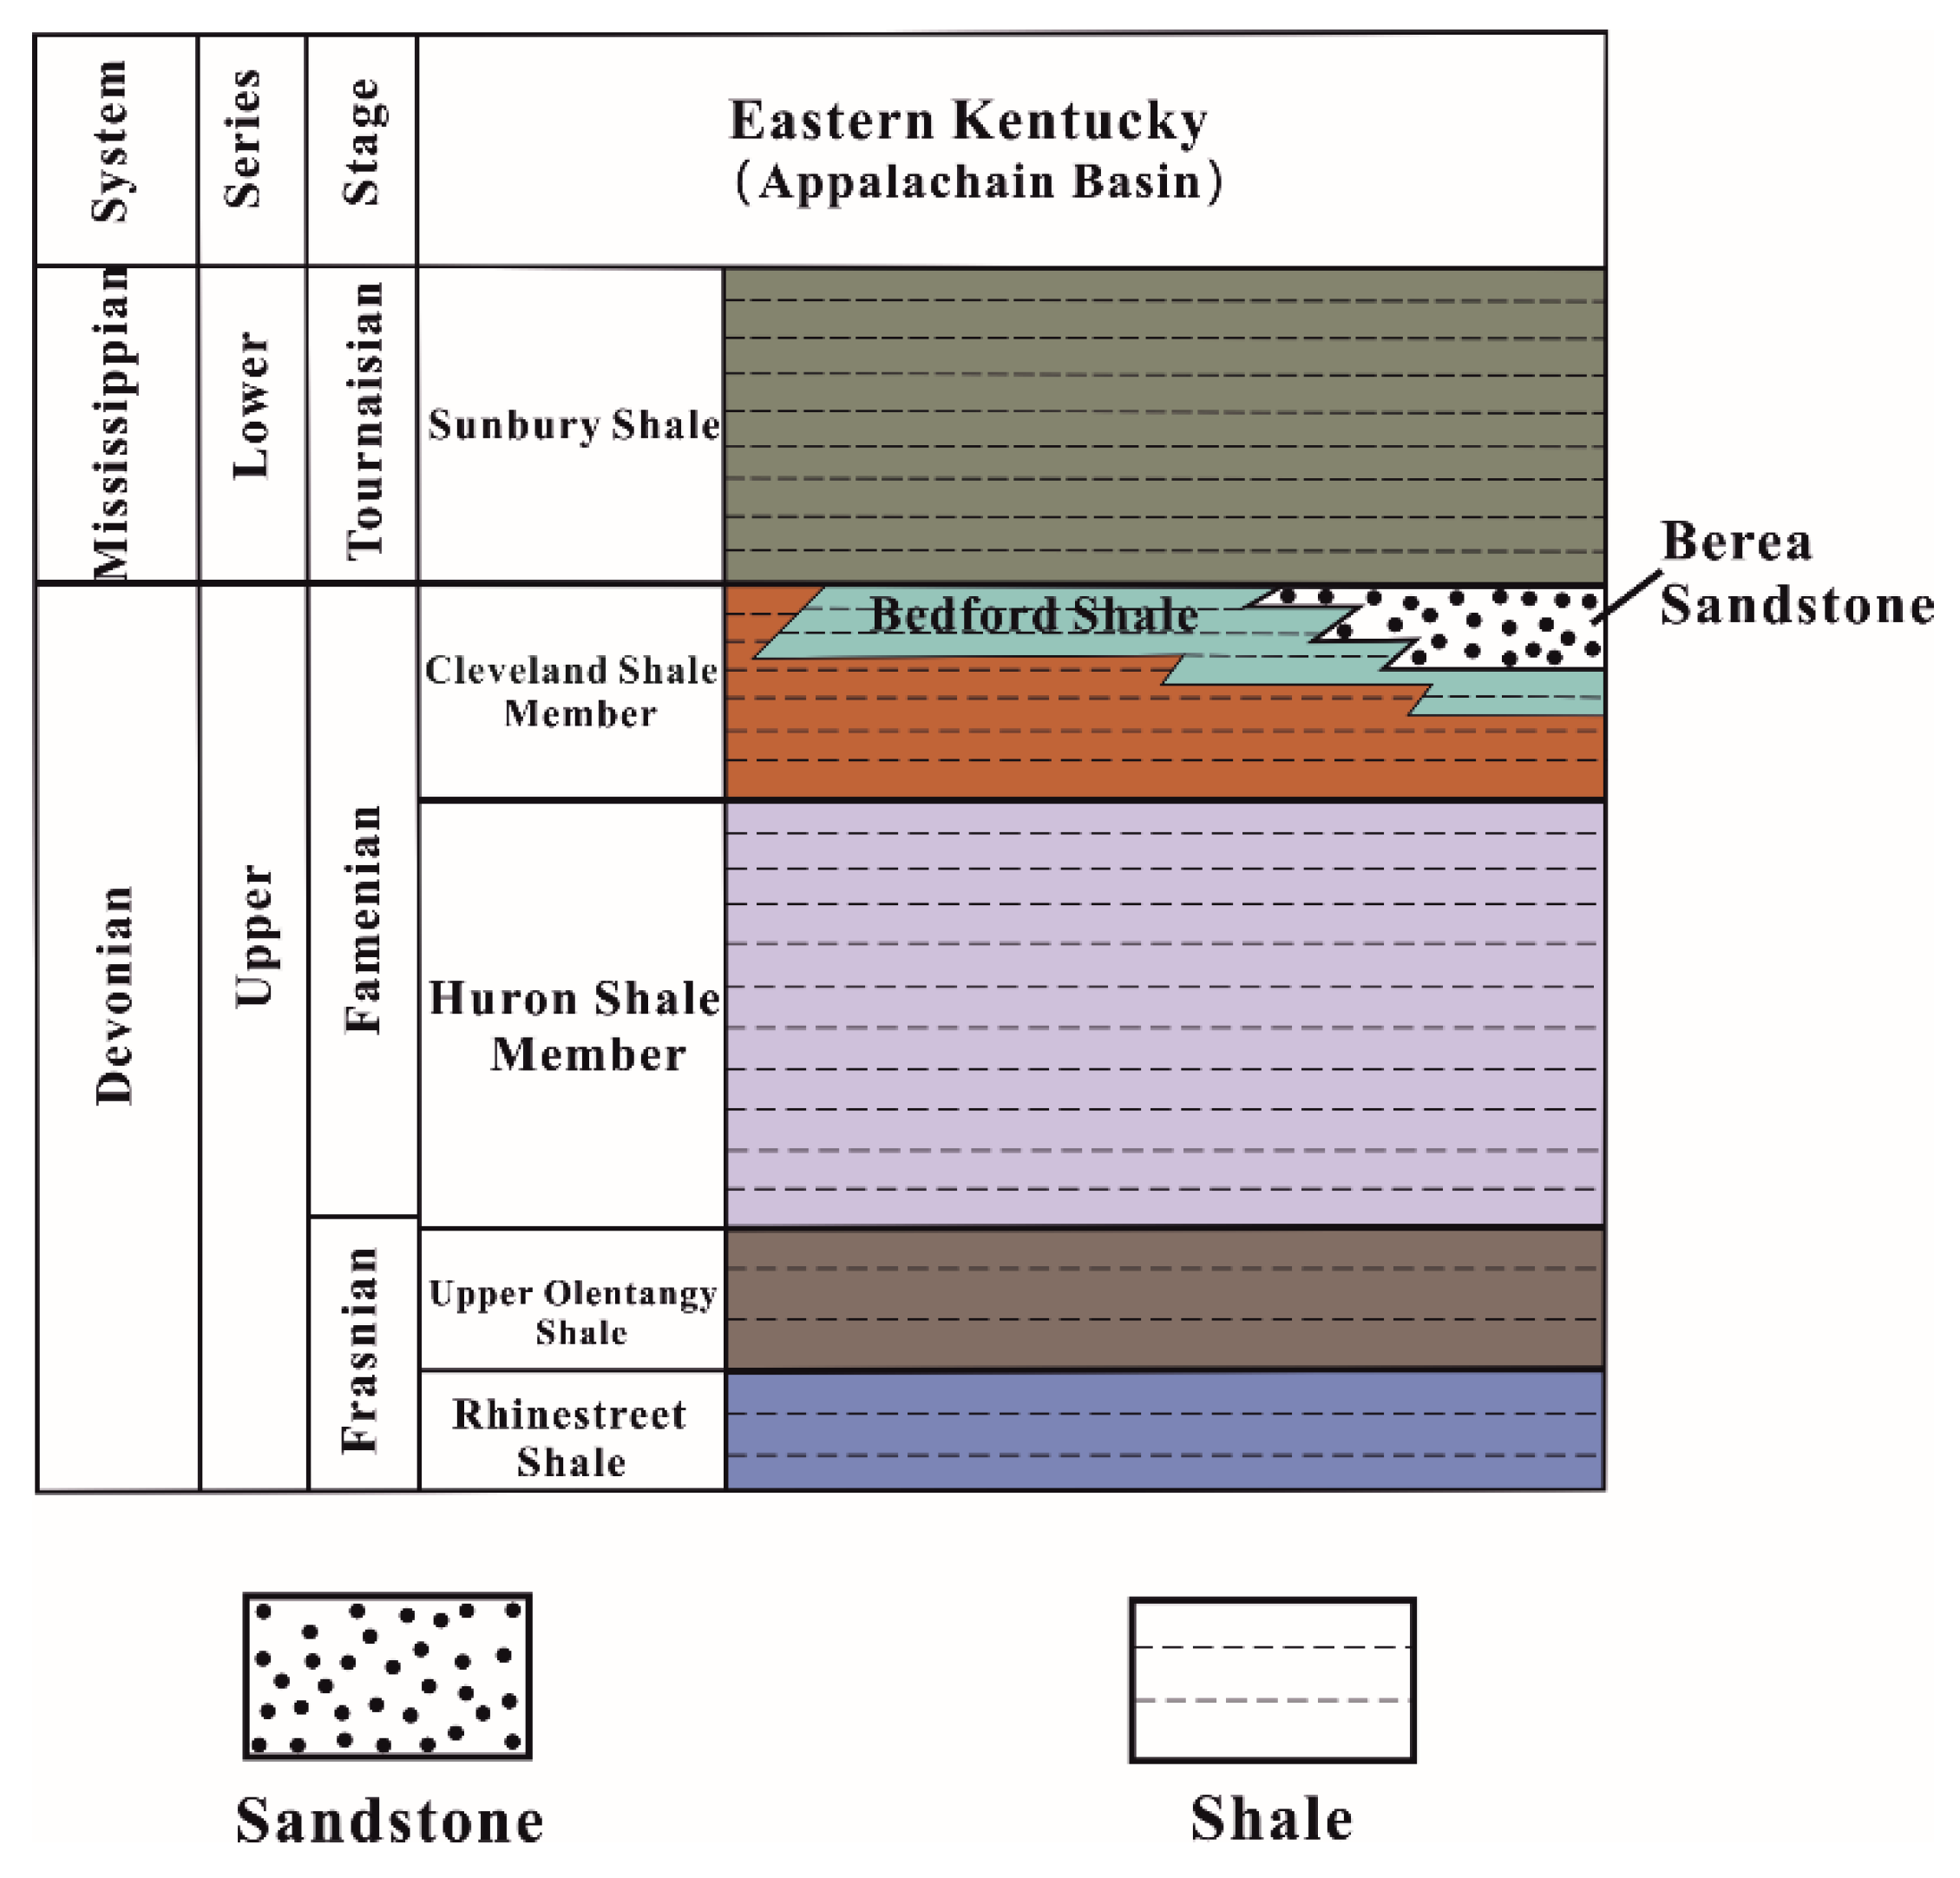
2. Geological Setting

The Appalachian Basin is an oblong sedimentary basin located in the eastern United States (Figure 1). The basin is bounded by Cincinnati arch in the west and the Appalachian Mountains in the east and extends along in the NE–SW direction [29,30]. It is defined as a giant foreland basin in which Lower Cambrian to Lower Permian strata are widely distributed. During the Early and Middle Cambrian, an interior rift system was formed in eastern North America due to the opening and spreading of the Iapetus–Rheic Ocean [31]. As a part of the rift system, the northeast-trending Rome trough is bordered by the Kentucky River fault system (KRFS) and the Rockcastle River fault system (RRFS), with the Irvine–Paint Creek fault system (IPCFS) developing internally [32]. The trough extends across a wide oil and gas production area in the central Appalachian basin. Berea Sandstone, throughout a large part of the Appalachian basin, has long been a prolific producer of oil and gas since 1859 [33]. Up to the present, more than 300 fields have been discovered and developed in Ohio, Kentucky, West Virginia and western Pennsylvania [34].

3. Samples

The studied Berea Sandstone was obtained from the Upper Devonian strata in northeastern Kentucky in the United States. The sampling site is located at the border of Kentucky, Ohio and West Virginia in the central Appalachian Basin (Figure 1). A cylindrical plug was drilled with dimensions of approximately 10 mm in diameter and 30 mm in length. The porosity and permeability data of Berea Sandstone published in the literature are listed in Table 1. Mineralogically, Berea Sandstone is mainly composed of quartz (usually above 60%) but also contains some feldspar, dolomite and clay minerals [33]. In eastern Kentucky, the Berea Sandstone is covered by the Lower Mississippian Sunbury Shale and underlain by the Upper Devonian Bedford Shale, which overlies the Cleveland and Huron Shale Members, Upper Olentangy Shale and Rhinestreet Shale (Figure 2). Berea Sandstone and Bedford Shale formed interpenetrating clastic wedges and were deposited in the storm shelf and slope environments caused by a forced regression during the end of the Devonian [35].

4. Methods

4.1. X-ray Micro-CT

The cylindrical sample plug was scanned on an X-ray micro-CT (Skyscan 1272, Bruker, Billerica, MA, USA) which was operated at 100 kV and 100 µA. A 0.11 mm Cu filter was utilized to preharden the X-ray beam. The projection data were reconstructed into 2D cross-sectional images, and these images were then cropped containing 1000 × 1000 × 1000 voxels with a voxel size of 2.25 μm. Therefore, the total images studied constitute a volume of 11.39 mm3. It is worth noting that the studied images were obtained from the Digital Rocks Portal (https://www.digitalrocksportal.org/) (accessed on 01.December 2022). Details about the sample information, setup and operation can be found in [37,39,40].

4.2. Workflow of Image Processing and Analysis

The cropped images were processed and further analyzed in the ImageJ software (Fiji), which was developed by the National Institutes of Health of the United States with powerful image processing capabilities. The cropped grayscale images were first processed by using contrast enhancement and noise reduction filters, aiming to enhance the contrast between pores and the surrounding solid phase and reduce the overall noise of the images. Specifically, for each image, the grayscale histogram was cut off by a contrast enhancement filter at a grey value where the current histogram constitutes 99.7% of the previous one, reducing the influence of a few outlying pixels on the grayscale histogram. The remaining grey values were then rescaled to the [0, 255] interval. In this way, the overall brightness and contrast of the images could be increased. After the contrast enhancement treatment, medium or non-local means filters can be chosen to reduce the noise of the images. In this study, the noise reduction filter based on the non-local means algorithm was applied to these images, which can be found in the plugin menu of the software. Unlike the medium filter, which replaces each pixel with the median value of its surrounding pixels to smooth the image, the non-local means filtering takes a weighted average value of pixels similar to the target one in the whole image, resulting in much greater clarity and a lower loss of detail [41]. The filtered images were semi-automatically segmented into features of interest (pores) and background (solid phase) by a built-in “Threshold” plugin according to the greyscale histogram. The ImageJ software provides 16 different automatic thresholding methods for segmentation, including the widely used “Default”, “Huang” and “Otsu” methods. The “Default” and “Huang” methods are based on the modified IsoData algorithm and Shannon’s entropy function, respectively [42,43]. The threshold clustering algorithm in “Otsu” method searches for a threshold that minimizes the intra-class variance, which is defined as a weighted sum of variances of the two classes [44].
In order to obtain representative analysis results about the pore geometry with a high computation efficiency, 1000 images of the sandstone were divided into 10 groups in order, with each group containing 100 images. One image was randomly selected from each group for analysis. Thus, image analysis on the selected 10 images (71st, 174th, 248th, 367th, 486th, 590th, 683rd, 768th, 883rd and 1000th) provided representative data on the pore structure of the sandstone. After the image processing was carried out, geometric parameters could be extracted from the segmented pores via ImageJ. In this study, statistical geometrical measurements were conducted on these images by using the “Analyze Particles” tool. A series of pore geometry parameters were obtained, such as the major axis length (L), minor axis length (W), perimeter (P), area (A), circularity (4πA/P2), aspect ratio (L/W) and so on. Based on these parameters, the porosity, pore shape and pore size distribution of the sandstone could be analyzed in detail.

5. Results

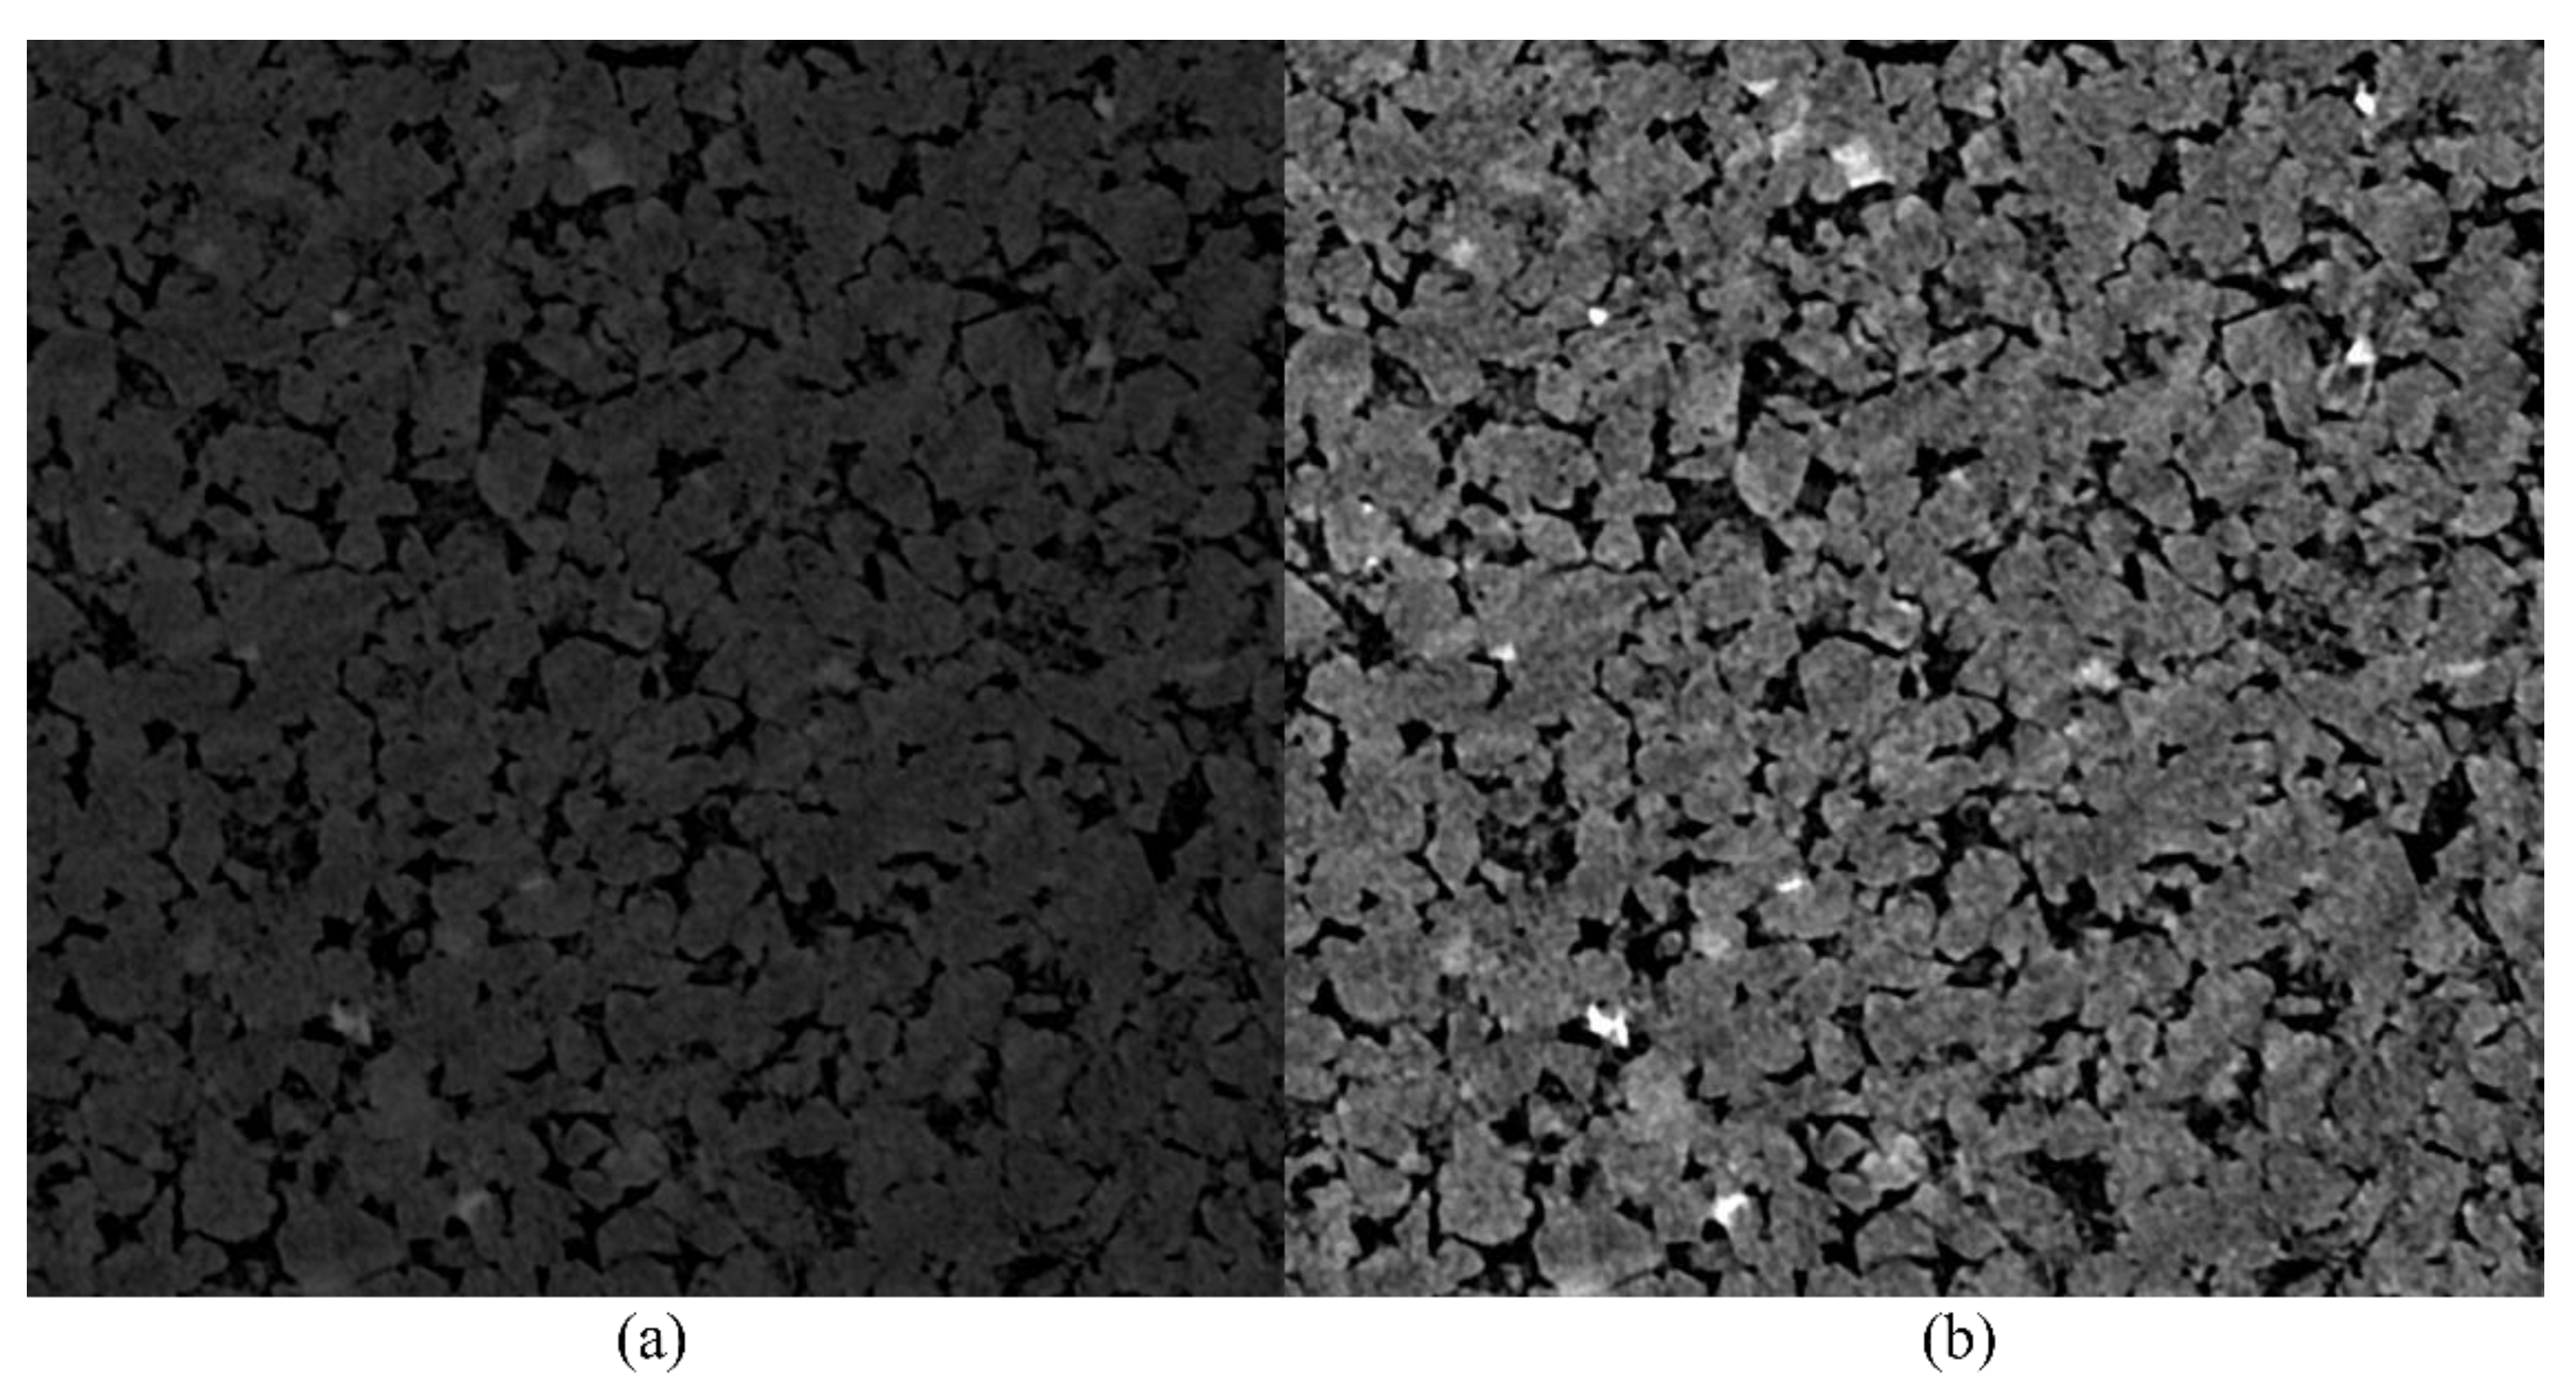
5.1. Image Processing

After the contrast enhancement and noise reduction operations, the brightness and contrast of the images were obviously increased, and the noises inherent in the imaging technique were also reduced (Figure 3). In this study, pores were segmented from these images by using the “Default”, “Huang” and “Otsu” thresholding methods. It is clear that the three methods yielded approximately the same segmentation results, and the obtained porosity data were seemingly close to each other (Figure 4).

5.2. Pore Geometry

The “Analyze Particles” tool in the analysis toolbar of ImageJ was used to count and measure the selected pores in the thresholded images. As is shown in Table 2, the number of pores varies from 341 to 416 in the selected ten images, and the total pore area ranges between 912,627 and 1,015,765.31 μm2. The average pore area varies from 2193.81 to 2899.04 μm2, and the average perimeter varies between 251.97 and 315.67 μm, which shows a homogeneous distribution of the pores in the sandstone. With respect to the pore geometry, the circularity values of all pores identified range from 0.031 to 1, and the aspect ratios vary from 1.005 to 8.815. The average circularity of pores in the selected images varies from 0.46 to 0.50, and the average aspect ratio varies from 1.90 to 1.97 (Table 2). In general, pores with low aspect ratios approaching 1 tend to exhibit high circularity values (Figure 5a). In our study, based on the calculated circularity values, the pores in Berea Sandstone are classified as high-circularity pores (0.75 < circularity ≤ 1), irregular pores (0.2 < circularity ≤ 0.75) and slit-shaped pores (0 < circularity ≤ 0.2). The irregular and high-circularity pores account for 72.74% and 15.92% of the total pore area, respectively, while slit-shaped pores make up 11.61% (Figure 5b).

5.3. Porosity and Pore Size Distribution

In this study, porosity was defined as the ratio of the pore area to the total area of the micro-CT image. As three different thresholding methods were applied in the pore segmentation, porosities were calculated separately for each image. According to Table 3, the standard deviation (SD) of the porosities based on three thresholding methods was in the range of 0.01%–0.62%. The average porosity of the ten images was 19.10%, with a SD of 0.55%.
Considering most of the identified pores are irregular in shape (72.74% in area fraction), pores are equated to circles with the same areas for the sake of diameter calculation. The calculated equivalent diameters of the pores varied between 19.67 and 295.50 μm, most of which were in the interval between 30 and 180 μm (Figure 6a). The corresponding cumulative porosity was 16.57%, and these pores accounted for 86.4% of the total pore area. Pores with equivalent diameters larger than 180 μm have a pore area fraction of about 7.10%, which is slightly higher than the area fraction (6.47%) of pores smaller than 30 μm. As is shown in Figure 6b, the cumulative porosity was plotted against the median equivalent diameter (the median value of each step interval). The cumulative porosity rapidly increases as the median equivalent diameter starts to decrease from the value of 165 μm.

6. Discussion

6.1. Methodological Comparison of Porosity

In our workflow of image processing, three different thresholding methods were applied in the pore segmentation of each selected image. Similar visual segmentation results and extremely low standard deviation (≤0.62%), along with calculated porosities, proved that pores in the micro-CT image could be identified by ImageJ in a highly accurate way (Figure 4; Table 3). The average porosity of the ten images was 19.10% (SD = 0.55%), which is fairly close to the value of 18.96% (experimental error of ±0.5%) determined by a helium pycnometer on the same sample [37]. It is noteworthy that porosities determined by HP only gave information on the effective pore space accessible to helium, whereas image-derived porosities should reflect effective as well as isolated porosities. The comparable porosity values obtained from the two methods indicate that the pore space of Berea Sandstone is mainly composed of effective pores. As is shown in Table 1, porosities of Berea Sandstone from eastern Kentucky and Ohio, determined via MIP and imaging methods (SEM and micro-CT), range from 2.01 to 26.01% [32,36,38]. The large variation in porosity could be related to the heterogeneity of the rock or bitumen impregnation [32,35].

6.2. Pore Structure Analysis

The intergranular pore is the most abundant pore type, which can easily be observed in the Berea Sandstone (Figure 3b). According to our pore classification based on the pore geometry, irregular pores are dominant with an area fraction of 72.74%, which is followed by high-circularity (15.92%) and slit-shaped pores (11.61%). With respect to the pore size distribution, pores with equivalent diameters between 30 and 180 μm contribute 86.4% of the total pore area, while pores smaller than 30 μm or larger than 180 μm are rare (about 7%). The low area fraction of pores smaller than 30 μm could be attributed to the low resolution (2.25 μm) of micro-CT images. However, the pores identified start from an equivalent diameter of 19.67 μm, which is much larger than 2.25 μm. Additionally, porosity measurements conducted on the same sample by using HP and our imaging method yielded fairly comparable results, which demonstrates that pores smaller than 30 μm only contribute quite a small proportion of the total pore space, as shown in our image analysis. Considering the low proportion of pores larger than 180 μm and the existence of a certain amount of slit-shaped pores, the primary pores of the Berea Sandstone were moderately reworked by intergranular compaction during the diagenesis.
The permeability coefficients of Berea Sandstone could be computed on the pore geometry data from the 2D micro-CT image based on the “bundle of capillary tubes” model. This model was deduced from Hagen–Poiseuille’s law and Darcy’s law and was proposed by Philipp et al. [45] and Hu et al. [46]. According to Equation (1), a permeability estimation can be achieved if the information on the pore morphology (pore area and perimeter) and tortuosity is known. It should be noted that tortuosity here is taken as a critical geometrical parameter to predict the transport properties of porous media when the Reynolds number is low. By introducing the pore geometry data from the selected 10 micro-CT images, permeability can be expressed as an exponential function of the tortuosity. Permeability exponentially decreases with increasing tortuosity value, and the decreasing trends are similar for all 10 images (Figure 7a). Hu et al. [46] also reported a similar permeability–tortuosity relationship for the Cobourg Limestone, which has a much lower permeability when compared to Berea Sandstone (Figure 7b). A steady-state gas flow test was conducted on the same Berea Sandstone by Neumann et al. [37], which yields a permeability coefficient of 121 mD with an experimental error of ±0.5%. Therefore, permeabilities estimated from the model match well with the experimental data when the tortuosity value is in the range of 4 to 6. The “bundle of capillary tubes” model is based on an ideal assumption that pore space in a rock is made up of a network of interconnected and tortuous capillary tubes [5]; it can still provide some insights into porosity-permeability relationships and the effect of tortuosity on permeability. More importantly, it serves as a bridge to link the indirect high-resolution image data with the fluid-invasive permeability measurements on bulk rocks.
k = ϕ r h y d 2 8 τ 2
Here, k and ϕ are the permeability and porosity of the sample, respectively. rhyd represents the hydraulic radius which is the ratio of the pore area to the perimeter. τ denotes the tortuosity of pore networks.

7. Conclusions

This contribution aims to provide a solution for investigating the pore structure (porosity, pore morphology, pore size distribution and tortuosity) of Berea Sandstone with a cropped volume of 11.39 mm3 by using X-ray micro-CT in combination with ImageJ software. The following conclusions can be drawn:
(1)
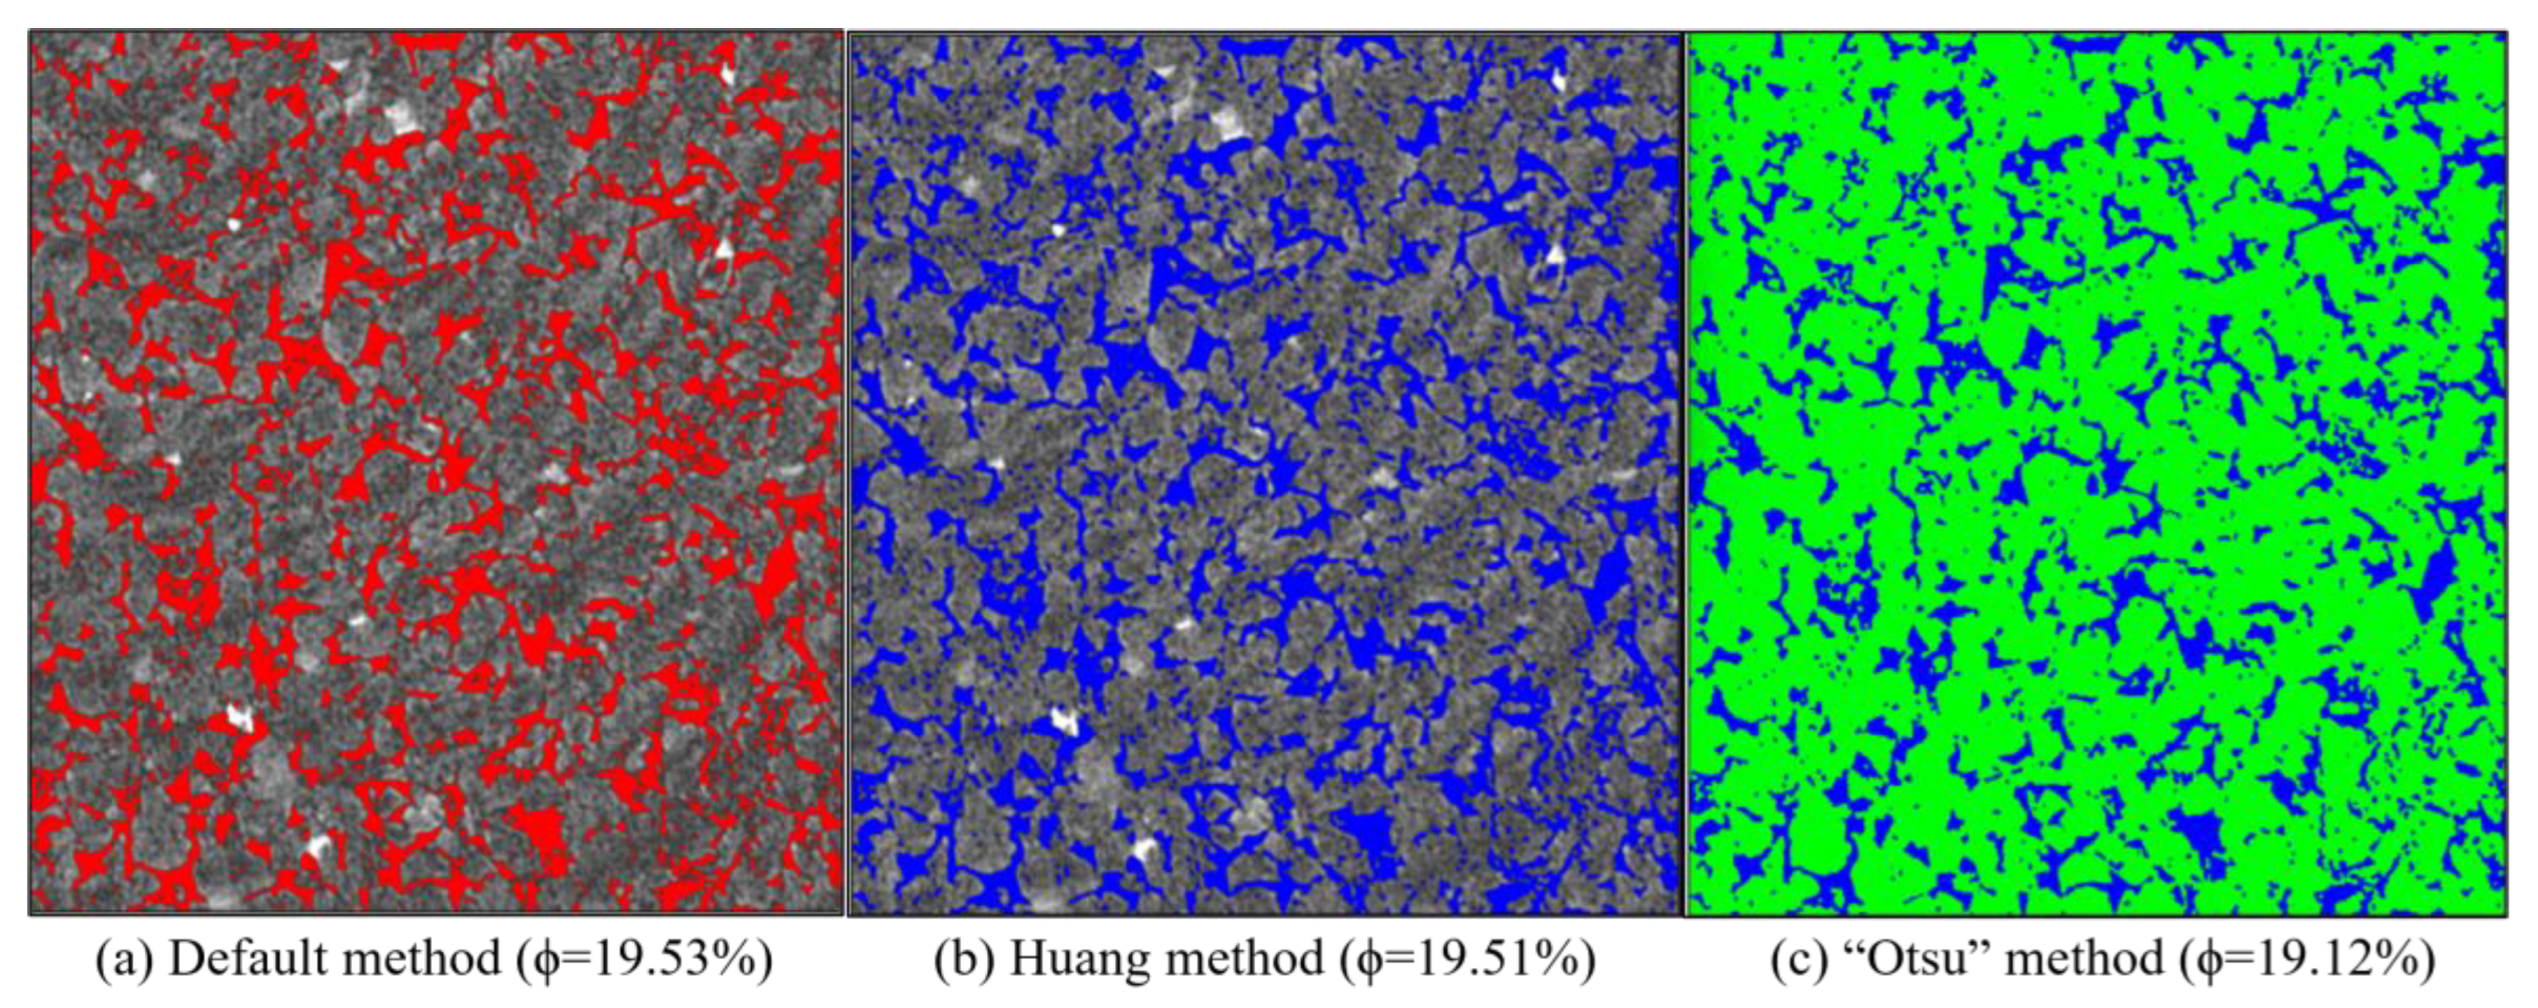
The pores in Berea Sandstone can be segmented from the mineral grains in the micro-CT images by using three different thresholding methods (Default, Huang and Otsu) in a highly accurate way, which paves the way for statistical geometrical measurements.
(2)
The average porosity (19.10%) derived from the image analysis is quite comparable to the porosity (18.96%) determined by a helium pycnometer on the same sample, which indicates that connected and effective pores are dominant in the pore space of the studied Berea Sandstone.
(3)
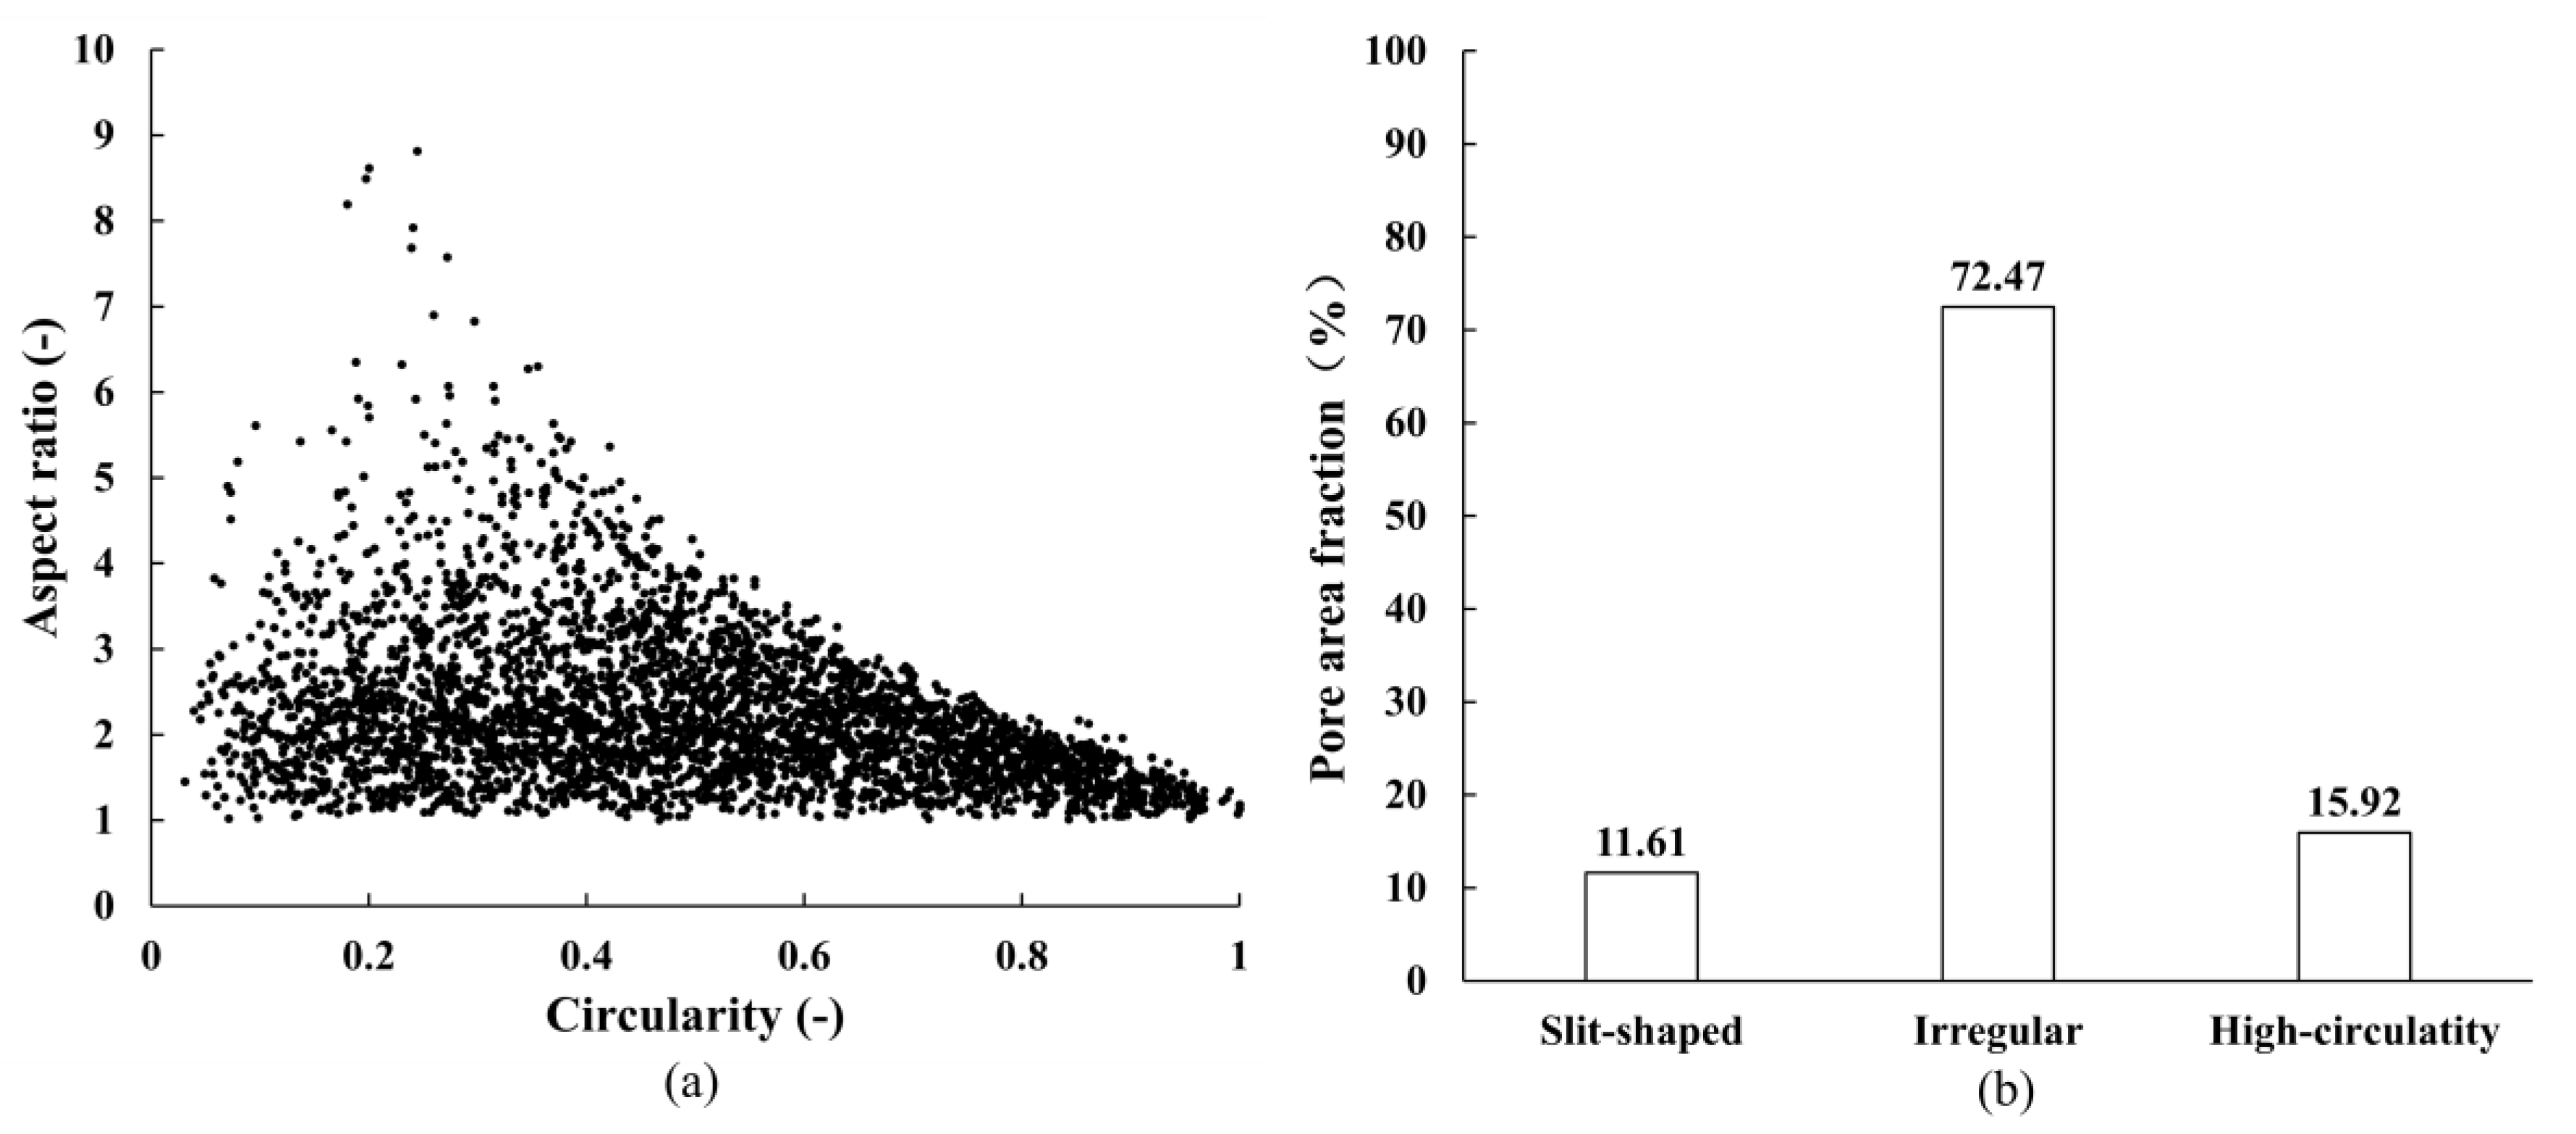
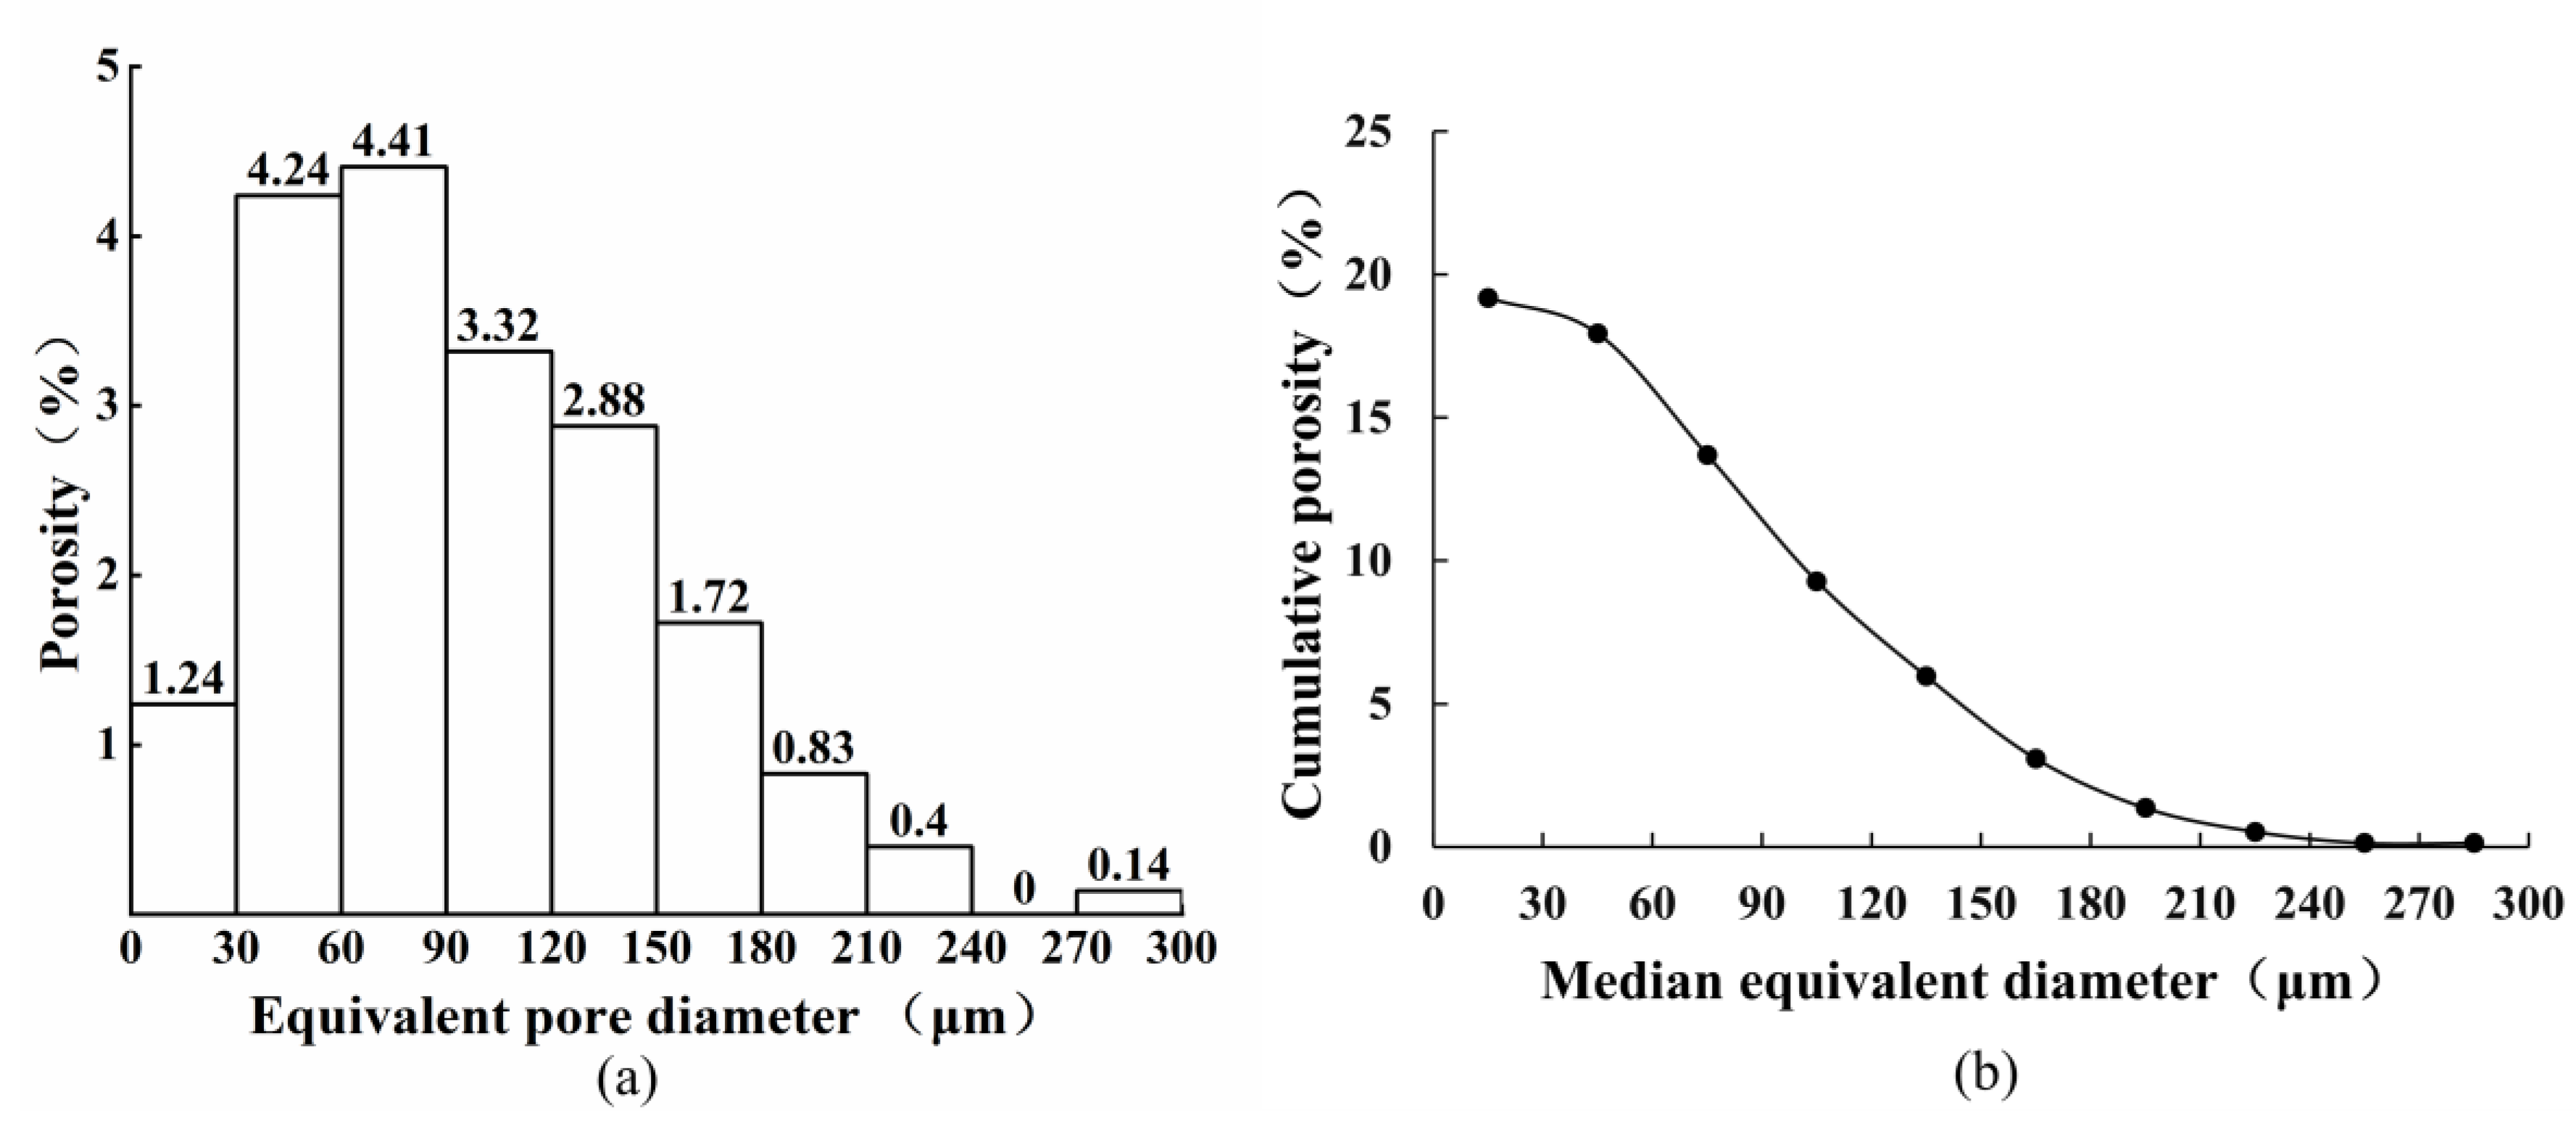
Based on the circularity values calculated, the pores in Berea Sandstone can be classified into irregular, high-circularity and slit-shaped pores. Irregular pores are the most abundant type, with an area fraction of 72.74%. Pores identified in this study are mostly in the range of 30 and 180 μm, which contributes 86.4% of the total pore area.
(4)
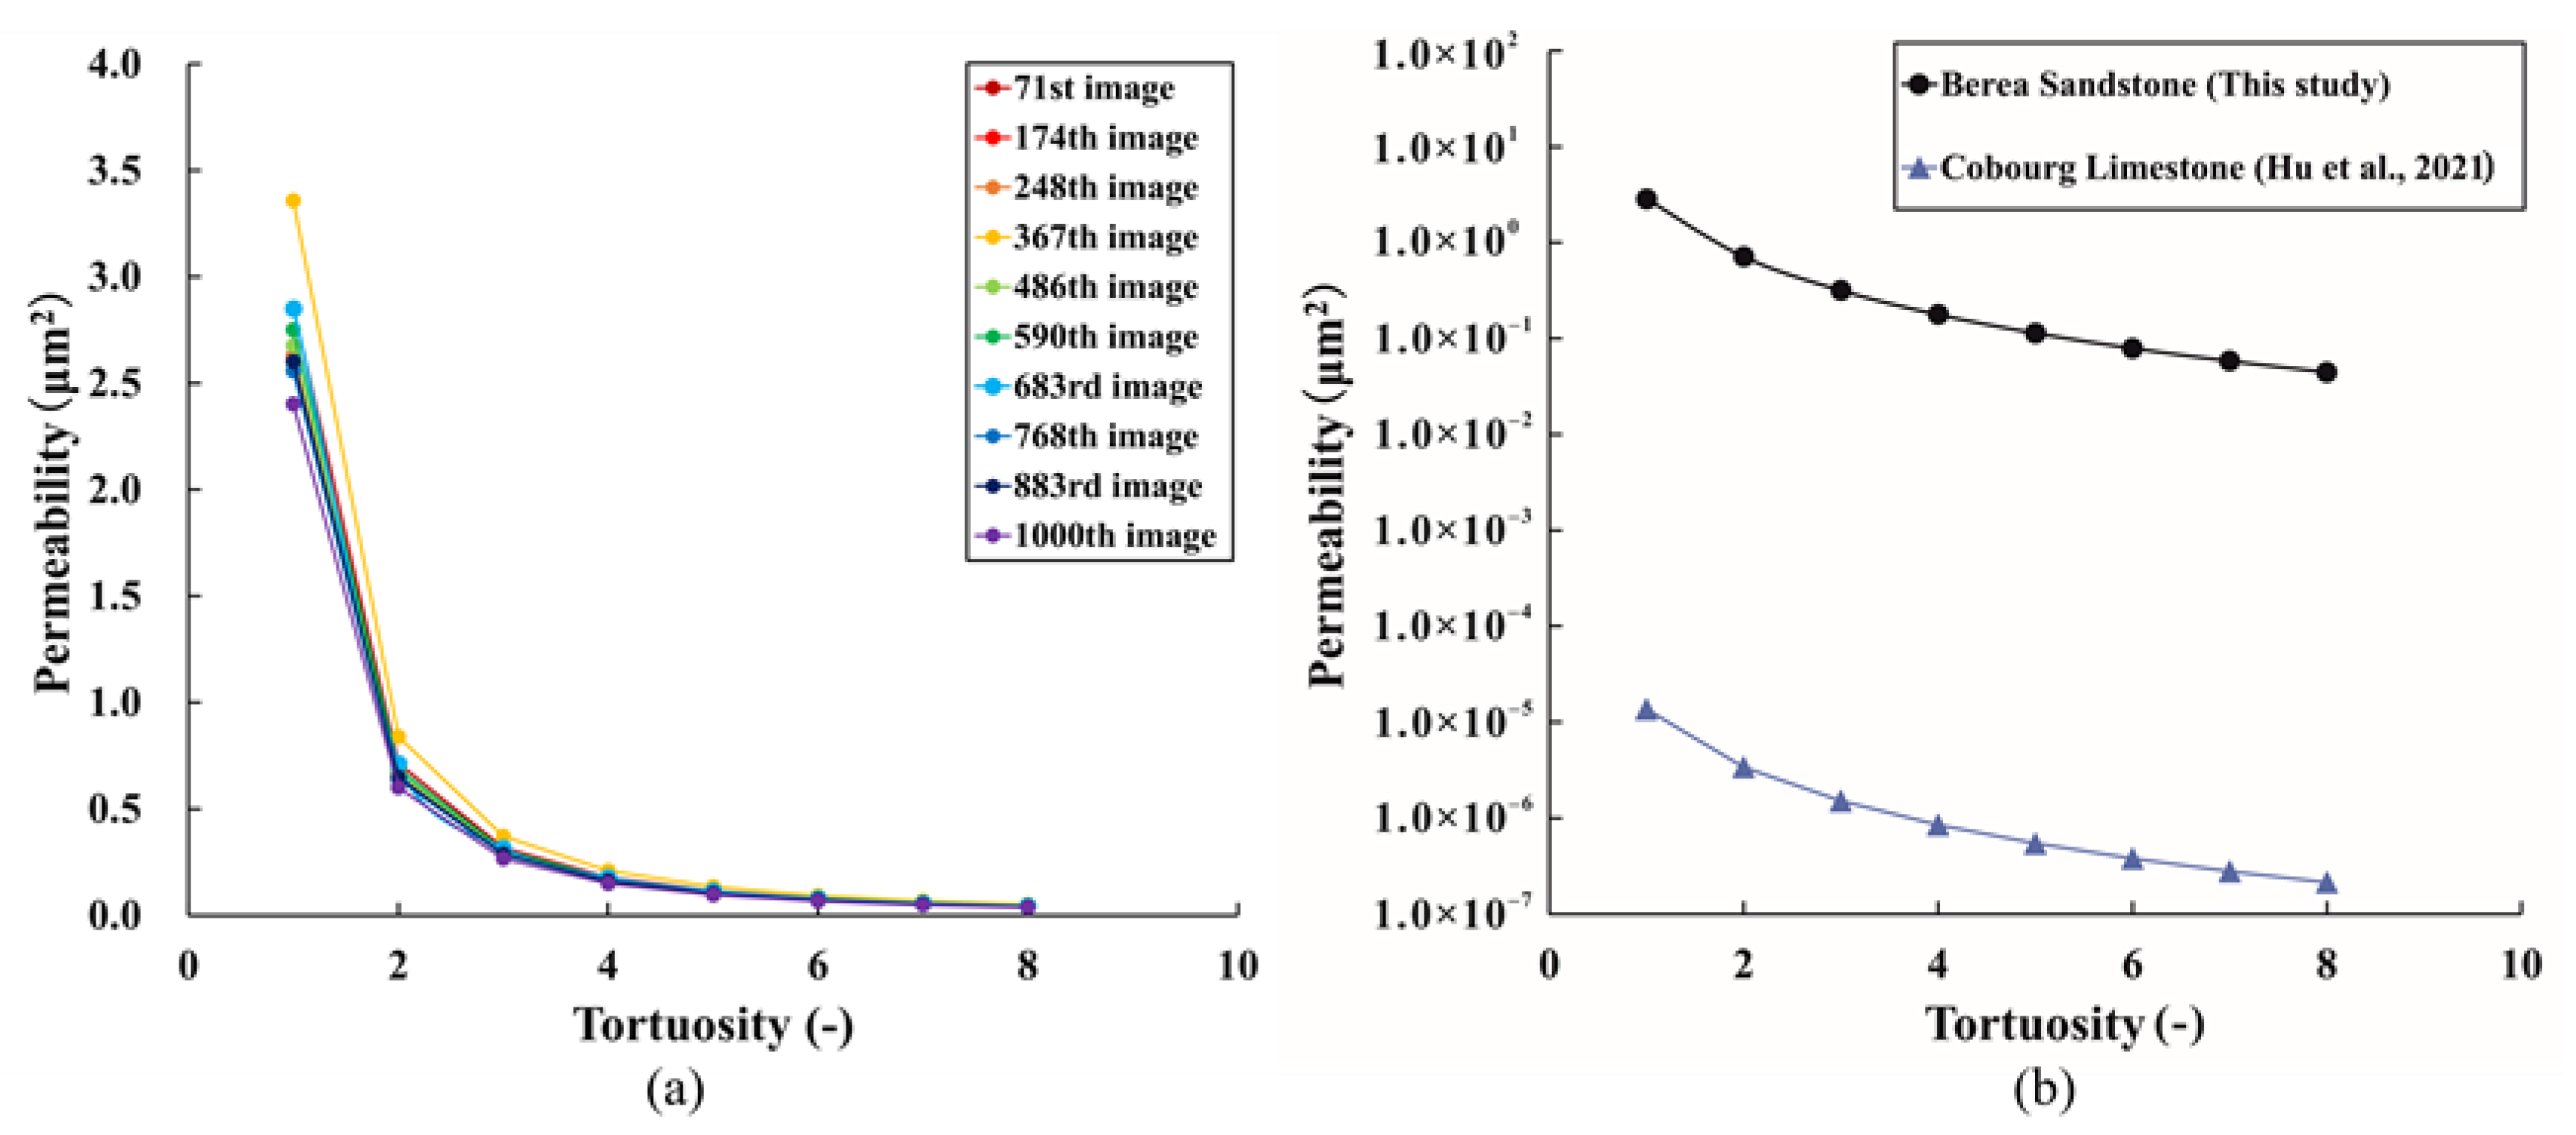
The permeability coefficients of Berea Sandstone estimated based on the “bundle of capillary tubes” model exponentially decrease with increasing tortuosity values. Based on this relationship, tortuosity values were calculated in the range of 4–6 to match the experimental permeability data.

Author Contributions

Conceptualization, Z.H.; methodology, Z.H.; software, Z.H. and K.Z.; validation, R.Z.; formal analysis, K.Z.; investigation, X.L.; resources, Y.J.; writing—original draft, K.Z.; writing—review & editing, Z.H., R.Z. and Q.Z.; supervision, W.G.; project administration, D.L. and X.Z.; funding acquisition, Z.H. and R.Z. All authors have read and agreed to the published version of the manuscript.

Funding

This research was funded by Henan Key Laboratory for Green and Efficient Mining & Comprehensive Utilization of Mineral Resources (Henan Polytechnic University) (Grant No. KCF2214), National Natural Science Foundation of China (Grant No. 42102166), Key Projects of the Universities in Henan Province (Grant No. 23A170006), Doctoral Foundation of Henan Polytechnic University (Grant No. B2022-54) and National Natural Science Foundation of China (Grant No. 41972175).

Data Availability Statement

The data presented in this study are available on request from the corresponding author. The data are not publicly available due to privacy.

Acknowledgments

We highly appreciate Rodrigo F. Neumann sharing the high-quality images.

Conflicts of Interest

The authors declare no conflict of interest.

References

  1. Pettijohn, F.J.; Potter, P.E.; Siever, R. Sand and Sandstone; Springer: New York, NY, USA, 2012. [Google Scholar]
  2. Leeder, M.R. Sedimentology and Sedimentary Basins: From Turbulence to Tectonics; Wiley: New York, NY, USA, 2009. [Google Scholar]
  3. Nichols, G. Sedimentology and Stratigraphy; Wiley: New York, NY, USA, 2009. [Google Scholar]
  4. Blatt, H.; Tracy, R.; Owens, B. Petrology: Igneous, Sedimentary, and Metamorphic; Macmillan: New York, NY, USA, 2006. [Google Scholar]
  5. Peters, E.J. Petrophysics; University of Texas at Austin: Austin, TX, USA, 2005. [Google Scholar]
  6. Anovitz, L.M.; Cole, D.R. Characterization and Analysis of Porosity and Pore Structures. Rev. Mineral. Geochem. 2015, 80, 61–164. [Google Scholar] [CrossRef] [Green Version]
  7. Tiab, D.; Donaldson, E.C. Theory and Practice of Measuring Reservoir Rock and Fluid Transport Properties; Gulf Professional Publishing: Burlington, MA, USA, 2015. [Google Scholar]
  8. Hu, Z.; Gaus, G.; Seemann, T.; Zhang, Q.; Littke, R.; Fink, R. Pore structure and sorption capacity investigations of Ediacaran and Lower Silurian gas shales from the Upper Yangtze platform, China. Geomech. Geophys. Geo-Energy Geo-Resour. 2021, 7, 1–26. [Google Scholar] [CrossRef]
  9. Busch, A.; Schweinar, K.; Kampman, N.; Coorn, A.; Pipich, V.; Feoktystov, A.; Leu, L.; Amann-Hildenbrand, A.; Bertier, P. Shale Porosity - What Can We Learn from Different Methods? In Proceedings of the Fifth EAGE Shale Workshop, Catania, Italy, 2–4 May 2016. [Google Scholar]
  10. Hu, Z.; Klaver, J.; Schmatz, J.; Dewanckele, J.; Littke, R.; Krooss, B.M.; Amann-Hildenbrand, A. Stress sensitivity of porosity and permeability of Cobourg limestone. Eng. Geol. 2020, 273, 105632. [Google Scholar] [CrossRef]
  11. Wardlaw, N.C.; McKellar, M. Mercury porosimetry and the interpretation of pore geometry in sedimentary rocks and artificial models. Powder Technol. 1981, 29, 127–143. [Google Scholar] [CrossRef]
  12. Abell, A.B.; Willis, K.L.; Lange, D.A. Mercury Intrusion Porosimetry and Image Analysis of Cement-Based Materials. J. Colloid Interface Sci. 1999, 211, 39–44. [Google Scholar] [CrossRef]
  13. Hildenbrand, A.; Urai, J.L. Investigation of the morphology of pore space in mudstones—First results. Mar. Petrol. Geol. 2003, 20, 1185–1200. [Google Scholar] [CrossRef]
  14. Kelly, S.; El-Sobky, H.; Torres-Verdin, C.; Balhoff, M.T. Assessing the utility of FIB-SEM images for shale digital rock physics. Adv. Water Resour. 2016, 95, 302–316. [Google Scholar] [CrossRef]
  15. Cnudde, V.; Boone, M.N. High-resolution X-ray computed tomography in geosciences: A review of the current technology and applications. Earth-Sci. Rev. 2013, 123, 1–17. [Google Scholar] [CrossRef] [Green Version]
  16. Andrä, H.; Combaret, N.; Dvorkin, J.; Glatt, E.; Han, J.; Kabel, M.; Keehm, Y.; Krzikalla, F.; Lee, M.; Madonna, C.; et al. Digital rock physics benchmarks-part II: Computing effective properties. Comput. Geosci. 2013, 50, 33–43. [Google Scholar] [CrossRef]
  17. Saxena, N.; Hofmann, R.; Alpak, F.O.; Berg, S.; Dietderich, J.; Agarwal, U.; Tandon, K.; Hunter, S.; Freeman, J.; Wilson, O.B. References and benchmarks for pore-scale flow simulated using micro-CT images of porous media and digital rocks. Adv. Water Resour. 2017, 109, 211–235. [Google Scholar] [CrossRef]
  18. Signoroni, A.; Savardi, M.; Baronio, A.; Benini, S. Deep Learning Meets Hyperspectral Image Analysis: A Multidisciplinary Review. J. Imaging 2019, 5, 52. [Google Scholar] [CrossRef] [PubMed] [Green Version]
  19. Chen, S.; Li, Y.; Zhang, T.; Zhu, X.; Sun, S.; Gao, X. Lunar features detection for energy discovery via deep learning. Appl. Energy 2021, 296, 117085. [Google Scholar] [CrossRef]
  20. Lucas, A.M.; Ryder, P.V.; Li, B.; Cimini, B.A.; Eliceiri, K.W.; Carpenter, A.E. Open-source deep-learning software for bioimage segmentation. Mol. Biol. Cell 2021, 32, 823–829. [Google Scholar] [CrossRef] [PubMed]
  21. Girish, V.; Vijayalakshmi, A.J.I.j.o.c. Affordable image analysis using NIH Image/ImageJ. Indian J. Cancer 2004, 41, 47. [Google Scholar]
  22. Schneider, C.A.; Rasband, W.S.; Eliceiri, K.W. NIH Image to ImageJ: 25 years of image analysis. Nat. Methods 2012, 9, 671–675. [Google Scholar] [CrossRef] [PubMed]
  23. Arena, E.T.; Rueden, C.T.; Hiner, M.C.; Wang, S.; Yuan, M.; Eliceiri, K.W. Quantitating the cell: Turning images into numbers with ImageJ. Wiley Interdiscip Rev. Dev. Biol. 2017, 6, e260. [Google Scholar] [CrossRef]
  24. Irving, B.A.; Weltman, J.Y.; Brock, D.W.; Davis, C.K.; Gaesser, G.A.; Weltman, A. NIH ImageJ and Slice-O-Matic Computed Tomography Imaging Software to Quantify Soft Tissue. Obesity 2007, 15, 370–376. [Google Scholar] [CrossRef]
  25. Grishagin, I.V. Automatic cell counting with ImageJ. Anal. Biochem. 2015, 473, 63–65. [Google Scholar] [CrossRef]
  26. Lumagui, K.N.M.; Manuel, L.J.R.; Quilloy, E.P.; Yaptenco, K.F. Varietal Classification of Selected Green Coffee Beans (Coffea arabica L. and Coffea canephora Pierre ex A. Froehner) Using Image Processing Software. Philipp. J. Agric. Biosyst. Eng. 2020, 16, 16. [Google Scholar]
  27. Grove, C.; Jerram, D.A. jPOR: An ImageJ macro to quantify total optical porosity from blue-stained thin sections. Comput. Geosci. 2011, 37, 1850–1859. [Google Scholar] [CrossRef]
  28. Wopara, F.O.; Lyuke, S.E. Prediction of flow and transport properties in porous media. Int. J. Oil Gas Coal Technol. 2018, 17, 284–303. [Google Scholar] [CrossRef]
  29. Ettensohn, F.R. Modeling the nature and development of major paleozoic clastic wedges in the Appalachian Basin, USA. J. Geodyn. 2004, 37, 657–681. [Google Scholar] [CrossRef]
  30. Qiu, K. Tectonic Evolution and Sedimentary Characteristics of Foreland Basin in North America; China University of Geosciences (Beijing): Beijing, China, 2013. [Google Scholar]
  31. Thomas, W.A. The Appalachian-Ouachita rifted margin of southeastern North America. GSA Bull. 1991, 103, 415–431. [Google Scholar] [CrossRef]
  32. Greb, S.F.; Harris, D.C.; Bowersox, J.R. Reservoir geology of the Berea Sandstone (uppermost Devonian), eastern Kentucky. AAPG Bull. 2021, 105, 597–628. [Google Scholar] [CrossRef]
  33. Pepper, J.F.; de Witt, W.; Demarest, D.F. Geology of the Bedford Shale and Berea Sandstone in the Appalachian Basin. Science 1954, 119, 512–513. [Google Scholar] [CrossRef] [PubMed]
  34. Parris, T.M.; Nuttall, B.C. Berea Sandstone: New developments in a mature oil and gas play, eastern Kentucky and Ohio. AAPG Bull. 2021, 105, 485–492. [Google Scholar] [CrossRef]
  35. Hackley, P.C.; Parris, T.M.; Eble, C.F.; Greb, S.F.; Harris, D.C. Oil–source correlation studies in the shallow Berea Sandstone petroleum system, eastern Kentucky. AAPG Bull. 2021, 105, 517–542. [Google Scholar] [CrossRef]
  36. Churcher, P.L.; French, P.R.; Shaw, J.C.; Schramm, L.L. Rock Properties of Berea Sandstone, Baker Dolomite, and Indiana Limestone. In Proceedings of the SPE International Symposium on Oilfield Chemistry, Anaheim, CA, USA, 20–22 February 1991. [Google Scholar]
  37. Neumann, R.F.; Barsi-Andreeta, M.; Lucas-Oliveira, E.; Barbalho, H.; Trevizan, W.A.; Bonagamba, T.J.; Steiner, M.B. High accuracy capillary network representation in digital rock reveals permeability scaling functions. Sci. Rep. 2021, 11, 11370. [Google Scholar] [CrossRef]
  38. Leu, L.; Berg, S.; Enzmann, F.; Armstrong, R.T.; Kersten, M. Fast X-ray Micro-Tomography of Multiphase Flow in Berea Sandstone: A Sensitivity Study on Image Processing. Transp. Porous Media 2014, 105, 451–469. [Google Scholar] [CrossRef]
  39. Prodanovic, M.; Maria, E.; Matthew, H.; Gaurav, N.; Prateek, A. Digital Rocks Portal: A repository for porous media images. 2015. [Google Scholar] [CrossRef]
  40. Lucas-Oliveira, E.; Barsi-Andreeta, M.; Neumann, R.F.; Trevizan, W.A.; Steiner, M.B.; Bonagamba, T.J. Micro-computed tomography of sandstone rocks: Raw, filtered and segmented datasets. Data Brief 2022, 41, 107893. [Google Scholar] [CrossRef]
  41. Buades, A.; Coll, B.; Morel, J.-M. Non-Local Means Denoising. Image Process. Line 2011, 1, 208–212. [Google Scholar] [CrossRef] [Green Version]
  42. Ridler, T.W.; Calvard, S. Picture Thresholding Using an Iterative Selection Method. IEEE Trans. Syst. Man Cybern. 1978, 8, 630–632. [Google Scholar] [CrossRef]
  43. Huang, L.-K.; Wang, M.-J.J. Image thresholding by minimizing the measures of fuzziness. Pattern Recognit. 1995, 28, 41–51. [Google Scholar] [CrossRef]
  44. Otsu, N. A Threshold Selection Method from Gray-Level Histograms. IEEE Trans. Syst. Man Cybern. 1979, 9, 62–66. [Google Scholar] [CrossRef] [Green Version]
  45. Philipp, T.; Amann-Hildenbrand, A.; Laurich, B.; Desbois, G.; Littke, R.; Urai, J.L. The effect of microstructural heterogeneity on pore size distribution and permeability in Opalinus Clay (Mont Terri, Switzerland): Insights from an integrated study of laboratory fluid flow and pore morphology from BIB-SEM images. Geol. Soc. London Spéc. Publ. 2017, 454, 85–106. [Google Scholar] [CrossRef]
  46. Hu, Z.; Lu, S.; Klaver, J.; Dewanckele, J.; Amann-Hildenbrand, A.; Gaus, G.; Littke, R. An Integrated Imaging Study of the Pore Structure of the Cobourg Limestone—A Potential Nuclear Waste Host Rock in Canada. Minerals 2021, 11, 1042. [Google Scholar] [CrossRef]
Figure 1. Tectonic map of central Appalachian Basin and the study area. The green box indicates the location of the study area. Thick Bedford–Berea strata (more than 30 m) are distributed in the irregular yellow zone. Pink and red lines indicate arches and faults, respectively. CA = Cincinnati arch; WA = Waverly arch; LFS = Lexington fault system; KRFS = Kentucky River fault system; IPCFS = Irvine–Paint Creek fault system; RRFS = Rockcastle River fault system.
Minerals 13 00360 g001
Figure 2. Upper Devonian and Lower Mississippian stratigraphy sequence in eastern Kentucky.
Minerals 13 00360 g002
Figure 3. Grayscale images before (a) and after (b) applying the contrast enhancement and noise reduction filters.
Minerals 13 00360 g003
Figure 4. The segmentation results and calculated porosities (ϕ) of the 683rd image based on “Default”, “Huang” and “Otsu” methods (the red and blue colors represent pores and the green color represents mineral grains ).
Minerals 13 00360 g004
Figure 5. (a) Relationship between aspect ratios and circularity values of pores; (b) area fractions of slit-shaped, irregular and high-circularity pores.
Minerals 13 00360 g005
Figure 6. (a) Porosity distribution over an equivalent pore diameter range of 300 μm; (b) cumulative porosity plotted against median equivalent diameter.
Minerals 13 00360 g006
Figure 7. (a) Relationships between tortuosity values and permeability coefficients calculated on the pore geometry data from 10 selected images of Berea Sandstone; (b) relationships between tortuosity values and permeability coefficients calculated on the pore geometry data from the 683rd image of Berea Sandstone and BIB-SEM image of Cobourg Limestone [46].
Minerals 13 00360 g007
Table 1. Porosity and permeability of Berea Sandstone published in the literature.
Sampling SiteNorthern OhioEastern KentuckyNortheastern KentuckySouthern Ohio
Porosity (%)19.04–26.012.01–16.1018.86–19.0516.7–18.7
Methods for porosity measurementsSEMMIPHPMicro-CT
Permeability (mD)114~11685 × 10−5–2.5109~133320~780
Methods for permeability measurementsSteady-state gas flowPulsed neutron decaySteady-state gas flowLattice Boltzmann
Data source[36] [32] [37][38]
Table 2. Summary of the pore geometry parameters of the Berea Sandstone.
Image NumberNumber of PoresTotal Pore Area (μm2)Average Pore Area (μm2)Average Perimeter (μm)Average CircularityAverage Aspect Ratio
71356985,866.182769.29297.910.481.90
174367994,492.682709.78302.820.461.94
248397960,503.062419.40272.540.501.93
367351991,764.002825.54294.280.491.90
4863571,015,765.312845.28314.360.481.95
590378975,386.812580.38283.920.481.94
683341988,572.752899.04315.670.471.97
768416912,627.002193.81251.970.501.97
883376936,506.812490.72275.160.501.95
1000366947,649.372589.21293.400.491.92
Table 3. Calculated porosities of the segmented images based on three different thresholding methods (Default, Huang, and Otsu).
Image Number711742483674865906837688831000
Default (%)19.4719.6418.9719.5920.0619.2719.5318.0318.5018.72
Huang (%)19.4719.6819.1420.0818.9618.3319.5118.0418.7618.87
Otsu (%)19.4819.6718.9420.0719.0218.2919.1218.3118.7618.84
Average porosity (%)19.4719.6619.0219.9119.3518.6319.3918.1318.6718.81
SD (%)0.010.020.110.280.620.550.230.160.150.08
Note: SD stands for the standard deviation of the porosities based on three thresholding methods.
Disclaimer/Publisher’s Note: The statements, opinions and data contained in all publications are solely those of the individual author(s) and contributor(s) and not of MDPI and/or the editor(s). MDPI and/or the editor(s) disclaim responsibility for any injury to people or property resulting from any ideas, methods, instructions or products referred to in the content.

