Article

A Negative Value of the Non-Darcy Flow Coefficient in Pore-Fracture Media under Hydro-Mechanical Coupling

1
School of Civil and Resource Engineering, University of Science and Technology Beijing, Beijing 100083, China
2
Shunde Innovation School, University of Science and Technology Beijing, Foshan 528399, China
3
Shangyuquan Coal Mine, Shanxi Luneng Hequ Electric Coal Development Co., Ltd., Xinzhou 034000, China
*
Author to whom correspondence should be addressed.
Minerals 2023, 13(3), 373; https://doi.org/10.3390/min13030373
Submission received: 15 February 2023 / Revised: 27 February 2023 / Accepted: 2 March 2023 / Published: 7 March 2023

Abstract

:
The Forchheimer equation is widely used in studying non-Darcy flow. Non-Darcy flow coefficient β in the Forchheimer equation is generally thought to be positive, and there are few studies on negative values. In this work, we performed seepage tests on sandstone samples with single, T-shaped, and Y-shaped fractures under different confining pressures, water pressures, and angles to analyze the nonlinear seepage behaviors and the features of Forchheimer’s coefficients of water flow in pore-fracture media. At the same time, the flow trajectory of the fluid inside the sample is studied by numerical simulation. The results showed that β was negative in the seepage test in pore-fracture media. The angle of the single-fracture sandstone sample had a greater influence on the seepage characteristic of the pore-fracture media; angles of the sandstone samples with T-shaped and Y-shaped fractures had a relatively small impact. The relationship between β and inherent permeability k was following a power function, and the differences in the seepage characteristics between the three fractures were compared. The use of the normalized hydraulic conductivity method is used to evaluate the applicability of Darcy’s law. Finally, we explained the primary cause of non-linear seepage behaviors with negative β in fractured sandstone samples.

1. Introduction

The fluid (Newtonian fluid) flow state is a key coefficient affecting the trajectory of fluid particles and the energy loss in the flow process. Accurately determining the flow state of the fluid is vital in studying the law of fluid movement in a fracture. Usually, seepage flow (seepage flow refers to the movement and filtering behavior of liquids as they pass through porous media) in geotechnical and water conservancy projects is relatively slow. Most scholars believed that the flow process could be described by Darcy’s law at this time. However, a large number of engineering practices show that Darcy’s law is not sufficient to fully describe the seepage behaviors in pores and fractures, and fluids often exhibit significant nonlinear seepage behavior in pores and fractures [1,2,3,4,5,6]. In terms of nonlinear seepage behavior, researchers chose the Forchheimer equation to describe the nonlinear seepage characteristic of water flow in rocks, with a clear theoretical basis [7,8,9,10,11,12,13,14,15,16,17,18]. Moreover, theoretical derivation and non-Darcy flow tests in porous media and fractures have verified the correctness and rationality of the Forchheimer equation. In porous media, Zeng and Grigg, Sidiropoulou et al., Moutsopoulos et al., Eck et al., and Ghane et al. established the functional relationship among the particle diameter, porosity, and Forchheimer’s coefficients (the coefficient of the viscous term and the inertia term) based on theoretical derivation or empirical summary [7,8,9,10,11]. In fractured media, Zhang and Nemcik, Johnson et al., Qian et al., and Zou et al. have found that viscosity and inertia coefficients affect the fluid flow state in fractures [15,19,20,21].
Therefore, whether in porous or fractured media, researchers usually used the Forchheimer equation to fit experimental data to determine the key coefficients (viscosity and inertia coefficient) and establish the relationship between inertia coefficient, friction coefficient, and critical Reynolds number and geometric parameters or pore structure parameters [8,9,22,23,24,25]. In addition, early studies suggested that it was a non-Darcy effect caused by turbulence and used the coefficient β to characterize the turbulence factor [26]. With the development of the theoretical background of the Forchheimer equation, both Ruth and Ma and Li and Engler studies showed that non-Darcy effects are caused by inertial effects that cannot be ignored rather than turbulence [27,28]. Then, the coefficient β is called the non-Darcy flow coefficient (also called the inertial resistance coefficient), and its value can directly determine the magnitude of the inertia term coefficient in the Forchheimer equation. Therefore, the coefficient β is very important for characterizing non-Darcy flow.
Researchers processed a large amount of experimental data and found that in the porous or fractured seepage test, the non-Darcy flow coefficient β is usually a positive value, but there is also a negative value [15,29,30,31,32,33,34,35,36]. At present, there are still few studies on the negative value of the non-Darcy flow coefficients in the Forchheimer equation, and there are even fewer reports on that in pore-fracture media.
In this work, we prefabricated sandstone samples with single, T-shaped, and Y-shaped fractures under different angles and then conducted seepage tests on fractured sandstone samples containing pore-fracture media. The characteristics of Forchheimer’s key parameters in the pore-fracture media were analyzed. At the same time, the reasons for the negative values of non-Darcy flow coefficient were revealed by laboratory experiment and numerical simulation methodology. Its physical significance was expounded to provide useful references for actual engineering. The specific objectives of this paper include: (i) The conditions for the negative value of non-Darcy flow coefficient β to be satisfied are theoretically analyzed. (ii) The characteristics of Forchheimer key parameters in pore-fracture media are obtained through laboratory experiments and numerical simulations, and the reasons for the negative value of non-Darcy flow coefficient are clarified. (iii). The expressions of Forchheimer key parameters and the determination of critical pressure gradient are discussed in the case where the non-Darcy discharge coefficient β is negative. (iv) Fluid flow trajectories in multi-shaped pore-fracture media through numerical simulation research are obtained.

2. Theoretical Background

Most underground engineering transportation phenomena are controlled by fluids in rock fractures or pores media. It is important to understand the boundaries between different flow states to grasp the flow law. Darcy’s law is usually used to describe the flow law in porous or fractured media, and its formula is as follows [14,37,38]:
Q = k A μ P
where ∇P [Pa/m] is the pressure gradient along the flow direction; Q [m3/s] is the volume flow; μ [Pa·s] is the dynamic viscosity coefficient of the fluid; k [m2] is the inherent permeability, which is the key hydraulic characteristic of water flow in pore-fracture media and determined through experiments; A [m2] is the flow area of the rock; A = πd2/4; and d [m] is the sample diameter.
There are examples of non-Darcy flow in real environments such as oil exploration, mining development, and hydraulic engineering [39]. The Forchheimer equation, usually used to describe non-Darcy flow, is a further extension of Darcy’s law by adding a quadratic term that considers the effects of nonlinear inertia [40]. The results show that the Forchheimer equation can describe the seepage behaviors in pore-fracture media, expressed as follows:
P = a Q + b Q 2
a = μ k A
b = β ρ A 2
where a [Pa·s·m−4] and b [Pa·s2·m−7] are the linear and non-linear coefficients, respectively. Coefficient a is related to the viscous force (viscous friction force) of the water–solid interface. Coefficient b describes the inertial effect caused by the irreversible loss of kinetic energy due to fluid flow; ρ [kg·m−3] is the fluid density; β [m−1] is the non-Darcy flow coefficient, determined through experiments.
In addition, according to the Forchheimer equation, the corresponding one-dimensional momentum equation is expressed as:
ρ c a v t = P L μ k v ρ β v 2 + F
where ca is the acceleration coefficient; v [m/s] is the velocity of fluid flow; F [N/kg] is the volume force. The pressure gradient term in Equation (5) is relatively large due to the small height of the sample used in the indoor test, so the volume force can be ignored. The indoor test adopts the steady-state method in the work. When the time exceeds a certain value, the seepage flow reaches a stable state, and ∂v/∂t = 0. When the seepage flow is stable, the momentum equation is:
P L μ k v ρ β v 2 = 0
That is,
P a Q b Q 2 = P μ k A Q ρ β Q 2 A 2 = 0
Equation (7) is used to discuss the sign of the non-Darcy flow coefficient β value and the physical meaning of its characterization.
(1)
When β > 0 and β > −μ2/4ρ|−∇P|k2, the β value is positive, and Equation (7) has a solution. The seepage system has an equilibrium state, and the non-linear seepage characteristic in Figure 1 is generally present in most hydraulic tests. The nonlinear seepage characteristic is due to the obvious inertia effect causing additional pressure loss. Therefore, the increase of −∇P is greater than that of Q in linear proportion, and the nonlinear curve is convex to the Q axis.
(2)
When −μ2/4ρ|−∇P|k2 < β < 0, the β value is negative, Equation (7) has a solution, and the seepage system has an equilibrium state. There are currently two explanations for the causes of such non-linear characteristics. (1) Under the confining pressure, the non-linear flow is caused by the expansion of rock fractures with the increased seepage water pressure [34]. The pores or cracks in the rock are compressed under the confining pressure. The confining pressure is reduced with the increased seepage water pressure, which leads to expanded fractures and increased flow rates. It gradually shows non-linearity. Develi and Babadagli also observed a similar phenomenon in their experiments [41]. In addition, this phenomenon has also widely appeared in rock engineering such as dams, shale gas/oil wells, and tunnels [22,34]. Mastering such nonlinear seepage characteristics is vital for the seepage characteristic evaluation and optimization design of rock engineering. (2) The non-linear flow is due to strong solid–liquid interaction (solid–liquid interface effect) in the rocks of low-permeability, micro/nano-scale, pore-fracture media [33,34,35]. This is similar to the flow behaviors of non-Newtonian fluids. We should strengthen the research on the flow mechanism of micro/nano-scale fractures in the future.
(3)
When β <μ2/4ρ|−∇P|k2 < 0, Equation (7) has no solution, and there is no equilibrium state in the seepage system. The pore and fracture structures inside the rock change when the hydraulic–mechanical coupling develops to a certain stage and degree. Fluid flow expands the seepage channel, which may lead to the complete loss of the barrier effect of the rock on the fluid. It greatly changes its permeability and ultimately causes seepage instability. Li Wenliang et al. expounded this phenomenon through experiments [35]. In mining engineering, as the rock mass is affected by mining, its pore and fracture structures significantly change. Correspondingly, the seepage characteristic changes greatly, resulting in the instability of the seepage system and inducing water inrush disasters.

3. Experimental and Simulation Methodology

3.1. Laboratory Experiment

3.1.1. Sample Preparation

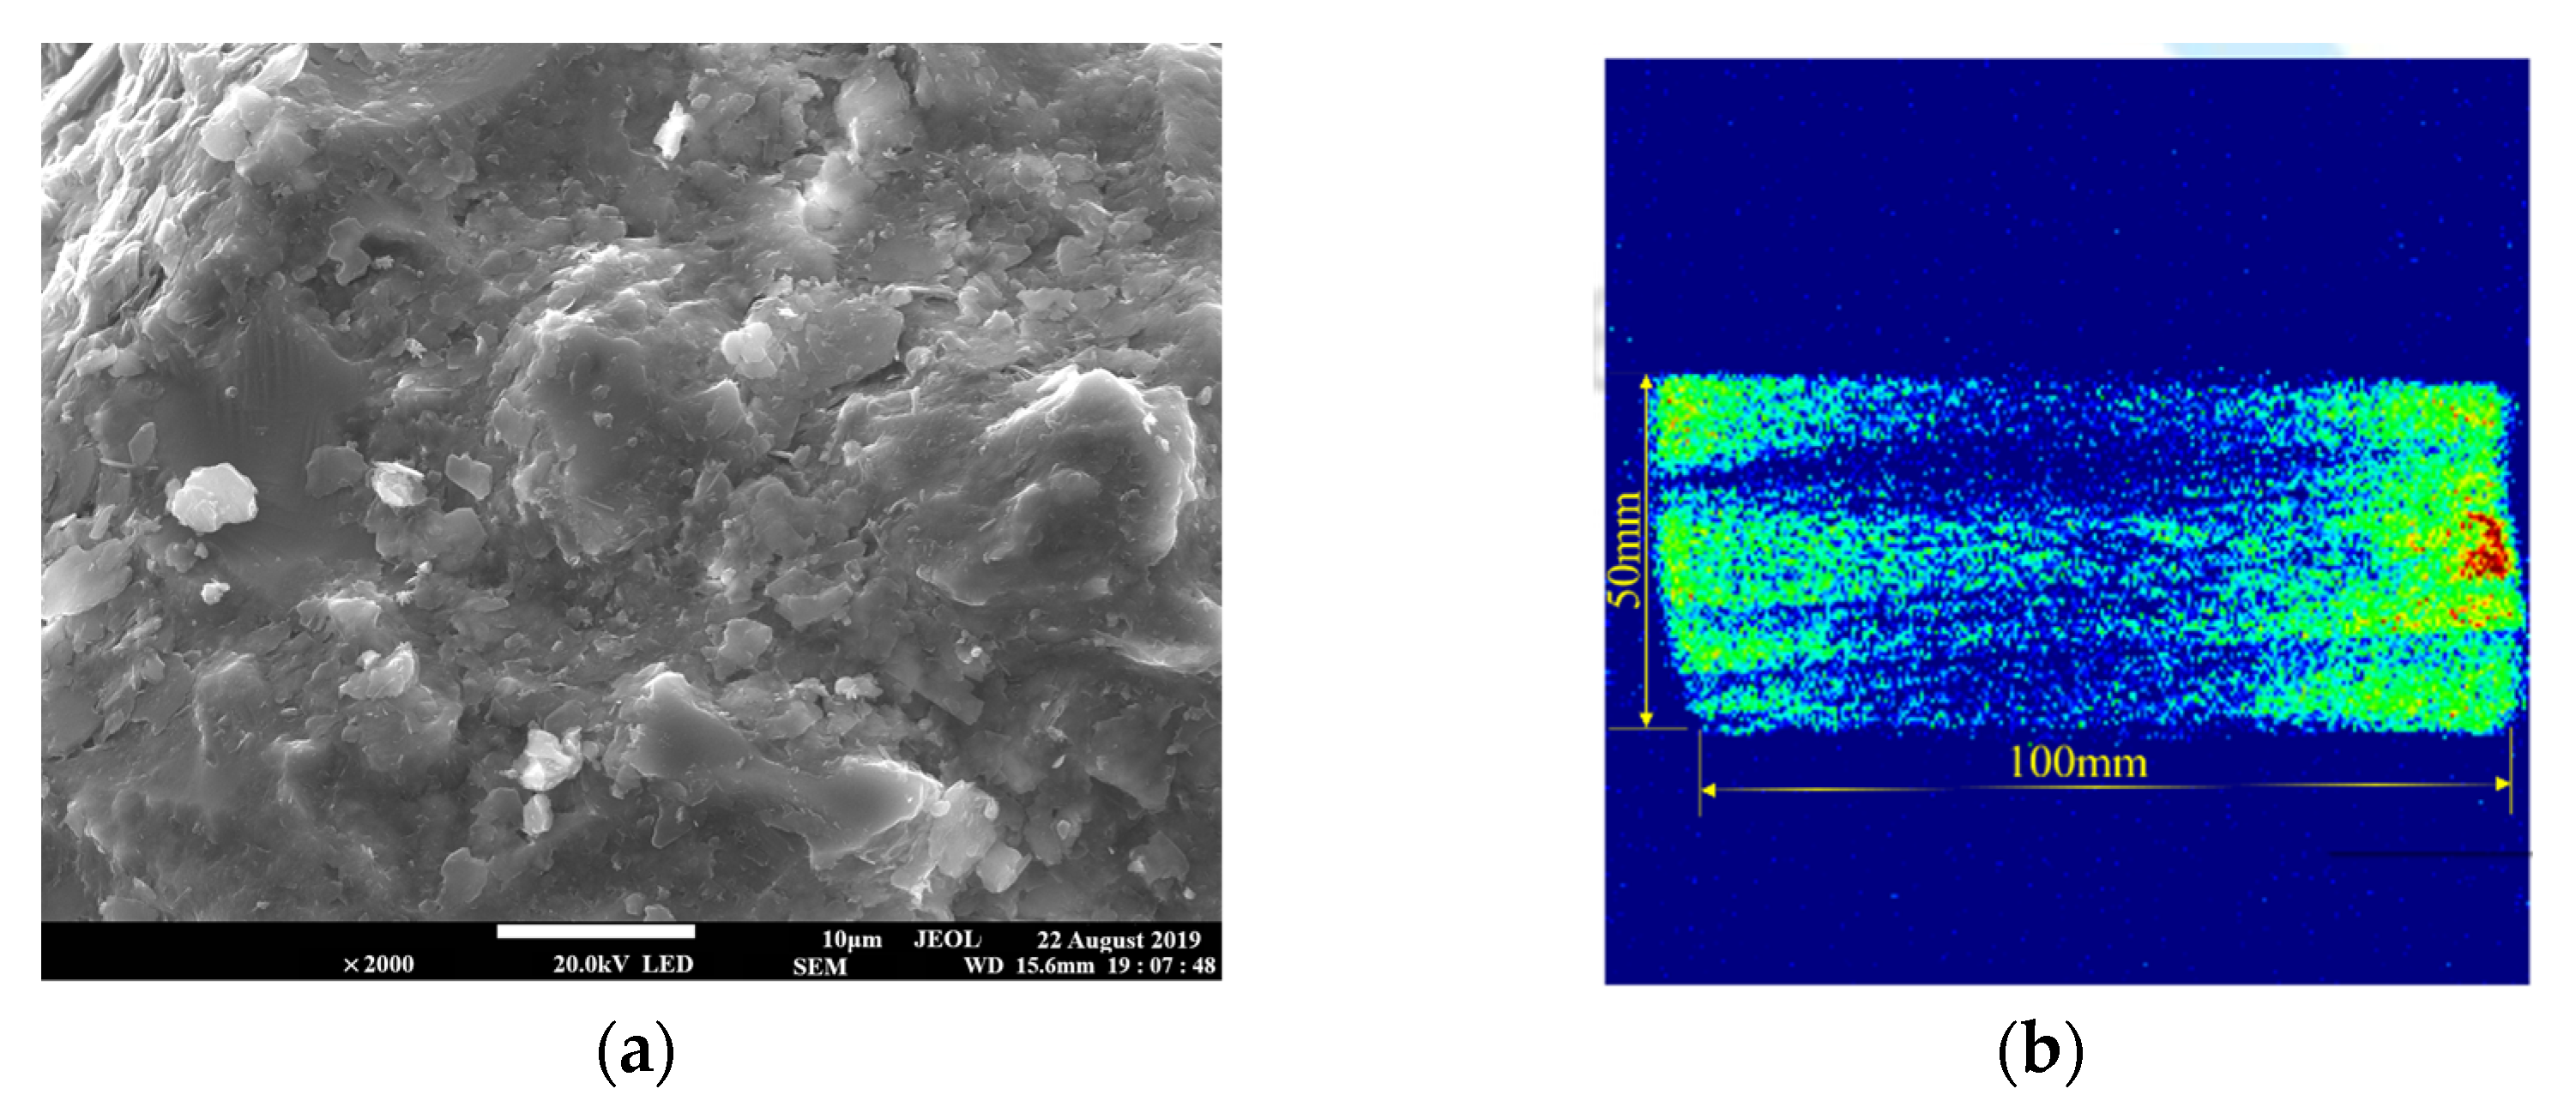
The selected sandstone surface had no obvious texture with the hard material texture. In the natural state, it was light yellow and had a block structure with fine–medium-grained sands. The main mineral components of sandstone samples include: quartz 75%, feldspar 6%, and others 19%. Following the sample preparation standards recommended by the International Society for Rock Mechanics (ISRM), the core, cutting, and polishing were successively processed into cylindrical samples of ϕ50 × 100 mm. The average density was 2240.33 kg/m3, and the average longitudinal-wave velocity was 2.19 km/s by testing 22 standard sandstone samples. Figure 2a shows many interconnected pore structures in the sample, which provide flow channels for fluids. The pseudo-color image in Figure 2b shows that the moisture distribution inside the sample is uneven, with brighter colors at the upper and lower ends and weaker brightness at the middle. The brighter color indicates higher water content and larger pores.
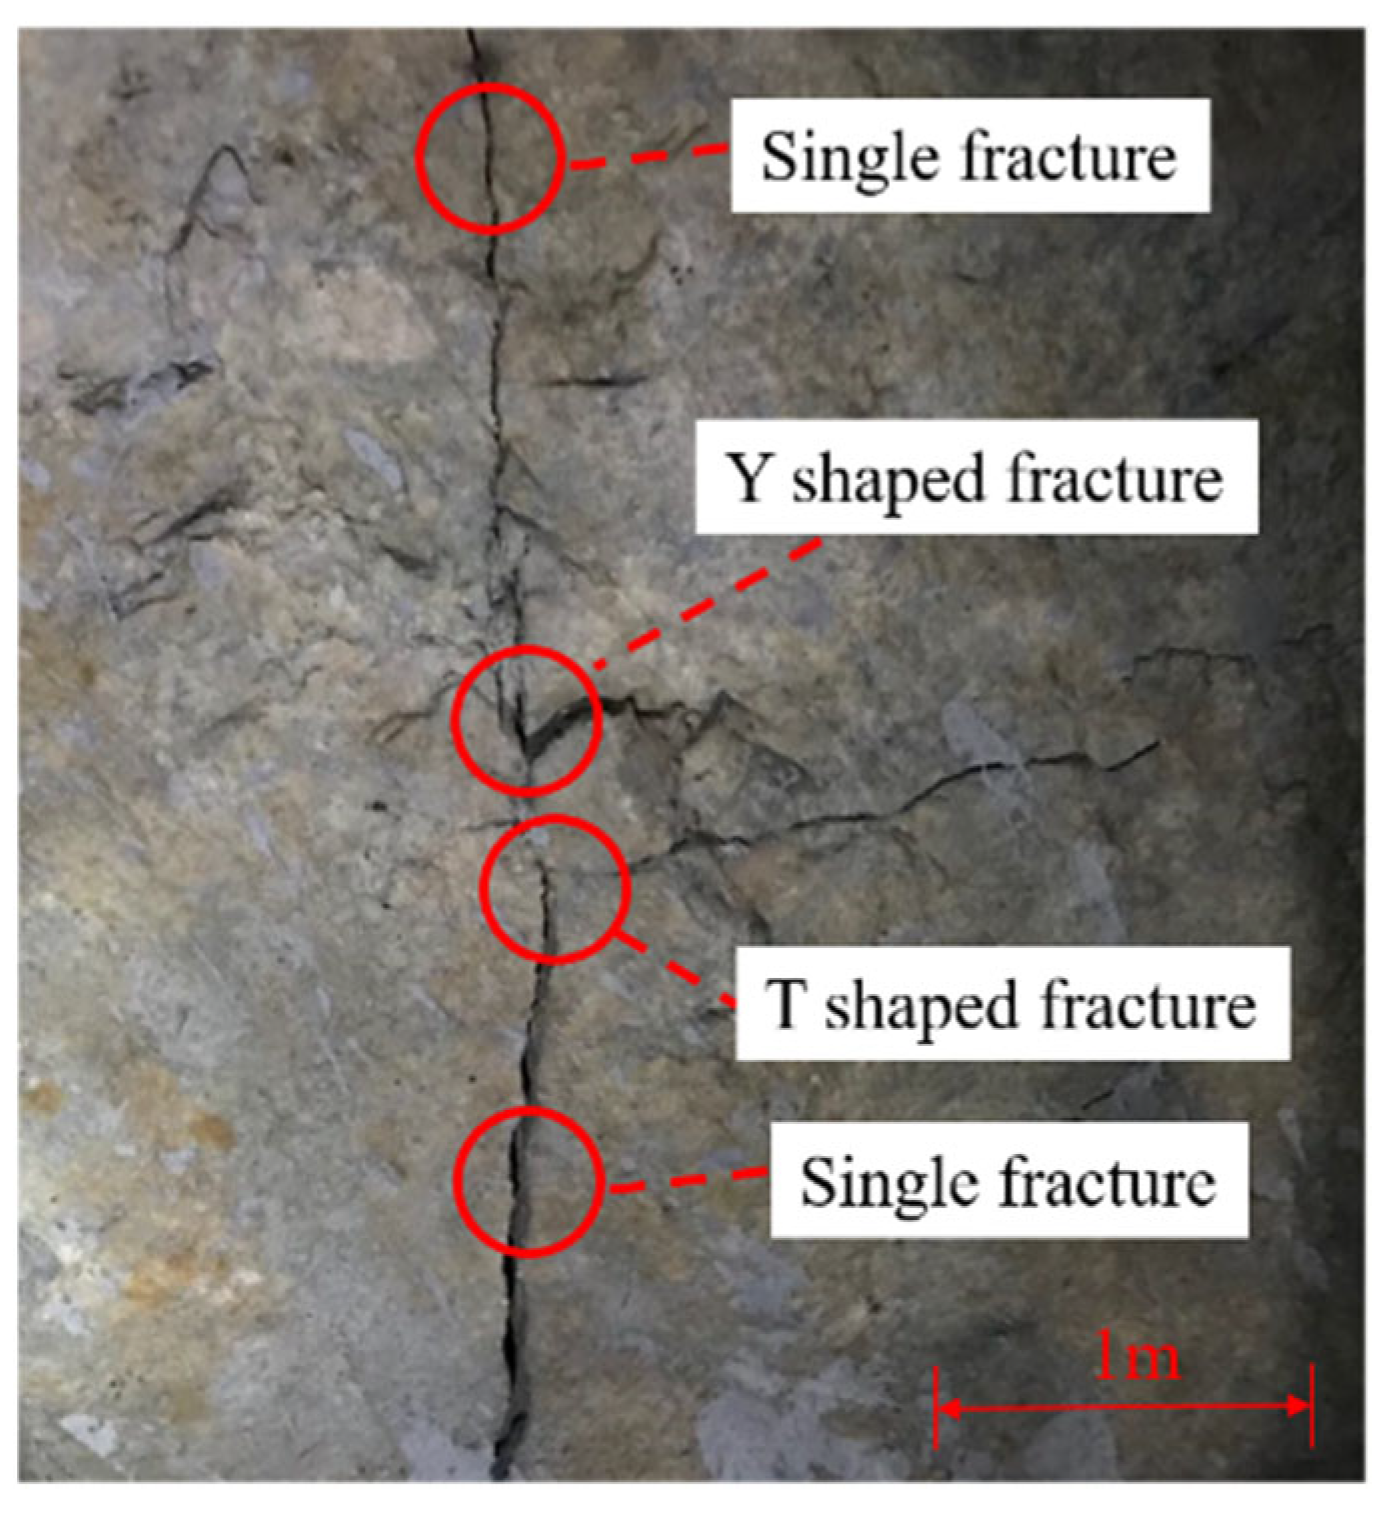
The engineering construction activities such as underground mining engineering, large-scale water conservancy and hydropower engineering and nuclear waste disposal cause the surrounding rock to produce different shapes of fracture (single fracture, T-shaped fracture, and Y-shaped fracture) channels under the action of excavation and mining stress (e.g., Figure 3). The existence of fractures with different shapes will reduce the strength of rock mass and greatly change the permeability characteristics of rock mass [42], resulting in frequent engineering accidents such as water inrush accidents and dam instability. Therefore, it is of great engineering significance to study the seepage characteristics of pore-fracture combined media by processing prefabricated single fracture, T-shaped fracture, and Y-shaped fracture sandstone samples.
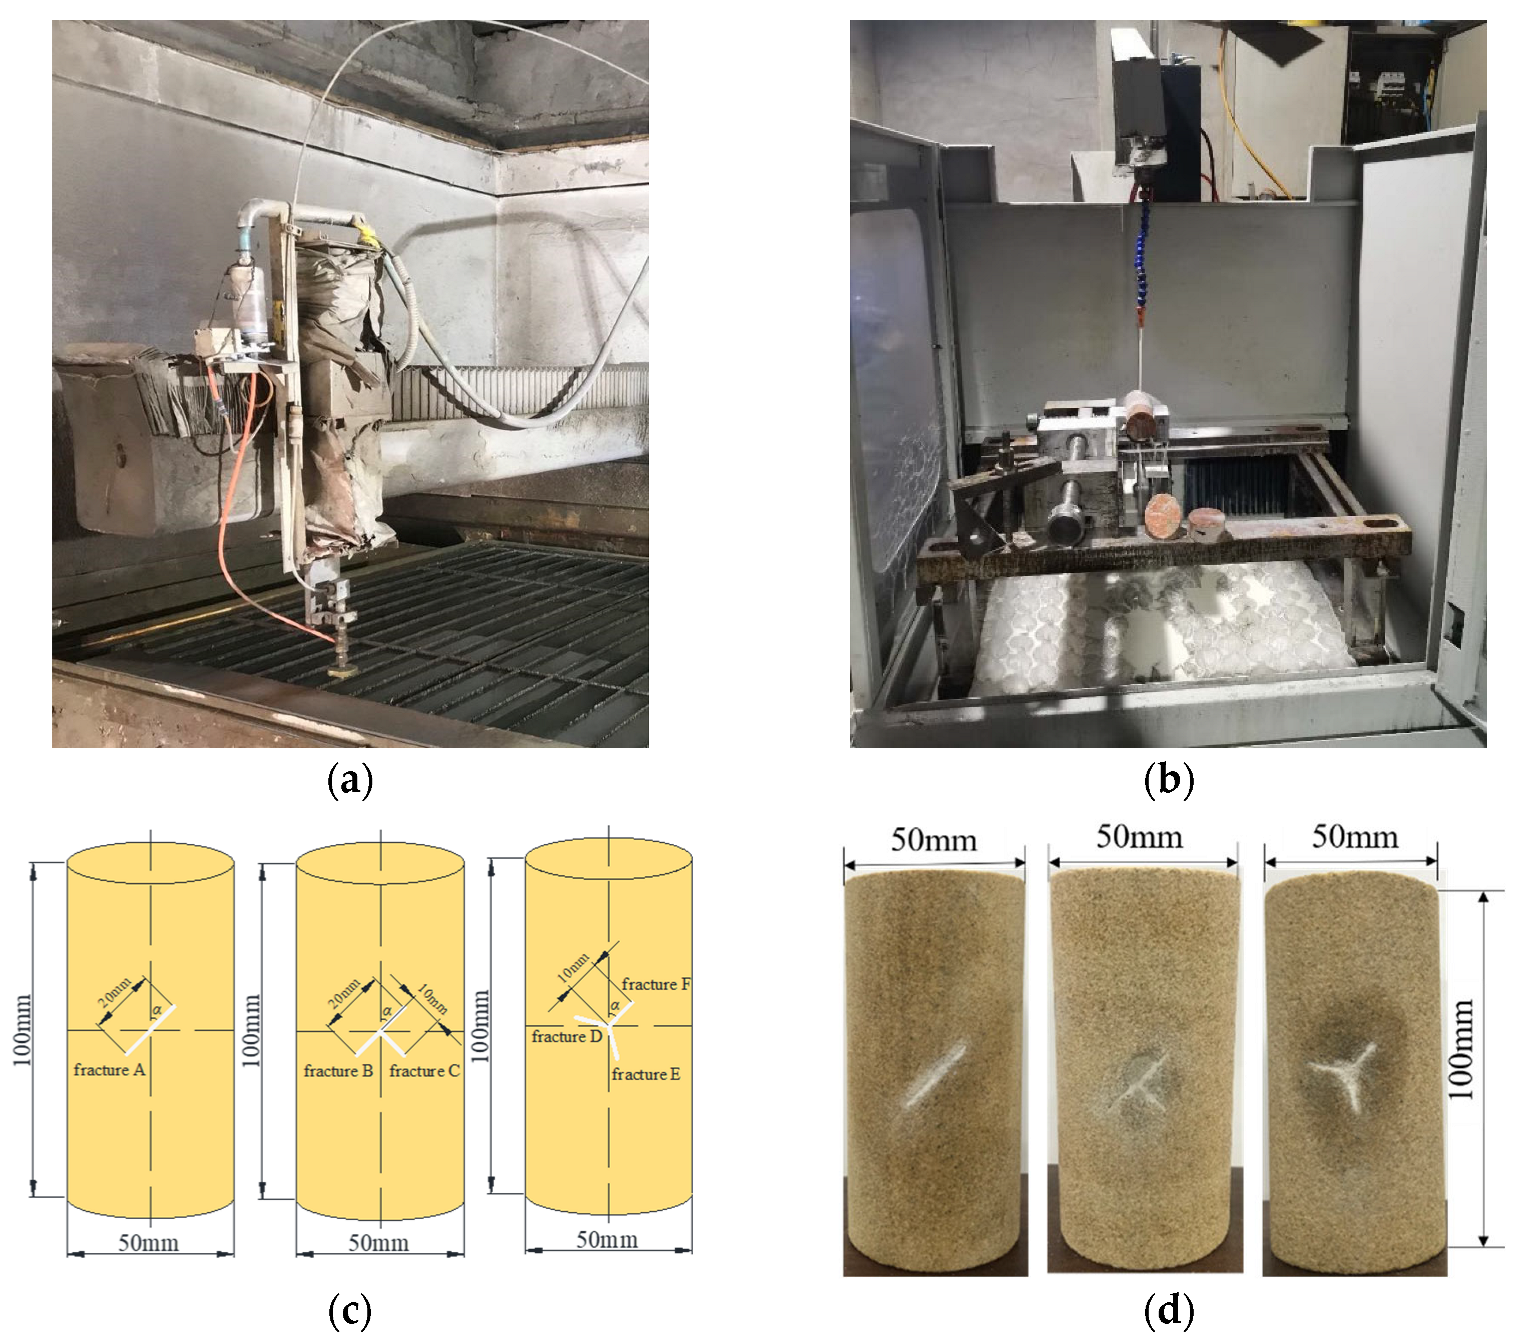
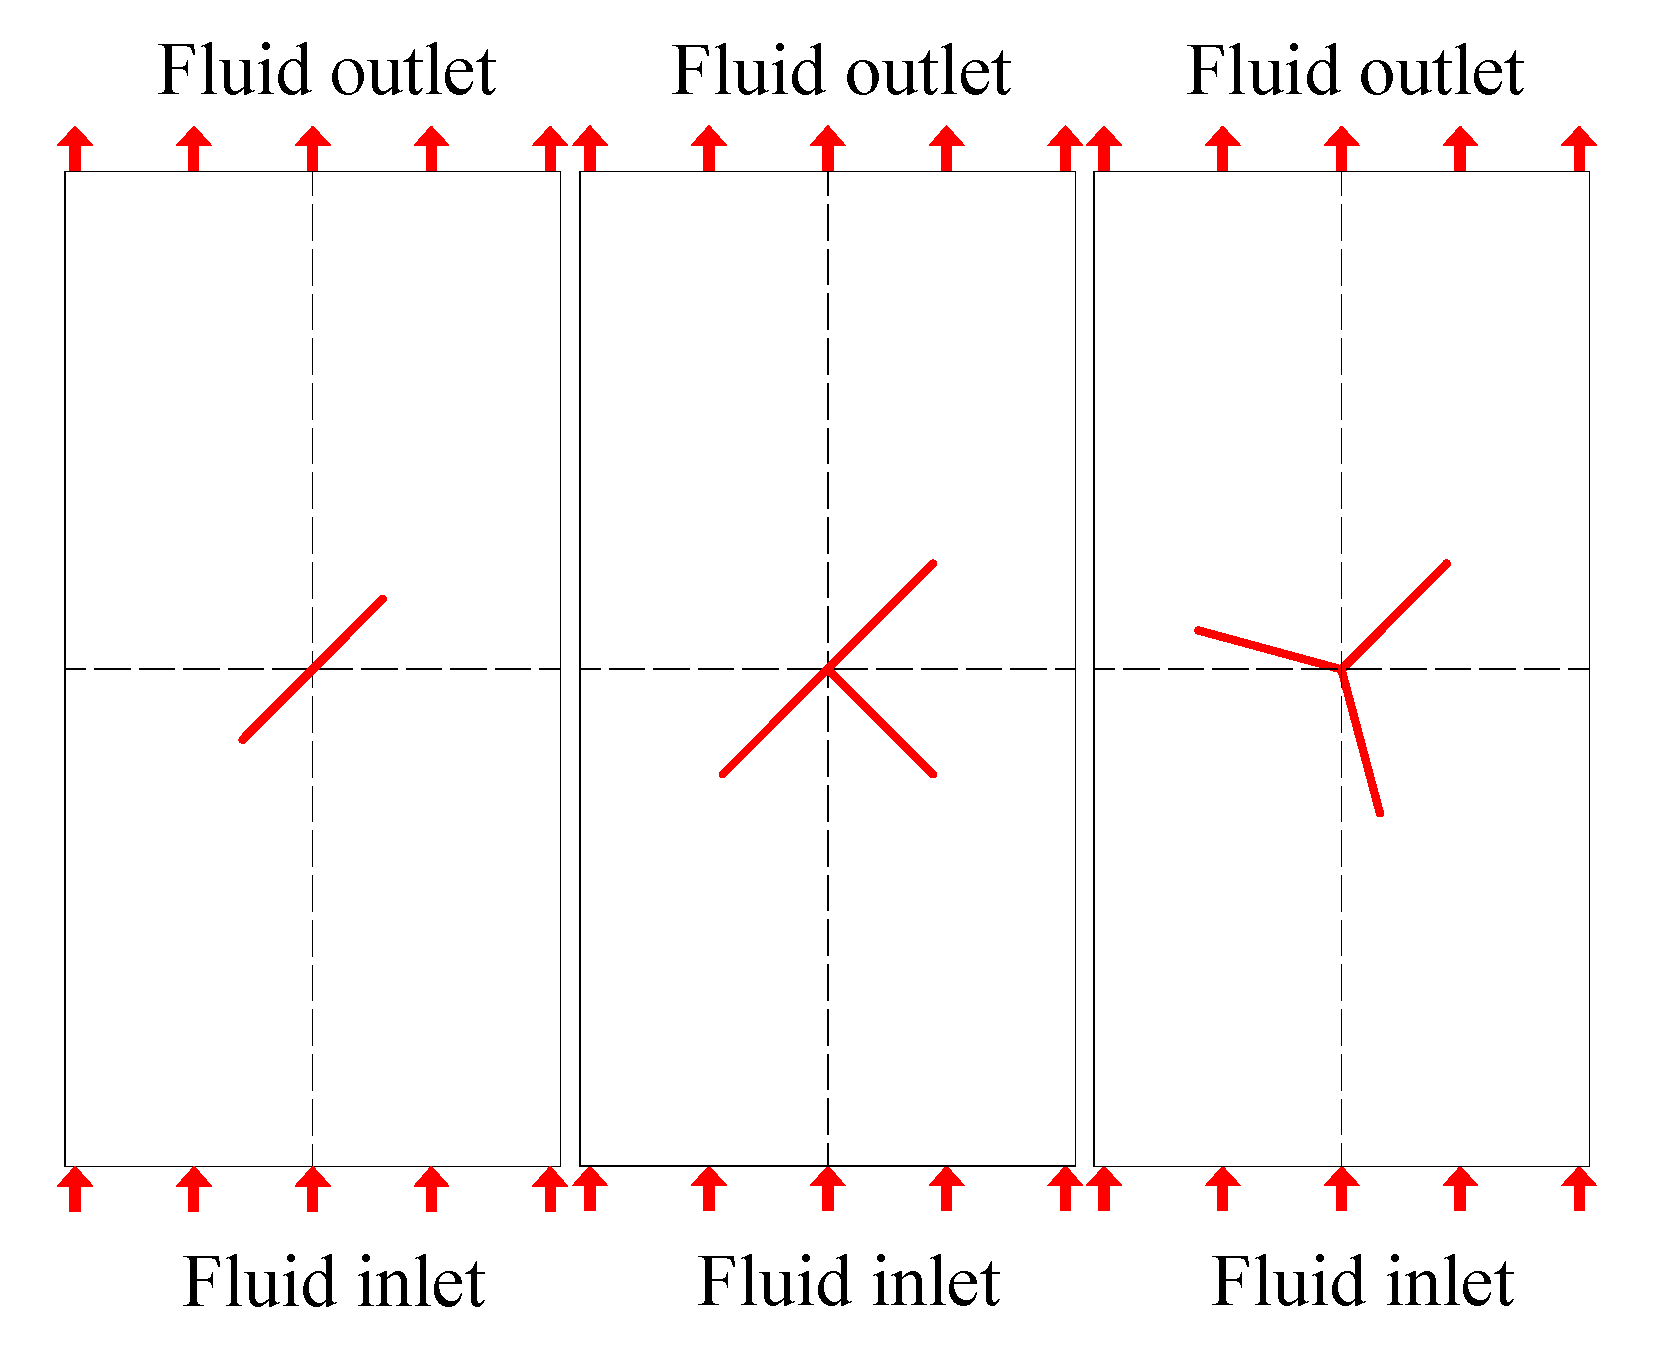
In Figure 4, waterjet cutting and wire cutting equipment are used to prefabricate sandstone samples with different inclinations, single, T-shaped, and Y-shaped fractures on standard samples (ϕ 50 × 100 mm). Figure 4c shows that the size of a single fracture is as follows: the length of the fracture is 20 mm, with an opening of 0.3 mm; the T-shaped and Y-shaped fractures are composed of three cracks of the same size, each of which is 10 mm long and has an opening of 0.3 mm. The geometries of single, T-shaped, and Y-shaped fractures are all characterized by parameter α. α represents the angle between fractures A, B, and F and the axial direction of the sample, and the values are 0°, 15°, 30°, 45°, 60°, 75°, and 90°. Figure 4d shows the final fractured sandstone sample. During the test, the cracks were likely to cause damage to the heat-shrinkable tube wrapping the sample due to the effect of the confining pressure, which could fail the test. Therefore, in the process of this test, the surfaces before and after the prefabricated fractures were plugged with gypsum and water (2:1) to ensure the normal progress of the test.

3.1.2. Test Plan and Process

In Table 1, five different confining pressures (σ3 = 8, 8.5, 9, 9.5, and 10 MPa) were set to study the influence of different fracture angles, confining pressure, and water pressure on the permeability of the sample, respectively. For each confining pressure, five different water pressures were set (Ps = 3, 4, 5, 6, and 7 MPa). The first step was to keep the confining pressure constant and change the water pressure. Each working condition lasted for 100 s. After changing the confining pressure and keeping the confining pressure unchanged, the next step was to change the water pressure until the end of the test. In the process of this seepage test, the fractured sandstone sample was put into the pressure chamber for sealing, ignoring the influence of axial pressure.
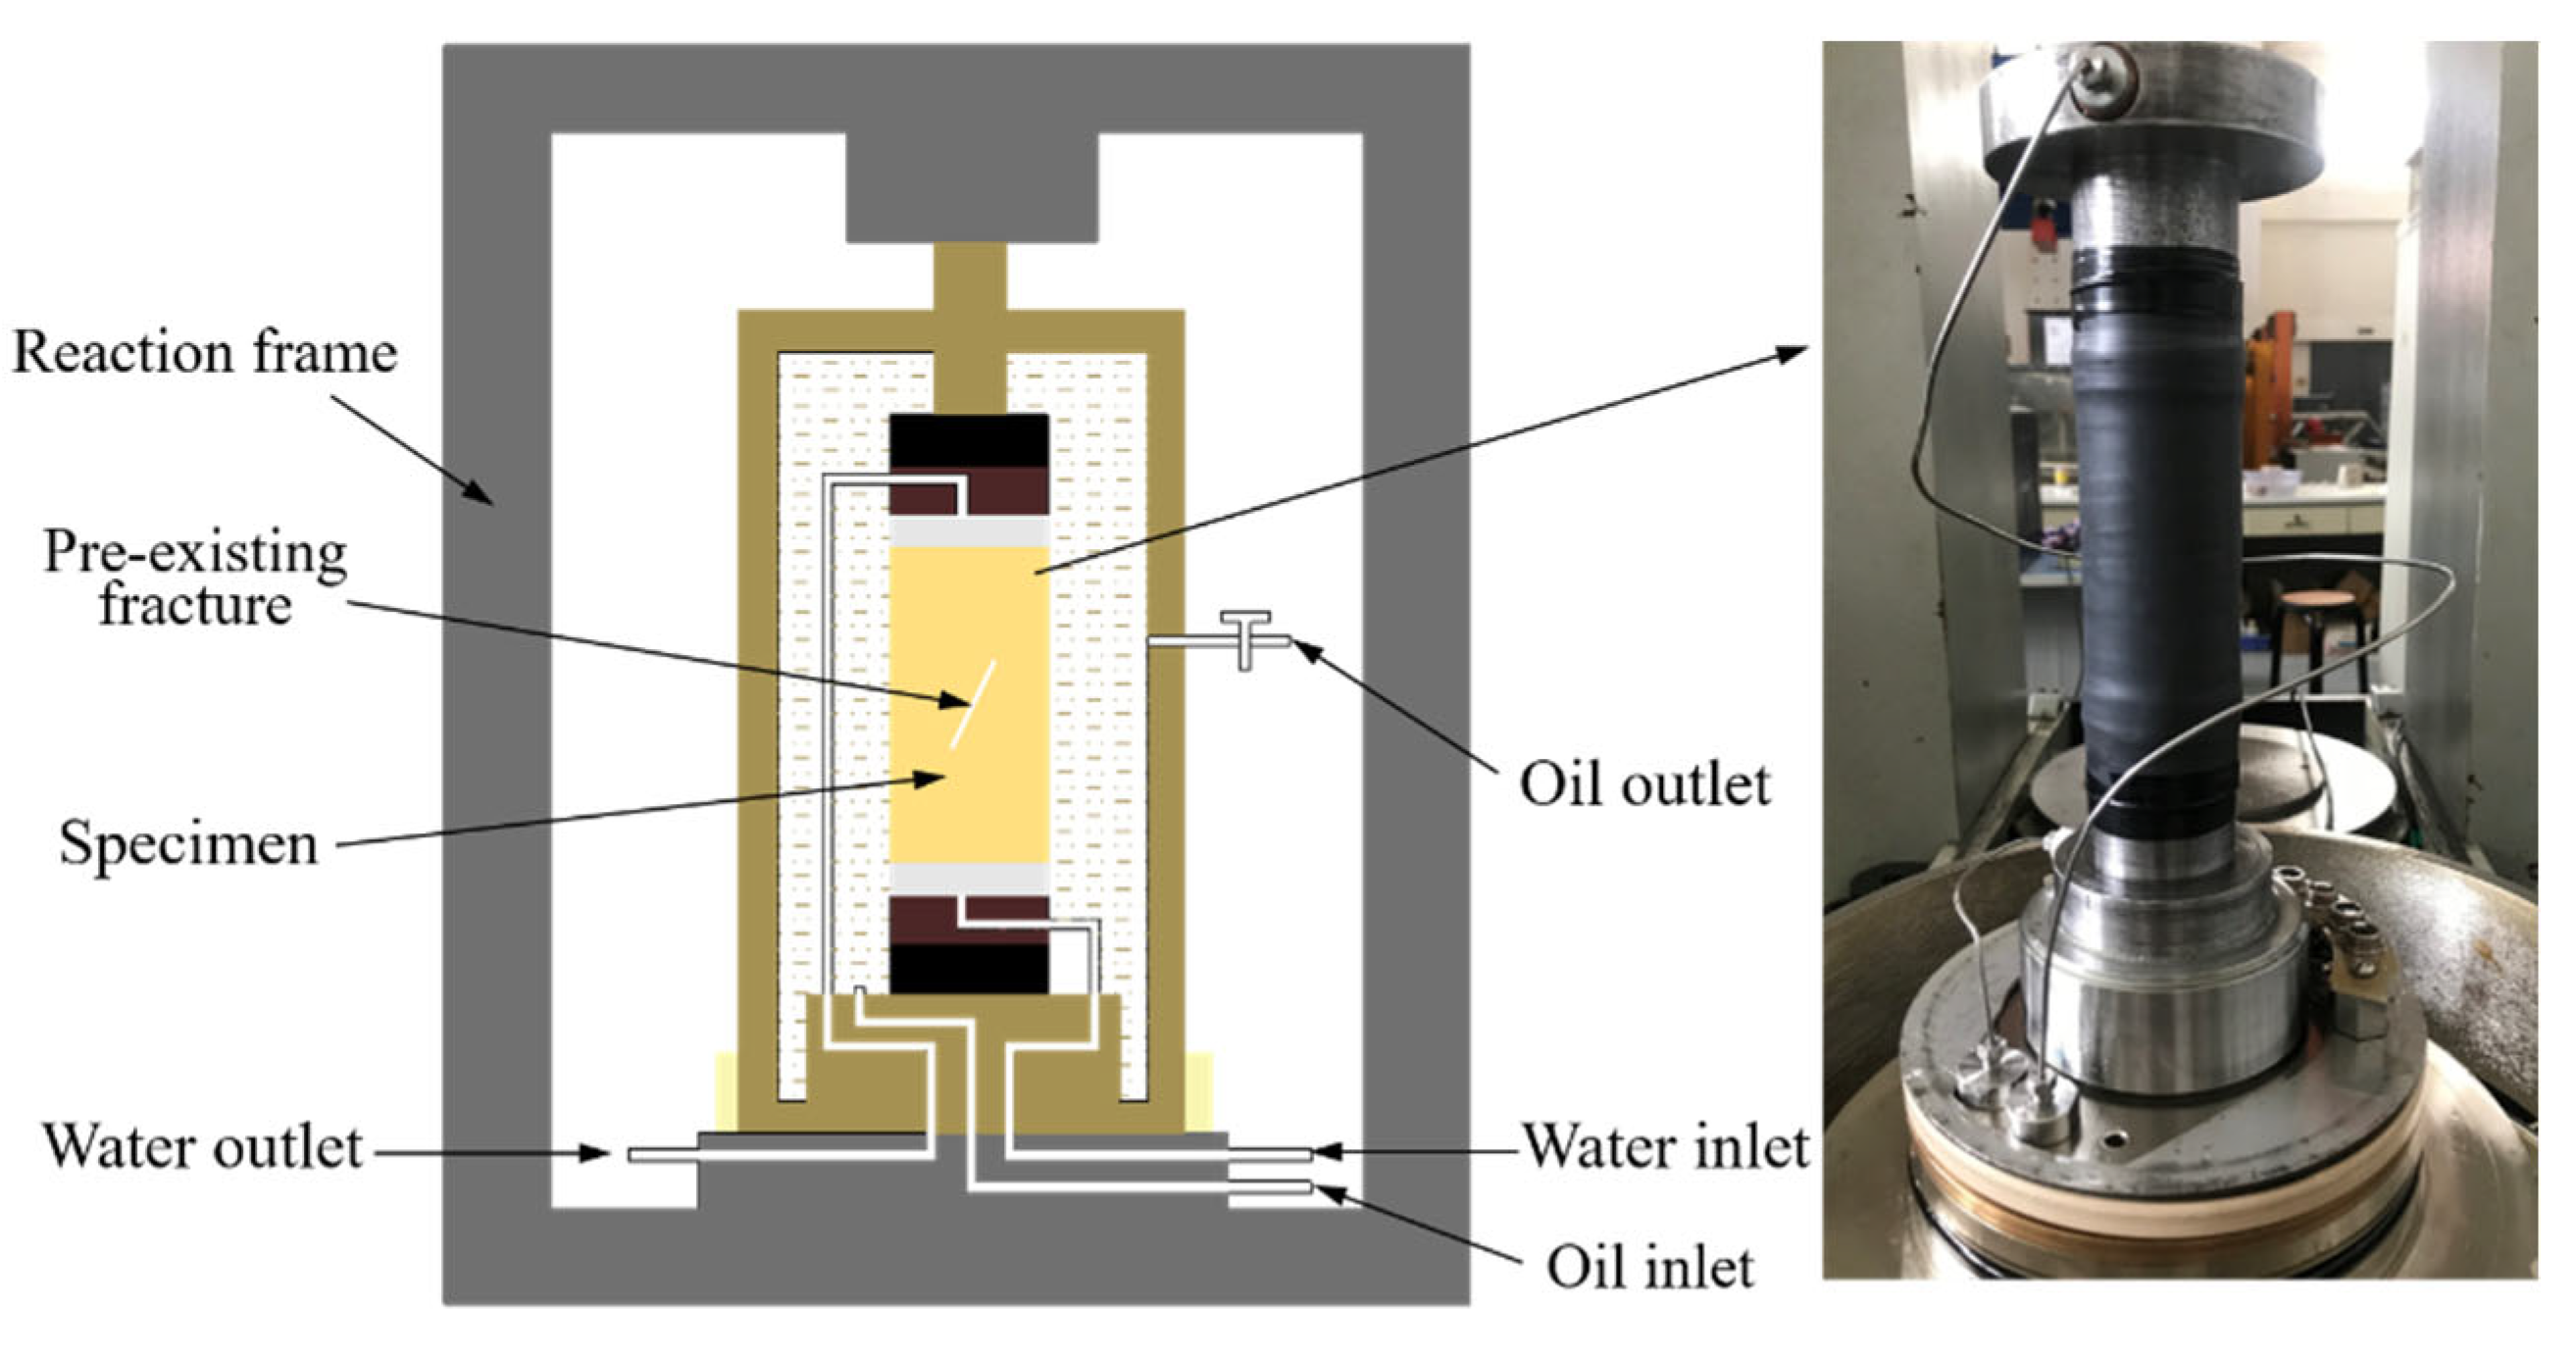
The TAW-2000 rock servo multifunctional test device was used for the seepage test on sandstone samples with single, T-shaped, and Y-shaped fractures to obtain hydraulic parameters under different confining pressures and hydraulic pressures. Before the test, all the fractured sandstone samples were soaked in a closed container filled with distilled water for 48 h. We ensured that the fractured sandstone samples were completely submerged by distilled water to make them fully saturated. In Figure 5, the seepage path goes from bottom to top. During the seepage test, the confining pressure and the water pressure were added successively. The latter was lower than the former.

3.2. Numerical Simulation

The laboratory test could provide strong data for analyzing the nonlinear seepage behavior with negative non-Darcy flow coefficient, but the flow pattern inside the fractured sandstone needs to be further explored. In order to make up for the inability of experiments to visually study the trajectory of fluid motion, numerical simulation was carried out. Numerical simulation research can be mutually verified and complemented with laboratory tests. The following introduces the development process of numerical simulation.

3.2.1. Model Construction and Grid Division

The numerical models of single, T-shaped, and Y-shaped fracture specimens with different angles adopt a two-dimensional rectangular model of 50 mm × 100 mm. The length and width of the prefabricated fracture are the same as the size of the experimental design. The physical field control grid is used to divide the grid, and the grid is automatically divided according to the setting of the physical field in the model. The new grid is generated with the change of the physical field. The numerical results of conventional, refined, relatively refined, ultra-refined, and extremely refined grid generation are compared and analyzed. The results show that there is a numerical difference in the conventional, refined, and relatively refined simulation results data, but there is little difference between ultra-refined and extremely refined grids, and the ultra-fine grid can greatly save the calculation time. Therefore, balancing the accuracy and computing cost, we chose the ultra-fine grids to divide the physical field.

3.2.2. Boundary Conditions and Governing Equations

As shown in Figure 6, the bottom opening of the two-dimensional model is defined as the entrance of the fluid flow, and the corresponding top opening is the exit. By controlling the average pressure difference between the outlet and the inlet, different inertia effects can be controlled. By controlling the average pressure difference between the outlet and the inlet, different sizes of inertial effect control can be achieved. The left and right boundaries of the two-dimensional model are set as non-sliding walls. When using the finite element method to solve the N-S equation, selecting reasonable parameters is a key step to solve the N-S equation, which also directly determines the accuracy and the solution time of the numerical simulation results. In this paper, the steady laminar flow model is selected, and the N-S equation is used to describe the control equation of pore-fracture flow as follows:
ρ u u = μ 2 u P
u = 0
where u = [ux, uy] is the velocity vector, and P [Pa] is the total pressure.

4. Analysis of Test Results

4.1. Analysis of the Nonlinear Seepage Behaviors with Negative β

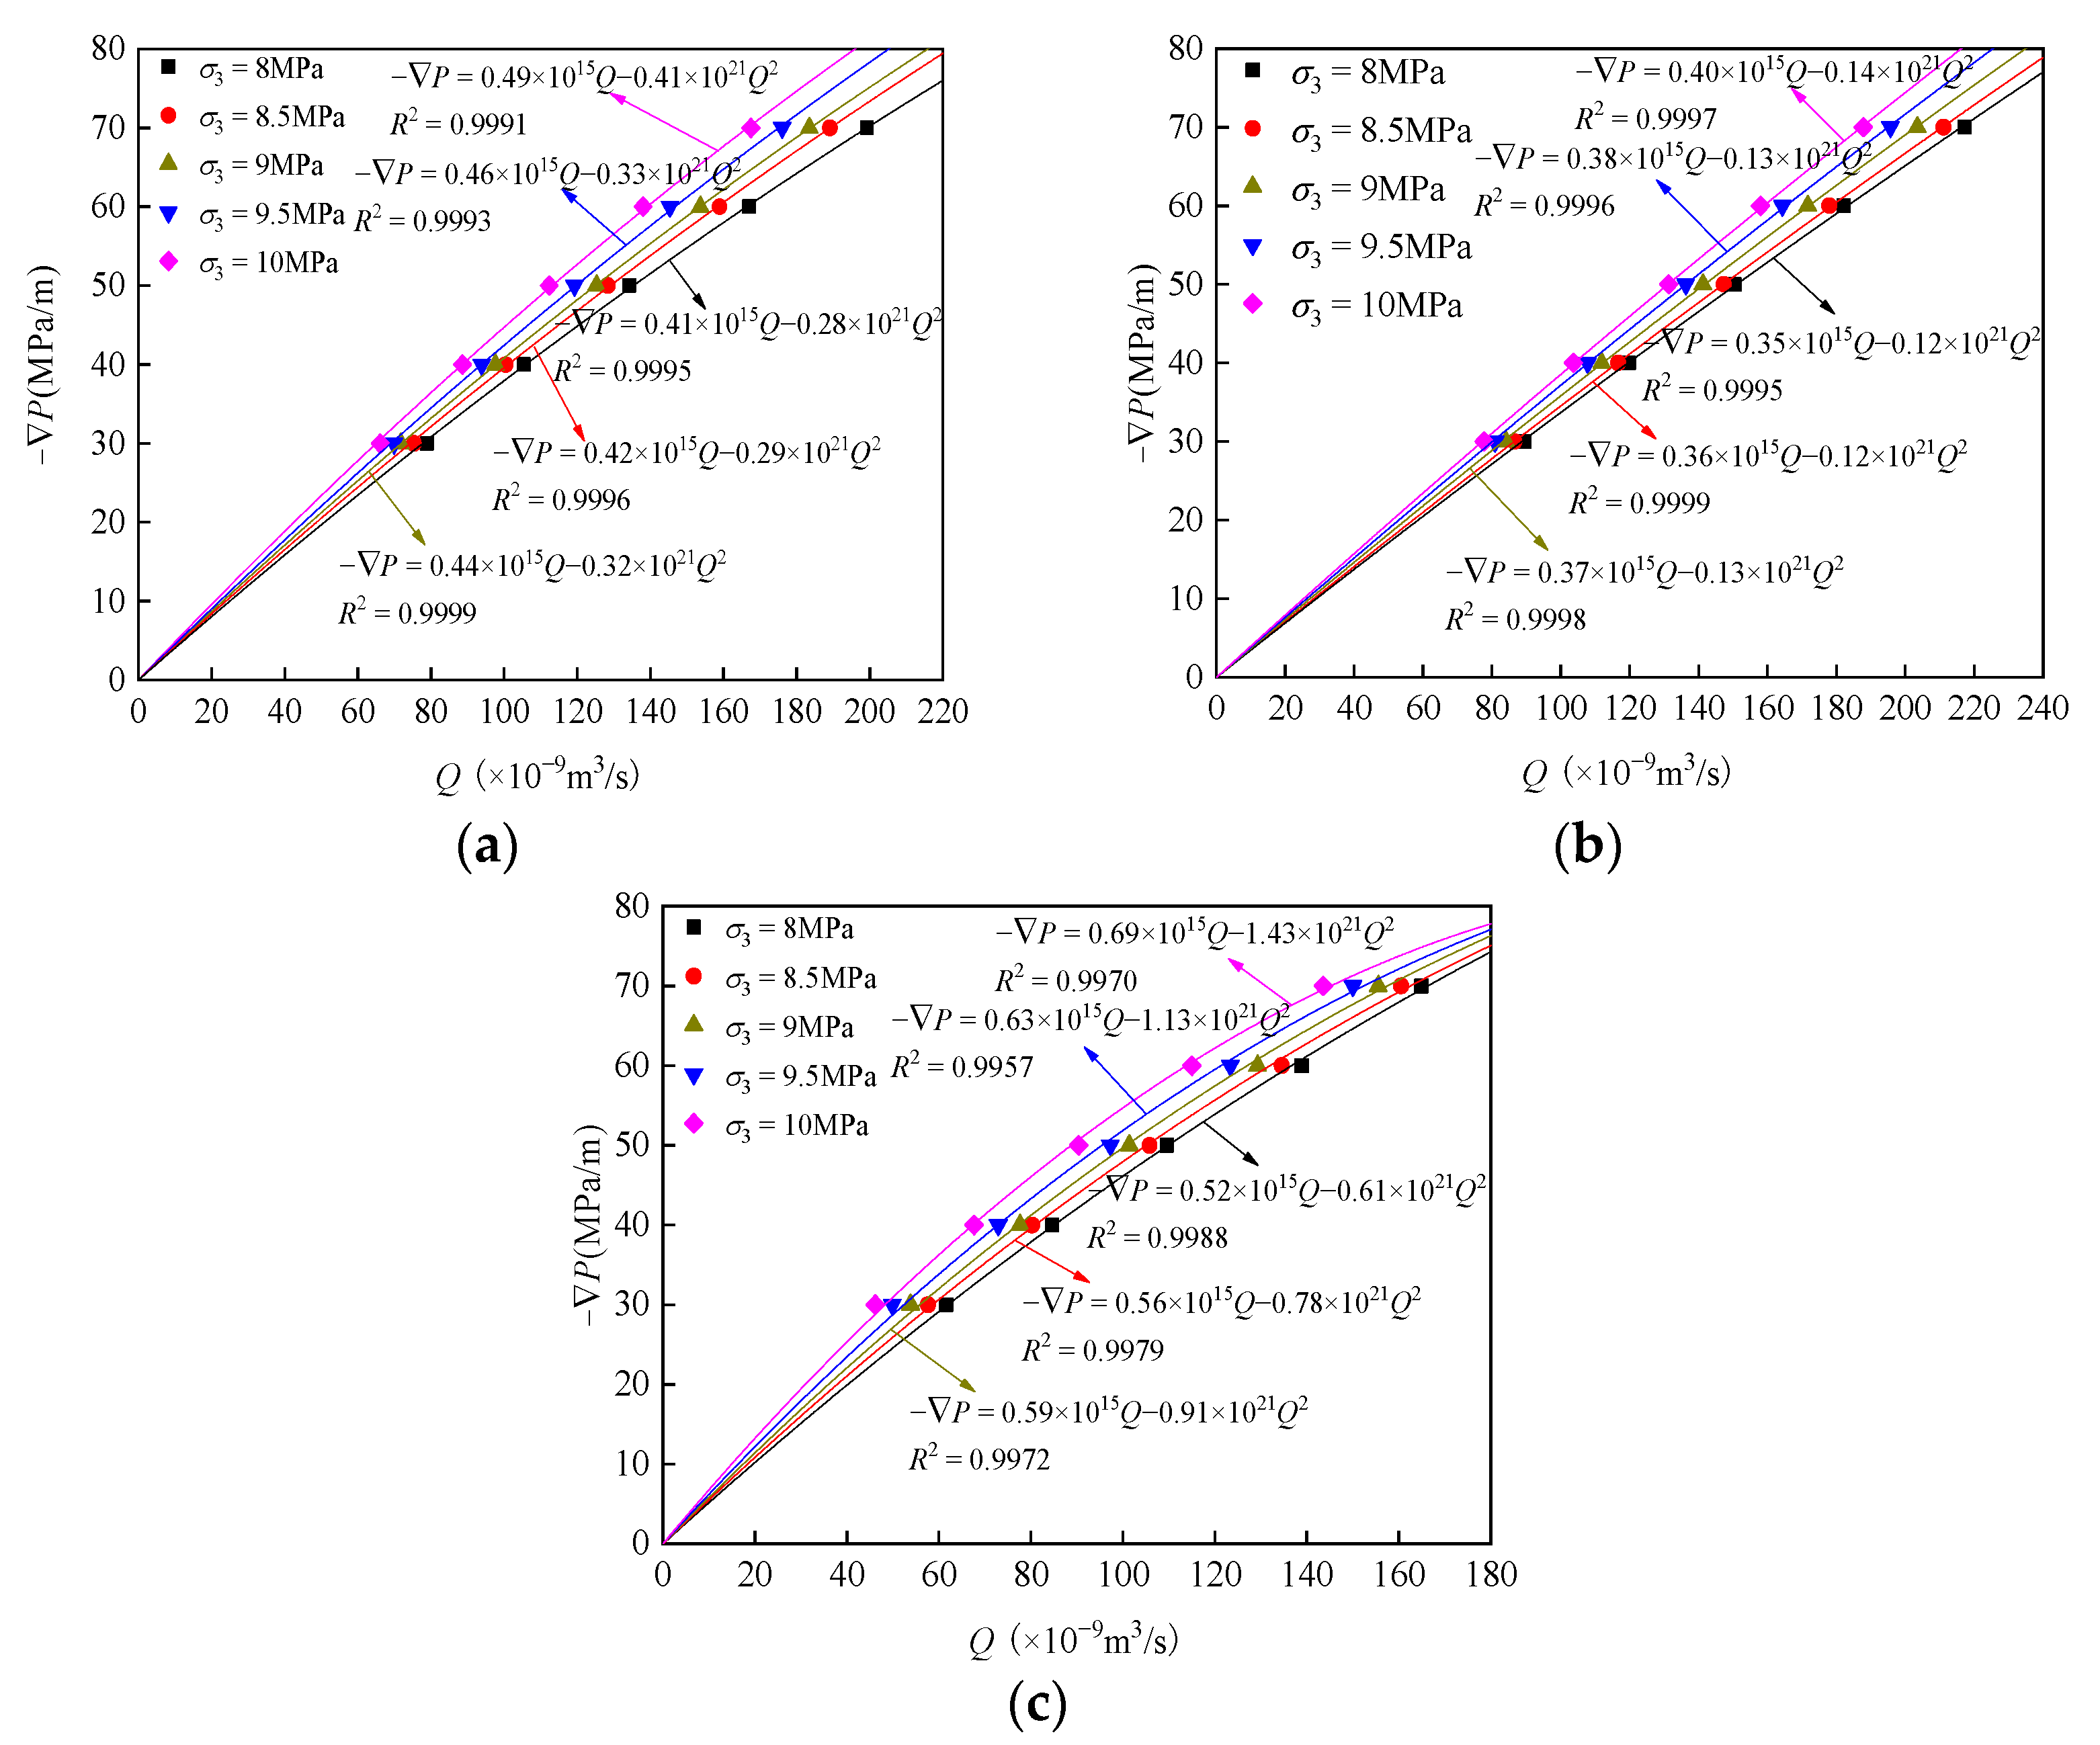
The sample numbers SF, ST, and SY in the work indicated sandstones with single, T-shaped, and Y-shaped fractures, respectively, and the following numbers indicate the inclination of the fractures. Under different confining pressures (σ3 = 8, 8.5, 9, 9.5, and 10 MPa), the Forchheimer equation was used for the fitting analysis of the correlation between seepage pressure gradient −∇P and volume flow Q of samples SF0-SF90, ST0-ST90, and SY0-SY90. Sandstone samples with single, T-shaped, and Y-shaped fractures at an inclination of 45° were taken as examples to avoid redundancy caused by too many figures.
In Figure 7, the comparative analysis of sandstone samples with single, T-shaped, and Y-shaped fractures under the same seepage pressure gradient shows that Q gradually decreases with the increased σ3 because the increased σ3 closes the fractures. With the increased −∇P, the fitting curve is convex to −∇P axis. The increase of Q higher than the linear increase is characterized by super-flow non-linearity, similar to the flow behaviors of non-Newtonian fluids. In this experiment, coefficient b in the Forchheimer equation is negative, that is, non-Darcy coefficient β is negative. This phenomenon will be discussed in depth later. Moreover, fitting correlation coefficient R2 between −∇P and Q of the sandstone samples with single, T-shaped, and Y-shaped fractures exceeds 0.9900 under different confining pressures and inclinations. It shows that the theoretical curve fitted by the Forchheimer equation is in good agreement with the experimental results, and the Forchheimer equation is applicable to accurate prediction of water gushing in underground projects such as mining and tunnels.
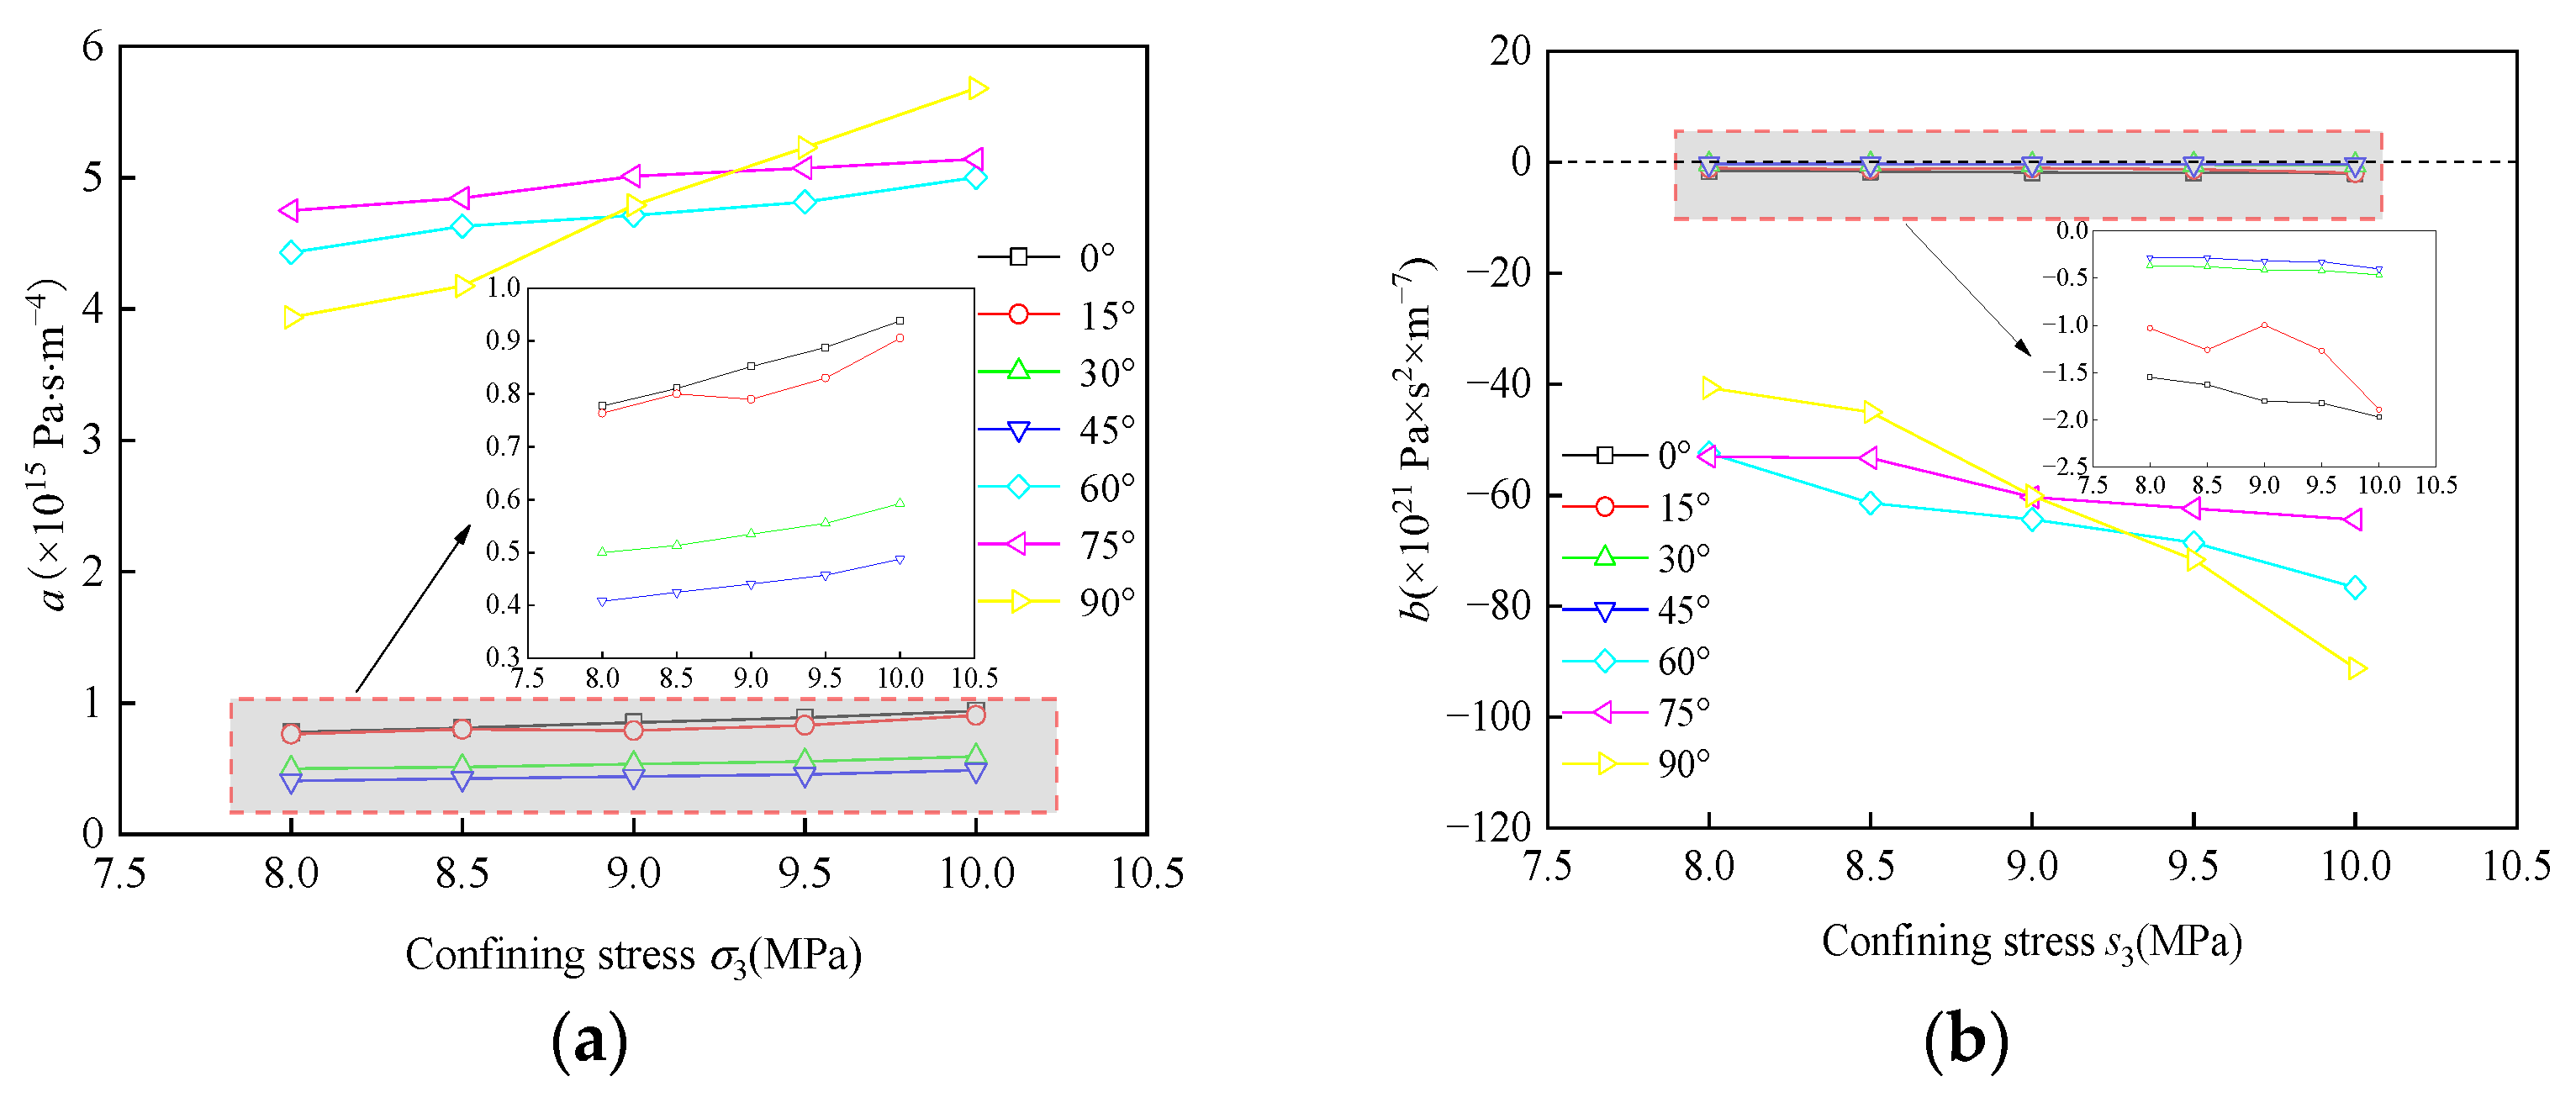
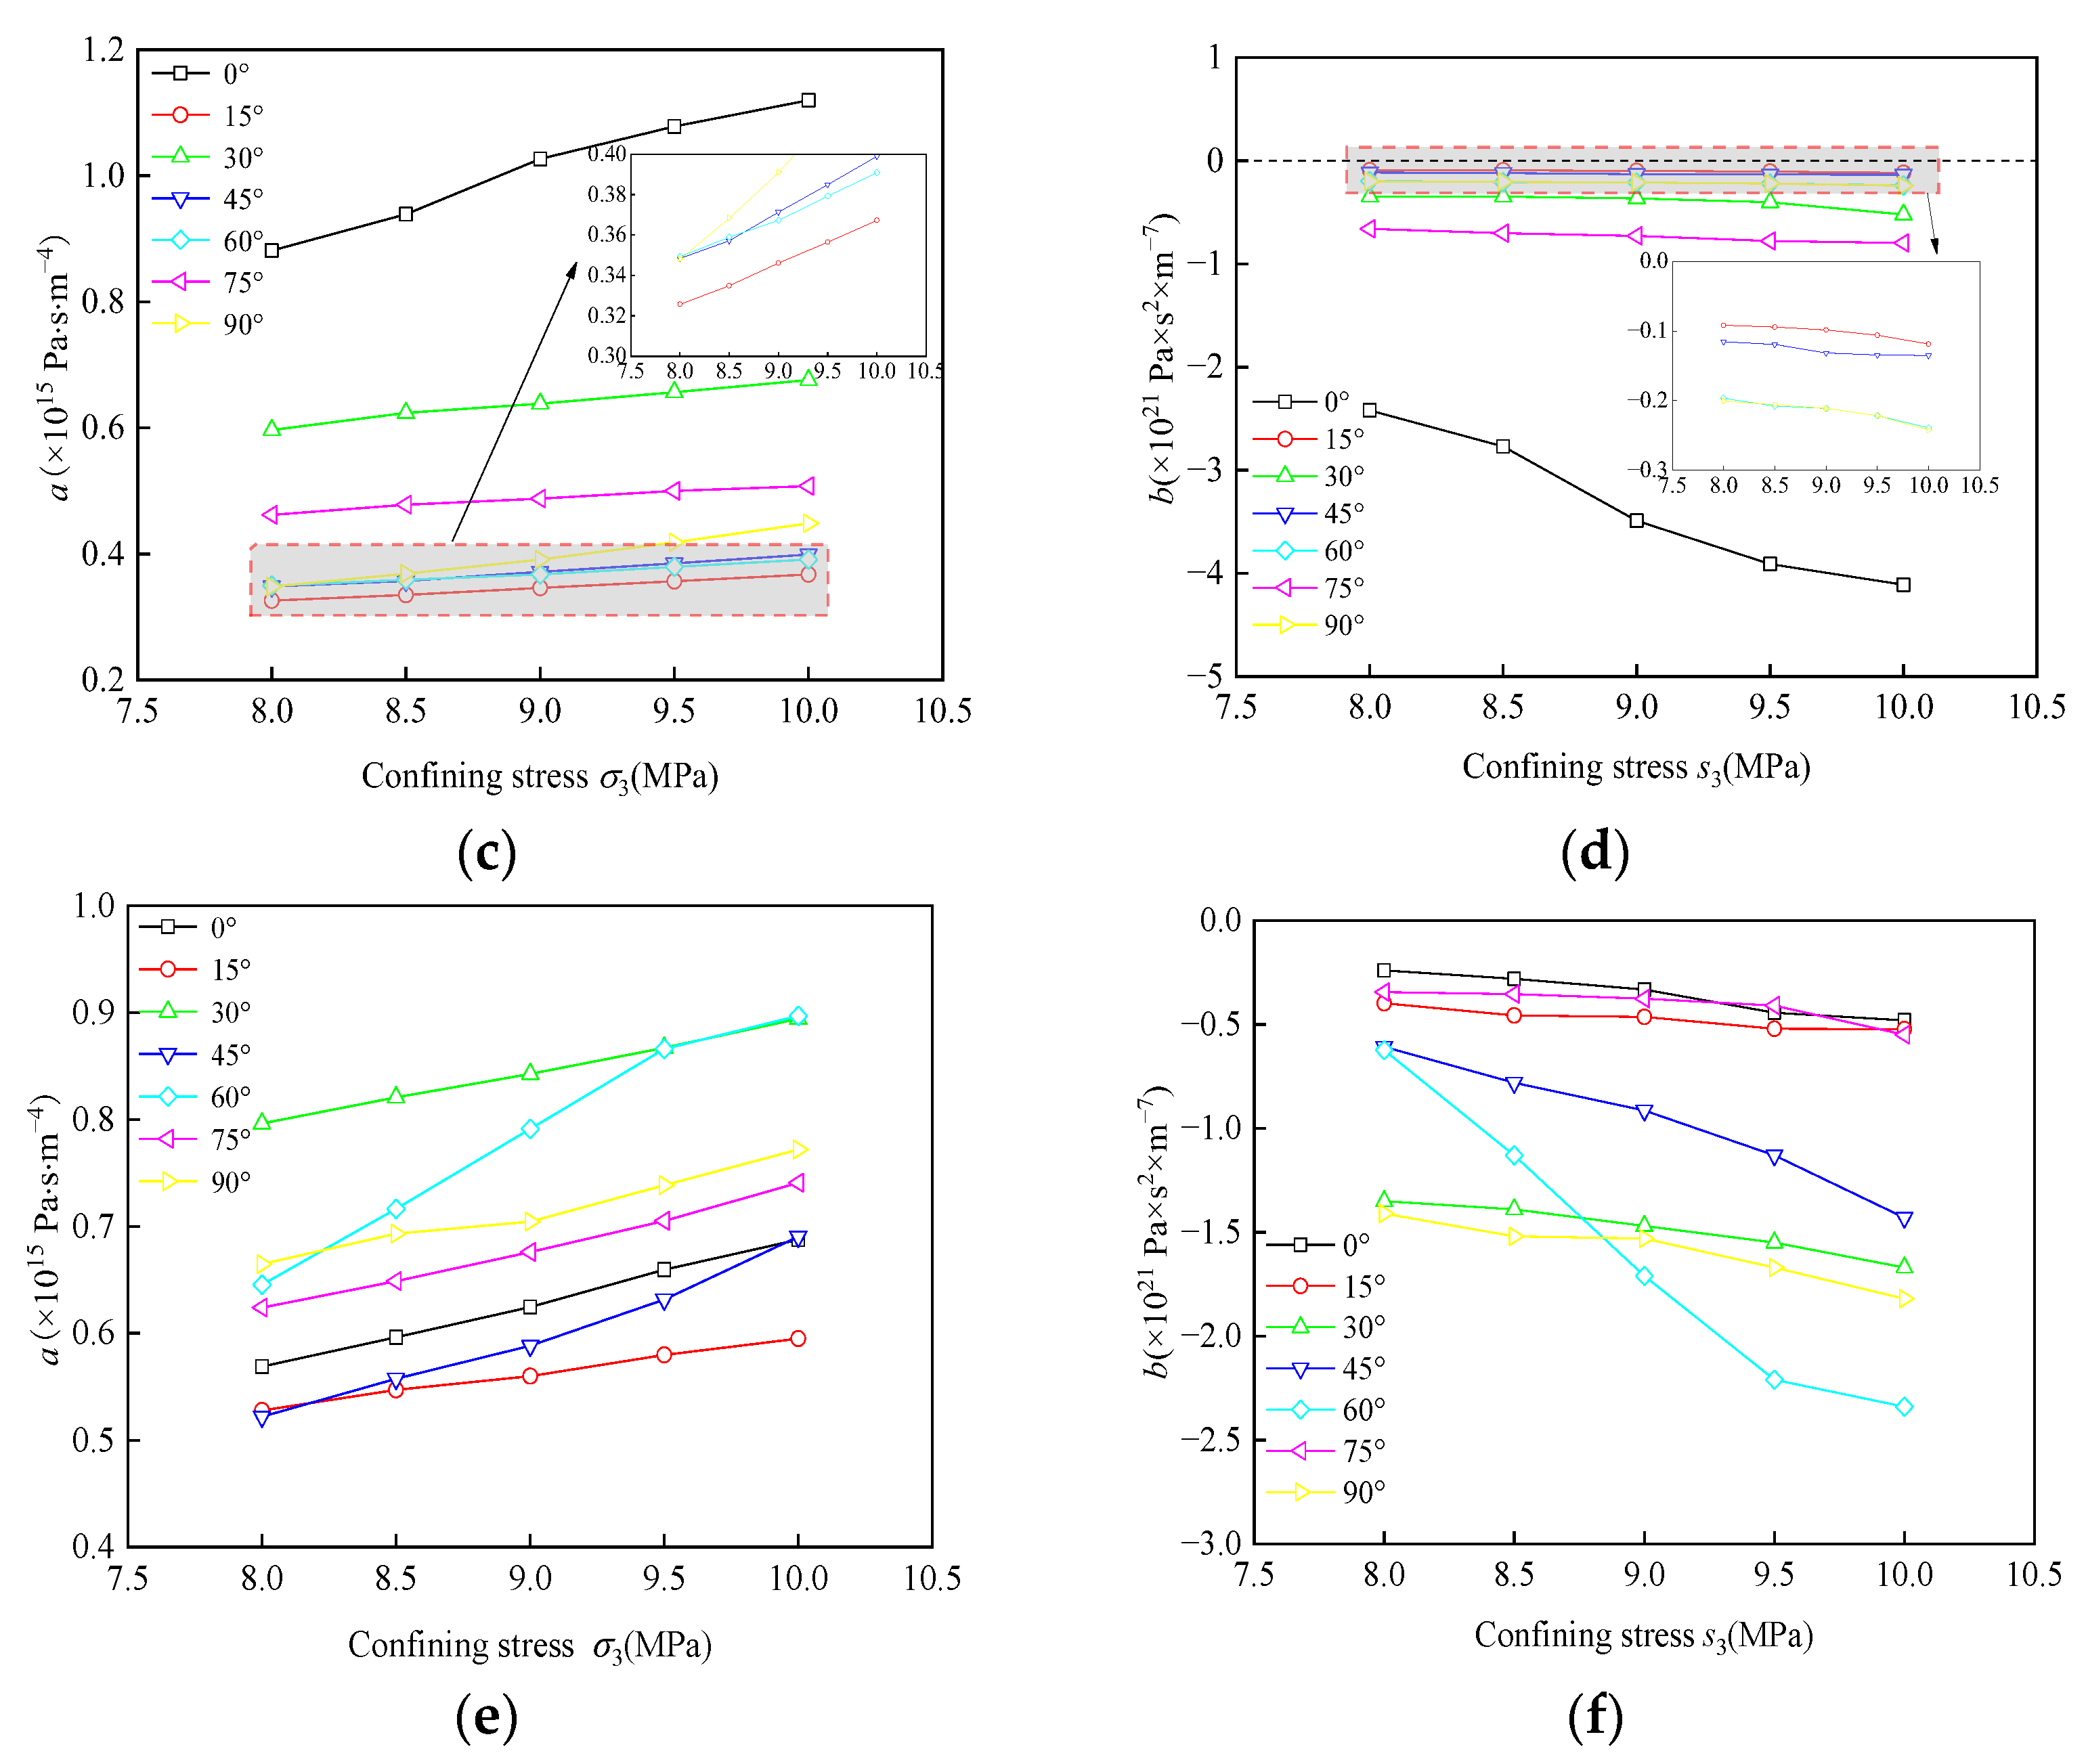
Figure 8 shows the variation of linear term coefficient a and nonlinear term coefficient b of the Forchheimer equation. a gradually increases with increased σ3 in the sandstone samples with single, T-shaped, and Y-shaped fractures, caused by the closure of internal fractures under the confining pressure; b decreases gradually with the increased σ3. When σ3 of samples SF0-SF90 increases from 8 to 10 MPa, the values of a and b change significantly with increased fracture inclination α. The a value at 0, 15, 30, and 45° is smaller than that at 60, 75, and 90°. When α is 0°, 15°, 30°, and 45°, the b value is greater than that when α is 60, 75, and 90°. In the process of samples ST0-ST90 and samples SY0-SY90, when σ3 increases from 8 to 10 MPa, the a and b value changes are relatively small with increased fracture inclinations.
The a and b values in the single-fracture samples at 0, 15, 30, and 45° are concentrated in 0.41 × 10¹⁵–0.94 × 10¹⁵ Pa·s·m−4 and −1.97 × 10²¹–−0.28 × 10²¹ Pa·s2·m−7, respectively. At 60, 75, and 90°, the a and b values are concentrated in 0.41 × 10¹⁵–0.94 × 10¹⁵ Pa·s·m−4 and −91.18 × 10²¹–−40.64 × 10²¹ Pa·s2·m−7, respectively. The a and b values are concentrated in 0.34 × 10¹⁵–0.68 × 10¹⁵ Pa·s·m−4 and −0.80 × 10²¹–−0.09 × 10²¹ Pa·s2·m−7 in the T-shaped fracture sample at 0–90°, respectively. The a and b values in the Y-shaped fracture sample at 0–90° are concentrated in 0.52 × 10¹⁵–0.90 × 10¹⁵ Pa·s·m−4 and −2.34 × 10²¹–−0.24 × 10²¹ Pa·s2·m−7, respectively. The results show that the angle of the sample with a single fracture has a greater impact on the seepage characteristic of the pore-fracture media, while the angles of the sandstone samples with T-shaped and Y-shaped fractures have a relatively small impact. The reason is that the fluid has strong directivity in a single fracture, the T-shaped and Y-shaped fractured sandstone samples have cross-fractures, the seepage path is more complex, and there is a bias flow phenomenon, resulting in a limited role of the angle.

4.2. Parameter Expression Construction with Negative β

Figure 9 shows the relationship between inherent permeability and confining pressure of sandstone samples with single, T-shaped, and Y-shaped fractures at different fracture inclinations. The inherent permeability gradually decreases as the confining pressure increases. The permeability of the sample is relatively good in a low-stress environment but poor in a high-stress environment. Moreover, the fracture inclination affects the permeability of sandstone samples with single, T-shaped, and Y-shaped fractures, but there is no obvious rule.
In order to determine the linear term coefficient a and non-linear term coefficient b for rock porous or fractured media, intrinsic permeability k and non-Darcy coefficient β are essential parameters. The literature claims that there is a direct relationship between k and β [8,10,11,34,43]. When β is a positive value, it has been common practice to employ the power function relationship between β and k for porous or fractured media. The fitting study of the correlation between β (negative value) and k in pore-fracture media in the paper also yields the power function relationship.
β = γ k n
where γ and n are fitting coefficients.
Table 2 shows the power function fitting equations of β and k for sandstone samples with single, T-shaped, and Y-shaped fractures at different fracture inclinations. The range of correlation coefficient R2 for single-fracture samples is 0.9196–0.9955, with an average value of 0.9579; the range of correlation coefficient R2 for samples with T-shaped fractures is 0.6875–0.9928, with an average value of 0.8872; the range of correlation coefficient R2 for samples with Y-shaped fractures is 0.8154–0.9950, with an average value of 0.9472. The fitting effect of single-fracture samples is better than that of samples with Y-shaped and T-shaped fractures. The value of fitting coefficient γ of the single-fracture sample varies in a wide range between 1.40 × 10−47 and 1.74 × 10⁻⁶, while the other fitting coefficient n varies in the range between −3.84 and −1.25. The γ value of the samples with T-shaped fractures varies in a wide range from 3.39 × 10−43 to 51.44, while another fitting coefficient n varies from −3.56 to −0.74. The γ value of the samples with Y-shaped fractures varies in a wide range between 1.55 × 10−47 and 1.36 × 10−137, and n varies in the range of −3.83–−1.71. It is observed that the γ value of the sandstone sample varies greatly under different inclinations, and the n value changes a little.

4.3. Determination of Critical Pressure Gradient with Negative β

Researchers typically utilize Reynolds number Re and Forchheimer’s coefficient F0 as the criterion for identifying the beginning of nonlinear flow in porous media and fractured media to assess the border between linear and nonlinear flow [7,9,11,16,44,45].
Forchheimer’s coefficient F0 is presented, since using Re as the standard for quantitatively determining the beginning of nonlinear flow contains a subjective inaccuracy. F0 is defined as the ratio of nonlinear pressure loss bQ2 to linear pressure loss aQ in the Forchheimer equation, defined as [7,16,27,44]:
F 0 = b Q 2 a Q = b Q a = k β ρ Q μ A
Zeng and Grigg suggested the expression of nonlinear effect E based on Equations (2) and (11) [7].
E = b Q 2 a Q + b Q 2 = F 0 1 + F 0
Zeng and Grigg believed that critical value E of nonlinear effects is 0.1, and critical value F0 is 0.11 [7]. Macini et al. obtained non-linear effect E of 0.28 and F0 of 0.40 through experiments [30]. Ghane et al. studied the seepage test of flow through the sawdust, giving E of 0.24 and F0 of 0.31 [11].
Based on nonlinear effect E or Forchheimer’s coefficient F0, the applicability of Darcy’s law is evaluated by drawing the curves between normalized hydraulic-conductivity T/T0 and pressure gradient −∇P. −∇P is given and can be easily obtained, so the method is more intuitive and effective.
Hydraulic conductivity T is a crucial hydraulic parameter that can be calculated using Equation (1) as T = kA = μQ/(−∇P). According to Equations (2) and (3), intrinsic hydraulic conductivity T0 is determined to be T0 = μ/a. Then T/T0 can be determined as follows [13]:
T T 0 = μ Q / ( a Q + b Q 2 ) μ Q / a Q = 1 E = 1 1 + F 0
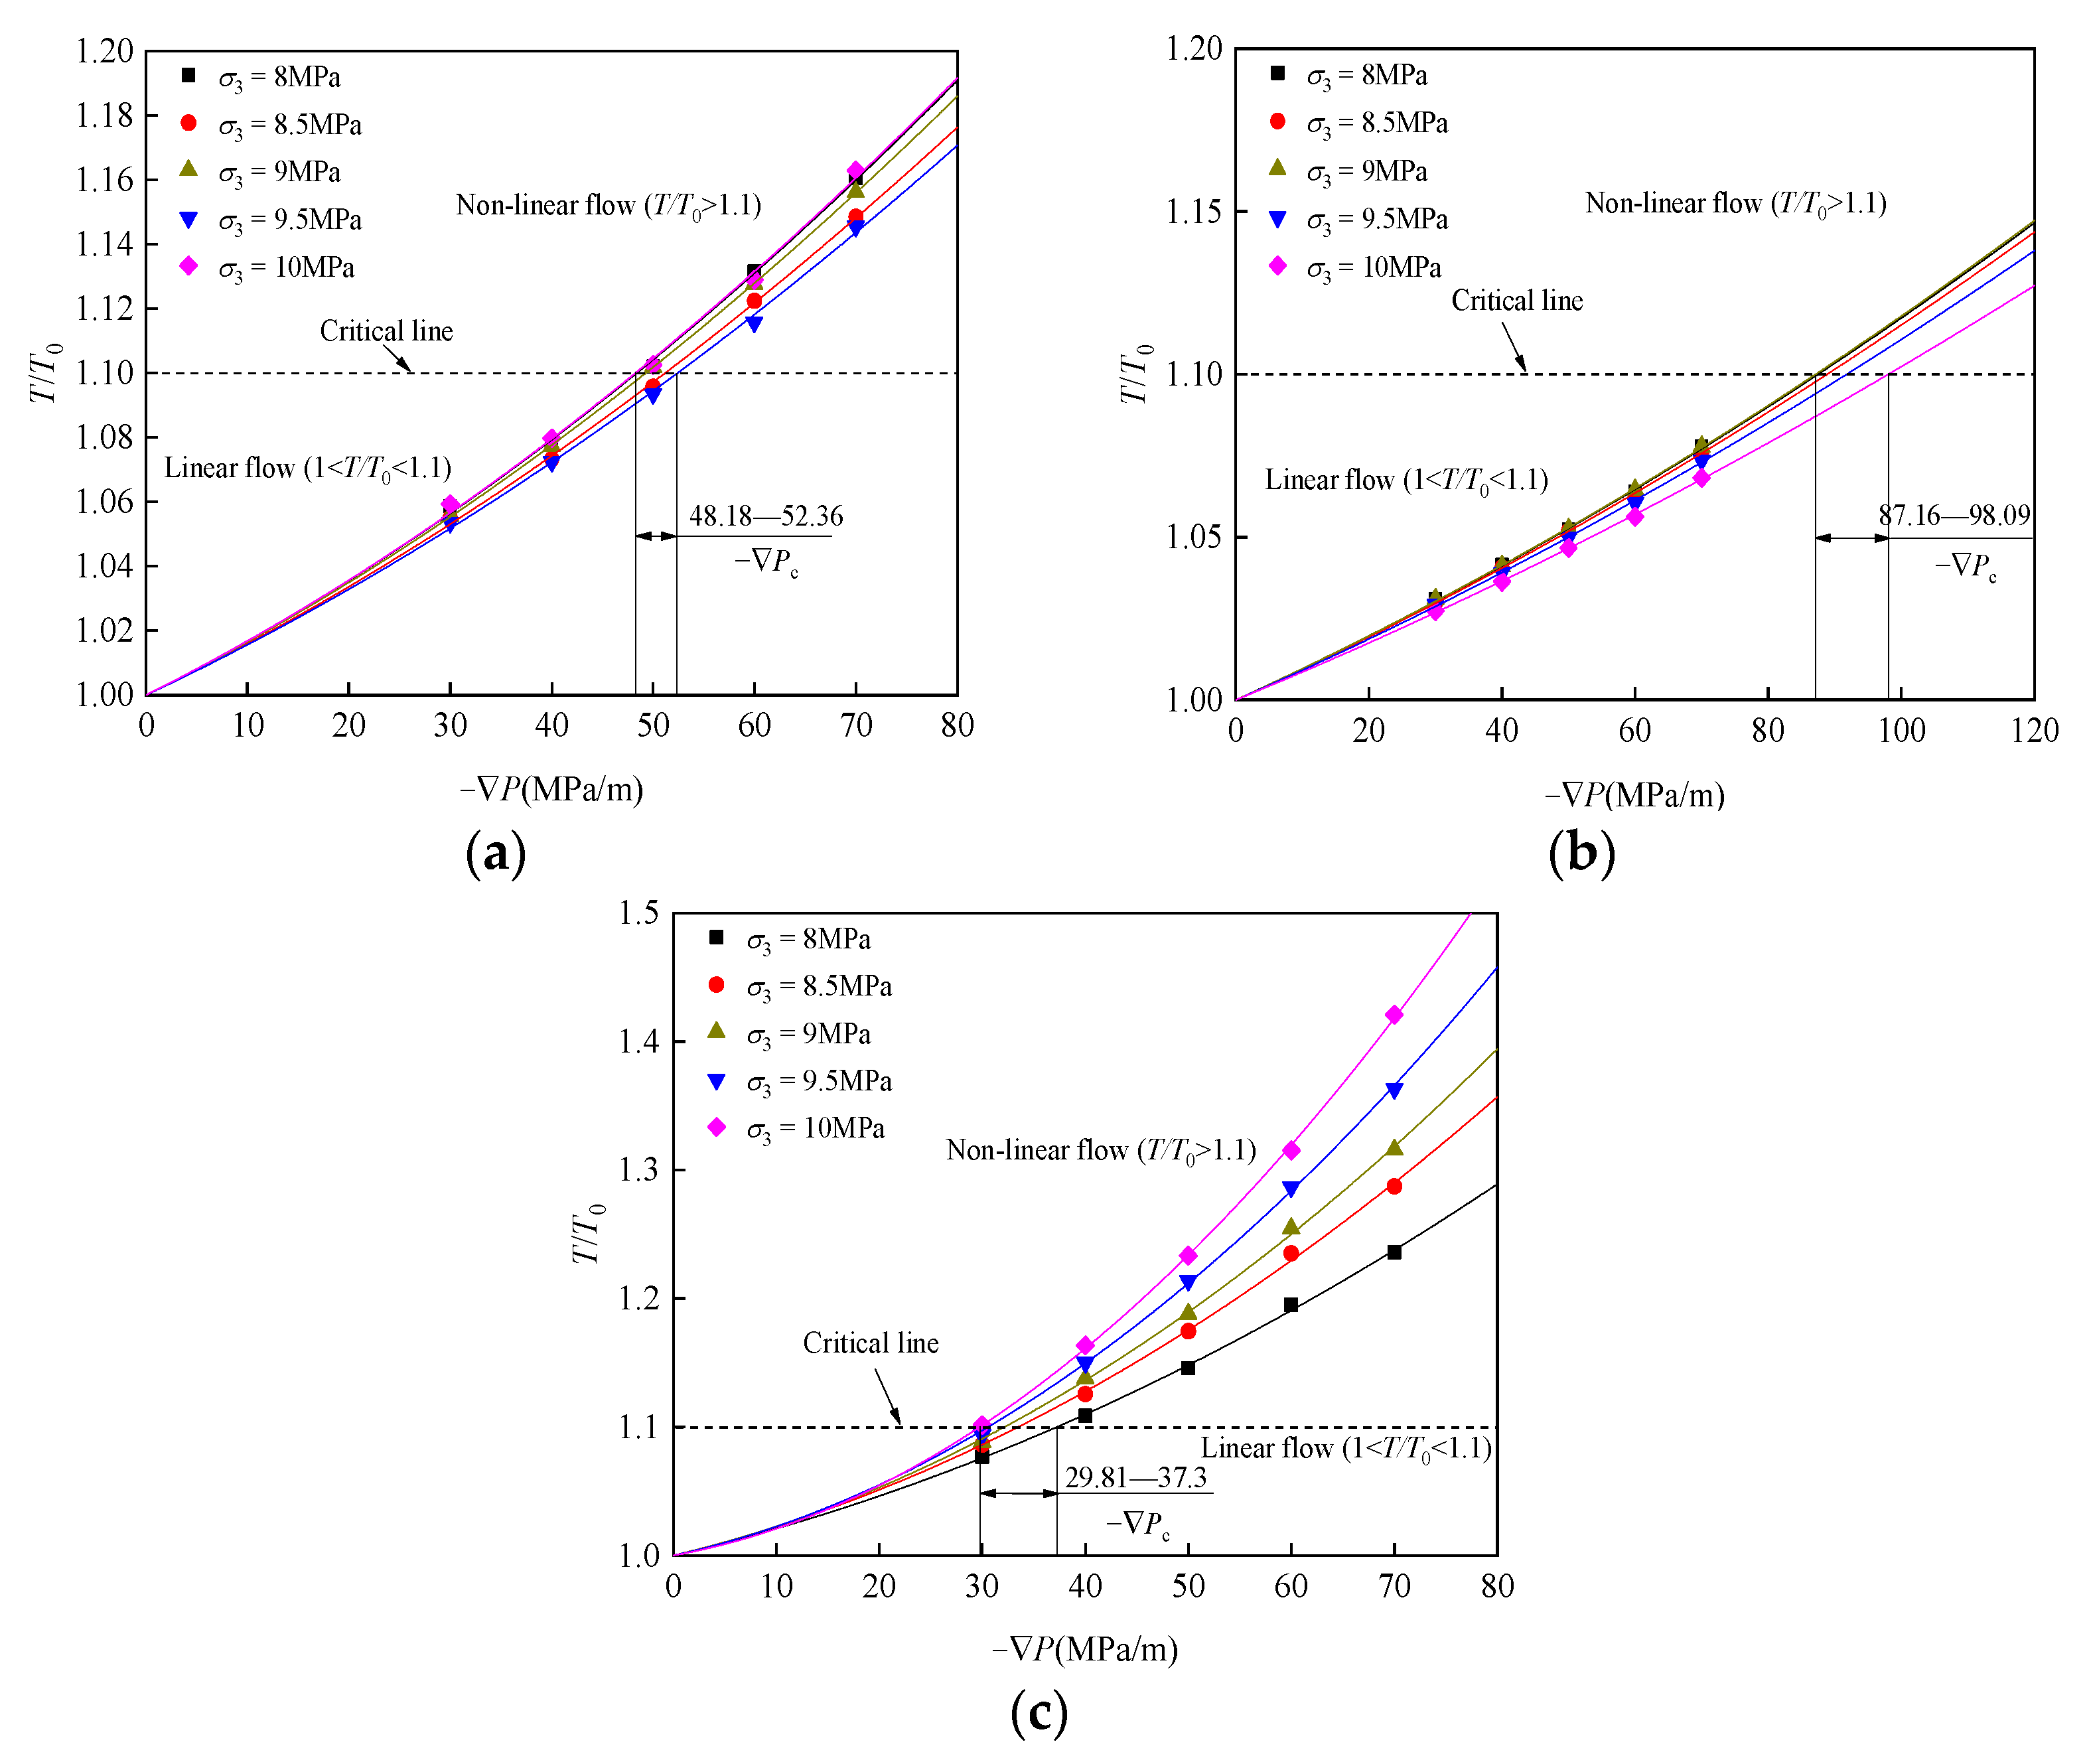
In Figure 10, a quadratic function can be used to describe the relationship between T/T0 and −∇P in samples SF45, ST45, andSY45. The relationship is:
T T 0 = a 1 P + b 1 P 2 + 1
where a1 and b1 are fitting coefficients.
In Figure 10, T/T0 increases with the increased −∇P. The critical pressure gradient −∇Pc range is further determined using critical T/T0 to quantify the linear- and nonlinear-flow regions. If β is a negative value, then nonlinear effect E = −0.1, and the critical T/T0 = 1.1 in the work. Therefore, it can be determined that the critical pressure gradient −∇Pc ranges of SF45, ST45, and SY45 under different water pressures are 48.18–52.36 MPa/m, 87.16–98.09 MPa/m, and 29.81–37.3 MPa/m, respectively.

5. Discussion

5.1. Theoretical Analysis

The β values are all negative through the hydraulic-mechanical coupling test of fractured sandstones with different shapes and inclinations in the work. The working condition of sample SF45 is taken as an example when the confining pressure is 10 MPa to explain the reason. The relationship between −∇P and Q (see Figure 7a) shows that the nonlinear curve is convex to the −∇P axis, and the increase of −∇P is less than that of Q in linear proportion. The fractured sandstone sample has a good sealing effect during the test, and there is no poor sealing that fails the test, indicating that the negative β value is not caused by sealing. Meanwhile, the water flow pipeline has been checked before the test to ensure no leakage. Therefore, the error generated by the test system during the test can be ignored, with no effect on the test result. Now, we will analyze the situation where the β value is negative in the work:
(1)
When −μ2/4ρ|−∇P|k2 < β < 0, Equation (7) has a solution, and the seepage system has an equilibrium state. The fractures and pores are compressed, and a certain seepage pressure is required to stabilize the seepage system when a certain confining pressure is applied to the fractured sandstone sample, due to the prefabricated fractures of different shapes and inclinations. When the seepage water pressure increases too close to the confining pressure restraint, the effective confining force produced by the confining pressure is suppressed. However, the test results show the nonlinear seepage characteristic is produced, resulting in a negative β value. The reason may be that under the action of hydraulic–mechanical coupling, the water flow state changes near the combined area of pores and prefabricated fractures. Anti-skid boundary conditions are assumed to become invalid, and the fracture surface is equivalent to a smooth surface, leading to excessive flow in the area of prefabricated fractures, and finally causes the change of the entire seepage system.
(2)
When β <μ2/4ρ|−∇P|k2 < 0, Equation (7) has no solution, and there is no equilibrium state in the seepage system, because the flow state of the fluid inside the sample cannot be observed during the test, and some sample outlets have large flow. Therefore, it is possible that the rock has no barrier effect of the rock on the fluid and causes seepage instability, which may be another reason for the nonlinear seepage characteristics in this paper.

5.2. Numerical Simulation Analysis

In the simulation process, it is assumed that the whole area has good sealing, the fluid flows from the bottom to the whole fracture area, and flows out from the top, and the rest of the boundaries are impermeable. The sample models of fracture (single fracture, T-shaped fracture, and Y-shaped fracture) with different shapes and inclination α = 45° are selected to carry out numerical simulation. It can be seen from the streamline distribution of fractured samples in Figure 11 that the streamline trajectory of fractured sandstones is affected by prefabricated fractures to a certain extent. In Figure 11a, the existence of single fracture will change the size and direction of water flow velocity. The water flow velocity changes with the change of permeability in the fracture. In the prefabricated single fracture, the seepage velocity in the fracture is relatively large due to the sudden increase in permeability, which is about 0.013 m/s. In Figure 11b, in the prefabricated T-shaped fracture, the water flow at A and B into C, and the seepage velocity at C, is relatively large, about 0.014 m/s. In Figure 11c, the water flow at B’ in Y- shaped fracture is diverted to A’ and C’, and the seepage velocity at B’ is relatively large, about 0.014 m/s.
Due to the existence of prefabricated fractures in the sample, the direction of the seepage flow streamline can be clearly presented in the process of seepage simulation. The geometric shapes of the fracture are a major factor affecting the direction of seepage. The prefabricated fracture area has an enlarged display, and the direction of seepage migration can be observed more intuitively. The existence of prefabricated fractures in the sample greatly increases the seepage velocity inside the fracture, thus forming a good seepage channel. When the fracture exists, the fluid mainly migrates along the fracture channel, supplemented by the pore channel.
On the whole, the flow velocity in the fracture is obviously larger than that in other parts of the sample, and the seepage velocity in the upper and lower regions of the sample outside the prefabricated fracture tends to be stable. The seepage velocity around the prefabricated fracture is greatly affected by the fracture, indicating that the fracture plays a leading role in the seepage process.
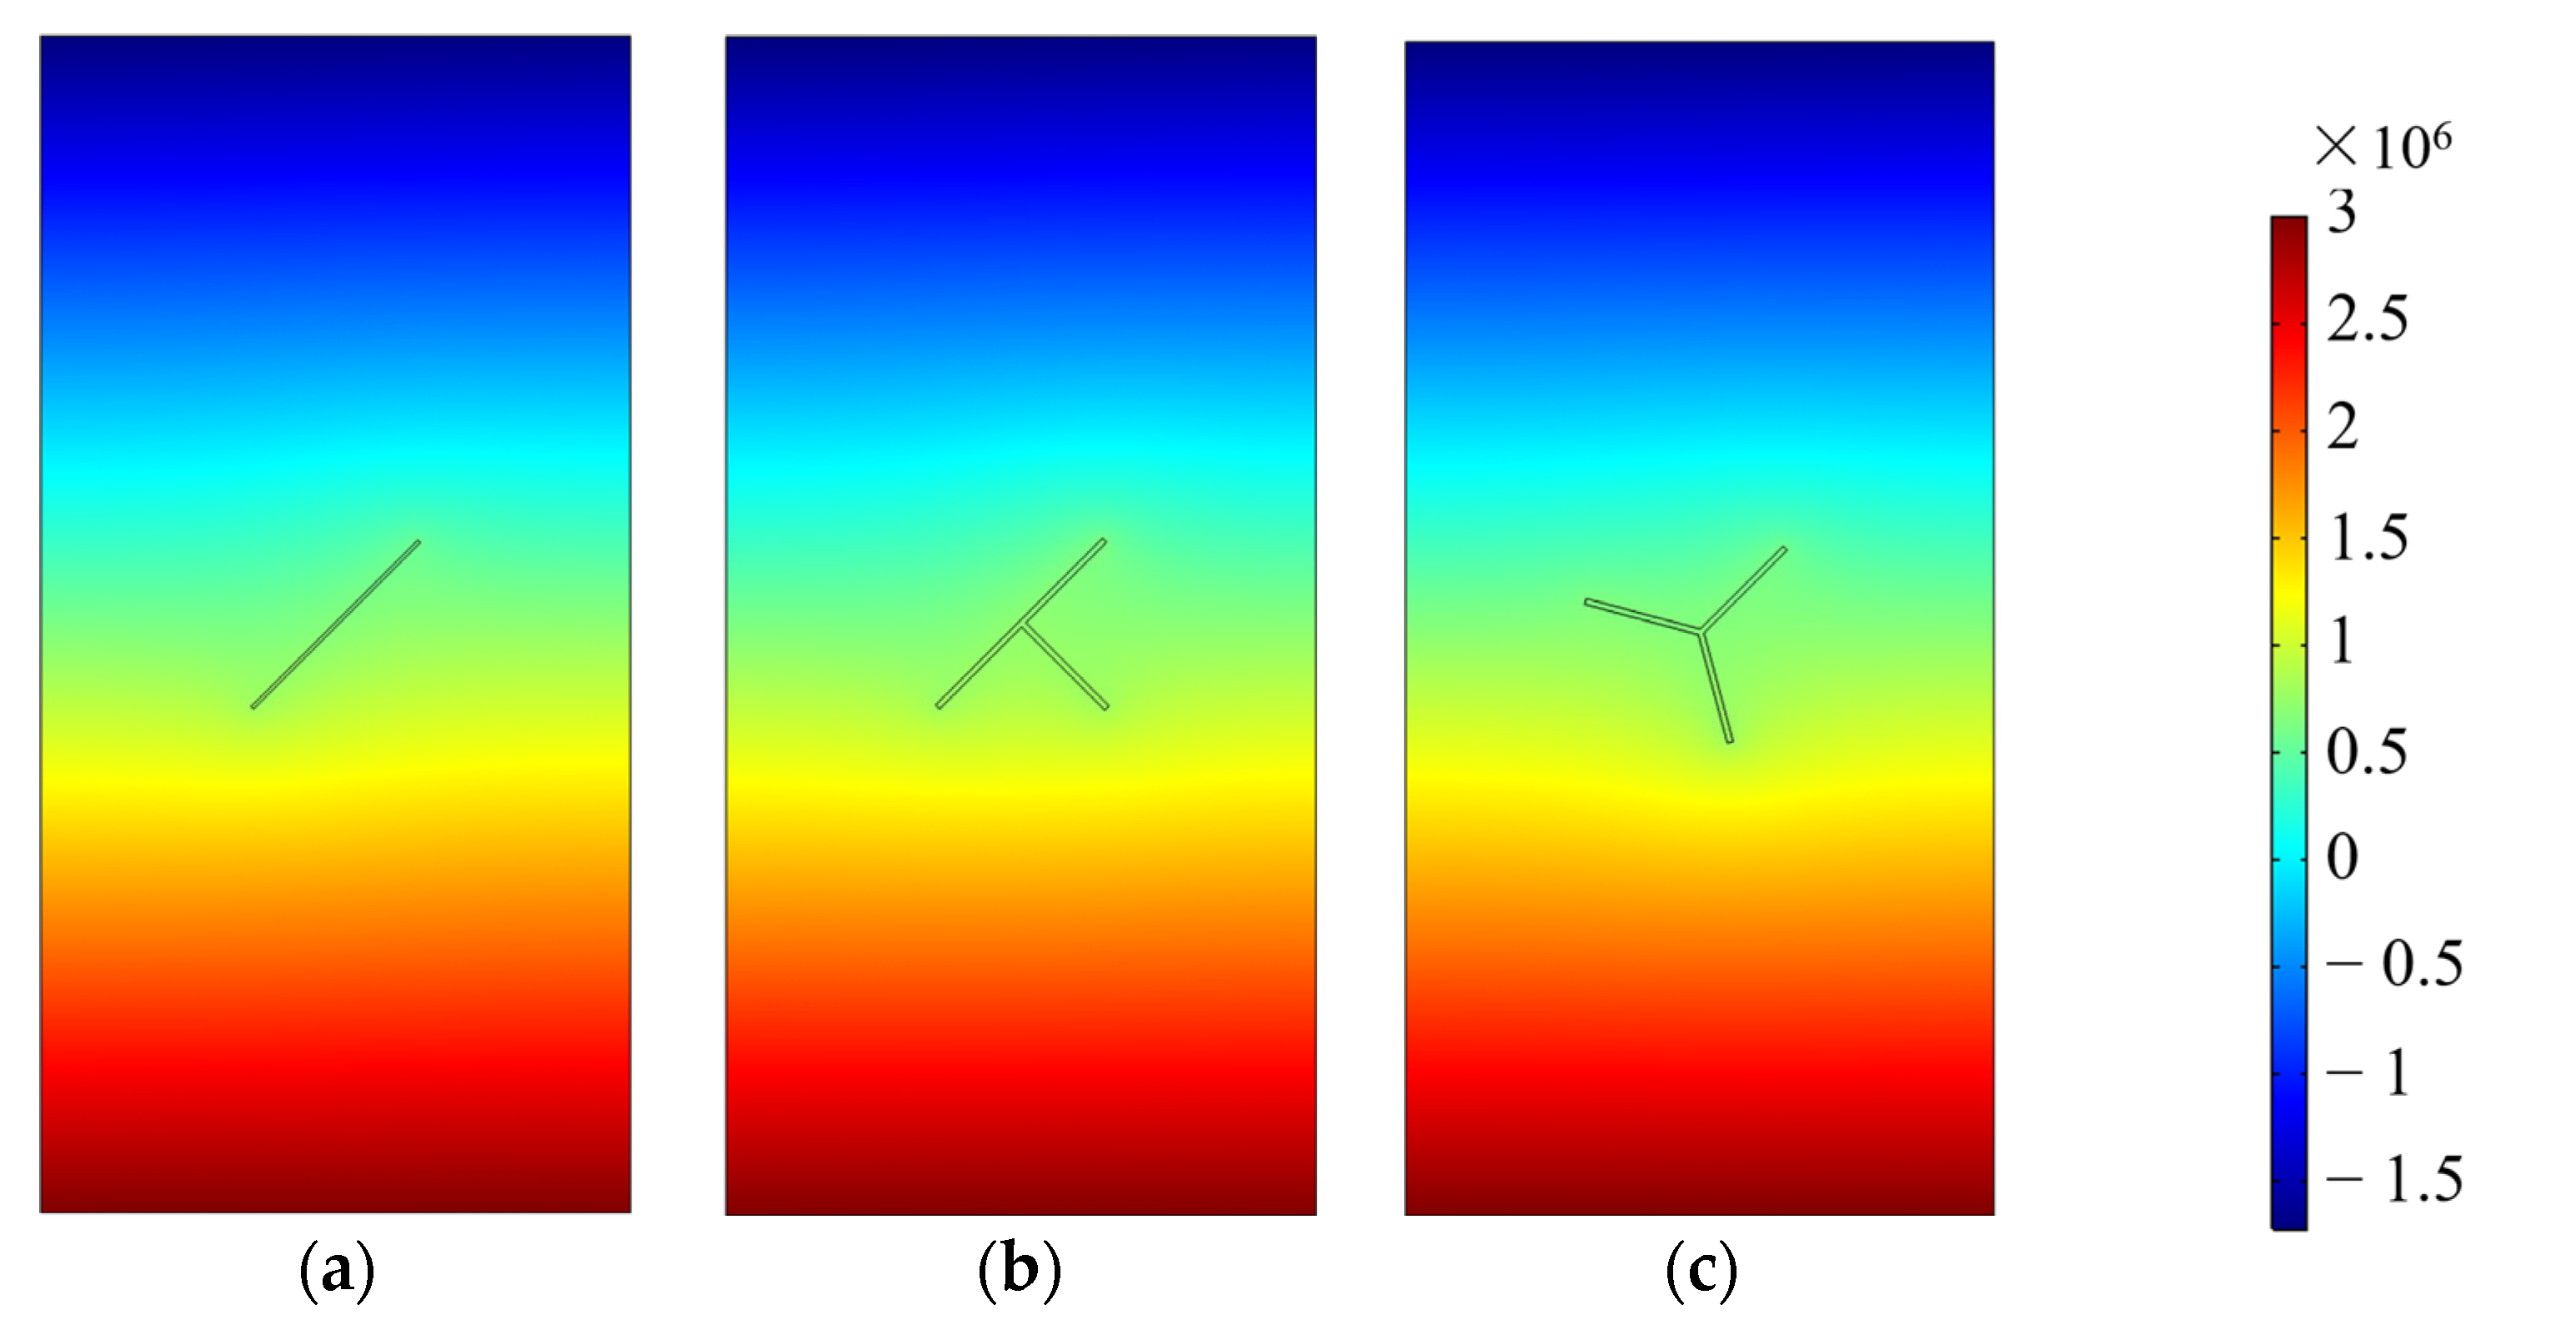
Figure 12 is the seepage pressure distribution map of the sample. The pressure difference between the upper and lower of the sample model drives the migration of the fluid, and the velocity of each part in the vertical direction is obviously different. The seepage pressure decreases gradually along the direction of fluid migration. Due to the existence of macroscopic prefabricated fracture, the uniformity of seepage pressure distribution is affected. The seepage pressure decreases slowly from the inlet to the prefabricated fracture and then decreases rapidly from the prefabricated fracture to the outlet. In the flow direction of seepage, the prefabricated fracture directly affects the fluid seepage path and velocity field distribution in the fracture-porosity model. The fluid seepage velocity in the prefabricated fractures increases significantly, and the dominant channel effect is significant.

6. Conclusions

The work performed the seepage test of sandstone samples with single, T-shaped, and Y-shaped fractures under different confining pressures (8, 8.5, 9, 9.5, and 10 MPa), different water pressures (3, 4, 5, 6, and 7 MPa), and different inclinations (0, 15, 30, 45, 60, 75, and 90°). The Forchheimer equation was used to analyze the nonlinear seepage behaviors of water flow in pore-fracture media and the characteristics of the Forchheimer’s coefficients. Combined with COMSOL numerical simulation software, the flow trajectory of fluid in the pore-fracture media inside the sample was studied. The main conclusions are as follows:
  • The Forchheimer equation was used for the fitting analysis on the correlation between seepage pressure gradient −∇P and volume flow Q of samples with single, T-shaped, and Y-shaped fractures. The correlation coefficient (R2) value exceeded 0.9900, with a good fitting effect. In the relationship between −∇P and Q, the different fractured samples increased with the increased −∇P, and the fitting curve was convex to −∇P axis. Moreover, the increase of Q was higher than the linear increase, presenting significant non-linearity. In this case, non-Darcy flow coefficient β (or nonlinear term coefficient b) of the Forchheimer equation was negative. When the pressure gradient was constant, the pores and fractures were closed due to the increased confining pressure, and the volume flow of samples with different fractures gradually decreased with the increased confining pressure.
  • Coefficient a in the sandstone samples with single, T-shaped, and Y-shaped fractures gradually increased with increased σ3, which was caused by the closure of internal fractures in the sample under the confining pressure. Coefficient b gradually decreased with increased σ3. Moreover, the angle of the single-fracture sample had a greater impact on the seepage characteristic of pore-fracture media, and the angles of the sandstone samples with T- and Y-shaped fractures had a relatively small impact.
  • The nonlinear inertial-parameter equation of fluid flow in pore-fracture media was fitted based on the experiment. This equation showed that the relationship between non-Darcy flow coefficient β (negative value) and inherent permeability k was still following the power function.
  • When β was a negative value, critical nonlinear effect E was −0.1, and corresponding Forchheimer’s coefficient F0 was −0.091. The normalized hydraulic conductivity method is used to evaluate the applicability of Darcy’s law, which provided a clear quantitative standard for predicting nonlinear flow behaviors.
  • Through the combination of experiment and numerical simulation, it can be seen that the nonlinear seepage characteristic phenomenon in this paper satisfies −μ2/4ρ|−∇P|k2 < β < 0. Under the seepage water pressure, the water flow first passes through the porous area of the sandstone sample and then passes through the combined area of pores and prefabricated fractures. The existence of prefabricated fracture has a significant influence on the seepage law, and the different spatial combinations of pores and prefabricated fractures are the main reason for the nonlinear seepage characteristic.
  • The expanded value range of non-Darcy flow coefficient β could open up new research directions and improve the research field of nonlinear seepage, providing strong support for developing the rock-mass seepage theory.
In summary, it was found that the fluid flow in multiple types of fracture-pore media satisfies the nonlinear seepage law through indoor experiments, and the non-Darcy flow coefficient β (or nonlinear term coefficient b) of the Forchheimer equation was negative. At the same time, the value of critical nonlinear effect E when β was a negative value was studied. In addition, combined with numerical simulation, it was revealed that the spatial combination of multiple types of fracture-pore media was the main reason for the negative of non-Darcy seepage coefficient β.

Author Contributions

Conceptualization, Y.Z. and Q.S.; methodology, Q.S. and D.Z.; validation, Y.Z., J.P. and X.X.; formal analysis, P.W.; investigation, P.W.; resources, M.C.; writing—original draft preparation, Y.Z., Q.S. and D.Z.; writing—review and editing, J.P. and X.X.; supervision, M.C.; project administration, M.C.; funding acquisition, Y.Z. and P.W. All authors have read and agreed to the published version of the manuscript.

Funding

This research was funded by the Guangdong Basic and Applied Basic Research Foundation (No. 2022A1515110448) and National Natural Science Foundation of China (No. 52074020).

Institutional Review Board Statement

Not applicable.

Informed Consent Statement

Not applicable.

Data Availability Statement

Not applicable.

Conflicts of Interest

The authors declare that they have no conflict of interest.

References

  1. Bear, J. Dynamics of Fluids in Porous Media; Elsevier: New York, NY, USA, 1972. [Google Scholar]
  2. Tsang, Y.W.; Witherspoon, P.A. Hydromechanical behavior of a deformable rock fracture subject to normal stress. J. Geophys. Res. Solid Earth 1981, 86, 9287–9298. [Google Scholar] [CrossRef] [Green Version]
  3. Chen, Z.; Narayan, S.P.; Yang, Z.; Rahman, S.S. An experimental investigation of hydraulic behaviour of fractures and joints in granitic rock. Int. J. Rock Mech. Min. Sci. 2000, 37, 1061–1071. [Google Scholar] [CrossRef]
  4. Nazridoust, K.; Ahmadi, G.; Smith, D.H. A new friction factor correlation for laminar, single-phase flows through rock fractures. J. Hydrol. 2006, 329, 315–328. [Google Scholar] [CrossRef]
  5. Crandall, D.; Ahmadi, G.; Smith, D.H. Computational Modeling of Fluid Flow through a Fracture in Permeable Rock. Transp. Porous Media 2010, 84, 493–510. [Google Scholar] [CrossRef]
  6. Yang, Y.; Zhang, D.; Zhang, B.; Ye, C.; Yang, B. Analysis of Strength and permeability of crystalline sandstone under loading-unloading conditions. Energy Sources Part A: Recover. Util. Environ. Eff. 2019, 41, 2650–2661. [Google Scholar]
  7. Zeng, Z.; Grigg, R. A criterion for non-Darcy flow in porous media. Transp. Porous Media 2006, 63, 57–69. [Google Scholar] [CrossRef]
  8. Sidiropoulou, M.G.; Moutsopoulos, K.N.; Tsihrintzis, V.A. Determination of Forchheimer equation coefficients a and b. Hydrol. Process. 2007, 21, 534–554. [Google Scholar] [CrossRef]
  9. Moutsopoulos, K.N.; Papaspyros, I.N.E.; Tsihrintzis, V.A. Experimental investigation of inertial flow processes in porous media. J. Hydrol. 2009, 374, 242–254. [Google Scholar] [CrossRef]
  10. Eck, B.J.; Barrett, M.E.; Charbeneau, R.J. Forchheimer flow in gently sloping layers: Application to drainage of porous asphalt. Water Resour. Res. 2012, 48, W01530. [Google Scholar] [CrossRef] [Green Version]
  11. Ghane, E.; Fausey, N.R.; Brown, L.C. Non-Darcy flow of water through woodchip media. J. Hydrol. 2014, 519, 3400–3409. [Google Scholar] [CrossRef]
  12. Schrauf, T.W.; Evans, D.D. Laboratory studies of gas flow through a single natural fracture. Water Resour. Res. 1986, 22, 1038–1050. [Google Scholar] [CrossRef]
  13. Zimmerman, R.W.; Al-Yaarubi, A.; Pain, C.C.; Grattoni, C.A. Non-linear regimes of fluid flow in rock fractures. Int. J. Rock Mech. Min. Sci. 2004, 41, 163–169. [Google Scholar] [CrossRef]
  14. Ranjith, P.G.; Darlington, W. Nonlinear single-phase flow in real rock joints. Water Resour. Res. 2007, 43, W09502. [Google Scholar] [CrossRef] [Green Version]
  15. Zhang, Z.; Nemcik, J. Fluid flow regimes and nonlinear flow characteristics in deformable rock fractures. J. Hydrol. 2013, 477, 139–151. [Google Scholar] [CrossRef]
  16. Javadi, M.; Sharifzadeh, M.; Shahriar, K.; Mitani, Y. Critical Reynolds number for nonlinear flow through rough-walled fractures: The role of shear processes. Water Resour. Res. 2014, 50, 1789–1804. [Google Scholar] [CrossRef] [Green Version]
  17. Tzelepis, V.; Moutsopoulos, K.N.; Papaspyros, J.N.E.; Tsihrintzis, V.A. Experimental investigation of flow behavior in smooth and rough artificial fractures. J. Hydrol. 2015, 521, 108–118. [Google Scholar] [CrossRef]
  18. Mathias, S.A.; Butler, A.P.; Zhan, H. Approximate solutions for Forchheimer flow to a well. J. Hydraul. Eng. 2008, 134, 1318–1325. [Google Scholar] [CrossRef] [Green Version]
  19. Johnson, J.; Brown, S.; Stockman, H. Fluid flow and mixing in rough-walled fracture intersections. J. Geophys. Res. Solid Earth 2006, 111, B12206. [Google Scholar] [CrossRef]
  20. Qian, J.; Zhan, H.; Luo, S.; Zhao, W. Experimental evidence of scale-dependent hydraulic conductivity for fully developed turbulent flow in a single fracture. J. Hydrol. 2007, 339, 206–215. [Google Scholar] [CrossRef]
  21. Zou, L.; Jing, L.; Cvetkovic, V. Roughness decomposition and nonlinear fluid flow in a single rock fracture. Int. J. Rock Mech. Min. Sci. 2015, 75, 102–118. [Google Scholar] [CrossRef]
  22. Quinn, P.M.; Parker, B.L.; Cherry, J.A. Using constant head step tests to determine hydraulic apertures in fractured rock. J. Contam. Hydrol. 2011, 126, 85–99. [Google Scholar] [CrossRef] [PubMed]
  23. Qian, J.; Wang, M.; Zhang, Y.; Yan, X.; Zhao, W. Experimental study of the transition from non-Darcian to Darcy behavior for flow through a single fracture. J. Hydrodyn. 2015, 27, 679–688. [Google Scholar] [CrossRef]
  24. Rong, G.; Tan, J.; Zhan, H.B.; He, R.H.; Zhang, Z.Y. Quantitative evaluation of fracture geometry influence on nonlinear flow in a single rock fracture. J. Hydrol. 2020, 589, 125162. [Google Scholar] [CrossRef]
  25. Xing, K.; Qian, J.Z.; Zhao, W.D.; Ma, H.C.; Ma, L. Experimental and numerical study for the inertial dependence of non-Darcy coefficient in rough single fractures. J. Hydrol. 2021, 603, 127148. [Google Scholar] [CrossRef]
  26. Cornell, D.; Katz, D.L. Flow of gases through consolidated porous media. Indus. Eng Chem. 1953, 45, 2145–2152. [Google Scholar] [CrossRef]
  27. Ruth, D.; Ma, H. On the derivation of the Forchheimer equation by means of the averaging theorem. Trans. Porous Med. 1992, 7, 255–264. [Google Scholar] [CrossRef]
  28. Li, D.; Engler, T.W. Literature review on correlations of the non-Darcy coefficient. In Proceedings of the SPE Permian Basin Oil and Gas Recovery Conference, Midland, TX, USA, 23–26 March 2001. [Google Scholar]
  29. Rong, G.; Yang, J.; Cheng, L.; Zhou, C. Laboratory investigation of nonlinear flow characteristics in rough fractures during shear process. J. Hydrol. 2016, 541, 1385–1394. [Google Scholar] [CrossRef]
  30. Macini, P.; Mesini, E.; Viola, R. Laboratory measurements of non-Darcy flow coefficients in natural and artificial unconsolidated porous media. J. Pet. Sci. Eng. 2011, 77, 365–374. [Google Scholar] [CrossRef]
  31. Yin, Q.; Ma, G.; Jing, H.; Wang, H.; Su, H.; Wang, Y.; Liu, R. Hydraulic properties of 3D rough-walled fractures during shearing: An experimental study. J. Hydrol. 2017, 555, 169–184. [Google Scholar] [CrossRef]
  32. Yu, B.Y.; Chen, Z.Q.; Ding, Q.L.; Wang, L.Z. Non-Darcy flow seepage characteristics of saturated broken rocks under compression with lateral constraint. Int. J. Min. Sci. Technol. 2016, 26, 1145–1151. [Google Scholar] [CrossRef]
  33. Zhou, J.Q.; Hu, S.H.; Fang, S.; Chen, Y.F.; Zhou, C.B. Nonlinear flow behavior at low Reynolds numbers through rough-walled fractures subjected to normal compressive loading. Int. J. Rock Mech. Min. Sci. 2015, 80, 202–218. [Google Scholar] [CrossRef]
  34. Chen, Y.F.; Zhou, J.Q.; Hu, S.H.; Hu, R.; Zhou, C.B. Evaluation of Forchheimer equation coefficients for non-Darcy flow in deformable rough-walled fractures. J. Hydrol. 2015, 529, 993–1006. [Google Scholar] [CrossRef]
  35. Li, W.L.; Zhou, J.Q.; He, X.L.; Chen, Y.F.; Zhou, C.B. Nonlinear flow characteristics of broken granite subjected to confining pressures. Rock Soil Mech. 2017, 38, 140–150. [Google Scholar]
  36. Ma, D.; Miao, X.X.; Chen, Z.Q.; Mao, X.B. Experimental Investigation of Seepage Properties of Fractured Rocks Under Different Confining Pressures. Rock Mech. Rock Eng. 2013, 46, 1135–1144. [Google Scholar] [CrossRef]
  37. Dary, H. Les Fontaines Publiques de la Ville de Dijon, Exposition et Application des Principes a Suivre et des Formules a Employer Dans les Questions de Distribution D’eau; Victor Dalmont: Paris, France, 1856; p. 647. [Google Scholar]
  38. Zimmerman, R.W.; Bodvarsson, G.S. Hydraulic conductivity of rock fractures. Transp. Porous Media 1996, 23, 1–30. [Google Scholar] [CrossRef] [Green Version]
  39. Medici, G.; West, L.J. Review of groundwater flow and contaminant transport modelling approaches for the Sherwood Sandstone aquifer, UK; Insights from analogous successions worldwide. Q. J. Eng. Geol. Hydrogeol. 2022, 55, qjegh2021-176. [Google Scholar] [CrossRef]
  40. Forchheimer, P. Wasserbewegung durch boden. Z. Ver. Dtsch. Ing. 1901, 45, 1782–1788. [Google Scholar]
  41. Develi, K.; Babadagli, T. Experimental and visual analysis of single-phase flow through rough fracture replicas. Int. J. Rock Mech. Min. Sci. 2015, 73, 139–155. [Google Scholar] [CrossRef]
  42. Pan, J.; Xi, X.; Wu, X.; Guo, Q.; Ren, F.; Cai, M. Physical properties evolution and microscopic mechanisms of granite modified by thermal and chemical stimulation. Case Stud. Therm. Eng. 2023, 41, 102633. [Google Scholar] [CrossRef]
  43. Belhaj, H.A.; Aghj, K.R.; Nouri, A.M.; Butt, S.D.; Vaziri, H.H.; Islam, M.R. Numerical and experimental modeling of non-Darcy flow in porous media. In Proceedings of the Society of Petroleum Engineers, SPE Latin America and Caribbean Petroleum Engineering Conference, Port of Spain, Trinidad and Tobago, 27–30 April 2003; pp. 1–9. [Google Scholar]
  44. Skjetne, E.; Auriault, J.L. New insights on steady, non-linear flow in porous media. Eur. J. Mech. B Fluids 1999, 18, 131–145. [Google Scholar] [CrossRef]
  45. Cherubini, C.; Giasi, C.I.; Pastore, N. Bench scale laboratory tests to analyze non-linear flow in fractured media. Hydrol. Earth Syst. Sci. 2012, 16, 2511–2522. [Google Scholar] [CrossRef] [Green Version]
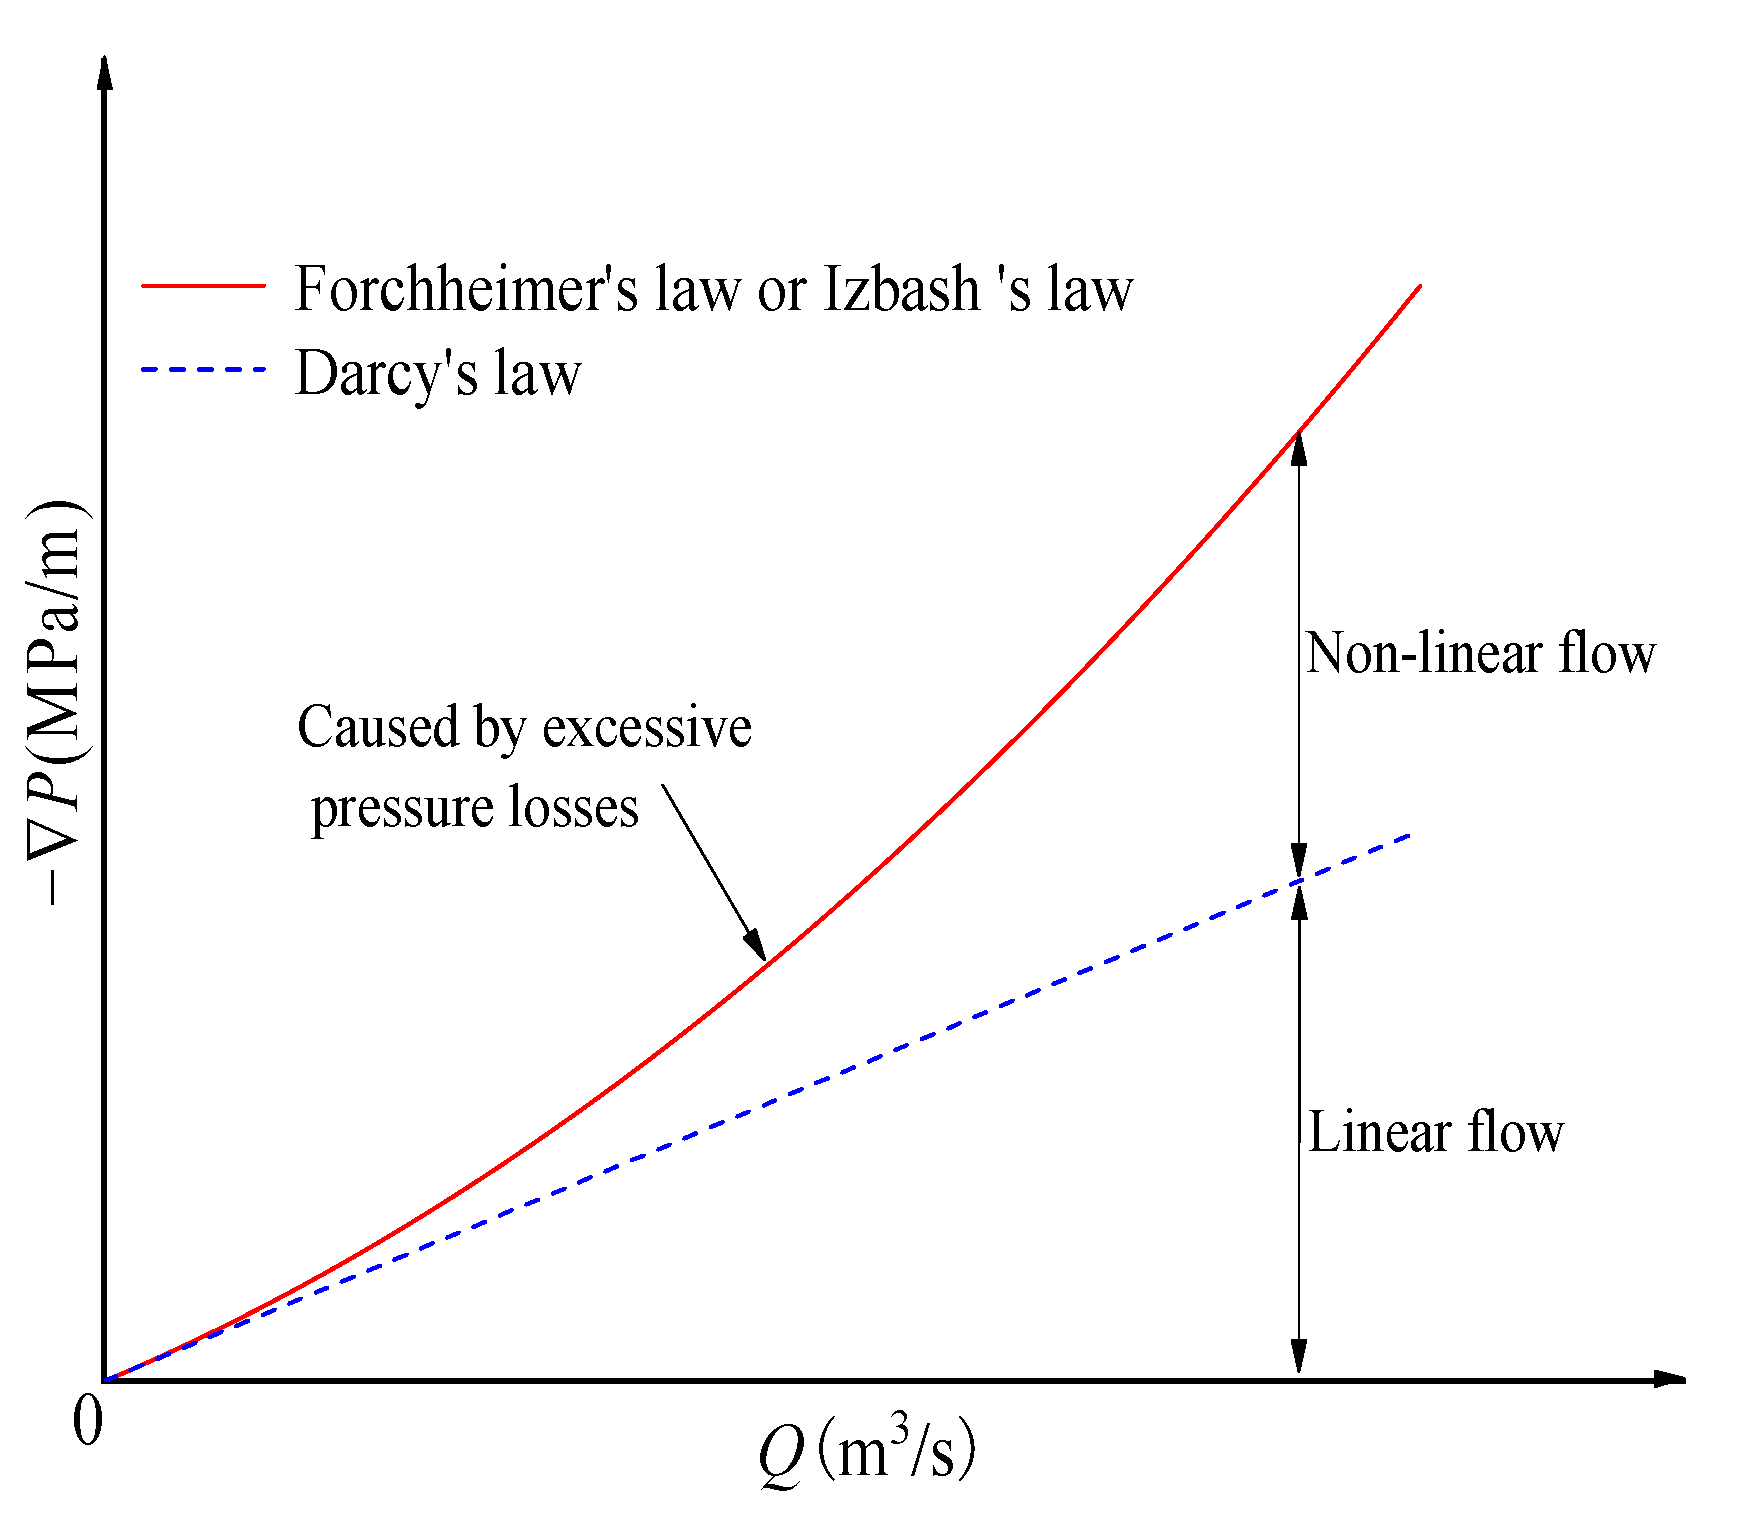
Figure 1. Increase of −∇P greater than that of Q in linear proportion (traditional conclusion).
Minerals 13 00373 g001
Figure 2. Detailed observation of the sample: (a) Scanning electron microscope (SEM) image; (b) magnetic resonance imaging (MRI) pseudo-color image.
Minerals 13 00373 g002
Figure 3. Underground fractured rock mass.
Minerals 13 00373 g003
Figure 4. Processing flow of sandstone samples with prefabricated fractures: (a) Waterjet cutting equipment; (b) wire cutting equipment; (c) sample models; (d) physical images of sandstone samples.
Minerals 13 00373 g004
Figure 5. Pressure chamber structure.
Minerals 13 00373 g005
Figure 6. Two-dimensional numerical model diagram.
Minerals 13 00373 g006
Figure 7. Fitting relationship between −∇P and Q of multi-fracture sandstone samples under different confining pressures: (a) SF45; (b) ST45; (c) SY45.
Minerals 13 00373 g007
Figure 8. Variation characteristics of Forchheimer’s coefficients with the confining pressure under different inclinations and fractures: (a) Variation characteristics of linear term coefficient a of the single fracture; (b) variation characteristics of nonlinear term coefficient b of the single fracture; (c) variation characteristics of linear term coefficient a of the T-shaped fracture; (d) variation characteristics of nonlinear term coefficient b of the T-shaped fracture; (e) variation characteristics of linear term coefficient a of the Y-shaped fracture; (f) variation characteristics of nonlinear term coefficient b of the Y-shaped fracture.
Minerals 13 00373 g008aMinerals 13 00373 g008b
Figure 9. Variation characteristics of inherent permeability with the confining pressure under different inclinations and fractures: (a) Single fracture; (b) T-shaped fracture; (c) Y-shaped fracture.
Minerals 13 00373 g009
Figure 10. Evolution of normalized transmissivity T/T0 with pressure gradient −∇P: (a) SF45; (b) ST45; (c) SY45.
Minerals 13 00373 g010
Figure 11. Seepage streamline trajectory distribution map: (a) Single fracture; (b) T-shaped fracture; (c) Y-shaped fracture.
Minerals 13 00373 g011
Figure 12. Seepage pressure distribution map of the sample: (a) Single fracture; (b) T-shaped fracture; (c) Y-shaped fracture.
Minerals 13 00373 g012
Table 1. Test scheme for the seepage characteristic of sandstone samples.
Confining Pressure/MPaWater Pressure/MPaTime/sConfining Pressure/MPaWater Pressure/MPaTime/s
8.031009.53100
8.041009.54100
8.051009.55100
8.061009.56100
8.071009.57100
8.5310010.03100
8.5410010.04100
8.5510010.05100
8.5610010.06100
8.5710010.07100
9.03100
9.04100
9.05100
9.06100
9.07100
Table 2. Fitting values of nonlinear seepage coefficients of sandstone.
Sample No.Fitting EquationR2
SF0β = −1.74 × 10⁻⁶k−1.250.9589
SF15β = −1.40 × 10−47k−3.840.9238
SF30β = −2.30 × 10⁻⁸k−1.350.9632
SF45β = −4.80 × 10⁻²⁰k−2.100.9196
SF60β = −7.98 × 10−36k−3.060.9955
SF75β = −2.56 × 10⁻³⁰k−2.720.9549
SF90β = −2.37 × 10⁻²²k−2.240.9898
ST0β = −2.04 × 10⁻²²k−2.260.9906
ST15β = −1.23 × 10⁻²¹k−2.180.9072
ST30β = −3.39 × 10−43k−3.560.6875
ST45β = −1.15 × 10⁻⁶k−1.220.8347
ST60β = −2.48 × 10⁻¹³k−1.660.9630
ST75β = −4.43 × 10⁻¹⁹k−2.050.9928
ST90β = −51.44k−0.740.8346
SY0β = −1.55 × 10−47k−3.830.9747
SY15β = −2.81 × 10⁻²²k−2.240.9131
SY30β = −9.44 × 10⁻¹⁷k−1.900.9761
SY45β = −6.00 × 10⁻³³k−2.930.9950
SY60β = −3.46 × 10−42k−3.510.9659
SY75β = −4.94 × 10⁻³³k−2.910.8154
SY90β = −1.36 × 10⁻¹³k−1.710.9899
Disclaimer/Publisher’s Note: The statements, opinions and data contained in all publications are solely those of the individual author(s) and contributor(s) and not of MDPI and/or the editor(s). MDPI and/or the editor(s) disclaim responsibility for any injury to people or property resulting from any ideas, methods, instructions or products referred to in the content.