3.1. Material Properties
The detailed chemical compositions of the raw materials are shown in
Table 5.
Figure 1 shows the effect of mechanochemical and thermal treatment on the particle sizes of WPS. Compared to the particle size distribution (PSD) curves of the samples without milling treatment WPS (d50 = 730 μm) and SC8 (d50 = 1200 μm), the entire PSD curves of mechanochemically activated SG (d50 = 600 μm) and SC8G (d50 = 860 μm) shifted to smaller particle sizes based on the grinding process. The PSD curves of the thermally activated SC8 were found to be coarser than WPS. The reason for this shift is likely that thermal activation tends to agglomerate clay minerals and that the occurrence of sintering and particle agglomeration increases particle size. Similar results could be obtained by comparing the PSD curves of SC6G (640 μm) and SC8G (d50 = 860 μm). The conclusions discussed above are consistent with earlier reports on the effect of grinding and heating on particle sizes of other clay minerals [
34,
35]. In addition, for SC6G and SC8G, the d50 was observed to be 640 μm and 860 μm, respectively; however, the d50 for SC7G was 550 μm, which did not increase linearly with calcination temperature.
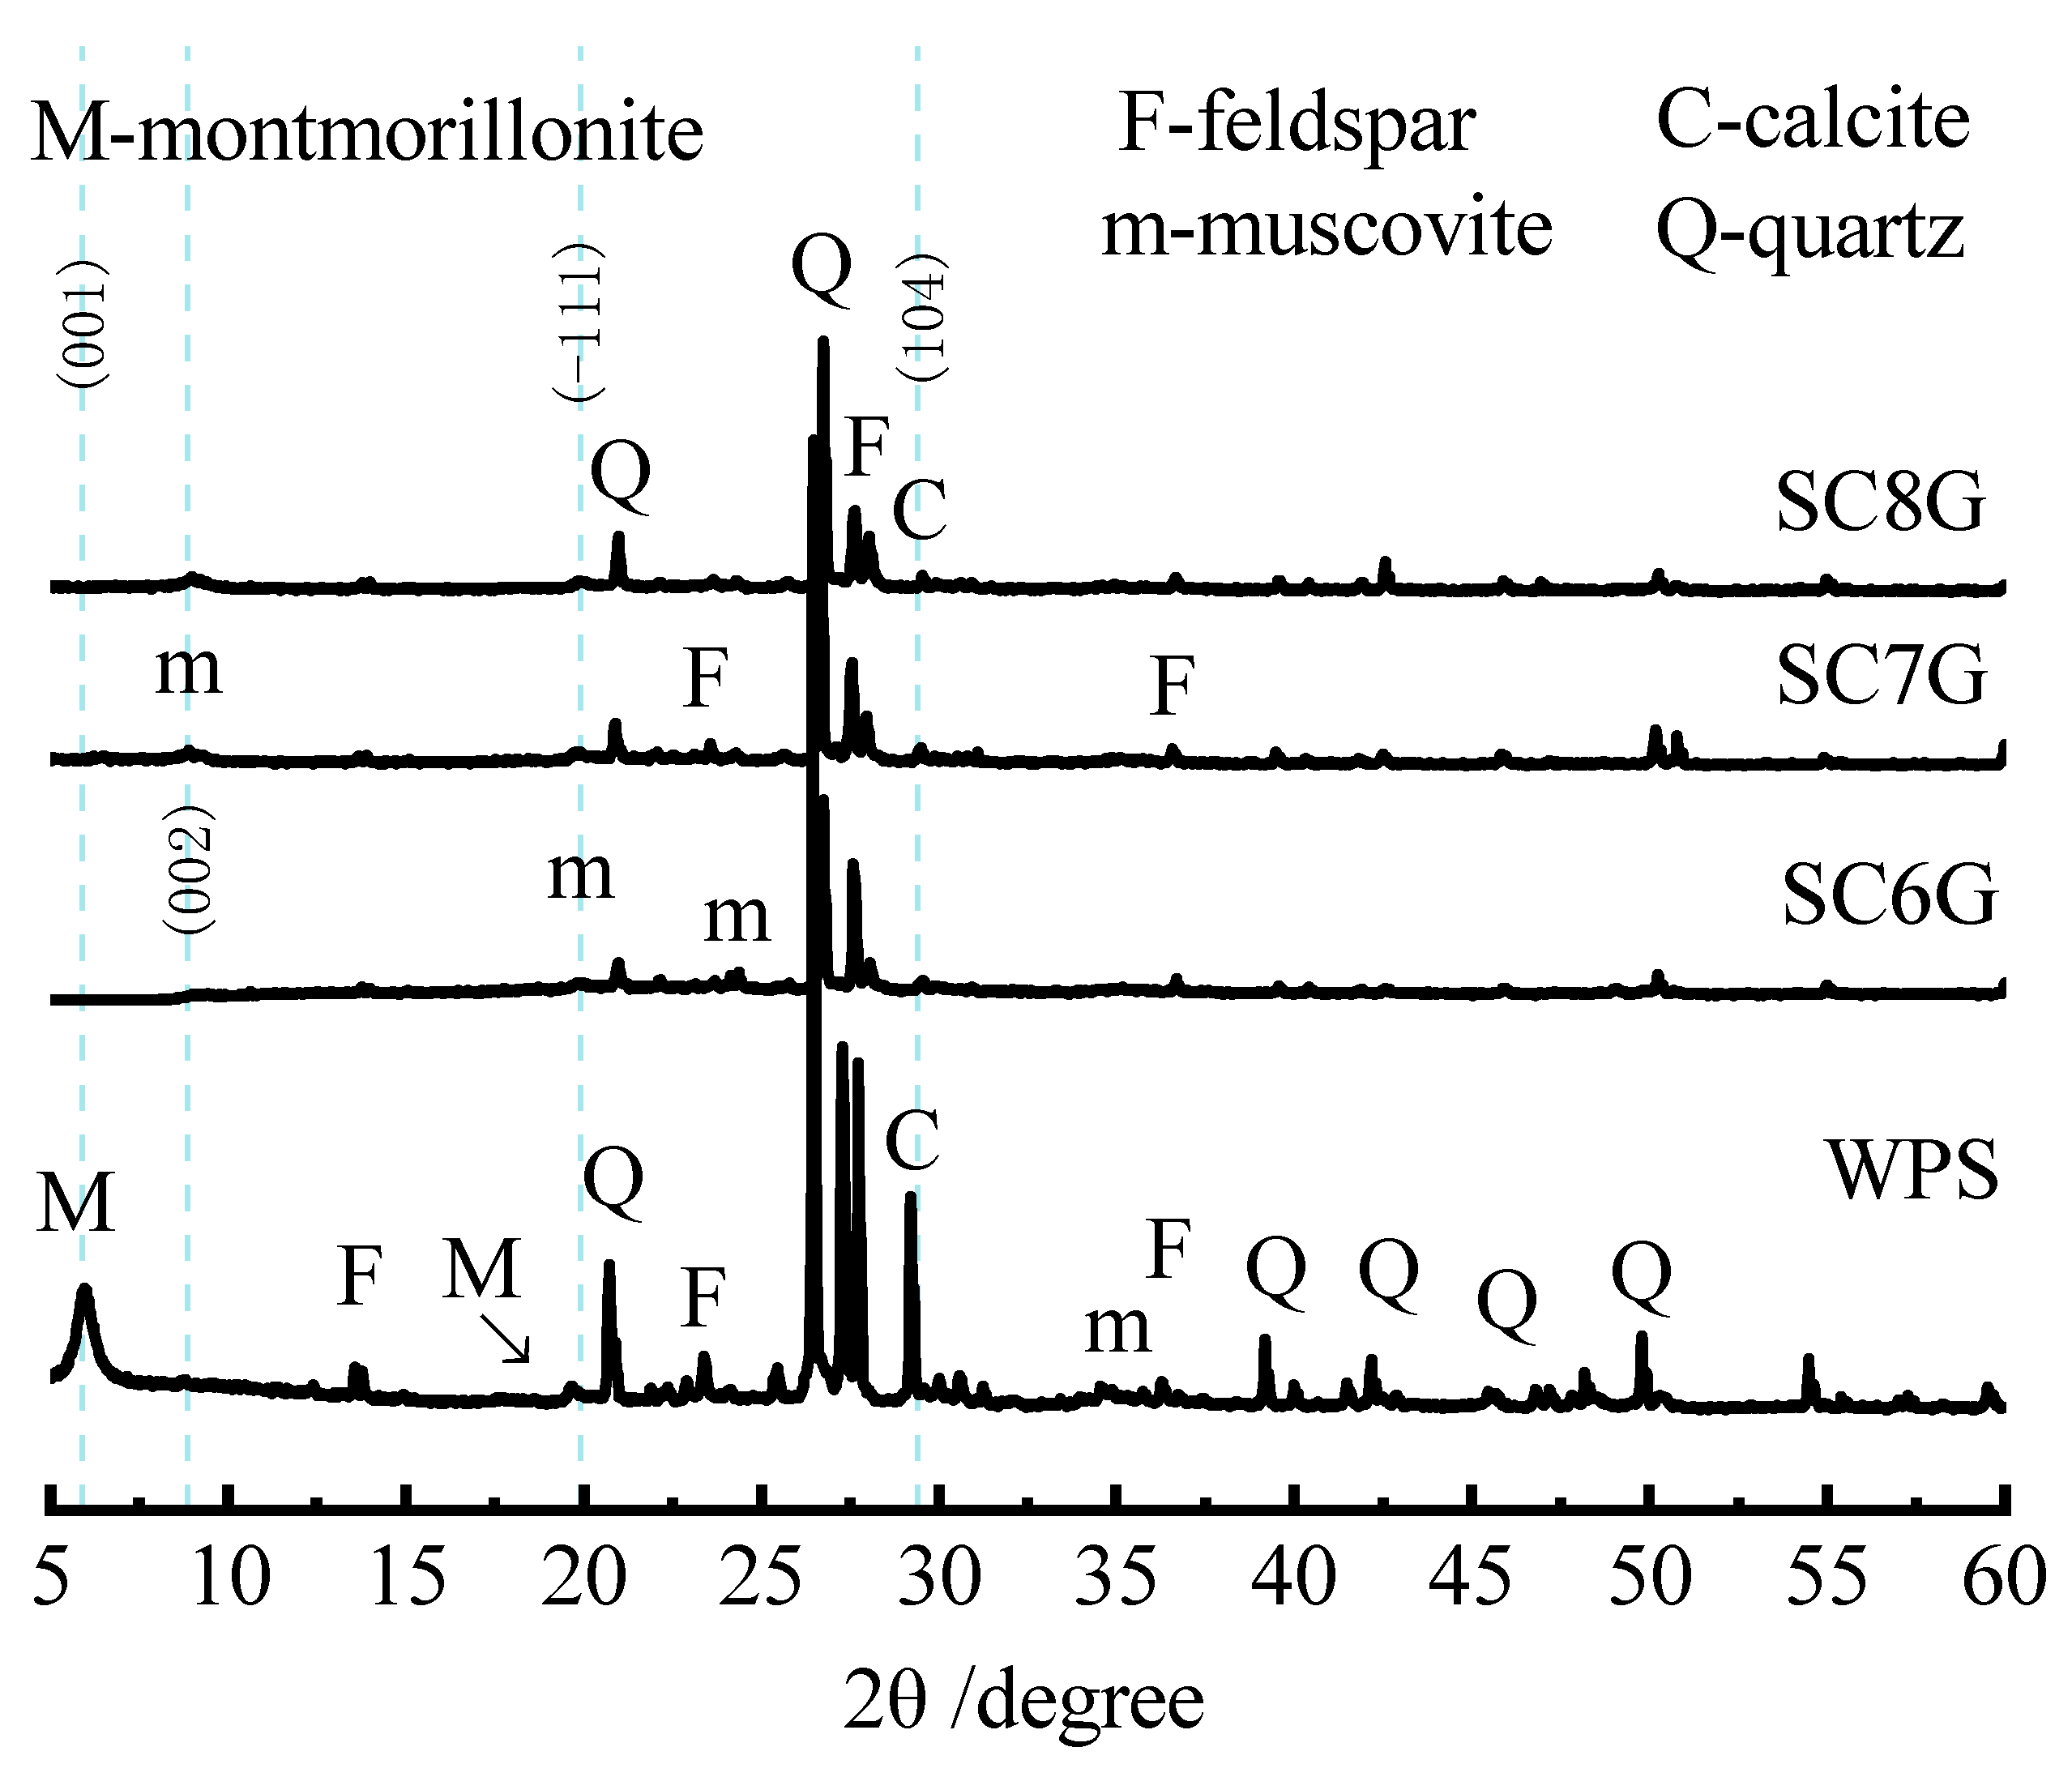
Figure 2 shows that the montmorillonite diffraction peak (001) of activated WPS almost disappeared compared to its untreated state. This result is inconsistent with earlier reports on the thermal activation of montmorillonite [
35]. Interlayer water of montmorillonite is removed after calcination at 800 °C, which leads to a reduction in the crystalline surface spacing but does not cause the disappearance of its diffraction peaks. This difference may be explained by the fact that the lattice of montmorillonite has disintegrated under the combined effect of calcination and intense grinding. A slight increase in the intensity of muscovite peaks was observed, which further confirmed the disintegration of the montmorillonite lattice [
35]. Mechanochemical and thermal treatment with dry grinding and calcination resulted in a broadening and lowering of quartz and feldspar peak intensities, indicating a reduction in WPS crystallinity and a progressive amorphization of the minerals among WPS. In addition, for the thermally and mechanochemically activated WPS, a significant disappearance of the calcite peaks was observed.
3.2. Effect of Mechanochemical Activation on the Dissolution of Si, Al, and Ca
There are various interactions that occur in the WPS/leaching agent system, which include precipitation/dissolution, complex formation, adsorption/desorption, and redox reactions, which are bound to control the mobilization of Si, Al, and Ca in the leachate [
30]. The dissolution process of WPS is very complicated. In order to simplify the process, the leaching efficiencies of Si, Al, and Ca were considered to be a relationship, which reflects the amounts of Si, Al, and Ca dissolved out from minerals and the amounts of free Si, Al, and Ca in leachates consumed by involving secondary mineral formation [
36,
37].
To highlight the effect of mechanochemical activation on the ion leaching efficiency, the grinding efficiency (the ratio of the leaching efficiency of each ion of the ground sample to the leaching efficiency of each the unground sample multiplied by 100%) was defined and presented in the figure as a scatter.
The variation in the leaching efficiencies of Si, Al, and Ca of WPS and SG in 1.0 M NaOH solution at 20 °C are shown in
Figure 3. It can be seen that there is a fluctuated variation in the leaching efficiency of Si as a function of leaching time. The grinding efficiencies were 124%, 106%, and 149% for 1, 3, and 28 days, respectively. This may be due to destruction of the crystalline lattice of minerals caused by the grinding, which allows the release of more Si and Al ions [
34]. Therefore, it seems to be possible to deduce that the leaching efficiency curve corresponding to SG should be higher than that corresponding to WPS. However, the result that the grinding efficiencies were 66% and 76% for 7 and 14 days, respectively, is inconsistent with the deduction. This result seems to be attributed to the fact that the mechanochemical activation not only makes the Si ions more soluble from the mineral surface but also promotes the chemical reactions that occur between the solid particle surface and Si, Al, and Ca in the leachate. In addition, the rates of the chemical reactions may be influenced by variations in the concentration of each ion in the leachate or by changes in the solid surface. There was a lack of correlation observed between WPS and SG in terms of the leaching efficiency of Al.
A significant decrease occurred in the leaching efficiency of Ca over the range of 1 to 3 days was observed (
Figure 3c and
Figure 4c). This phenomenon could be attributed to the fact that the easily soluble oxide of calcium dissolved quickly in the leaching agent, which caused a higher value of the leaching efficiency of Ca [
30], and subsequently, the free Ca ions in the leachate were consumed by reacting with other ions in leachates. In addition,
Figure 3c also shows that with mechanochemical treatment, the leaching efficiency of Ca in the leachate of SG decreased compared to its untreated state WPS. This decrease is likely due to the loss of easily soluble oxide of calcium on the surface of WPS caused by the grinding process [
34].
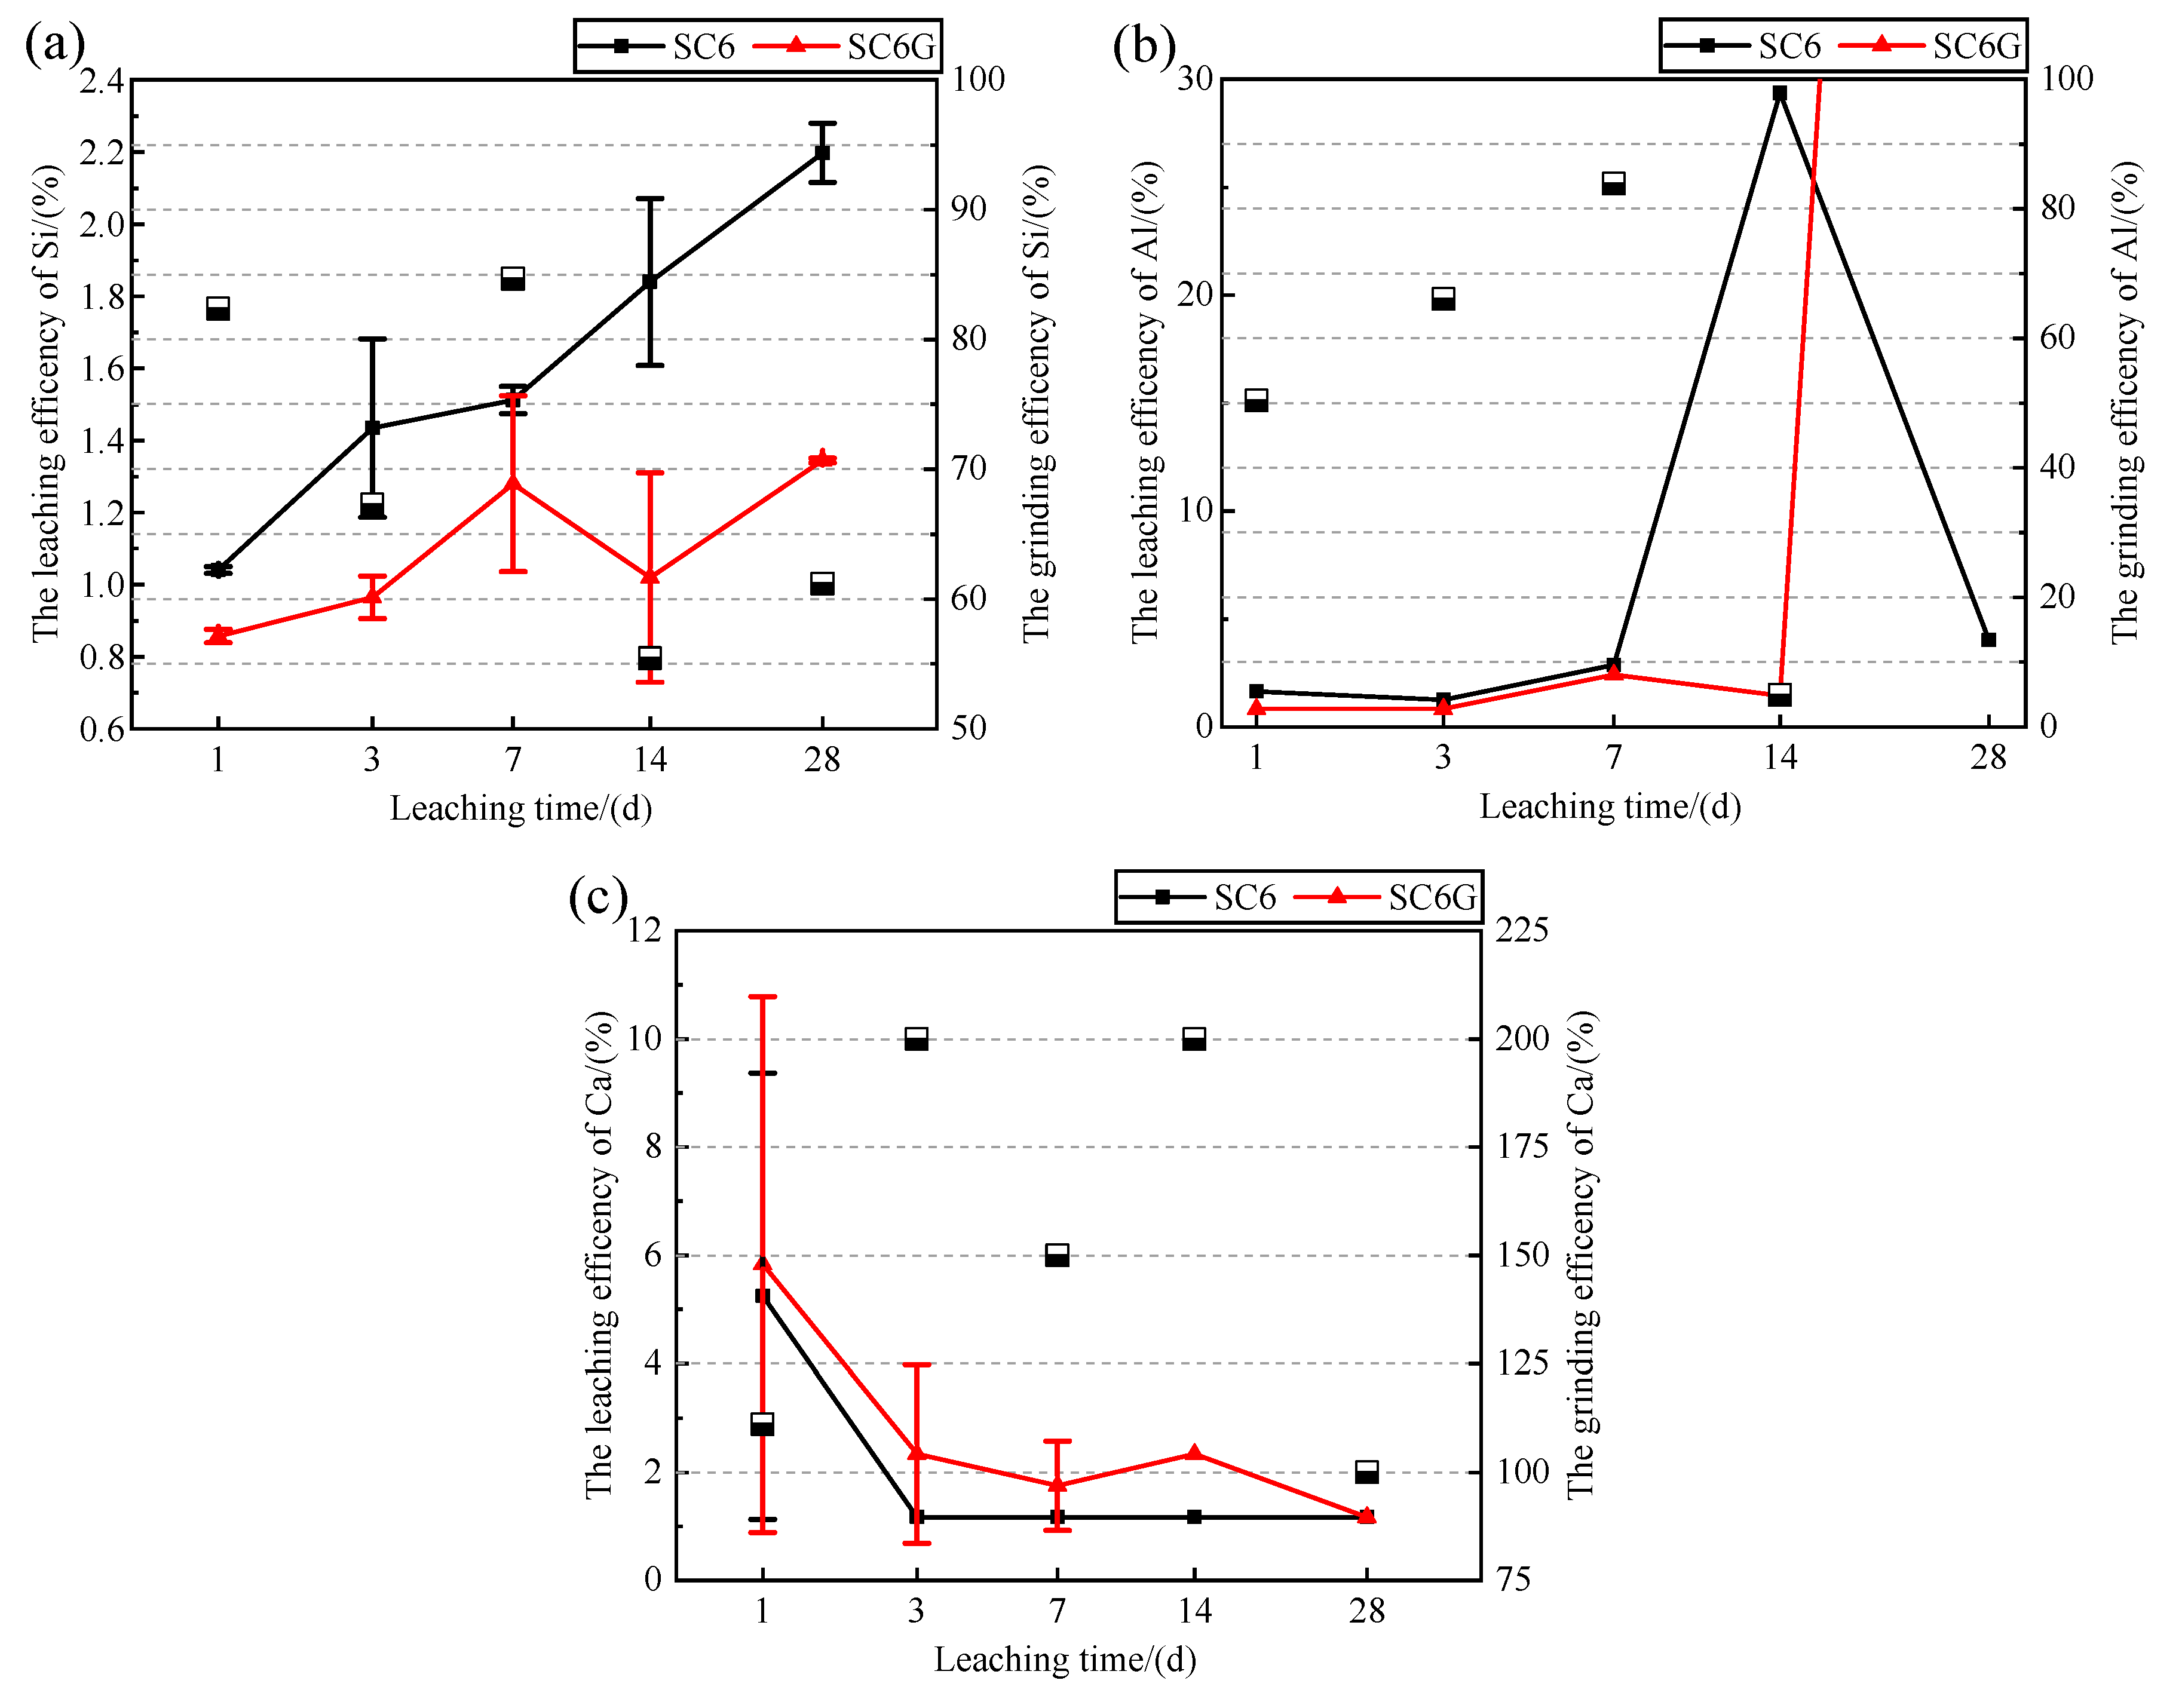
The variation in the leaching efficiencies of Si, Al, and Ca of SC6 and SC6G in 1.0 M NaOH solution at 20 °C are shown in
Figure 4. It can be seen that the grinding efficiencies of Si are all less than 100%, indicating that SC6G leaches less Si in leachates than SC6. In terms of particle size, smaller particles, which have a larger area to interact with the liquid, have a thinner boundary layer and can leach faster [
38]; however, this feature was not observed in the leaching efficiencies of Si and Al. This indicates that mechanochemical activation reduced the size of the particles, increased the rate of dissolution of ions dissolved from minerals, and also accelerated the rate of reactions between the species on the solid surface and the ions in the leachate [
37], which is consistent with the conclusions obtained in
Figure 3. The grinding efficiencies of Ca were all higher than 100%, which is opposite to the variation in the grinding efficiency in
Figure 3c.
In summary, mechanochemical activation affects the leaching behavior of WPS in alkaline solutions. In terms of the fluctuating variations in ion leaching efficiency, mechanochemical activation accelerates the rate of interaction between the solid surface and the ions in the leachate. In terms of leaching efficiency, mechanochemical activation increases the ion concentration of Si in the leachate after 28 days, and this concentration is affected by the ion concentration of Ca in the leachate, which shows that the ion concentration of Si in the leachate is higher when the ion concentration of Ca is lower. This may be due to the fact that the amount of Ca in the leachate is too insufficient to continue the reaction with the residual Si in the leachate to form gelling-like substances. Therefore, in the modification stage of WPS, the samples subject to mechanochemical activation should be mixed with mineral admixtures that can be calcium sources to make the reaction more adequate.
3.3. Effect of NaOH Concentration on the Dissolution of Si, Al, and Ca
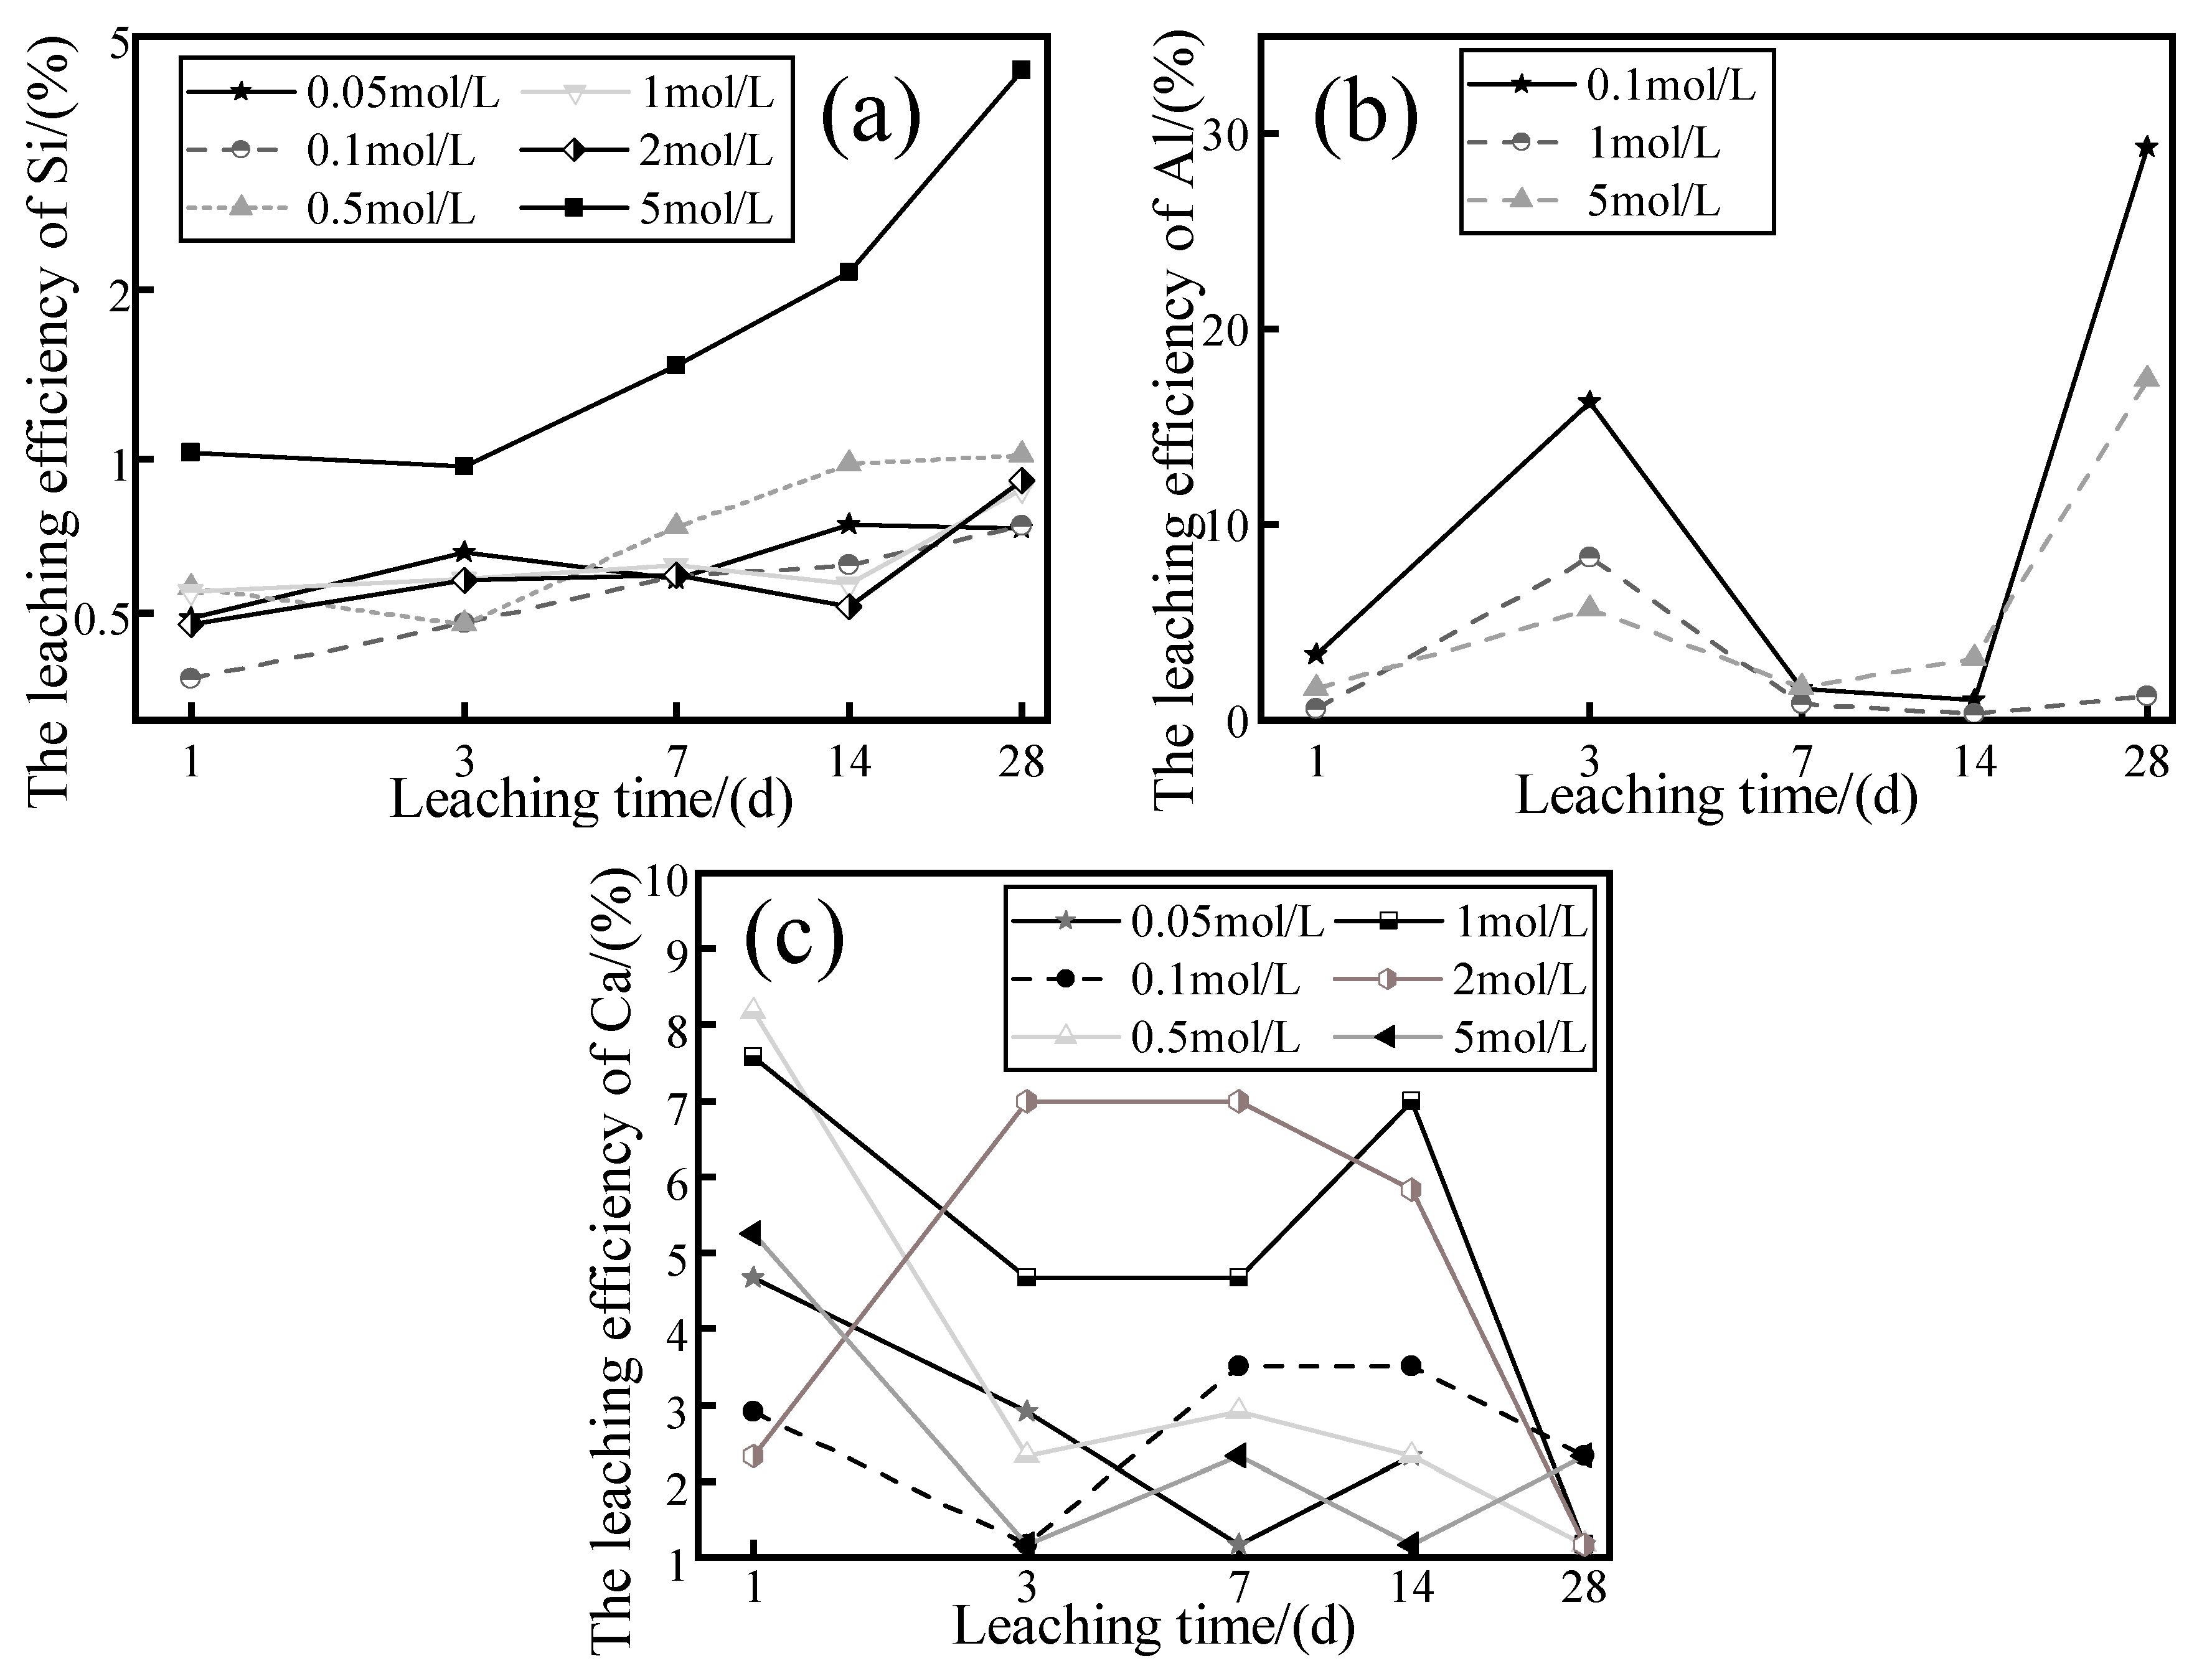
The SG samples were immersed in different concentrations of NaOH solutions curing at 20 °C, and the variation in the leaching efficiencies of Si, Al, and Ca as a function of leaching time was observed, as shown in
Figure 5. It can be seen that the leaching efficiency of Si showed an increasing trend with the leaching time but did not increase with the improvement in the concentration of the NaOH solutions. For example, when the leaching time was 28 days, the leaching efficiency of Si corresponding to the 0.5 and 2.0 M NaOH solutions was 1.02% and 0.91%, respectively, and only the leaching efficiency of Si corresponding to 5.0 M NaOH solutions was 4.46%, which was greatly improved.
As shown in
Figure 5b, all the curves showed fluctuating variations, exhibiting an increasing trend between 1 and 3 days, a decreasing trend between 3 and 7 days, and an increasing trend between 14 and 28 days. The Al leaching efficiency of 28 days was 27.7, 4.2, and 5.5 of Al leaching efficiency at a leaching time of 14 days, respectively, as the concentration of the leaching agent increased. There was no significant correlation between the concentration of NaOH solutions and the Al leaching efficiency in terms of the difference in the curves. In
Figure 5c, it is observed that each curve shows fluctuating variations with different trends from each other.
NaOH solutions of various concentrations represent the concentration of free OH
- ions present in the solution, and this concentration affects the leaching efficiency or dissolution rate and the adsorption and desorption of ions [
39]. However, due to the diversity of mineral species in WPS, the interaction between each mineral and the OH
- ion varies, which leads to considerable complexity in the variation in the concentration of each ion in the leachates. Therefore, the variations in ion leaching efficiency are not enough to understand the dissolution characteristics of WPS in alkaline solutions and need to be combined with the mineral composition of the solid residues after leaching.
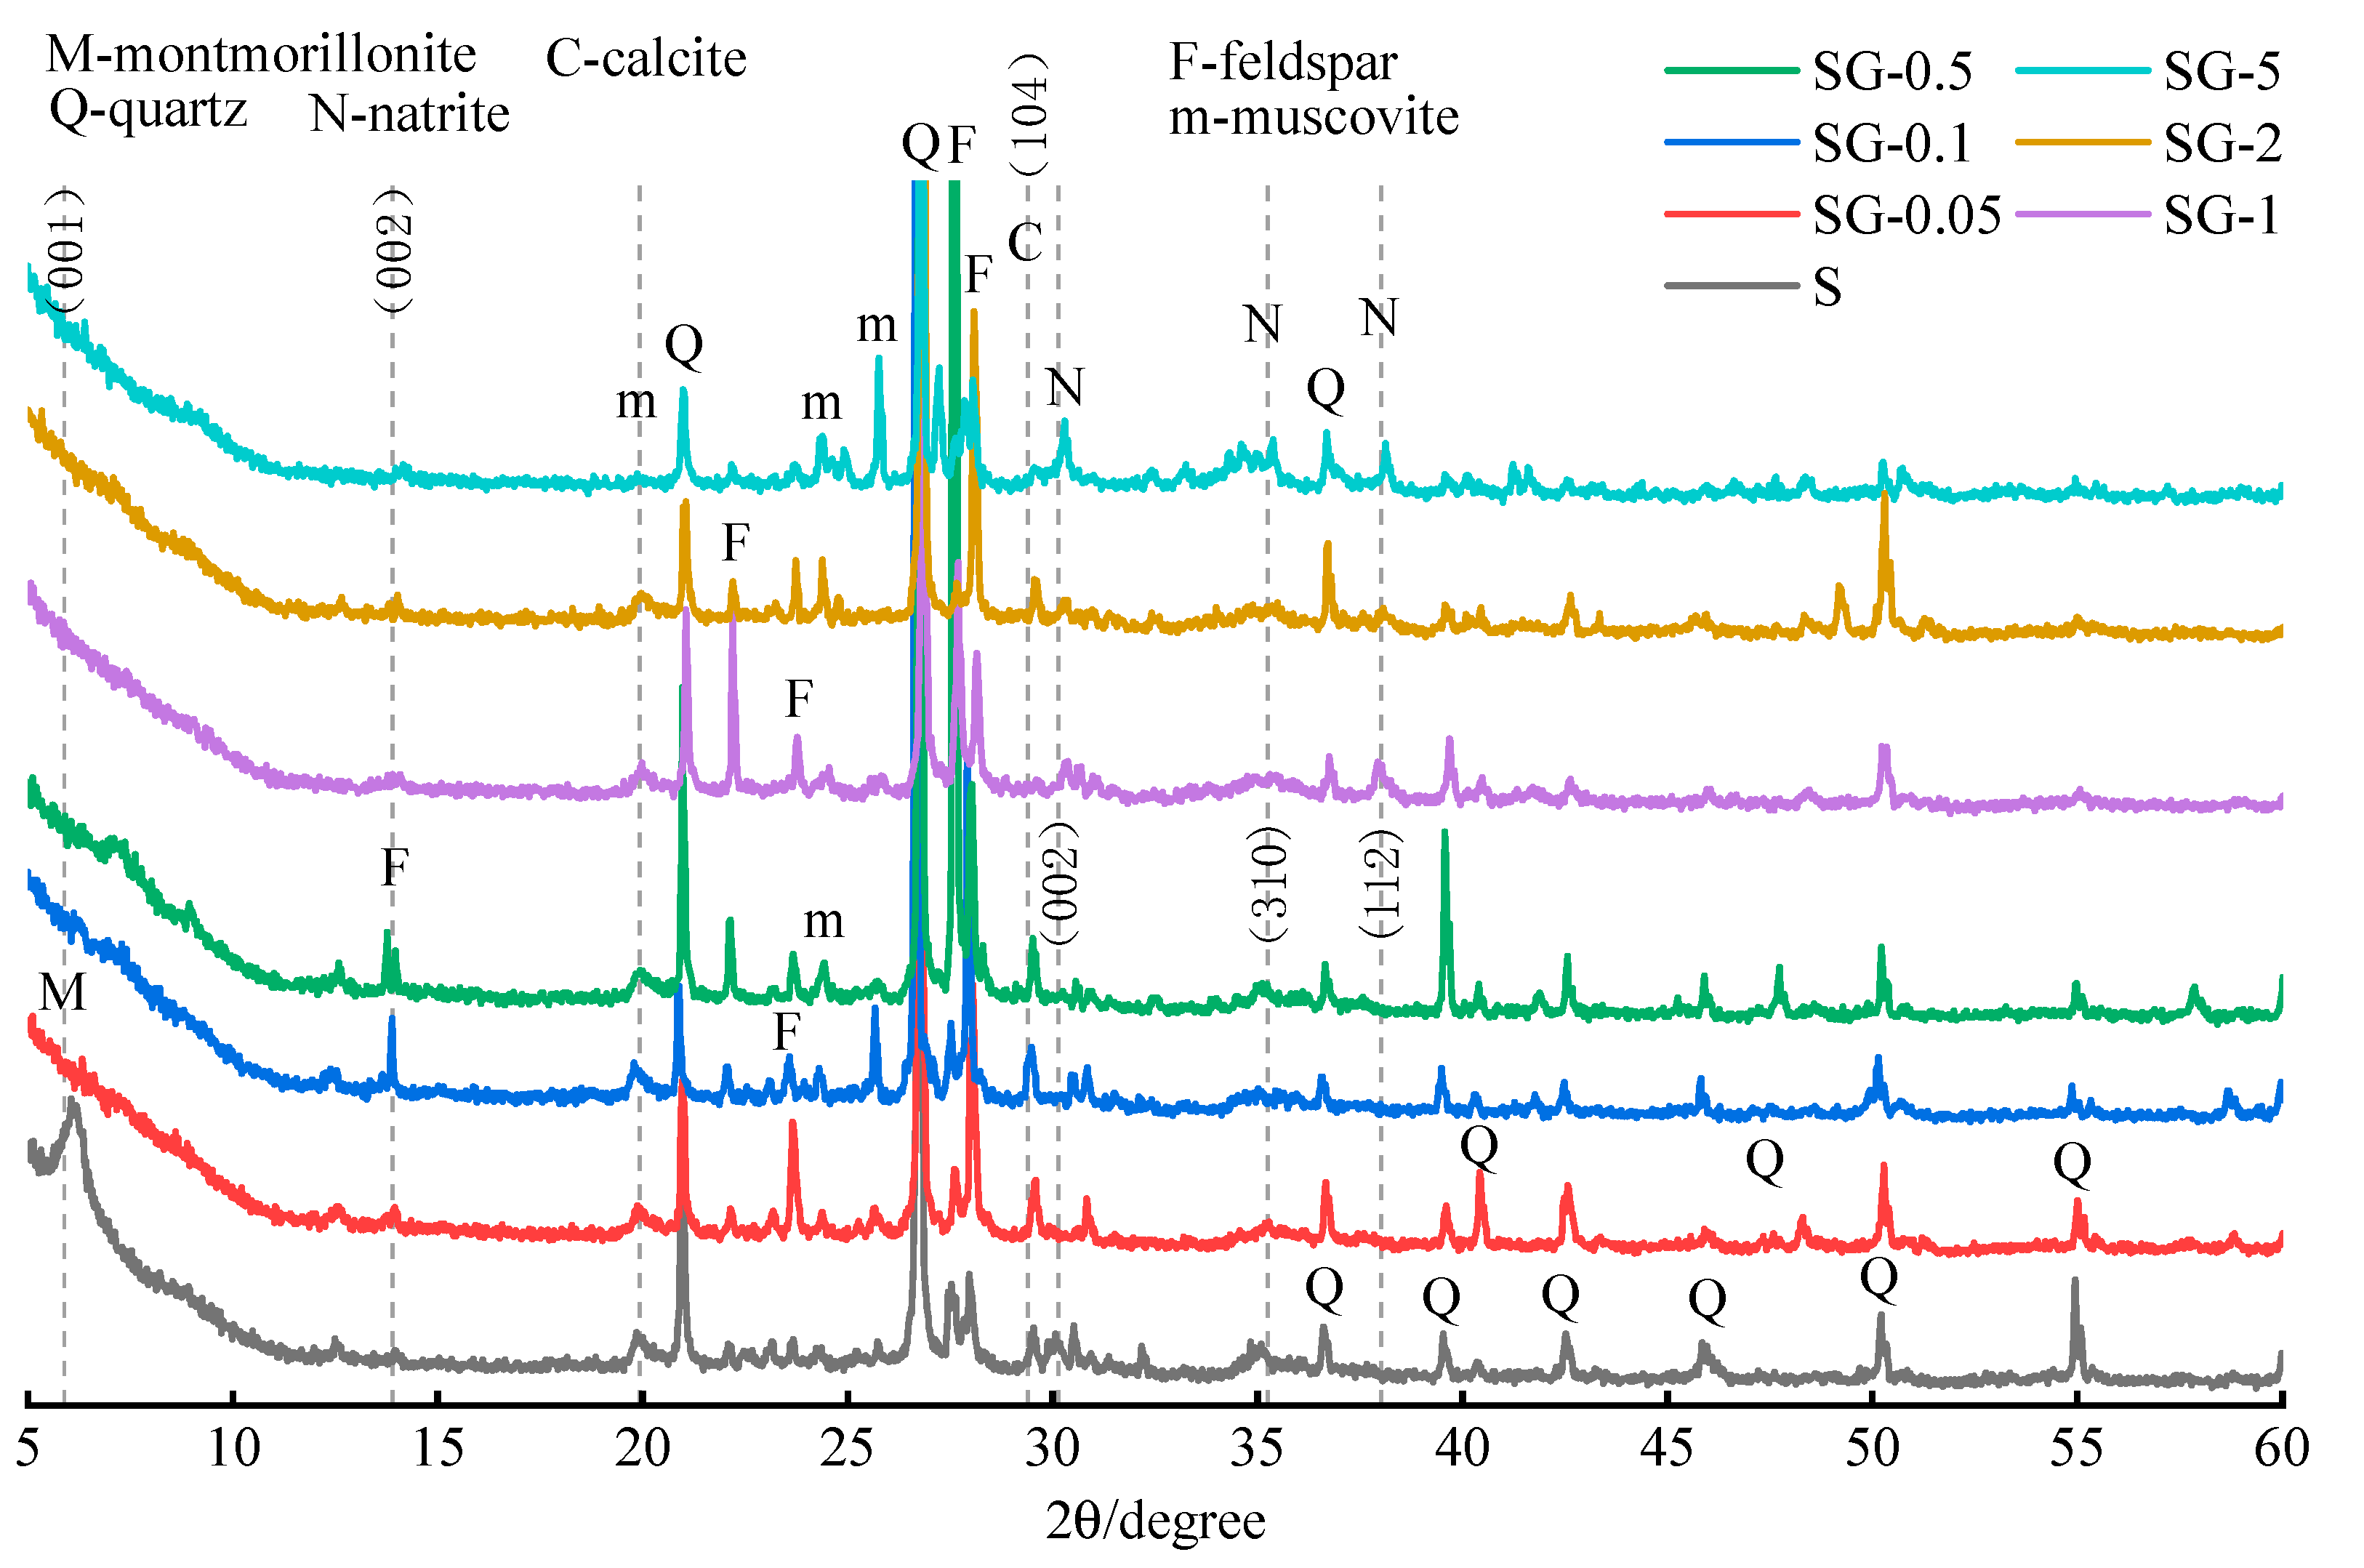
The XRD of the residues is shown in
Figure 6. The montmorillonite peaks of WPS all disappeared after leaching in alkaline solutions with different concentrations, accompanied by an increase in the intensity of diffraction peaks of albite (a feldspar) and muscovite, consistent with the literature [
35], which pointed out that albite and muscovite are helpful indicators of montmorillonite decomposition.
A new feldspar peak was observed at 13.9° 2
θ when the concentration of the leaching agent was 0.1 and 0.5 M, but this diffraction peak disappeared as the concentration of the leaching agent increased. This may be due to the fact that when the OH
- concentration is higher, it is converted to other substances or exists in an amorphous form. It was observed that the intensity of the diffraction peaks between 27.5° 2
θ and 28.5° 2
θ tended to increase and then decrease as the concentration of the leaching agent increased. This may be due to the fact that when the concentration of OH
- in the solution is low, the mineral surface is dissolved, and feldspar-like substances are formed. At this time, the concentration of OH
- in the solution is in equilibrium with these substances. However, when the concentration of OH
- in the solution is further increased, these substances react further with OH
-, possibly converting to amorphous substances or disintegrating at higher OH
- [
40]. These phenomena seem to explain that, as observed previously, the variation in the leaching efficiency of Si, Al, and Ca does not show a certain regularity with increasing the concentration of the leaching solution.
It can also be observed from
Figure 6 that SG-0.5 and SG-1 have excellent material crystallinity, while SG-5 is relatively weak. This phenomenon can explain the considerable increase in the leaching efficiency of Si corresponding to the 5.0 M NaOH solution in
Figure 5a. That is, the excessive OH
- ions in the solution interact with the silica–oxygen tetrahedra on the lattice of silicate minerals, Si-O breaks, and Si dissolves into the bulk of the solution in the form of ions or complexes [
33]. In addition, three characteristic peaks (30.1° 2
θ, 35.3° 2
θ, 38.0° 2
θ) of natrite (Na
2CO
3) were retrieved at SG-5, which may be the precipitation of excess NaOH during the drying process, which was subsequently carbonated to produce Na
2CO
3 [
41]. When the concentration of the leaching agent is low (≤0.5 M), calcite peaks can be observed. However, they disappear at higher concentrations.
In summary, WPS can dissolve more ions in higher concentrations of a NaOH solution. However, when the concentration of the NaOH solution is too high, it will have a negative effect, which will be manifested as a reduction in the crystallinity of the mineral, and more Si/Al/Ca ions will be leached out, while these residual ions are not involved in the generation of new substances and are consumed. In addition, excess alkali will be carbonized after drying to produce sodium carbonate crystals, which can lead to porosity on the surface of the modified specimens. When the concentration of the NaOH solution is 0.5 and 1 M, the amount of Al and Ca ions leached is well enhanced and can be consumed with sufficient participation in the formation of new substances, as well as having a better mineral crystallinity compared to other concentrations. Therefore, in the modification process of WPS, the concentration of alkaline solution should not be too high, around 1 M is sufficient.
3.4. Effect of Thermal Activation on the Dissolution of Si, Al, and Ca
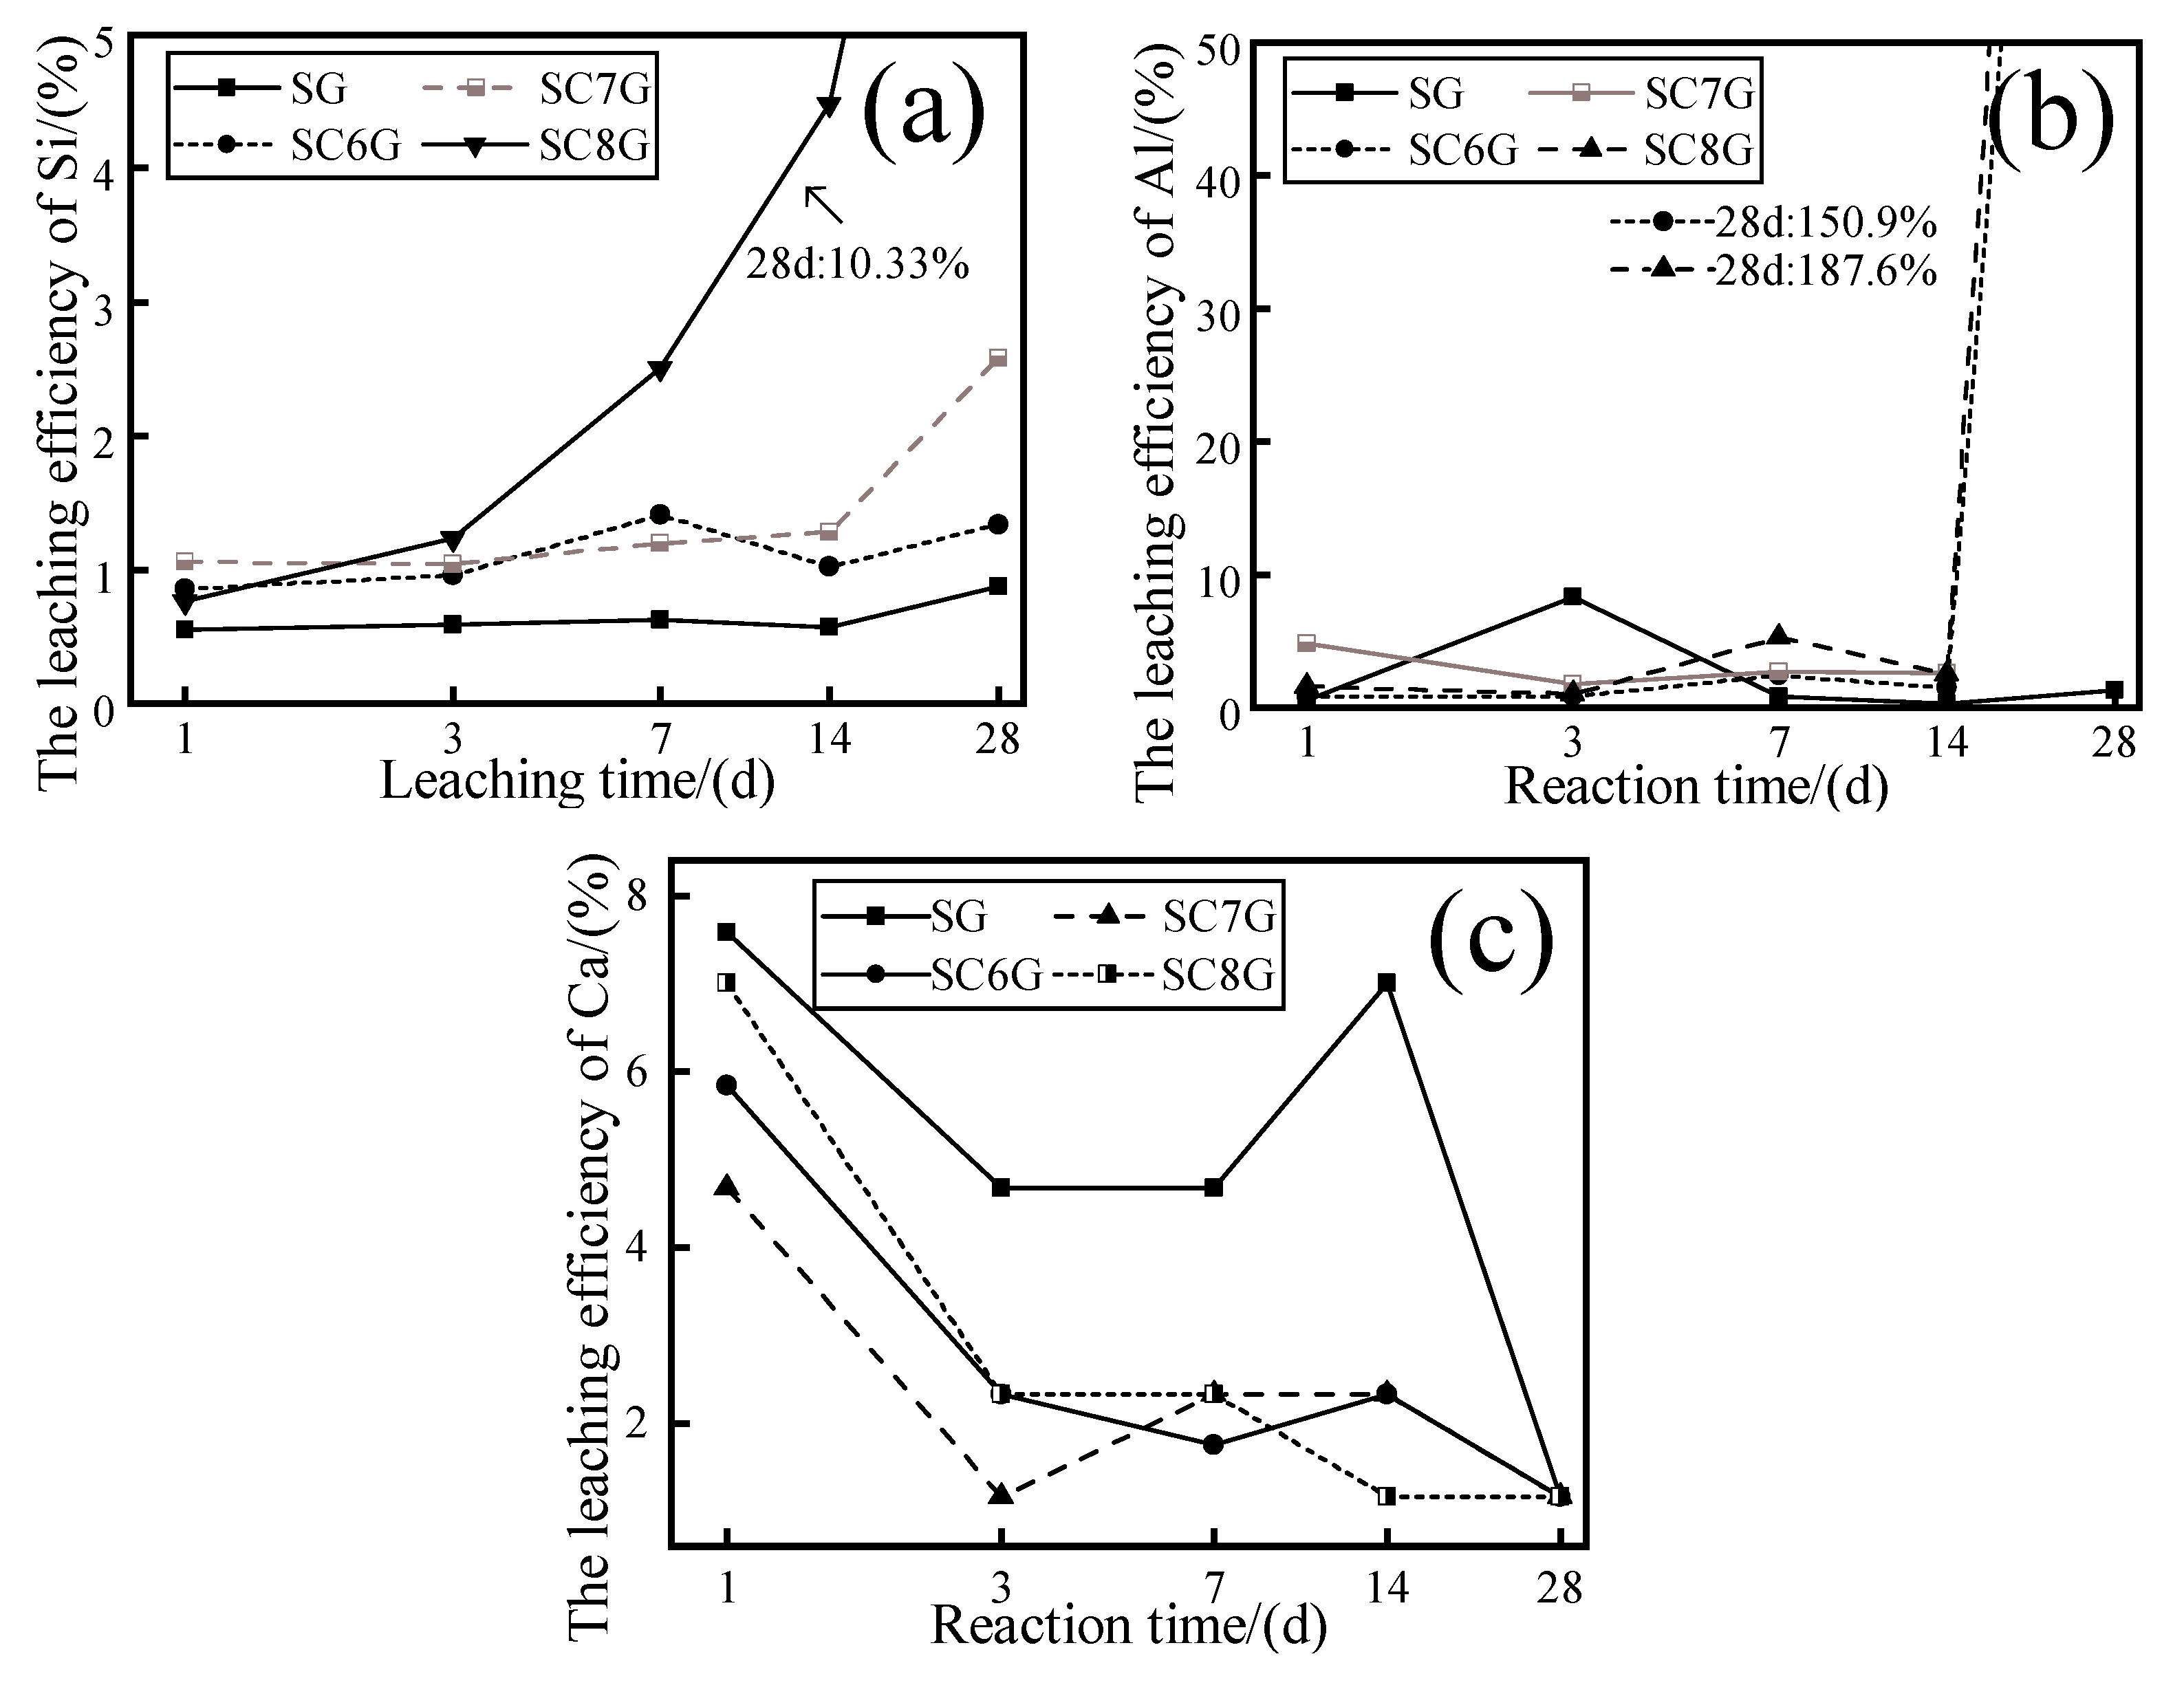
The calcined WPS samples at different temperatures were immersed in 1.0 M NaOH solutions curing at 20 °C, and the variation in ion leaching efficiency as a function of leaching time was observed, as shown in
Figure 7. It can be seen that the leaching efficiency of Si was significantly higher for the thermally activated WPS compared to the SG. The leaching efficiency of Si corresponding to SG, SC6G, SC7G, and SC8G was 0.89%, 1.34%, 2.58%, and 10.32% at 28 days, respectively. It is not difficult to derive from this that the leaching efficiency of Si increased with the increase in calcination temperature. It is worth noting that the variation in the corresponding curve of SG is flatter than the other curves, and the extreme difference in each observation point on the curve is 0.32%. The extreme differences of 0.56%, 1.54%, and 9.56% for each observation point on the corresponding curves of SC6G, SC7G, and SC8G, respectively, indicate that the volatility in the Si leaching efficiency variation becomes more significant with increasing calcination temperature. This may be due to the amorphization of minerals caused by thermal activation [
35], which converts minerals to the glassy form and subsequently allows Si to dissolve out of the minerals more easily.
In
Figure 7b, it is observed that each curve shows a fluctuating change before 14 days. At 28 days, the curves corresponding to SC6G and SC8G had a significant increase, and the Al leaching efficiencies of SC6G and SC8G were 150.9% and 187.6%, respectively. SC7G is not plotted due to missing data. It can be seen from
Figure 7c that the leaching efficiency of Ca was lower for the thermally activated WPS compared to the SG. In addition, the leaching efficiency of Ca for each curve was 1.67% when the leaching time was 28 days.
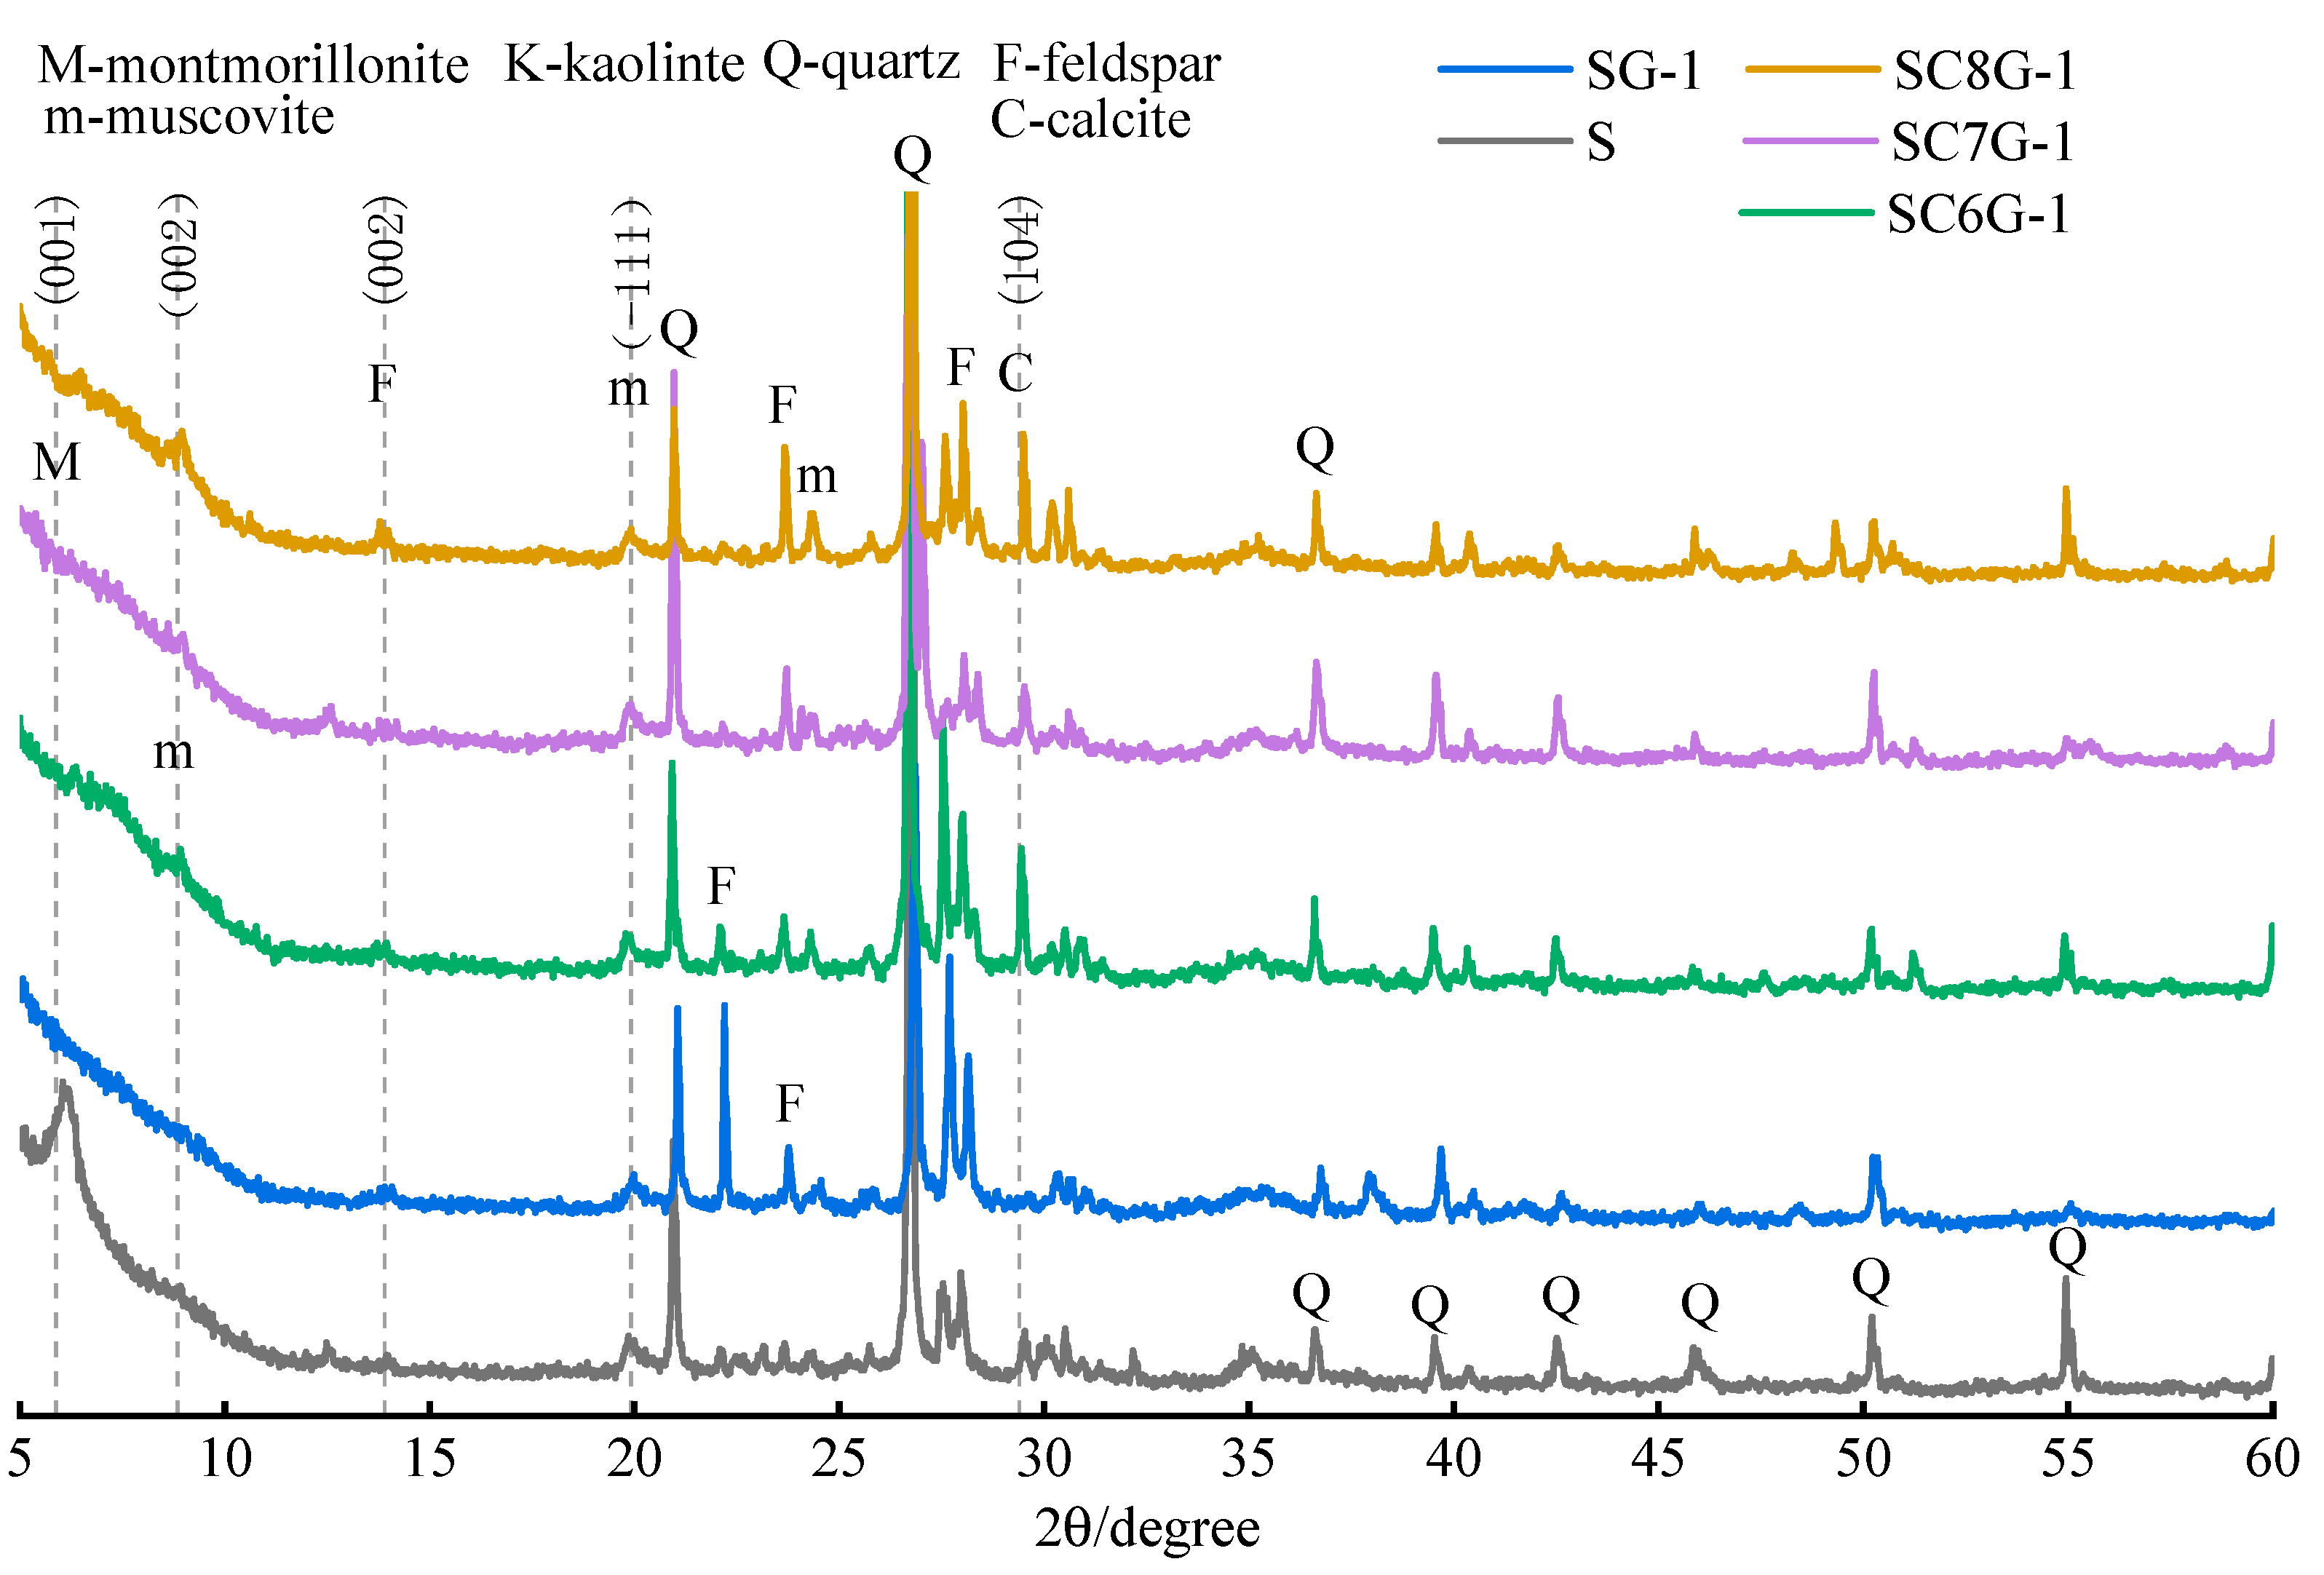
The XRD of the residues is shown in
Figure 8. It can be seen that the intensity of the diffraction peaks of the feldspar and muscovite species between 22.0° 2
θ and 26.4° 2
θ is affected by the calcination temperature. The intensity of the partial diffraction peaks (22.0° 2
θ) gradually decreased with increasing calcination temperature, and the intensity of the partial diffraction peaks (23.7° 2
θ) gradually increased with increasing calcination temperature. The intensity of the diffraction peaks for feldspar species between 27.5° 2
θ and 28.5° 2
θ is also affected by the calcination temperature. These phenomena can be explained as follows.
It has been concluded from
Figure 2 that thermal and mechanochemical activation caused the amorphization of the minerals in WPS into the glassy state, while increasing the surface chemical energy and improving the chemical reactivity [
34]. Subsequently, the glassy material can develop and reorganize well in alkaline solutions. Therefore, the difference between the spectral lines in
Figure 8 is mainly caused by the calcination temperature. In addition, the intensity of the diffraction peak of anorthite sodian (a feldspar) at 13.9° 2
θ varies with the change in calcination temperature, but there is no certain rule. It has been observed from
Figure 2 that the diffraction peak of calcite at 29.4° 2
θ almost disappears at high temperatures; however, it is detected in
Figure 8. This seems to explain that the leaching efficiency of Ca for 28 days corresponding to each curve in
Figure 7c was maintained at 1.67%.
The crystallinity of feldspar-like minerals and mica-like minerals in the thermally activated WPS was significantly increased after leaching. Before leaching, the crystallinity of the minerals gradually decreased with the increase in the temperature of thermal activation. However, after leaching, the difference in the crystallinity of the minerals of the samples subjected to different thermal activation temperatures was not significant. This may be due to the fact that the increase in the thermal activation temperature can convert more minerals in WPS to glassy or amorphous forms, which makes Si easier to leach in the alkaline solution and increases the ion concentration of Si in the leachate. However, the Si in the leachate is limited by the amount of Ca or other substances, resulting in a portion of Si not being able to further develop and reorganize to generate new substances. Therefore, the higher the thermally activated temperature of the WPS, the more mineral admixtures with available Ca should be added in the modification stage.
3.5. Effect of Curing Temperature on the Dissolution of Si, Al, and Ca
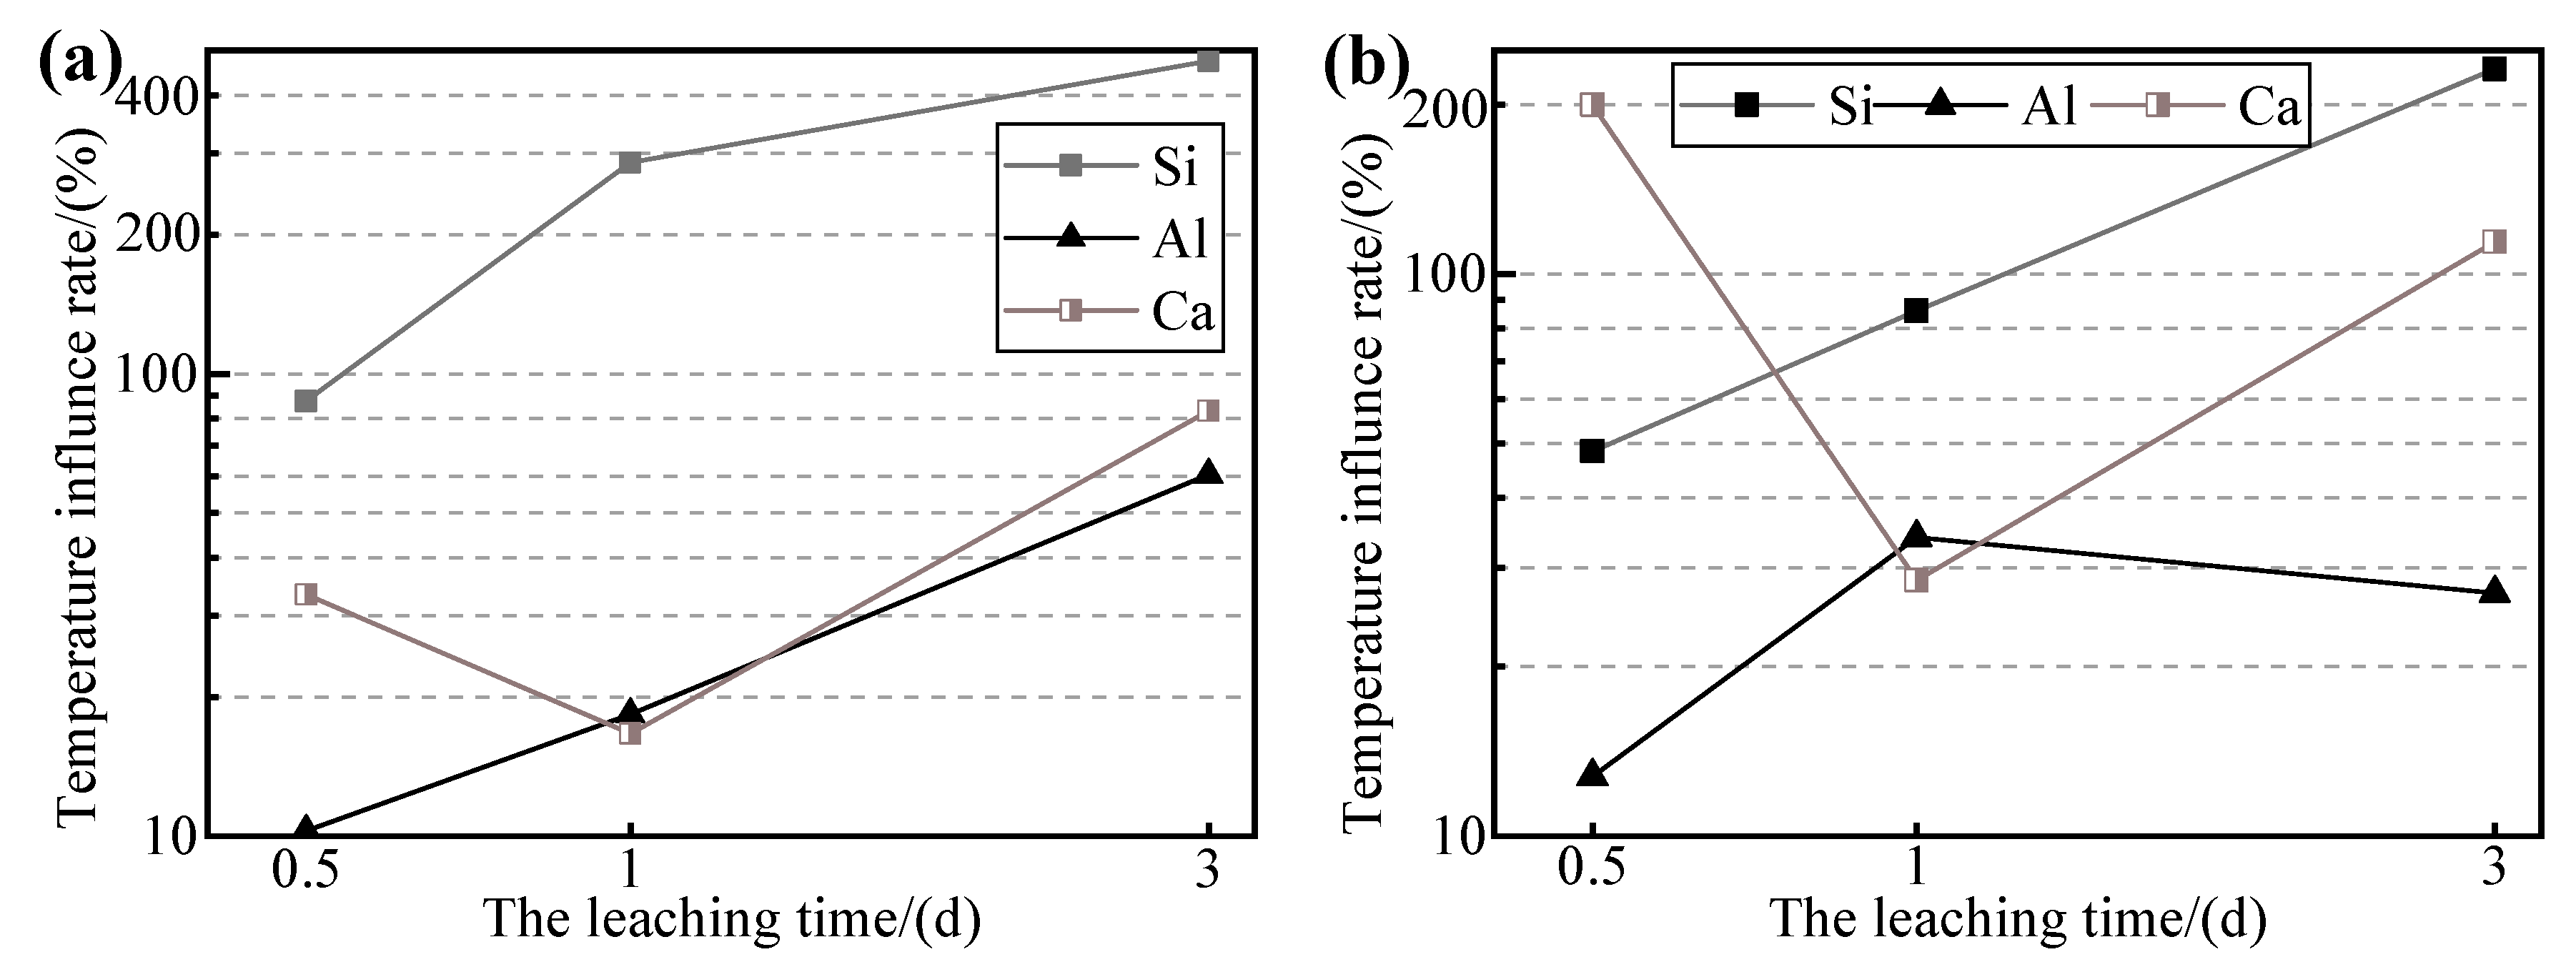
S and SC6G were immersed in 5.0 M NaOH solutions, and their leaching times were 28 days and 3 days at 20 °C and 80 °C, respectively. It is well known that when the temperature increases, the rate of the reaction between the solutes and the solution also increases [
37]. To better compare the leaching behavior of the samples at different curing temperatures, the temperature influence rate (
TIR) was used to characterize the effect of curing temperature on the leaching of each ion, which was calculated as follows:
where
is the concentration of each ion in the leachate at 80 °C when the leaching time is
n,
is the maximum value of the concentration of each ion in the leachate when the leaching time is 1, 3, 7, 14, and 28 days at 20 °C, and
is the minimum value of the concentration of each ion in the leachate when the leaching time is 1, 3, 7, 14, and 28 days at 20 °C.
As shown in
Figure 9a, the
TIR of Si reaches 87% and 286% at leaching times of 0.5 and 1 day, respectively. The
TIR of Si corresponding to S-5 was almost twice as high as that of SC6G-5 at a leaching time of 3 days, which is consistent with the conclusion obtained from
Figure 7 showing that relative to the untreated WPS, the Si leaching efficiency of the thermally activated WPS has been improved, which makes the increase in TIR of SC6G-5 less than that of S-5. It can also be deduced that the effect of curing temperature on the Si leaching efficiency is greater than that of thermal activation on the Si leaching efficiency. This may be due to the fact that thermal activation favors the activation of raw materials [
35]. At the same time, the increase in curing temperature not only accelerates the rate of mineral dissolution [
39] but also raises the threshold of ion leaching efficiency.
The TIR of Al is less than 100%, which indicates that the Al leaching efficiency within 3 days of leaching at 80 °C does not exceed the Al leaching efficiency within 28 days of leaching at 20 °C. This may be caused by insufficient leaching time.
Figure 5b shows that the Al leaching efficiency increased significantly between 14 and 28 days for each leaching agent concentration, whereas the leaching time at 80 °C was only 3 days, resulting in a lower amount of Al being leached into the leachate. In addition, the TIR of Al in
Figure 9a for 3 days is 61%, and that in
Figure 9b for 3 days is 34%, indicating that the elevated curing temperature would hasten the rate of Al leaching from the WPS.
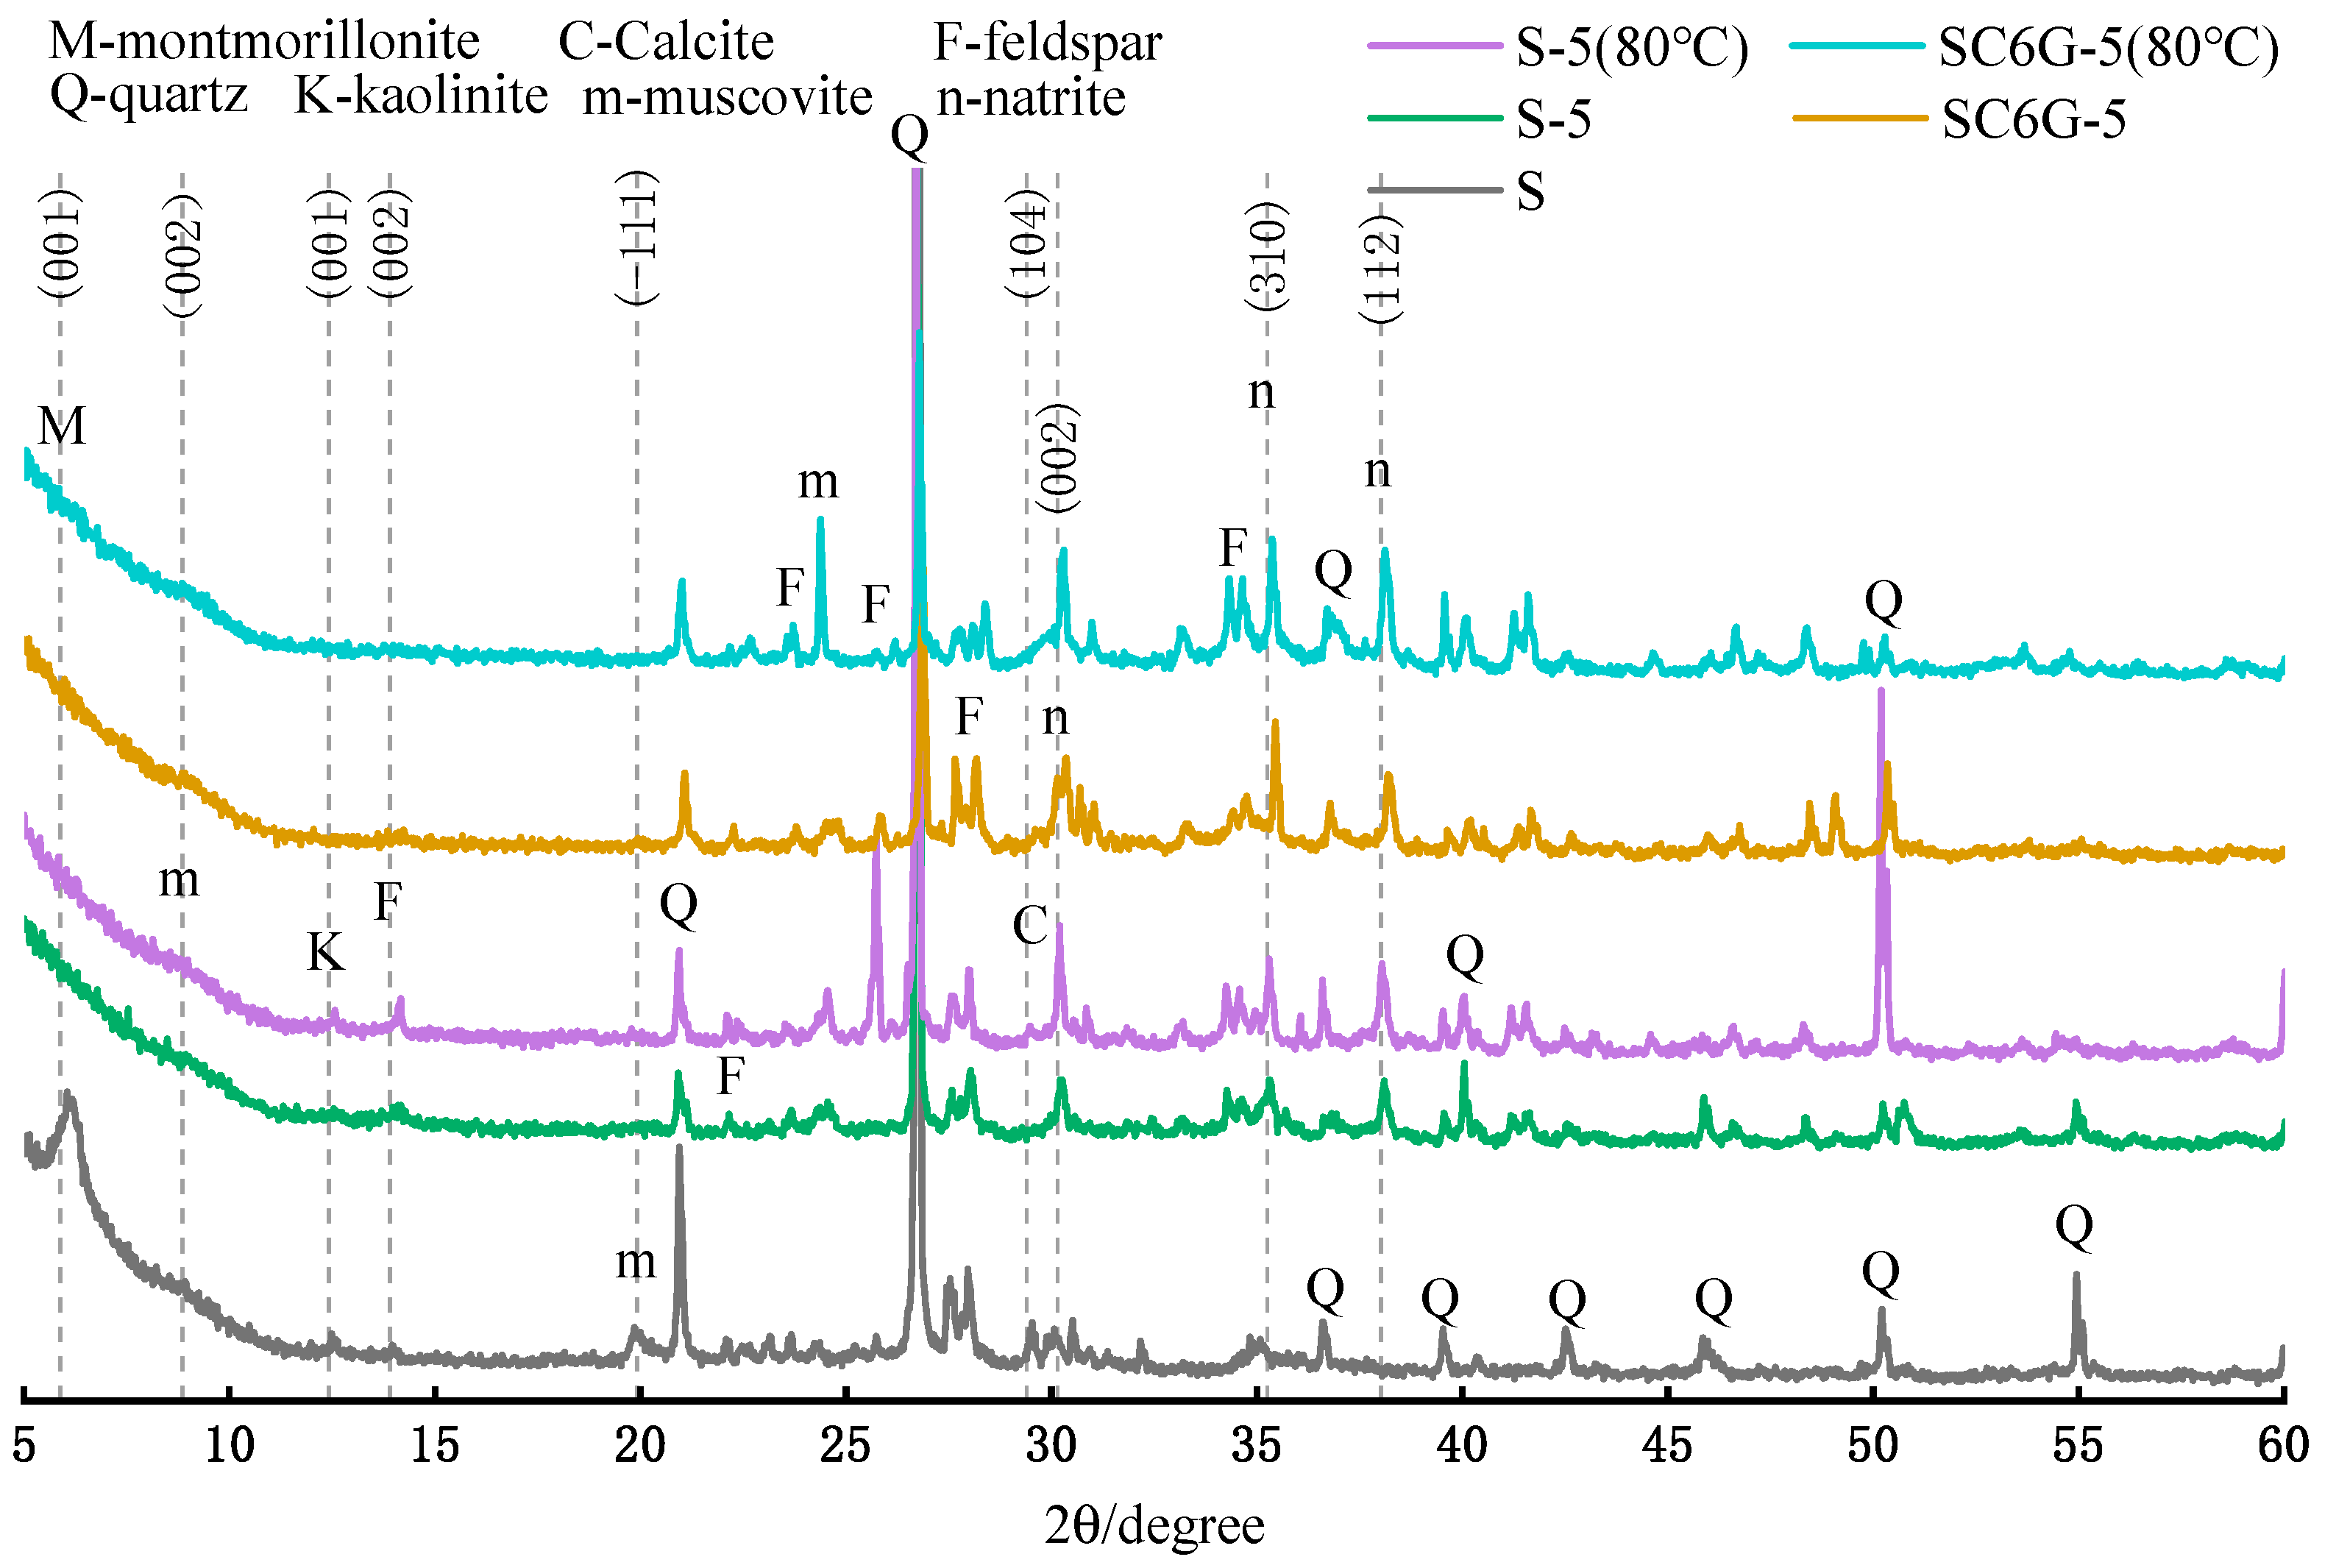
The XRD of the residues after leaching for 28 days at 20 °C and after leaching for 3 days at 80 °C are shown in
Figure 10. It was observed that muscovite peaks almost disappeared. This result was compared with muscovite peaks at a relatively low leaching agent concentration (0.5 M) in
Figure 8, from which it can be inferred that muscovite will be destroyed in a higher concentration of NaOH solutions. It can be seen from a comparison of S-5 and S-5 (80 °C) that the latter has a higher mineral crystallinity than the former, indicating that the increase in curing temperature may lead to a tendency for the products of the dissolution of minerals to crystallize.
In addition, the presence of obvious diffraction natrite peaks is observed, which confirms the conclusion obtained in
Figure 6. The calcite peaks disappeared when the concentration of the leaching agent was 5.0 M, which is also consistent with the conclusion obtained in
Figure 6.

 ,
, 

