Abstract
The contemporary retreat of glaciers results in the development of glacial forelands which constitute excellent areas for studies on the initial stages of weathering. This research concentrates on weathering rinds developed on glacially abraded Dachstein limestone surfaces (Eastern Alps) liberated from glacial ice since LIA (mid-19th century). We performed measurements of rock surface micro-roughness and strength (Schmidt hammer), spectral reflectance, and petrographic and microbiological analyses in SEM. There was a time-dependent increase in micro-roughness, decrease in rock strength and decrease in spectral reflectivity, but only within visual light. Rock surfaces on older sites reflected infrared radiation significantly better than younger ones. SEM analysis revealed that angular micro-structures inherited from glacial abrasion dominated in younger sites, eventually giving way to more rounded micro-structures. The structure of rock (micrite versus spar, phlogopite veinlets, etc.) plays a significant role. On older sites, microorganisms were detected within the studied weathering rinds, which probably results in better infrared reflectivity. We advocate the potential role of microorganisms (mainly heterotrophic) in the dissolution of limestone, and the role of cyanobacteria in the formation of the secondary porous limestone layer (extracellular biomineralization).
1. Introduction
Glaciers are the agents of rock surfaces erosion [1], and due to contemporary deglaciation [2] new abraded rocks every year and at the global scale become subject to subaerial weathering—a complex interplay of physical, chemical, and biological processes leading to rock decay [3]. In a variety of geological settings, there are growing glacial forelands that constitute excellent polygons to study the short-timescale weathering of limestone since the Little Ice Age (LIA) mid-19th century glacial maxima. Established chronosequences allow us to gain insight into the initial stages of weathering in cold environments, assuming that glacial erosion removes signs of the previous weathering.
The weathering alteration of limestone plays a role in shaping the content of atmospheric CO2, thus influencing the greenhouse effect [4]. Human-made accelerated weathering of limestone is used to capture CO2 from effluent gas streams [5], so it is important to acquire a better understanding of the dynamics of limestone decay under different environmental conditions and at different scales. It is frequently difficult to distinguish between different types of weathering, as they often coexist and interplay, leading to rock breakdown [3]. The role of bacteria and fungi should especially be emphasized [6]. When the bedrock is limited to limestone, dissolution (karstification) is the dominant chemical alteration of rock [7,8], but the role of previous glacial abrasion, frost shattering, and the influence of micro-organisms should not be disregarded. Moreover, disruptions to mineral lattices by subglacial processes can increase rock dissolution rates [9]. The effects of subglacial precipitation of dissolved minerals is frequently seen on lee sides of bedrock protrusions (within glacial forelands) as a fragmented thin coating, especially on carbonate rocks [10]. Such a coating obviously influences the subaerial weathering in the place of its occurrence.
Numerous studies have been published about karstic landforms [11] developed at a variety of scales, ranging from mogotes and caves [12,13] to solution flutes [14]. Other interesting examples of karstic landforms are cited by Ford and Williams [8]. Numerous studies on the micro-scale erosion of limestone rock surfaces have been conducted with the use of micro-erosion meters [15,16,17,18,19,20], as summarized by Stephenson and Finlayson [21] and Moses et al. [22]. Limestone dissolution nanomorphologies have been experimentally produced and studied by Viles and Moses [23]. However, very few studies have focused on the shape and internal composition of the micro-structures developed in the limestone weathering rind in a contemporary glacial foreland [24].
The aim of this article is to show the effects of a short time scale (up to the 172 years which have passed since the LIA glacial maximum extent) of limestone weathering in a cold, proglacial environment in the Dachstein Massif (Alps)—the Hallstätter Glacier foreland. A pilot study on micro-weathering in this foreland has already been performed by Dąbski et al. [24], and this article presents further developments as more methods were employed. Micro-roughness measurements were supplemented with Schmidt hammer tests, reflectance spectrometry measurements and photogrammetric surveys. Additionally, many more rock samples were analyzed and the samples were collected with more care. Laboratory analyses of rock samples were not limited to petrographic analysis under scanning electron microscopy [24], but also included analysis under transmitted light and under the Keyence Digital Microscope. However, most importantly we performed a set of microbiological analyses. We studied the interplay between a record of the glacial abrasion of limestone, and subaerial weathering, petrographic conditions, spectral characteristics, and the development of microbiota.
2. Materials and Methods
2.1. Study Site
The study site was located in the recently exposed proglacial area of the Hallstätter Glacier, which is the largest glacier on the Dachstein Massif located in the Eastern Alps in Austria. The Hallstätter Glacier resides within a wide cirque facing northeast at altitudes between 2270 and 2950 m a.s.l. Climate-induced glacier retreat exposed an area of 2.6 km2 between the last maximum glacier extent in the mid-19th century (LIA) and 2022 (Figure 1). The proglacial zone is almost completely free of vegetation and soils and contains only limited debris accumulations. Towards the lower limits, small ponds and one small lake (Eissee) have formed after the glacier retreat. The central part of the forefield is a shallow trough valley that contained the central glacier tongue during most of the 20th century and the LIA period.
The Dachstein plateau is the typical locality of Dachstein limestone, deposited in the Upper Triassic [25]. It is a fine-grained limestone with frequent occurrences of micro-fossils such as conodonts and foraminifera [26]. Numerous sedimentary discontinuities and fossil micro-karstic features within the rocks hint at frequently interrupted sedimentation patterns [26,27].
The Dachstein massif is conditioned by a cool, temperate, and moist climate with high precipitation rates due to its location at the northern margin of the Alps and the associated orogenic effects on westerly storm fronts. The 0 °C isotherm of the mean annual air temperature is at about 2000 m a.s.l., and permafrost conditions are considered probable in the steep headwalls surrounding the glacier [28]. Prevailing northerly winds exceed 6 ms−1 on average [29], which causes a high frequency of bedrock wetting and drying.


Figure 1.
Location of the test sites in the Hallstätter Glacier foreland; pink dashed lines mark consecutive positions of the glacial snout (background DEM data source: basemap.at); DEM of the glacial trough under study based on own UAV survey; glacial retreat and LIA limit after Bruhm et al. [30], Fischer et al. [31,32], and Buckel and Otto [33].
2.2. Methods
Methods employed included in-field measurements of micro-roughness, rock strength (Schmidt hammer rebound values), and spectral reflectance of glacially abraded rock surfaces along a transect from the glacial snout to the outermost moraines from the Little Ice Age (Figure 2), covering circa 172 years of subaerial weathering in the proglacial alpine environment. Sampled rocks were subject to detailed microscopic analysis of petrography, micro-structures, and microbiota developed in weathering rinds. GNSS RTK (Global Navigation Satellite Systems with Real Time Kinematic positioning) and UAV (Unmanned Aerial Vehicle) surveys of the studied area were performed to obtain Digital Elevation Models (DEMs) and allow for detailed comparative studies in the future.
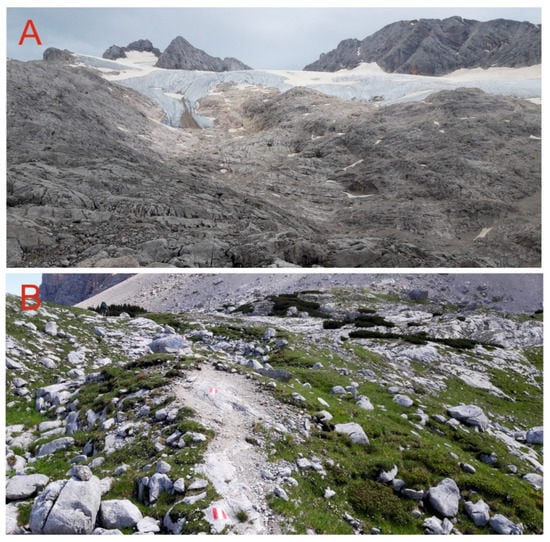
Figure 2.
(A)—Upper part of the Hallstätter Glacier foreland, (B)—Little Ice Age moraine.
2.2.1. Location and Dating of Test Sites
In the foreland of the Hallstätter Glacier, five test sites were designed along the transects from the youngest surface near the glacier snouts to the LIA moraines (Figure 1, Table 1). Site 1 was very close to the glacier (undergoes weathering for 1–2 years), site 2 was in the zone c. 10 years old, site 3 was in the zone c. 50–51 years old, site 4 was in the zone c. 105–106 years old, and the last one (site 5) was on the LIA moraines, where the duration of weathering is c. 167–172 years (Figure 1). The sites were located on bedrock or boulders embedded in the moraines with distinct traces of glacial abrasion, allowing us to infer that older weathering rind (developed before glacial accumulation) has been eroded. The sites were selected based on their age, homogenous petrography, accessibility, and suitability for micro-roughness measurements. Similar sites (but not the same) were selected in the pilot study by Dąbski et al. [24].

Table 1.
Position of centrally located rock surfaces within each test site.
The dating of the test sites is only an approximation based on information obtained from Fischer et al. [31,32] and Buckel and Otto [33]. They provided detailed extents of Austrian glaciers during various stages, compiled in aerial-photo-based glacier inventories—GI 1 (1969), GI 2 (1998), GI 3 (2006), and GI 4 (2015)—and complemented with the LIA inventory based on digital elevation models (DEM) and the mappings of Groß [34]. Moreover, Bruhm et al. [30] elaborated the 3D visualization of the Hallstätter Glacier retreat since the LIA. Glacier extent data combined with DEM data allowed us to properly locate the test sites (Figure 1), date them, and obtain information on the duration of subaerial weathering.
Within each test site, we selected ten specific rock surfaces (c. 100 cm2 each), with clear signs of glacial abrasion, for the measurements of micro-roughness, Schmidt hammer rebound (rock strength), and spectral reflectance. Later, 3 rock samples were taken from each test site (15 in total) for further laboratory analysis.
2.2.2. Micro-Roughness, Rock Strength, and Spectral Measurements
Rock surface micro-roughness was measured with the use of the Handysurf+ electronic profilometer (ACCRETECH (Europe) GmbH, Munich, Germany), similar to that used by Dąbski [35,36], Dąbski and Tittenbrun [37] and Dąbski et al. [24], in the three smoothest lichen-free places on each rock surface under study (giving a total of 30 readings per test site), along profiles parallel to striation in order to omit visible erosional features on the run of the profilometer. Patches of calcitic coating were avoided (they stood out from the gray limestone bedrock due to their white or pink color). The calibration of the profilometer was checked at every test site using a reference roughness specimen. We used the Rz roughness parameter for further analysis (it shows average micro-scale denivelations). Rock strength was assessed using a Schmidt hammer (SH), N type, manual, and tests were performed on the same surfaces previously checked for micro-roughness. SH blows were at least 1 cm apart from each hit point and at least 6 cm away from any visible irregularity on the rock surface. All studied rock surfaces were horizontal or nearly horizontal. Altogether, there were 100 readings of rebound values (R-values) per test site. The normality of distributions of micro-roughness and SH rebound readings were checked with the use of the Shapiro–Wilk test. A significant part of the populations did not have normal distributions, and therefore the non-parametric Kruskal–Wallis and multiple comparison post hoc tests were employed in order to check the differences between the test sites. Statistical calculations were performed with the use of Statistica 13.3 software, assuming a significance level of α = 0.05.
Spectral reflectance measurements were performed with the use of a field spectroradiometer ASD FieldSpec 4 (Malvern Panalytical Ltd., Malvern, UK) (350–2500 nm) fitted with a contact probe (ASD Plant Probe). The measurements were preceded by spectrometer optimization and calibration. The measurements were made directly on rock surfaces using a fiber cable (25° field of view (FOV)) placed in the ASD Plant Probe, which takes measurements from one cm of FOV circle area of rock surfaces in the ASD Plant Probe. Spectral measurements were collected at the same 10 rock surfaces selected for micro-roughness measurements and SH tests. Each spectral measurement was composed of an average of 25 instantaneous measurements. The obtained spectral characteristics were exported to ASCII files for further statistical analysis. Statistically significant differences were analyzed between the spectral characteristics from the studied sites at the level of significance α = 0.05 (Shapiro–Wilk test, non-parametric Kruskal–Wallis and multiple comparisons post hoc tests). The calculation of 1st and 2nd order derivates of spectral reflectance curves was also used in order to better illustrate differences between the test sites. A scaling effect was used to enhance spectral features at the scale of the specified sampling interval and remove noise or features smaller than the sampling interval.
2.2.3. UAV and GNSS RTK Surveys
The precise location of test sites was determined in the field with the use of GNSS RTK (Topcon HiPer SR, Tokio, Japan), which allowed for the spatial accuracy of measurements up to 2 cm. UAV surveys were performed with the use of a rotary-winged drone (DJI Matrice 300 RTK, Shenzhen DJI Sciences and Technologies Ltd., Shenzen, China). The drone flights were carried out in two rounds with (1) a passive RGB camera (Zenmuse P1) and (2) an active LiDAR sensor (Zenmuse L1). Flights were performed at the same height above the terrain using a pre-programmed “terrain follow” algorithm, which was especially useful in this challenging terrain. They provided RGB images and LiDAR scanning, with very high ground resolution (below 0.05 m). The data were processed in DJI Terra and Bentley ContextCapture 20.1 software. Finally, an orthophoto map and DEMs were produced to be used for detailed spatial analysis and serve as base data for additional survey comparative studies in the future to obtain better insights into the weathering processes of the Dachstein limestone.
2.2.4. Analyses of Rock Samples
The rock samples (obtained with a hammer and a chisel) were submerged in the Canada balsam resin in order to protect weathering rinds before microscope preparation. The cuts were made perpendicular to the substrate, allowing observation of both the surface of the sample and its interior. The samples were observed under Nikon Eclipse E600 POL and Nikon Eclipse LV100 POL petrographic microscopes under transmitted light, as well as under a field-emission scanning electron microscope (FE-SEM) SIGMA VP (Carl Zeiss Microscopy GmbH, Oberkochen, Germany). The FE-SEM was equipped with two energy-dispersive spectroscopes (EDS; Quantax XFlash 6|10, Bruker Nano GmbH, Berlin, Germany), used for qualitative mineral composition analysis performed under 20 keV acceleration voltage. Thin sections were coated with a carbon layer before analysis. Circa 6 cm long rock surface fragments (composed of 3 thin sections) were subject to microscopic inspection at each test site. Selected samples from all test sites were also checked under a Keyence Digital Microscope (KDM) VHX-7000 (Keyence Corporation, Osaka, Japan) in order to obtain extra information on the micro-relief of weathering rinds, color images, and 3D models of surfaces. KDM allowed performing additional measurements of micro-roughness based on the DFD (depth from defocus) technique, where the image is constructed by calculating the height based on minor surface texture differences. Surveys according to the ISO 25178 standard for both linear and surface roughness allowed an optical measurement without interfering with surfaces.
Energy-dispersive X-ray Spectroscopy (EDS) analyses under SEM allowed us to determine the chemical composition of the weathering layer and substratum and to determine specific features of the weathering rinds, such as the thickness of granular and fissured layers, the diameter of grains and their rounding, the diameter of tunnels, the width of fissures, and the thickness of the sponge layer (see Section 3). The analysis of rounding was based on 500 randomly selected grains (100 from rock samples representing each test site) and classified into four groups: very angular, angular, subangular/subrounded, and rounded. The analysis of micro-tunnels’ diameter and circular voids was based on 457 measurements of these micro-structures developed on rock samples from sites 3 to 5 (see Section 3).
Unweathered parts of the collected rock samples were cut off and ground into powder (>5 μm diameter) in the planetary ball mill (Retsch PM 100). The spectral reflection of the powder was measured by a spectroradiometer (same method as Section 3.2). Thanks to these measurements, Dachstein limestone reflectance spectra were obtained for comparison with the results from the field measurements and spectral libraries resources.
Microbiology Analyses
The detection of microorganisms on the surface of the weathering rind was made using a scanning electron microscope (SEM) (Leo 1430VP, LEO Electron Microscopy Inc., Thornwood, NY, USA) after the samples had been fixed in formaldehyde vapor (4 weeks) and gold coated.
Heterotrophic bacteria and fungi were isolated on Lysogeny Broth [38] and Czapek-Dox solid media [39], respectively. Samples of the weathering rind (diameter 2–5 mm) were placed on the surface of a solid medium. The cultures were incubated at 20 °C for 1–2 weeks. Colonies of isolated bacteria and fungi were measured by a spectroradiometer to obtain reflectance spectra (see Section 2.2.2).
3. Results
3.1. Rock Surface Micro-Roughness and Strength
The micro-roughness of the rock surfaces gradually increased together with the weathering time and the distance from the glacier: mean Rz increased from 21.08 µm to 74.97 µm (Figure 3A). However, the difference between sites 1 and 2 and between sites 3 and 4 was not statistically significant, which can probably result from a limited number of measurements (30 per test site). On the oldest site, the rock surface was too rough to allow for the usage of the Handysurf, and therefore the micro-roughness was determined in the laboratory (using rock samples) using KDM. Schmidt hammer rebound values (R-values) also showed that the expected trend of rock strength decreased along the studied profile: mean R-values decreased from 64.03 to 51.52. (Figure 3B), and the only difference, which was not statistically significant, was between sites 1 and 2.
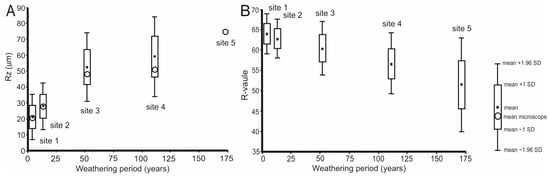
Figure 3.
Rock surface micro-roughness (A) and strength (B) changes in the Hallstätter Glacier foreland. Box-and-whisker diagrams shows results obtained from the Handysurf and circles show additional results from the KDM (A).
3.2. Spectral Reflectance
Measurements of spectral reflectance also revealed the general pattern of time-dependent changes (Figure 4). We observed a decrease in the reflectance in visible radiation (380–750 nm), most significant between sites 1 and 3. However, there was an unexpected increase in the reflectance of the near-infrared and short-wavelength infrared radiation (750–2500 nm) on older sites (4 and 5).
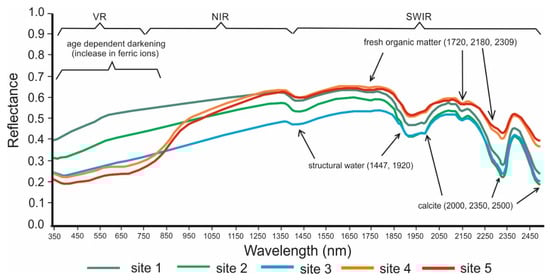
Figure 4.
Reflectance spectra of the Dachstein limestone at the Hallstätter Glacier foreland. VR—visible radiation, NIR—near-infrared radiation, SWIR—short-wavelength infrared radiation.
Statistical analysis revealed that significant differences occurred in the following electromagnetic spectrum ranges: 453–542 nm, 595–775 nm, 857–906 nm, and 2483–2500 nm (Figure 5). The ranges given were the common ranges for statistically significant differences in reflectance values between all sites tested. Figure 5 also includes ranges that were statistically significant between the reflectance values of the pairs of study areas, i.e., between sites 1 and 2, 1 and 3, 1 and 4, 1 and 5, 2 and 3, 2 and 4, 3 and 4, 3 and 5, and 4 and 5 (these are shown as lines at the top of the graph, Figure 5).
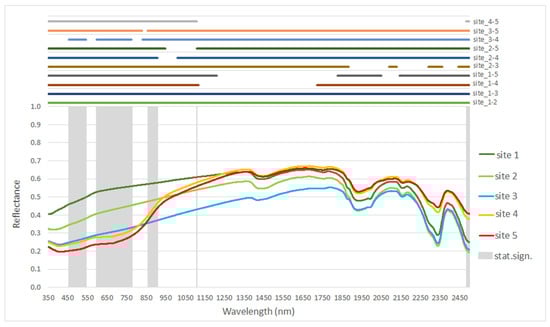
Figure 5.
Statistically significant differences between reflectance spectra of the test sites (significance level α = 0.05). The differences between particular pairs of curves are shown by overlapping horizontal lines, and differences between all sites are shown by gray columns.
The analysis of first and second order derivates of spectral reflectance showed that the signal-to-noise ratio decreased as higher orders of derivatives were used. This is important when scattering increases with wavelength; for example, biologically active macromolecules increase the slope of the absorbance baseline [40].
Several interesting spectral features were visible in the derived spectra that were invisible in the original spectra. For example, for the 1-degree derivative there were subtle changes in curvature between 700 nm and 1000 nm that were consistent across the set of spectra for sites 4 and 5 (Figure 6). Additionally, for wavelengths indicative for calcite content—2000 nm and 2350 nm—shifts of the first derivative and second derivative were visible, where a shift indicating changes in curvature from convex up to convex down and back to concave up could be seen, indicating subtle, consistent changes in reflectivity (Figure 6 and Figure 7). This relationship was also evident in both derivatives for the range imaging fresh organic matter, i.e., 2180 nm and 2309 nm (Figure 6 and Figure 7). Although the original spectra differed in magnitude between 400 nm and 1300 nm (Figure 4, Figure 6 and Figure 7), they had almost identical second-order derivative values in the same wavelength range. The differential range of the curve from site 4 and site 5 in the case of the 1-degree derivative in the spectrum 750–950 nm may illustrate the occurrence of cyanobacteria (dry condition), as confirmed by other authors [41].
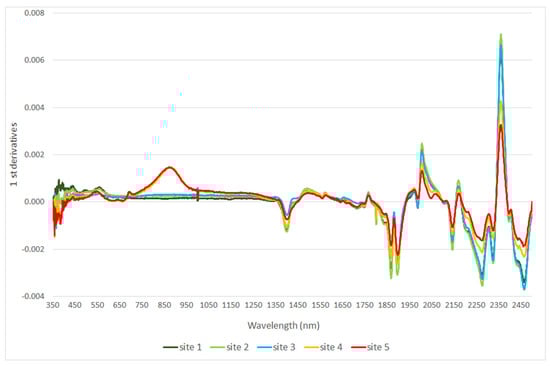
Figure 6.
First derivative of spectral characteristics for the Hallstätter Glacier foreland test sites.
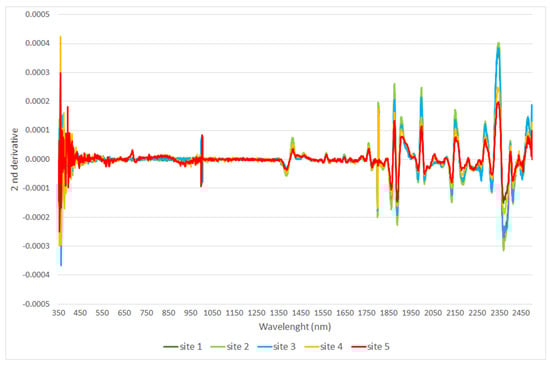
Figure 7.
Second derivative of spectral characteristics for the Hallstätter Glacier foreland test sites.
3.3. Petrography and Micro-Structures
The petrographic analysis under the optical microscope revealed that the rocks could be classified as micritic limestone, in most cases, but sometimes also as calcareous grainstone, packstone, wackestone, or dolomitic mudstone. The rocks were strongly altered by secondary processes related to hydrothermal activity, resulting in numerous spar veins (Figure 8), occasionally phlogopite or biotite, tectonism (micro-faults and secondary calcite infills), and diagenesis (stylolites formed due to pressure dissolution or micrite recrystallization). In places, numerous foraminifera, cephalopods, fragmented gastropods, with characteristic wavy shell ornamentations, or bivalves shells could be seen (Figure 8A), as well as ellipsoidal or spherulitic peloids or single ooids. Sometimes, dolomite was found inside micro-fossils as euhedral rhomb-shaped crystals. There were differences in the micro-structures seen inside the weathering rinds depending on the type of matrix (micrite or spar); however, they were not clearly visible under the optical microscope (Figure 8B,C).
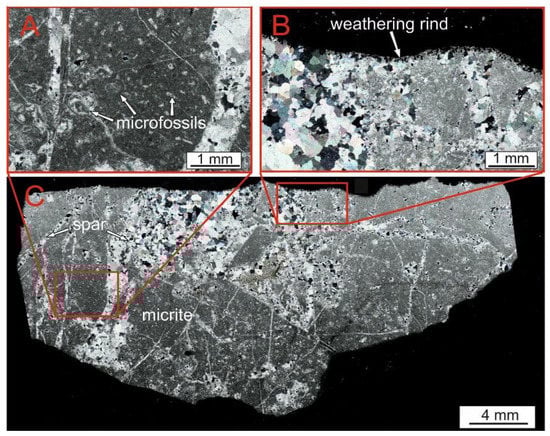
Figure 8.
A sample of limestone taken from site 5 (upper surface was glacially abraded in LIA) visible under the optical microscope; (A)—foraminifera in micrite matrix, (B)—weathering rind on micrite and spar, (C)—general view of the samples with numerous micro-fossils, spar veins and micro-cracks.
3.3.1. General Weathering Rind Characteristics
Analyses under the FE-SEM revealed that young rock surfaces, subject to the weathering for up to 10 years (sites 1–2), possessed numerous fissures, mostly running parallel or semi-parallel to the rock surface, angular blocks, and oblique burrs developed on cleavage (visible on spar) and in a strongly disintegrated granular layer composed of grains between 2 µm and 12 µm (the smallest being found closer to the rock surface), especially where the rock surface was developed on micrite. We use the term “grains” because these small fragments occur separately on the FE-SEM images, and also to maintain the same terminology as the previous study [24]. However, we are aware that the images are only 2D, and we cannot exclude the possibility that some of the “grains” are actually cross-sections of miniature bridges or small protruding fragments attached to the main mass of rock. The parallel fissures led to spalling of the outermost fragments. The thickness of the granular layer increased from site 1 (max. 100 µm) to site 2 (up to 200 µm). This was accompanied by the thickening of fissures from <3 µm almost up to 25 µm (Table 2).
Table 2.
Characteristics of weathering rinds (sites 1–5).
In older sites (3–5), which have been subject to weathering for at least 50 years, the share of rounded and sub-angular/sub-rounded grains increased (Figure 9) and rounded caverns, circular voids, and tunnels were developed (not present in younger sites), which eventually evolved into a sponge structure both on micrite and spar. Samples from site 5 revealed that the sponge structures were best developed in concave fragments of rock surfaces (sometimes developed as micro-valleys), while protruding fragments were mostly fissured and underwent spalling (Table 2, Figure 10). We also observed a decrease in the diameter of the circular voids and tunnels from site 3 (mean 23 µm) to site 5 (14 µm) (Table 3).
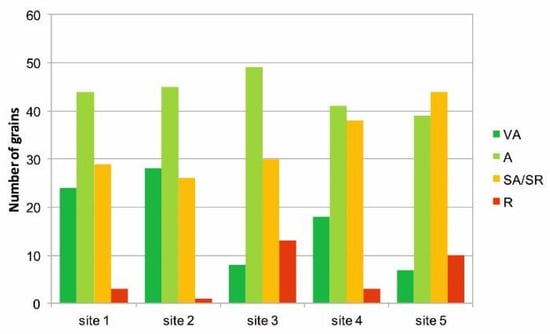
Figure 9.
Rounding of grains within the granular layer of weathering rinds (VA—very angular, A—angular, SA/SR—sub-angular/sub-rounded, R—rounded).
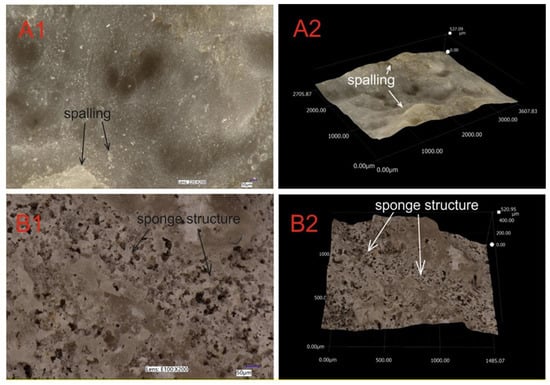
Figure 10.
Images of the rock surface from site 1 (A1,A2) and site 5 (B1,B2) obtained under the Keyence Digital Microscope. Note that sponge structures develop mostly in concave parts of the rock surface (B2).
Table 3.
Diameters of the tunnel and circular void micro-structures (sites 3–5).
3.3.2. Micro-Structures at Sites 1 and 2
The surface of the rock at site 1 was characterized by intergranular disintegration (granular layer), which penetrates the limestone down to 100 μm and is best developed in micrite. Grains varied from 2 µm to 12 µm (smaller grains tended to be closer to the rock surface), very angular to sub-rounded, with angular being the most abundant (Figure 9). Internal voids were very angular (Figure 11). Cracks running mostly parallel or slightly sloping to the rock surface were present at depths down to 40–100 μm (rarely 400 μm), and in places they resulted in surface spalling. There was a clear change in surface preservation where spar veins met the surface (Figure 11A). In such cases, micro-cracks were rather oblique to the rock surface, wider, and the superficial granular layer was not developed. Sometimes, the smallest fissures ran along the cleavage planes of a spar. In some places, at a depth of c. 100–120 μm, stylolite-like structures were present. There were also common oblique burrs developed on rock surfaces composed of spar (Figure 11B). Some far-reaching alterations of the rock surface, e.g., micro-cracks down to depths of up to 1500 μm, were observed.
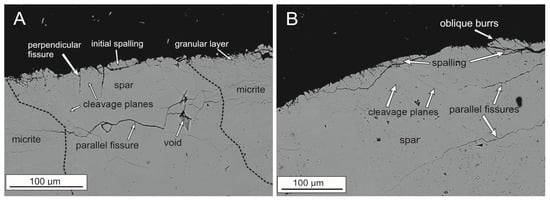
Figure 11.
Weathering rind at site 1 (subject to weathering for 1–2 years). (A)—spar vein cutting micritic limestone; (B)—weathering rind developed on the spar (images from FE-SEM).
At site 2, the granular layer was developed in places down to 200 μm, but was usually much shallower. The best-developed fissures occurred in spar veins (Figure 12A) and ran at different angles to the rock surface, underlining the border between micrite and spar. Some fissures were associated with stylolites filled with phlogopite veinlets (Figure 12B). In the latter case, the fissures penetrated the rock down to c. 1000 μm. Similarly, as in site 1, sharp and oblique burrs marked the rock surface where spar outcrops occurred. The rounding of the grains in the granular layer exhibited a similar pattern to samples from site 1 (Figure 9).
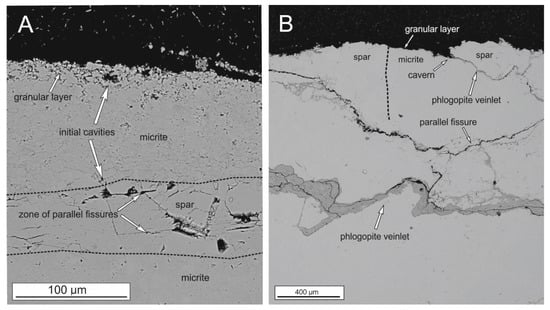
Figure 12.
Weathering rind at site 2 (subject to weathering for 10 years); (A)—spar vein cutting micritic limestone; (B)—deep fissures developed along phlogopite veinlet (images from FE-SEM).
3.3.3. Micro-Structures at Sites 3–5
Older weathering rinds (subject to weathering for 50–172 years) exhibited similar micro-structures as the young ones, with granular layers on micritic surfaces, oblique burrs developed in spar, and parallel fissures leading to spalling. However, new micro-structures could be observed: caverns, compound caverns, rounded voids and tunnels, and sponge structures (Figure 13, Figure 14 and Figure 15), which are best developed in concavities, e.g., in the floor of compound caverns (Figure 13 and Figure 14A). These micro-structures were relatively rounded and had smooth inner surfaces, whether they were formed in micrite or spar. Caverns developed in micrite usually had a granular layer on their walls. The grain diameter varied, but smaller grains tended to be closer to the rock surface. The rounding of the grains within the granular layer was slightly better in comparison with the younger weathering rinds, and the grains were frequently larger (the diameter varied from 2 µm to 25 µm), but the thickness of the granular layer was smaller (up to 50 µm). Signs of spalling were usually observed on the protruding convex parts (Figure 13A and Figure 14B). In places, oblique or perpendicular fractures were filled with phlogopite or accompanied by voids. Cleavage planes of spar crystals sometimes determined the places where elongated voids developed (Figure 15B).
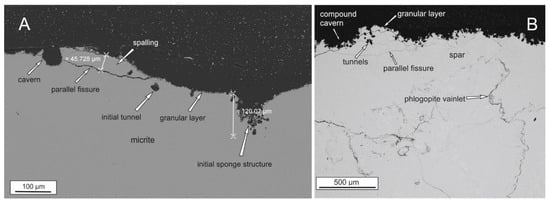
Figure 13.
Weathering rind at site 3 (subject to the weathering for 50–51 years); (A)—single cavern and initial sponge structure developed in micrite; (B)—deep fissures filled with phlogopite, a compound cavern with initial sponge structure in spar (images from FE-SEM).
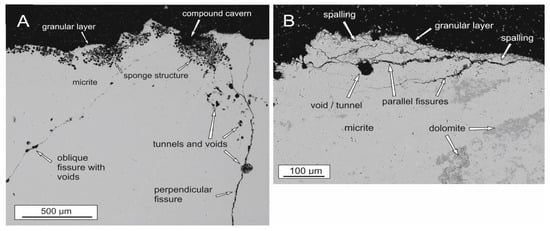
Figure 14.
Weathering rind at site 4 (subject to the weathering for 105–106 years); (A)—well-developed sponge structure in concavities and deep tunnels and voids along oblique and perpendicular fissures; (B)—well-developed fissuring on a protruding rock fragment leading to spalling (images from FE-SEM).
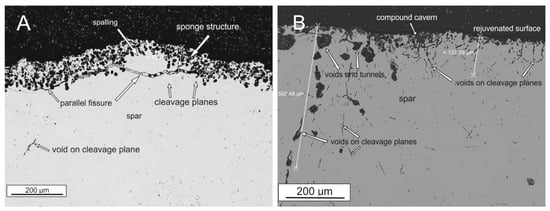
Figure 15.
Weathering rind at site 5 (subject to the weathering for 167–172 years); (A)—very well-developed sponge structure in spar (occupying all rock surface) with parallel fissure undercutting the protruding fragment; (B)—rejuvenated surface (due to spalling) with very large voids and tunnels (images from FE-SEM).
3.4. Preliminary Detection of Microorganisms on the Weathering Rind
Our pilot study of the geomicrobiology of the weathering rinds confirmed the presence of microorganisms in all studied sites (Figure 16). Figure 16A shows biofilm covering the limestone. Oval and rod-shaped cells covered with a layer of extracellular polymeric substances can be seen. In addition, actinobacteria-like cells (Figure 16B) and fungi (Figure 16C) were detected on the surface of the studied samples. Moreover, oval structures with a diameter of about 5–7 µm located in cavities were detected at site 5, and are likely to be epilithic cyanobacterial cells embedded with secondary calcite (Figure 16D).
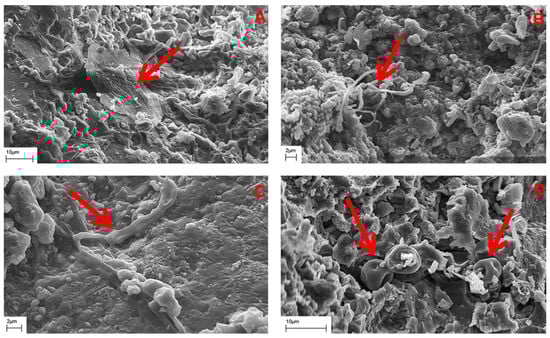
Figure 16.
SEM images showing: (A)—microbial biofilm (test site 1), (B)—actinobacteria-like cells (test site 4), (C)—fungi (test site 4), and (D)—epilithic cyanobacterial cells embedded with secondary calcite (test site 5) observed on the surface of the weathering rinds from all test sites (Hallstätter Glacier foreland); arrows indicate microbial cells.
The preliminary isolation of heterotrophic microorganisms yielded two isolates from site 3: (i) brown pigment-producing bacteria (Figure 17A), which were tentatively identified as actinobacteria based on the colony and cell morphology, as well as (ii) fungi (Figure 17B) producing red and black pigment (see Section 4.3).
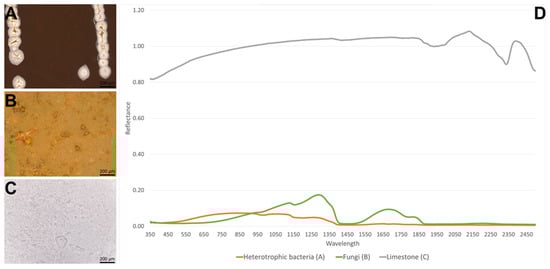
Figure 17.
Keyence Digital Microscope images of colonies of isolated bacteria (A), fungi (B), and Dachstein limestone powder (C), which were subjected to reflectance analysis (D).
4. Discussion
4.1. Previous Weathering Studies in Proglacial Environments
The previous study of limestone weathering in the Hallstätter Glacier foreland [24] found that the micro-roughness increased from the snout of the glacier towards LIA moraine (with the greatest increase occurring within the first 50 years after deglaciation), and there was no protective shield from weathering coating. Our study confirms this finding and provides further information about the associated rock strength decrease. However, Dąbski et al. [24] found a significant reduction in the weathering rind thickness on the oldest test site (from LIA), and attributed it to erosion. In this study, we analyzed more samples and found that rocks of the oldest site still possess thick weathering rinds with very well-developed sponge structures (but signs of spalling are clearly visible). The discrepancy between the previous finding and this study can be explained, besides the increased number of samples, by the fact that the former preparation of rock fragments for microscopic analyses was incorrect. Previously, the rock surfaces were not protected by balsam resin during cutting, which probably resulted in the destruction of the fragile weathering rind on the oldest sample. Moreover, the use of reflectance spectroscopy and microbiological analyses have shed a new light of the weathering processes—biologically enhanced calcite dissolution and possible biomineralization (see Section 5).
Rock surface deterioration after deglaciation reflected in the increase in rock surface roughness (or micro-roughness in a short timescale) is a generally known phenomenon. It was extensively explored for the first time by McCarroll [42] and McCarroll and Nesje [43], who studied gneiss rocks in the Storbreen foreland, Norway with the use of a hand gauge profilometer. A significant increase in roughness was shown between landforms developed in the LIA and those from the onset of the Holocene; therefore, over thousands of years. Numerous works have focused on weathering rind thickness measurements in reference to the relative age of glacial landforms, but they also pertain to long time scales [44,45,46]. Similarly, the SH R-values have frequently been used in assessing rock strength in relation to the age of glacial landforms developed in the LIA and those from the Pleistocene [43,46,47,48,49]. However, only a few studies have focused on contemporary glacial forelands (developed since the LIA glacial maxima); these include the works of Evans et al. [50] and Etienne [51] in Iceland (on basalts) and the study of Matthews and Owen [52] in the Scandinavian Mountains (gneiss rocks). There have also been recent studies performed on basalts in Iceland by Dąbski [35,36], Dąbski and Tittenbrun [37], and on Dachstein limestone by Dąbski et al. [24]. The study reported in this paper provides further support that micro-roughness correlates well with SH R-values on fine-grained rocks (limestones) and can be used as a relative age proxy of young glacial landforms developed since the LIA maxima.
Rock surface roughness (or micro-roughness), micro-forms, weathering rind, and coating developed on glacial landforms have been studied for decades, but the research has mostly concentrated on a long chronosequence of glacial deposits, spanning the weathering time since Pleistocene glaciations [44,53,54,55,56,57,58]. Much shorter time periods, covering post-LIA glacier forelands, have been the subject of more recent studies, which also considered the role of micro-organisms [51,59,60], but they require continuations on different types of rocks and under different atmospheric conditions.
4.2. Interpretation of Micro-Structures
Micro-structures observed in the studied chronosequence allow for the following interpretation. The short-time-dependent increase in the micro-relief amplitude and the development of sponge structure in the weathering rind results in the decrease of rock strength (SH R-values) because the pressure exerted by the blow of the hammer becomes absorbed during by destruction (compression) of the micro-structures. The analysis of SH readings and microscopic images shows that there is no case hardening, as the weathering of studied limestone does not lead to the precipitation of amorphous glazing, which is reported in certain studies and which would act as a protective shell leading to case-hardening [6,60,61,62].
The increase in micro-roughness of the glacially abraded limestone surfaces in the direction from the glacial snout (test site 1) to the LIA moraine (site 5) is caused by the time-dependent increase in weathering micro-relief amplitude, and especially the development of caverns and compound caverns on older test sites. We interpreted these micro-structures as products of limestone dissolution (micro-scale karstification) enhanced by bioweathering, as well as biomineralization (see following section). Glacial abrasion, followed by the post-glacial relaxation of pressure and frost shattering, is probably responsible for the development of oblique burrs, parallel fissuring, and spalling [63].
The gradual decrease in the thickness of the granular layer from site 2 to site 5 and the fact that, on older sites (4 and 5), parallel fissures are frequently limited to protruding fragments of rock surfaces, can be explained by progressive spalling of the weathering rind. The removal of detached fragments probably results from ice/snow melting, rainwater erosion, and aeolian deflation.
4.3. Interpretation of Spectral Reflectance
The increase in infra-red reflectance on sites 4 and 5 can probably be explained by the increasing content of organic and in-organic admixtures, which have been introduced into micro-concavities and the thick sponge structures. They act as traps collecting biotic and abiotic matter introduced by surface runoff due to snow melt and rain. Most likely, the infill of the micro-structures contains cyanobacteria, which are known to cause significant shifts in IF reflectance [41].
Sponge structures, best observed in concave parts of the rock surface, allow the inference that wetting plays a very important role in their development. There is probably a feedback loop, which includes the following stages. Initial concavities or micro-valleys (possibly inherited from glacial erosion) form on recently deglaciated rock surfaces that hold more moisture. This leads to the deepening of the concavities by calcite dissolution and the development of initial caverns and tunnels. These micro-structures act like traps for sediments (clay fraction) delivered by snow, and glacial ice melt or rainwater. This, in turn, creates a good habitat for fungi, algae, and bacteria (including cyanobacteria). Lowered acidity fosters the further dissolution of limestone and the development of sponge structures. This process is offset by spalling and the destruction of the weakest parts of the weathering rind by frost shattering or/and hail and further removal by aeolian wind deflation of the action of water erosion.
To confirm the above assumptions, spectral reflectance was measured for: (i) colonies of heterotrophic bacteria (Figure 17A), (ii) fungi (Figure 17B) isolated from site 3A, and (iii) Dachstein limestone powder (Figure 17C). Characteristic changes in reflectance at 2000, 2350, and 2500 nm were observed (Figure 17D). Measurements of colonies of heterographic bacteria showed the greatest values in 450–1400 nm, with fungi in 750–1400 nm and 1500–1870 nm ranges. The unexpected increase in reflectance on sites 4 and 5 (see Figure 4) can be therefore interpreted as a result of microorganisms and a higher content of secondary calcite produced by biomineralization (in 2000, 2350, 2500 nm).
4.4. The Role of Microorganisms in Micro-Structure Development and Infill
Despite the fact that we cannot rule out the possibility of rock sample contamination, the following interpretation is possible. Concave micro-structures and sponge structures developed within the weathering rinds of the Dachstein limestone (Figure 18) constitute excellent habitats for microorganisms, which leads to the formation of a weathering feedback loop by enhancing the further dissolution of calcite. However, certain fragments of sponge structure can result from biologically induced extracellular mineralization [64,65,66].
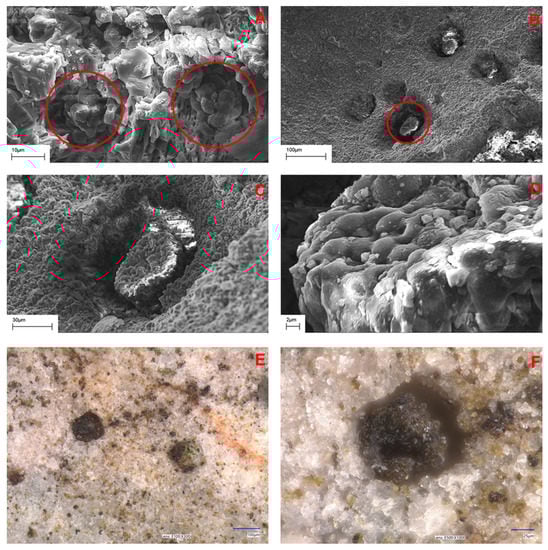
Figure 18.
The influence of microorganisms on the weathering of limestone detected by SEM—clusters of yeast-like cells, site 2 (A), microcolonies of yeast-like cells, site 4 (B), microcolonies embedded in deep caverns, site 4 (C,D), samples from site 5 observed under Keyence Digital Microscope (E,F).
The microorganisms responsible for the bioweathering of limestone are primarily those that acidify the environment, i.e., heterotrophs that produce carboxylic acids or carbonic acid, but also chemolithotrophs that produce sulfuric acids, for example, or microorganisms representing fermentative metabolism. We can observe the impact of microorganisms on the weathering of limestone by analyzing Figure 18. Clusters of several yeast-like cells can be observed (Figure 18A), which then enlarge to form microcolonies (Figure 18B) embedded in deep caverns about 20–30 µm in diameter (Figure 18C–F). It can be assumed that these cavities are formed by the action of metabolites, mainly acids.
On the other hand, observations of site 5 revealed the presence of epilithic cyanobacteria, which are surrounded by calcite, probably resulting from extracellular mineralization induced by their metabolic activity (Figure 16D and Figure 19A). In addition, numerous empty holes, remnants of dead cells, are visible (Figure 19A). The involvement of cyanobacteria in the formation of extracellular calcite is well-known and described in the literature [64,67]. Based on these observations, the potential contribution of epilithic cyanobacteria to the formation of the surface porous layer seen in Figure 19A,B can be indicated. At the same time, based on our ongoing research, we cannot exclude the presence of endolithic cyanobacteria, which can cause the secondary filling of microspaces with calcite, and thus cause a reduction in porosity. The detection of endoliths will be the subject of further research.
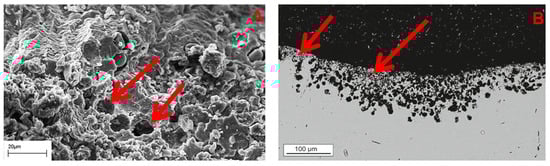
Figure 19.
SEM images showing a porous layer of limestone (arrows), probably formed with the involvement of cyanobacteria—top view (A) and cross-section (B) (Hallstätter Glacier foreland; site 5).
An unexpected increase in near-infrared wavelength radiation on older sites, 4 and 5 (Figure 4), can be explained by the content of fungi and bacteria (Figure 19) in the sponge structure. The reflectance features characteristic for calcite content (2000 nm, 2350 nm, 2500 nm) successfully decrease from site 1 to site 3, which proves that the surface is becoming older (Figure 4). A sudden increase in these ranges at sites 4 and 5 also indicates younger calcite from biologically induced mineralization. The sponge structure created because of calcite dissolution is inhabited by cyanobacteria, which build a fresh sponge in it.
5. Conclusions
In this study, we were able to document the time-dependent increase in the degree of the weathering of the Dachstein limestone since the LIA maximum of the Hallstätter Glacier. This was manifested by an increase in micro-roughness, decreasing rock strength, a modification of the radiation reflectance spectrum and an increase in the development of microorganisms. This was accompanied by a decrease in visible radiation reflectance, which is best observed within the younger part of the glacier foreland (subject to weathering for 50–51 years). Older sites exhibit a rapid increase in infrared radiation, which can probably be explained by the development of the sponge structure of the weathering rind and accompanying microorganism communities and biomineralization.
The difference between rock surfaces developed on spar and micrite determines the character of micro-structures in the weathering rinds. Spar allows for the development of characteristic sharp oblique burrs associated with crystal cleavage and well-visible fissuring along the run of spar veins. On the other hand, micrite leads to the development of the subtle granular layer. Parallel fissures leading to spalling, cavers, tunnels, and sponge structures develop on both spar and micrite. Micro-structures resulting from dissolution (rounded caverns, tunnels, voids, sponge structures) are developed only on older surfaces that have undergone weathering for at least 50 years. Sites deglaciated between 105 and 172 years ago have the best-developed sponge structures, which significantly decrease limestone surface hardness.
Based on preliminary microscopic observations, two potential mechanisms of microbial impact on the structure of the limestones in the proglacial environment were proposed. Firstly, the potential role of microorganisms, mainly heterotrophic, including fungi, in the dissolution of limestone was pointed out, and secondly, the role of cyanobacteria in the formation of the secondary porous limestone layer (extracellular biomineralization) was discussed. Both groups of microorganisms, despite their different mechanisms of action, can significantly affect the porosity of the surface layer of rock. Physical, chemical, and biochemical processes act together, resulting in quick “rock decay” which is manifested by changes in the texture of the Dachstein limestone weathering rinds and rock surface softening, with no geochemical coating or casehardening. Our microbiological study is preliminary, and requires further research on the role of microorganisms in the weathering of Dachstein limestone.
Author Contributions
Conceptualization, methodology, and funding acquisition, M.D. and I.B.; obtaining permits and the acquisition of field background information, J.-C.O.; UAV operations and data processing, I.B.; micro-roughness and Schmidt hammer measurements, M.D.; spectral measurements, M.K.; sample collection and preparation, M.D. and I.B.; petrographic analysis, A.G.; microbiological analysis, R.M.; writing of first draft, M.D.; editing of figures M.D., I.B. and M.K.; review and editing—all authors. All authors have read and agreed to the published version of the manuscript.
Funding
This research was funded in whole by the National Science Centre, Poland (NCN), grant “Micro-weathering and spectral signatures of rock surfaces in glacier forelands” (2020/39/O/ST10/01068).
Data Availability Statement
Not applicable.
Acknowledgments
We would like to thank MGGP Aero for providing the spectroradiometer ASD FieldSpec, TPI for providing UAV with equipment and help in data processing, and Keyence for allowing us to use the KDM.
Conflicts of Interest
The authors declare no conflict of interest. The founders had no role in the design of the study; in the collection, analyses, or interpretation of data; in the writing of the manuscript; or in the decision to publish the results.
References
- Benn, D.; Evans, D.J.A. Glaciers and Glaciations; Routledge: London, UK, 2010. [Google Scholar]
- WGMS. World Glacier Monitoring Service. 2022. Available online: https://wgms.ch/ (accessed on 20 December 2022).
- Hall, K.; Thorn, C.; Sumner, P. On the persistence of ‘weathering’. Geomorphology 2012, 149–150, 1–10. [Google Scholar] [CrossRef]
- Kump, L.R.; Brantley, S.L.; Arthur, M.A. Chemical weathering, Atmospheric CO2, and Climate. Annu. Rev Earth Planet. Sci. 2000, 28, 611–667. [Google Scholar] [CrossRef]
- Kirchner, J.S.; Lettmann, K.A.; Schnetger, B.; Wolff, J.-O.; Brumsack, H.-J. Identifying Appropriate Locations for the Accelerated Weathering of Limestone to Reduce CO2 Emissions. Minerals 2021, 11, 1261. [Google Scholar] [CrossRef]
- Thorn, C.E.; Darmody, R.G.; Dixon, J.C.; Schlyter, P. The chemical weathering regime of Kärkevagge, arctic–alpine Sweden. Geomorphology 2001, 41, 37–52. [Google Scholar] [CrossRef]
- Dreybrodt, W. The Role of Dissolution Kinetics in the Development of Karst Aquifers in Limestone: A Model Simulation of Karst Evolution. J. Geol. 1990, 98, 639–655. [Google Scholar] [CrossRef]
- Ford, D.; Williams, P. Kart Hydrology and Geomorphology; Wiley & Sons: Chichester, UK, 2007. [Google Scholar]
- Anderson, S.P.; Drever, J.I.; Humphrey, N.F. Chemical weathering in glacial environments. Geology 1997, 25, 399–402. [Google Scholar] [CrossRef]
- Hallet, B. Subglacial regelation water film. J. Glaciol. 1979, 23, 321–334. [Google Scholar] [CrossRef]
- Gunn, J. Encyclopedia of Caves and Karst Science; Routlege: New York, NY, USA, 2003. [Google Scholar]
- Day, M.J. Morphology and distribution of residual limestone hills (mogotes) in the karst of northern Puerto Rico. Geol. Soc. Am. Bull. 1978, 89, 426–432. [Google Scholar] [CrossRef]
- Brook, G.; Ford, D. The origin of labyrinth and tower karst and the climatic conditions necessary for their development. Nature 1978, 275, 493–496. [Google Scholar] [CrossRef]
- Dunkerley, D.L. Lithology and micro-topography in the Chillagoe karst, Queensland, Australia. Z. Für Geomorphol. 1983, 27, 191–204. [Google Scholar] [CrossRef]
- Hanna, F.K. A technique for measuring the rate of erosion of cave passages. Proc. Univ. Bristol Spelaeol. Soc. 1966, 11, 83–86. [Google Scholar]
- Trudgill, S.T. Surface lowering and landform evolution on Aldabra Philosophical Transactions of the Royal Society of London. Biol. Sci. Ser. B 1979, 286, 35–45. [Google Scholar]
- Spate, A.P.; Jennings, J.N.; Smith, D.I.; Greenaway, M.A. The micro-erosion meter: Use and limitations. Earth Surf. Process. Landf. 1985, 10, 427–440. [Google Scholar] [CrossRef]
- Shakesby, R.A.; Walsh, R.P.D. Micro-erosion meter measurements of erosion of limestone, Oxwich Point, Gower: Some technical considerations and preliminary results. Cambria 1986, 13, 213–234. [Google Scholar]
- Cucchi, F.; Fabio, F.; Ulcigrai, F. Degradation by dissolution of carbonate rocks. Acta Carsol. 1994, 23, 55–62. [Google Scholar]
- Muhammad, R.F.; Beng, Y.E. Estimating limestone dissolution rates in the Kinta and Lenggong Valleys using the micro erosion meter; a preliminary study. Bull. Geol. Soc. Malays. 2002, 45, 253–256. [Google Scholar] [CrossRef]
- Stephenson, W.J.; Finlayson, B.L. Measuring erosion with the micro-erosion meter—Contributions to understanding landform evolution. Earth-Sci. Rev. 2009, 95, 53–62. [Google Scholar] [CrossRef]
- Moses, C.; Robinson, D.; Barlow, J. Methods for measuring rock surface weathering and erosion: A critical review. Earth-Sci. Rev. 2014, 135, 141–161. [Google Scholar] [CrossRef]
- Viles, H.A.; Moses, C.A. Weathering nanomorphologies: Their experimental production and use as indicators of carbonate stone decay. Q. J. Eng. Geol. Hydrol. 1998, 31, 347–357. [Google Scholar] [CrossRef]
- Dąbski, M.; Woronko, B.; Fabijańska, P.; Otto, J.C. Micro-weathering of limestone surfaces in a foreland of Hallstätter Glacier (Dachstein, Austria). Geogr. Ann. Ser. A Phys. Geogr. 2019, 101, 277–292. [Google Scholar] [CrossRef]
- Mandl, G.W.; Matura, A. Geologische Karte der Republik Österreich 1: 50 000. 127 Schladming; Geologische Bendesanstalt: Vienna, Austria, 1995. [Google Scholar]
- Haas, J.; Lobitzer, H.; Monostori, M. Characteristics of the Lofer cyclicity in the type locality of the Dachstein Limestone (Dachstein Plateau, Austria). Facies 2007, 53, 113–126. [Google Scholar] [CrossRef]
- Krystyn, L.; Mandl, G.W.; Schauer, M. Growth and termination of the Upper Triassic platform margin of the Dachstein area (Northern Calcareous Alps, Austria). Austrian J. Earth Sci. 2009, 102, 23–33. [Google Scholar]
- Rode, M.; Sass, O.; Kellerer-Pirklbauer, A.; Schnepfleitner, H.; Gitschthaler, C. Permafrost distribution and conditions at the headwalls of two receding glaciers (Schladming and Hallstatt glaciers) in the Dachstein Massif, Northern Calcareous Alps, Austria. Cryosphere 2020, 14, 1173–1186. [Google Scholar] [CrossRef]
- Klimaregion Dachsteingruppe, 2018. Das Land Steiermark. Available online: http://www.umwelt.steiermark.at/cms/beitrag/10023730/25206/ (accessed on 28 June 2018).
- Bruhm, K.; Buchroithner, M.; Hetze, B. True-3D Visualization of Glacier Retreat in the Dachstein Massif, Austria: Cross-Media. Hard- and Softcopy Displays. In Developments in 3D Geo-Information Science. Lecture Notes in Geoinformation and Cartography; Neutens, T., De Maeyer, P., Eds.; Springer: Berlin/Heidelberg, Germany, 2010. [Google Scholar]
- Fischer, A.; Seiser, B.; Stocker-Waldhuber, M.; Mitterer, C.; Abermann, J. Tracing glacier changes in Austria from the Little Ice Age to the present using a lidar-based high-resolution glacier inventory in Austria. Cryosphere 2015, 9, 753–766. [Google Scholar] [CrossRef]
- Fischer, A.; Seiser, B.; Stocker-Waldhuber, M.; Mitterer, C.; Abermann, J. The Austrian Glacier Inventories GI 1 (1969), GI 2 (1998), GI 3 (2006), and GI LIA in ArcGIS (shapefile) format. PANGAEA. Supplement to: Fischer, A.; Seiser, B.; Stocker-Waldhuber, M.; Mitterer, C.; Abermann, J. Tracing glacier changes in Austria from the Little Ice Age to the present using a lidar-based high-resolution glacier inventory in Austria. Cryosphere 2015, 9, 753–766. [Google Scholar]
- Buckel, J.; Otto, J.-C. The Austrian Glacier Inventory GI 4 in ArcGis (shapefile) format. PANGAEA. Supplement to: Buckel, J.; Otto, J.-C.; Prasicek, G.; Keuschnig, M. Glacial lakes in Austria—Distribution and formation since the Little Ice Age. Glob. Planet Chang. 2018, 164, 39–51. [Google Scholar] [CrossRef]
- Groß, G. Der Flächenverlust der Gletscher in Österreich 1850-1920-1969 (GI 1). Z. Für Gletsch. Und Glazialgeol. 1987, 23, 131–141. [Google Scholar]
- Dąbski, M. Rock surface micro-roughness, Schmidt hammer rebound and weathering rind thickness within LIA Skalafellsjokull foreland, SE Iceland. Pol. Polar Res. 2014, 35, 99–114. [Google Scholar] [CrossRef]
- Dąbski, M. Application of the Handysurf E-35B electronic profilometer for the study of weathering micro-relief in glacier forelands in SE Iceland. Acta Geol. Pol. 2015, 65, 389–401. [Google Scholar] [CrossRef]
- Dąbski, M.; Tittenbrun, A. Time-dependant surface deterioration of glacially abraded basaltic boulders deposited by Flaajokull, SE Iceland. Jökull 2013, 63, 55–70. [Google Scholar] [CrossRef]
- Sambrook, J.; Russel, D.W. Molecular Cloning: A Laboratory Manual; Cold Spring Harbor Laboratory Press: Cold Spring Harbor, NY, USA, 2001. [Google Scholar]
- Czapek, F. Untersuchungen über die Stickstoffgewinnung und Eiweifsbildung der Pflanzen. Beiträge Zur Chem. Physiol. Und Pathol. 1901–1902, 1, 538–560. [Google Scholar]
- Tsai, F.; Philpot, W. Derivative Analysis of Hyperspectral Data. Remote Sens. Environ. 1998, 66, 41–51. [Google Scholar] [CrossRef]
- Moghtaderi, A.; Moore, F.; Taghavi, S.M.; Rezaei, R. The application of ASTER imageries and mathematical evaluation method in detecting cyanobacteria in biological soil crust, Chadormalu area, central Iran. Iran. J. Sci. Technol. A1 2011, 35, 13–28. [Google Scholar]
- McCarroll, D. A new instrument and techniques for the field measurement of rock surface roughness. Zeischrift Für Geomorphol. 1992, 36, 69–79. [Google Scholar] [CrossRef]
- McCarroll, D.; Nesje, A. Rock surface roughness as an indicator of degree of rock surface weathering. Earth Surf. Process. Landf. 1996, 21, 963–977. [Google Scholar] [CrossRef]
- Porter, S.C. Weathering rinds as a relative-age criterion: Application to subdivision of glacial deposits in the Cascade Range. Geology 1975, 3, 101–104. [Google Scholar] [CrossRef]
- Chinn, T.J.H. Use of Rock Weathering-Rind Thickness for Holocene Absolute Age-Dating in New Zealand. Arct. Alp. Res. 1981, 13, 33–45. [Google Scholar] [CrossRef]
- Nicholson, D.T. Holocene microweathering rates and processes on ice-eroded bedrock, Roldal area, Hardangervidda, southern Norway. In Periglacial and Paraglacial Processes and Environments; Knight, J., Harrison, J., Eds.; Geological Society, Special Publications 320: London, UK, 2009. [Google Scholar]
- Matthews, J.A.; Shakesby, R.A. The status of the Little Ice Age is southern Norway: Relative-age dating of neoglacial moraines with Schmidt hammer and lichenometry. Boreas 1984, 13, 333–346. [Google Scholar] [CrossRef]
- Winkler, S. The Schmidt hammer as a relative-age dating technique: Potential and limitations of its application on Holocene moraines in Mt. Cook National Park, Southern Alps, New Zealand. N. Z. J. Geol. Geophys. 2005, 48, 105–116. [Google Scholar] [CrossRef]
- Shakesby, A.A.; Matthews, J.A.; Owen, G. The Schmidt hammer as a relative-age dating tool and its potential for calibrated-age dating in Holocene glaciated environments. Quat. Sci. Rev. 2006, 25, 2846–2867. [Google Scholar] [CrossRef]
- Evans, D.J.A.; Archer, S.; Wilson, D.J.H. A comparison of the lichenometric and Schmidt hammer dating techniques based on data from the proglacial areas of some Icelandic glaciers. Quat. Sci. Rev. 1999, 18, 13–41. [Google Scholar] [CrossRef]
- Etienne, S. The role of biological weathering in periglacial areas: A study of weathering rinds in south Iceland. Geomorphology 2002, 47, 75–86. [Google Scholar] [CrossRef]
- Matthews, J.A.; Owen, G. Holocene Chemical Weathering, Surface Lowering and Rock Weakening Rates on Glacially Eroded Bedrock Surfaces in an Alpine Periglacial Environment, Jotunheimen, Southern Norway. Permafr. Periglac. Process. 2011, 22, 279–290. [Google Scholar] [CrossRef]
- Sharp, R.P. Semiquantitative differentiation of glacial moraines near Convict Lake, Sierra Nevada, California. J. Geol. 1969, 77, 68–91. [Google Scholar] [CrossRef]
- Anderson, L.W.; Anderson, D.S. Weathering Rinds on Quartzarenite Clasts as a Relative-Age Indicator and the Glacial Chronology of Mount Timpanogos, Wasatch Range, Utah. Arct. Alp. Res. 1981, 13, 25–31. [Google Scholar] [CrossRef]
- Gellatly, A.F. The Use of Rock Weathering-Rind Thickness to Redate Moraines in Mount Cook National Park, New Zealand. Arct. Alp. Res. 1984, 16, 225–232. [Google Scholar] [CrossRef]
- André, M.-F. Rates of post-glacial rock weathering on glacially scoured outcrops (Abisko-Riksgransen area, 688 N). Geogr. Ann. 2002, 84A, 139–150. [Google Scholar] [CrossRef]
- Sumner, P.; Nel, W.; Holness, S.; Boelhouwers, J. Rock weathering characteristics as relative-age indicators for glacial and post-glacial landforms on Marion Island. South Afr. Geogr. J. 2002, 84, 153–157. [Google Scholar] [CrossRef]
- Mahaney, W.C.; Fairén, A.G.; Dohm, J.M.; Krinsley, D.H. Weathering rinds on clasts: Examples from Earth and Mars as short and long term recorders of paleoenvironment. Planet. Space Sci. 2012, 73, 243–253. [Google Scholar] [CrossRef]
- Ciccazzo, S. Dynamic of Bacterial Community Colonization in High-Altitude Mountain Environments. Ph.D. Thesis, Universita degli Studi di Milano, Milan, Italy, 2014. [Google Scholar]
- Dorn, R.I.; Jeong, A. Rock Coating and Weathering-Rind Development at the Edge of Retreating Glaciers: An Initial Study. Yearb. Assoc. Pac. Coast Geogr. 2018, 80, 66–96. [Google Scholar] [CrossRef]
- Dixon, J.C.; Thorn, C.E.; Darmody, R.G.; Campbell, S.W. Weathering rinds and rock coatings from an Arctic alpine environment, northern Scandinavia. GSA Bull. 2002, 114, 226–238. [Google Scholar] [CrossRef]
- Dorn, R.I.; Mahaney, W.C.; Krinsley, D.H. Case Hardening: Turning Weathering Rinds into Protective Shells. Elements 2017, 13, 165–169. [Google Scholar] [CrossRef]
- Woronko, B. Frost weathering versus glacial grinding in the micromorphology of quartz sand grains: Processes and geological implications. Sediment. Geol. 2016, 335, 103–119. [Google Scholar] [CrossRef]
- Konhauser, K. Introduction to Geomicrobiology; Blackwell Publishing Company: Malden, MA, USA, 2007. [Google Scholar]
- Ehrlich, H.L.; Newman, D.K. Geomicrobiology; CRC Press Taylor&Francis Group: Boca Raton, FL, USA, 2009. [Google Scholar]
- Li, W.; Zhou, P.P.; Jia, L.P.; Yu, L.-J.; Li, X.-L.; Zhu, M. Limestone Dissolution Induced by Fungal Mycelia, Acidic Materials, and Carbonic Anhydrase from Fungi. Mycopathologia 2009, 167, 37–46. [Google Scholar] [CrossRef]
- Dupraz, C.; Reid, P.; Braissant, O.; Decho, A.W.; Norman, S.R.; Visschert, P.T. Processes of carbonate precipitation in modern microbial mats. Eart-Sci. Rev. 2009, 96, 141–162. [Google Scholar] [CrossRef]


Disclaimer/Publisher’s Note: The statements, opinions and data contained in all publications are solely those of the individual author(s) and contributor(s) and not of MDPI and/or the editor(s). MDPI and/or the editor(s) disclaim responsibility for any injury to people or property resulting from any ideas, methods, instructions or products referred to in the content. |
© 2023 by the authors. Licensee MDPI, Basel, Switzerland. This article is an open access article distributed under the terms and conditions of the Creative Commons Attribution (CC BY) license (https://creativecommons.org/licenses/by/4.0/).