Article

Pyrite Textures and Compositions in the Dunbasitao Gold Deposit, NW China: Implications for Ore Genesis and Gold Mineralization Processes

1
Key Laboratory of Orogenic Belts and Crustal Evolution, Ministry of Education, Peking University, Beijing 100871, China
2
Key Laboratory of Western China’s Mineral Resources and Geological Engineering, Ministry of Education, School of Earth Science and Resources, Chang’an University, Xi’an 710054, China
3
Xinjiang Mineral Resources Research Center, Xinjiang Institute of Ecology and Geography, Chinese Academy of Sciences, Urumqi 830011, China
4
Western Region Gold Co., Ltd., Urumqi 830002, China
5
Key Laboratory of Gold Mineralization Processes and Resource Utilization, MNR, Shandong Institute of Geological Sciences, Jinan 250013, China
*
Authors to whom correspondence should be addressed.
Minerals 2023, 13(4), 534; https://doi.org/10.3390/min13040534
Submission received: 18 March 2023 / Revised: 2 April 2023 / Accepted: 6 April 2023 / Published: 11 April 2023
(This article belongs to the Special Issue Mineral Resources in North China Craton)

Abstract

:
The process and mechanism of gold mineralization are frontier issues. The Dunbasitao deposit is the most important gold deposit discovered along the Armantai suture zone, East Junggar, NW China, which indicates the potential for future ore exploration in this area. Orebodies are mainly hosted in Lower Carboniferous Jiangbasitao Formation volcano-sedimentary rocks, and the ores are characterized by multistage pyrites. Based on microscopy and backscattered electron imaging studies, pyrites are classified into five types: the pre-ore framboidal/colloidal Py0; the early-stage coarse-grained, cubic, and homogeneous Py1; and the middle-stage fine-grained, cubic/pyritohedron Py2 that includes Py2a (core), Py2b (mantle), and Py2c (rim). The results of the EPMA and in situ LA-ICP-MS analyses show that trace elements of pyrite mainly occur in two forms: solid solutions and invisible or visible inclusions. Mn, Co, Ni, and As enter the pyrite lattice, whereas Ti occurs as mineral inclusions, and Au, Cu, Zn, Sb, and Pb can occur in both forms. Au and As show a positive linear relationship with r = 0.850. Py2b has much higher Au contents (20.1 to 201 ppm) than other pyrite types (Py0: 0.01 to 0.36 ppm; Py1: 0.01 to 0.02 ppm; Py2a: 0.31 to 2.48 ppm; and Py2c: 0.18 to 18.0 ppm). The Dunbasitao deposit is classified as an orogenic gold deposit using the two latest machine learning classifiers based on pyrite trace element data. Fluid immiscibility, sudden cooling, and the substitution of S1− with As1− might be crucial mechanisms leading to Au precipitation. Initial ore-forming fluids brought major amounts of As, Au, Co, Ni, Se, Zn, Ag, Cd, Sn, and other elements, and the Jiangbasitao Formation host rocks contributed a certain amount of As, Ni, Cu, Sb, Pb, and Bi, at least.

1. Introduction

The process and mechanism of gold mineralization are the frontiers of gold deposit research and are essential for understanding the genesis of the deposits and establishing the mineralization models [1,2,3,4,5]. Pyrite is the most common gold-bearing sulfide and is also an important host to a range of trace elements such as Au, Ag, Cu, Pb, Zn, Co, Ni, As, Sb, Se, and Te, which are useful indicators for ore genesis and physico-chemical conditions [6,7,8,9,10,11,12,13,14]. In recent years, since traditional chemical analysis methods often give mixed results, especially for pyrites with complicated textures and small particle sizes, laser ablation–inductively coupled plasma–mass spectrometry (LA-ICP-MS) in situ trace element analysis of pyrite is considered a better method to decipher the multistage mineralization processes of gold deposits (e.g., [15,16,17,18]). Moreover, the developing trace element databases on different deposit types enable scholars to use statistical methods to identify ore deposits based on mineral data (e.g., [19,20,21]), which is of great significance for guiding prospecting and exploration. Recently, Gregory et al. [22] and Zhong et al. [23] developed two different machine learning classifiers based on pyrite trace element databases. However, these two classifiers have not been widely used, and their effectiveness remains to be examined.
The Central Asian Orogenic Belt (CAOB) (Figure 1a) is the largest Phanerozoic orogen and one of the most important orogenic gold deposit provinces around the world, hosting the Muruntau (>5000 t; biggest), Kumtor (539 t), Zarmitan (340 t), Sawayaerdun (127 t), and other world-class orogenic gold deposits [24,25,26,27,28,29]. East Junggar in northern Xinjiang, China (Figure 1b), located in the north-central part of the CAOB, has experienced significant accretionary and continental collision orogenesis during the Phanerozoic, which theoretically has excellent prospecting potential for orogenic gold deposits [30,31]. There are three major suture zones in East Junggar, including Irtysh, Armantai, and Kalamaili from the north to the south (Figure 1b,c). Although many gold deposits have been discovered along the Irtysh and Kalamaili suture zones, e.g., the Sarbulake (17 t Au) and Shuangquan (10 t Au) gold deposits (Figure 1c; [32,33]), there is only one medium-sized gold deposit that has been discovered along the Armantai suture zone, i.e., the Dunbasitao gold deposit (5.1 t of gold proved and additional inferred reserves of 6 t; [34]). Thereby, the Dunbasitao deposit is a critical breakthrough point for further prospecting in this zone and needs to be studied in detail.
However, research on the trace element geochemistry of gold-bearing minerals and gold mineralization process in the Dunbasitao deposit is still lacking. In addition, Li [36] have suggested that the Dunbasitao deposit is a magmatic-hydrothermal deposit largely based on the existence of a magmatic intrusion outside the mining area whose age approximates that of the mineralization (268.3 ± 2.8 Ma, pyrite Rb-Sr isochron age), whilst Liu et al. [34,35] demonstrated that the Dunbasitao deposit was an orogenic gold deposit according to its ore-controlling characteristics, petrography, and fluid inclusions. Previous hydrogen and oxygen isotope results were all plotted outside the fields of magmatic and metamorphic water on δDH2O versus δ18OH2O diagrams, failing to obtain a definite origin of the fluid between metamorphic and magmatic water [35,36]. Therefore, further evidence is still needed to determine the genesis of the deposit.
In this study, we conducted systematic EPMA and in situ LA–ICP–MS trace element analyses based on detailed microscopy and BSE observations to (1) find out the occurrence states and incorporation mechanisms of trace elements in pyrite; (2) provide new evidence for the genesis of the deposit and test existing machine learning classifiers; and (3) decipher the mineralization processes and gold precipitation mechanism.

2. Regional Geology

The CAOB extends from the Urals in the west, through Kazakhstan, NW China, Mongolia, and NE China, to the Pacific in the east and is one of the largest accretionary orogenic belts in the world (Figure 1a; [37]). It comprises complex tectonic units, including Precambrian massifs, ophiolite suites, magmatic arcs, and accretionary terranes. High-rate continental growth in the CAOB during the Phanerozoic led to a variety of metallogeneses [38,39,40]. It is generally accepted that subduction-related orogenesis in the CAOB began in the late Precambrian, and the final closure of the Paleo-Asian Ocean and the end of the accretionary orogenesis in the southern part of the CAOB may have resulted from the junction of the active southern margin of the Siberian with the Tarim and North China cratons in the Permian or Triassic [37,39,41,42].
East Junggar is located in the west-central part of the CAOB (Figure 1b), separated from the Altai orogen by the Irtysh suture zone to the north and from the Tianshan orogen by the Kalamaili suture zone to the south [26,31,43]. The northern part of East Junggar is mainly composed of two arcs bounded by three NW-SE-striking suture zones (Figure 1c). The two arcs refer to the Dulate arc and the Yemaquan arc, and the three zones refer to the Irtysh suture zone, the Armantai suture zone, and the Kalamaili suture zone from north to south [36].
The Irtysh suture zone represents the closure of the Paleo-Asian Ocean between Kazakhstan and the peri-Siberia tectonic domains in the Carboniferous [44,45,46]. The eastern part of the Irtysh suture zone is cut off by the NNW-trending strike-slip Fuyun Fault (Figure 1c; [47]). The Armantai suture zone, formed during the Late Ordovician to Early Silurian, represents the closure of the southern branch of the Paleo-Asian Ocean [48]. The Kalamaili suture zone was formed by the closure of the Junggar Ocean at approximately 343 Ma [49].
The Dulate arc is dominantly composed of Devonian–Carboniferous volcanic and sedimentary rocks and Devonian to Permian granitoids formed by the intra-oceanic subduction of the Paleo-Asian oceanic plate [26,46,50,51,52]. The Yemaquan arc was formed from the subduction of the Paleo-Asian oceanic plate under the Junggar continent during the Early Paleozoic, mainly comprising Devonian–Carboniferous volcanic and volcaniclastic rocks, Ordovician and Silurian volcano-sedimentary rocks, and Carboniferous–Permian granitoids [43,53,54].
Due to the presence of abundant accreted juvenile material and related fluids, various types of deposits have been discovered in East Junggar, such as orogenic gold deposits, epithermal gold deposits, IOCG Fe-Cu-Au deposits, porphyry Cu-Mo deposits, magmatic Cu-Ni deposits, and skarn Cu-Mo deposits [31,47,55,56,57,58,59,60].

3. Local and Deposit Geology

3.1. Stratigraphy

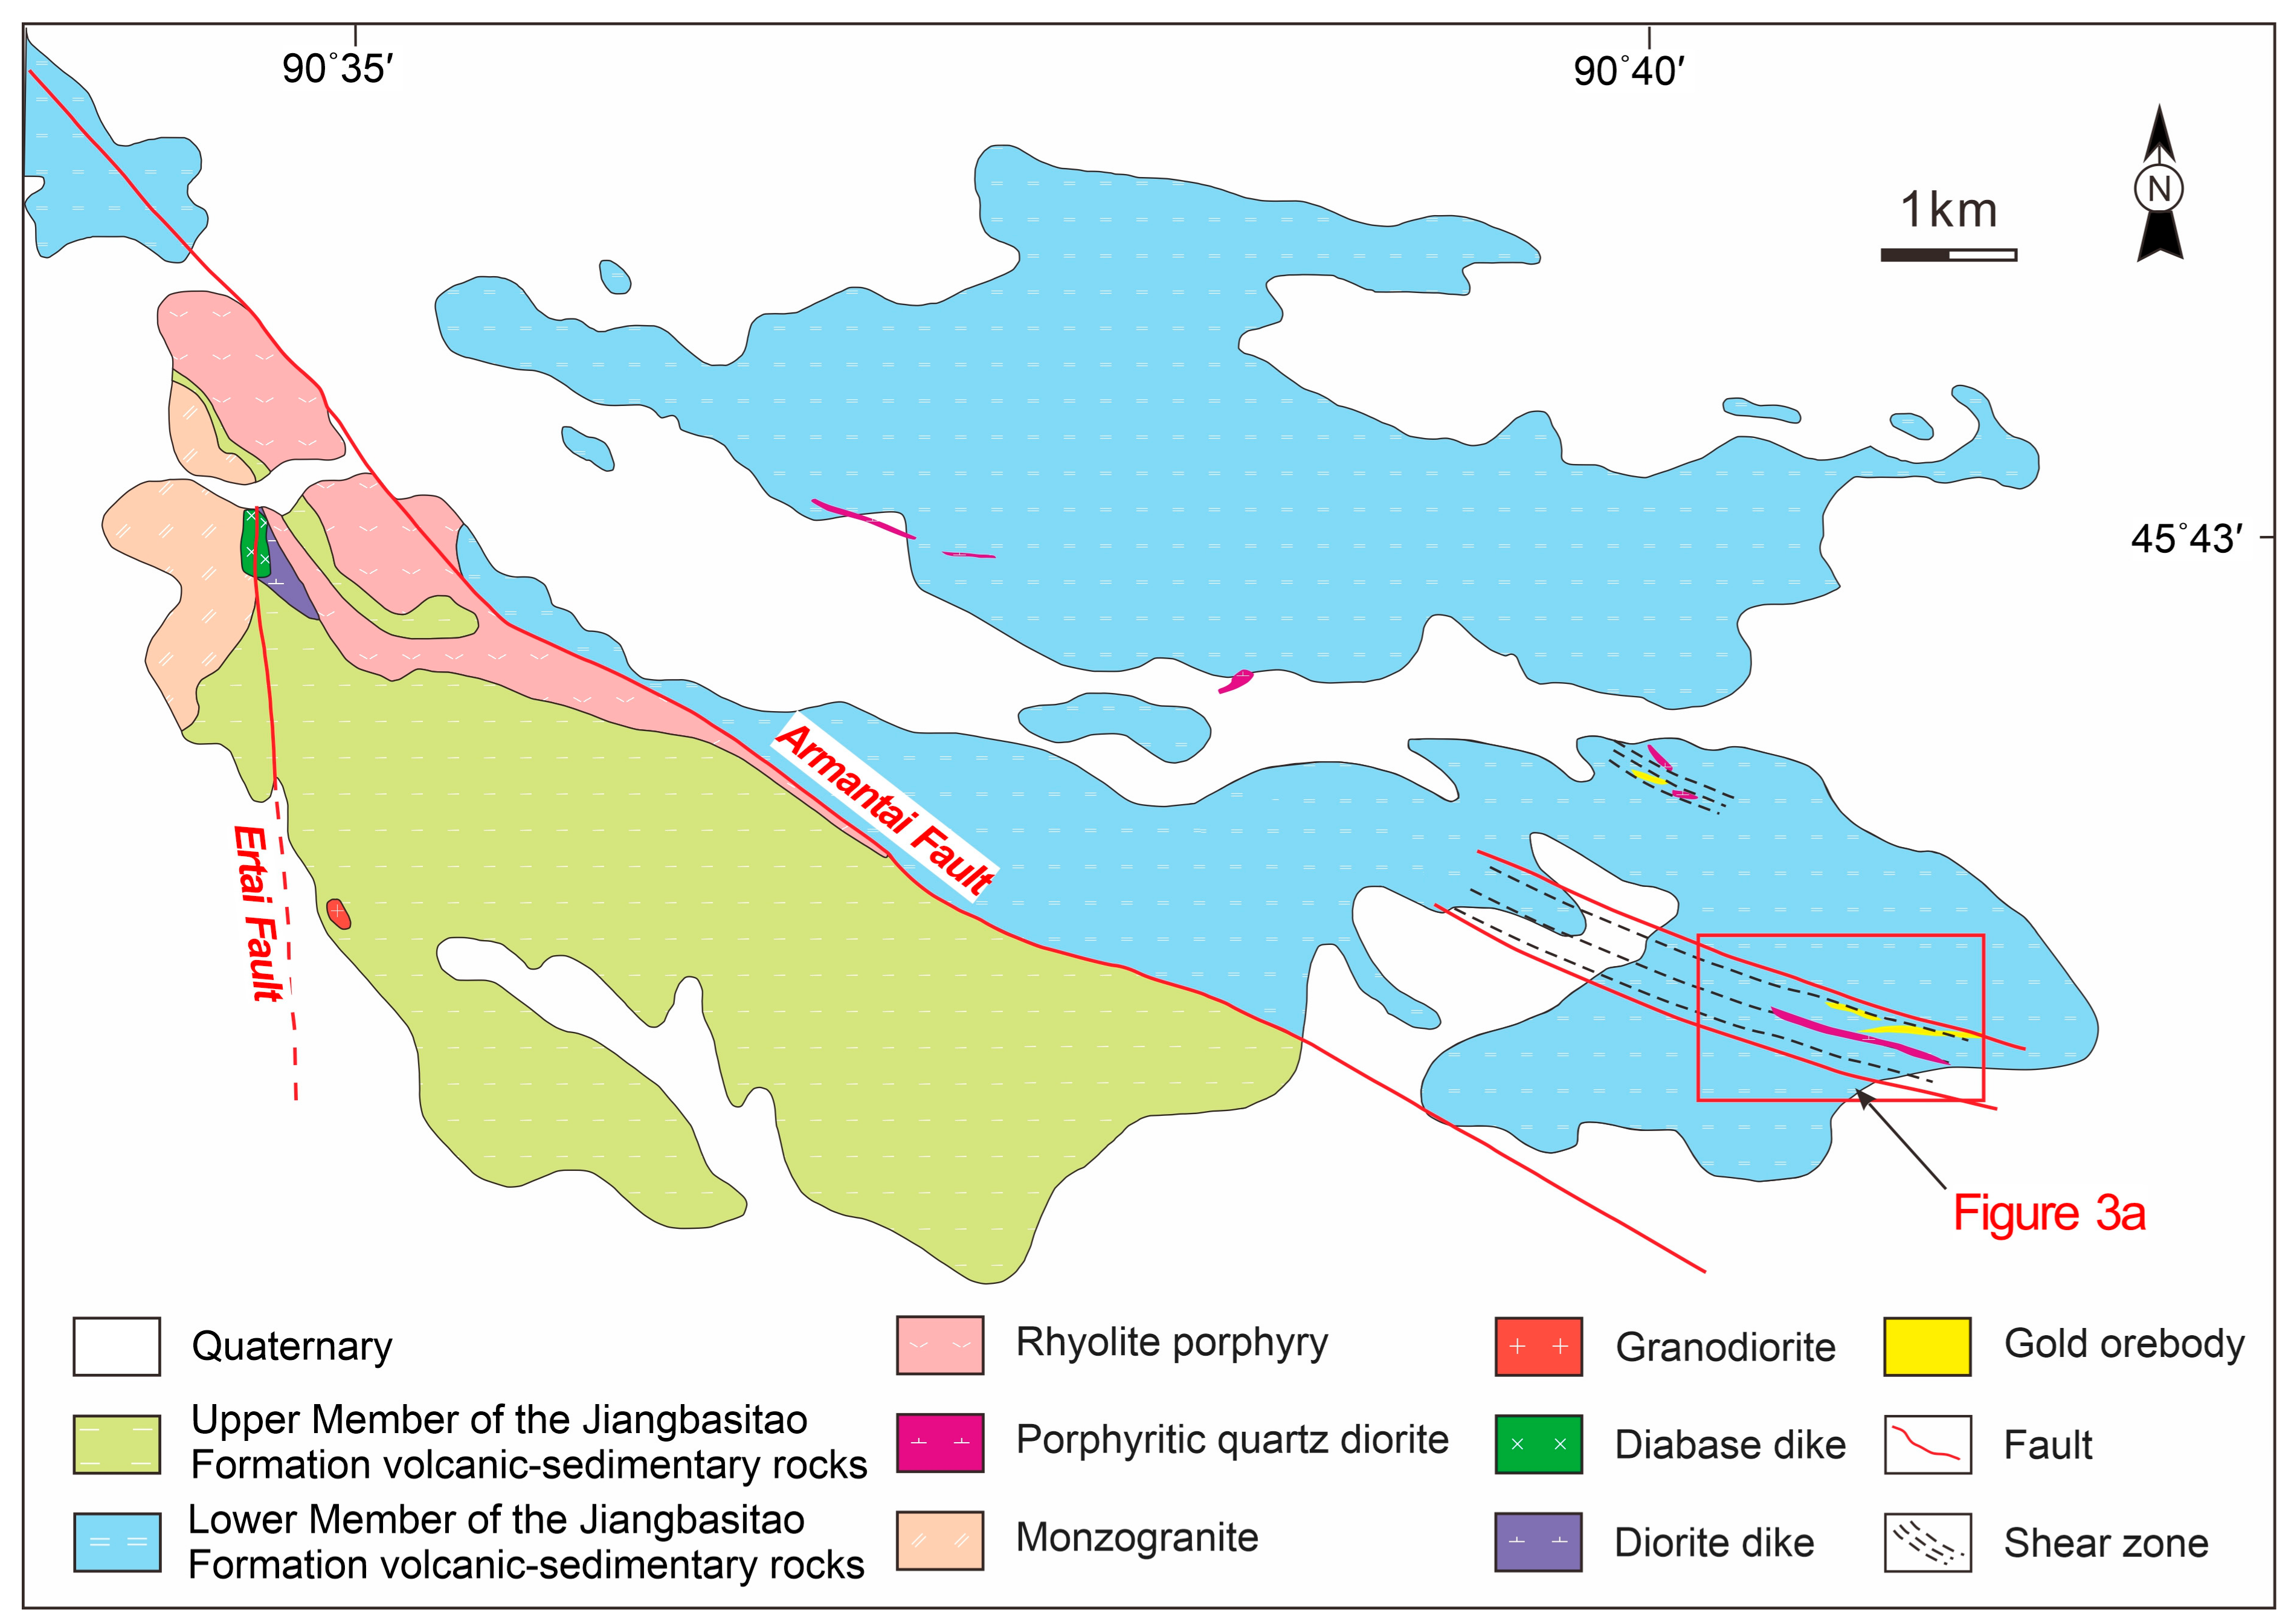
The Dunbasitao gold deposit is located in the southeast part of the Dulate arc, close to the Armantai suture zone (Figure 1c). The strata exposed in the mining area mainly comprise Lower Carboniferous Jiangbasitao Formation and Quaternary sediments (Figure 2). The Jiangbasitao Formation consists of volcano-sedimentary rocks with minor carbonate rock interlayers, which can be further divided into Lower and Upper members. The Lower and Upper members of the Jiangbasitao Formation are separated by the Armantai Fault in the mining area. The Upper Member is mainly composed of tuffs, tuffaceous siltstone, and micrite, which is distributed on the southwest of the Armantai Fault (Figure 2). The Lower Member is composed of conglomerate, sandstone, tuffaceous sandstone, tuffaceous siltstone, and micrite, distributed in the northeast of the Armantai Fault. This member has significant sedimentary cycles, with its detrital grain size varying notably. Previous work has also reported carbonaceous interlayers, animal fossils, and sedimentary pyrite in this member [34]. In the brittle–ductile shear zone, the rocks widely underwent dynamic metamorphism manifesting as phyllitization and mylonitization [36].

3.2. Intrusive Rocks

In the mining area, the intrusive rocks include rhyolite porphyry, monzogranite, porphyritic quartz diorite, diorite, and diabase. Among these, only porphyritic quartz diorite hosts some orebodies, whereas rhyolite porphyry, monzogranite, diorite, and diabase are all exposed in the northwest of the mining area, far from the orebodies (Figure 2). Porphyritic quartz diorite has intruded into the Lower Member of the Jiangbasitao Formation in the form of dikes and is mainly disclosed via drill holes, with minor outcrops on the surface. This rock has a porphyritic texture, comprising approximately 15% phenocryst and 85% matrix. The phenocryst is characterized by plagioclase, quartz, and K-feldspar, and the matrix is constituted of fine to microscopic plagioclase and quartz. This rock has undergone intense and extensive sericitization, carbonation, chloritization, and pyritization [34]. Rhyolite porphyry, located at the intersection of the Ertai and Armantai faults, stretches to the southeast following the Armantai Fault with its width narrowing. Monzogranite is exposed on the southwest of the rhyolite porphyry, and they are bounded by the Ertai Fault. Diorite is adjacent to the monzogranite bordered by the Ertai Fault, and its outcrop is quite small. Diabase is located at the boundary between the diorite and monzogranite along the Ertai Fault and is exposed as a 20-m and severely weathered dike [34].

3.3. Structure

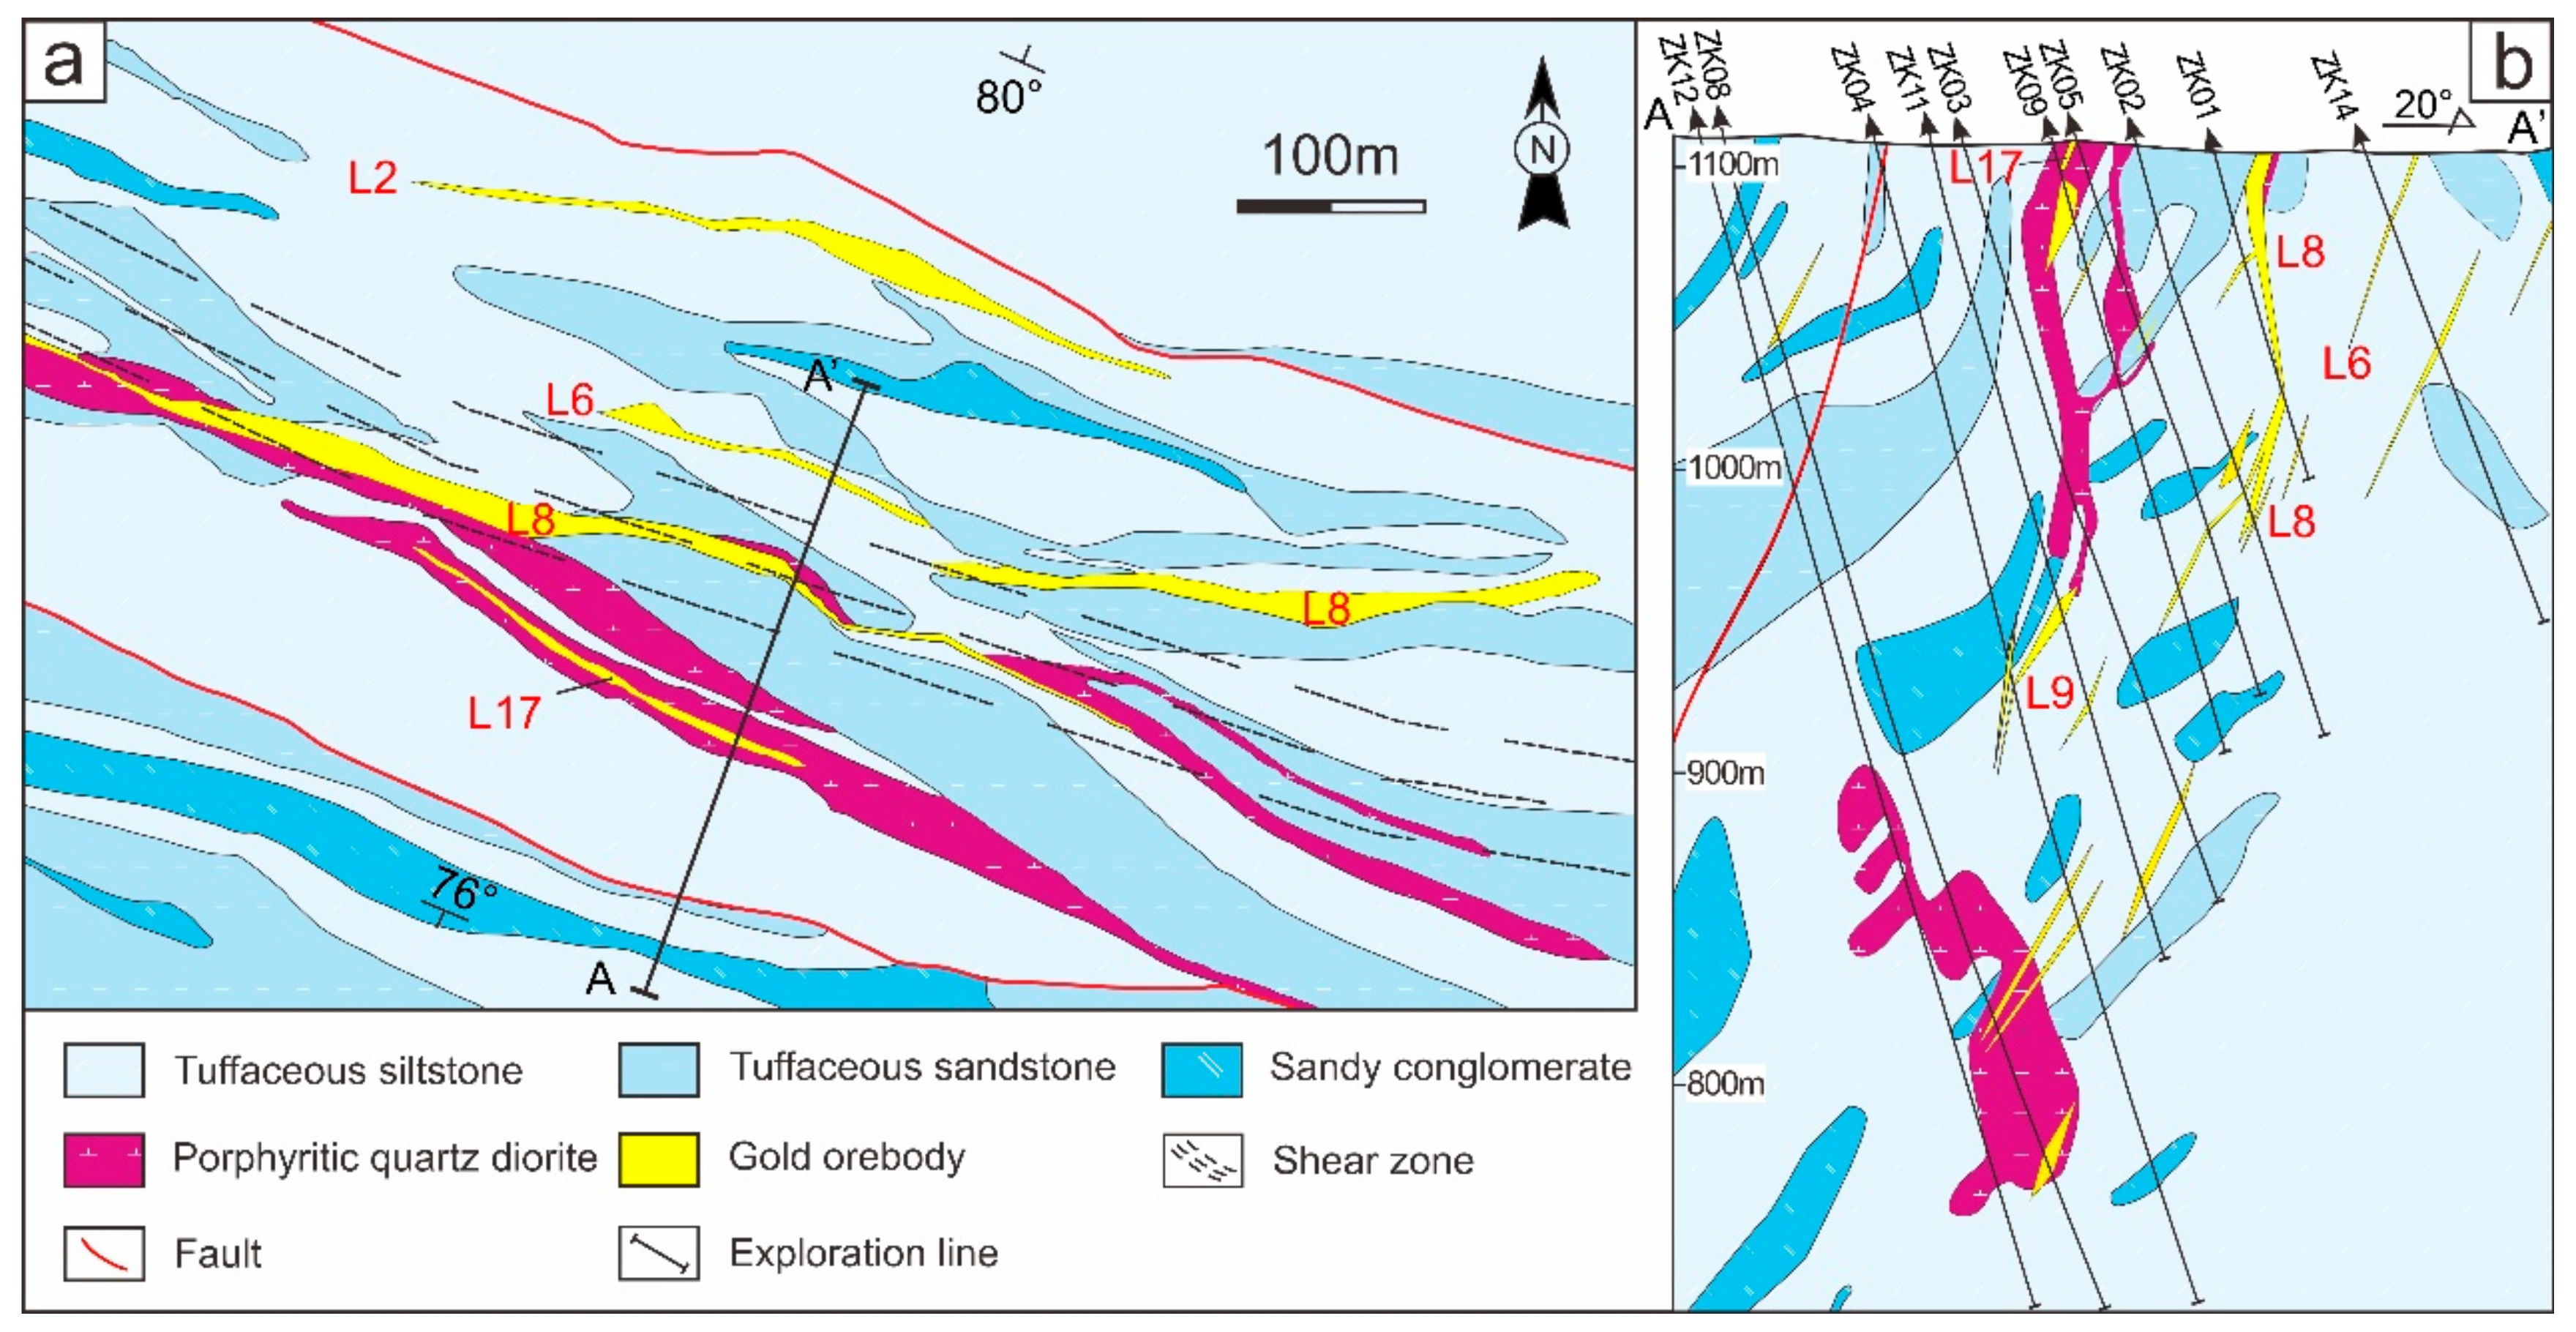
There is an anticline that lies in the eastern part of the mining area, with its axis dipping eastward and striking 110° (Figure 2 and Figure 3a). The core of the anticline is mainly composed of tuffaceous sandstone and siltstone hosting the largest L8 orebody (Figure 3a,b). The faults in the mining area comprise the Armantai Fault, Ertai Fault, and their secondary faults and other minor steep-dip faults. The Armantai Fault dips steeply to the southwest with its overall strike at about 115° and a dip angle of more than 70°. Two ESE-trending shear zones occur on the northeast side of the Armantai Fault (Figure 2). The most crucial shear zone is located in the southeast of the mining area, sandwiched by 2 high-angle faults, and steeply dips toward the southwest with a strike of 110–123° and a dip angle of 70–85°. The rocks in the shear zone are characterized by strong foliation and cleavage [35,36].

3.4. Orebodies

Most of the orebodies are distributed along the ESE-trending shear zone, whose occurrence is roughly parallel to the Lower Member of the Jiangbasitao Formation (Figure 3). A total of 31 gold orebodies have been delineated, with lengths of 40 to 850 m, thicknesses of 1.0 to 16.2 m, and grades of 1.0 to 33.5 g/t. These orebodies are vein-like with poor continuity and dip steeply southward with dip directions of 115 to 125° and dip angles of 70 to 85°. L8 is the largest among these orebodies, accounting for over 80% of the total gold reserves in the Dunbasitao gold deposit. It strikes in the ESE direction, dips steeply to the south, and steadily extends to a greater depth (of approximately 320 m) with a total length of 850 m on the surface and a dip angle between 70 and 85°. The gold grade of the L8 orebody ranges from 1 to 33 g/t, and the thickness ranges from 1 to 16 m. Native gold can be locally observed. Pinch and swell in orebodies are common both along the strike and the deepening [35,36].

3.5. Mineralization and Alteration

The gold is mainly hosted by quartz veins and secondly, by altered ores. The hydrothermal alterations in the Dunbasitao deposit comprise silicification, sericitization, pyritization, arsenopyritization, epidotization, chloritization, and carbonation, among which the pyritization and arsenopyritization are closely associated with gold mineralization, whilst the epidotization and chloritization are typical poor-ore alterations. The ore minerals mainly consist of native gold, pyrite, arsenopyrite, galena, sphalerite, and chalcopyrite, and the gangue minerals comprise quartz, calcite, albite, ankerite, chlorite, epidote, and sericite. The ores are characterized by disseminated, banded, brecciated, and stockwork structures with inclusion, replacement, euhedral granular, cataclastic, and intersertal textures [34].

3.6. Mineral Paragenesis and Pyrite Types

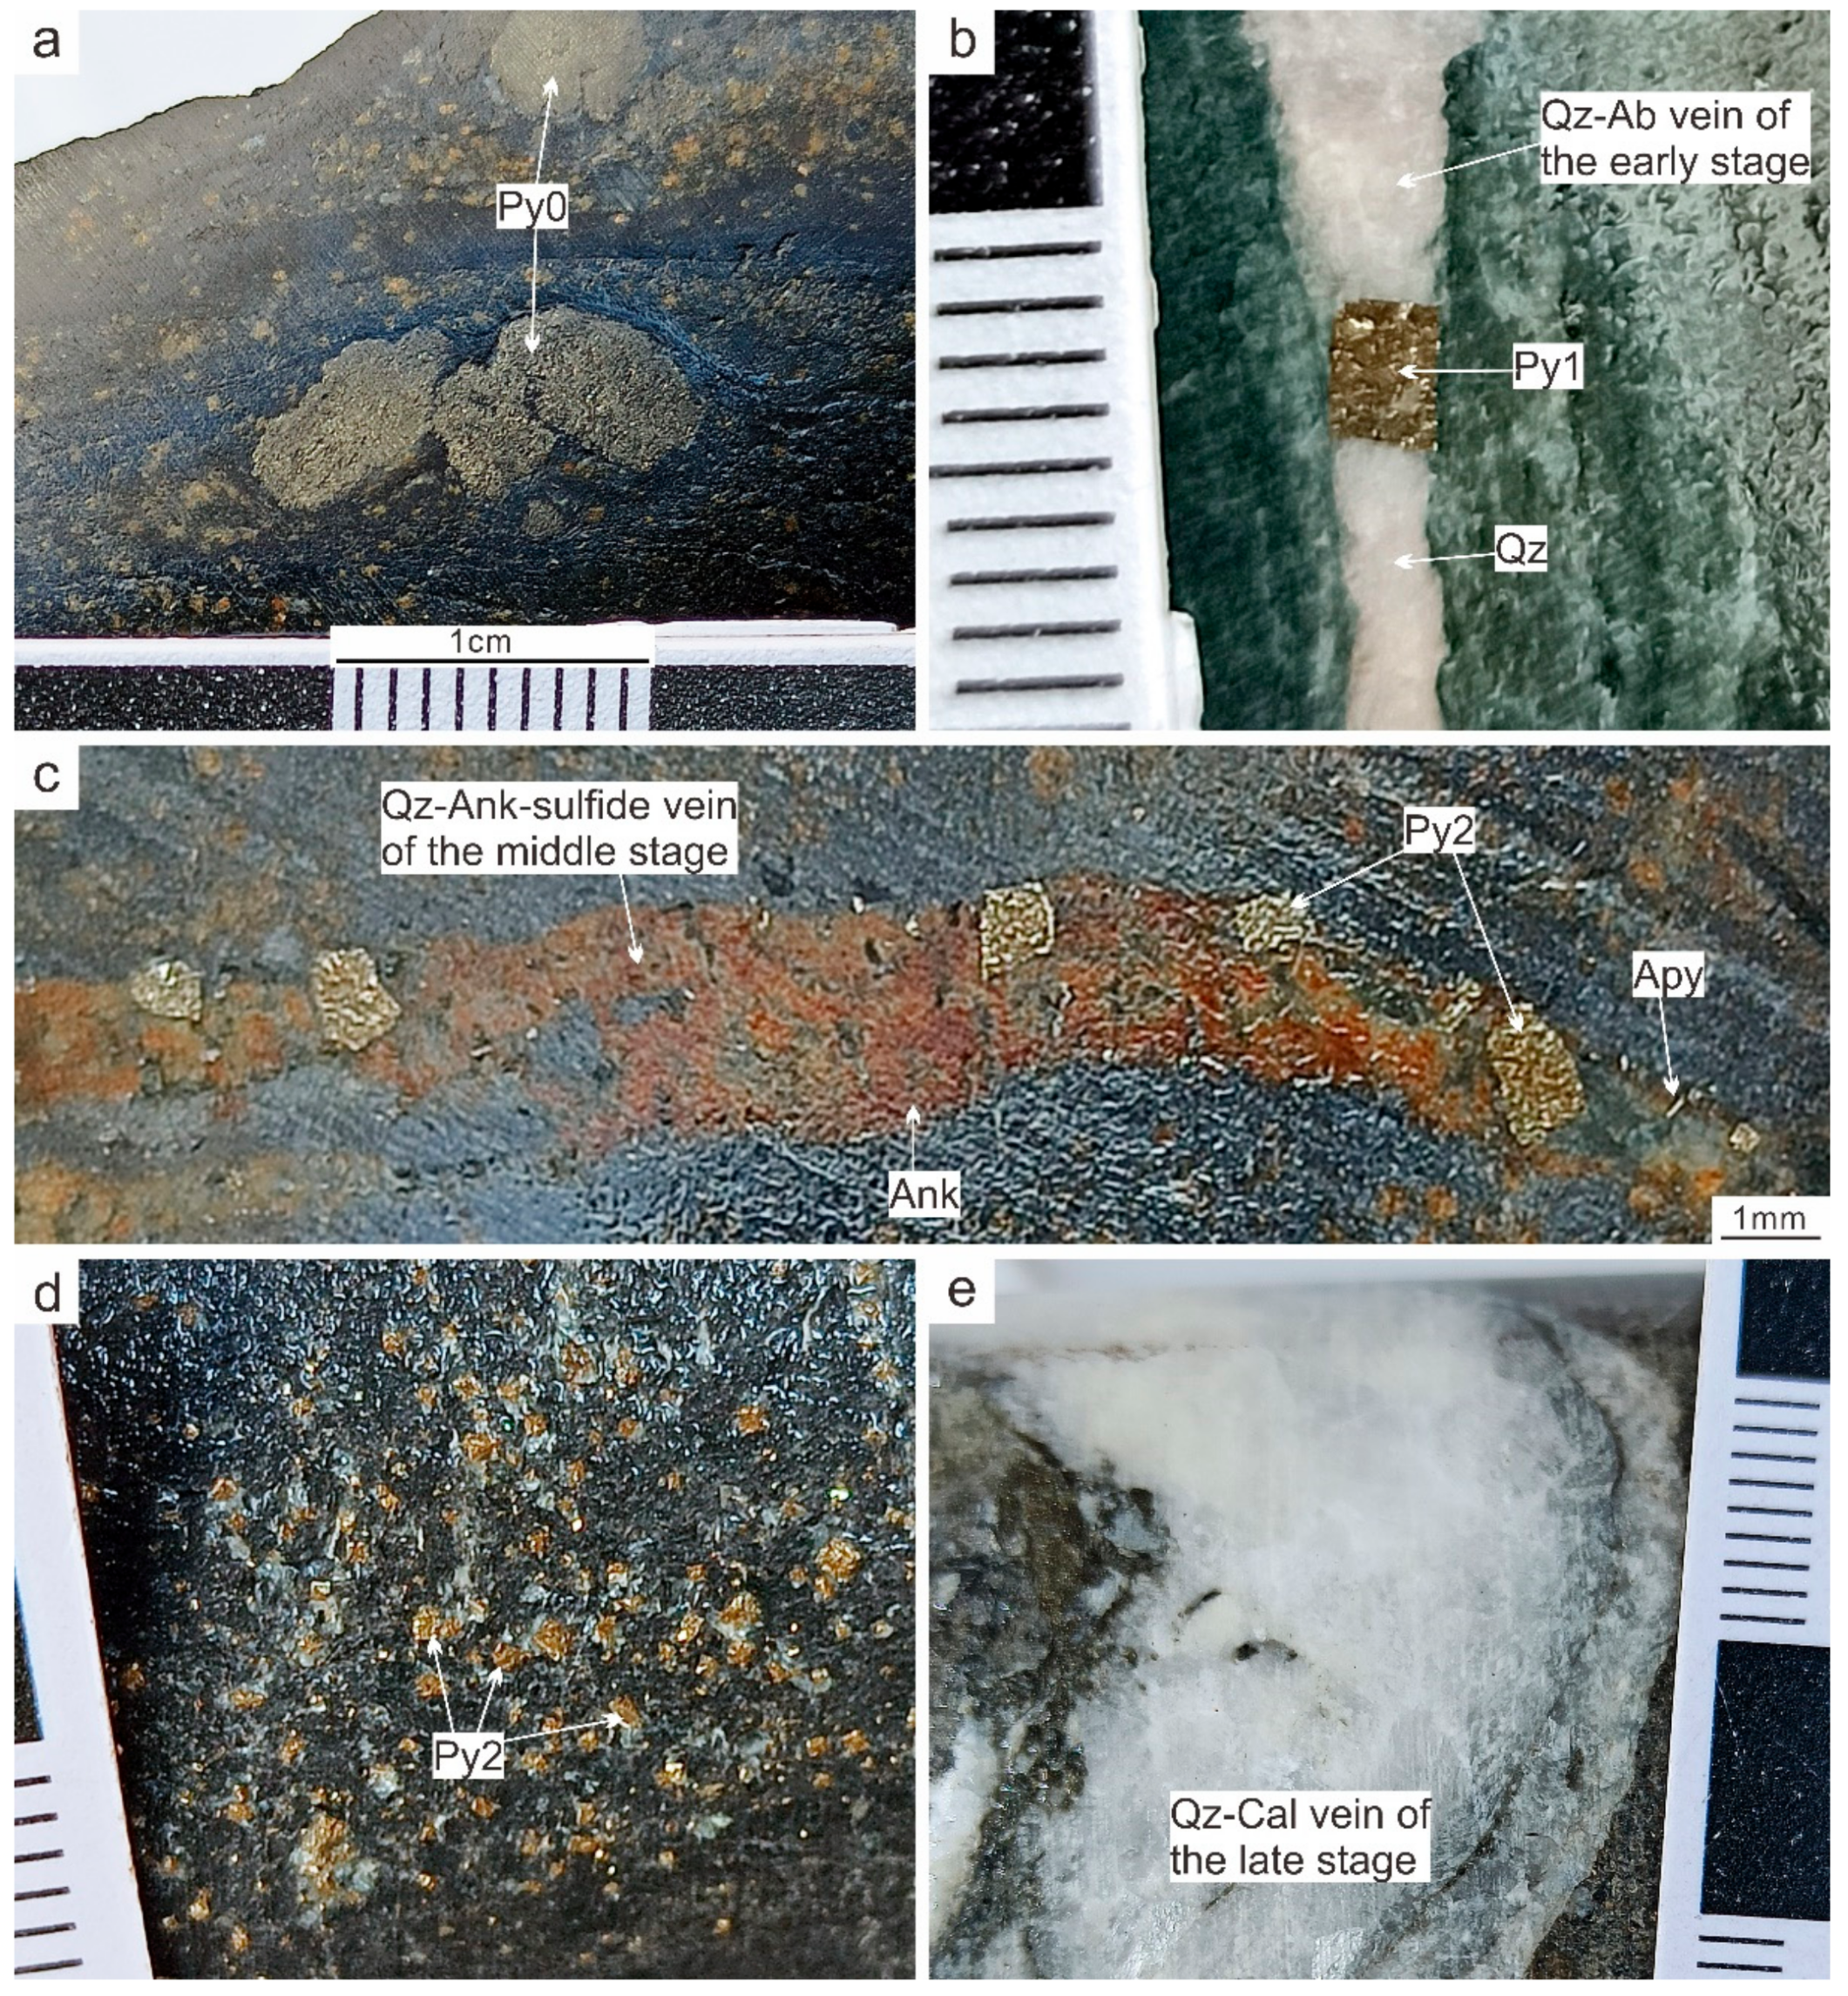
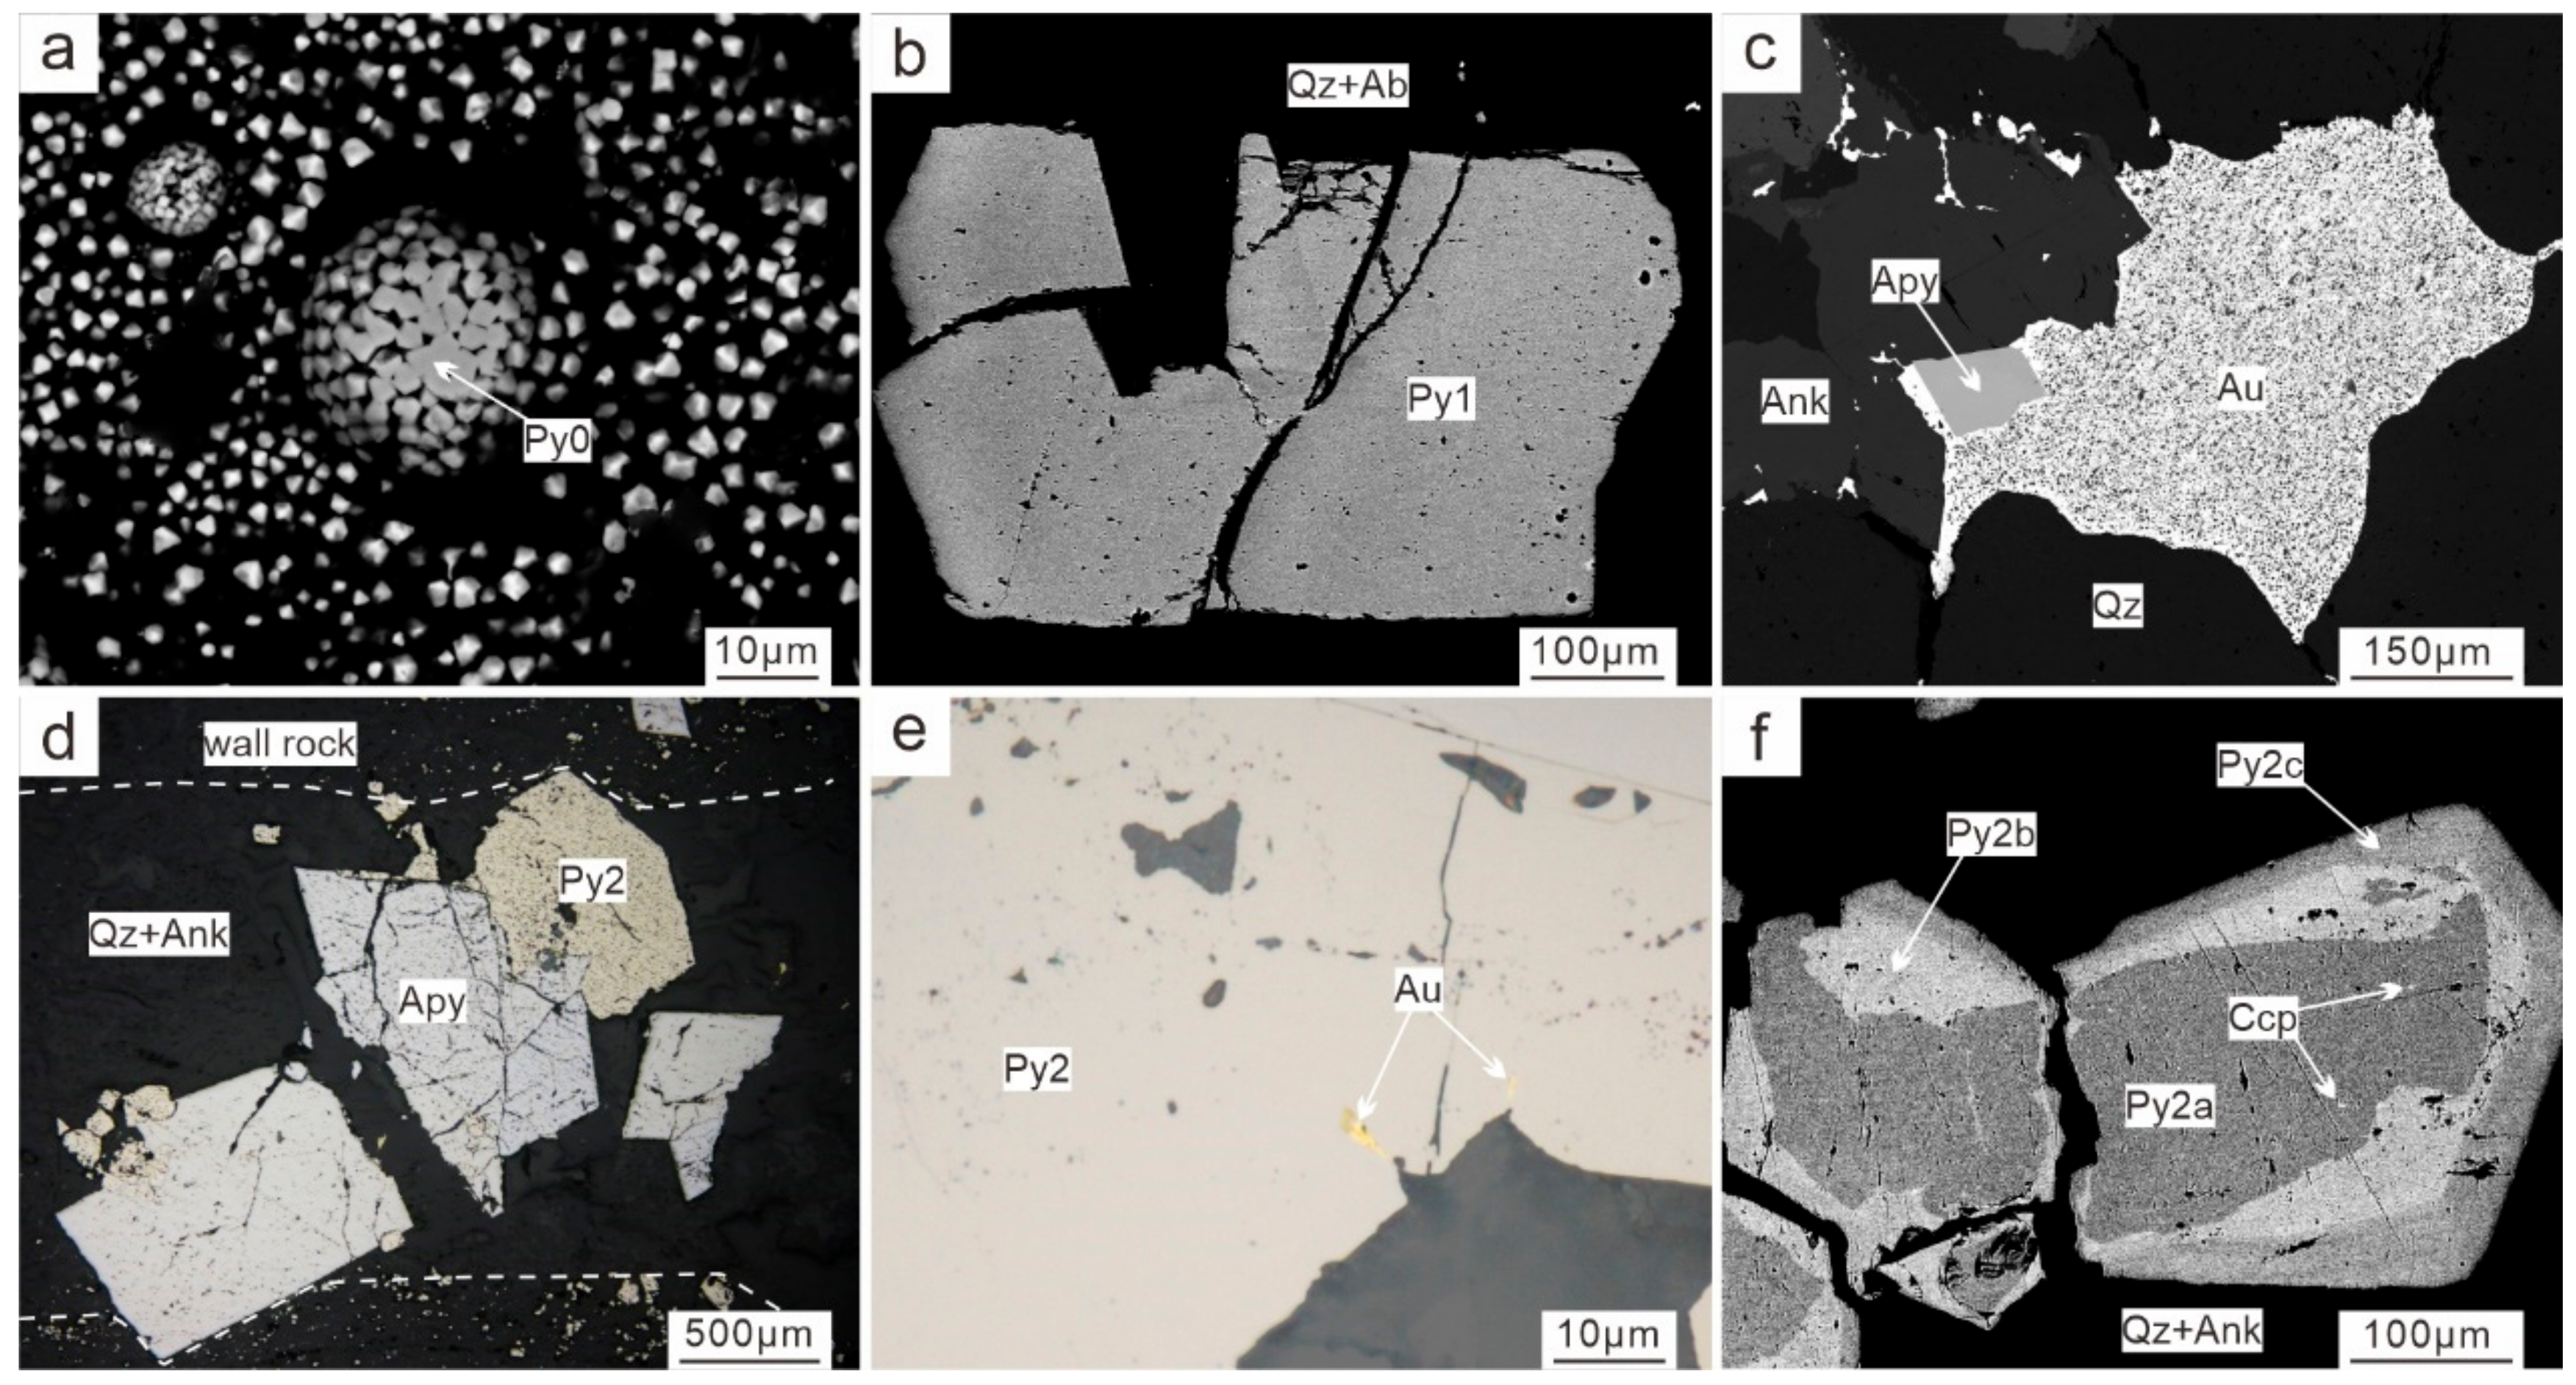
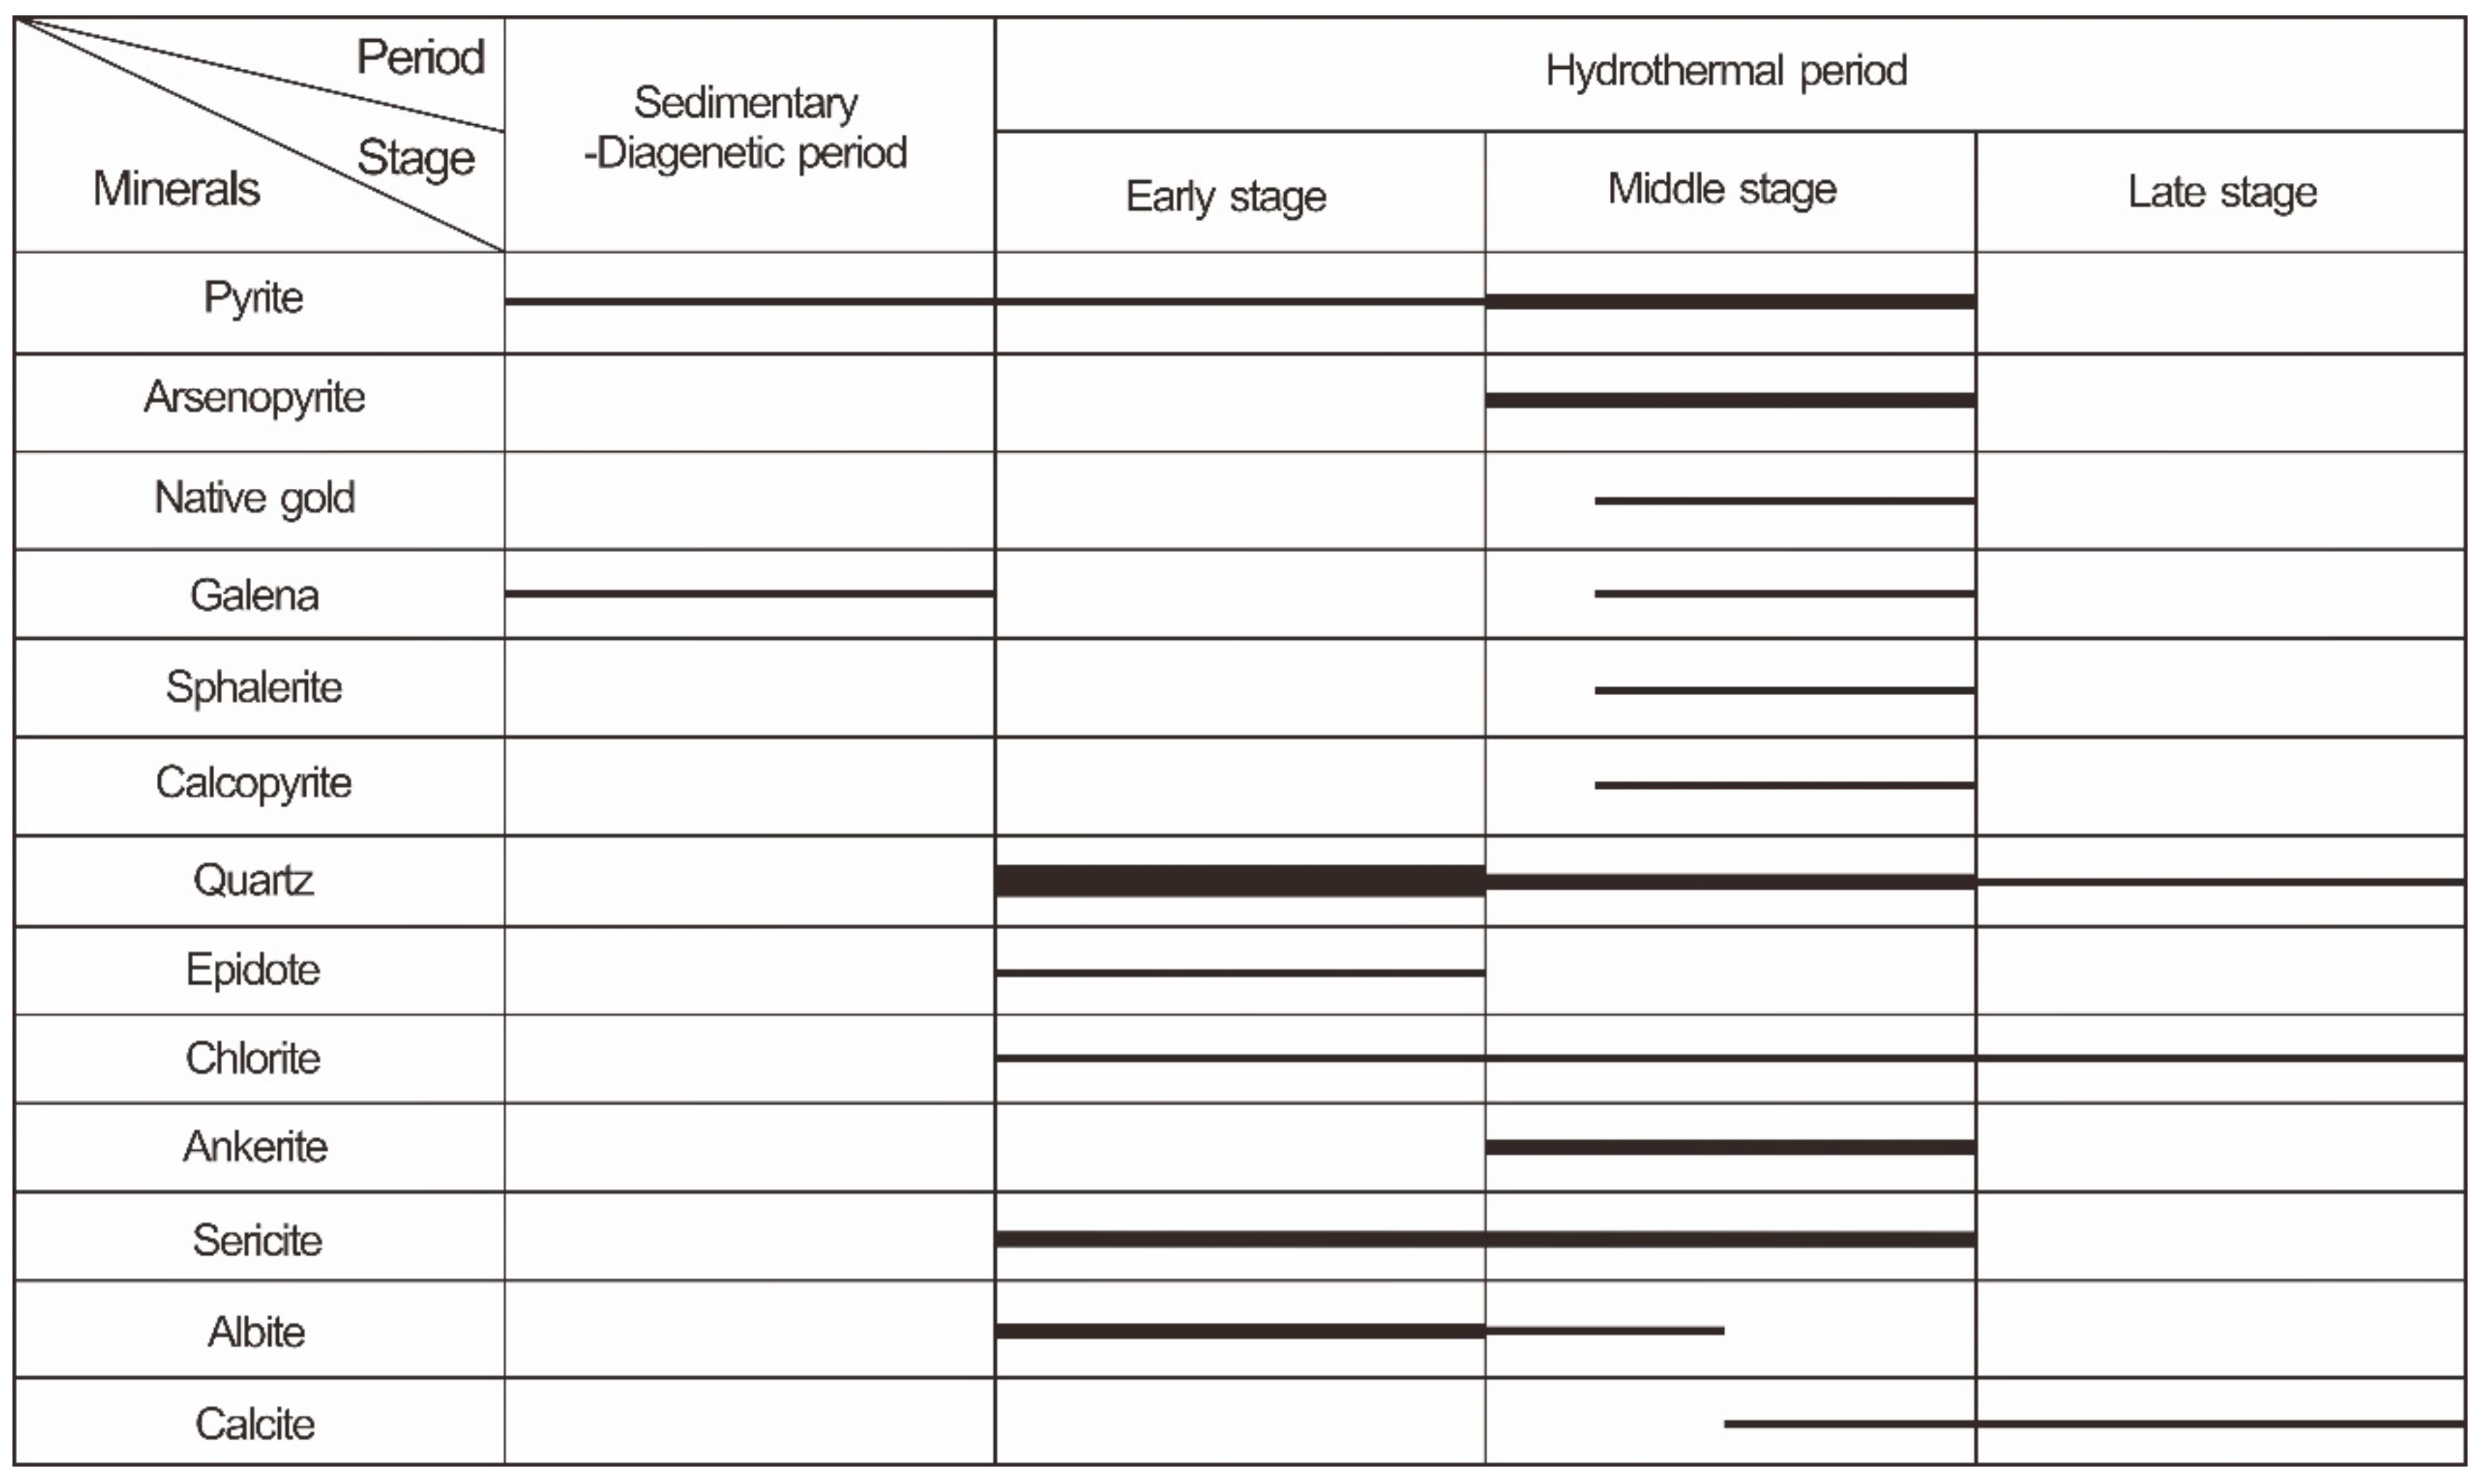
The ore-forming process can be divided into two periods, including sedimentary–diagenetic and hydrothermal periods. The former is pre-ore and characterized by the growth of strata-bound pyrite framboids and nodules (Figure 4a). The latter can be further divided into three stages based on the cross-cutting relationships between the veins in field and hand specimens, mineral assemblages, and their microscopic characteristics (for details, see [34,35]). The early stage is characterized by the formation of milky and barren quartz–albite veins (Figure 4b). The middle stage is characterized by veinlets of quartz + ankerite + pyrite + polymetallic sulfides and disseminated fine-grained sulfides in host rocks (Figure 4c,d). The late stage is characterized by barren quartz–calcite veinlets (Figure 4e), commonly cross-cutting the earlier-formed quartz veins. Pyrite was selected for more detailed systematic research as it is the predominant gold-bearing mineral throughout all stages of ore-forming processes. Using microscopy and backscattered electron imaging (BSE), five types of pyrite, including Py0, Py1, Py2a, Py2b, and Py2c, have been identified based on morphology, grain size, texture, and paragenetic sequence (Figure 5).
Py0 is a pre-ore formed during the sedimentary–diagenetic period. Py0 usually presents in the shape of a framboid and colloid with its size ranging from 2 to 50 μm, occurring in volcano-sedimentary host rocks (Figure 5a). Py0 can also occur as pyrite nodules, which are composed of fine-grained pyrite framboids. The size of these nodules can vary from 1 mm to 1 cm and are distributed parallel to the strata beddings (Figure 4a). Py0 also coexists with some other sedimentary sulfides, e.g., galena [34].
Py1 was formed during the early stage of the hydrothermal period. Py1 is generally coarse-grained with its size ranging from 0.4 to 4 mm, occurring in early-stage milky quartz ± albite veins (Figure 4b). Py1 is a euhedral to subhedral, mainly cubic crystal. The backscattered electron images show that Py1 is inherently homogeneous with no notable zonal texture. There are few sulfide inclusions in Py1 (Figure 5b).
Py2 was formed during the middle stage of the hydrothermal period. Py2 is subhedral to anhedral with its size varying a lot, occurring in middle-stage quartz-ankerite–sulfide veins and disseminated in the alteration halo (Figure 4c,d). Arsenopyrite is euhedral and rhombic and commonly develops a cataclastic texture. Py2, arsenopyrite, and native gold often intergrow or coexist, indicating that they were formed nearly simultaneously (Figure 5c,d). Native gold often fills in the crystal fissures of quartz and ankerite or occurs in Py2 as inclusions (Figure 5c,e). Most of the Py2 produced in quartz–sulfide veins shows a pyritohedron and/or cubic crystalline form with its size mainly being between 0.2 and 1 mm. Py2 with relatively larger sizes is commonly cataclastic due to stress and deformation. The backscattered electron images show that Py2 is heterogeneous, comprising a dark core (Py2a), a bright mantle (Py2b), and a narrow, medium-brightness rim (Py2c) (Figure 5f). Py2a is rich in sulfide inclusions, such as galena, sphalerite, and chalcopyrite, and is generally replaced with Py2b, which is characterized by its irregular border and relict texture. The boundary between Py2b and Py2c is straight and distinct, indicating that Py2c overgrew on Py2b with little replacement. The mineral paragenesis sequence is shown in Figure 6.

4. Sampling and Analytical Methods

4.1. Sampling Procedure

Over 200 gold-bearing ore samples covering 32 drill holes in the no. 16 to 23 exploration lines were collected from the Dunbasitao gold deposit for further studies. The thick sections of these samples were first examined using a microscope, and then BSE imaging was used to characterize the internal textures and discriminate between different types of pyrite. Microscopy and BSE observations were carried out in the Key Laboratory of Orogenic Belts and Crustal Evolution of the Ministry of Education, Peking University, Beijing, China. Moreover, finally, five representative samples were selected for electron probe X-ray microanalyzer (EPMA) and laser ablation–inductively coupled plasma–mass spectrometer (LA-ICP-MS) analyses (Table 1).

4.2. EPMA Major Elements Analysis

Major elements (wt%) in minerals were measured with a JEOL JXA-8230 electron microprobe at the Shandong Institute of Geological Sciences, Jinan, China. The operating conditions were a 20 kV accelerating voltage, 20 nA beam current, and 1 μm beam spot. The standards used were natural minerals and synthetic compounds, including pyrite (S, Fe), arsenopyrite (As), sphalerite (Zn), galena (Pb), chalcopyrite (Cu), gold (Au), silver (Ag), antimony telluride (Te, Sb), bismuth selenide (Bi, Se), pentlandite (Ni), and cobalt (Co).

4.3. LA-ICP-MS Trace Elements Analysis and Mapping

Trace elements analysis and the mapping of pyrite were conducted at Guangzhou Tuoyan Analytical Technology Co., Ltd., Guangzhou, China, using an NWR 193 nm ArF Excimer laser ablation system coupled to an iCAP RQ (ICP-MS). NIST 610 standard glass was used to tune the ICP-MS to yield low oxide production rates [61]. Helium carrier gas was fed into the ablation cell at a rate of 0.7 L/min, and subsequently, the aerosol was mixed with 0.89 L/min of Ar make-up gas. For spot analysis, the laser fluence was 5 J/cm2, with a repetition rate of 6 Hz, a 30 μm spot size, and a 40 s background measurement, followed by an analysis time of 40 s. For mapping, the laser fluence was 5 J/cm2, with a repetition rate of 20 or 30 Hz and a 5 or 8 μm spot size with a laser scan speed of 15 or 20 μm/s. The freeware IOLITE package of Paton et al. [62] was used to run the “TRACE ELEMENTS” data reduction scheme (DRS) for reducing the raw isotope data. User-defined time intervals were established in IOLITE for the baseline correction procedure to calculate session-wide baseline-corrected values for each isotope. Two glass standards blocks (one NIST 610 and one GSE-2G) and one MASS-1 sulfide standard analysis were followed by five to eight unknown samples for both spot analysis and mapping. A total of 26 isotopes were monitored: 34S, 47Ti, 51V, 53Cr, 55Mn, 57Fe, 59Co, 60Ni, 65Cu, 66Zn, 75As, 77Se, 97Mo,107Ag,111Cd, 118Sn, 121Sb, 126Te, 135Ba, 184W, 197Au, 202Hg, 205Tl, 208Pb, 209Bi, and 238U. The dwell time of each isotope was 10 ms for the spot analysis with a total of 260 ms and 5 ms for the mapping with a total of 130 ms. 34S, 51V, 53Cr, 55Mn, 57Fe, 59Co, 65Cu, 66Zn, 75As, 77Se, 97Mo,107Ag,111Cd, 118Sn, 121Sb,126Te,197Au, 202Hg, 205Tl, and 209Bi were calibrated using the MASS-1 sulfide standard (Fe = 15.60%; [63]), while 60Ni, 47Ti, 135Ba, 184W, 208Pb, and 238U were corrected using the GSE-2G (7.55% Fe) synthetic basaltic glass standard prepared using the material developed by Myers et al. [64]. All LA-ICP-MS analysis spot positions were one-to-one and corresponded to those of the EPMA to ensure the trace element analysis results could be precisely corrected using the internal standard of 57Fe based on EPMA data. For the mapping, all the isotopes were corrected using the internal standard of 57Fe (Fe = 46.60%).

5. Results

5.1. EPMA Major Element Compositions of Pyrites

The EPMA analysis results (Table S1) show that pyrites from the Dunbasitao gold deposit have significant differences in major element contents. Py0 has a relatively low Fe content (42.95–45.74 wt%, with an average of 44.86 wt%), S content (50.98–53.73 wt%, with an average of 52.67 wt%), and As content (<0.12 wt%, with an average of 0.05 wt%). A total of 2 of the 17 analysis points yielded total contents lower than 95.00 wt%, which was possibly due to the uneven surface of Py0 resulting from its special texture. The major element contents of Py1 are close to the theoretical values (Fe: 46.67%; S: 53.33%), with an Fe content ranging from 45.44 to 46.50 wt%, with an average of 46.06 wt%, and a S content ranging from 50.20 to 54.20 wt%, with an average of 53.44 wt%. The As content in Py1 is extremely low, as most of the data are below the detection limit (bdl). The Fe content in Py2a ranges from 45.07 to 45.75 wt%, with an average of 45.38 wt%, and the S content ranges from 53.18 to 53.91 wt%, with an average of 53.53 wt%. The As content in Py2a is also low, as half of the data are below the detection limit. Py2b has a low Fe content (43.96–45.44 wt%, with an average of 44.70 wt%), low S content (51.21–52.00 wt%, with an average of 51.63 wt%), and significantly high As content (2.35–2.98 wt%, with an average at 2.59 wt%). The Fe content in Py2c ranges from 44.34 to 45.95 wt%, with an average of 45.35 wt%, its S content ranges from 51.92 to 53.60 wt%, with an average of 52.88 wt%, and its As content ranges from 0.52 to 1.54 wt%, with an average of 0.90 wt%, which are lower than those in Py2b but significantly higher than those in Py0, Py1, and Py2a.

5.2. LA-ICP-MS Trace Element Compositions of Pyrites

The representative trace element contents of the different types of pyrite determined using LA-ICP-MS are listed in Table 2. The measured data include 17 spot analyses of Py0, 24 of Py1, 6 of Py2a, 12 of Py2b, and 12 of Py2c. All the results of the spot analysis data covering 26 analyzed elements are available in Table S2. For those spots whose contents were below the detection limit, half of the bdl was taken as the estimated value. Considering that many spots analyses yield abnormally high values, medians instead of averages was used to discuss to ensure data representativeness. Figure 7 shows the representative LA-ICP-MS time-resolved depth profiles of the different pyrites. The boxplot of representative trace element contents for the different pyrite types is presented in Figure 8.
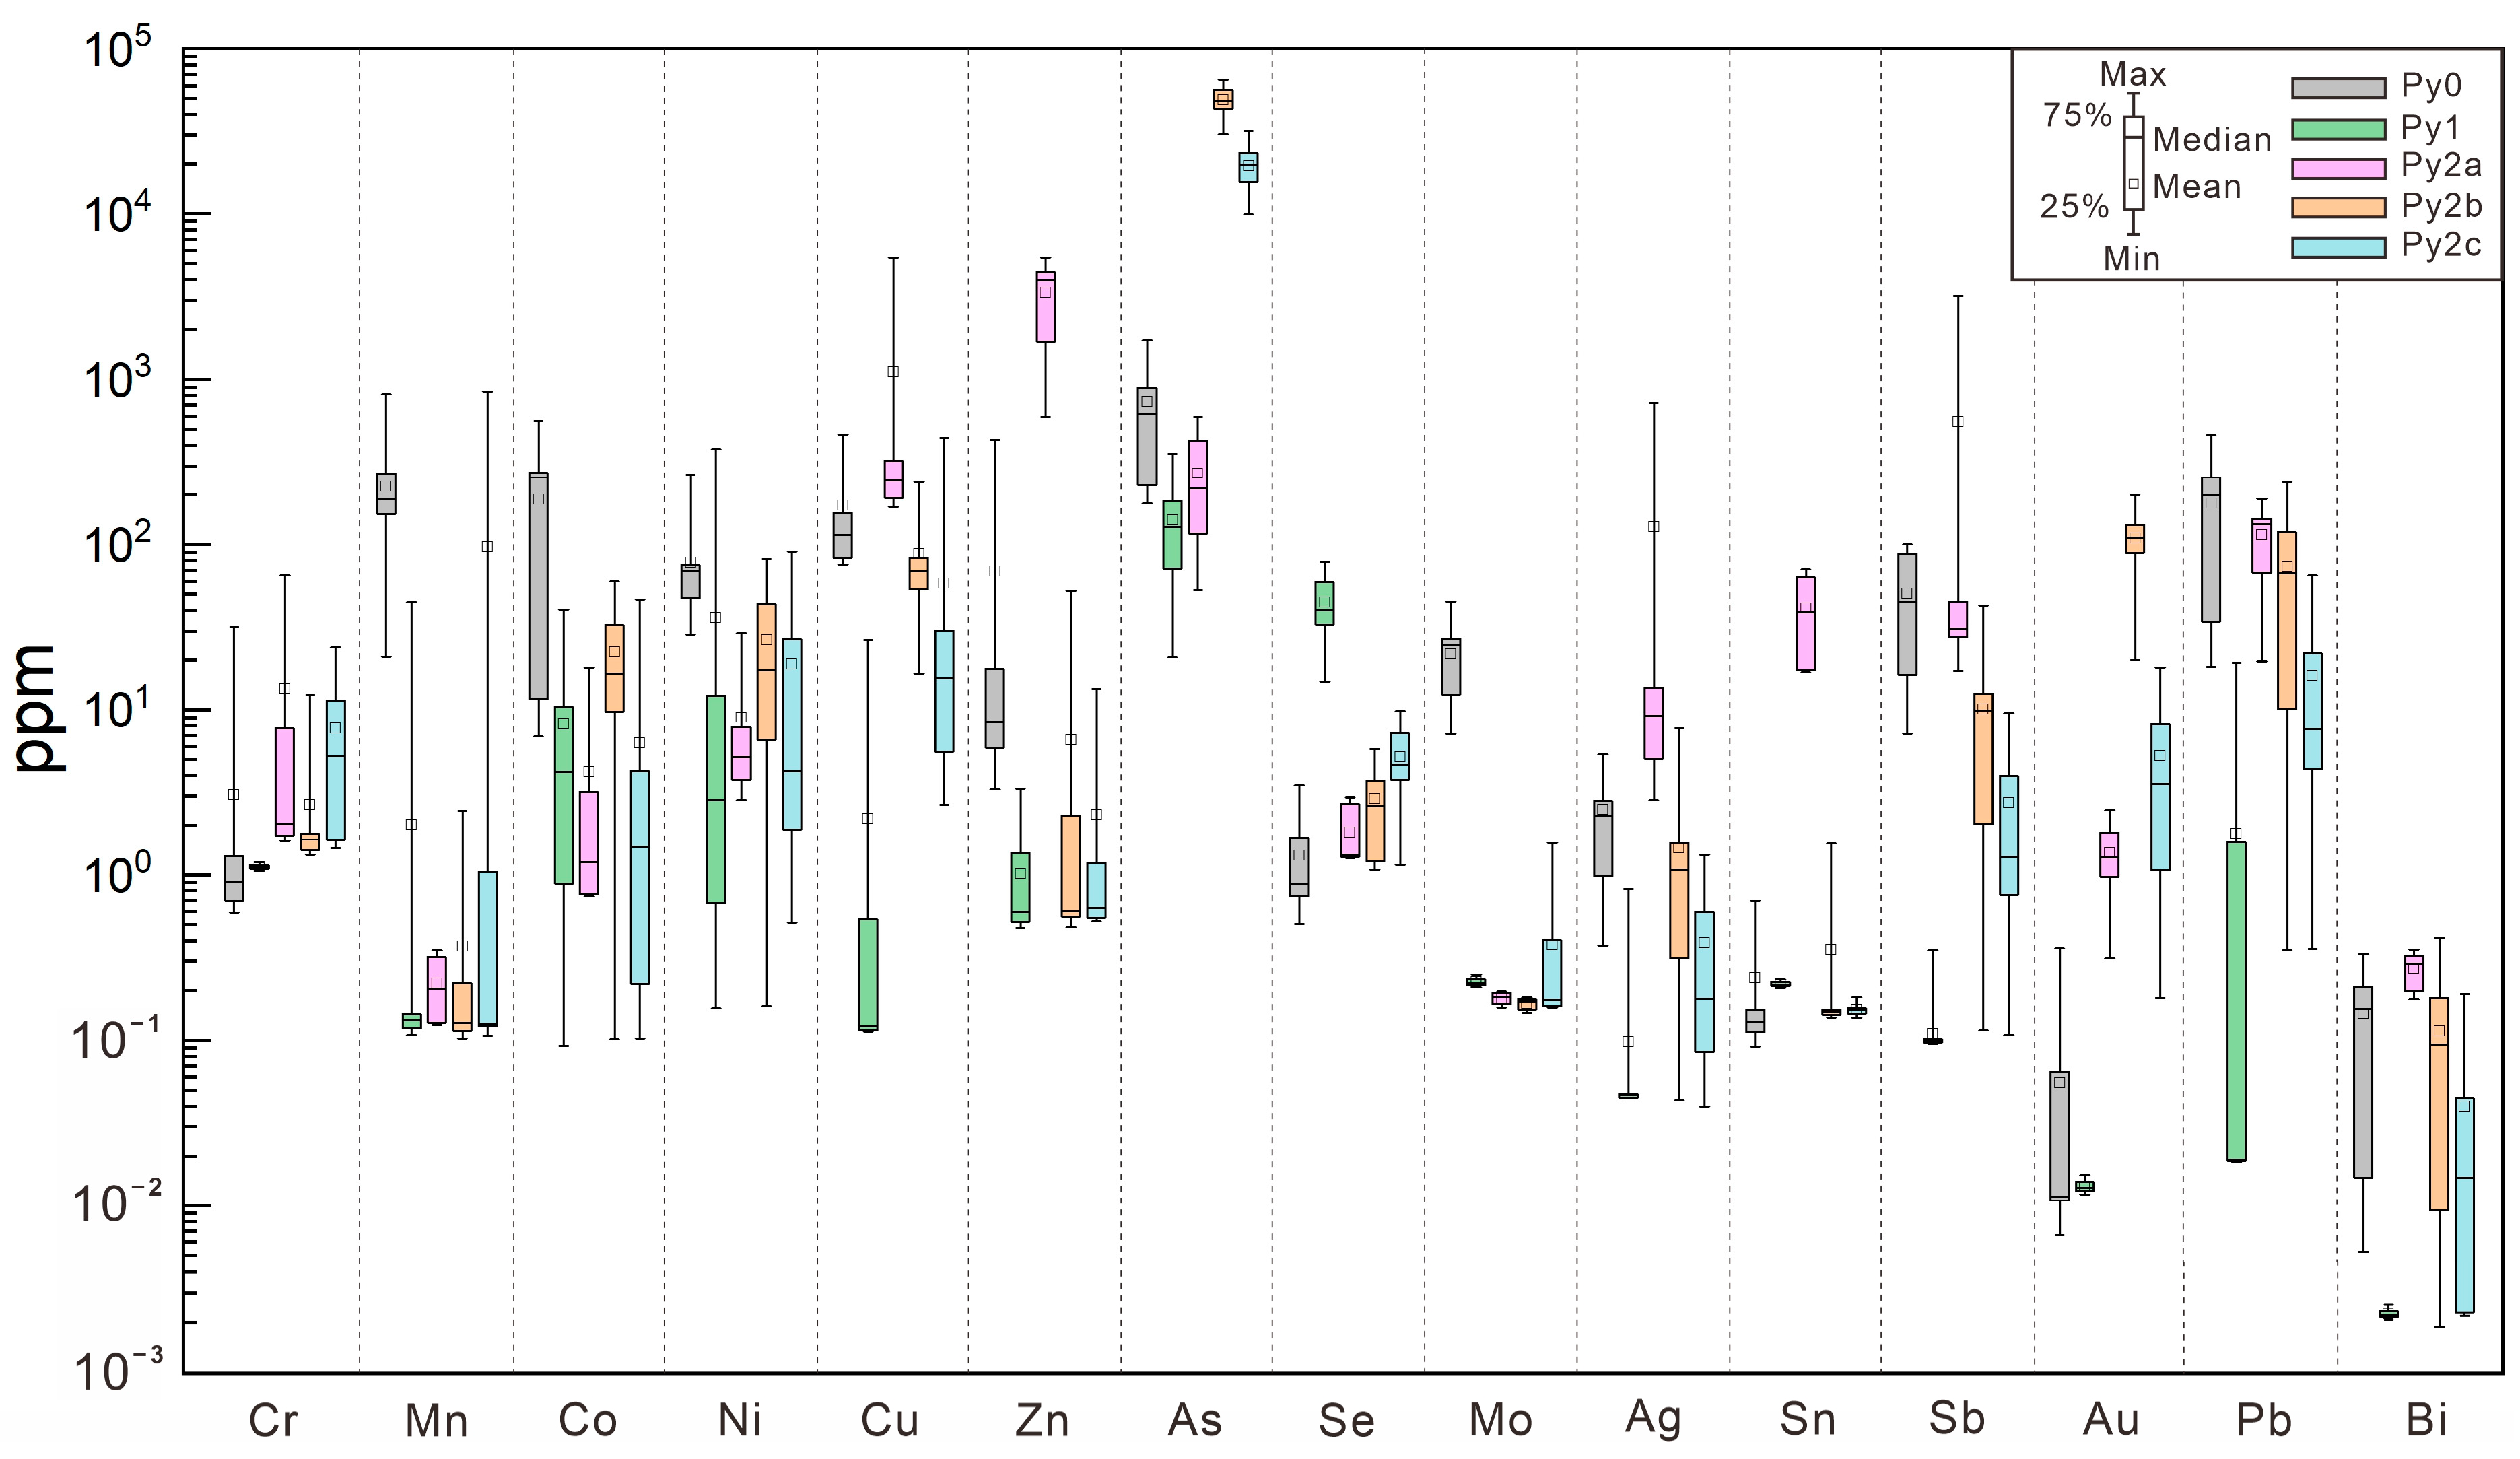
LA-ICP-MS revealed that Py0 contains the most abundant amounts of Mn, Co, Ni, Mo, Sb, and Pb (Table 2, Figure 8). Py0 also contains considerable amounts of other trace elements, such as As, Cu, Ni, and Ag. The Au content in Py0 ranges from 0.01 to 0.36 ppm, with a median of 0.01 ppm. Abnormal spikes in the LA-ICP-MS trace element contents indicate the presence of micro-inclusions of minerals containing those elements (e.g., 159 ppm for Ti; Table S2).
Py1 is fairly pure, containing only small amounts of trace elements, and most of the trace element contents in Py1 are the lowest among all the pyrite types, such as Cr, Ni, Cu, Zn, As, Ag, Sb, Au, Pb, and Bi. The Au contents in most of the Py1 spot analyses were below the detection limit. It is worth noting that the Se content in Py1 is the highest among all the pyrite types, ranging from 14.9 to 78.8 ppm, with a median of 40.0 ppm (Table 2, Figure 8). Ti-bearing inclusions were also detected in Py1 (e.g., 1381 ppm for Ti; Table S2).
Py2a has the highest Cu, Zn, Ag, Cd, Sn, and Bi contents. The Au content in Py2a varies from 0.31 to 2.48 ppm, with a median of 1.27 ppm, which is significantly higher than those in Py0 and Py1 (Table 2, Figure 8). Py2b has significantly abundant Au (20.1–201 ppm, with a median of 110 ppm) and As (30,139–65,265 ppm, with a median of 48,363 ppm) contents, which are notably higher than those in all the other pyrite types. Py2b is also rich in Co, Ni, Cu, Sb, and Pb. Py2c has considerable Au (0.18–18.0 ppm, with a median of 3.57 ppm) and As (9894–31,654 ppm, with a median of 19,751 ppm) contents. In addition, Py2c contains relatively abundant Cr, Se, and Mo. For most of the spot analyses of all the types of pyrite from the Dunbasitao gold deposit, the Ti, V, Cd, Te, Ba, W, Hg, Tl, Bi, and U contents are extremely low (overwhelmingly lower than 1 ppm).

5.3. LA-ICP-MS Trace Element Mapping of Pyrites

Considering Py2 is the most important gold-bearing type of pyrite, one representative Py2 grain produced in a quartz–ankerite vein was selected for LA-ICP-MS trace element mapping to reveal its internal compositional texture. The evident textural zoning on the As and Au maps outlines the core (Py2a), the mantle (Py2b), and the rim (Py2c) of the Py2 grain, which is perfectly consistent with the internal texture revealed in the BSE image (Figure 5f). Py2a is characterized by depletion in As and Au but enrichment in a variety of trace elements compared with Py2b and Py2c, e.g., Cu, Zn, Ag, Sn, Sb, Pb, and Bi (Figure 9). The local high enrichments in Cu indicate chalcopyrite inclusions. The distribution characteristics of As and Au correlate well, both of them increasing by approximately two orders of magnitude from Py2a to Py2b. Py2b is also rich in Co and Ni, and their elevated content distributions are similar to those of As and Au. The Cu content in Py2b is lower than in Py2a by one order of magnitude. Py2b is depleted in Zn, Ag, Sn, Sb, Pb, and Bi compared with Py2a. The As and Au contents in Py2c are higher than in Py2a but lower than in Py2b. Py2c is characterized by depletion in many trace elements including Co, Ni, Cu, Zn, Ag, Sn, Sb, Pb, and Bi. The contents of Zn, Ag, Sn, Sb, Pb, and Bi show no significant changes from Py2b to Py2c.

6. Discussion

6.1. Trace Element Incorporation and Occurrence in Pyrites

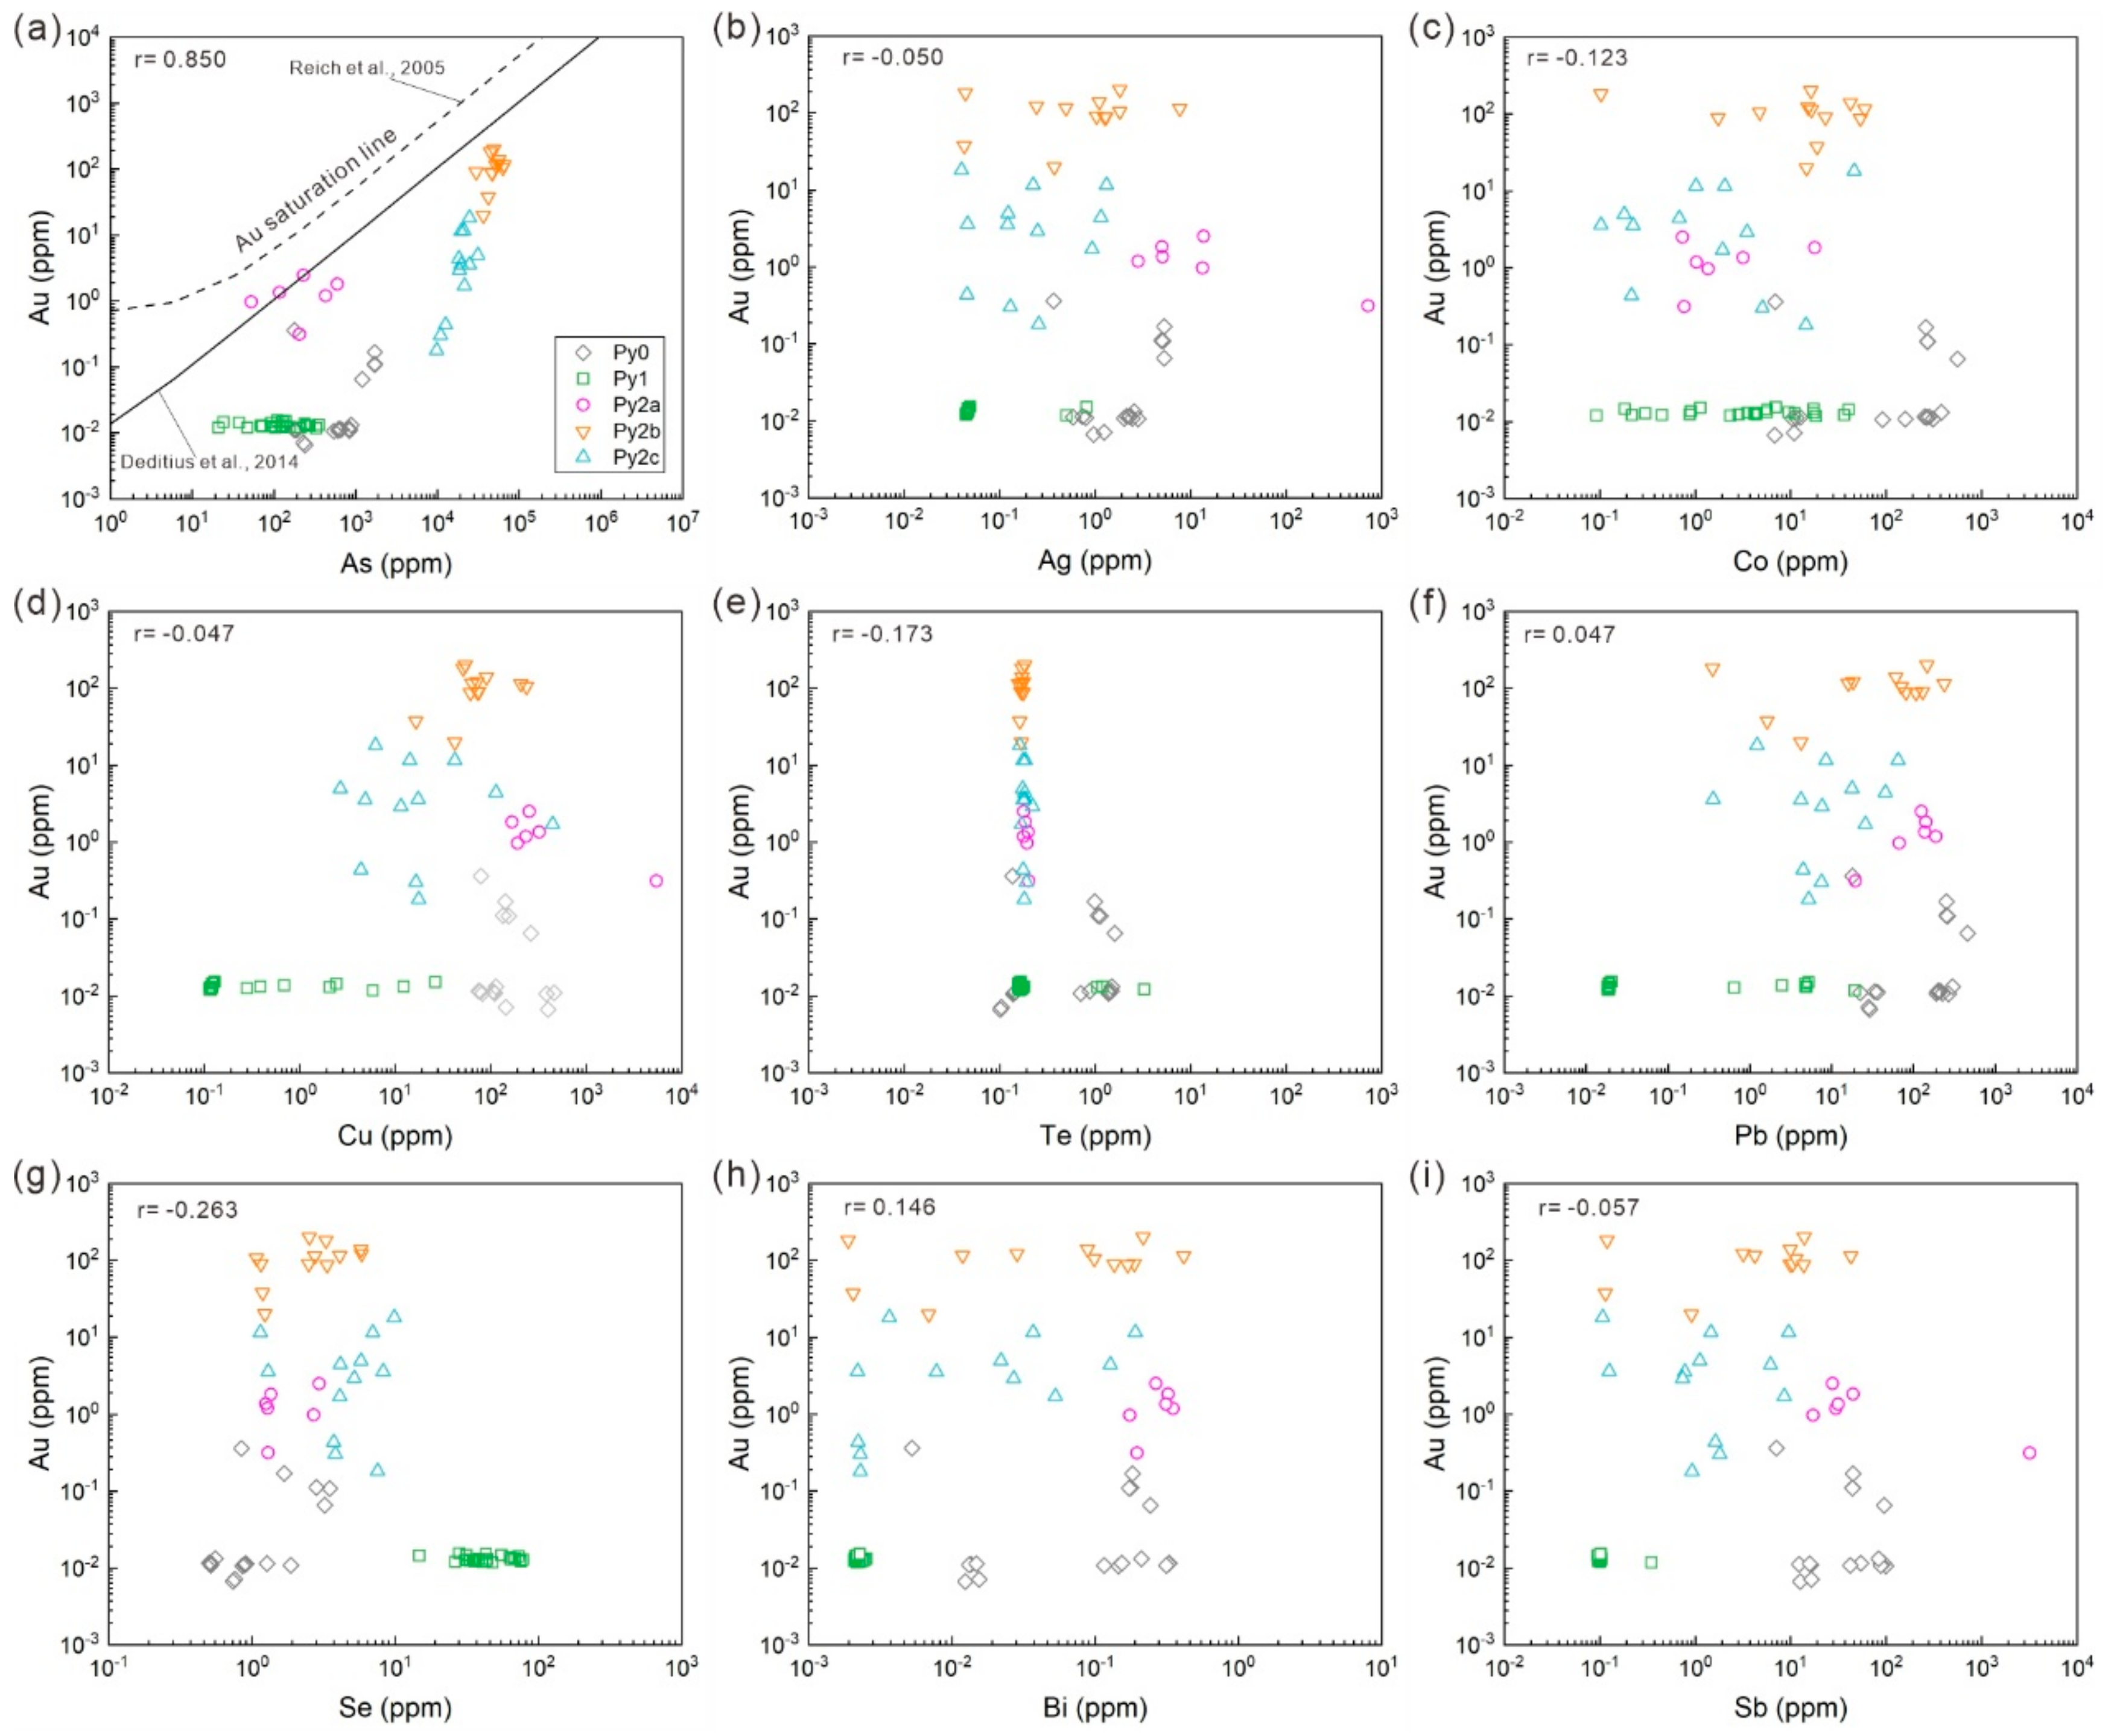
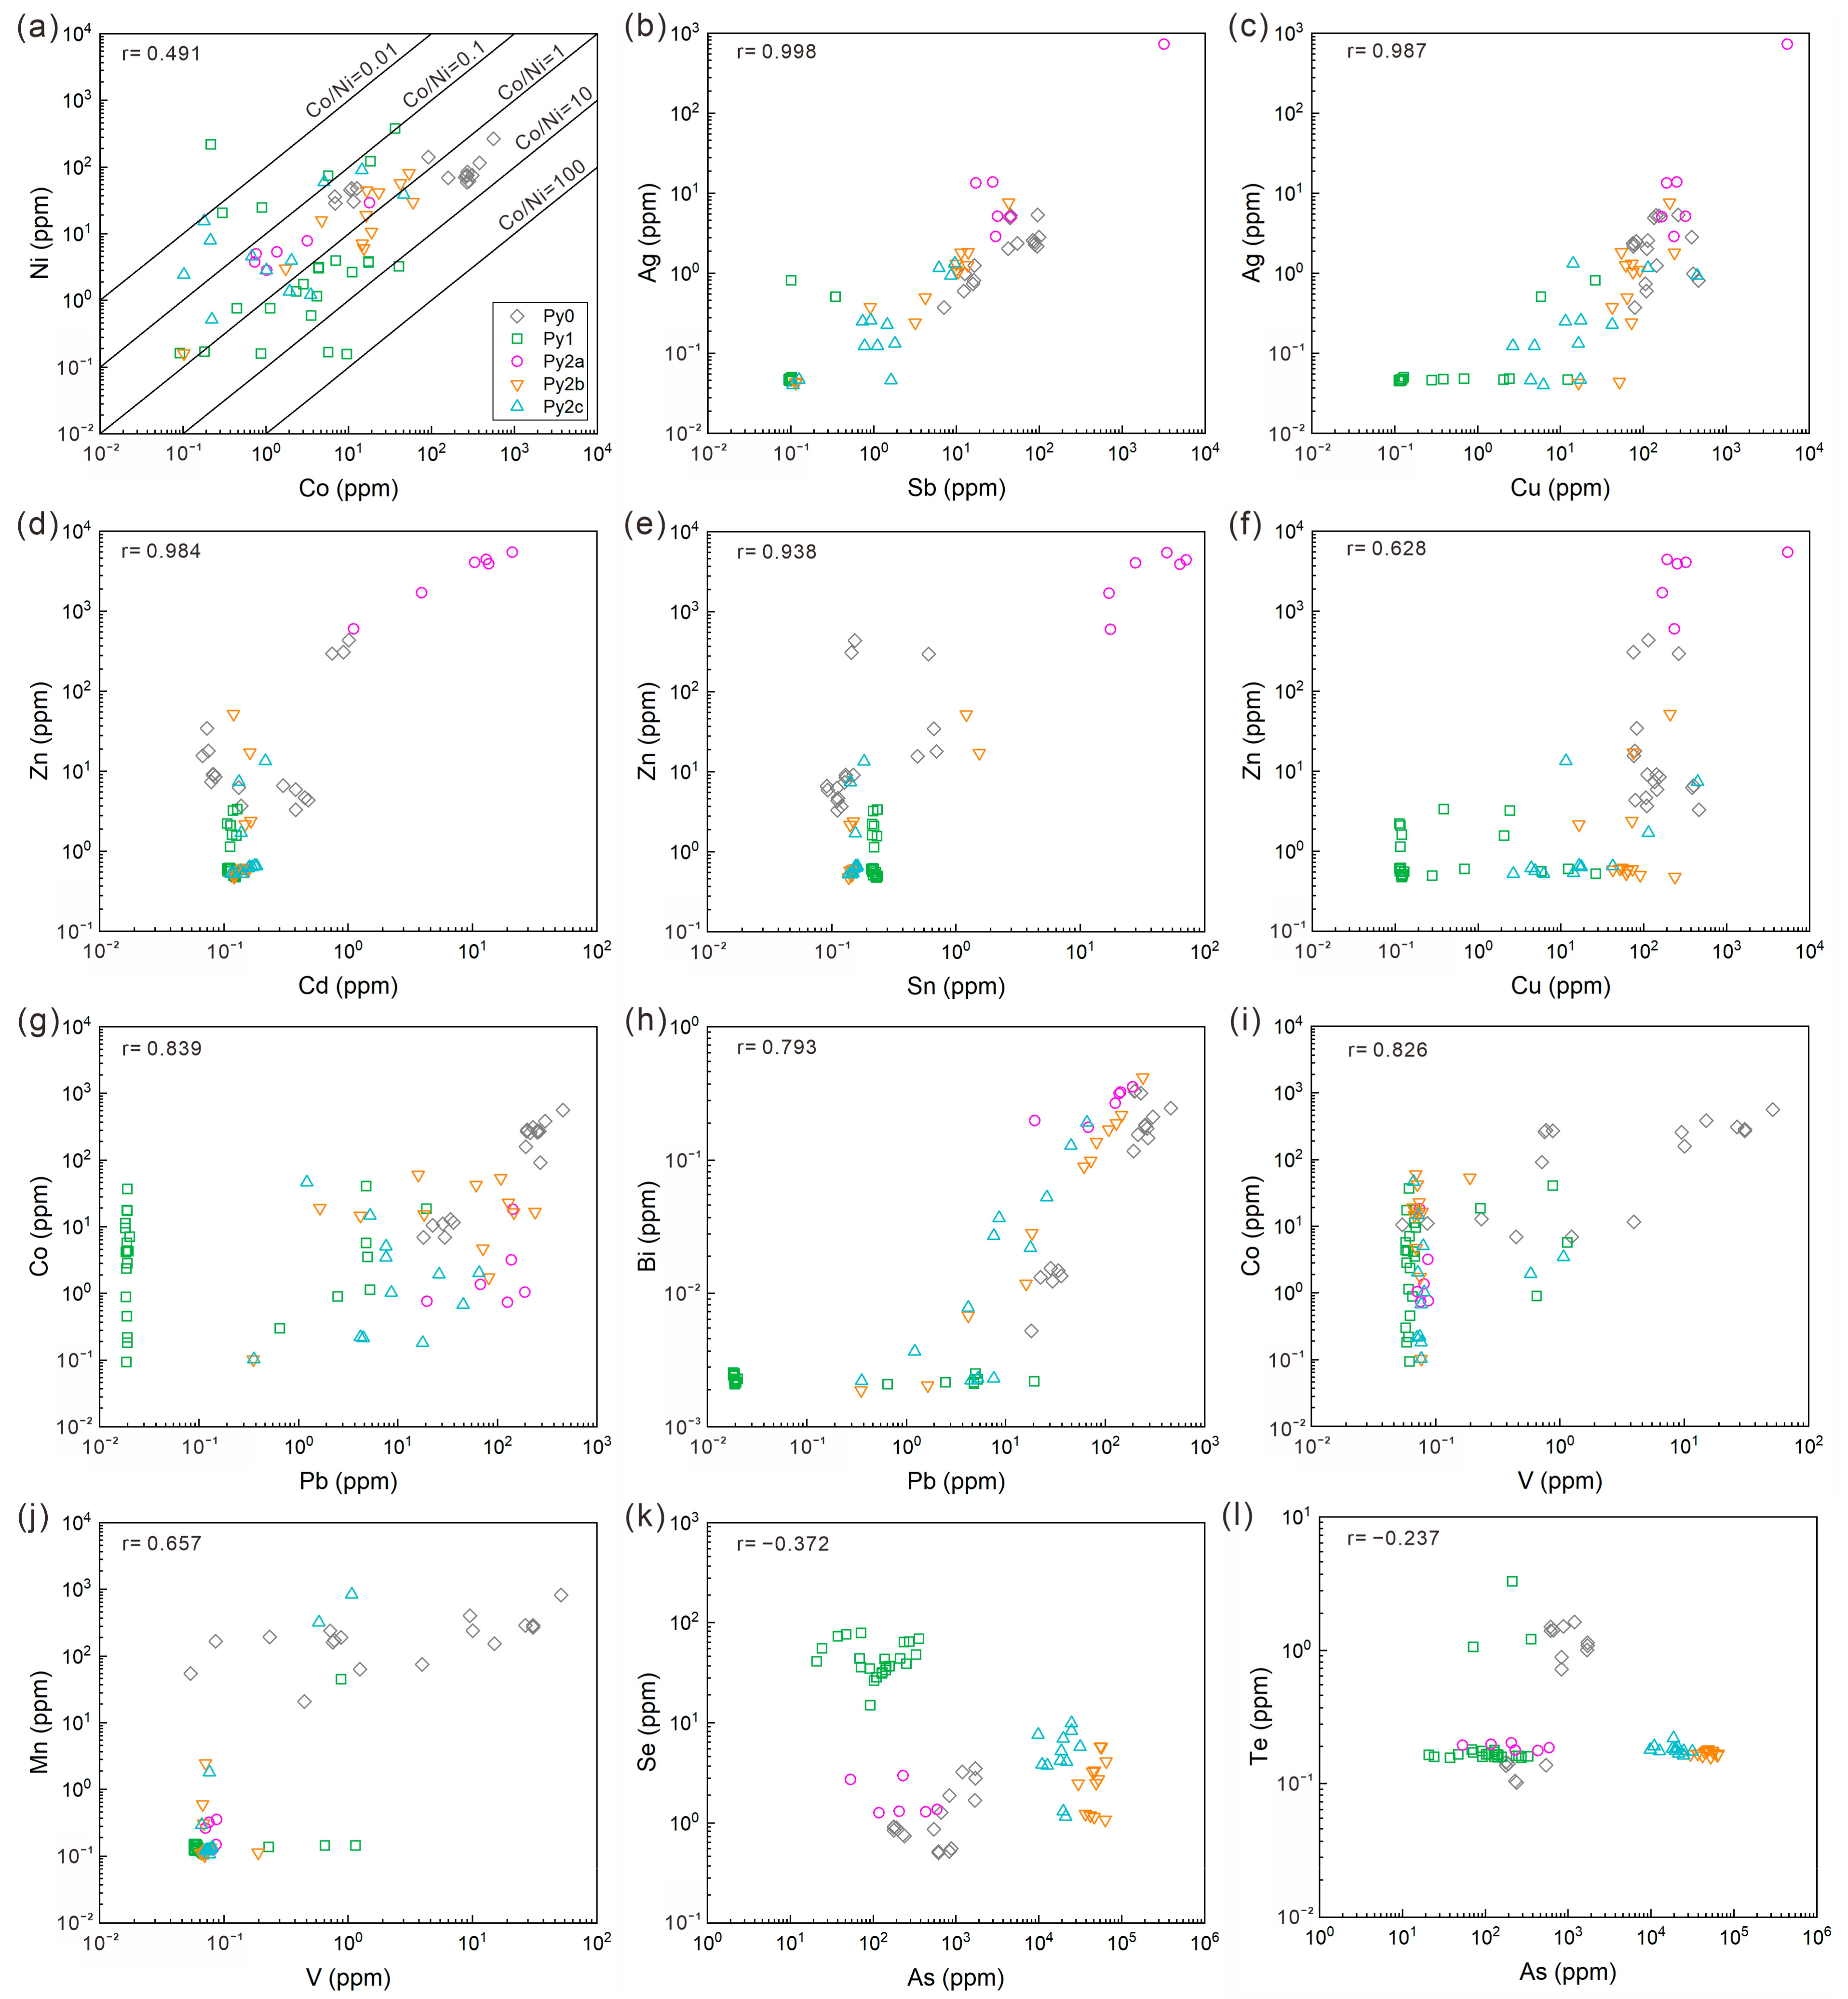
The linear correlation coefficients (r) of the different elements in the pyrites from the Dunbasitao gold deposit were calculated and are available in Table S3. The correlations between Au and other elements for the different types of pyrite are shown in Figure 10. The contents of and correlations between selected elements for the different types of pyrite are shown in Figure 11. Three element associations were identified via correlation analysis, i.e., Au-As, V-Mn-Co-Te-Pb-Bi, and Cu-Zn-Ag-Cd-Sn-Sb-Hg. There were obvious positive correlations between each element within these associations, implying that their behavior of being introduced into the pyrites was likely synchronous (Table S3; Figure 11).
Trace elements mainly occur within pyrite in two forms: (1) as micro- to nano-sized mineral inclusions, and (2) as solid solutions within the crystal lattice [6,10,12,65]. Among all the types of pyrite, the visible gold is only distributed in Py2 and occurs as native gold inclusions (Figure 5e). The invisible gold is overwhelmingly concentrated in Py2b and Py2c, whose time-resolved depth profiles are smooth and flat (Table 2, Figure 7d–f). Combining this with most of the data points of the pyrites from the Dunbasitao gold deposit falling below the Au solubility curve, it can be inferred that invisible gold mainly occurs as solid solutions (Au+) in Py0 to Py2 (Figure 10a; [11,65]).
S and As show a strong negative correlation on the binary plot, suggesting that S may be substituted with As (Figure 12). Yang et al. [66] revealed that more than 50% of As occurs as As1− in pyrite using X-ray photoelectron spectroscopy, which indicated the incorporation of As was mainly via As1− substituting S1−. The smooth and flat time-resolved depth profiles of As for most of our pyrite samples testify that As mainly occurs as solid solutions in pyrite (Figure 7). Previous work has suggested that the substitution of S1− with As1− in pyrite could cause lattice distortion, which is beneficial for gold to enter the pyrite lattice as Au+ [67]. The incorporation of As could also lead to the local transformation of pyrite from an n-type semiconductor to a p-type, thereby enhancing its capability to adsorb Au complexes, such as Au (HS)2 [65,68]. In the Dunbasitao deposit, Au does not show any obvious correlation with other elements except for As, whose linear correlation coefficient with Au is as high as 0.850 (Figure 10), strongly indicating the substitution of S1− with As1− is probably the crucial mechanism for the incorporation of gold in pyrite.
Se and Te show weak negative correlations with As, which implies that Se and Te may be introduced into pyrite by substituting S similarly to As (Figure 11k,l; [69,70]). Most of the time-resolved depth profiles of Co and Ni are smooth, indicating that Co and Ni are structurally bound elements within pyrite and occur as solid solutions (Figure 7). Co, Ni, and Cu can be introduced via the isovalent substitution of Fe2+ with Co2+, Ni2+, and Cu2+, owing to the structural affinity of the FeS2-CoS2-NiS2-CuS2 system [13]. It is difficult for Pb to substitute directly with Fe due to its larger ionic radius than Fe2+ [18]. However, the incorporation of As in pyrite can distort the pyrite lattices, which would allow Pb to insert itself into these lattices and substitute with Fe (Fe2+ ↔ Pb2+; [71]). The incorporation of Sb and other large anions might promote the incorporation of Pb into the pyrite structure in a similar way to As promoting the incorporation of Au in pyrite [13,65]. The time-resolved depth profiles of Pb, Cu, and Sb for Py0 are smooth, indicating that Pb, Cu, and Sb mainly occur as solid solutions bounded within the crystal lattice of Py0. The time-resolved depth profiles of Pb and Cu for Py1 are spiculate, indicating that Pb and Cu mainly occur as sulfide micro-inclusions (mostly galena and chalcopyrite) within Py1. The time-resolved depth profiles of Pb, Zn, Cu, and Sb for Py2 can be smooth and/or spiculate, suggesting that these elements can occur both as sulfide micro-inclusions and solid solutions within Py2. Mn is mainly concentrated in Py0, which is consistent with the characteristics of Mn enrichment in sedimentary pyrite (Table 2; [72]). Mn can be directly substituted with Fe (Fe2+ ↔ Mn2+) due to the similar properties of Mn2+ and Fe2+, which agrees with the smooth time-resolved depth profiles of Mn for Py0 (Figure 7a; [71]). The LA-ICP-MS trace element analysis results show that Ti is concentrated in Py0 and Py1 with abnormally high contents, which suggests that Ti occurs as mineral inclusions (possibly rutile; Table S2). In some spots, the time-resolved depth profiles of Pb, Zn, Cu, and Sb show the same fluctuations, indicating that the Pb-Zn-Cu-, Pb-Cu-, and/or Pb-Sb-bearing mineral inclusions are also present (Figure 7).

6.2. Genesis of Ore Deposit

Conventional Co-Ni binary diagrams and the Co/Ni ratios have been widely applied to determine the origin of pyrite and explain the genesis of deposits (e.g., [71,73,74,75,76]). Generally, sedimentary/diagenetic pyrite has Co/Ni of <1, and hydrothermal pyrite usually has Co/Ni of > 1 (mostly < 5), whilst pyrite of volcanogenic- or felsic-intrusion-related origin usually has high Co/Ni ratios of 5 to 50 [77,78,79,80]. However, as shown in Figure 11a, most of the Co/Ni ratios in sedimentary/diagenetic Py0 in the Dunbasitao deposit are higher than 1, differing from the typical Co/Ni of <1, and those in Py1 show a significantly wide variation range (from less than 0.01 to nearly 100), which reflects the limitation of Co/Ni ratios in identifying the genesis of ore deposits.
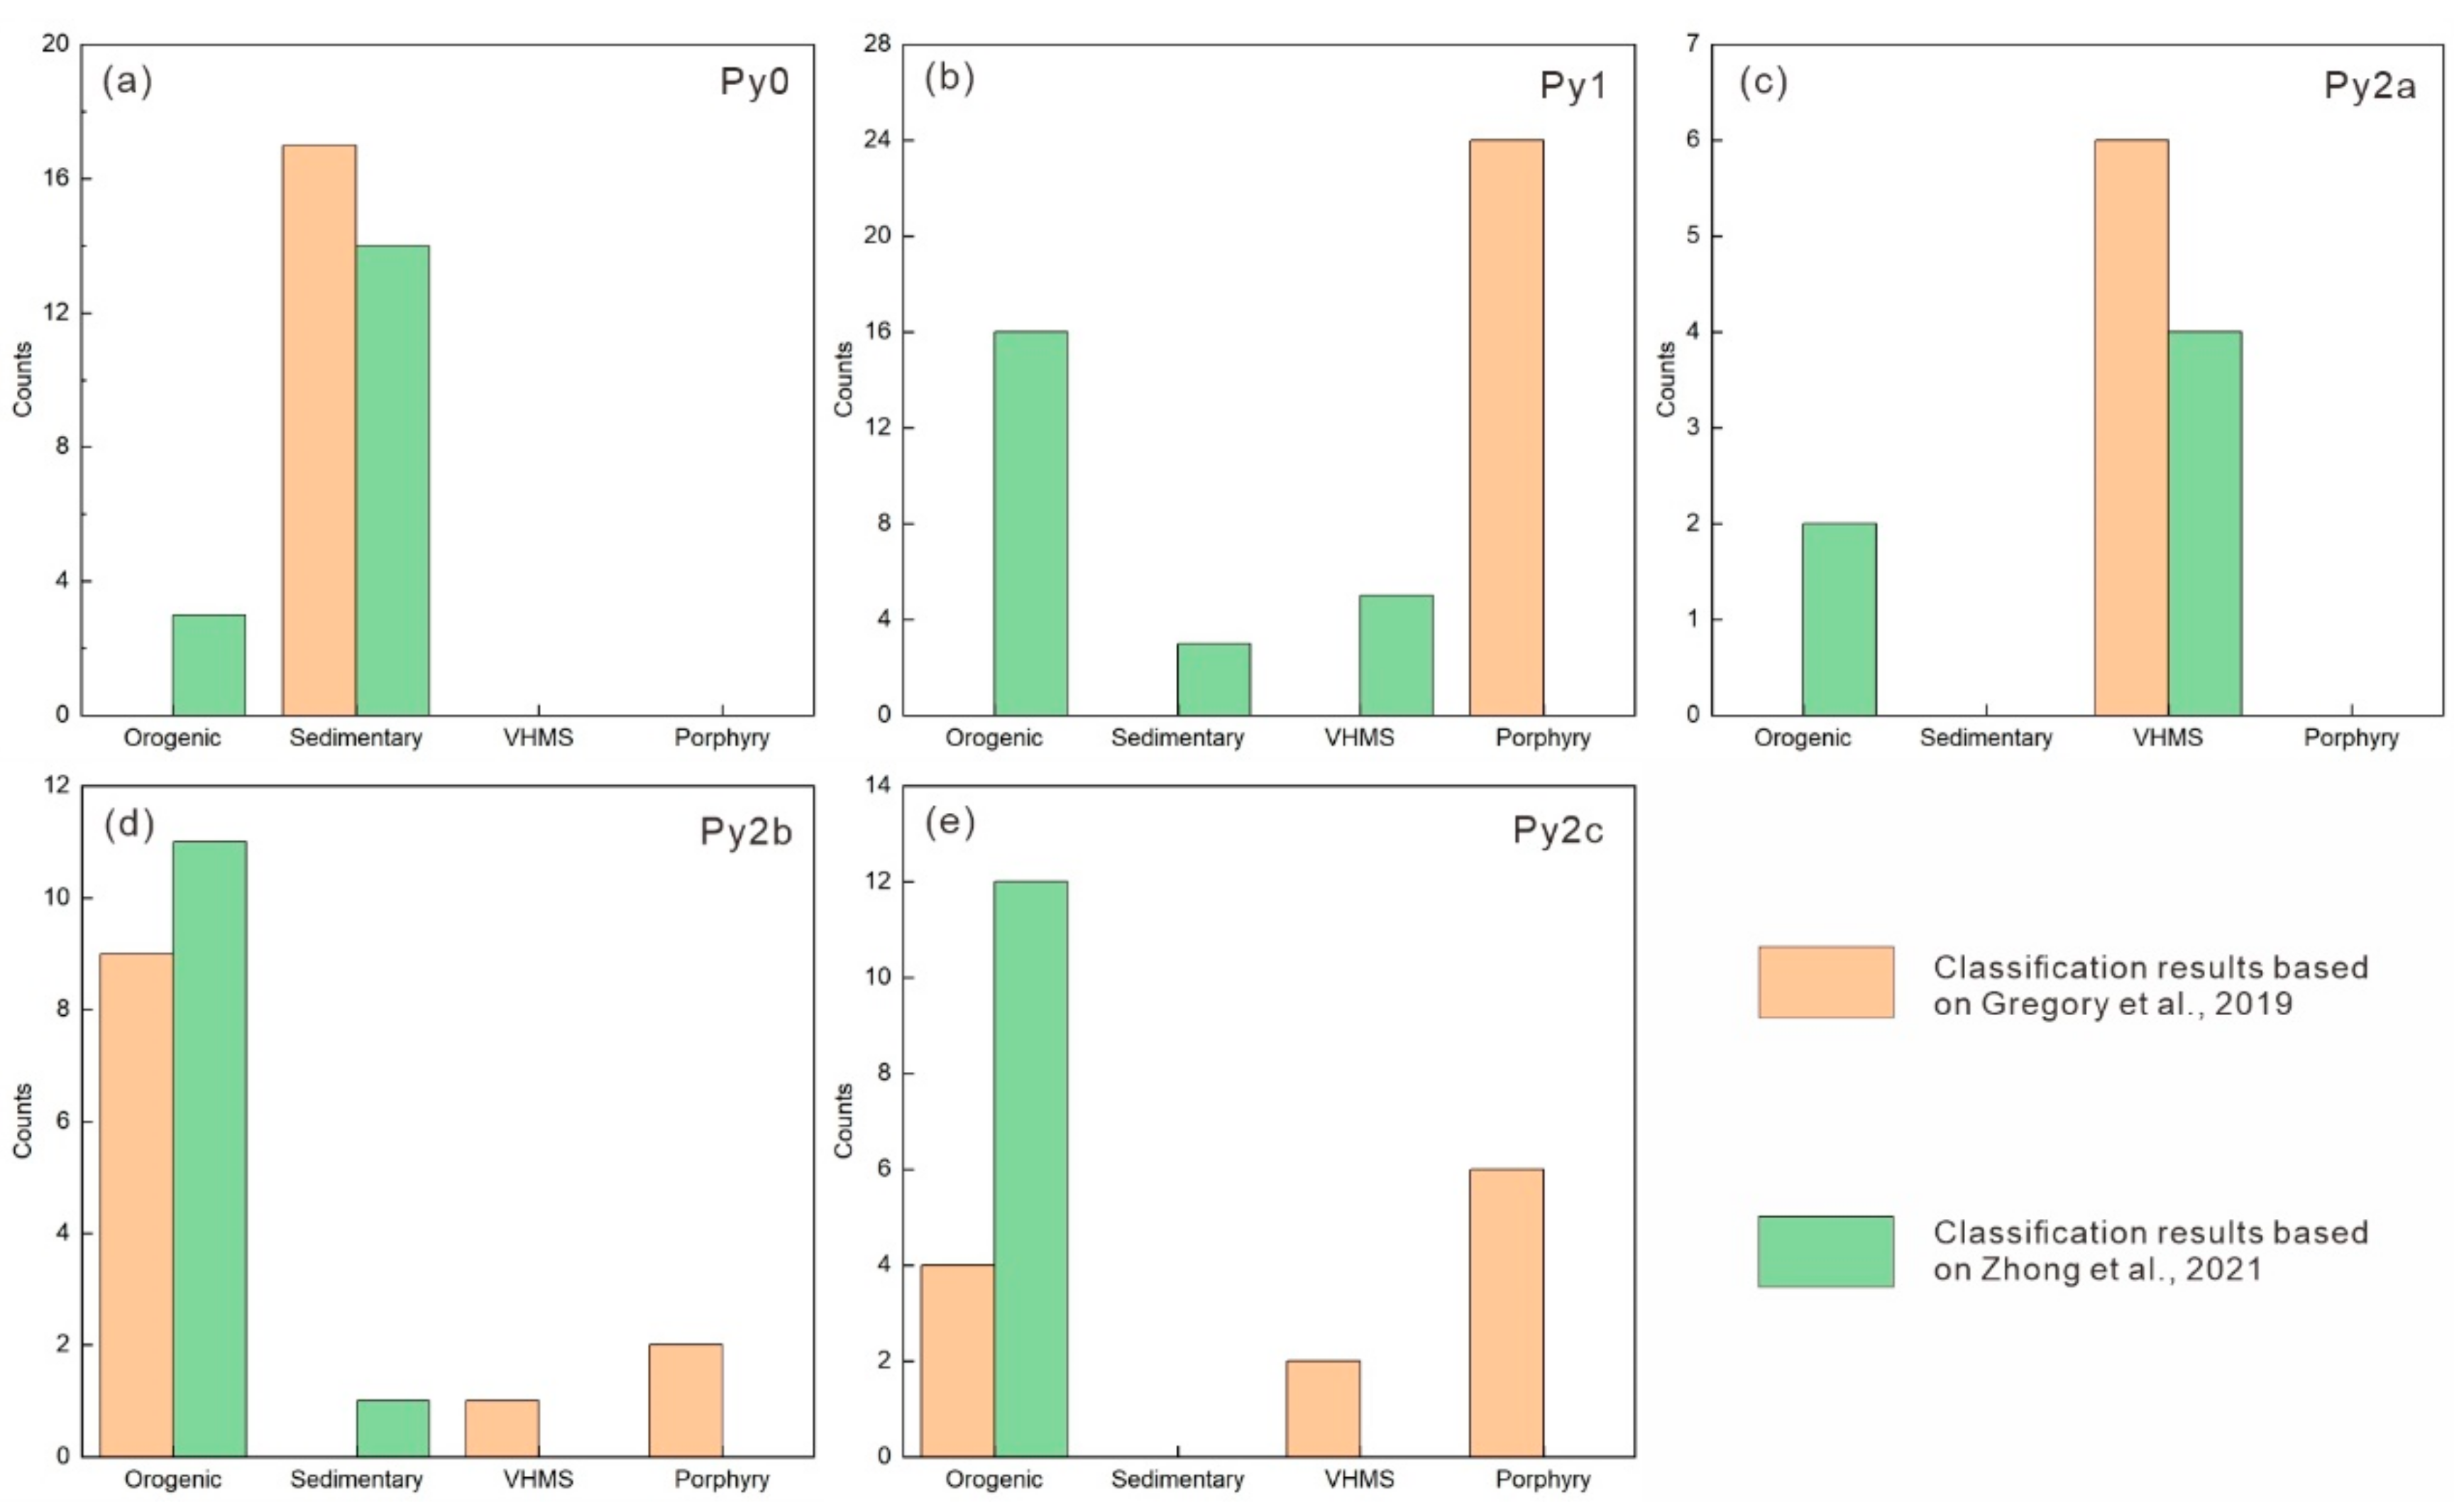
In this paper, we tried to use two different machine learning classifiers developed by Gregory et al. [22] and Zhong et al. [23] to determine the genesis type of the Dunbasitao gold deposit (abbreviated as the G-classifier and Z-classifier in this paper). The classification results of the 2 classifiers for 71 pyrite LA-ICP-MS spot analysis data on the different types of pyrite are shown in Table 3 and Table 4 and Figure 13. The G-classifier displays perfect discrimination results for Py0, which are 100% consistent with the sedimentary–diagenetic petrographic features of Py0 (Table 3; Figure 13a). An amount of 82.35% of pre-ore Py0 data was identified as sedimentary pyrite with the Z-classifier (Table 4). Both classifiers show excellent discrimination capabilities for sedimentary pyrite. An amount of 66.67% of early-stage Py1 data was identified as being of orogenic origin, 12.50% were of sedimentary origin, and 20.83% were of VHMS origin using the Z-classifier. However, all 24 data on Py1 were identified as being of porphyry origin using the G-classifier (Figure 13b). For middle-stage Py2a, 66.67% were identified as being of VHMS origin, and 33.33% were of orogenic origin using the Z-classifier. All six data on Py2a were identified as being of VHMS origin using the G-classifier (Figure 13c). Both classifiers overwhelmingly identified Py2b (the dominant gold-rich pyrite type) as being of orogenic origin (75.00% with the G-classifier and 91.67% with the Z-classifier), which strongly indicates that the Dunbasitao deposit is an orogenic gold deposit (Figure 13d). For gold-bearing Py2c, all 12 data were identified as being of orogenic origin using the Z-classifier, while 33.33% were identified as being of orogenic origin, 16.67% were of VHMS origin, and 50.00% were of porphyry origin using the G-classifier (Figure 13e).
The discrimination results using the G-classifier vary a lot for the hydrothermal pyrites from the Dunbasitao deposit. Considering that the G-classifier still gave a satisfactory result for the gold-rich Py2b, the most probable reason for this kind of variation is that the G-classifier was developed using ore-phase pyrites, so it could not accurately classify non-ore phase pyrites, i.e., the relatively good–poor Py1, Py2a, and Py2c [22]. The discrimination results for the hydrothermal Py1, Py2a, Py2b, and Py2c using the Z-classifier coincide with each other (being mostly of orogenic origin), which verifies the powerful discrimination capability of the Z-classifier. Thus, we hold the opinion that the Dunbasitao deposit is an orogenic gold deposit based on its pyrite trace element features, which is consistent with previous petrography and fluid inclusion works [34,35].

6.3. Trace Element Variations and Their Implications

Considering the chronological sequence from Py0 to Py2c, the change in the trace elements in the pyrites can be used to probe the evolution of the ore-forming fluid, the changes in the physical and chemical conditions for mineralization, and the source of the metals [6,7,8,9,10,11,81]. Py0 is rich in many trace elements (e.g., As, Co, Pb, Mn, Cu, Ni, and Sb; Table 2 and Figure 8); among these, the contents of Mn, Co, Ni, Mo, Sb, and Pb are even markedly higher than those in the hydrothermal pyrite, which indicates the host rock has a fair potential to provide these ore-forming materials.
Py1 is homogeneous in texture and of great purity (Table 2; Figure 5b and Figure 8). Its S and Fe contents are close to ideal values, except for certain amounts of As, Se, Co, and Ni, the contents of other elements were very low, and most of them were even lower than the detection limit. This evidence indicates that the early stage should be under stable physical and chemical conditions and with the process of mineral crystallization advancing slowly [67]. The extremely low trace element contents in Py1 contrast with those in Py0, indicating that the host rock had limited influence on the composition of the ore-forming fluid in the early stage, which is possibly due to the large fluid–rock ratio during the early stage. Thus, the relative enrichment in As, Se, Co, and Ni in Py1 is likely to reflect the nature of the primary ore-forming fluids derived from the source region (Figure 8). Py1 is notably enriched in Se (14.9–78.8 ppm, with a median of 40.0 ppm), whose content is even higher than in all the other pyrites (Table 2; Figure 8). Previous studies have suggested that Se incorporation in pyrite correlates positively with the hydrothermal fluid temperature [9,82]; thus, the high Se content in Py1 is consistent with the relatively higher temperature of early-stage fluids, as measured by Liu et al. [35].
From Py1 to Py2a, most trace element contents jumped sharply, such as that of Zn (595–5446 ppm, with a median of 3968 ppm), Cu (168–5466 ppm, with a median of 244 ppm), Ag (2.85–725 ppm, with a median of 9.27 ppm), Sn (17.0–71.0 ppm, with a median of 38.9 ppm), Sb (17.3–3187 ppm, with a median of 30.8 ppm), and Au (0.31–2.48 ppm, with a median of 1.27 ppm) (Table 2; Figure 8). The abrupt precipitation of ore-forming materials in the middle stage indicates that the physical and chemical conditions of mineralization change intensely, which might be due to fluid immiscibility during the decompression process [35,67]. These elements could be incorporated into Py2a as solid solutions and sulfide micro-inclusions, as observed with a microscope, BSE, LA-ICP-MS time-resolved depth profiles, and trace element mapping (Figure 5f, Figure 7c and Figure 9). The drop in Se indicates the decrease in the fluid temperature from the early to the middle stage (Figure 8).
From Py2a and Py2b to Py2c, the contents of Co, Ni, As, and especially Au tend to rise and then fall, and those in Py2c are higher than in Py2a (Table 2; Figure 8 and Figure 12). Considering the contents of Au and As were negatively correlated with temperature within the range of 200–500 °C in hydrothermal deposits [11], Py2b presented a sudden fluid cooling event during the middle stage, leading to the dramatic precipitation of gold, which may be due to the fluid mixing owing to the addition of meteoric water [35]. The dilution of meteoric water can also explain the decreases in other element contents in Py2b. From Py2a to Py2b, the contents of Cu, Sb, Pb, and Bi gently decline, whilst those of other elements including Zn, Ag, Cd, and Sn plunged (Table S2; Figure 8). Combined with the Cu, Sb, Pb, and Bi enriched in Py0, these gentle drops may reflect the buffering effect of the host rock, i.e., the host rock contributed these elements to the fluids. On the contrary, Zn, Ag, Cd, and Sn are more sensitive and likely to be dominantly derived from primary fluids. This phenomenon also enlightens us to the fact that meteoric water addition/fluid mixing in an orogenic gold deposit system may often be posterior to fluid immiscibility/boiling, as demonstrated by Chen [83]. The fluid cooling event was probably the critical gold precipitation mechanism leading to the Au and As contents soaring dramatically in Py2b, in which the Au content could be up to 201 ppm and the As up to 65,265 ppm (Table 2). The drops in the Co, Ni, As, and Au contents in Py2c indicate the recovery of the fluid temperature to some extent but are still lower than those in Py2a, among which the decreases in the Co and Au contents are much sharper than those of Ni and As from Py2b to Py2c, implying that the Co and Au were dominantly derived from fluids, whilst the Ni and As were, in addition, provided by the host rock (Table 2; Figure 8). The Cr, Mn, and Mo contents from Py2a and Py2b to Py2c display a falling and then rising tendency that is contrary to those of Co, Ni, As, and Au, indicating their contents in pyrite are positively correlated with the fluid temperature in the Dunbasitao deposit, and all these elements were highly temperature-controlled. The general decline in most element contents from Py2b to Py2c suggests that the addition of meteoric water gradually began to dilute the ore-forming fluid. Se and Mo are also sensitive to redox, and their contents in pyrite are positively correlated with the fO2 of the fluid, which was used to restore the Great Oxidation Event in Earth’s history [7]. Therefore, the content of Se went up gradually from Py2a to Py2c, and the rise in the Mo content from Py2b to Py2c may reflect the increase in the fluid fO2, which is also in accordance with the addition of meteoric water (Table 2; Figure 8).

6.4. Gold Mineralization Process and Precipitation Mechanism

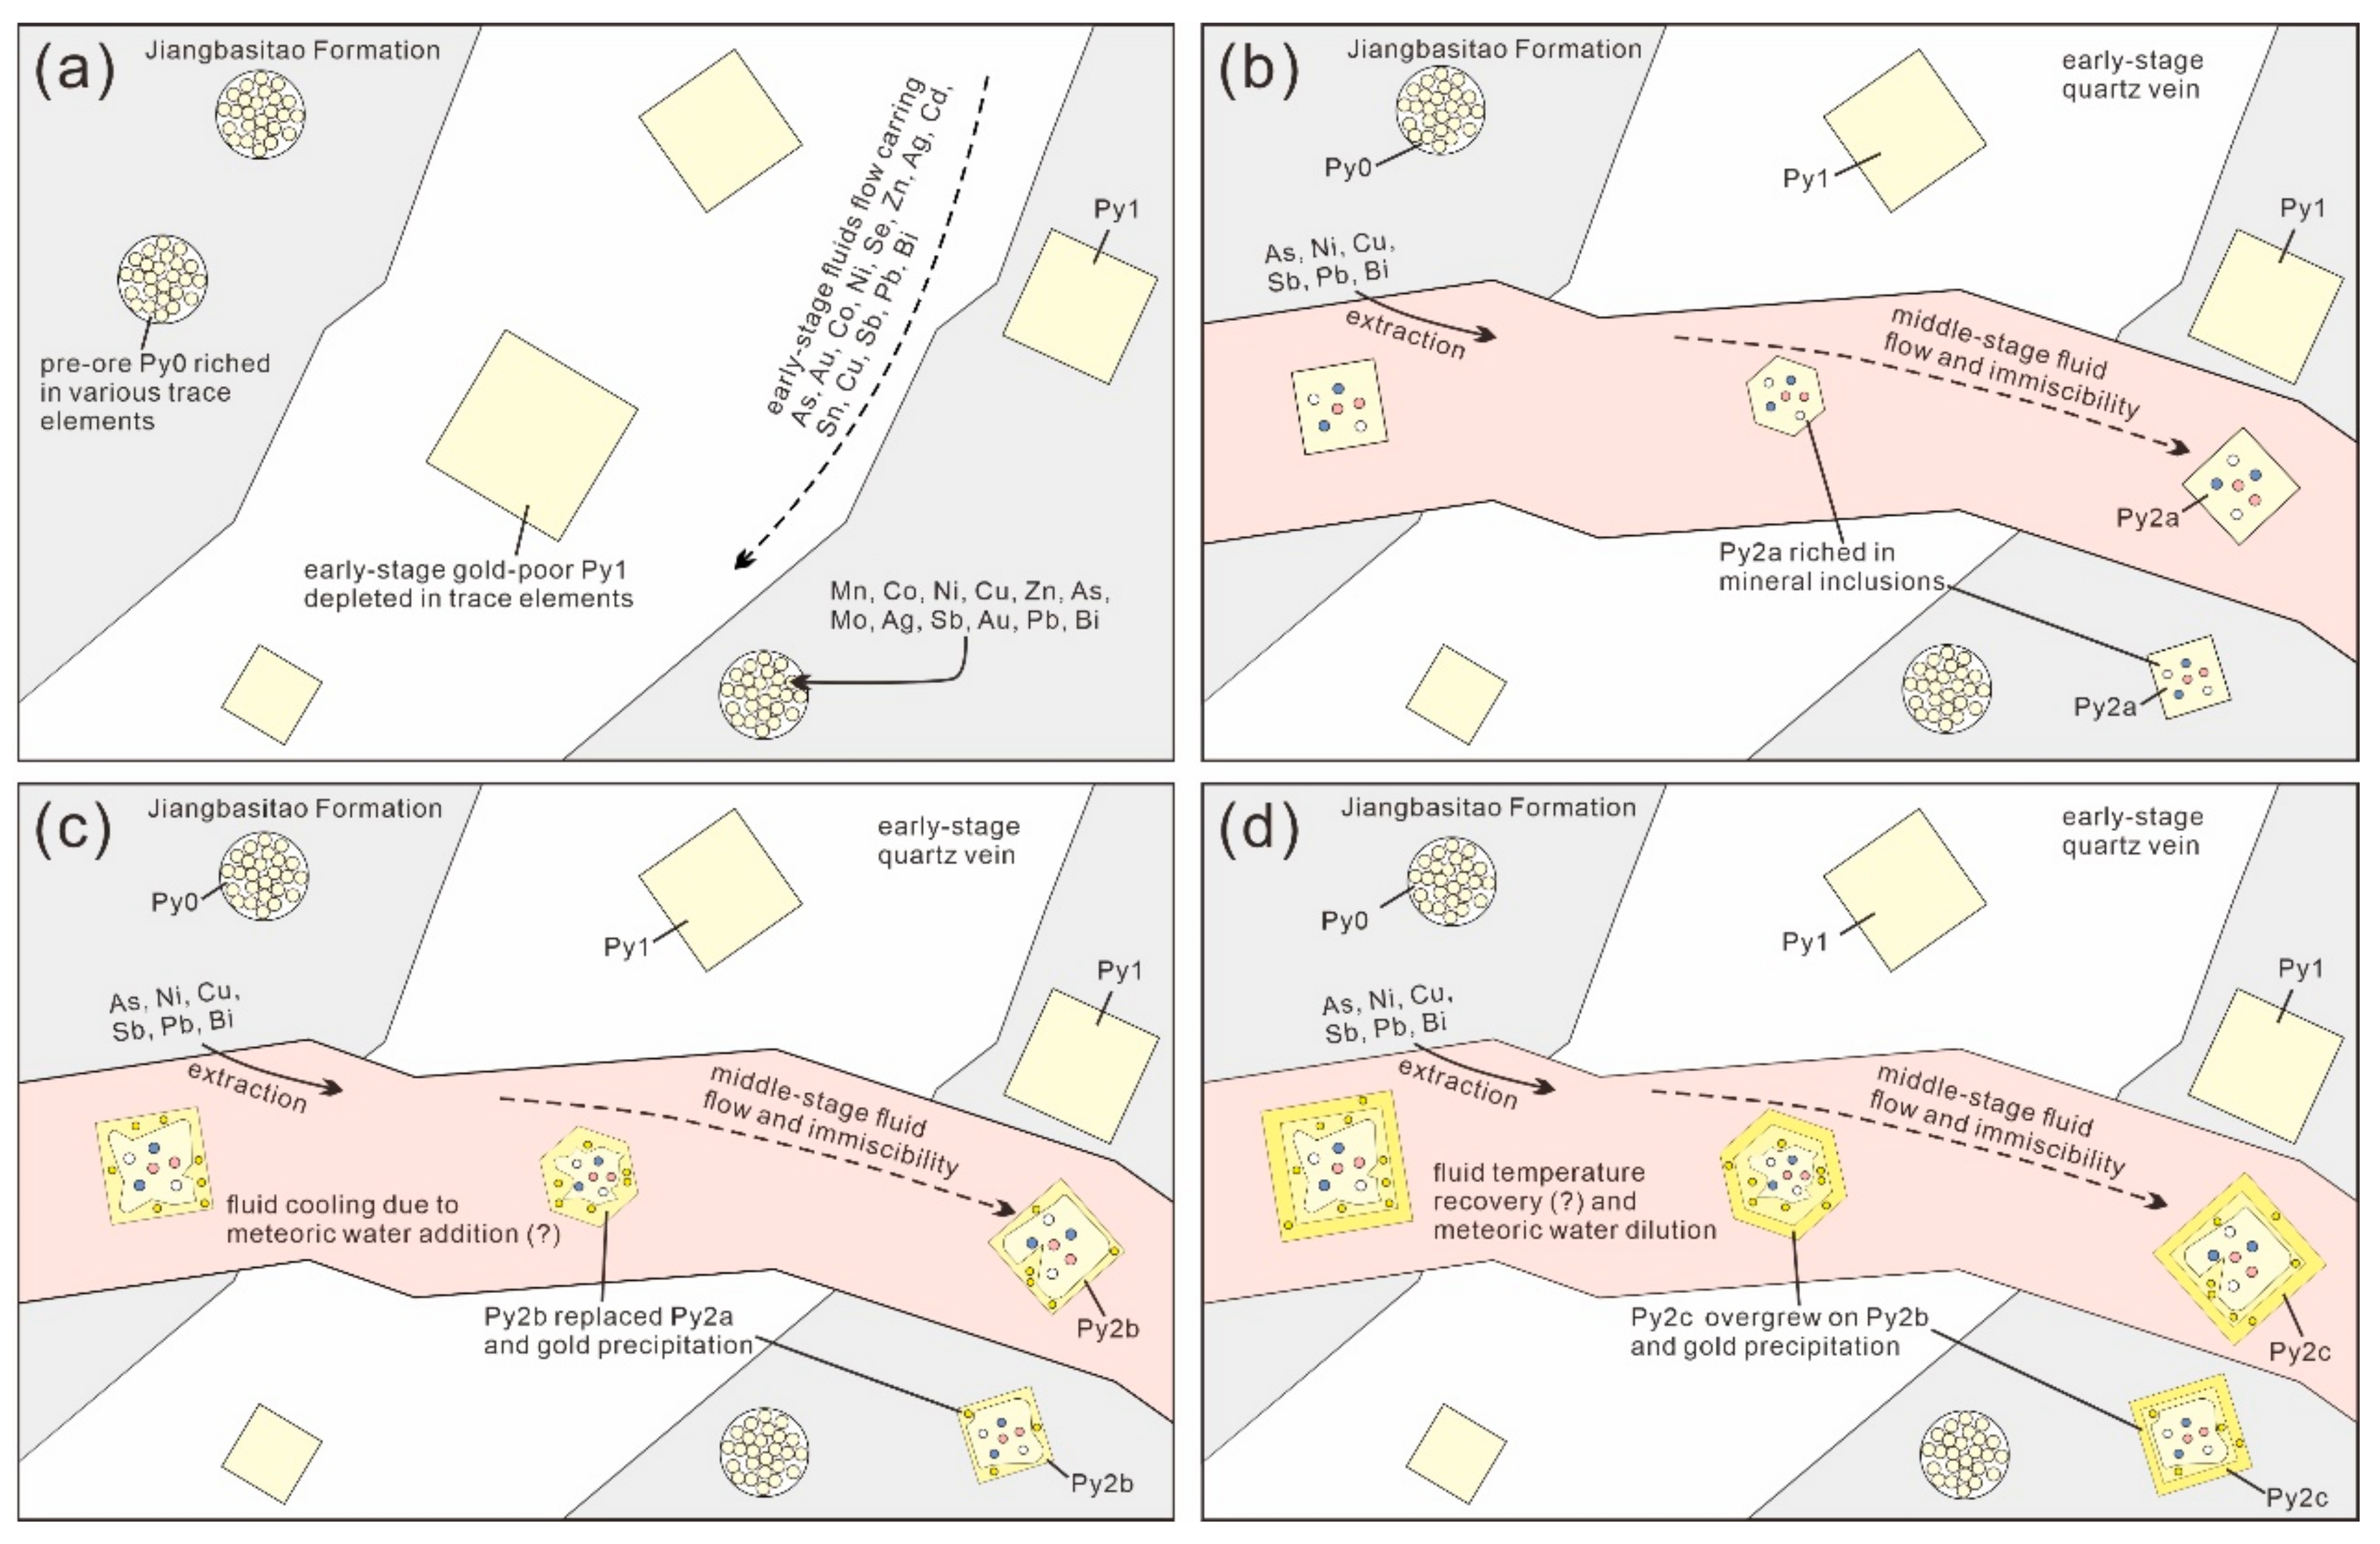
Based on pyrite’s textural and compositional features, the mineralization process of the Dunbasitao gold deposit can be summarized as follows (Figure 14): The pre-ore Py0 was a deposit sink for various trace elements, hosting abundant amounts of Mn, Co, Ni, Cu, Zn, As, Mo, Ag, Sb, Au, Pb, and Bi during the sedimentary process of the Jiangbasitao Formation (Figure 14a). The initial metamorphic fluids carried major amounts of S, As, Au, Co, Ni, Se, Zn, Ag, Cd, and Sn, and certain amounts of Cu, Sb, Pb, Bi, and other elements. These fluids transported Au mainly in the form of Au (HS)2 and migrated upwards along the Armantai conducting fault to shallower levels. In the early stage, the mineralization system had a large water–rock ratio and was under stable physical and chemical conditions, and the elements were dominantly fluid-controlled and slowly precipitated to form coarse-grained, cubic, homogeneous, and barren Py1, which was poor in various trace elements (Figure 14a). Over time, fluids flowed from the major fault to narrower, finer fractures, which decreased the water–rock ratio and expanded the reaction interface, making the fluid–rock interactions more adequate. Hence, on the one hand, the fluid leached host rocks and extracted As, Ni, Cu, Sb, Pb, Bi, and other elements more effectively. On the other hand, the water–rock reactions consumed the H2O in the fluid, leading to further increases in the trace element concentrations in the fluids. In the middle stage, fluid immiscibility led to the dramatic precipitation of most trace elements, forming the fine-grained, cubic, and/or pyritohedron Py2a rich in trace elements (Figure 14b). Subsequently, there might have been a significant drop in the fluid temperature due to the sudden injection of meteoric water (possibly caused by hydraulic fracturing during fluid immiscibility), along with changes in other physical and chemical conditions (such as decompression and an increase in fO2), which led to the destabilization and dissociation of the Au (HS)2 complex. The ore-forming fluids then replaced the Py2a accompanied by the substitution of S with As, leading to lattice distortion and the transformation of the semiconducting property of pyrite, which promoted the Au+ to precipitate into the pyrite lattice and finally formed the gold-rich Py2b (Figure 14c). This process is supported by the joint rise in As and Au contents from Py2a to Py2b (Figure 8, Figure 9 and Figure 10a). Gold and arsenic are strongly coupled in pyrite from the Dunbasitao deposit with a linear correlation coefficient of 0.850, whilst there is no obvious correlation between gold and other elements in comparison (Figure 10). In the middle stage, Cu, Zn, Ag, Cd, Sn, Sb, Pb, and Bi precipitated during continuous fluid immiscibility. However, due to the dilution of the meteoric water, the contents of these elements decreased significantly. In this process, the contents of Cu, Sb, Pb, and Bi buffered by the host rock declined slower than those of Zn, Ag, Cd, and Sn, mainly derived from primary fluids. After that, the temperature of the ore-forming fluids recovered slightly, the meteoric water kept diluting the fluids, and the fluid fO2 increased, which was companied by the Py2c overgrowing on Py2b and the decrease in most element contents (Figure 14d). The middle-stage Py2c is also an important gold-bearing pyrite type, as its Au content ranges from 0.18 to 18.0 ppm, with a median of 3.57 ppm. In the late stage, the ore-forming fluids were dominated by the meteoric water and formed barren quartz–calcite veinlets without sulfides (Figure 4e).

7. Conclusions

(1)
Pyrite from the Dunbasitao gold deposit can be classified into five types, including the pre-ore framboidal/colloidal Py0; the coarse-grained, cubic, and homogeneous Py1 in the early stage; and the fine-grained cubic/pyritohedron Py2 in the middle stage composed of Py2a (core), Py2b (mantle), and Py2c (rim).
(2)
Trace elements of pyrite in the Dunbasitao gold deposit mainly occur in two forms: as solid solutions and as invisible or visible inclusions. Mn, Co, Ni, and As enter the pyrite lattice in the form of isomorphisms; Ti is distributed primarily as mineral inclusions; and Au, Cu, Zn, Sb, and Pb occur in both forms in pyrite.
(3)
The Dunbasitao deposit was identified as an orogenic gold deposit using two of the latest machine learning classifiers based on the pyrite trace element data in this work.
(4)
Gold and arsenic are strongly coupled in the pyrites in the Dunbasitao deposit, and their contents in Py2b are much higher than in the other pyrites. Fluid immiscibility, the sudden cooling of a fluid possibly caused by the addition of meteoric water, and the substitution of S1− with As1− may be the crucial mechanisms leading to the precipitation of Au and other trace elements and their incorporation into the pyrites.
(5)
The initial ore-forming fluids brought major amounts of As, Au, Co, Ni, Se, Zn, Ag, Cd, Sn, and other elements, and the Jiangbasitao Formation host rocks contributed certain amounts of As, Ni, Cu, Sb, Pb, and Bi, at least.

Supplementary Materials

The following supporting information can be downloaded at: https://www.mdpi.com/article/10.3390/min13040534/s1, Table S1: The major element data of different types of pyrites from the Dunbasitao gold deposit determined by EPMA (%); Table S2: The trace element data of different types of pyrites from the Dunbasitao gold deposit determined by LA-ICP-MS (ppm); Table S3: Linear correlation coefficients of contents of different trace element in all types of pyrites from the Dunbasitao gold deposit.

Author Contributions

Field geological survey, W.L., X.D., S.H., X.C., X.L., A.A., Y.W. (Yanshuang Wu), Y.W. (Yong Wang), W.S. and Z.L.; writing—original draft, W.L.; writing—review and editing, X.D., Y.C. and W.L.; data analysis, W.L., Y.C. and X.D. All authors have read and agreed to the published version of the manuscript.

Funding

This research was supported by the National Natural Science Foundation of China (No. 42202075, 42222205, and 42072106) and the Natural Science Foundation of Xinjiang (No. 2022D01A344).

Data Availability Statement

The data are available from the authors upon reasonable request.

Acknowledgments

The Western Region Gold Co., Ltd. and the no. 701 team of the Xinjiang Uygur Autonomous Region Nonferrous Geological Exploration Bureau are heartfeltly thanked for their support and help with this fieldwork.

Conflicts of Interest

The authors declare no conflict of interest.

References

  1. Wu, Y.F.; Evans, K.; Li, J.W.; Fougerouse, D.; Large, R.R.; Guagliardo, P. Metal remobilization and ore-fluid perturbation during episodic replacement of auriferous pyrite from an epizonal orogenic gold deposit. Geochim. Cosmochim. Acta 2019, 245, 98–117. [Google Scholar] [CrossRef] [Green Version]
  2. Wu, Y.F.; Evans, K.; Hu, S.Y.; Fougerouse, D.; Zhou, M.F.; Fisher, L.A.; Guagliardo, P.; Li, J.W. Decoupling of Au and As during rapid pyrite crystallization. Geology 2021, 49, 827–831. [Google Scholar] [CrossRef]
  3. Yang, L.; Wang, Q.F.; Large, R.R.; Fougerouse, D.; Mukherjee, I.; Zhang, Q.Z.; Deng, J. Texture and geochemistry of pyrite from the Jinya, Nakuang and Gaolong gold deposits in the Youjiang Basin: Implications for basin-scale gold mineralization. Miner. Depos. 2022, 57, 1367–1390. [Google Scholar] [CrossRef]
  4. Zhang, H.C.; Zhu, Y.F.; Salvi, S.; Wu, Y.F.; Gilbert, S. Complex fluid source of the multistage pyrite-bearing Huilvshan gold deposit (west Junggar, NW China): Insight from pyrite texture, sulfur isotope and trace element compositions. Ore Geol. Rev. 2022, 149, 105081. [Google Scholar] [CrossRef]
  5. Zoheir, B.; McAleer, R.; Steele-MacInnis, M.; Zeh, A.; Bain, W.; Poulette, S. Vein-type gold formation during late extensional collapse of the Eastern Desert, Egypt: The Gidami deposit. Miner. Depos. 2023, 58, 681–706. [Google Scholar] [CrossRef]
  6. Large, R.R.; Maslennikov, V.V.; Robert, F.; Danyushevsky, L.V.; Chang, Z. Multistage sedimentary and metamorphic origin of pyrite and gold in the giant Sukhoi Log Deposit, Lena gold province, Russia. Econ. Geol. 2007, 102, 1233–1267. [Google Scholar] [CrossRef]
  7. Large, R.R.; Halpin, J.A.; Danyushevsky, L.V.; Maslennikov, V.V.; Bull, S.W.; Long, J.A.; Gregory, D.D.; Lounejeva, E.; Lyons, T.W.; Sack, P.J.; et al. Trace element content of sedimentary pyrite as a new proxy for deep-time ocean–atmosphere evolution. Earth Planet. Sci. Lett. 2014, 389, 209–220. [Google Scholar] [CrossRef]
  8. Large, R.R.; Mukherjee, I.; Danyushevsky, L.; Gregory, D.; Steadman, J.; Corkrey, R. Sedimentary pyrite proxy for atmospheric oxygen: Evaluation of strengths and limitations. Earth-Sci. Rev. 2022, 227, 103941. [Google Scholar] [CrossRef]
  9. Maslennikov, V.V.; Maslennikova, S.P.; Large, R.R.; Danyushevsky, L.V. Study of trace element zonation in vent chimneys from the Silurian Yaman-Kasy volcanic-hosted massive sulfide deposit (Southern Urals, Russia) using laser ablation-inductively coupled plasma mass spectrometry (LA-ICPMS). Econ. Geol. 2009, 104, 1111–1141. [Google Scholar] [CrossRef]
  10. Deditius, A.P.; Utsunomiya, S.; Reich, M.; Kesler, S.E.; Ewing, R.C.; Hough, R.; Walshe, J. Trace metal nanoparticles in pyrite. Ore Geol. Rev. 2011, 42, 32–46. [Google Scholar] [CrossRef]
  11. Deditius, A.P.; Reich, M.; Kesler, S.E.; Utsunomiya, S.; Chryssoulis, S.L.; Walshe, J.; Ewing, R.C. The coupled geochemistry of Au and As in pyrite from hydrothermal ore deposits. Geochim. Cosmochim. Acta 2014, 140, 644–670. [Google Scholar] [CrossRef] [Green Version]
  12. Reich, M.; Deditius, A.; Chryssoulis, S.; Li, J.W.; Ma, C.Q.; Parada, M.A.; Barra, F.; Mittermayr, F. Pyrite as a record of hydrothermal fluid evolution in a porphyry copper system: A SIMS/EMPA trace element study. Geochim. Cosmochim. Acta 2013, 104, 42–62. [Google Scholar] [CrossRef]
  13. Román, N.; Reich, M.; Leisen, M.; Morata, D.; Barra, F.; Deditius, A.P. Geochemical and micro-textural fingerprints of boiling in pyrite. Geochim. Cosmochim. Acta 2019, 246, 60–85. [Google Scholar] [CrossRef]
  14. Steadman, J.A.; Large, R.R.; Olin, P.H.; Danyushevsky, L.V.; Meffre, S.; Huston, D.; Fabris, A.; Lisitsin, V.; Wells, T. Pyrite trace element behavior in magmatic-hydrothermal environments: An LA-ICPMS imaging study. Ore Geol. Rev. 2021, 128, 103878. [Google Scholar] [CrossRef]
  15. Li, R.C.; Chen, H.Y.; Large, R.R.; Zhao, L.D.; Liu, Y.H.; Jiao, J.G.; Xia, X.P.; Yang, Q. Ore-forming fluid source of the orogenic gold deposit: Implications from a combined pyrite texture and geochemistry study. Chem. Geol. 2020, 552, 119781. [Google Scholar] [CrossRef]
  16. Ma, Y.; Jiang, S.Y.; Frimmel, H.E.; Zhu, L.Y. In situ chemical and isotopic analyses and element mapping of multiple-generation pyrite: Evidence of episodic gold mobilization and deposition for the Qiucun epithermal gold deposit in Southeast China. Am. Mineral. 2022, 107, 1133–1148. [Google Scholar] [CrossRef]
  17. Sun, Z.Y.; Deng, X.H.; Pirajno, F. Textures, trace element compositions, and sulfur isotopes of pyrite from the Honghai volcanogenic massive sulfide deposit: Implications for ore genesis and mineral exploration. Sci. China Earth Sci. 2023. [Google Scholar] [CrossRef]
  18. Tan, H.J.; Shao, Y.J.; Liu, Q.Q.; Zhang, Y.; Feng, Y.Z.; Zhang, Y.C.; Ahmad Shah, S. Textures, trace element geochemistry and in-situ sulfur isotopes of pyrite from the Xiaojiashan gold deposit, Jiangnan Orogen: Implications for ore genesis. Ore Geol. Rev. 2022, 144, 104843. [Google Scholar] [CrossRef]
  19. Sciuba, M.; Beaudoin, G.; Grzela, D.; Makvandi, S. Trace element composition of scheelite in orogenic gold deposits. Miner. Depos. 2020, 55, 1149–1172. [Google Scholar] [CrossRef]
  20. Sciuba, M.; Beaudoin, G. Texture and trace element composition of rutile in orogenic gold deposits. Econ. Geol. 2021, 116, 1865–1892. [Google Scholar] [CrossRef]
  21. Tan, H.M.R.; Huang, X.W.; Meng, Y.M.; Xie, H.; Qi, L. Multivariate statistical analysis of trace elements in apatite: Discrimination of apatite with different origins. Ore Geol. Rev. 2023, 153, 105269. [Google Scholar] [CrossRef]
  22. Gregory, D.D.; Cracknell, M.J.; Large, R.R.; McGoldrick, P.; Kuhn, S.; Maslennikov, V.V.; Baker, M.J.; Fox, N.; Belousov, I.; Figueroa, M.C.; et al. Distinguishing ore deposit type and barren sedimentary pyrite using laser ablation-inductively coupled plasma-mass spectrometry trace element data and statistical analysis of Large Data Sets. Econ. Geol. 2019, 114, 771–786. [Google Scholar] [CrossRef]
  23. Zhong, R.C.; Deng, Y.; Li, W.; Danyushevsky, L.V.; Cracknell, M.J.; Belousov, I.; Chen, Y.J.; Li, L.M. Revealing the multi-stage ore-forming history of a mineral deposit using pyrite geochemistry and machine learning-based data interpretation. Ore Geol. Rev. 2021, 133, 104079. [Google Scholar] [CrossRef]
  24. Mao, J.W.; Konopelko, D.; Seltmann, R.; Lehmann, B.; Chen, W.; Wang, Y.; Eklund, O.; Usubaliev, T. Postcollisional age of the Kumtor gold deposit and timing of Hercynian events in the Tien Shan, Kyrgyzstan. Econ. Geol. 2004, 99, 1771–1780. [Google Scholar] [CrossRef]
  25. Windley, B.F.; Alexeiev, D.; Xiao, W.J.; Kröner, A.; Badarch, G. Tectonic models for accretion of the Central Asian Orogenic Belt. J. Geol. Soc. Lond. 2007, 164, 31–47. [Google Scholar] [CrossRef] [Green Version]
  26. Xiao, W.J.; Han, C.M.; Yuan, C.; Sun, M.; Lin, S.F.; Chen, H.L.; Li, Z.L.; Li, J.L.; Sun, S. Middle Cambrian to Permian subduction-related accretionary orogenesis of Northern Xinjiang, NW China: Implications for the tectonic evolution of central Asia. J. Asian Earth Sci. 2008, 32, 102–117. [Google Scholar] [CrossRef]
  27. Chen, H.Y.; Chen, Y.J.; Baker, M. Isotopic geochemistry of the Sawayaerdun orogenic-type gold deposit, Tianshan, northwest China: Implications for ore genesis and mineral exploration. Chem. Geol. 2012, 310–311, 1–11. [Google Scholar] [CrossRef]
  28. Goldfarb, R.J.; Taylor, R.D.; Collins, G.S.; Goryachev, N.A.; Orlandini, O.F. Phanerozoic continental growth and gold metallogeny of Asia. Gondwana Res. 2014, 25, 48–102. [Google Scholar] [CrossRef]
  29. Seltmann, R.; Goldfarb, R.J.; Zu, B.; Creaser, R.A.; Dolgopolova, A.; Shatov, V.V. Chapter 24: Muruntau, Uzbekistan: The World’s Largest Epigenetic Gold Deposit. In Geology of the World’s Major Gold Deposits and Provinces; Sillitoe, R.H., Goldfarb, R.J., Robert, F., Simmons, S.F., Eds.; Society of Economic Geologists: Littleton, CO, USA, 2020; pp. 497–521. [Google Scholar]
  30. Xiao, W.J.; Sun, M.; Santosh, M. Continental reconstruction and metallogeny of the Circum-Junggar areas and termination of the southern Central Asian Orogenic Belt. Geosci. Front. 2015, 6, 137–140. [Google Scholar] [CrossRef] [Green Version]
  31. Han, C.M.; Xiao, W.J.; Zhao, G.C.; Su, B.X.; Sakyi, P.A.; Ao, S.J.; Wan, B.; Zhang, J.E.; Zhang, Z.Y.; Wang, Z.M. Mid-Late Paleozoic metallogenesis and evolution of the Chinese Altai and East Junggar Orogenic Belt, NW China, Central Asia. J. Geosci. 2014, 59, 255–274. [Google Scholar] [CrossRef] [Green Version]
  32. Xu, B.; Lu, Y.M.; Gu, X.X.; Zhang, W.Z. Metallogenic epoch of the Shuangquan gold deposit in Qitai area, Xinjiang, China. Geol. Bull. China 2009, 28, 1871–1884. [Google Scholar]
  33. Wang, Y.H. Tectonic-Mineralizing Fluids in the Saerbulake Gold Deposit, Erqis Metallogenic Belt, Xinjiang. Master’s Thesis, University of Science and Technology Beijing, Beijing, China, 2010; pp. 1–71. [Google Scholar]
  34. Liu, W.X.; Deng, X.H.; Wu, Y.S.; Han, S.; Chen, X.; Li, X.; Wang, Y.; Chen, Y.J. Geological characteristics and genesis of Dunbastau gold deposit in eastern Junggar, Xinjiang. Geol. Rev. 2021, 67, 1–28. [Google Scholar]
  35. Liu, W.X.; Deng, X.H.; Pirajno, F.; Han, S.; Chen, X.; Li, X.; Aibai, A.; Wu, Y.S.; Wang, Y.; Chen, Y.J. The ore-forming fluid nature, source, and evolution of the Dunbasitao gold deposit, East Junggar, China: Constraints from geology, fluid inclusions, and C-H-O isotopes. SSRN Electron. J. 2023. [Google Scholar] [CrossRef]
  36. Li, H. The Metallogenic and Prospecting Model of Paleozoic Gold Deposits in the Dunbasitao and Adjacent Area, East Junggar, Xinjiang Province. Ph.D. Thesis, China University of Geosciences (Wuhan), Wuhan, China, 2018; pp. 1–156. [Google Scholar]
  37. Xiao, W.J.; Windley, B.F.; Huang, B.C.; Han, C.M.; Yuan, C.; Chen, H.L.; Sun, M.; Sun, S.; Li, J.L. End-Permian to mid-Triassic termination of the accretionary processes of the southern Altaids: Implications for the geodynamic evolution, Phanerozoic continental growth, and metallogeny of Central Asia. Int. J. Earth Sci. 2009, 98, 1189–1217. [Google Scholar] [CrossRef]
  38. Jahn, B.M. The Central Asian Orogenic Belt and growth of the continental crust in the Phanerozoic. Geol. Soc. Lond. Spec. Publ. 2004, 226, 73–100. [Google Scholar] [CrossRef]
  39. Şengör, A.M.C.; Natal’in, B.A.; Sunal, G.; Van der Voo, R. The tectonics of the Altaids: Crustal growth during the construction of the continental lithosphere of Central Asia between ∼750 and ∼130 Ma Ago. Annu. Rev. Earth Planet. Sci. 2018, 46, 439–494. [Google Scholar] [CrossRef]
  40. Zhou, J.B.; Wilde, S.A.; Zhao, G.C.; Han, J. Nature and assembly of microcontinental blocks within the Paleo-Asian Ocean. Earth-Sci. Rev. 2018, 186, 76–93. [Google Scholar] [CrossRef]
  41. Xiao, W.J.; Windley, B.F.; Han, C.M.; Liu, W.; Wan, B.; Zhang, J.E.; Ao, S.J.; Zhang, Z.Y.; Song, D.F. Late Paleozoic to early Triassic multiple roll-back and oroclinal bending of the Mongolia collage in Central Asia. Earth-Sci. Rev. 2018, 186, 94–128. [Google Scholar] [CrossRef]
  42. Tan, Z.; Xiao, W.J.; Mao, Q.G.; Wang, H.; Sang, M.; Li, R.; Gao, L.M.; Guo, Y.H.; Gan, J.M.; Liu, Y.H.; et al. Final closure of the Paleo Asian Ocean basin in the early Triassic. Commun. Earth Environ. 2022, 3, 1–15. [Google Scholar] [CrossRef]
  43. Long, X.P.; Yuan, C.; Sun, M.; Safonova, I.; Xiao, W.J.; Wang, Y.J. Geochemistry and U–Pb detrital zircon dating of Paleozoic graywackes in East Junggar, NW China: Insights into subduction–accretion processes in the southern Central Asian Orogenic Belt. Gondwana Res. 2012, 21, 637–653. [Google Scholar] [CrossRef]
  44. Li, P.F.; Sun, M.; Rosenbaum, G.; Cai, K.D.; Yu, Y. Structural evolution of the Irtysh Shear Zone (northwestern China) and implications for the amalgamation of arc systems in the Central Asian Orogenic Belt. J. Struct. Geol. 2015, 80, 142–156. [Google Scholar] [CrossRef] [Green Version]
  45. Li, P.F.; Sun, M.; Rosenbaum, G.; Jourdan, F.; Li, S.Z.; Cai, K.D. Late Paleozoic closure of the Ob-Zaisan Ocean along the Irtysh shear zone (NW China): Implications for arc amalgamation and oroclinal bending in the Central Asian orogenic belt. GSA Bull. 2017, 129, 547–569. [Google Scholar] [CrossRef] [Green Version]
  46. Hu, W.W.; Li, P.F.; Rosenbaum, G.; Liu, J.L.; Jourdan, F.; Jiang, Y.D.; Wu, D.; Zhang, J.; Yuan, C.; Sun, M. Structural evolution of the eastern segment of the Irtysh Shear Zone: Implications for the collision between the East Junggar Terrane and the Chinese Altai Orogen (northwestern China). J. Struct. Geol. 2020, 139, 104126. [Google Scholar] [CrossRef]
  47. Aibai, A.; Zhang, Z.C.; Cheng, Z.G.; Huang, H.; Santosh, M. Highly differentiated juvenile crust-derived magmas linked with the Xilekuduke porphyry Mo (Cu) deposit in East Junggar, NW China. Ore Geol. Rev. 2019, 115, 103103. [Google Scholar] [CrossRef]
  48. Dong, L.H.; Xu, X.W.; Qu, X.; Li, G.M. Tectonic setting and formation mechanism of the circum-Junggar porphyritic copper deposit belts. Acta Petrol. Sin. 2009, 25, 713–737. [Google Scholar]
  49. Zhang, Y.Y.; Pe-Piper, G.; Piper, D.J.W.; Guo, Z.J. Early Carboniferous collision of the Kalamaili orogenic belt, North Xinjiang, and its implications: Evidence from molasse deposits. GSA Bull. 2013, 125, 932–944. [Google Scholar] [CrossRef]
  50. Zhang, Z.C.; Yan, S.H.; Chen, B.L.; Zhou, G.; He, Y.K.; Chai, F.M.; He, L.X.; Wan, Y.S. SHRIMP zircon U-Pb dating for subduction-related granitic rocks in the northern part of east Jungaar, Xinjiang. Chin. Sci. Bull. 2006, 51, 952–962. [Google Scholar] [CrossRef]
  51. Tao, H.F.; Sun, S.; Wang, Q.C.; Yang, X.F.; Jiang, L. Petrography and geochemistry of lower carboniferous greywacke and mudstones in Northeast Junggar, China: Implications for provenance, source weathering, and tectonic setting. J. Asian Earth Sci. 2014, 87, 11–25. [Google Scholar] [CrossRef]
  52. An, R.; Zhao, G.C.; Liu, Q.; Han, Y.G. Early Palaeozoic subduction-accretion in East Junggar (NW China): Insights from age, geochemical, and Sr-Nd-Hf isotopic data of andesitic rocks in the northern Yemaquan Arc. Lithos 2021, 380–381, 105892. [Google Scholar] [CrossRef]
  53. Xu, X.W.; Jiang, N.; Li, X.H.; Qu, X.; Yang, Y.H.; Mao, Q.; Wu, Q.; Zhang, Y.; Dong, L.H. Tectonic evolution of the East Junggar terrane: Evidence from the Taheir tectonic window, Xinjiang, China. Gondwana Res. 2013, 24, 578–600. [Google Scholar] [CrossRef]
  54. Li, D.; He, D.F.; Sun, M.; Zhang, L. The Role of Arc-Arc Collision in Accretionary Orogenesis: Insights From ∼320 Ma Tectono-sedimentary Transition in the Karamaili Area, NW China. Tectonics 2020, 39, e2019TC005623. [Google Scholar] [CrossRef]
  55. Chen, Y.J.; Pirajno, F.; Wu, G.; Qi, J.P.; Xiong, X.L. Epithermal deposits in North Xinjiang, NW China. Int. J. Earth Sci. 2012, 101, 889–917. [Google Scholar] [CrossRef]
  56. Wan, B.; Xiao, W.J.; Han, C.M.; Windley, B.F.; Zhang, L.C.; Qu, W.J.; Du, A.D. Re–Os molybdenite age of the Cu–Mo skarn ore deposit at Suoerkuduke in East Junggar, NW China and its geological significance. Ore Geol. Rev. 2014, 56, 541–548. [Google Scholar] [CrossRef]
  57. Goldfarb, R.; Qiu, K.F.; Deng, J.; Chen, Y.J.; Yang, L.Q. Orogenic Gold Deposits of China. Soc. Econ. Geol. Spec. Publ. 2019, 22, 263–324. [Google Scholar]
  58. Liang, P.; Chen, H.Y.; Wu, C.; Xie, Y.L. Pyrite and magnetite Re–Os isotope systematics at the Laoshankou Fe–Cu–Au deposit in the northern margin of the East Junggar terrane, NW Xinjiang, China: Constraints on the multistage mineralization and metal sources. Geol. J. 2019, 55, 4265–4278. [Google Scholar] [CrossRef]
  59. Hong, T.; Hollings, P.; Gao, J.; Xu, X.W.; Wu, Q.; Wu, C.; Mao, Q. Mineralization and petrogenesis of the Qiongheba porphyry copper deposit in Mengxi district, East Junggar, China. Ore Geol. Rev. 2020, 127, 103848. [Google Scholar] [CrossRef]
  60. Tang, D.M.; Qin, K.Z.; Su, B.X.; Mao, Y.J.; Evans, N.J.; Niu, Y.J.; Kang, Z. Sulfur and copper isotopic signatures of chalcopyrite at Kalatongke and Baishiquan: Insights into the origin of magmatic Ni-Cu sulfide deposits. Geochim. Cosmochim. Acta 2020, 275, 209–228. [Google Scholar] [CrossRef]
  61. Reed, W.P. Certificate of Analysis: Standard Reference Materials 610 and 611; National Institute of Standards and Technology: Gaithersburg, MD, USA, 1992; pp. 1–4. [Google Scholar]
  62. Paton, C.; Hellstrom, J.C.; Paul, B.; Woodhead, J.D.; Hergt, J.M. Iolite: Freeware for the visualisation and processing of mass spectrometric data. J. Anal. Atom. Spectrom. 2011, 26, 2508–2518. [Google Scholar] [CrossRef]
  63. Wilson, S.; Ridley, I.; Koenig, A. Development of sulfide calibration standards for the laser ablation inductively-coupled plasma mass spectrometry technique. J. Anal. Atom. Spectrom. 2002, 17, 406–409. [Google Scholar] [CrossRef]
  64. Myers, A.T.; Havens, R.G.; Niles, W.W. Glass reference standards for trace element analysis of geologic materials. In Developments in Applied Spectroscopy; Grove, E.L., Ed.; Springer: New York, NY, USA, 1970; Volume 8. [Google Scholar] [CrossRef]
  65. Reich, M.; Kesler, S.E.; Utsunomiya, S.; Palenik, C.S.; Chryssoulis, S.L.; Ewing, R.C. Solubility of gold in arsenian pyrite. Geochim. Cosmochim. Acta 2005, 69, 2781–2796. [Google Scholar] [CrossRef]
  66. Yang, R.S.; Chen, Y.J.; Xie, J.L. X-ray photoelectron spectroscopic study on arsenian pyrite and arsenopyrite from the Yangshan gold deposit, Gansu province (North China). Acta Petrol. Sin. 2009, 25, 2791–2800. [Google Scholar]
  67. Li, J.; Chen, Y.J.; Liu, Y.X. Typomorphic characteristics of pyrite from the lode gold deposits in North China Craton: Implications for fluid mineralization. J. Miner. Petrol. 2004, 24, 93–102. [Google Scholar]
  68. Simon, G.; Huang, H.; Hahn, J.E.P.; Kesler, S.E.; Kao, L.S. Oxidation state of gold and arsenic in gold-bearing arsenian pyrite. Am. Mineral. 1999, 84, 1071–1079. [Google Scholar] [CrossRef]
  69. Chouinard, A.; Paquette, J.; Williams-Jones, A.E. Crystallographic controls on trace-element incorporation in auriferous pyrite from the Pascua epithermal high-sulfidation deposit, Chile-Argentina. Can. Mineral. 2005, 43, 951–963. [Google Scholar] [CrossRef] [Green Version]
  70. Cook, N.J.; Ciobanu, C.L.; Meria, D.; Silcock, D.; Wade, B. Arsenopyrite-pyrite association in an orogenic gold ore: Tracing mineralization history from textures and trace elements. Econ. Geol. 2013, 108, 1273–1283. [Google Scholar] [CrossRef]
  71. Zhou, C.; Yang, Z.; Sun, H.S.; Koua, K.A.D.; Lyu, C.L. LA-ICP-MS trace element analysis of sphalerite and pyrite from the Beishan Pb-Zn ore district, south China: Implications for ore genesis. Ore Geol. Rev. 2022, 150, 105128. [Google Scholar] [CrossRef]
  72. Large, R.R.; Meffre, S.; Burnett, R.; Guy, B.; Bull, S.; Gilbert, S.; Goemann, K.; Danyushevsky, L. Evidence for an intrabasinal source and multiple concentration processes in the formation of the Carbon Leader Reef, Witwatersrand Supergroup, South Africa. Econ. Geol. 2013, 108, 1215–1241. [Google Scholar] [CrossRef]
  73. Gregory, D.D.; Large, R.R.; Halpin, J.A.; Baturina, E.L.; Lyons, T.W.; Wu, S.; Danyushevsky, L.; Sack, P.J.; Chappaz, A.; Maslennikov, V.V.; et al. Trace element content of sedimentary pyrite in black shales. Econ. Geol. 2015, 110, 1389–1410. [Google Scholar] [CrossRef]
  74. Zhang, Y.; Chen, H.Y.; Cheng, J.M.; Tian, J.; Zhang, L.J.; Olin, P. Pyrite geochemistry and its implications on Au-Cu skarn metallogeny: An example from the Jiguanzui deposit, Eastern China. Am. Mineral. 2022, 107, 1910–1925. [Google Scholar] [CrossRef]
  75. Ding, Z.P.; Sun, X.M.; Hu, S.Y.; Chen, H.J.; Li, D.F.; Fu, Y.; Xu, L.; Wu, Z.Y.; Huang, F. Role of carbonaceous material in gold precipitation for orogenic gold deposits: A case study of the Bangbu gold deposit in southern Tibet, China. Ore Geol. Rev. 2023, 152, 105231. [Google Scholar] [CrossRef]
  76. Vasilopoulos, M.; Molnár, F.; Ranta, J.P.; O’Brien, H. Mineralogical, lithogeochemical and sulfide trace element characteristics of the Hirvilavanmaa Au-only and the base metal-rich Naakenavaara orogenic gold deposits in the Central Lapland belt, northern Finland. J. Geochem. Explor. 2023, 244, 107132. [Google Scholar] [CrossRef]
  77. Loftus-Hills, G.; Solomon, M. Cobalt, nickel and selenium in sulphides as indicators of ore genesis. Miner. Depos. 1967, 2, 228–242. [Google Scholar] [CrossRef]
  78. Bralia, A.; Sabatini, G.; Troja, F. A revaluation of the Co/Ni ratio in pyrite as geochemical tool in ore genesis problems. Miner. Depos. 1979, 14, 353–374. [Google Scholar] [CrossRef]
  79. Bajwah, Z.U.; Seccombe, P.K.; Offler, R. Trace element distribution, Co:Ni ratios and genesis of the Big Cadia iron-copper deposit, New South Wales, Australia. Miner. Depos. 1987, 22, 292–300. [Google Scholar] [CrossRef]
  80. Brill, B.A. Trace-element contents and partitioning of elements in ore minerals from the CSA Cu-Pb-Zn Deposit, Australia, and implications for ore genesis. Can. Mineral. 1989, 27, 263–274. [Google Scholar]
  81. Large, R.R.; Danyushevsky, L.; Hollit, C.; Maslennikov, V.; Meffre, S.; Gilbert, S.; Bull, S.; Scott, R.; Emsbo, P.; Thomas, H.; et al. Gold and trace element zonation in pyrite using a laser imaging technique: Implications for the timing of gold in orogenic and Carlin-Style sediment-hosted deposits. Econ. Geol. 2009, 104, 635–668. [Google Scholar] [CrossRef]
  82. Revan, M.K.; Genç, Y.; Maslennikov, V.V.; Maslennikova, S.P.; Large, R.R.; Danyushevsky, L.V. Mineralogy and trace-element geochemistry of sulfide minerals in hydrothermal chimneys from the Upper-Cretaceous VMS deposits of the eastern Pontide orogenic belt (NE Turkey). Ore Geol. Rev. 2014, 63, 129–149. [Google Scholar] [CrossRef]
  83. Chen, Y.J. The development of continental collision metallogeny and its application. Acta Petrol. Sin. 2013, 29, 1–17. [Google Scholar]
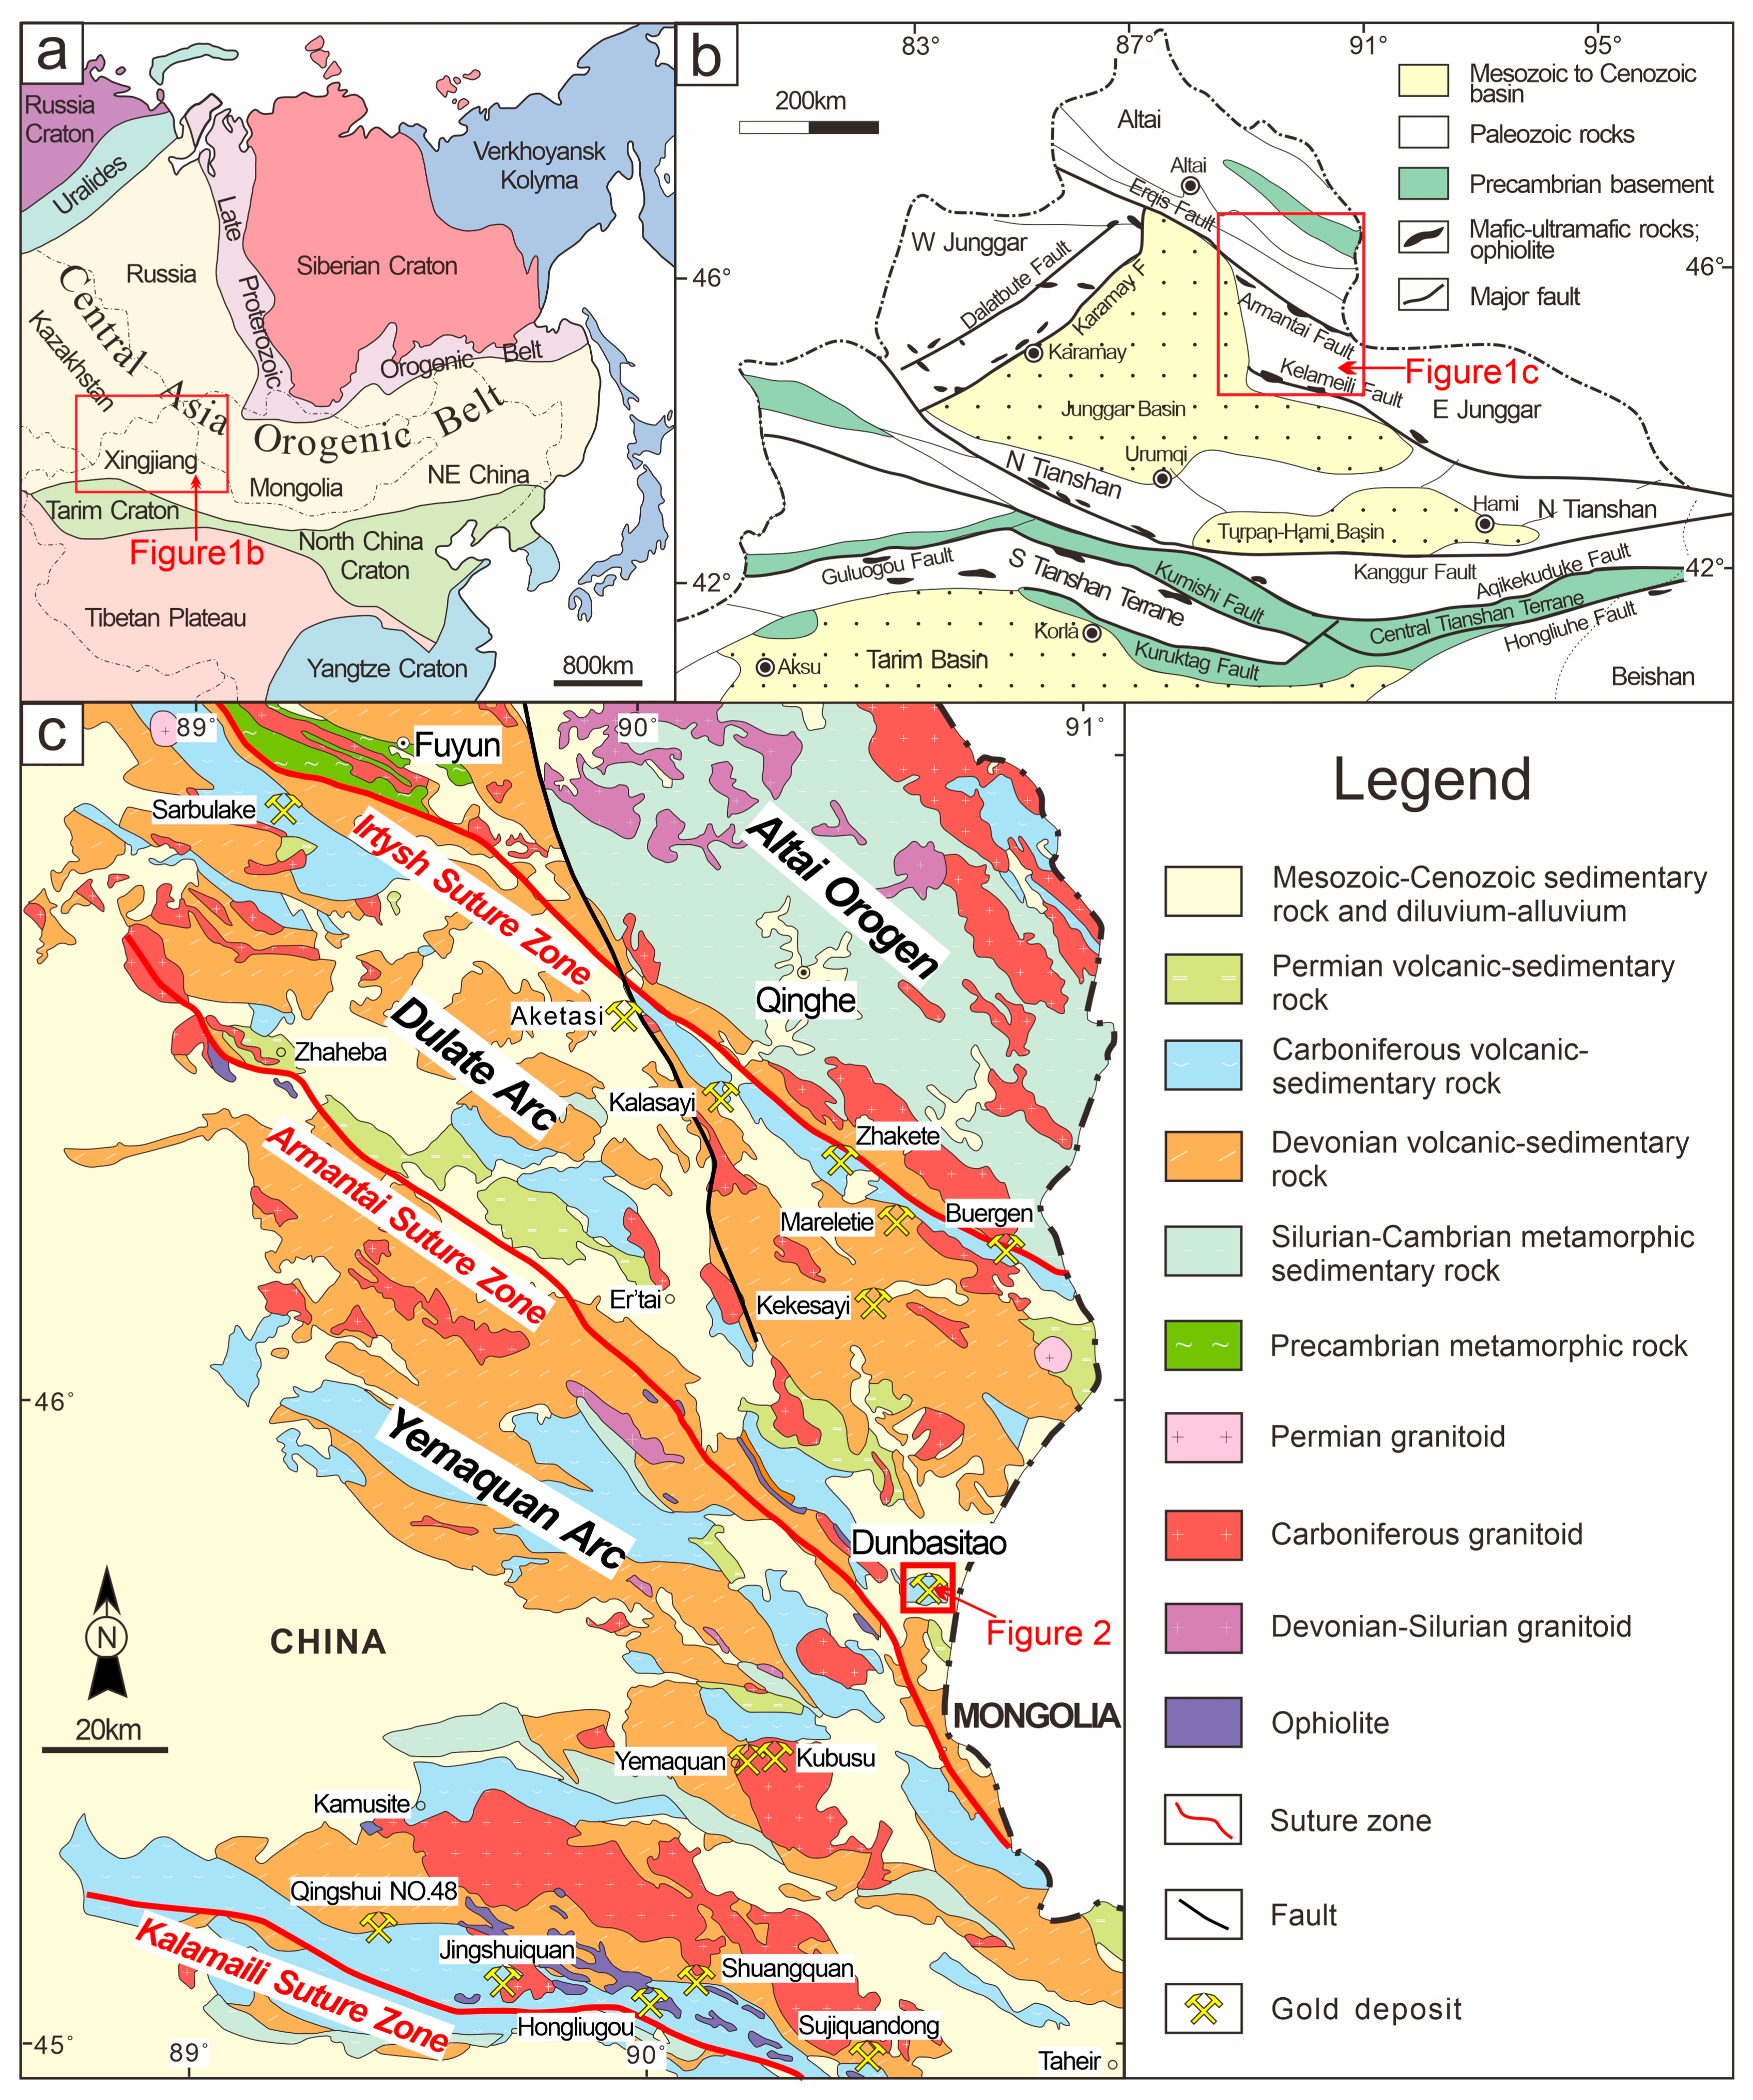
Figure 1. Tectonic locations of East Junggar and Dunbasitao gold deposit (according to Liu et al. [35]). (a) Simplified tectonic map of the Central Asian Orogenic Belt showing the location of North Xinjiang. (b) Simplified geological map showing the division of tectonic units in North Xinjiang. (c) Regional geological map of the northern part of East Junggar showing the location of the Dunbasitao gold deposit.
Minerals 13 00534 g001
Figure 2. Simplified geological map of Dunbasitao district (according to Liu et al. [35]).
Minerals 13 00534 g002
Figure 3. The distribution characteristics of orebodies in the Dunbasitao gold deposit (according to Liu et al. [35]). (a) Geological map of the area around the main orebody with the no. 0 exploration line noted. (b) Cross-section of the no. 0 exploration line, showing the relationships between strata, porphyritic quartz diorite, and orebodies.
Minerals 13 00534 g003
Figure 4. Photographs of hand specimens showing mineralization characteristics at different stages in the Dunbasitao gold deposit. (a) Sedimentary pyrite nodules of Py0 hosted in the Jiangbasitao Formation with the bedding around them significantly curved. (b) A quartz–albite vein in the early stage with a coarse-grained cubic Py1 in it. (c) A quartz–ankerite–sulfide vein in the middle stage with fine-grained Py2 and arsenopyrite in it. (d) Disseminated, anhedral Py2 in host rocks. (e) A quartz–calcite vein in the late stage without sulfides. Qz—quartz; Ab—albite; Ank—ankerite; Cal—calcite; Py—pyrite; Apy—arsenopyrite.
Minerals 13 00534 g004
Figure 5. Photomicrographs showing the features of pyrite at different stages in the Dunbasitao gold deposit, among which the images in Figure 5d,e are microscopy photos, whereas the others are BSE images. (a) Pre-ore framboidal Py0 produced in Jiangbasitao Formation. (b) Py1 in the early stage is produced in a quartz–albite vein, which is internally homogeneous and poor in mineral inclusions. (c) This local micrograph of a middle-stage quartz–ankerite vein shows that the native gold filled in crystal fissures of quartz and ankerite, and the arsenopyrite intergrew with the gold. (d) Py2 intergrew with arsenopyrite in the quartz–ankerite vein in the middle stage. (e) Native gold inclusions produced in Py2 in the middle stage. (f) This BSE image shows the internal texture of Py2 produced in the quartz–ankerite vein in the middle stage; Py2 is composed of a dark and inclusion-rich core (Py2a), a bright mantle (Py2b), and a medium-bright rim (Py2c). The irregular border of Py2a and its relict texture indicates that Py2a has been replaced by Py2b, and the straight boundary between Py2b and Py2c indicates that Py2c overgrew on Py2b. Qz—quartz; Ab—albite; Py—pyrite; Au—native gold; Apy—arsenopyrite; Ank—ankerite; Ccp—chalcopyrite.
Minerals 13 00534 g005
Figure 6. The mineral paragenesis sequence of the Dunbasitao gold deposit (according to Liu et al. [35]). The thickness of the line represents the amount of that mineral.
Minerals 13 00534 g006
Figure 7. Representative LA-ICP-MS time-resolved depth profiles of different pyrites from the Dunbasitao gold deposit. Element signal peaks are marked by gray areas. (a) Time-resolved depth profile of Py0 shows that most element curves are smooth, which indicates these elements were incorporated into Py0 as solid solutions. (b) Time-resolved depth profile of Py1. Most trace element signals are weak, which reflects their low contents in Py1. Pb-Cu peak indicates the presence of Pb-Cu-bearing inclusion. (c) Time-resolved depth profile of Py2a showing strong signals of various elements and many element peaks. (d) Time-resolved depth profile of Py2b showing the strong Au signal. The curve of Au is smooth, which suggests the Au occurs in the form of lattice gold. Pb peak indicates the presence of Pb-bearing inclusion, probably galena. (e) Time-resolved depth profile of Py2b showing the Sb and Pb peaks, which are probably due to the presence of stibnite and galena inclusions. (f) Time-resolved depth profile of Py2c whose Au signal is significantly weaker than that of Py2b.
Minerals 13 00534 g007
Figure 8. Boxplot showing selected trace element contents in different types of pyrite from the Dunbasitao gold deposit.
Minerals 13 00534 g008
Figure 9. BSE image and coupled LA-ICP-MS trace element mappings of a typical grain of Py2. (a) BSE image of a Py2 grain. (bl) Mapping of critical elements in Py2. Py2a is rich in Cu, Zn, Ag, Sn, Sb, Pb, and Bi. Py2b is rich in Au, As, Co, and Ni. Py2c contains a certain amount of Au but is depleted in most trace elements.
Minerals 13 00534 g009
Figure 10. Binary plots and correlations between Au and other elements for different types of pyrite from the Dunbasitao gold deposit. In Figure 10a, the dashed line represents the Au saturation line for Carlin-type deposits [65], and the solid line represents that for orogenic gold deposits [11].
Minerals 13 00534 g010
Figure 11. Elemental binary plots and correlations for different types of pyrite from the Dunbasitao gold deposit.
Minerals 13 00534 g011
Figure 12. Binary S vs. As plot for the Dunbasitao pyrites, showing the significant negative correlation between As and S. The S contents are based on EPMA data, and the As contents are based on LA-ICP-MS data.
Minerals 13 00534 g012
Figure 13. Classification result histograms for Py0 (a), Py1 (b), Py2a (c), Py2b (d), and Py2c (e) from the Dunbasitao gold deposit based on two different machine learning classifiers developed by Gregory et al. [22] and Zhong et al. [23]. Note that the latter could only discriminate orogenic, sedimentary, and VHMS types.
Minerals 13 00534 g013
Figure 14. Schematic diagrams showing the formation processes for the different types of pyrites from the Dunbasitao deposit. (a) The pre-ore Py0 hosted various trace elements during the sedimentary process of the Jiangbasitao Formation. Initial metamorphic fluids carried major amounts of As, Au, Co, Ni, Se, Zn, Ag, Cd, Sn, Cu, Sb, Pb, Bi, and other elements. In the early stage, coarse-grained, cubic, homogeneous, barren Py1 precipitated from fluids, which was poor in various trace elements. (b) In the middle stage, the fluid immiscibility led to the dramatic precipitation of most trace elements, forming the fine-grained, cubic, and/or pyritohedron Py2a rich in trace elements. (c) Subsequently, a significant drop in the fluid temperature led to the dissociation of the Au complex. The ore-forming fluids replaced the Py2a and formed the gold-rich Py2b. (d) After that, the temperature of ore-forming fluids recovered slightly, the meteoric water kept diluting the fluid, and fluid fO2 increased, which was companied by the Py2c overgrew on Py2b and the decrease in the most element contents.
Minerals 13 00534 g014
Table 1. Geology of samples from the Dunbasitao gold deposit analyzed using EPMA and LA-ICP-MS.
Sample No.StageTypeDescription
307-4Pre-orePy0Sedimentary rock rich in pyrite framboids and nodules
810-24Pre-orePy0Sedimentary rock rich in pyrite framboids and nodules
002-13bEarlyPy1Chlorite-altered host rock containing early-stage quartz–albite–pyrite vein
304-16MiddlePy2Disseminated ore containing middle-stage quartz–ankerite–pyrite vein
5203-5MiddlePy2Middle-stage quartz–ankerite–pyrite vein
Table 2. The statistical analysis of representative trace elements in pyrites from the Dunbasitao gold deposit determined using LA-ICP-MS (ppm).
Type MnCoNiCuZnAsSeMoAgSbTeAuPbBi
Py0 (N = 17)Min.21.06.8828.675.53.311770.507.170.377.190.100.0118.30.01
Max.81755926546743317243.4845.45.361001.630.364600.33
Median19025669.01158.446190.8924.62.2944.80.890.012010.16
Average22418778.117369.07391.3121.92.4950.90.780.061770.15
SD17715954.61231315400.9411.01.6833.30.580.091240.11
Py1 (N = 24)Min.0.110.090.160.110.4720.914.90.210.040.100.160.010.020.00
Max.45.140.637826.63.3335578.80.250.820.353.280.0219.40.00
Median0.134.222.830.120.6012840.00.220.050.100.160.010.020.00
Average2.008.1536.12.191.0214045.00.220.100.110.380.011.780.00
SD8.9810.786.55.750.8490.317.00.010.180.050.660.004.120.00
Py2a (N = 6)Min.0.120.742.8416959553.11.250.162.8517.30.180.3119.70.18
Max.0.3518.129.2546754465952.950.2072631900.202.481890.35
Median0.211.195.1524539682181.320.189.2730.80.191.271330.29
Average0.224.198.99110733512721.810.181285560.191.351140.27
SD0.096.279.17195116681860.720.0126811760.010.6855.20.07
Py2b (N = 12)Min.0.100.100.1616.70.48301391.080.150.040.110.1620.10.350.00
Max.2.4660.081.423952.5652655.780.187.7443.00.182012400.42
Median0.1316.617.568.70.60483632.620.171.079.980.1711066.90.09
Average0.3722.426.587.86.57492582.880.171.4410.10.1710973.50.11
SD0.6418.824.263.814.698841.600.011.9911.10.0149.570.50.12
Py2c (N = 12)Min.0.110.100.512.670.5298951.140.160.040.110.160.180.360.00
Max.84446.490.544513.4316549.911.571.329.550.2218.065.60.19
Median0.131.474.2315.50.63197524.660.180.181.290.183.577.650.01
Average97.06.3219.058.32.32195375.150.380.392.750.185.2616.20.04
SD24212.727.61203.8359562.560.410.453.210.015.3219.30.06
Abbreviations: min. = minimum; max. = maximum; SD = standard deviation; and N = number of individual spot analyses.
Table 3. Classification results for different types of pyrite from the Dunbasitao gold deposit based on the study by Gregory et al. [22].
TypeStageDiscrimination Results (Number, Percentage)
OrogenicSedimentaryVHMSPorphyry
Py0Pre-ore0 (0%)17 (100%)0 (0%)0 (0%)
Py1Early0 (0%)0 (0%)0 (0%)24 (100%)
Py2aMiddle0 (0%)0 (0%)6 (100%)0 (0%)
Py2bMiddle9 (75.00%)0 (0%)1 (8.33%)2 (16.67%)
Py2cMiddle4 (33.33%)0 (0%)2 (16.67%)6 (50.00%)
Table 4. Classification results for different types of pyrite from the Dunbasitao gold deposit based on the study by Zhong et al. [23].
TypeStageDiscrimination Results (Number, Percentage)
OrogenicSedimentaryVHMS
Py0Pre-ore3 (17.65%)14 (82.35%)0 (0%)
Py1Early16 (66.67%)3 (12.50%)5 (20.83%)
Py2aMiddle2 (33.33%)0 (0%)4 (66.67%)
Py2bMiddle11 (91.67%)1 (8.33%)0 (0%)
Py2cMiddle12 (100%)0 (0%)0 (0%)
Disclaimer/Publisher’s Note: The statements, opinions and data contained in all publications are solely those of the individual author(s) and contributor(s) and not of MDPI and/or the editor(s). MDPI and/or the editor(s) disclaim responsibility for any injury to people or property resulting from any ideas, methods, instructions or products referred to in the content.