Article

Luminescence Characteristics of Green Grossular Garnets

Gemological Institute, China University of Geosciences, Wuhan 430074, China
*
Author to whom correspondence should be addressed.
Minerals 2023, 13(5), 639; https://doi.org/10.3390/min13050639
Submission received: 4 April 2023 / Revised: 29 April 2023 / Accepted: 3 May 2023 / Published: 4 May 2023

Abstract

:
Some light green grossular garnets exhibit orange-red luminescence under long-wave and short-wave ultraviolet light. To characterize their luminescence behavior, we studied seven grossular garnets with typical colors ranging from light yellowish-green to intense green by using photoluminescence (PL), ultraviolet–visible (UV–Vis) spectroscopy, electron paramagnetic resonance (EPR), Electron Probe Microanalysis (EPMA) and laser ablation inductively coupled plasma mass spectrometry (LA-ICP-MS). In the PL spectra of these grossular garnets samples, a broad band exists at about 589 nm and three sharp peaks appear at 697, 702 and 716 nm. The three-dimensional fluorescence spectra reveal two luminescence emissions. They are (1) a broad band near 600 nm; and (2) a series of sharp peaks centered at 697, 702 and 716 nm. In the UV–Vis spectra, two prominent asymmetrical absorption bands near 430 and 605 nm are related to Cr3+ or Cr3+/V3+, and minor absorption peaks at 408 and 419/420 nm are related to Mn2+. EMPA and LA-ICP-MS analysis confirmed the existence of trace elements Ti, V, Cr and Mn. Furthermore, the EPR spectrum excluded the existence of V2+ and V4+ and confirmed the existence of Mn2+, Cr3+ and Fe3+. Regarding V, an interesting phenomenon was reported in which the intensity of luminescence could be suppressed in grossular garnets with higher concentrations of V. These results imply that chromium and manganese are the luminescence activators in grossular garnets, and vanadium is a powerful quencher.

1. Introduction

Grossular, with the chemical formula Ca3Al2(SiO4)3, is the Ca–Al species of the six frequent members of the garnet group which has more color varieties than any other garnet species. It displays colors ranging from colorless to pink, green, brown, red, yellow and orange. In the global gemstone market, the value of grossular highly depends on its coloration, and the green series are the most popular. Tsavorite, a grossular variety with saturated green, is the most familiar grossular member, which was discovered by Campbell Bridges in 1967 in northeastern Tanzania [1]. Its economic deposits include Tanzania, Kenya, Madagascar and minor occurrences in Pakistan and Antarctica [2]. Except for tsavorite, other varieties in lighter mint-green (“Merelani” garnets), light yellowish (occasionally termed “Kiwi” garnets) and virtually colorless with a faint tinge of green (“Leuco” garnets) garnets are all examples belonging to the green grossular garnet family. All the names mentioned above are commercial, but there still exist some hidden regulations and connections with their color and trace chemical composition. In mineralogy, all these green colorations are due to the substitution of aluminum (Al) by chromium (Cr) and/or some vanadium (V, if any) [3]. Recently, five new chemical types have been defined based on the variation of the V–Mn–Cr contents, which can provide a helpful tool for identifying the geographic origin of tsavorites from East Africa, Madagascar and East Antarctica [4].
Mineral luminescence is a common phenomenon, and transition metal elements (e.g., Cr, Mn, V and Ti) with different valence are important luminescence centers. The luminescence of Cr3+ in minerals has been well investigated, where studied minerals include corundum, spinel, topaz, emerald, etc. [5,6,7,8]. Mn2+ is also a well-known activator in many minerals. It is responsible for green, yellow and orange-red luminescence [8]. Some Mn-bearing axinite can emit orange luminescence. In addition, Mn2+ is an important luminescence activator of garnet.
Grossular garnet is a common luminescent mineral. The red grossular garnets from Mexico showed scarlet red luminescence under shortwave ultraviolet (SWUV) light, and microprobe testing indicated that manganese is the reason for red luminescence [9]. However, the specific luminescence mechanism was not discussed in detail. In 1995, Mazurak et al. found that Cr3+ and V3+ cause the luminescence of green grossular through absorption and luminescence spectra [10]. Recently, some grossular garnets demonstrated strong pinkish-red luminescence under long-wave ultraviolet (LWUV) light, supposedly induced by Mn2+ [11]. In 2013, Gaft et al. studied the luminescence features via the laser-induced time-resolved spectroscopy of grossular from eight origins, which expressed trace elements Mn2+, Mn3+, Mn4+, V2+, Ni2+ and REE3+, which could be the luminescence centers of grossular. The above trace elements enter the grossular lattice by substitution, usually at the site of Ca2+ (like Mn2+) or Al3+ (like Cr3+ and V3+) [12].
Tanzania, one of the high-value economic deposits in the Neoproterozoic Mozambique Belt, has an extensive geologic history and hosts a variety of gem and mineral deposits [13,14,15]. Some green grossular garnets from Tanzania exhibit orangey-red luminescence under LWUV light and yellowish-orange luminescence under SWUV light. Therefore, this work aims to explore the cause of luminescence in green grossular garnets from Tanzania and to compare these properties with different hues and saturations of luminescence.

2. Materials and Methods

Seven faceted grossular samples (BH1-7) with colors ranging from light yellowish-green to intense green (Figure 1) are listed in Table 1. These natural grossular samples were collected from a gem dealer who claimed they were mined from Tanzania. Some samples show different intensities of orange-red luminescence under LWUV light and yellowish-orange luminescence under SWUV light (Figure 1).
Sample photos and luminescence images were captured by a Nikon D810 camera in Madelight DIB-1612N LED light box (approximately 5500 K color temperature) in the Gemmological Institute of China University of Geosciences (Wuhan, China). The external UV light source is a traditional gemological mercury lamp.
Following the luminescence images, the three-dimensional (3D) fluorescence spectra of samples BH1 and BH5 were obtained using a JASCO FP-8500 fluorescence spectrometer (JASCO, Ishikawamachi Hachioji-shi Tokyo, Japan) in the Gemmological Institute of China University of Geosciences (Wuhan, China). The following parameters were used: excitation (Ex) range from 350 to 700 nm with 5 nm bandwidth; emission (Em) range from 350 to 700 nm with 2.5 nm bandwidth; photomultiplier (PMT) voltage was set to 700 V; and the resolution was controlled within 2.5 nm.
To obtain deeper insight into the distribution of luminescence for its trace elements in the next step, a mapping of luminescence on sample BH3 was accessed by JASCO NRS7500 Raman spectrometer with a 532 nm laser in the Gemmological Institute of China University of Geosciences (Wuhan, China).
Mineral chemical analyses were performed using a JEOL JXA-8230 electron probe microanalyzer (EPMA) with four wavelength-dispersive spectrometers (WDS) at the Center for Global Tectonics, School of Earth Sciences, China University of Geosciences (Wuhan). The following parameters were used: 15 kV accelerating voltage; 20 nA probe current; and a 10 μm beam diameter. Dwell times were 10 s on element peaks and half that on background locations adjacent to peaks. Raw X-ray intensities were corrected using a ZAF (atomic number, absorption, fluorescence) correction procedure. Trace elements analysis was performed using a GeoLasPro Agilent 7900a LA-ICP-MS at Wuhan Sample Solution Analytical Technology Co., Ltd., Wuhan, China. The laser beam spot diameter was 44 μm with a frequency of 5 Hz and an intensity of 5.5 J/cm2. NIST 610, BHVO-2G, BCR-2G and BIR-1G were used as calibration reference materials. The raw data were processed by ICPMS Data Cal software, and the multi-external standards combined internal standard calibration strategy for oxide was used for quantitative calculations.
Photoluminescence (PL) spectra of samples were obtained using HORIBA LabRAM HR Elolution spectrometer in the State Key Laboratory of Geological Processes and Mineral Resources, China University of Geosciences (Wuhan, China). The testing method was used with the following parameters: 325 nm; 600 grating; and 325–1000 nm range.
Electron paramagnetic resonance spectra have been recorded on an electron paramagnetic resonance (EPR) spectrometer (A300, Bruker) at 77 K in Detection of Technical Sousepad (Wuhan, China). The magnetic field was scanned from 500 to 5000 G.
Ultraviolet–visible (UV–Vis) absorption spectra were obtained by using a Lambda 650S spectrometer in the Gemmological Institute of China University of Geosciences (Wuhan, China). The wavelength covers the ultraviolet-to-near-infrared band, i.e., from 350 to 800 nm.

3. Results and Discussion

3.1. Photoluminescence Features

Figure 1 shows that the luminescence excited from LWUV light is orange-red, while that from SWUV light is yellowish-orange (samples BH1–5). The luminescence intensity under LWUV and SWUV decreased as the green hue strengthened. This rough regulation implies that the green chromophores are negatively correlated with luminescence. A typical instance is sample BH3, which contains distinguished green color zones where we can hardly recognize luminescence under SWUV.
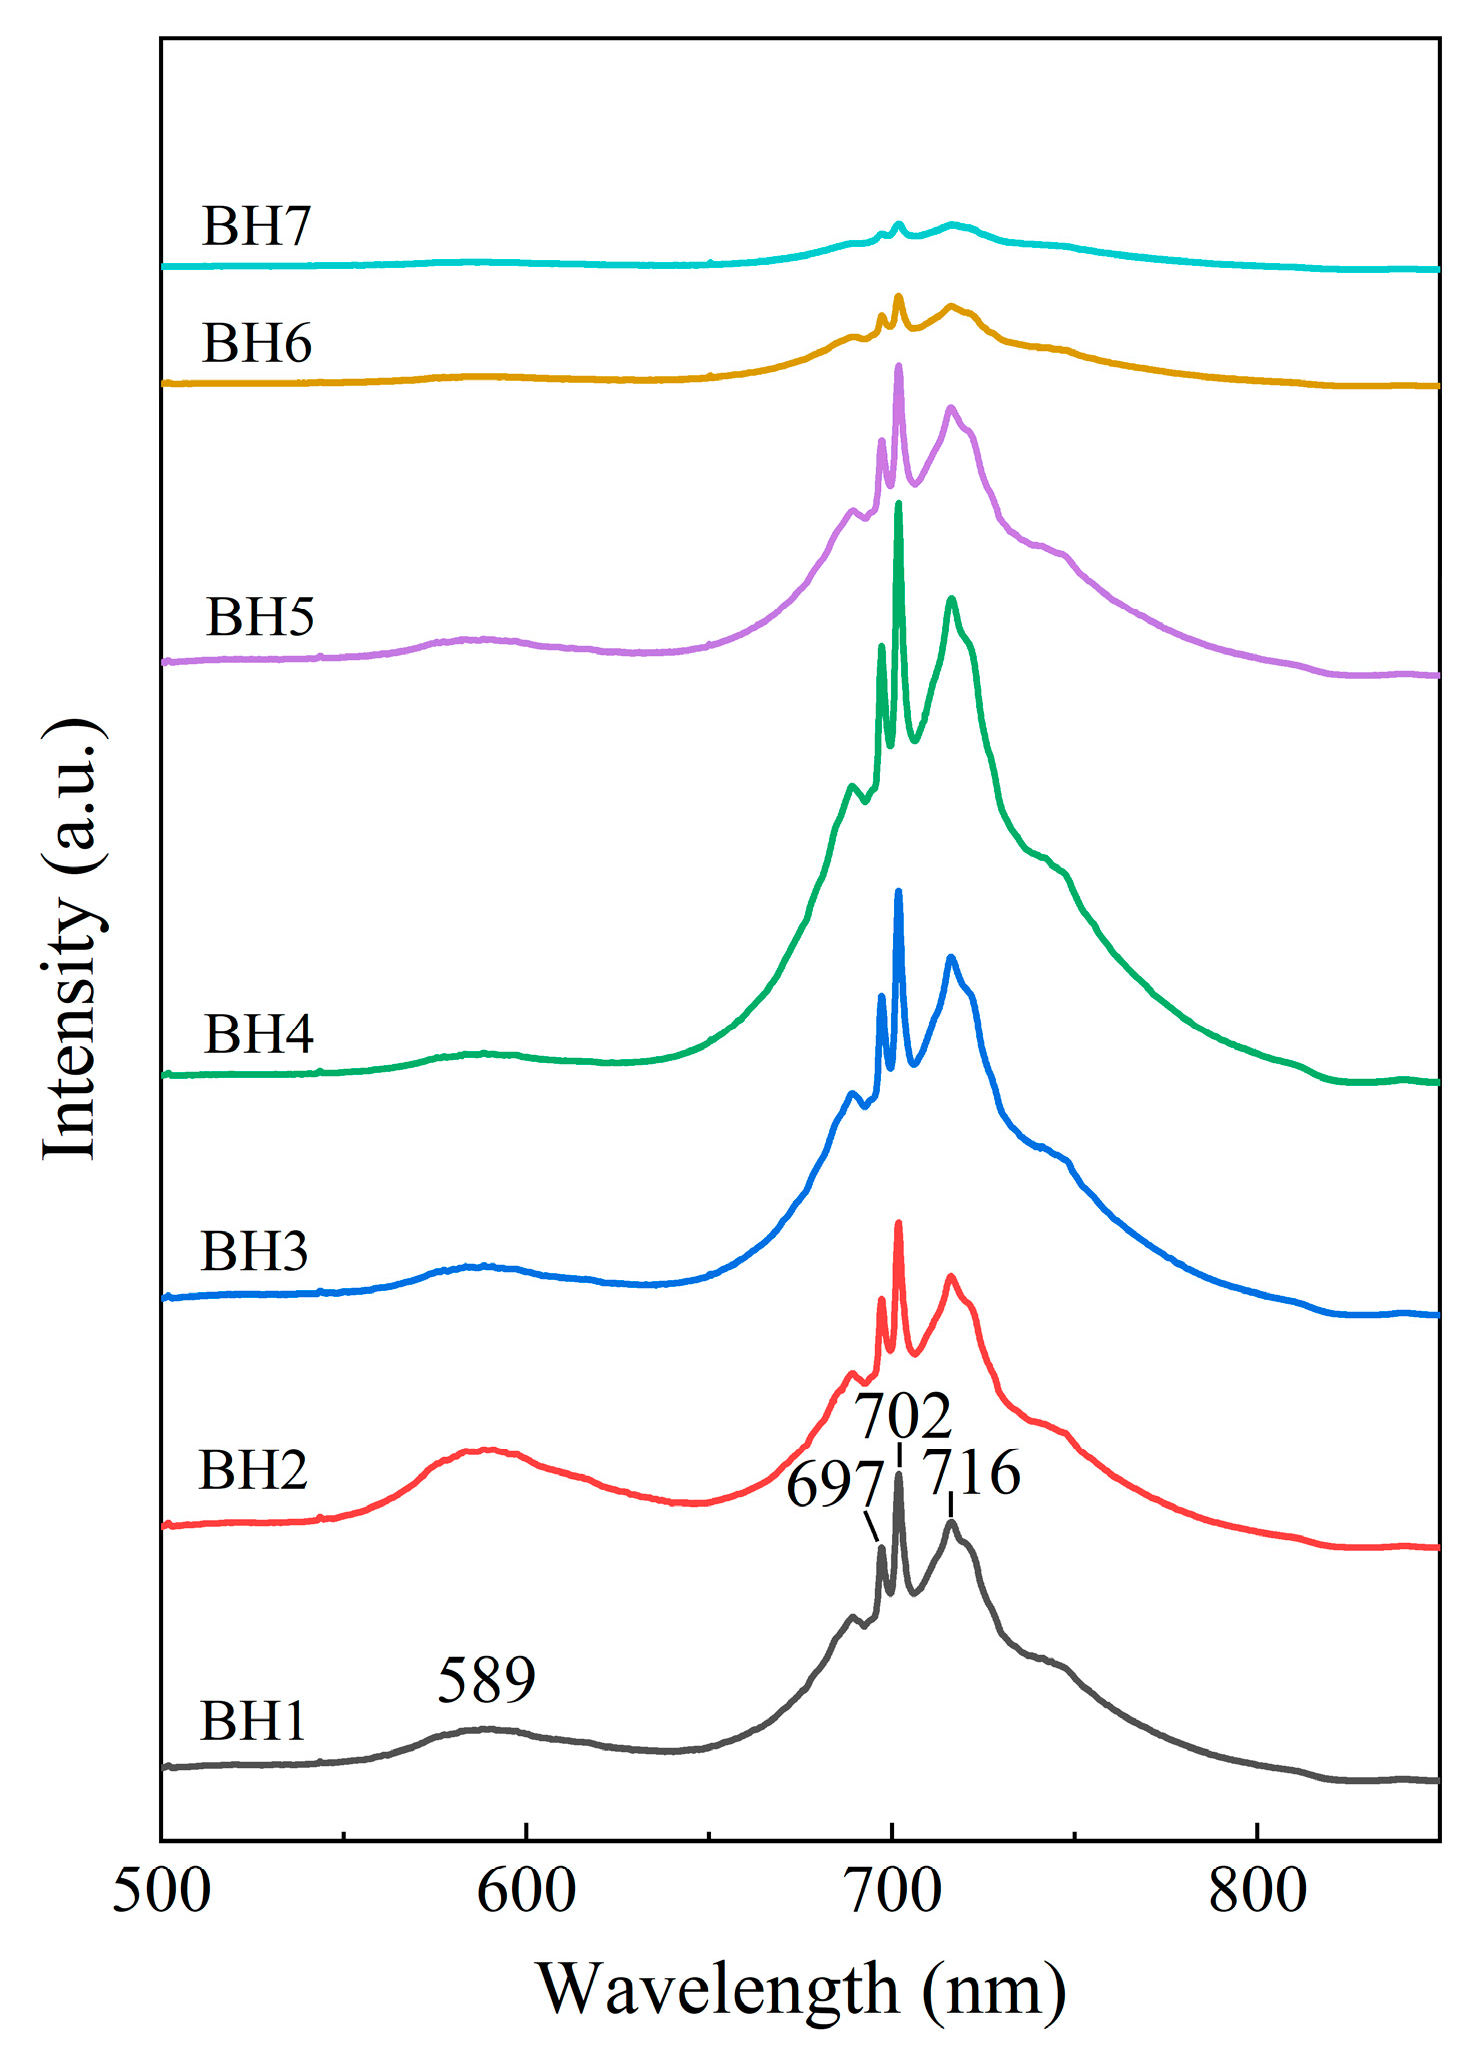
To investigate the luminescence features, PL spectra of green grossular samples were collected. Overall, the PL spectra of samples with intense luminescence (sample BH1–5) are stronger than those of samples which are almost without luminescence (sample BH6 and 7). The spectra show a broad peak at ~589 nm and a series of sharp peaks around 700 nm (Figure 2). There are two sharp, independent peaks, centered at 697 and 702 nm, and an asymmetric band at 716 nm. In addition, two shoulder peaks are located at approximately 721 nm and 746 nm. Combining the photoluminescence spectra with previous literature data, the broad band, ~589 nm, turns out to be related to Mn2+, sharp peaks at 697 and 702 nm are associated with Cr3+ and the asymmetric band at 716 nm may be attributed to V2+ [12].
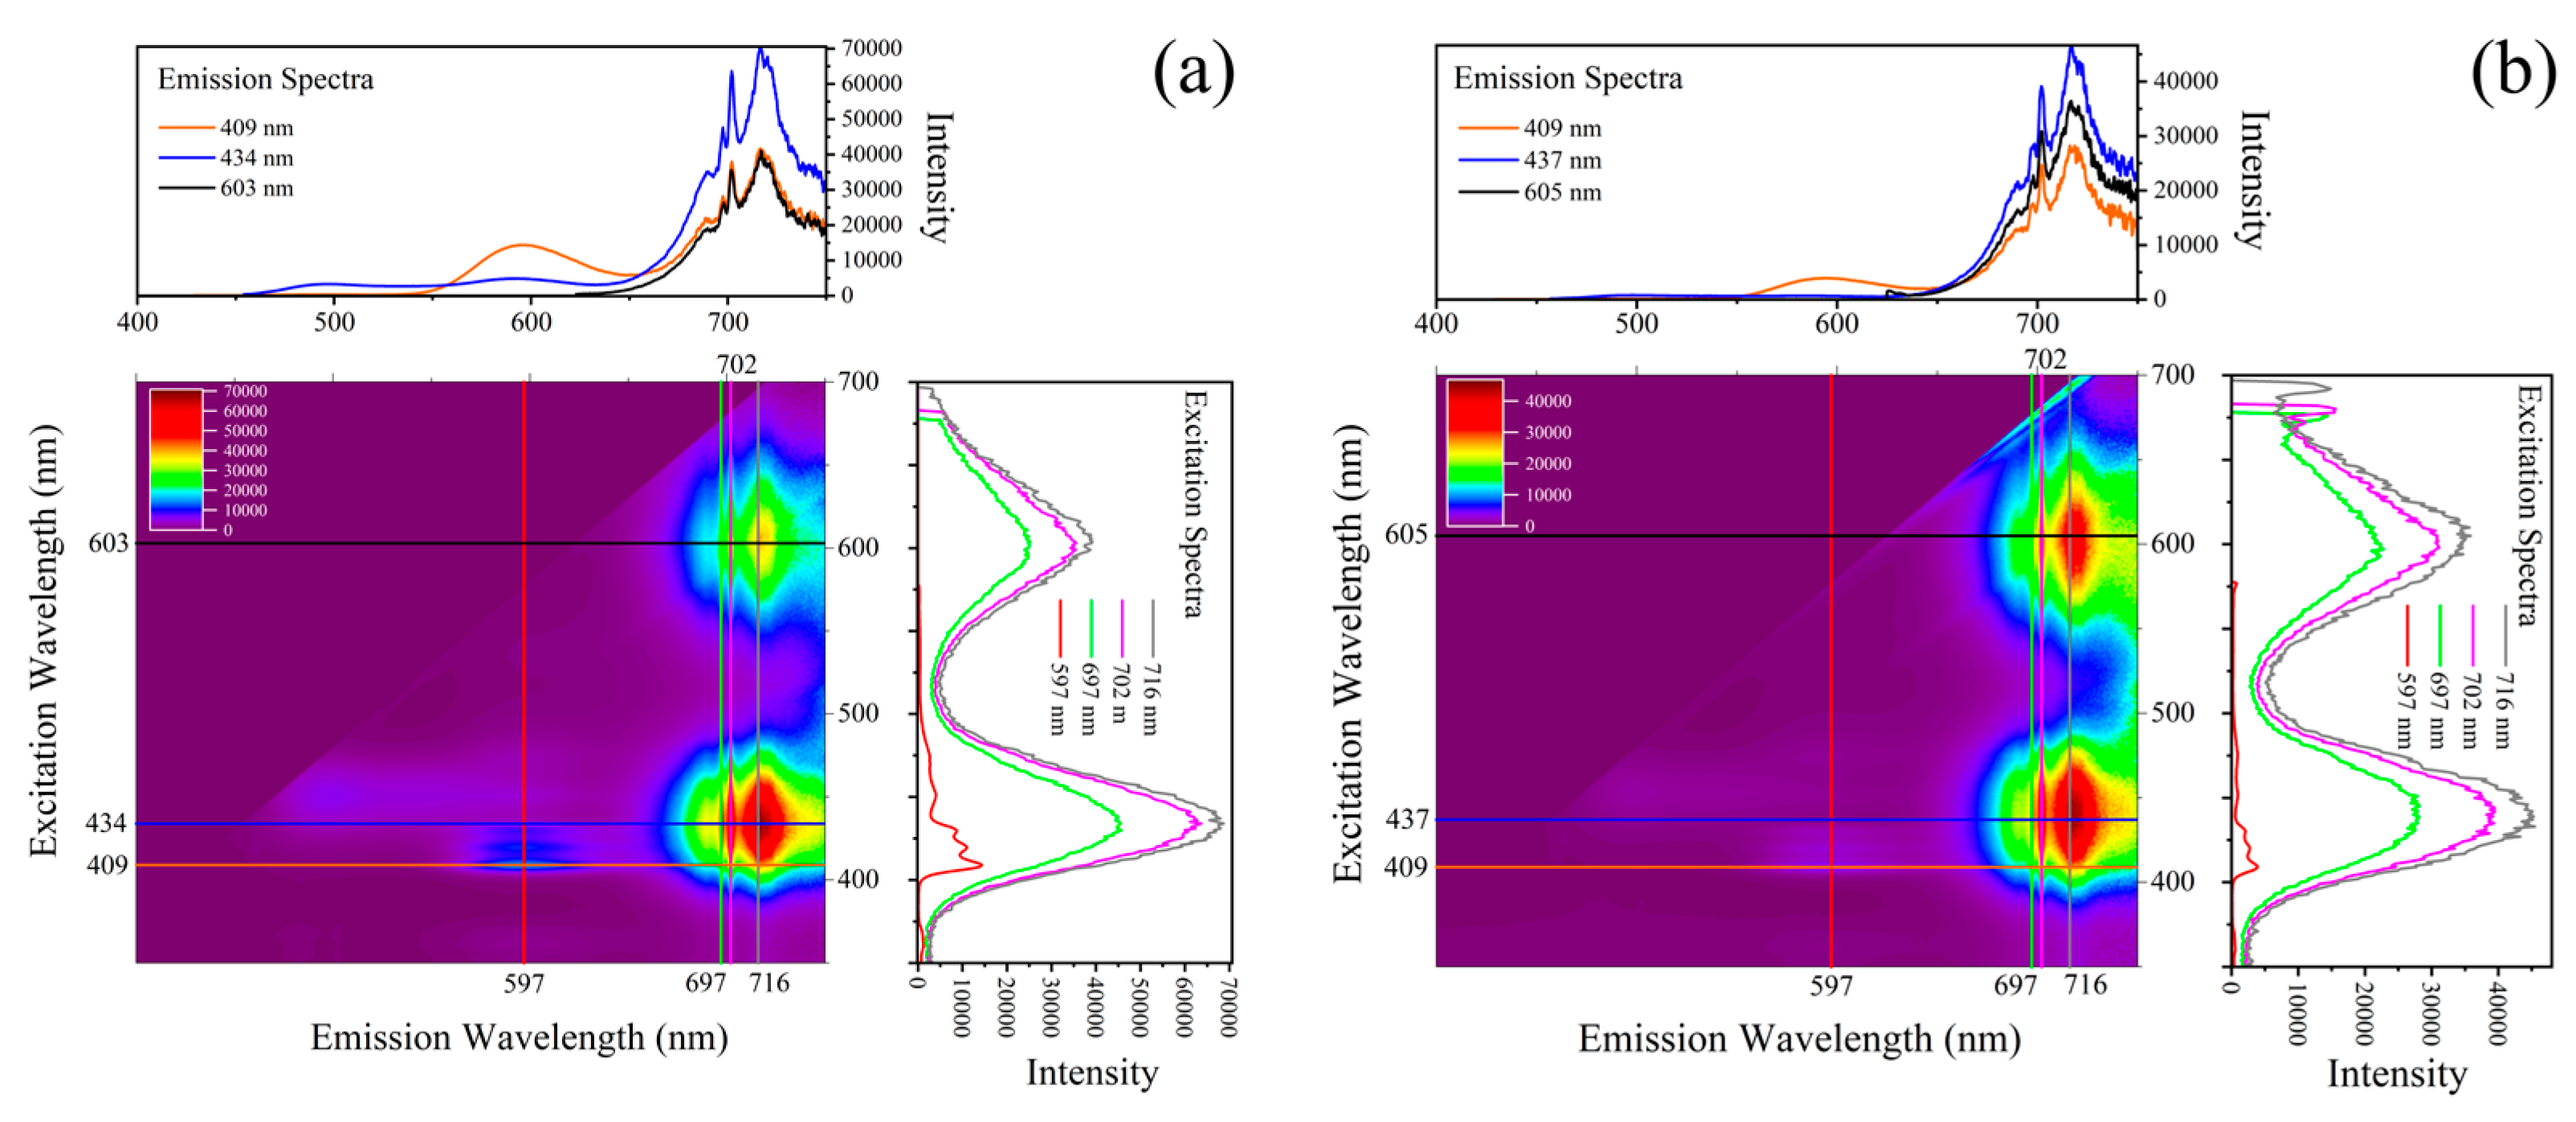
The 3D fluorescence spectra (i.e., EEM, excitation–emission matrix, or excitation–emission mapping) of sample BH1 (light yellowish green one) and sample BH5 (light mint-green one) were collected at room temperature, as shown in Figure 3.
The 3D fluorescence spectra show that the two samples have the same luminescence features (numbers and positions) but with different intensities (Figure 3). The intensity of sample BH5 is significantly lower than that of sample BH1, just as we expected according to the luminescence phenomena in Figure 1. Under the 434/437 nm excitation, sample BH1 and BH5’s emission spectra have two luminescence emissions. One emission in the orange-red region consists of a series of shape peaks centered at 697, 702 and 716 nm. Another emission is a broad band near 600 nm with lower intensity in the yellow-orange region; this broad band is more evident under the 409 nm excitation (the orange curves in the emission spectra).
As mentioned above, the grossular may have different luminescence features, which can be manifested through the 3D fluorescence spectrum. The emission spectra of the grossular in this work have a weak band at near 600 nm and a series of peaks at around 700 nm, which imply manganese-, chromium- and vanadium-induced luminescence. Pink grossular from Mogok, Myanmar, can present strong red luminescence under LWUV light; its emission spectrum under 325 nm excitation displayed a strong narrow band at 604 nm and some weaker bands at 583, 595, 617, 631, 645 and 660 nm [16]. Some natural grossular garnets from California, USA, also have a similar luminescence spectrum, i.e., with a narrow vibrational structure and a short decay time, and their emission is supposedly related to Mn2+ accompanied by F-centers [11].
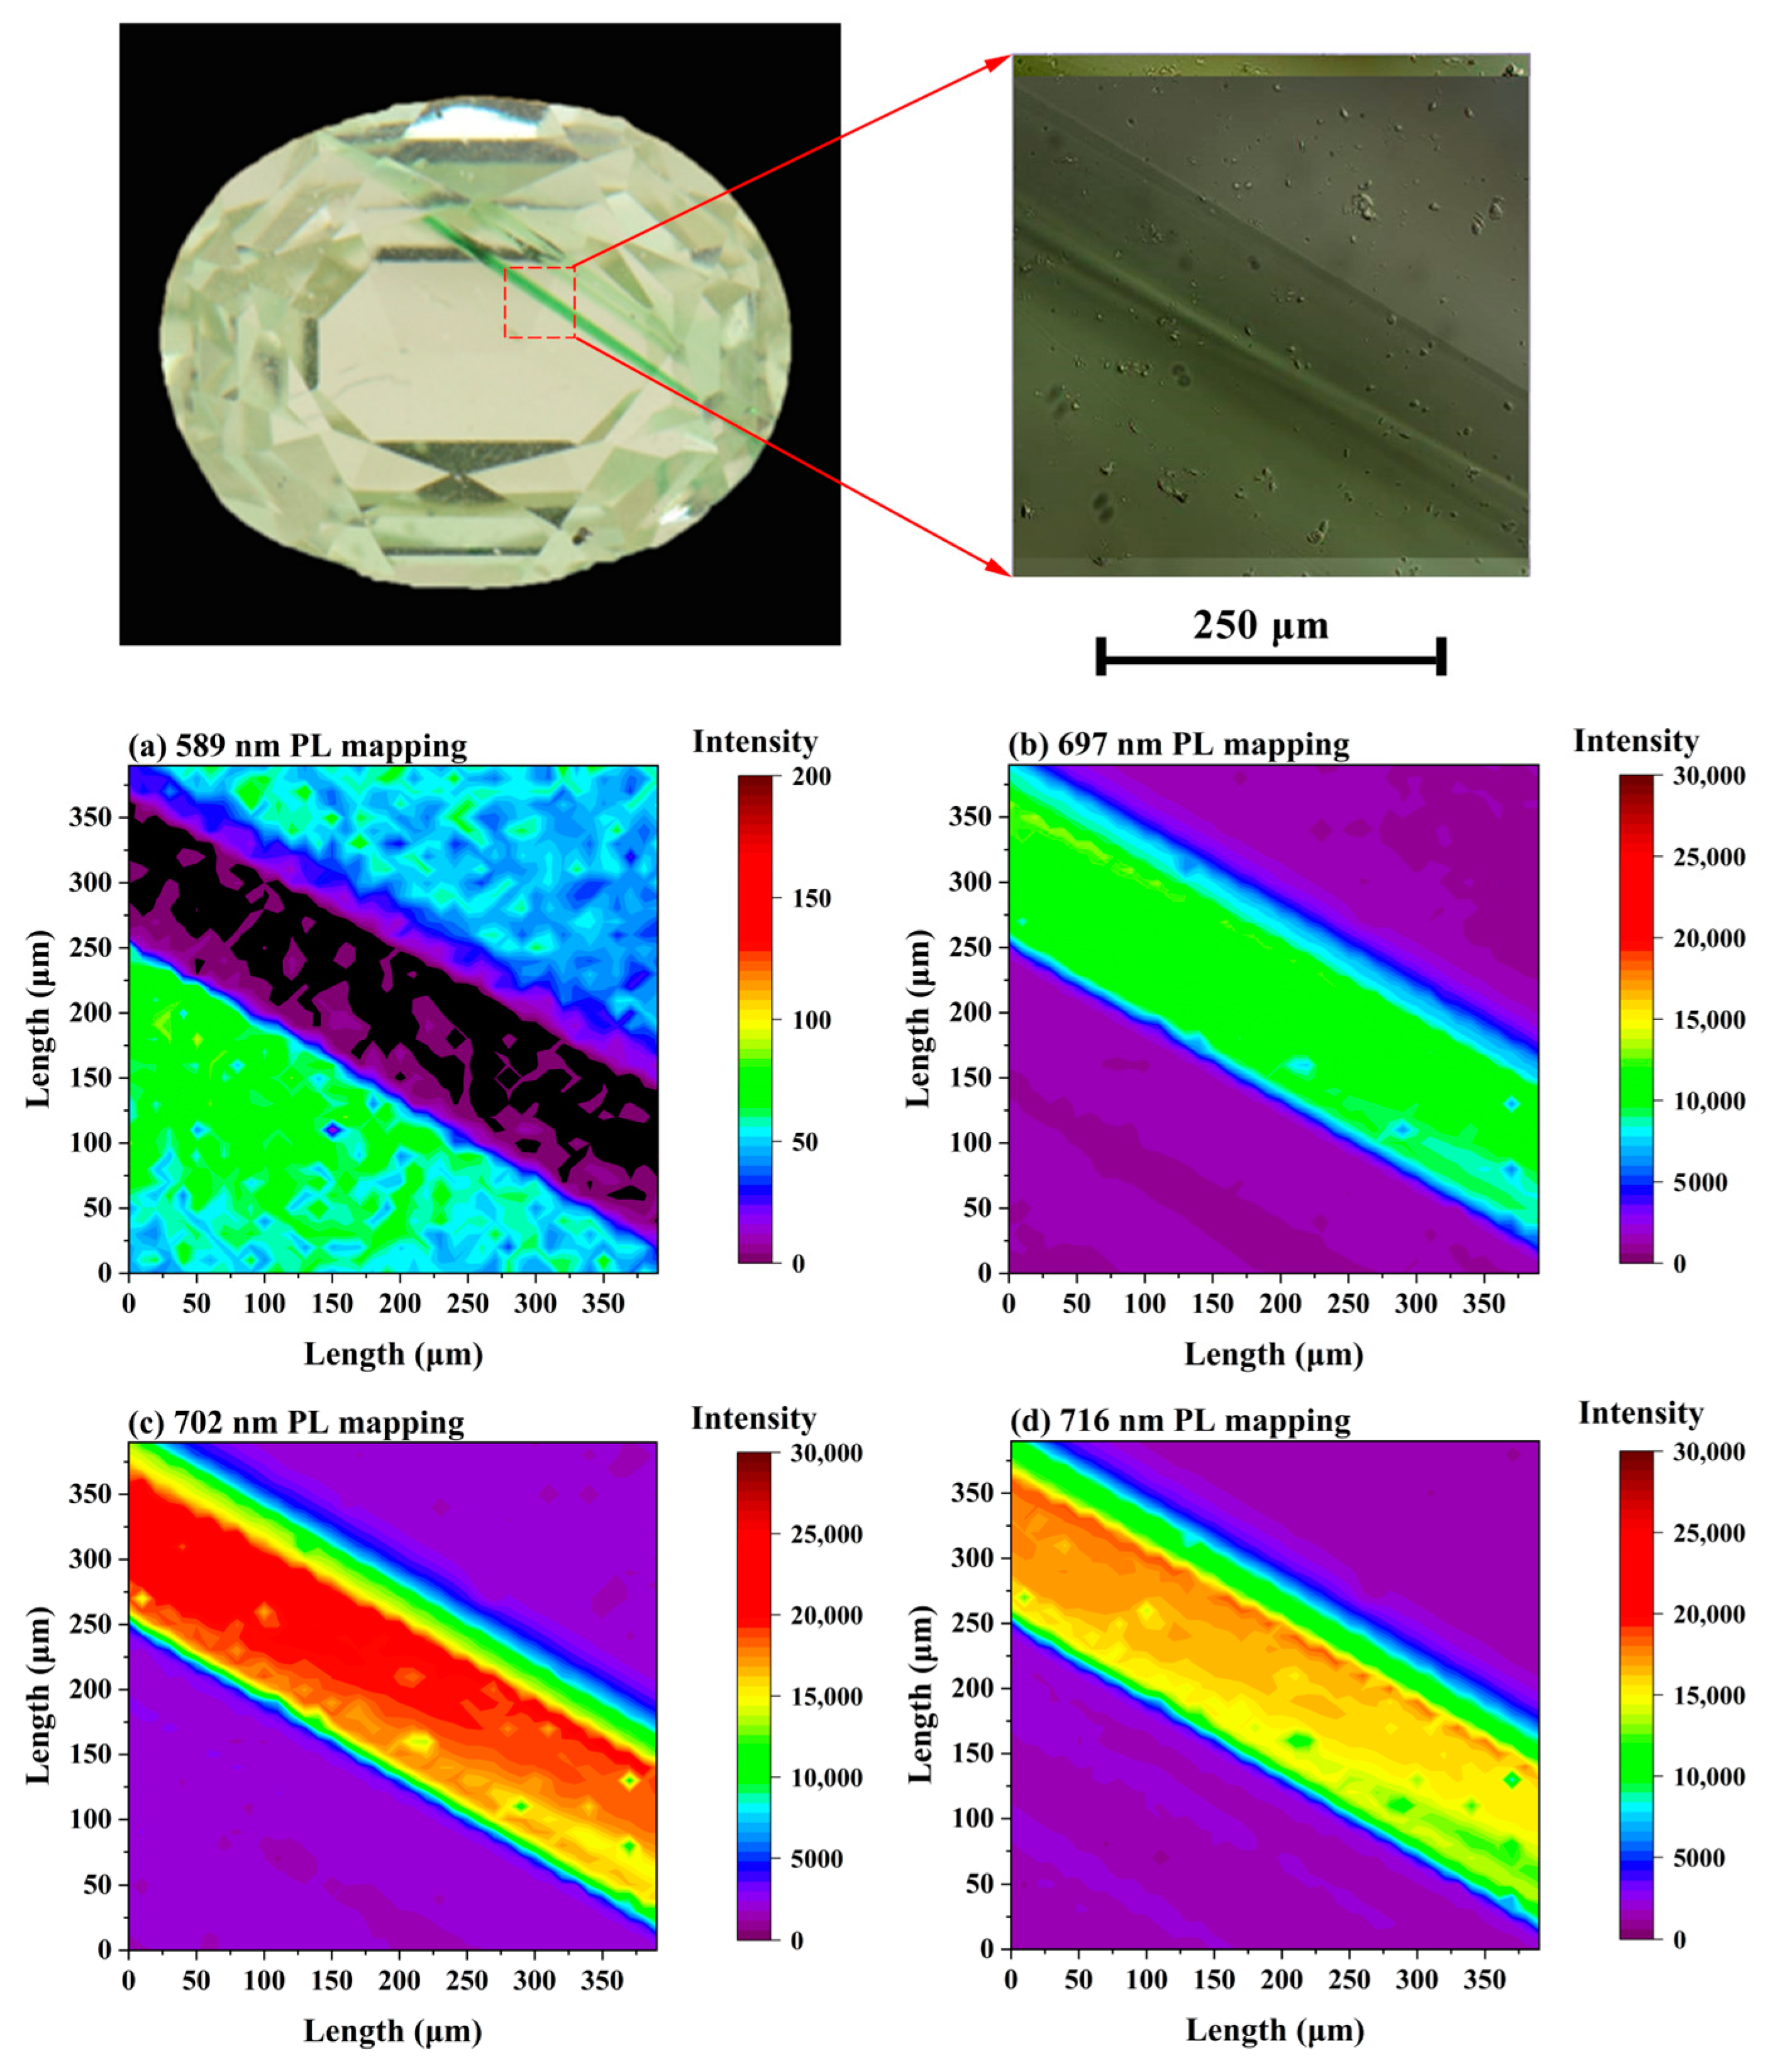
A green zone crossing sample, BH3, provides a good example of the spatial relationship between luminescence and coloration. The following mapping of 532 nm laser PL from sample BH3 (Figure 4) shows a strong positive correlation between the sharp peak series (697, 702 and 716 nm), indicating that these three peaks are related to the same origin (Figure 4b–d). Conversely, the 589 nm luminescence is concentrated outside the green zone (Figure 4a).

3.2. Chemical Analysis and Type Identification

The chemical analyses of major and trace elements of these samples were performed by EPMA and LA-ICP-MS. Each sample was analyzed at five and two points, respectively, to obtain an average.
The EPMA results (Table 2) show that the main components are CaO (36.12–37.13 wt.%), SiO2 (37.84–41.41 wt.%) and Al2O3 (21.19–22.72 wt.%), with low concentrations of impurity elements (Mg, Mn, Ti and V). The chromophores in green grossular garnets are Cr and V. As the vanadium oxide content gradually increases to 0.67 wt.%, the intensity of the green color gradually increased to deep green. The calculated chemical formulae of the studied garnets are listed in Table 3, and they are classified as grossular garnets [17].
Although the main reason for the green color of tsavorite is the presence of Cr and/or V, other elements such as Mn exist in significant quantities, sometimes higher than those of V and Cr [4]. In 2014, Feneyrol et al. proposed five grossular chemical types according to the variation of the V–Mn–Cr contents, including (1) vanadium grossular with V > Cr > Mn; (2) vanadium grossular with V > Mn > Cr; (3) Mn-bearing vanadium grossular with Mn > V > Cr; (4) Mn-bearing chromium grossular with Mn > Cr > V; and (5) Cr- and Mn-bearing grossular with Cr > Mn > V [4]. LA-ICP-MS results (Table 4) indicate that the samples BH2 and BH4-7 are type 3 (Mn > V > Cr); they should be renamed as Mn-bearing vanadium grossular. In addition, the ratio of V/Cr indicates that these tsavorites might have originated from Tanzania. The V/Cr ratios in this work ranged from 0.8 to 11.6, which are near consistent with the V/Cr ratios between 0.7 and 10.1 of Tanzanian tsavorites in a previous study [4]. Our results correspond to tsavorites from Komolo, Namalulu and Kimwengan in Tanzania [4]. For the samples BH1 and BH3, the contents of Cr and V have no noticeable difference and are hard to classify.

3.3. Assignment of Luminescence and Coloration

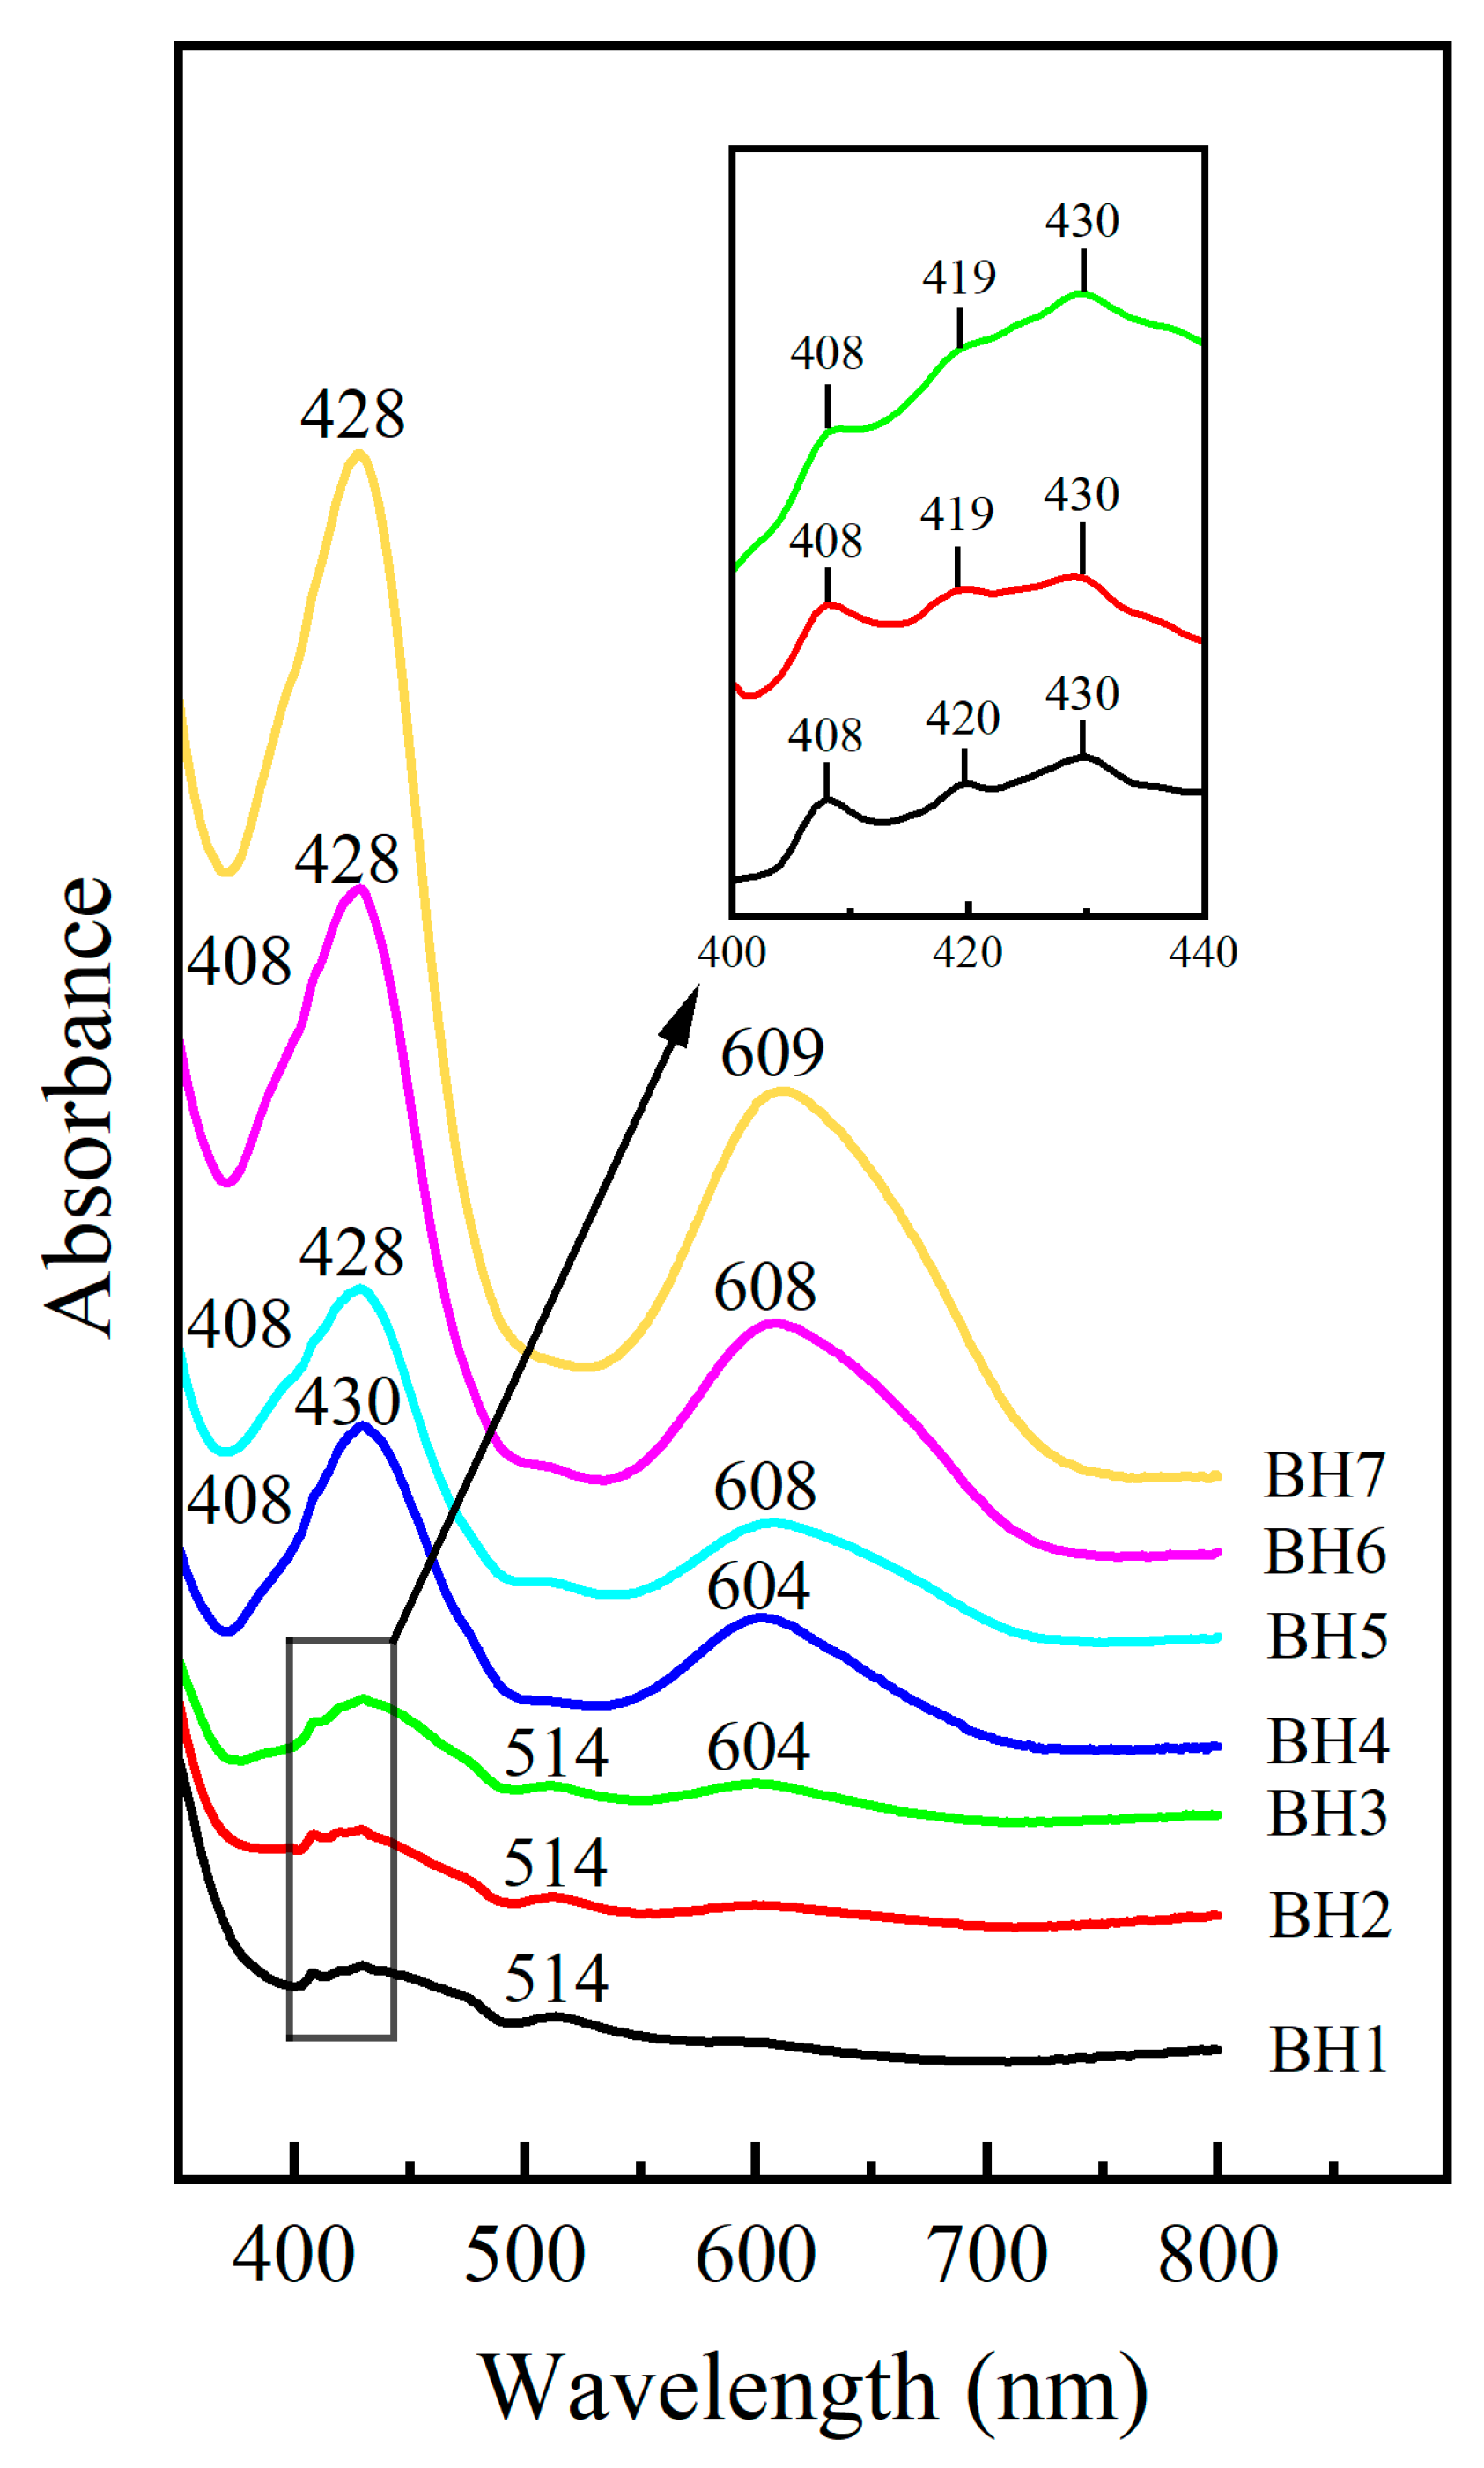
By using EPMA and LA-ICP-MS, it was confirmed that trace elements related to luminescence, i.e., Cr, V and Mn, exist in the grossular garnets. However, their role in luminescence and coloration needs further definition. The absorption spectra of representative green grossular garnets are shown in Figure 5. Two asymmetrical absorption bands have centers at approximately 430 and 605 nm. Previous studies have confirmed that the bands at 430 and 605 nm are related to Cr3+ or Cr3+/V3+ [18]. Combined with Figure 1, samples BH6–7, with the intense green hue, have stronger absorption peaks at nearly 430 and 605 nm, which also showed the correlation between the trace elements (Cr and V) and the green color.
Two shoulders or minor absorption peaks at 408 and 419/420 nm were detected, which are prominent in the sample with stronger luminescence. Previous studies assigned these bands to the absorption of Mn2+ [4,19]. A relatively weak band at 514 nm was also observed in the UV–Vis spectra. This band was reported once in “raspberry” grossular from Mexico, and it is the domain band for its coloration [20]. After our predecessors’ effort, we assigned it to Mn3+.
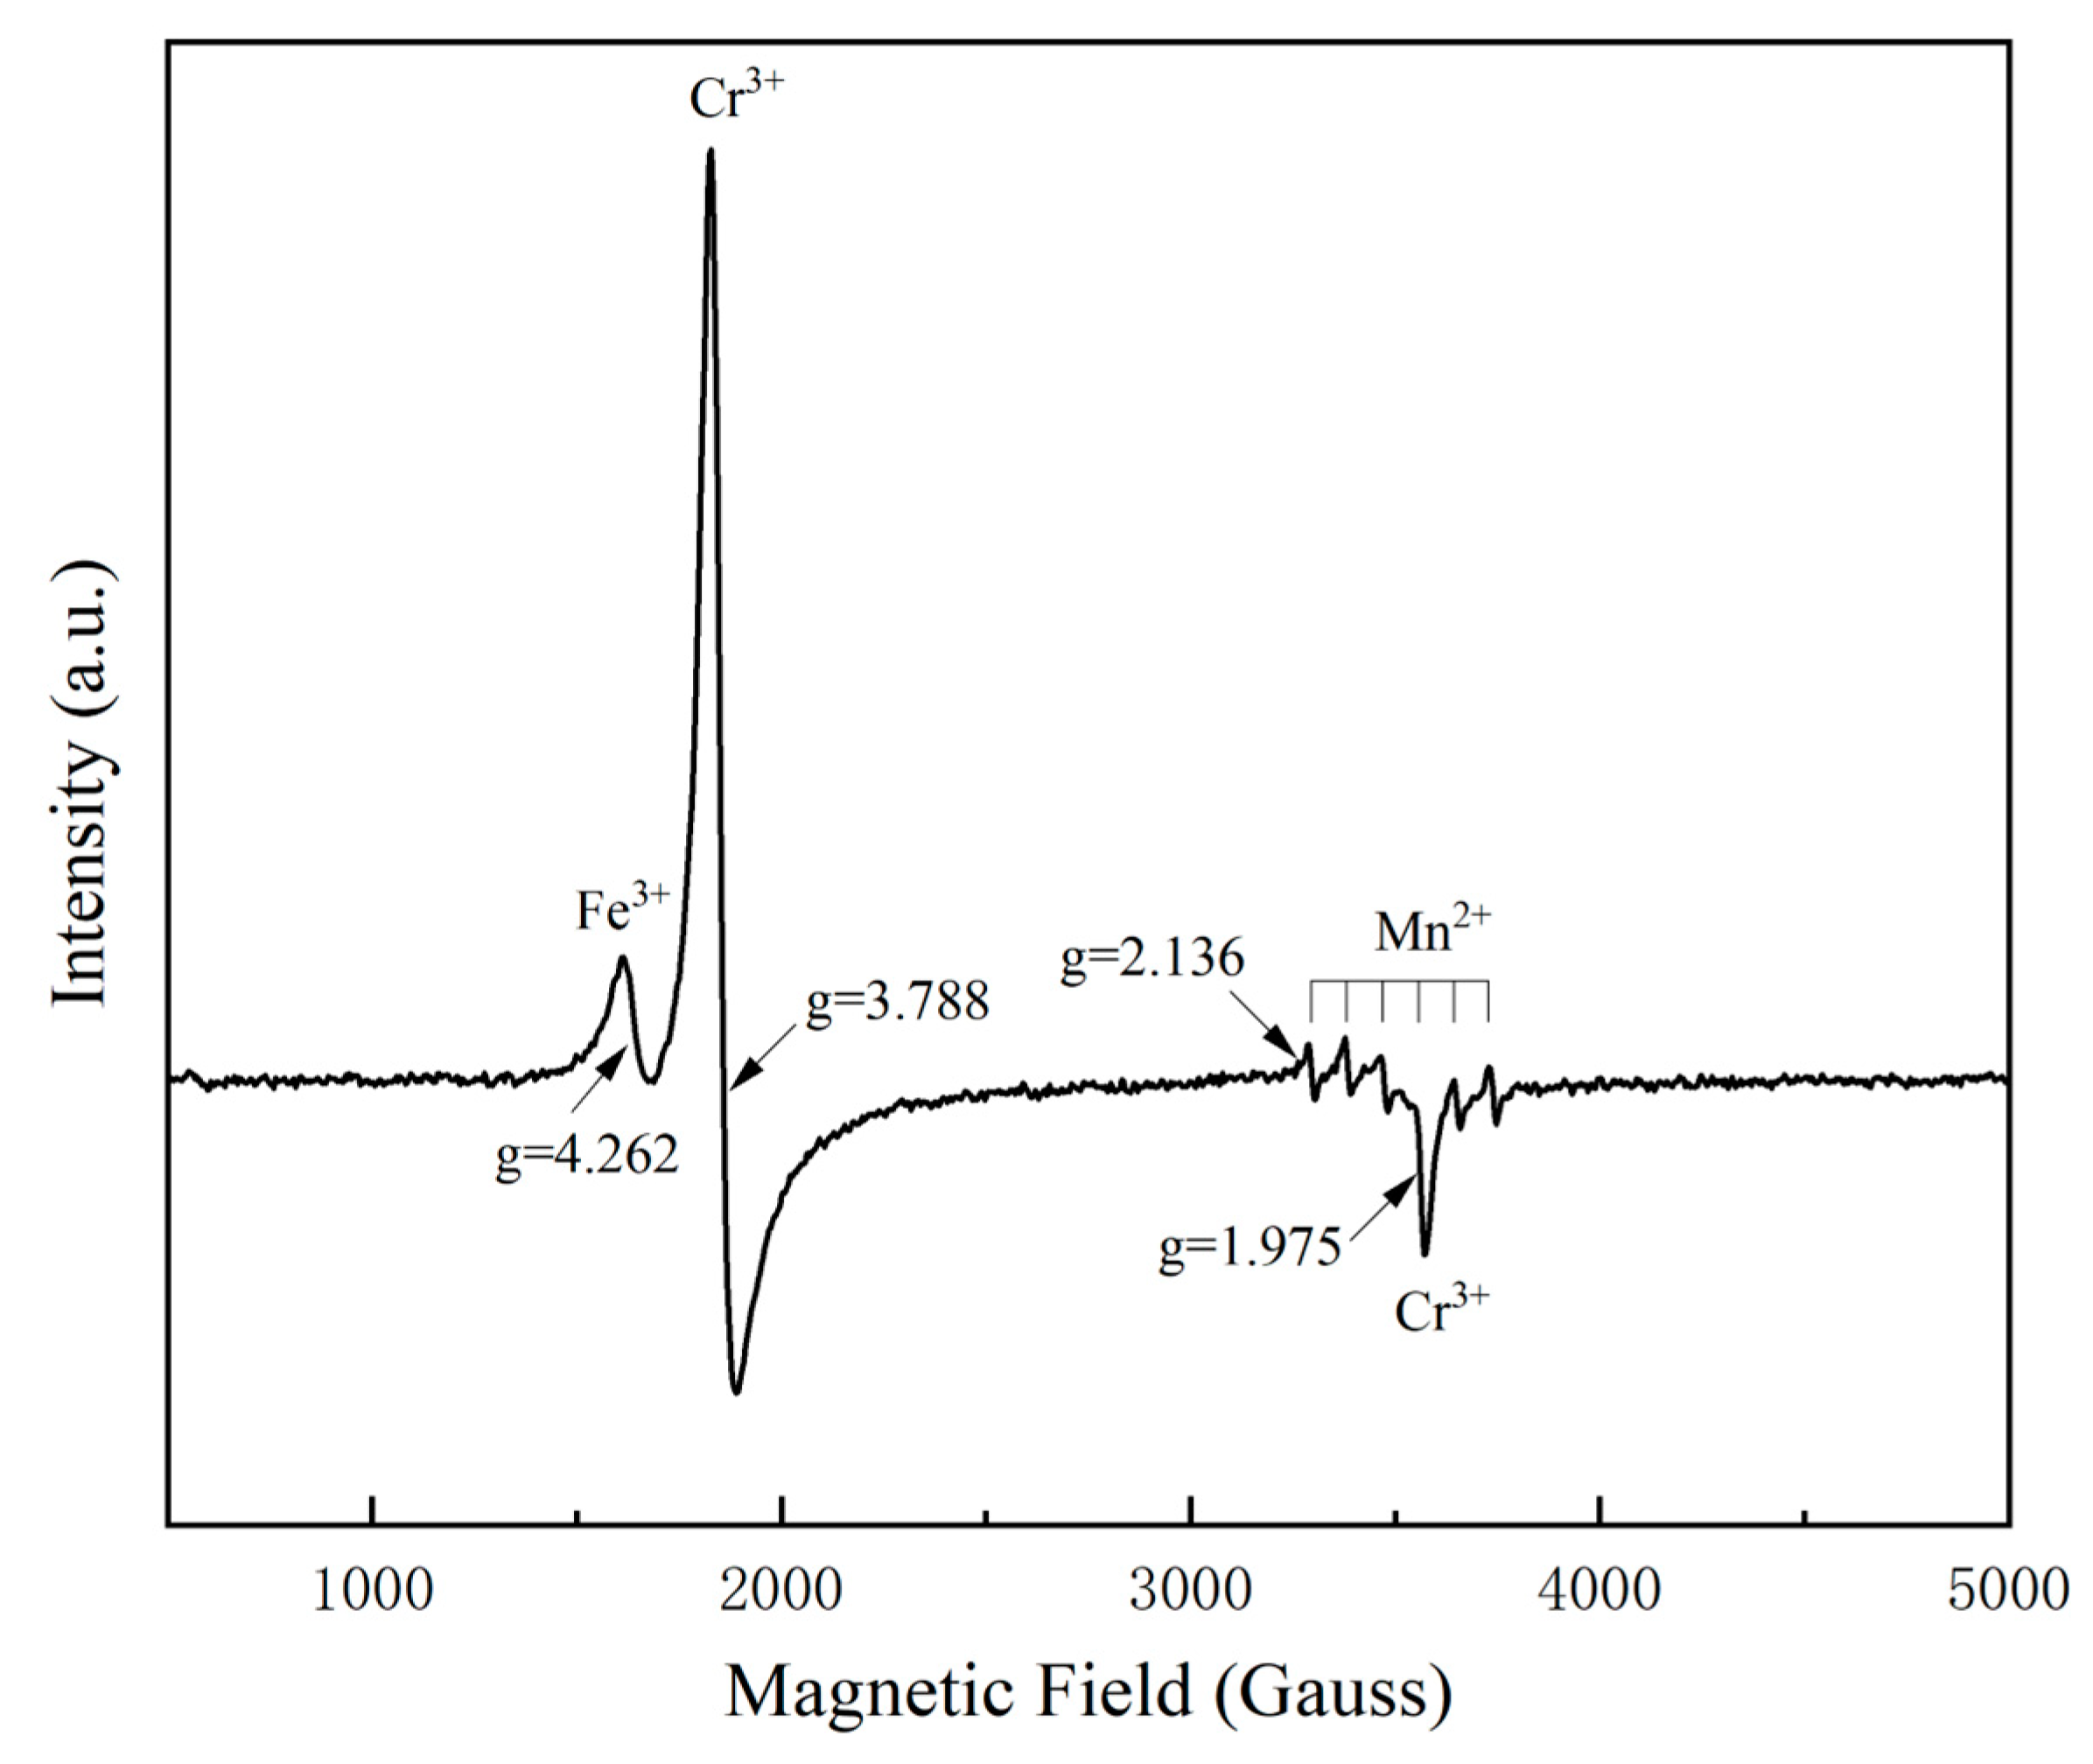
From the UV–Vis spectra, it can be inferred that impurities Cr3+/V3+, Mn2+ and Mn3+ are related to chromophore and may lead to luminescence. V2+ was supposed to cause the asymmetric 716 nm band in the former PL spectra, but its existence needs further discussion. V2+ belongs to 3d3 ions and is isoelectronic with Cr3+, so the V2+ and Cr3+ emission spectra can overlap. In this work, we checked it by EPR, a useful tool for studying unpaired electrons in transition metals and other defects [21]. If V2+ or V4+ exist, there should be a significant signal in EPR.
The sample BH2 was tested by EPR. As in Figure 6, the EPR signals centered at g-values of 3.788 are probably due to isolated Cr3+ ions at octahedral sites, while the peak at 1.975 is related to the dual contribution from both Cr3+–Cr3+ ion exchange coupled pairs and isolated Cr3+ ions [22]. The g = 4.262 singlet is assigned to Fe3+ and a typical six-line spectrum of Mn2+ is also shown [23]. However, the sample BH2 showed no EPR signal of V2+ [24] and V4+ [25], implying that V may occur as V3+. Therefore, we prefer to assign the 716 nm band to Cr3+ rather than to V2+. This means that only Cr3+ contributes to the emission in the red region.

3.4. Suppression Influence on the Vanadium-Rich Sample

According to the EPR spectrum, the correlation between V2+ and/or V4+ and the emissions in the red region was excluded. However, there is a more interesting phenomenon related to V.
Chemical and spectroscopic analyses were performed as described above. Given that we had ascribed the emissions in the yellow-orange region to Mn2+ and the emissions in the red region to Cr3+, some would expect these elements to be more concentrated in samples with stronger luminescence; however, the fact is reversed. Samples BH6–7 have relatively high Cr and Mn contents and emit the weakest luminescence. It seems that there should be some other unknown mechanism behind it. Recently, Ma and Guo studied thirty-three tsavorites from Tanzania and Kenya, with colors ranging from pale to vivid green, which can produce orange-red luminescence under the LWUV, similar to the luminescence phenomena in this work. They speculated that trivalent chromium in grossular is the activator of luminescence; however, luminescence gradually weakened and disappeared as vanadium increased, which means vanadium is a potent quencher [26]. In addition, lately, some rumors about this case have shown up in the gem market as well.
In this work, we found an identical correlation. The grossular garnet with a relatively high chromium content and abundant vanadium (e.g., 318 ppmw Cr and 2470 ppmw V in BH5) does not display strong luminescence. The discrepancy, in a multitude of orders, in vanadium content (e.g., 121 ppmw in BH1 vs. 2470 ppmw in BH5) indicates that vanadium inhibits luminescence. Therefore, lighter green grossular with lower vanadium concentration exhibits stronger luminescence.

4. Conclusions

In this work, seven faceted grossular garnets from light yellowish-green to intense green have been investigated by PL, 3D fluorescence spectroscopy, EPMA, LA-ICP-MS, UV–Vis spectroscopy and EPR. The chemical analysis revealed a composition consistent with that of grossular, with calcium, aluminum and silicon as major elements, and manganese, titanium, chromium, vanadium, magnesium and iron as trace elements.
The PL spectra show a broad band near 600 nm and a series of sharp peaks centered at 697, 702 and 716 nm. Combined with the EPR spectra, the UV–Vis spectra show the characteristic absorption peaks related to Cr3+ and V3+ for the green grossular garnets. Mn2+ and Mn3+ absorption peaks also appear, which are more evident in the lighter green samples. It was determined that Mn2+ and Cr3+ are the causes of the emission in the yellow-orange and red region, respectively.
According to the luminescence intensity and trace element data from LA-ICP-MS, the much higher concentration of vanadium found in intense green grossular garnets has a weak luminescence. Therefore, vanadium is identified as a quencher for grossular luminescence.

Author Contributions

Conceptualization, Q.Z.; formal analysis, Y.S., T.S. and F.X.; writing—original draft preparation, Q.Z.; writing—review and editing, Q.Z., X.L. and A.H.S. All authors have read and agreed to the published version of the manuscript.

Funding

This research was funded by the Fundamental Research Founds for National University, China University of Geosciences (Wuhan) (no. CUGDCJJ202225) to Andy H. Shen.

Data Availability Statement

All supporting data and computational details are available on written request. These data are stored by the main author of this article.

Conflicts of Interest

The authors declare no conflict of interest.

References

  1. Bridges, C. Green Grossulanite Garnets (“Tsavorites”) in East Africa. Gems Gemol. 1974, 14, 290–295. [Google Scholar]
  2. Feneyrol, J.; Giuliani, G.; Ohnenstetter, D.; Fallick, A.E.; Martelat, J.-E.; Monié, P.; Dubessy, J.; Rollion-Bard, C.; Goff, E.L.; Malisa, E.P.J.; et al. New Aspects and Perspectives on Tsavorite Deposits. Ore Geol. Rev. 2013, 53, 1–25. [Google Scholar] [CrossRef]
  3. Switzer, G. Composition of Green Garnet from Tanzania and Kenya. Gems Gemol. 1974, 14, 296–297. [Google Scholar]
  4. Feneyrol, J.; Giuliani, G.; Ohnenstetter, D.; Rondeau, B.; Fritsch, E.; Fallick, A.E.; Ichang’i, D.; Omito, E.; Rakotondrazafy, M.; Ranatsenho, M.; et al. New Typology and Origin of Tsavorite Based on Trace-element Chemistry. Eur. J. Mineral. 2014, 26, 293–308. [Google Scholar] [CrossRef]
  5. Zeug, M.; Nasdala, L.; Chanmuang, N.C.; Hauzenberger, C. Gem Topaz from the Schneckenstein Crag, Saxony, Germany: Mineralogical Characterization and Luminescence. Gems Gemol. 2022, 58, 2–17. [Google Scholar] [CrossRef]
  6. Wang, C.; Shen, A.H.; Liu, Y. Characterization of Order-Disorder Transition in MgAl2O4: Cr3+ Spinel using Photoluminescence. J. Lumin. 2020, 227, 117552. [Google Scholar] [CrossRef]
  7. Nelson, D.F.; Sturge, M. Relation between Absorption and Emission in the Region of the R Lines of Ruby. Phys. Rev. 1965, 137, 1117–1130. [Google Scholar] [CrossRef]
  8. Gaft, M.; Reisfeld, R.; Panczer, G. Modern Luminescence Spectroscopy of Minerals and Materials; Springer: New York, NY, USA, 2015. [Google Scholar]
  9. Lueth, V.W.; Jones, R. Red grossular from the sierra de Cruces, coahuila, Mexico. Mineral. Rec. 2003, 34, 73–79. [Google Scholar]
  10. Mazurak, Z.; Czaja, M. Optical Properties of Tsavorite Ca3Al2(SiO4)3: Cr3+, V3+ from Kenya. J. Lumin. 1995, 65, 335–340. [Google Scholar] [CrossRef]
  11. Gaft, M.; Waychunas, G.; Rossman, G.R.; Nagli, L.; Goryachev, A.; Raichlin, Y. Zero-phonon Mn2+ luminescence in natural grossular Ca3Al2(SiO4)3. J. Lumin. 2022, 248, 119001. [Google Scholar] [CrossRef]
  12. Gaft, M.; Yeates, H.; Nagli, L.; Panczer, G. Laser-induced Time Resolved Luminescence of Natural Grossular Ca3Al2(SiO4)3. J. Lumin. 2013, 137, 43–53. [Google Scholar] [CrossRef]
  13. Malisa, E.P.J.; Muhongo, S. Tectonic Setting of Gemstone Mineralization in the Proterozoic Metamorphic Terrane of the Mozambique Belt in Tanzania. Precambrian Res. 1990, 46, 167–176. [Google Scholar] [CrossRef]
  14. Malisa, E. Trace Elements Characterization of the Hydrothermally Deposited Tanzanite and Green Grossular in the Merelani—Lelatema Shear Zone, Northeastern Tanzania. Tanz. J. Sci. 2003, 29, 45–60. [Google Scholar] [CrossRef]
  15. Giuliani, G.; Fallick, A.E.; Feneyrol, J.; Ohnenstetter, D.; Pardieu, V.; Saul, M. 18O/16O and V/Cr ratios in gem tsavorites from the Neoproterozoic Mozambique metamorphic belt: A clue towards their origins? Miner. Deposita 2011, 46, 671–676. [Google Scholar] [CrossRef]
  16. Zhang, Q.; Shen, A.H. Grossular with strong red fluorescence. Gems Gemol. 2022, 58, 508–509. [Google Scholar]
  17. Grew, E.S.; Locock, A.J.; Mills, S.J.; Galuskina, I.O.; Galuskin, E.V.; Hålenius, U. Nomenclature of the garnet supergroup. Am. Mineral. 2013, 98, 785–811. [Google Scholar] [CrossRef]
  18. Rossman, G.R. Optical spectroscopy. Rev. Mineral. Geochem. 2014, 78, 371–398. [Google Scholar] [CrossRef]
  19. Manning, P.G. The optical absorption spectra of the garnets almandine-pyrope, pyrope, and spessartine and some structural interpretations of mineralogical significance. Can. Mineral. 1967, 9, 237–251. [Google Scholar]
  20. Geiger, C.A.; Stahl, A.; Rossman, G.R. Raspberry-red Grossular from Sierra de Cruces Range, Coahuila, Mexico. Eur. J. Mineral. 1999, 11, 1109–1113. [Google Scholar] [CrossRef]
  21. Pan, Y.; Nilges, M.J. Electron paramagnetic resonance spectroscopy: Basic principles, experimental techniques and applications to Earth and planetary sciences. Rev. Mineral. Geochem. 2014, 78, 655–690. [Google Scholar] [CrossRef]
  22. Kim, I.W.; Kaur, S.; Yadav, A.; Rao, A.S.; Saravanakumar, S.; Rao, J.L.; Singh, V. Structural, luminescence and EPR properties of deep red emitting MgY2Al4SiO12:Cr3+ garnet phosphor. J. Lumin. 2020, 220, 116975. [Google Scholar] [CrossRef]
  23. Yauri, J.; Watanabe, S. Defect Dependent Properties in Grossularite. Phys. Status Solidi C 2005, 2, 555–559. [Google Scholar] [CrossRef]
  24. Vazhenin, V.A.; Potapov, A.P.; Asatryan, G.R.; Artyomov, M.Y. Paramagnetic V2+ Centers in Yttrium–Aluminum Garnet. Phys. Solid State 2020, 62, 2116–2121. [Google Scholar] [CrossRef]
  25. Havlíček, V.; Novak, P. EPR Line-width Intensity of V4+ Ion in NaCa2Mg2V3O12 Garnet. Czech. J. Phys. B 1974, 24, 188–202. [Google Scholar] [CrossRef]
  26. Ma, Y.; Guo, Y. Variation in Gemological Characteristics in Tsavorites with Different Tones from East Africa. Crystals 2022, 12, 1677. [Google Scholar] [CrossRef]
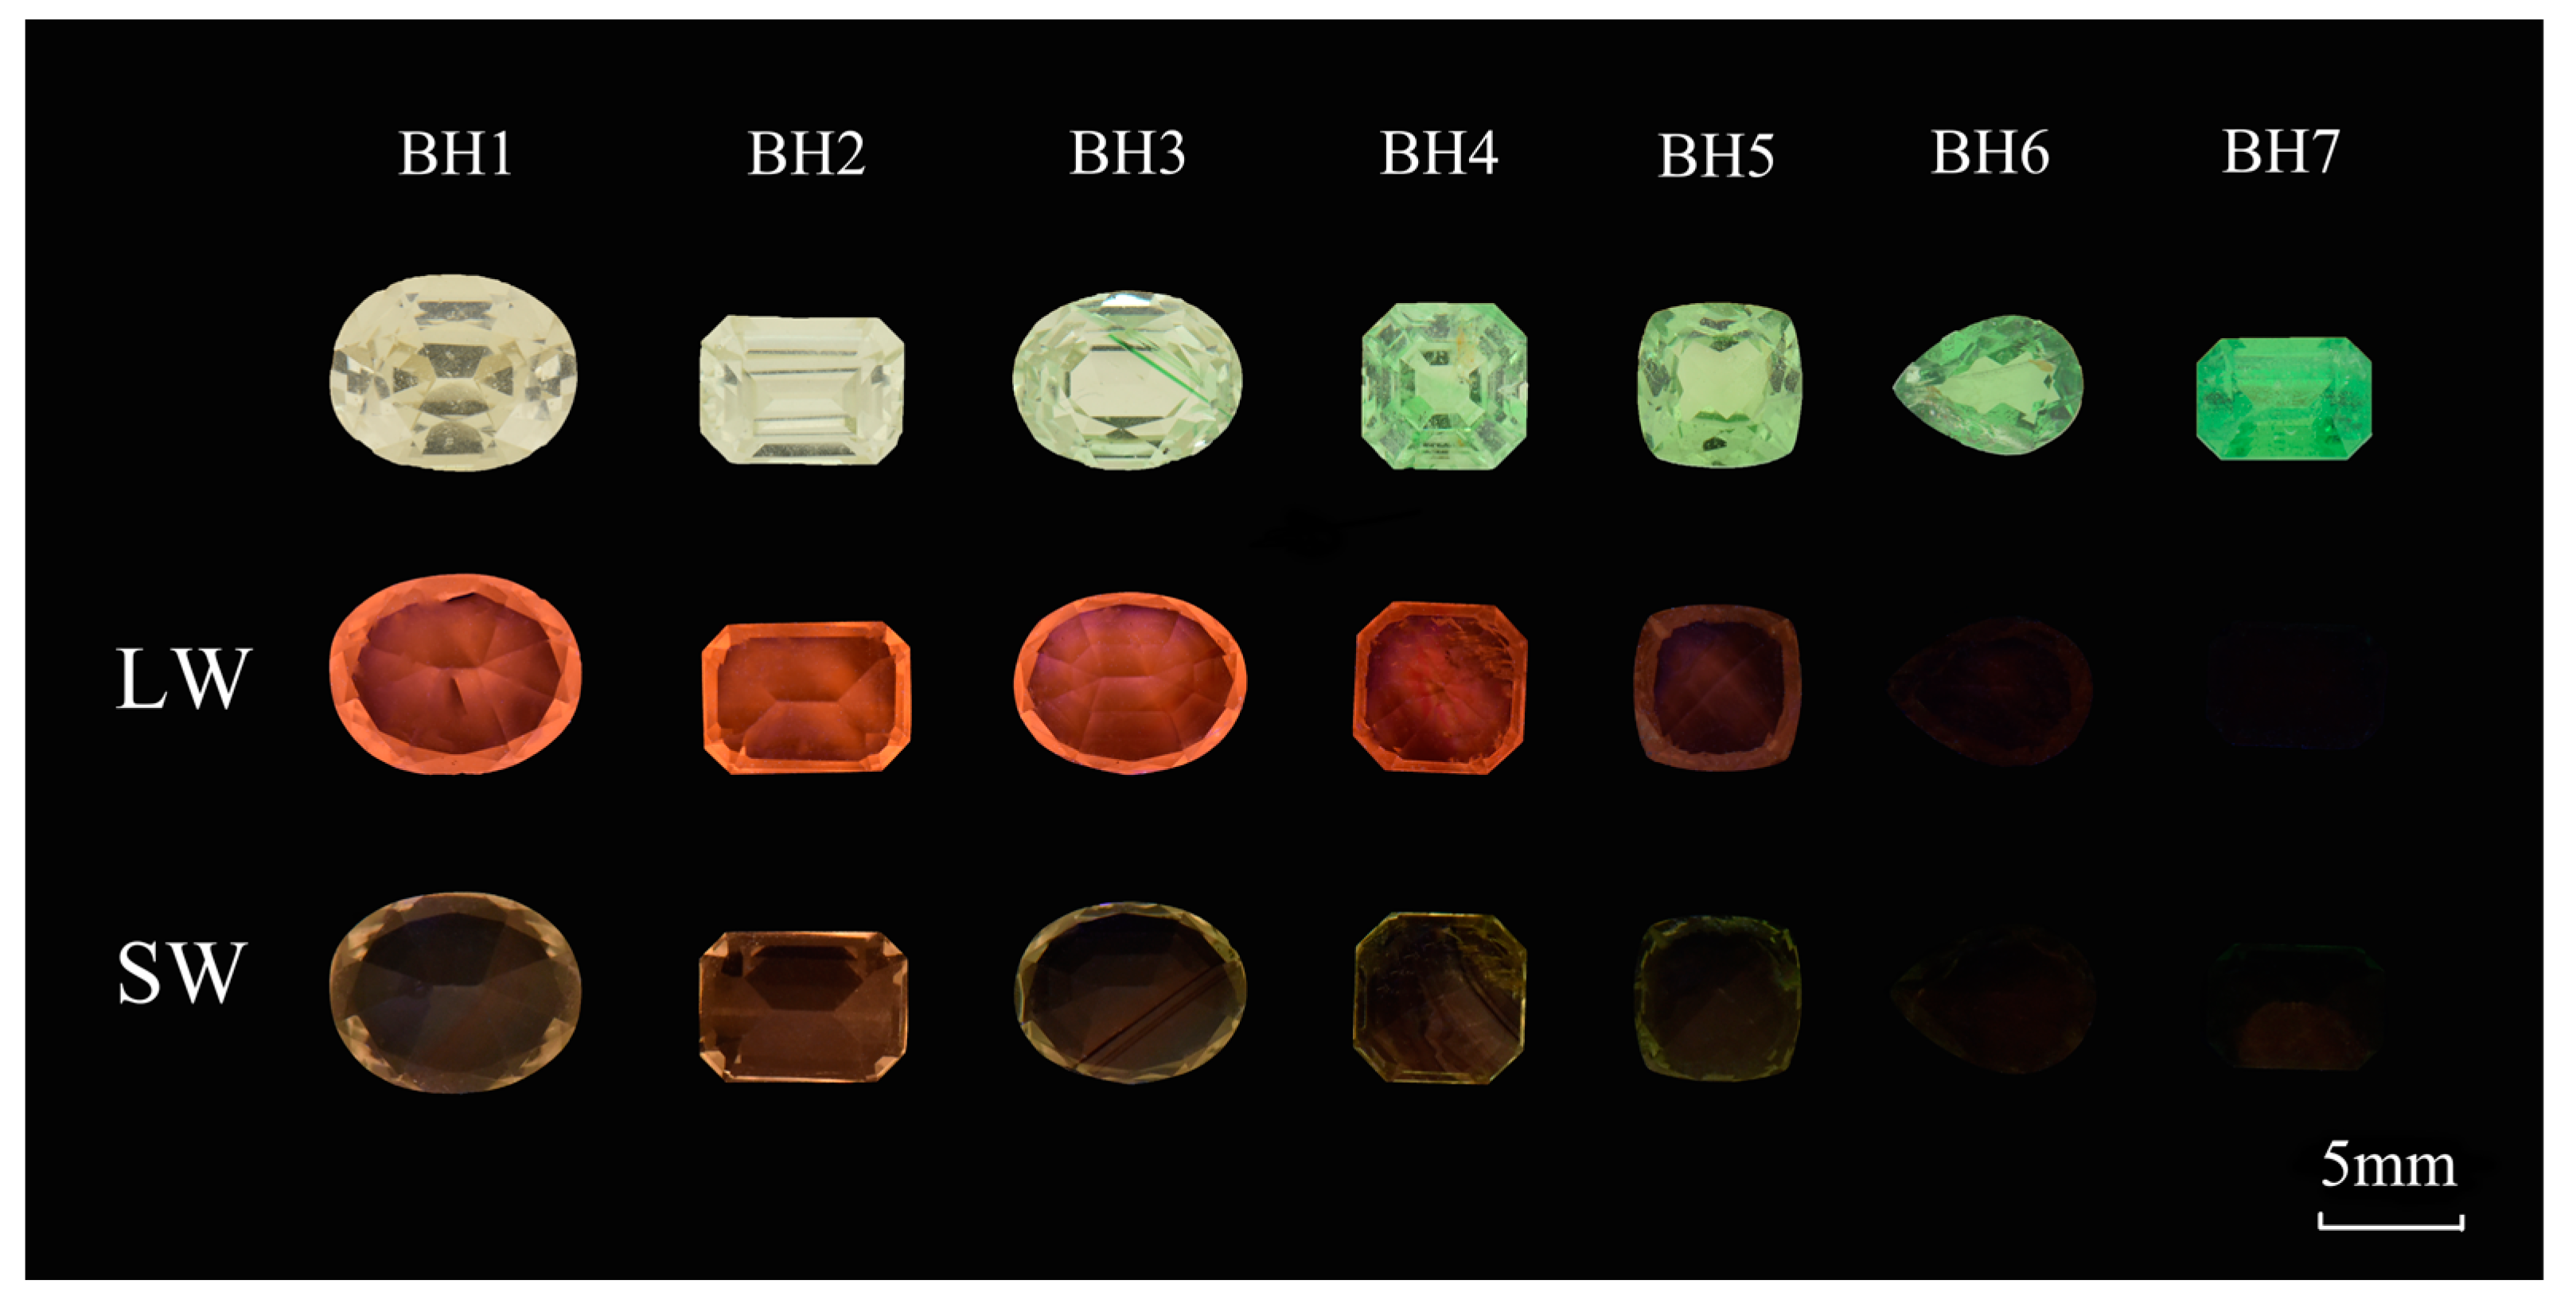
Figure 1. Grossular garnets show colors ranging from light yellowish-green to intense green, and some of them display luminescence under LWUV and SWUV light.
Minerals 13 00639 g001
Figure 2. The 325 nm laser-induced photoluminescence spectra of the green grossular garnets.
Minerals 13 00639 g002
Figure 3. The 3D contour map of fluorescence spectrum of sample BH1 (a) and sample BH5 (b).
Minerals 13 00639 g003
Figure 4. Laser PL mapping of sample BH3: (a) at 589 nm; (b) at 697 nm; (c) at 702 nm; and (d) at 716 nm.
Minerals 13 00639 g004
Figure 5. The UV–Vis–NIR spectra of the green grossular garnets.
Minerals 13 00639 g005
Figure 6. EPR spectrum of the sample BH2 shows single Cr3+, Fe3+ and Mn2+ centers at 77 K.
Minerals 13 00639 g006
Table 1. Gemological properties of green grossular garnets.
Sample No.Weight (ct)Size (mm)Specific GravityRefractive IndexColor
BH12.008.19 × 6.55 × 4.763.601.738light yellowish-green
BH21.277.05 × 4.96 × 3.793.611.739light yellowish-green
BH31.627.59 × 5.96 × 3.973.641.737light yellowish-green
BH41.125.63 × 5.56 × 3.923.611.738light mint-green
BH50.865.54 × 5.33 × 3.343.641.739light mint-green
BH60.736.79 × 4.99 × 2.803.651.739green
BH70.845.87 × 4.09 × 3.643.651.738green
Table 2. Chemical composition of green grossular garnets.
Composition BH1BH2BH3BH4BH5BH6BH7
Oxide (wt.%)
CaORange36.62–36.9636.85–37.0436.12–36.5936.86–36.9936.36–36.9736.35–36.7036.55–37.13
Average36.77 36.95 36.27 36.93 36.69 36.52 36.83
SiO2Range39.52–41.4139.73–40.0839.50–39.7439.18–39.4539.69–40.2639.03–39.1337.84–38.28
Average40.10 39.96 39.60 39.29 39.94 39.07 38.05
Al2O3Range21.19–21.7522.26–22.4822.41–22.7222.04–22.3622.07–22.3722.20–22.5221.79–22.23
Average21.45 22.37 22.60 22.20 22.22 22.38 22.01
MgORange0.13–0.530.56–0.600.47–0.510.53–0.560.60–0.670.41–0.480.49–0.54
Average0.29 0.58 0.50 0.54 0.62 0.44 0.53
FeORange0.02–0.090.03–0.090.02–0.110.04–0.100.03–0.100.06–0.110.01–0.10
Average0.05 0.06 0.06 0.06 0.07 0.08 0.04
MnORange0.20–0.300.34–0.440.24–0.320.38–0.440.28–0.340.61–0.700.54–0.65
Average0.26 0.38 0.27 0.41 0.30 0.66 0.58
K2ORange0.00–0.020.00–0.020.01–0.020.01–0.020.02–0.020.01–0.020.00–0.02
Average0.01 0.01 0.01 0.01 0.01 0.01 0.01
TiO2Range0.26–0.490.34–0.370.28–0.350.24–0.270.45–0.560.34–0.380.46–0.52
Average0.38 0.35 0.31 0.26 0.51 0.37 0.49
Cr2O3Range0.00–0.040.00–0.050.02–0.040.06–0.110.01–0.090.02–0.100.05–0.09
Average0.01 0.01 0.03 0.08 0.03 0.06 0.07
Na2ORange0.00–0.020.01–0.020.03–0.040.01–0.040.01–0.030.01–0.040.00–0.02
Average0.01 0.01 0.02 0.02 0.02 0.02 0.01
NiORange0.02–0.080.02–0.060.04–0.060.01–0.020.02–0.080.01–0.050.01–0.05
Average0.04 0.02 0.02 0.01 0.03 0.02 0.02
V2O3Range0.01–0.050.01–0.050.03–0.070.03–0.130.11–0.320.43–0.650.61–0.70
Average0.01 0.02 0.04 0.10 0.23 0.51 0.67
TotalRange98.18–101.40100.46–100.8999.36–100.2599.87–100.04100.33–101.23100.03–100.3199.02–99.94
Average99.39 100.72 99.71 99.91100.68 100.13 99.31
Table 3. List of chemical formulae of all the studied green grossular garnets.
Sample No.Chemical Formula
BH1(Ca2.98Mg0.03Mn0.02)3.03(Al1.91Ti0.02)1.93Si3.03O12
BH2(Ca2.95Mg0.06Mn0.02)3.03(Al1.96Ti0.02)1.98Si2.97O12
BH3(Ca2.92Mg0.06Mn0.02)3.00(Al2.00Ti0.02)2.02Si2.98O12
BH4(Ca2.97Mg0.06Mn0.02)3.05(Al1.96Ti0.01)1.97Si2.95O12
BH5(Ca2.93Mg0.07Mn0.02)3.02(Al1.95Ti0.03V0.01)1.99Si2.98O12
BH6(Ca2.94Mg0.05Mn0.04)3.03(Al1.98V0.03Ti0.02)2.03Si2.93O12
BH7(Ca2.99Mg0.06Mn0.04)3.09(Al1.96V0.04Ti0.03)2.03Si2.88O12
Table 4. Trace elements of green grossular garnets obtained by LA-ICP-MS (in ppmw).
MgPTiVCrMnFe
BH1353115728931211282232613
BH2346313621272571023266597
BH3353471.618501491892287620
BH4325954.017332811332328579
BH53653197292624703182641591
BH6315687.6228135823104947710
BH73400137306847214254750612
Disclaimer/Publisher’s Note: The statements, opinions and data contained in all publications are solely those of the individual author(s) and contributor(s) and not of MDPI and/or the editor(s). MDPI and/or the editor(s) disclaim responsibility for any injury to people or property resulting from any ideas, methods, instructions or products referred to in the content.