Article

Investigating Effects of Structural Deformation Regimes on Mineralization Distributions in Fluid-Saturated Rocks: Computational Simulation Approach through Generic Models

1
Computational Geosciences Research Centre, Central South University, Changsha 410083, China
2
Key Laboratory of Metallogenic Prediction of Nonferrous Metals and Geological Environment Monitoring, Ministry of Education, Central South University, Changsha 410083, China
*
Author to whom correspondence should be addressed.
Minerals 2023, 13(5), 664; https://doi.org/10.3390/min13050664
Submission received: 24 March 2023 / Revised: 29 April 2023 / Accepted: 10 May 2023 / Published: 12 May 2023

Abstract

:
Structural deformation regimes in the upper crust of the Earth can have significant effects on the distributions of pore-fluid flow in existing fissured and fractured zones, which are surrounded by fluid-saturated porous rocks. Based on the modern mineralization theory, mineralization distributions in ore-forming systems depend strongly on the distributions of pore-fluid flow velocity. Therefore, different structural deformation regimes associated with mineralization systems can remarkably affect mineralization distributions in existing fissured and fractured zones. This article utilizes a computational simulation approach, which is rigorously developed on the basis of fundamental scientific laws and principles, to solve coupled rock deformation, porosity–permeability evolution and pore-fluid flow problems, which are deeply involved in rock deformation driven mineralization systems. In particular, the porosity and permeability variations, which are caused by rock deformation, and often neglected in the previous studies of solving mineralization problems, are explicitly considered in the computational simulation approach of this study. The proposed approach is verified through a benchmark problem and, moreover, it was employed to examine how different structural deformation regimes can affect the mineralization distributions in existing fissured and fractured zones within the surrounding fluid-saturated porous rocks through using a generic model, which can be viewed as a representation of a generalized and simplified geological model. Main results obtained from this study have demonstrated the following conclusions: (1) consideration of porosity–permeability variations can have significant impacts on the computational simulation solutions of coupled rock deformation, porosity–permeability evolution and pore-fluid flow problems in fluid-saturated porous rocks; (2) different structural deformation regimes can have a significant effect on the mineralization enrichment distributions in ore-forming systems consisting of fluid-saturated porous rocks; (3) there are two favorable mineralization enrichment environments associated with compressional and extensional deformation regimes in ore-forming systems involving permeable fractured zones or faults.

1. Introduction

Mineral resources are one of the indispensable material foundations for the civilization and modernization of mankind. Since existing mineral resources of both high grade and large tonnage will be exhausted in the near future, it is essential to find new and giant mineral deposits within the upper crust of the Earth [1,2,3,4,5]. This requires us to use either the purely mathematical deduction methods [1,2,6,7,8,9,10] or the emerging computational simulation methods [11,12] for studying potential ore-forming mechanisms, which control the possible localities of giant mineral deposits within the upper crust of the Earth. Extensive early studies explored the application of coupled geodynamic modeling to geology and mineralizing systems in Australia [13,14,15,16,17,18,19]. Although a realistic geological model is used to study the ore-forming mechanism associated with a particular mineralization region in China [20,21,22,23,24,25,26,27], a generic model, which can be considered as the representation of a generalized and simplified geological model, is commonly used to study potential ore-forming mechanisms within the upper crust of the Earth [3,8,9]. Since the realistic geological model is strongly dependent on a specific mineralization region, it can only produce specific results and conclusions for the considered mineralization region [21,22,23,24,25,27,28]. However, since the generic model represents a family of similar mineralization regions which have the same ore-forming mechanism, it can produce general results and conclusions for the family of similar mineralization regions. For this reason, the generic model, instead of a realistic geological model, is utilized in this study.
From the scientific point of view, an ore-forming system within the upper crust of the Earth belongs to a complex and complicated system. It may involve the following six main processes: a rock deformation process, a porosity–permeability evolution process, a pore-fluid flow process, a heat transfer process, a mass transport process and a chemical reaction process [11,12]. Since these processes are fully coupled, it is very difficult, if not impossible, to obtain either analytical or numerical solutions for the fully coupled problems between the abovementioned six main processes. Alternatively, according to different potential ore-forming mechanisms, the fully coupled problem between a few of the six main processes is commonly considered in either a generic model or a realistic geological model. For example, from the driving force point of view, if the pore-fluid flow is mainly driven by the rock deformation process, then it is called the pore-fluid pressure gradient driven flow. If the pore-fluid flow is mainly driven by the heat transfer process, then it is called the temperature gradient driven flow, while if the pore-fluid flow is mainly driven by the chemical reaction process, then it is called the solute concentration gradient driven flow. Since pore-fluid flow plays a vital role in controlling mineralization distributions within an ore-forming system, the type of pore-fluid flow is commonly used to determine the mineralization mechanism involved in the ore-forming system [29,30]. Consequently, if the mineralization distribution is mainly caused by the temperature gradient driven flow, then a coupled problem between a heat transfer process and a pore-fluid flow process is commonly considered in either a generic model [7,8,29,30] or a realistic geological model [21,22,23,24,25,26,27]. On the other hand, if the mineralization distribution is mainly caused by the solute concentration gradient driven flow, then a coupled problem between a pore-fluid flow process, a porosity–permeability evolution process, a mass transport process and a chemical reaction process is commonly considered in a generic model [31,32,33,34,35,36,37]. Nevertheless, if the mineralization distribution is mainly caused by the pore-fluid pressure gradient driven flow, then a coupled problem between a rock deformation, a porosity–permeability evolution process and a pore-fluid flow process should be considered in either a generic model or a realistic geological model. Although the mineralization mechanisms associated with the temperature gradient driven flow have been extensively studied in recent years [31,32,33,34,35,36,37], there are only limited studies on the mineralization mechanisms associated with the pore-fluid pressure gradient driven flow, where a coupled problem between a rock deformation, a porosity–permeability evolution process and a pore-fluid flow process should be taken into account. Because the main purpose of conducting this study is to investigate how structural deformation regimes within the upper crust of the Earth can affect the mineralization distributions in fluid-saturated porous rocks, it is necessary to consider a coupled problem between the rock deformation, porosity–permeability evolution and pore-fluid flow processes in the mineralization system.
According to the modern mineralization theory [29,30], if the mineralization distribution is mainly controlled by the temperature gradient driven pore-fluid flow, then the rock alteration index associated with temperature gradient (RAIt), which is equal to the scalar product of pore-fluid velocity and temperature gradient [7,29,30], can be used to show potential mineral precipitation and dissolution regions within the ore-forming system. On the other hand, if the mineralization distribution is mainly controlled by the pore-fluid pressure gradient driven pore-fluid flow, then the rock alteration index associated with pore-fluid pressure gradient (RAIp), which is equal to the scalar product of pore-fluid velocity and pore-fluid pressure gradient [7,29,30], can be used to show potential mineral precipitation and dissolution regions within the ore-forming system.
By taking what is mentioned above into account, the forthcoming contents of this article are arranged as follows: In Section 2, after a generic model is used to represent an ore-forming system within the upper crust of the Earth, the governing equations of the coupled problem between rock deformation, porosity–permeability evolution and pore-fluid flow processes are presented for the generic model. In particular, a computational simulation algorithm is proposed for solving the coupled rock deformation, porosity–permeability evolution and pore-fluid flow problem. In Section 3, analytical solutions are mathematically derived for a benchmark problem involving coupled rock deformation and pore-fluid flow in fluid-saturated porous rocks. Consequently, the proposed computational simulation algorithm is verified through comparing the computational simulation results with the analytical solutions of the benchmark problem. In Section 4, the proposed computational simulation approach is used to investigate how different structural deformation regimes can affect the mineralization distributions in permeable fractured zones or faults, which are located within the upper crust of the Earth. Finally, some conclusions are given in Section 5.

2. Mathematical Governing Equations for the Coupled Rock Deformation, Porosity-Permeability Evolution and Pore-Fluid Flow Problem

2.1. Generic Model

For the purpose of investigating how structural deformation regimes can affect mineralization distributions within highly permeable material zones consisting of fissured and fractured porous rocks, a generic model (see Figure 1) is used in this study to represent a portion of the fluid-saturated porous rock within the upper crust of the Earth. In this generic model, the horizontal length and the thickness in the vertical direction are denoted by L and H , respectively. There is an existing fissured and fractured material zone in the generic model. Compared with the fluid-saturated porous rock considered in the generic model, the elastic modulus of the fissured and fractured material zone is relatively small, so that the weakness of the fissured and fractured material zone can be reflected in the generic model, from the mechanical deformation point of view. Through applying either tensile stresses or compressive stresses on the vertical boundaries of the generic model, the effects of different structural deformation regimes, such as the extensional structural deformation and the compressional structural deformation, can be taken into account in the generic model. In the aspect of simulating the pore-fluid flow process in the generic model, the top and bottom boundaries can be assumed to be either permeable or impermeable, depending on the specific cases to be considered. On the other hand, in the aspect of simulating the rock deformation process in the generic model, the top boundary is free in both the horizontal and vertical directions, while the bottom boundary is free in the horizontal direction but fixed in the vertical direction.

2.2. Mathematical Model

Based on the related scientific principles, a mathematical model can be derived for describing the coupled rock deformation, porosity–permeability evolution and pore-fluid flow problem in fluid-saturated porous rocks [11]. For a two-dimensional elastic and fluid-saturated porous rock, the force equilibrium equations without considering gravity can be expressed as follows:
σ x x + τ y x y = 0
τ x y x + σ y y = 0
σ x = E ( 1 ν ) ( 1 2 ν ) ( 1 + ν ) ( ε x + ν 1 ν ε y ) p = σ ˜ x p
σ y = E ( 1 ν ) ( 1 2 ν ) ( 1 + ν ) ( ν 1 ν ε x + ε y ) p = σ ˜ y p
τ x y = τ y x = 2 G γ x y
ε x = u s x ,   ε y = v s y ,   γ x y = 1 2 ( u s y + v s x )
where σ x and σ y are the total normal stresses of the fluid-saturated porous rock in the x and y directions, respectively; σ ˜ x and σ ˜ y are the effective normal stresses of the solid matrix in the x and y directions, respectively; ε x and ε y are the normal strains of the solid matrix in relation to σ ˜ x and σ ˜ y , respectively; τ x y and γ x y are the shear stress and shear strain of the solid matrix, respectively; u s and v s are the horizontal and vertical displacements of the solid matrix, respectively; p is the excess pore-fluid pressure due to the mechanical deformation effect; E and G are the elastic and shear modulus of the solid matrix, respectively; and ν is Poisson’s ratio of the solid matrix.
It needs to be pointed out that Equations (1) and (2) represent the force equilibrium equations, whereas Equations (3)–(6) are the constitutive equations and strain–displacement relationship equations, respectively. By means of the commonly used sign convention in elastic mechanics, both the total and effective normal stresses are positive if they are considered to be tensile stresses.
Substitution of Equations (3)–(6) into Equations (1) and (2) yields the following two equations:
G ( 2 u s x 2 + 2 u s y 2 ) + G 1 2 ν ( 2 u s x 2 + 2 v s x y ) p x = 0
G ( 2 v s x 2 + 2 v s y 2 ) + G 1 2 ν ( 2 u s x y + 2 v s y 2 ) p y = 0
On the other hand, for an uncompressible pore-fluid in a two-dimensional fluid-saturated porous rock, the corresponding transient-state continuity equation of the pore-fluid can be written as follows:
ϕ t + u x + v y = 0
where u is the x-direction component of the pore-fluid velocity; v is the y-direction component of the pore-fluid velocity in the fluid-saturated porous rock; and ϕ is the porosity of the fluid-saturated rock.
If the Darcy law is used to describe pore-fluid flow in a fluid-saturated porous rock [1,2,6,7,8], then both the x-direction (i.e., horizontal direction in this study) and the y-direction (i.e., vertical direction in this study) components of the pore-fluid velocity have the following form:
u = k ( ϕ ) μ p x
v = k ( ϕ ) μ p y
where k ( ϕ ) is the permeability of the porous rock; p is the excess pore-fluid pressure in the fluid-saturated porous rock; and μ is the dynamic viscosity of the pore-fluid. Generally, the total pore-fluid pressure is equal to the summation of the excess pore-fluid pressure and the static pore-fluid pressure [30].
To establish a coupling between the rock deformation process and the pore-fluid flow process, it is necessary to consider a relationship between the volumetric strain and the porosity of the porous rock as well as a relationship between porosity and permeability. For small strain problems, the volumetric strain and porosity relationship can be expressed in [38]:
ϕ = 1 1 ϕ 0 1 + ε v ,   ε v = ε x + ε y
where ϕ and ϕ 0 are the porosity and initial porosity of the fluid-saturated porous rock, respectively; ε v is the volumetric strain of the solid matrix.
Through differentiating Equation (12) with respect to time, the following equation can be obtained:
ϕ t = ( 1 ϕ 0 ) ε v t = ( 1 ϕ 0 ) [ t ( u s x ) + t ( v s y ) ]
If the Carman–Kozeny formula [8,39] is used, then the permeability of the fluid-saturated porous rock can be expressed as a function of porosity as follows:
k ( ϕ ) = k 0 ( 1 ϕ 0 ) 2 ϕ 3 ϕ 0 3 ( 1 ϕ ) 2
where k 0 is the reference permeability corresponding to the reference porosity, ϕ 0 .
Substitution of Equations (10), (11) and (13) into Equation (9) yields the following equation:
( 1 ϕ 0 ) [ t ( u s x ) + t ( v s y ) ] x ( k ( ϕ ) μ p x ) y ( k ( ϕ ) μ p y ) = 0
Note that Equations (7), (8) and (15) are three simultaneous partial-differentiation equations for describing the coupled rock deformation, porosity–permeability evolution and pore-fluid flow in fluid-saturated porous rocks. Clearly, the rock deformation process is coupled with the pore-fluid flow process through the terms p x and p y in Equations (7) and (8), while the pore-fluid flow process is coupled with the rock deformation process through the term ( 1 ϕ 0 ) [ t ( u s x ) + t ( v s y ) ] in Equation (15). Since there are three unknown variables, namely u s , v s and p , in these three equations, the coupled problem between the rock deformation, porosity–permeability evolution and pore-fluid flow in fluid-saturated porous rocks is well posed mathematically. However, it is very difficult, if not impossible, to derive analytical solutions for mathematically solving these three simultaneous partial-differentiation equations, so that it is a natural choice to solve them through computational simulation methods, such as the commonly-used finite element method.
It needs to be pointed out that since the fractured zones and faults can be treated as porous rocks of different physical and chemical parameters, the governing equations associated with the aforementioned mathematical model are equally suitable for describing the coupled rock deformation, porosity–permeability evolution and pore-fluid flow problem in fluid-saturated fractured zones and faults, from the mathematical point of view.

2.3. Computational Simulation Algorithm

A combined computational simulation algorithm consisting of the finite difference method and the finite element method is used to solve the aforementioned coupled rock deformation, porosity–permeability evolution and pore-fluid flow problem in the fluid-saturated porous rock. In the combined computational simulation algorithm, the finite difference method is employed to discretize time, while the finite element method is utilized to discretize space. By following this idea and using the backward difference scheme, Equation (15) can be rewritten in the following difference form:
( 1 ϕ 0 ) Δ t [ ( ε v ) t i + Δ t ( ε v ) t i ] x ( k ( ϕ ) μ p t i + Δ t x ) y ( k ( ϕ ) μ p t i + Δ t y ) = 0
where p t i + Δ t is the excess pore-fluid pressure at time-step t i + Δ t ; ( ε v ) t i + Δ t is the volumetric strain of the solid matrix at time-step t i + Δ t ; ( ε v ) t i is the volumetric strain of the solid matrix at time-step t i ; and Δ t is the time-step length.
Note that in the process of evaluating Equation (16), the following equation is utilized:
( ε v ) t i + Δ t ( ε v ) t i = 1 M v ( p t i + Δ t p t i )
where p t i is the excess pore-fluid pressure at time-step t i ; M v is the volumetric compression modulus of the solid matrix, which is defined as the compressive stress needed for unit volumetric strain.
Consequently, Equation (16) can be rewritten as follows:
( 1 ϕ 0 ) Δ t M v [ p t i + Δ t p t i ] x ( k ( ϕ ) μ p t i + Δ t x ) y ( k ( ϕ ) μ p t i + Δ t y ) = 0
In order to facilitate the description of the finite element formulations, it is desirable to express the three unknown variables associated with the coupled rock deformation, porosity–permeability evolution and pore-fluid flow problem in the fluid-saturated porous rock as follows:
U 1 = ( u s ) t i + Δ t ,   U 2 = ( v s ) t i + Δ t ,   U 3 = p t i + Δ t
Consequently, Equations (7), (8) and (18) can be rewritten in the following forms:
G ( 2 U 1 x 2 + 2 U 1 y 2 ) + G 1 2 ν ( 2 U 1 x 2 + 2 U 2 x y ) = U 3 x
G ( 2 U 2 x 2 + 2 U 2 y 2 ) + G 1 2 ν ( 2 U 1 x y + 2 U 2 y 2 ) = U 3 y
x ( k ( ϕ ) μ U 3 x ) + y ( k ( ϕ ) μ U 3 y ) = ( 1 ϕ 0 ) Δ t M v [ U 3 p t i ]
According to the finite element method [11,40,41], Equation (19) can be written in the following discretization form at the element level:
U 1 e = [ N ] Δ 1 e ,   U 2 e = [ N ] Δ 2 e ,   U 3 e = [ N ] Δ 3 e
where U 1 e and U 2 e are the horizontal and vertical displacement distributions of the porous rock, respectively, within the finite element; U 3 e is the excess pore-fluid pressure distribution of the pore-fluid within the finite element; Δ 1 e and Δ 2 e are the nodal horizontal and vertical displacement vectors of the finite element, respectively; Δ 3 e is the nodal excess pore-fluid pressure vector of the finite element; [ N ] is the shape function matrix of the finite element.
On the basis of using the Galerkin weighted residual procedure [40,41], Equations (20)–(22) can be turned into the following equation at the element level:
A [ N ] T G ( 2 U 1 x 2 + 2 U 1 y 2 ) + G 1 2 ν ( 2 U 1 x 2 + 2 U 2 x y ) U 3 x d A = 0
A [ N ] T G ( 2 U 2 x 2 + 2 U 2 y 2 ) + G 1 2 ν ( 2 U 1 x y + 2 U 2 y 2 ) U 3 y d A = 0
A [ N ] T x ( k ( ϕ ) μ U 3 x ) + y ( k ( ϕ ) μ U 3 y ) ( 1 ϕ 0 ) Δ t M v [ U 3 p t i ] d A
where A is the area of the finite element.
Through mathematically manipulating Equations (24)–(26), the following finite element formulations can be derived at the element level:
[ K ] e { Δ 1 } e + [ B ] e { Δ 2 } e = { F 1 } e
[ B ^ ] e { Δ 1 } e + [ K ^ ] e { Δ 2 } e = { F 2 } e
[ H ] e { Δ 3 } e = { F 3 } e
where K e , B e , K ^ e , B ^ e and H e are the property matrices of the finite element; and F 1 e , F 2 e and F 3 e are the “load” vectors of the finite element.
The abovementioned property matrices and “load” vectors of the finite element can be appropriately assembled to derive the finite element formulations for the entire system of the coupled rock deformation, porosity–permeability evolution and pore-fluid flow problem in the fluid-saturated porous rocks as follows:
[ K ] { Δ 1 } + [ B ] { Δ 2 } = { F 1 }
[ B ^ ] { Δ 1 } + [ K ^ ] { Δ 2 } = { F 2 }
[ H ] { Δ 3 } = { F 3 }
where K , B , K ^ , B ^ and H are the global property matrices of the coupled rock deformation, porosity–permeability evolution and pore-fluid flow system; Δ 1 is the global vector of the horizontal displacement in the entire coupled system; Δ 2 is the global vector of the vertical displacement in the entire coupled system; Δ 3 is the global vector of the excess pore-fluid pressure in the entire coupled system; F 1 is the global “load” vector associated with Δ 1 ; F 2 is the global “load” vector associated with Δ 2 ; and F 3 is the global “load” vector associated with Δ 3 .
It is worth mentioning that since F 3 is a time-dependent vector, Equations (30)–(32) need to be solved at each time-step. Afterwards, the rock alteration index associated with the pore-fluid velocity vector and the first-order derivative of the total pore-fluid pressure can be computed at the end of each time-step through using the following formula:
R A I p = u Δ 3 x + v Δ 3 y + p y s t a t i c
where R A I p is the rock alteration index associated with the pore-fluid velocity vector and the first-order derivative of the total pore-fluid pressure in the coupled rock deformation, porosity–permeability evolution and pore-fluid flow system; u and v are respectively the horizontal and vertical components of the pore-fluid velocity vector in the coupled rock deformation, porosity–permeability evolution and pore-fluid flow system; p y s t a t i c is the static pore-fluid pressure gradient in the vertical direction of the coupled rock deformation, porosity–permeability evolution and pore-fluid flow system. Note that u and v can be computed through using Equations (10) and (11).
Equations (30)–(32), which are used to describe the coupled rock deformation, porosity–permeability evolution and pore-fluid flow problem, can be solved in a sequential and iterative manner. As the first solution step of a given current time-step, Equation (32) is solved to obtain the excess pore-fluid pressure of the entire system at the current time-step by using the porosity–permeability function and the excess pore-fluid pressure obtained from the previous time-step. However, if the given current time-step is the first time-step in the computation, then Equation (32) is solved to obtain the excess pore-fluid pressure of the entire system at the current time-step by using the porosity–permeability function and the excess pore-fluid pressure described in the initial conditions of the coupled rock deformation, porosity–permeability evolution and pore-fluid flow problem. As the second solution step of the given current time-step, Equations (30) and (31) can be simultaneously solved to obtain the horizontal and vertical displacements of the entire system at the current time-step by using the obtained excess pore-fluid pressure from the first solution step of the given current time-step. Since Equations (30)–(32) are coupled, these two solution steps need to be repeated until the convergent solutions for the horizontal and vertical displacements as well as the excess pore-fluid pressure are obtained at the current time-step. As the third solution step of the given current time-step, both the porosity and the permeability are updated at the current time-step, while the R A I p is evaluated at the current time-step. Subsequently, the abovementioned solution processes need to be repeated until the final time-step in the computational simulation of the coupled rock deformation, porosity–permeability evolution and pore-fluid flow problem in the fluid-saturated porous rocks is reached.

3. Verification of the Proposed Computational Simulation Algorithm

It is well known that compared with the purely mathematical deduction method, which can be used to derive exact analytical solutions, computational simulation methods, which belong to approximate solution methods, can only produce approximate solutions for scientific and engineering problems [40,41]. This is the inherent weakness of using computational simulation methods. For this reason, any new computational simulation algorithm associated with using the computational simulation method should be carefully verified before it is used to solve realistic scientific and engineering problems. Toward this goal, a benchmark problem, for which the analytical solution can be derived through using the purely mathematical deduction method, needs to be constructed, so that the proposed computational simulation algorithm for solving the coupled rock deformation, porosity–permeability evolution and pore-fluid flow problem can be verified.

3.1. Brief Description of Deriving the Analytical Solutions for a Benchmark Problem

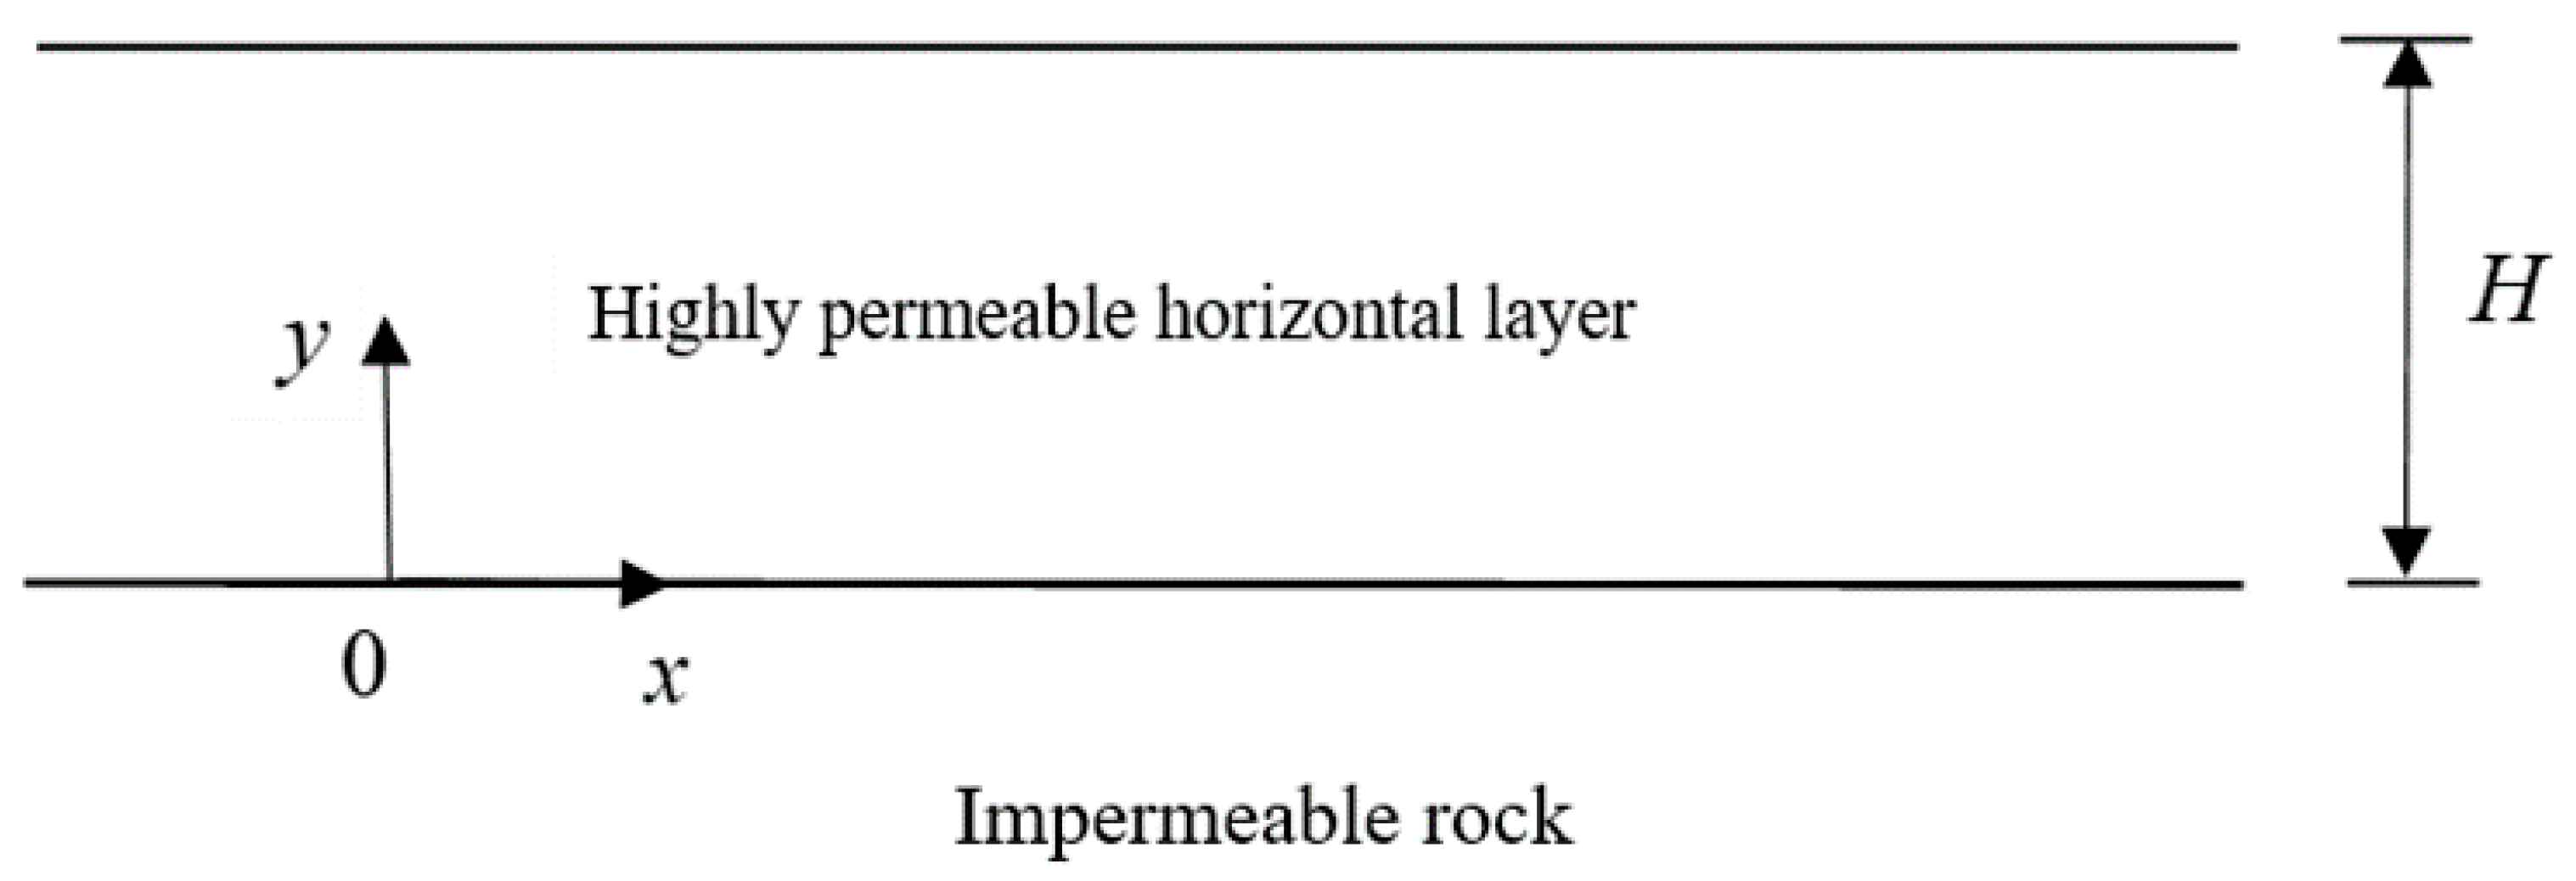
As shown in Figure 2, the geometry of the benchmark problem is a layered half space, in which the top layer is permeable, while the bottom layer is rigid and has low permeability. The thickness of the top layer is equal to H . There is a constant normal stress, which is uniformly distributed on the surface of the layered half space. It is assumed that the permeable top layer of the layered half space is filled with the homogeneous, isotropic, elastic and fluid-saturated porous medium. Note that although this assumption is far away from reality, it is necessary to derive the analytical solution for the benchmark problem [42]. The initial porosity of the porous medium in the permeable top layer is equal to ϕ 0 , while the corresponding initial permeability of the porous medium in the permeable top layer is equal to k 0 . In order to facilitate the mathematical derivation of the analytical solution, it is also assumed that the variation of permeability with porosity is small and negligible, so that the permeability of the porous medium in the permeable top layer remains constant in the process of deriving the analytical solution for the benchmark problem. Due to the specific geometrical shape, the benchmark problem can be essentially treated as a one-dimensional problem, from the purely mathematical point of view. The initial vertical displacement is equal to zero in the permeable top layer, while the initial excess pore-fluid pressure in the permeable top layer is equal to the constant normal stress (i.e., σ 0 ), which is acted on the surface of the layered half space. Since the bottom layer is rigid and has low permeability, it can be treated as a rigid and impermeable boundary to the permeable top layer, so that it is only necessary to consider the permeable top layer of the benchmark problem in the following mathematical analysis.
Based on the abovementioned considerations, the force equilibrium equation of the benchmark problem can be simplified in the permeable top layer as follows:
E v s y p = C 1
where E is the elastic modulus of the solid matrix in the permeable top layer; v s is the vertical displacement of the solid matrix in the permeable top layer; p is the excess pore-fluid pressure in the permeable top layer due to the mechanical deformation effect; C 1 is a constant, which should be equal to the total vertical stress (i.e., σ 0 ) in the permeable top layer.
Similarly, the transient-state continuity equation of the pore-fluid for the benchmark problem can be written in the permeable top layer as follows:
( 1 ϕ 0 ) 2 v s y t k 0 μ 2 p y 2 = 0
where ϕ is the porosity of the fluid-saturated medium in the permeable top layer; ϕ 0 is the initial porosity of the fluid-saturated medium in the permeable top layer; k 0 is the permeability of the porous medium in the permeable top layer; and μ is the dynamic viscosity of the pore-fluid in the permeable top layer.
Mathematically, Equation (34) can be rewritten as follows:
E 2 v s y t p t = 0
Substitution of Equation (36) into Equation (35) yields the following equation:
( 1 ϕ 0 ) E p t k 0 μ 2 p y 2 = 0
It is obvious that Equation (34) can also be rewritten in the following form:
E 2 v s y 2 p y = 0
Substitution of Equation (38) into Equation (35) yields the following equation:
( 1 ϕ 0 ) E v s t k 0 μ 2 v s y 2 = C 2
where C 2 is another arbitrary constant, which arises from the mathematical deduction process and has no specific meaning in physics.
Equations (37) and (39) immediately indicate that the coupling effect between the medium deformation and pore-fluid flow in the permeable top layer can be decoupled mathematically for the benchmark problem, so that the analytical solution for the excess pore-fluid pressure in the permeable top layer can be derived from directly solving Equation (37). The analytical solution for the vertical displacement in the permeable top layer cannot be directly derived from solving Equation (39), unless the arbitrary constant, C 2 , can be determined, from the physical point of view. Nevertheless, the analytical solution for the total vertical displacement at the surface of the permeable top layer can be derived from solving Equation (34) after Equation (37) is mathematically solved.
For the purpose of deriving the analytical solution for the excess pore-fluid pressure in the permeable top layer, Equation (37) can be rewritten as follows:
p t β 2 p y 2 = 0
where
β = k 0 E μ ( 1 ϕ 0 )
The corresponding boundary conditions for the permeable top layer of the benchmark problem can be described as follows:
p = 0 ,   ( at   y = H ) ,   p y = 0   ( at   y = 0 )
On the other hand, the corresponding initial condition for the permeable top layer of the benchmark problem can be described as listed below:
p = σ 0   ( at   t = 0 )
Note that this initial condition is determined from the following consideration. Since the timescale of rock deformation is much smaller than that of pore-fluid pressure dissipation [12], an applied external force can propagate quickly throughout the fluid-saturated porous rock, so that it is immediately undertaken by the pore-fluid. Consequently, the excess pore-fluid pressure is equal to the extra total stress caused by the applied external force [43].
It is immediately recognized that the problem described by Equation (40) with the corresponding initial condition (i.e., Equation (43)) and boundary conditions (i.e., Equation (42)) is similar to either the classical heat conduction problem [44] or the classical soil consolidation problem [43]. Therefore, the analytical solution for the excess pore-fluid pressure in the permeable top layer can be derived by using the separation method of variables [43,44].
Consequently, the analytical solution for the excess pore-fluid pressure in the permeable top layer can be expressed as follows:
p = n = 0 C n e ( n + 1 2 ) 2 π 2 β t H 2 cos ( n + 1 2 ) π y H
where C n can be determined by considering the initial condition (i.e., Equation (43)) as follows:
C n = 2 H 0 H σ 0 cos ( n + 1 2 ) π y H d y = 2 σ 0 ( 1 ) n π ( n + 1 2 )
Afterwards, the analytical solution for the total vertical displacement at the surface of the permeable top layer can be derived from solving Equation (34), as shown below:
v s = 1 E 0 H ( σ 0 + p } d y = H σ 0 E + 1 E n = 0 C n e ( n + 1 2 ) 2 π 2 β t H 2 0 H cos [ ( n + 1 2 ) π y H ] d y = H σ 0 E + 1 E n = 0 C n e ( n + 1 2 ) 2 π 2 β t H 2 H ( 1 ) n ( n + 1 2 ) π = H σ 0 E 1 n = 0 2 ( n + 1 2 ) 2 π 2 e ( n + 1 2 ) 2 π 2 β t H 2

3.2. Verification of the Proposed Computational Simulation Algorithm Using the Benchmark Problem

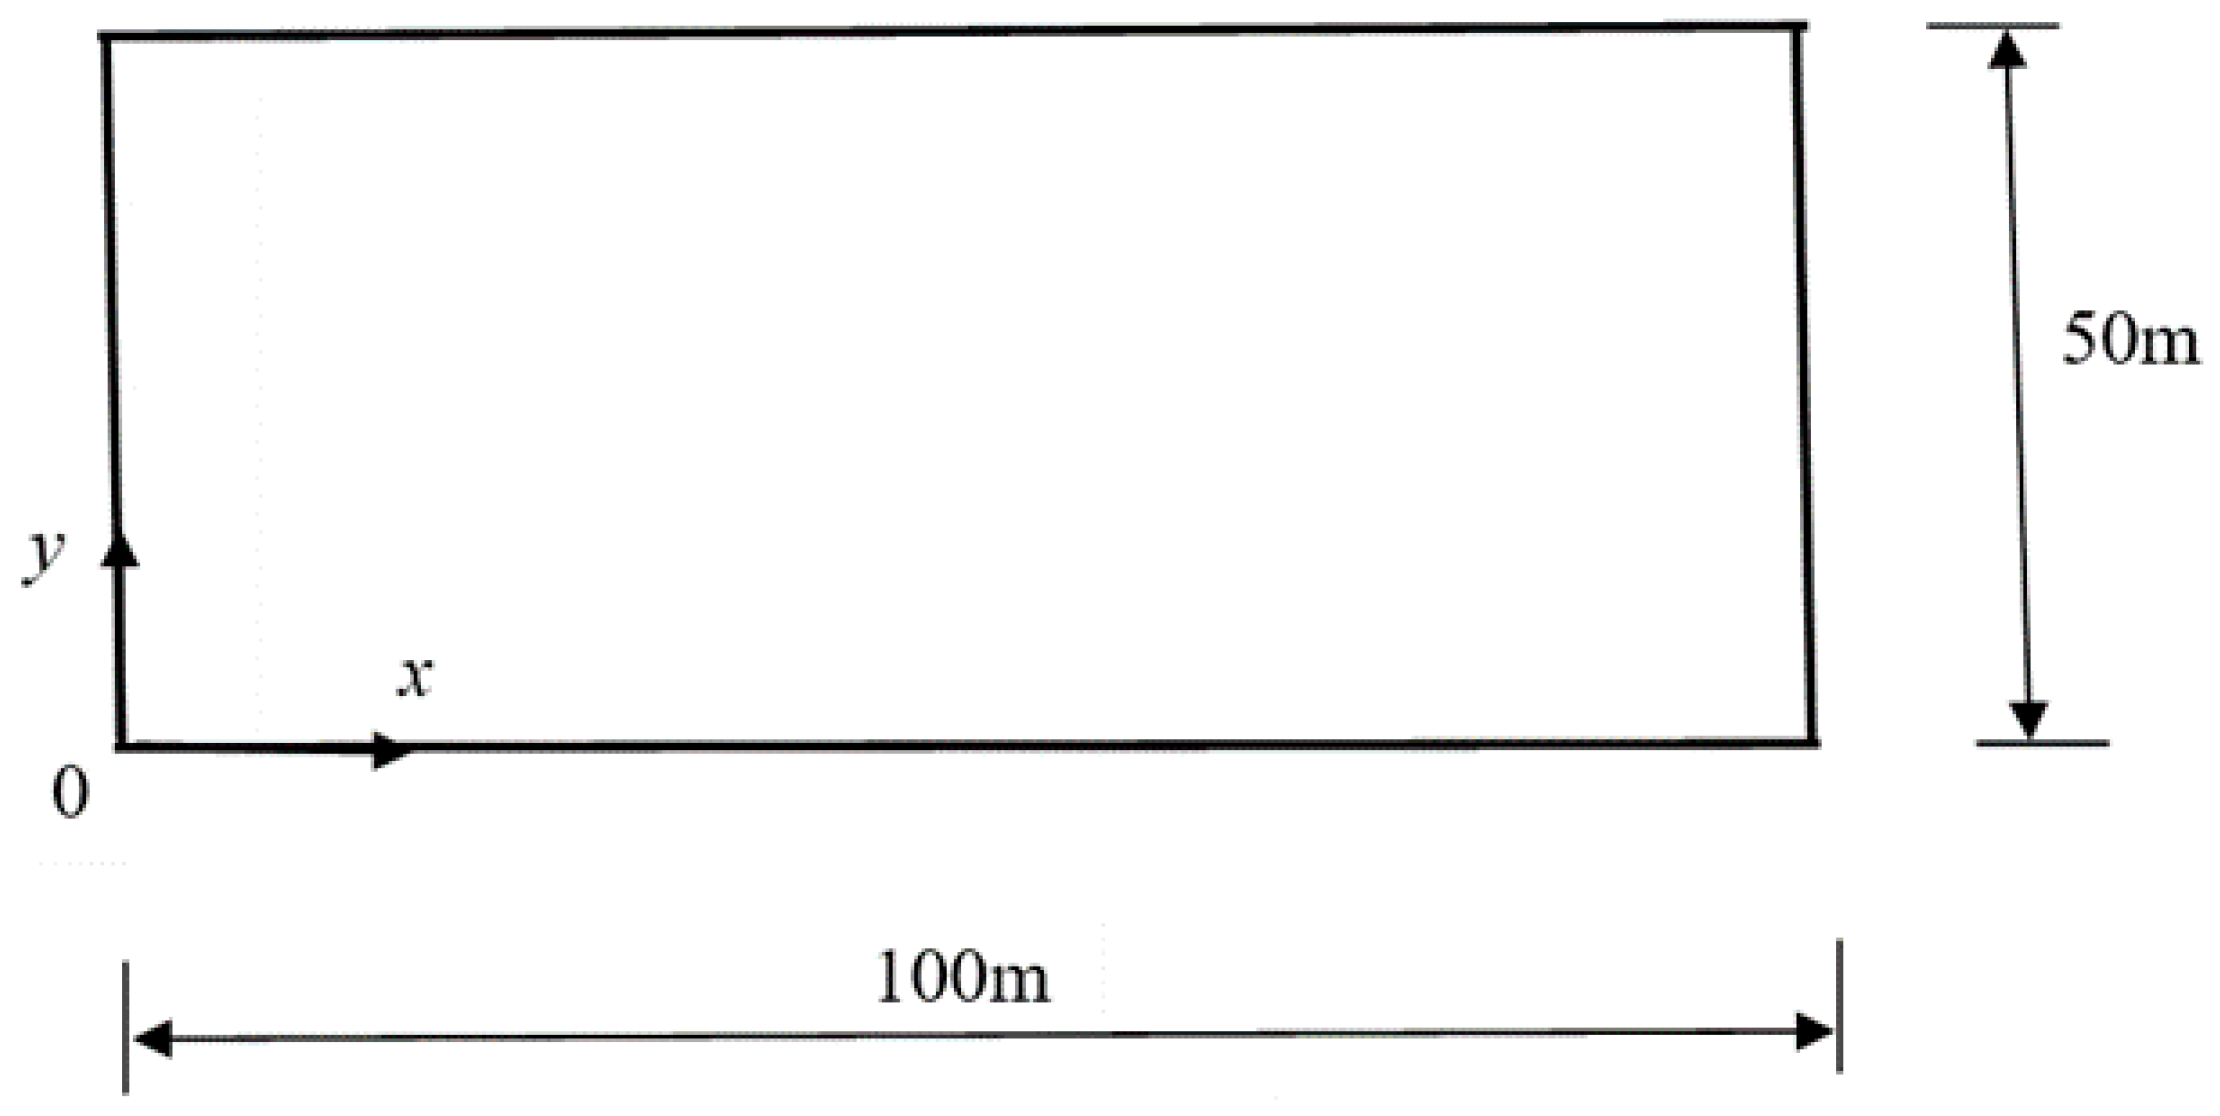
To verify the proposed computational simulation algorithm through using the benchmark problem, it is necessary to construct a computational simulation model to simulate the benchmark problem. Since finite elements are commonly used to simulate a finite computational domain, only a portion of the horizontal layer in the benchmark problem is simulated in the computational simulation model, as shown in Figure 3. In this computational simulation model, the width and length of the computational domain are equal to 50 m and 100 m, respectively. The entire computational domain is simulated with 1176 four-node quadrilateral finite elements. In the process of computationally simulating the benchmark problem, the following parameters are used: the elastic modulus of the porous rock is equal to 10 10 (N/m2); the porosity (i.e., ϕ 0 ) of the porous rock is equal to 0.1 , while the corresponding permeability (i.e., k 0 ) of the porous rock is equal to 10 14 m2; the pore-fluid dynamic viscosity is equal to 10−3 N·s/m2; and the constant normal stress (i.e., σ 0 ) acting on the top boundary of the computational domain is equal to −108 (N/m2), so that the initial excess pore-fluid pressure in the computational simulation model is equal to 108 (N/m2). In order to simulate the transient process of the pore-fluid flow, the time-step length is equal to 100 s in the computational simulation.
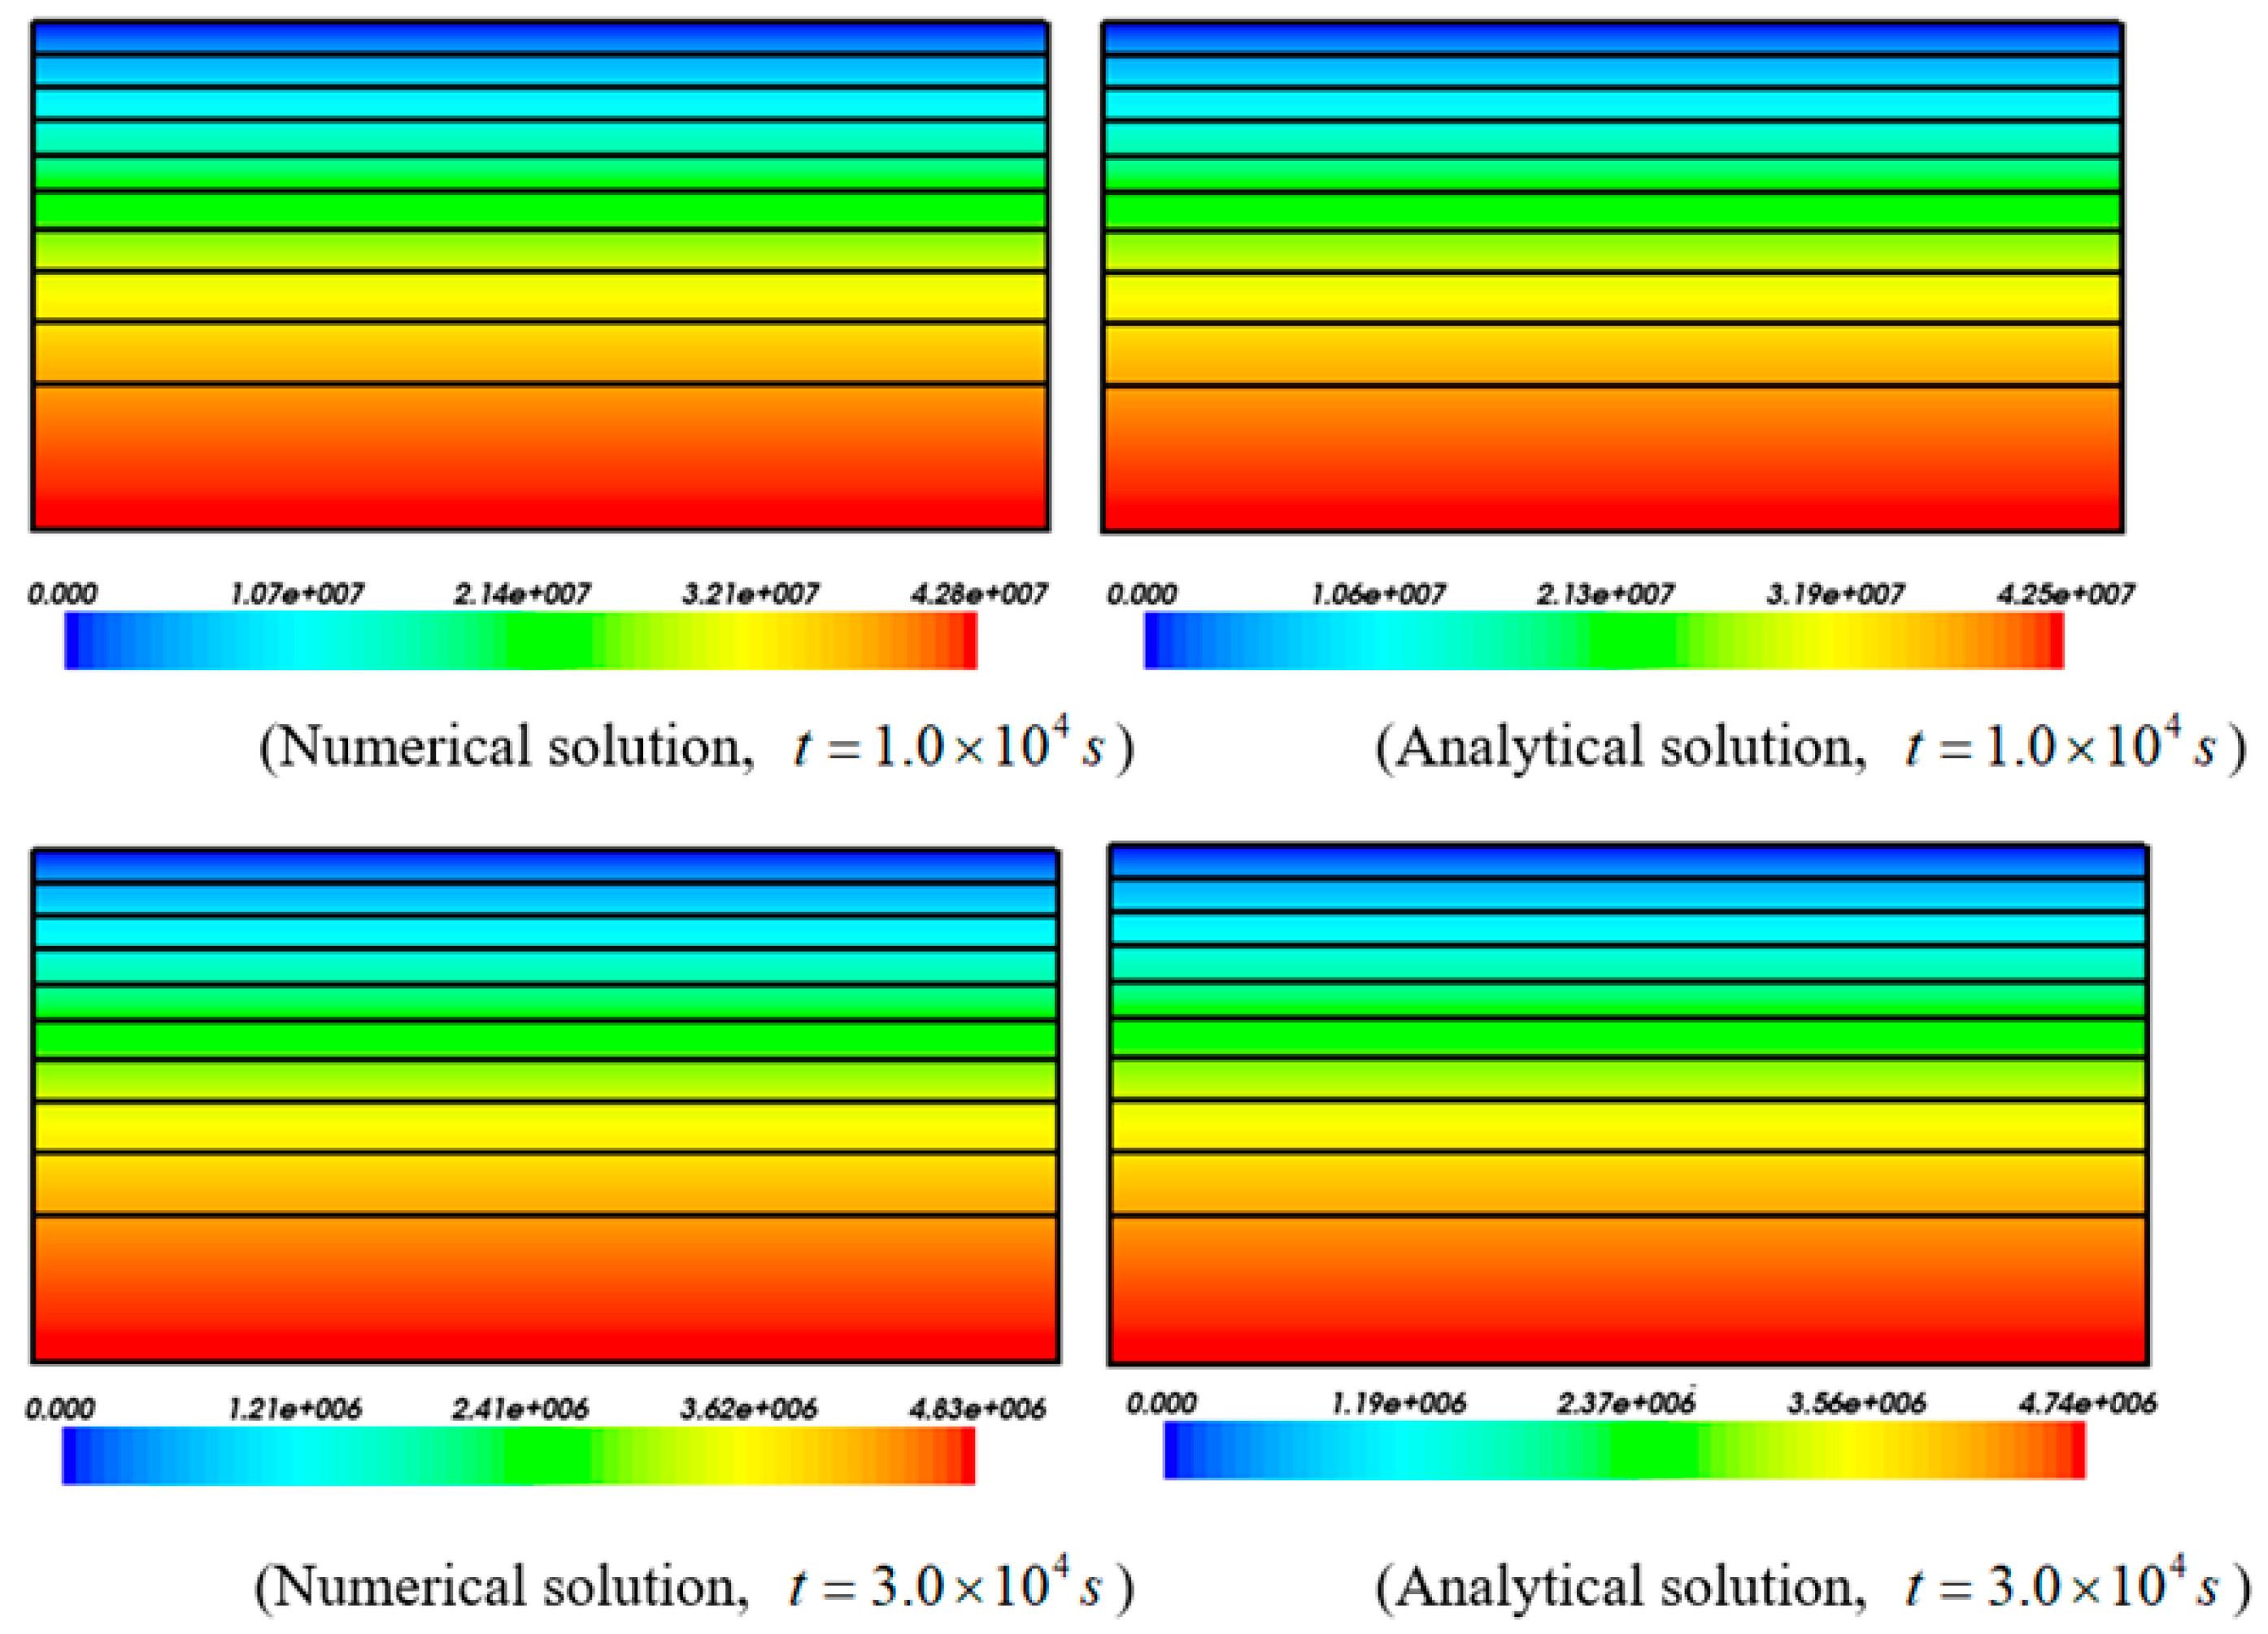
Figure 4 shows the comparison of the computational simulation result with the analytical solution for the excess pore-fluid pressure distribution in the benchmark problem at two different computational times, namely t = 1.0 × 10⁴ s and t = 3.0 × 10⁴ s. In this figure, the left column shows the computational simulation result (i.e., the numerical solution), while the right column shows the analytical solution. It is obvious that the computational simulation result agrees very well with the analytical solution for the benchmark problem. With the case of t = 1.0 × 10⁴ s taken as an example, the maximum value of the theoretically predicted excess pore-fluid pressure, which takes place at the bottom boundary of the benchmark problem, is equal to 4.28 × 10⁷ (N/m2), while the maximum value of the computationally simulated excess pore-fluid pressure is equal to 4.25 × 10⁷ (N/m2). In this situation, the relative error of the computationally simulated excess pore-fluid pressure is equal to 0.7 % , which is acceptable, from the solving geological problem point of view. This indicates that the proposed computational simulation algorithm is valid for solving the coupled rock deformation and pore-fluid flow problem, at least from the simulating pore-fluid flow point of view.
It is worth mentioning that the porosity–permeability evolution process is neglected in the process of deriving the analytical solution for the benchmark problem, because otherwise the analytical solution cannot be obtained for the benchmark problem. However, owing to the versatility of the computational simulation method, the porosity–permeability evolution process can be considered in the computational simulation model of the benchmark problem. This means that the effect of porosity–permeability evolution on the pore-fluid flow and rock deformation can be investigated through conducting the computational simulation of the benchmark problem. Toward this goal, the computational simulation of the benchmark problem with the consideration of porosity–permeability evolution is reconducted in this study.
Figure 5 shows the effect of porosity–permeability evolution on the computational simulation result for the excess pore-fluid pressure distribution in the computational domain at two different computational times. In this figure, the left column shows the result with considering the porosity–permeability evolution (i.e., P-P evolution) process, while the right column shows the result without considering the porosity–permeability evolution process. It is noted that consideration of the porosity–permeability evolution process can have remarkable impacts on the computational simulation results. With the situation of t = 3.0 × 10⁴ s taken as an example, in the case of considering the porosity–permeability evolution process, the maximum value of the computationally simulated excess pore-fluid pressure is equal to 9.75 × 10⁶ (N/m2), while in the case of not considering the porosity–permeability evolution process, the maximum value of the computationally simulated excess pore-fluid pressure is equal to 4.74 × 10⁶ (N/m2). Compared to the solution obtained from not considering the porosity–permeability evolution process, the relative solution difference between considering and not considering the porosity–permeability evolution process can reach 101.9 % (i.e., 9.75 4.74 4.74 = 101.9 % ). This demonstrates that the porosity–permeability evolution process should be considered in computationally simulating the coupled rock deformation, porosity–permeability evolution and pore-fluid flow problem, which reflects one of the key processes in an ore-forming system when the rock deformation is the main driving force to control the mineralization distributions in the ore-forming system.

4. Effects of Structural Deformation Regimes on Mineralization Distributions in Permeable Fractured Zones within Fluid-Saturated Rocks

The proposed computational simulation approach can be used to investigate the effects of structural deformation regimes on mineralization distributions in permeable fractured zones (or faults) within fluid-saturated rocks. Figure 6 shows the geometrical shape of the computational simulation model, which is used in this section. The width and length of the computational simulation model are equal to 250 m and 500 m, respectively. There is a fractured zone in the center of the model. The incline angle of the fractured zone is equal to 60 0 , which is measured from the horizontal plane. The length and maximum thickness of the fractured zone are equal to 125 m and 6.25 m, respectively. The entire computational domain is simulated by 6585 three-node triangle finite elements with 13,022 nodal points in total. In the aspect of simulating the rock deformation process, the top boundary of the computational simulation model is free in both the horizontal and vertical directions, while the left boundary of the computational simulation model is fixed in both the horizontal and vertical directions. In addition, the bottom boundary of the computational simulation model is free in the horizontal direction but fixed in the vertical direction. In the case of considering the compressional deformation regime, the constant normal stress (i.e., σ 0 ) acting on the right boundary of the computational simulation model is equal to −108 (N/m2), while in the case of considering the extensional deformation regime, the constant normal stress (i.e., σ 0 ) acting on the right boundary of the computational simulation model is equal to −108 (N/m2). For simulating the fractured zone, the elastic modulus is equal to 1.091 × 10⁹ (N/m2), while Poisson’s ratio is equal to 0.2. For simulating the porous rock, the elastic modulus is equal to 1010 (N/m2), while Poisson’s ratio is equal to 0.1.
In the aspect of simulating the pore-fluid flow process, both the top and bottom boundaries of the computational simulation model are permeable, while the left boundary of the computational simulation model is impermeable. To consider the porosity–permeability evolution process, the Carman–Kozeny law [39] is used, in which the reference porosity and reference permeability are equal to 0.1 and 10−14 m2, respectively. The pore-fluid dynamic viscosity is equal to 10−3 N·s/m2. For simulating the fractured zone, the initial porosity is equal to 0.5, while for simulating the porous rock, the initial porosity is equal to 0.1. In order to simulate the transient process of the pore-fluid flow, the time-step length is equal to 100 s in the computational simulation.
Figure 7 and Figure 8 show the effects of the compressional and extensional deformation regimes on the mineralization distributions at two different computational times, namely t = 4.0 × 10⁵ s and t = 8.0 × 10⁵ s. In these two figures, case 1 represents the computational simulation results, which are obtained from considering the compressional deformation of the porous rock, while case 2 represents the computational simulation results, which are obtained from considering the extensional deformation of the porous rock. Since the compressional deformation of the porous rock is considered in case 1, the excess pore-fluid pressure is positive, so that the pore-fluid is squeezed out of the computational domain. However, since the extensional deformation of the porous rock is considered in case 2, the excess pore-fluid pressure is negative, so that the pore-fluid is sucked into the computational domain. This phenomenon can be observed from the excess pore-fluid pressure distributions in Figure 7 and Figure 8. In terms of the streamline distributions, there are two flow loops in both the upper part and the lower part of the more permeable fractured zone at each of the two different computational times. This means that the convective pore-fluid flow can take place at either the upper part or the lower part of the more permeable fractured zone and its surrounding porous rock. From the convective pore-fluid flow point of view, the flow loop with a red core indicates that the pore-fluid flow is along the clockwise direction, while the flow loop with a blue core indicates that the pore-fluid flow is along the anticlockwise direction [11,30]. Therefore, in the case of simulating the compressional deformation regime (i.e., case 1), the pore-fluid flow is upward in the upper part of the more permeable fractured zone, but it is downward in the lower part of the more permeable fractured zone. However, in the case of simulating the extensional deformation regime (i.e., case 2), the pore-fluid flow is downward in the upper part of the more permeable fractured zone, but it is upward in the lower part of the more permeable fractured zone.
According to the modern mineralization theory [7,29,30], the negative value of the RAIp represents the mineral precipitation region, while the positive value of the RAIp represents the mineral dissolution region. This means that the blue region of the RAIp distribution represents the mineralization enrichment region. As shown in Figure 7 and Figure 8, in the case of simulating the compressional deformation regime (i.e., case 1), the mineralization enrichment region is in the upper part of the more permeable fractured zone, while in the case of simulating the extensional deformation regime (i.e., case 2), the mineralization enrichment region is in the lower part of the more permeable fractured zone. This clearly demonstrates that different rock deformation regimes can have significant impacts on the mineralization distributions in the more permeable fractured zone within the upper crust of the Earth, which is comprised of fluid-saturated porous rocks.
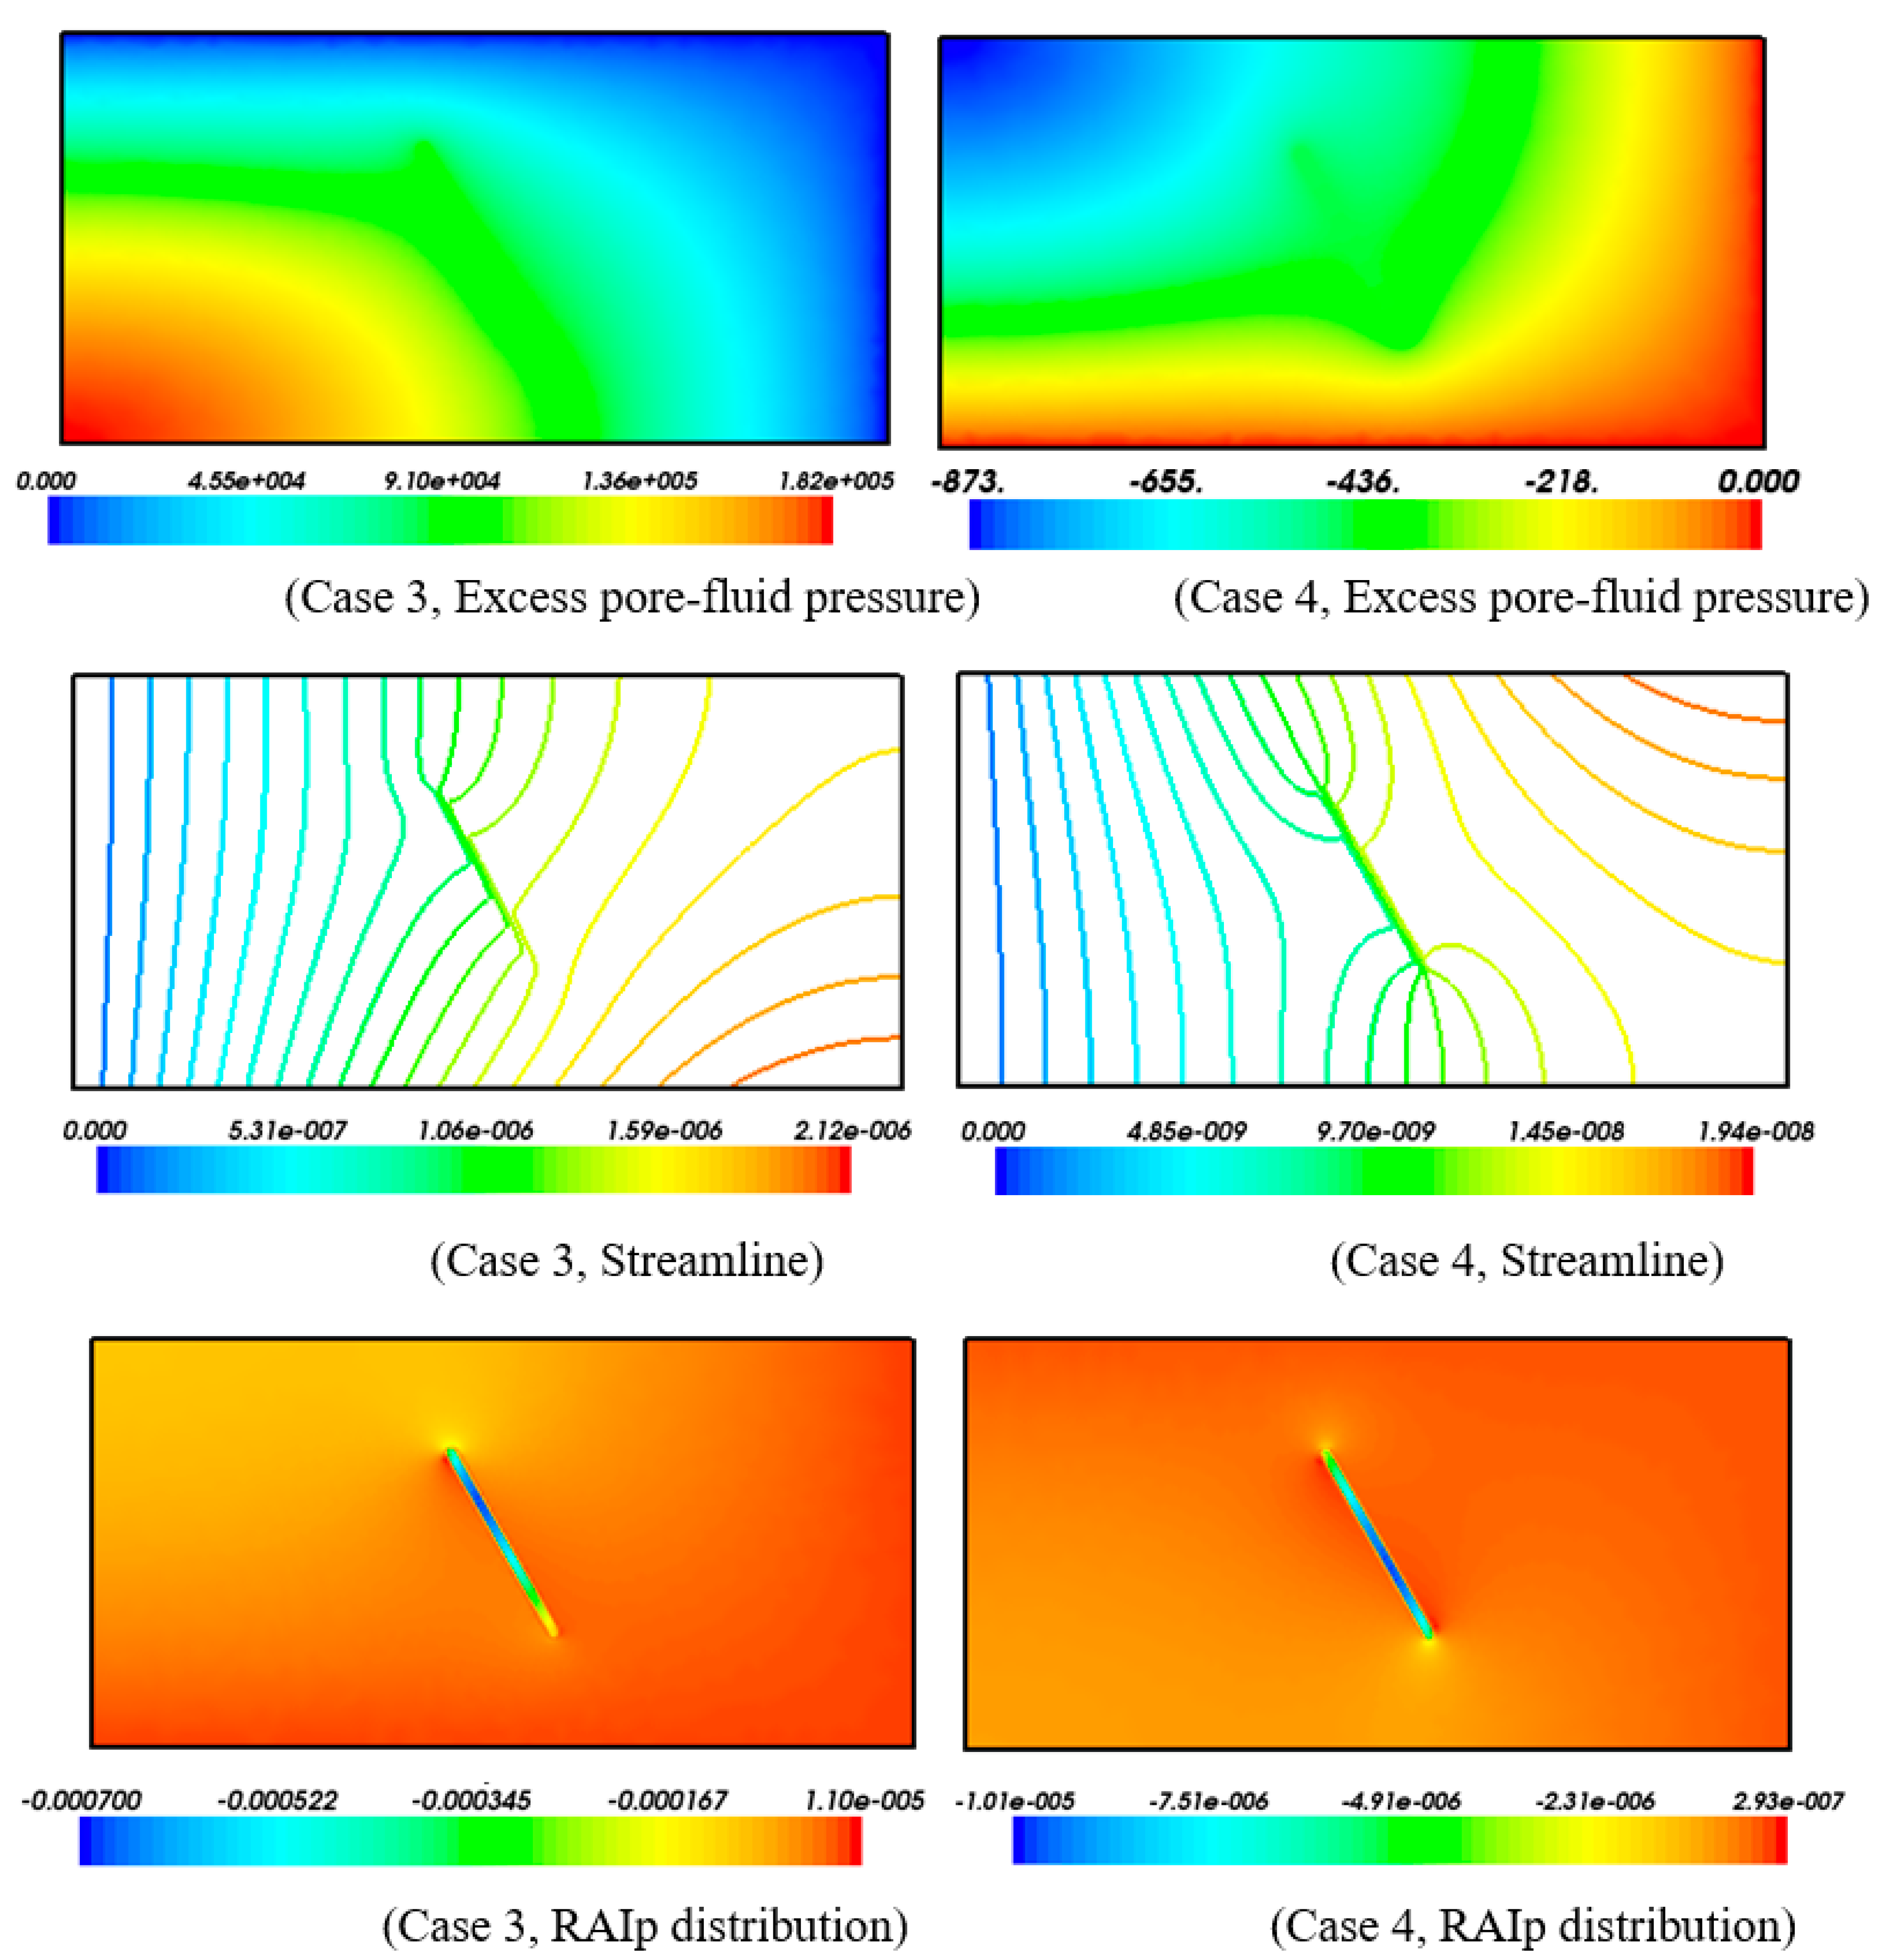
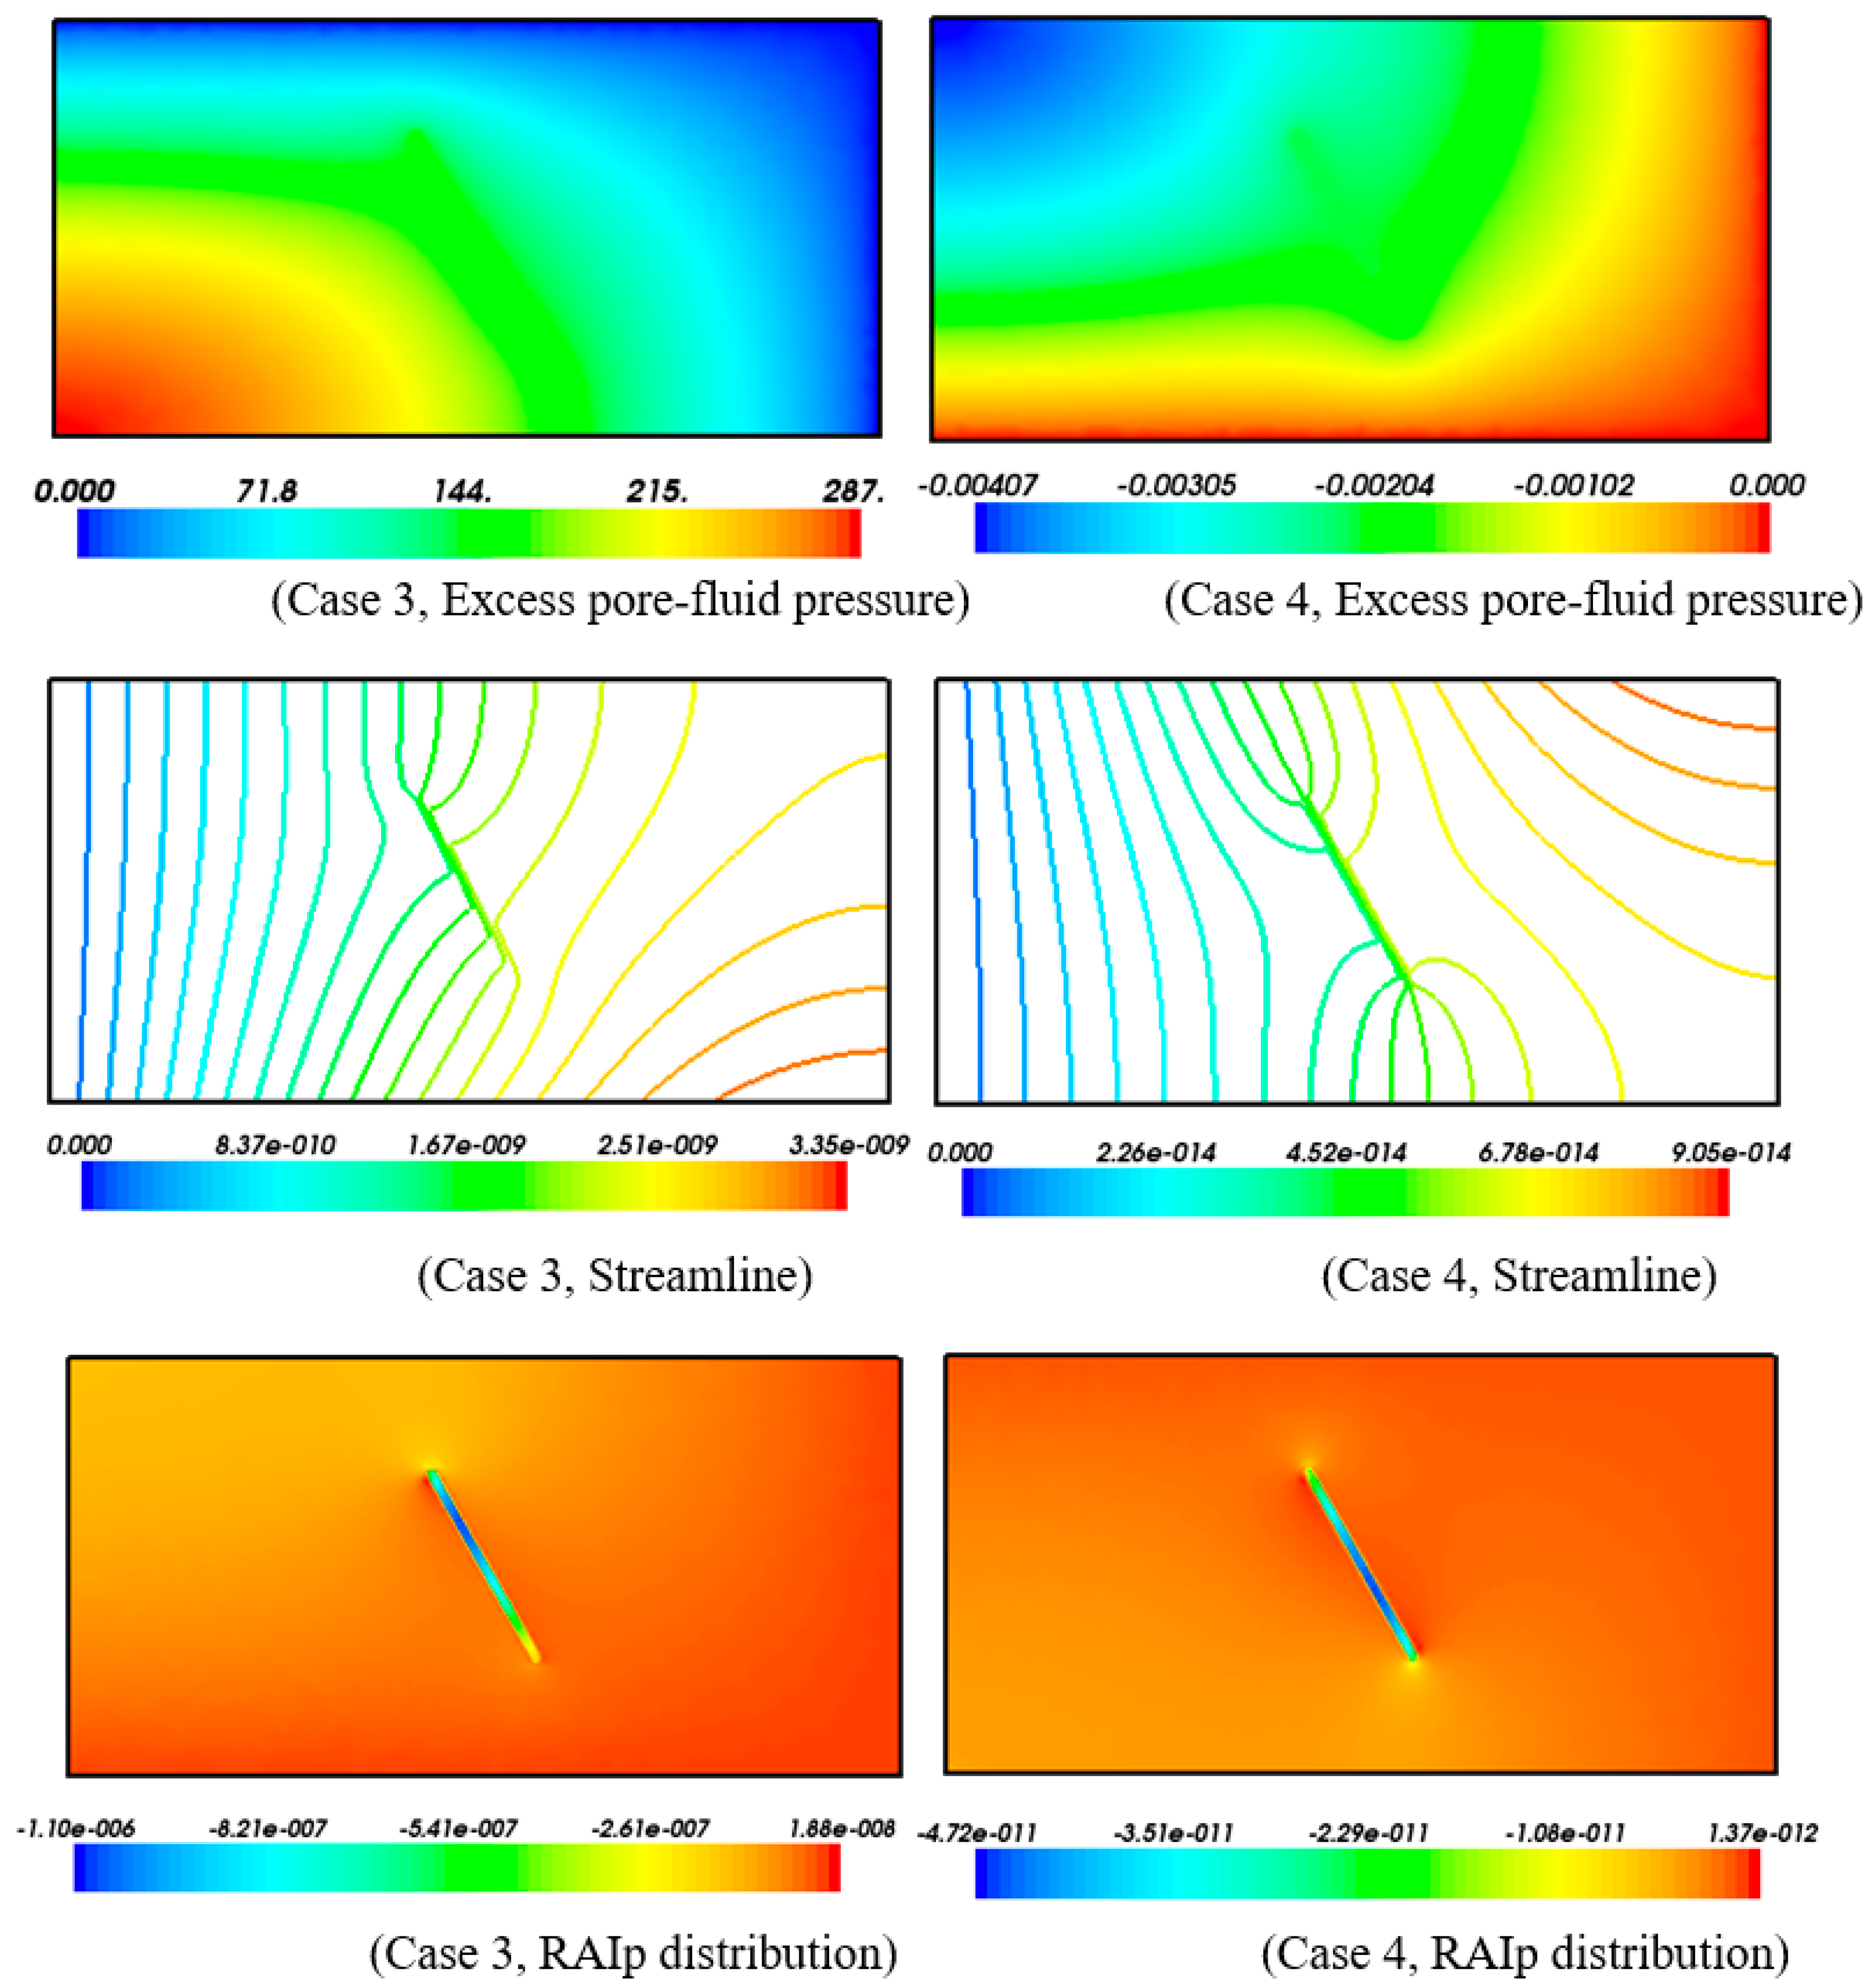
In order to achieve the favorable mineralization environment, it is important to explore where the mineralization enrichment region is located in the whole portion (including both the upper and lower parts) of the more permeable fractured zone. In this regard, two additional cases (i.e., case 3 and case 4) are simulated using the proposed computational simulation approach in this study. In terms of case 3, the finite element mesh and related parameters are exactly the same as those used in case 1, except that the bottom boundary is impermeable instead of permeable. On the other hand, in terms of case 4, the finite element mesh and related parameters are exactly the same as those used in case 2, except that the top boundary is impermeable instead of permeable.
Figure 9 and Figure 10 show the effects of top and bottom boundary conditions on the mineralization distributions associated with the compressional and extensional deformation regimes at two different computational times, namely t = 1.6 × 10⁶ s and t = 3.2 × 10⁶ s. It is noted that the excess pore-fluid pressure distribution is positive in case 3 but negative in case 4. This is consistent with what is observed in cases 1 and 2. In terms of the streamline distribution, there are only two flow loops in the whole portion (including both the upper and lower parts) of the more permeable fractured zone and its surrounding porous rock. Consequently, the pore-fluid flow is upward in the whole portion (including both the upper and lower parts) of the more permeable fractured zone. This phenomenon is obviously different from what is observed in cases 1 and 2. In terms of the RAIp distribution, the mineralization enrichment region is in the whole portion (including both the upper and lower parts) of the more permeable fractured zone. This phenomenon is also different from what is observed in cases 1 and 2. Therefore, we can conclude that in the case of considering the compressional deformation regime, an ore-forming system with a bottom base layer of low permeability is a favorable environment for mineralization enrichment in the ore-forming system, while in the case of considering the extensional deformation regime, an ore-forming system with a top cover layer of low permeability is a favorable environment for mineralization enrichment in the ore-forming system.

5. Conclusions

Theoretical and computational studies of ore-forming mechanisms are very important for finding new and giant ore deposits within the upper crust of the Earth. Although there are many different ore-forming mechanisms, only the ore-forming mechanism associated with the compressional and extensional deformation regimes of the porous rock is investigated in this study. To conduct this investigation, a new computational simulation algorithm is proposed to solve the coupled rock deformation, porosity–permeability evolution and pore-fluid flow problem, which reflects the key processes when the rock deformation is the main driving force to control mineralization distributions in an ore-forming system. The novelty of the proposed computational simulation algorithm is to consider the porosity–permeability evolution process in space, which was often neglected in previous studies.
In order to ensure that the proposed computational simulation approach is able to produce accurate and reliable numerical solutions, a benchmark problem is constructed and mathematically solved to obtain the analytical solutions. By comparing the computational simulation result with the analytical solution of the benchmark problem, we can conclude that the proposed computational simulation approach is suitable and reliable for solving the coupled rock deformation, porosity–permeability evolution and pore-fluid flow problem associated with the ore-forming mechanism, particularly when the rock deformation is the main driving force to control mineralization distributions in an ore-forming system.
According to the computational simulation results of this study, the following conclusions can be made: (1) the consideration of porosity–permeability variations can have a significant impact on the computational simulation results of coupled rock deformation, porosity–permeability evolution and pore-fluid flow problems in fluid-saturated porous rocks; (2) different structural deformation regimes can have a significant effect on the mineralization enrichment distributions in ore-forming systems consisting of fluid-saturated porous rocks; (3) in the case of considering the compressional deformation regime, an ore-forming system with a bottom base layer of low permeability is a favorable environment for mineralization enrichment in the ore-forming system; and (4) in the case of considering the extensional deformation regime, an ore-forming system with a top cover layer of low permeability is a favorable environment for mineralization enrichment in the ore-forming system. This new finding has a scientific significance because it may be used to explain why the mineralization enrichment is focused in the permeable fractured zones or faults, which are located in the upper crust of the Earth.

Author Contributions

Conceptualization, C.Z. and Q.L.; methodology, C.Z. and Q.L.; software, C.Z. and Q.L.; validation, C.Z. and Q.L.; formal analysis, C.Z. and Q.L.; investigation, C.Z.; resources, C.Z.; data curation, C.Z.; writing—original draft preparation, C.Z. and Q.L.; visualization, C.Z.; supervision, C.Z.; funding acquisition, C.Z. All authors have read and agreed to the published version of the manuscript.

Funding

This work is financially supported by the National Natural Science Foundation of China (Grant Nos: 42030809 and 72088101).

Data Availability Statement

Not applicable.

Acknowledgments

This work is financially supported by the National Natural Science Foundation of China (Grant Nos: 42030809 and 72088101). The authors express sincere thanks to the anonymous referees for their valuable comments, which led to a significant improvement over an early version of the article.

Conflicts of Interest

The authors declare no conflict of interest.

References

  1. Zhao, C.; Hobbs, B.; Ord, A. Chemical dissolution-front instability associated with water-rock reactions in groundwater hydrology: Analyses of porosity-permeability relationship effects. J. Hydrol. 2016, 540, 1078–1087. [Google Scholar] [CrossRef]
  2. Zhao, C.; Schaubs, P.; Hobbs, B. Computational simulation of seepage instability problems in fluid-saturated porous rocks: Potential dynamic mechanisms for controlling mineralisation patterns. Ore Geol. Rev. 2016, 79, 180–188. [Google Scholar] [CrossRef]
  3. Zhao, C.-B.; Hobbs, B.; Ord, A. Effects of different numerical algorithms on simulation of chemical dissolution-front instability in fluid-saturated porous rocks. J. Cent. South Univ. 2018, 25, 1966–1975. [Google Scholar] [CrossRef]
  4. Liu, Y.; Dai, T.; Xia, S.; Tian, H. Computational simulation of iron ore-forming processes in the Caiyuanzi siderite ore district, Guizhou, China. J. Geochem. Explor. 2015, 158, 155–167. [Google Scholar] [CrossRef]
  5. Zou, Y.; Liu, Y.; Dai, T.; Mao, X.; Lei, Y.; Lai, J.; Tian, H. Finite difference modeling of metallogenic processes in the Hutouya Pb-Zn deposit, Qinghai, China: Implications for hydrothermal mineralization. Ore Geol. Rev. 2017, 91, 463–476. [Google Scholar] [CrossRef]
  6. Bear, J. Dynamics of Fluids in Porous Media; Elsevier: Amsterdam, The Netherlands, 1972. [Google Scholar]
  7. Phillips, O.M. Flow and Reactions in Permeable Rocks; Cambridge University Press: Cambridge, UK, 1991. [Google Scholar]
  8. Nield, D.A.; Bejan, A. Convection in Porous Media; Springer: New York, NY, USA, 1992. [Google Scholar]
  9. Zhao, C.; Hobbs, B.; Ord, A. A new alternative approach for investigating acidization dissolution front propagation in fluid-saturated carbonate rocks. Sci. China Technol. Sci. 2017, 60, 1197–1210. [Google Scholar] [CrossRef]
  10. Zhao, C.; Hobbs, B.; Ord, A. Transient-state instability analysis of dissolution-timescale reactive infiltration in fluid-saturated porous rocks: Purely mathematical approach. Sci. China Technol. Sci. 2019, 63, 319–328. [Google Scholar] [CrossRef]
  11. Zhao, C.; Hobbs, B.E.; Ord, A. Fundamentals of Computational Geoscience: Numerical Methods and Algorithms; Springer: Berlin/Heidelberg, Germany, 2009. [Google Scholar]
  12. Zhao, C.; Reid, L.B.; Regenauer-Lieb, K. Some fundamental issues in computational hydrodynamics of mineralization: A review. J. Geochem. Explor. 2012, 112, 21–34. [Google Scholar] [CrossRef]
  13. Hobbs, B.E.; Zhang, Y.H.; Ord, A.; Zhao, C. Application of coupled deformation, fluid flow, thermal and chemical modelling to predictive mineral exploration. J. Geochem. Explor. 2000, 69, 505–509. [Google Scholar] [CrossRef]
  14. Gow, P.; Upton, P.; Hill, K.; Zhao, C. Copper-Gold mineralization in the New Guinea: Numerical modeling of collision, fluid flow and intrusion-related hydrothermal system. Aust. J. Earth Sci. 2002, 49, 753–771. [Google Scholar] [CrossRef]
  15. Ord, A.; Hobbs, B.E.; Zhang, Y.; Broadbent, G.C.; Brown, M.; Willetts, G.; Sorjonen-Ward, P.; Walshe, J.L.; Zhao, C. Geodynamic modeling of the Century deposit, Mt Isa Province, Queensland. Aust. J. Earth Sci. 2002, 49, 1011–1039. [Google Scholar] [CrossRef]
  16. Schaubs, P.; Zhao, C. Numerical modelling of gold-deposit formation in the Bendigo-Ballarat zone, Victoria. Aust. J. Earth Sci. 2002, 49, 1077–1096. [Google Scholar] [CrossRef]
  17. Sorjonen-Ward, P.; Zhang, Y.; Zhao, C. Numerical modelling of orogenic processes and mineralization in the south eastern part of the Yilgarn Craton, Western Australia. Aust. J. Earth Sci. 2002, 49, 935–964. [Google Scholar] [CrossRef]
  18. Cox, S.F. Coupling between deformation, fluid pressures, and fluid flow in ore-producing hydrothermal systems at depth in the crust. Econ. Geol. 2005, 100, 39–75. [Google Scholar]
  19. Potma, W.; Roberts, P.A.; Schaubs, P.M.; Sheldon, H.A.; Zhang, Y.; Hobbs, B.E.; Ord, A. Predictive targeting in Australian orogenic-gold systems at the deposit to district scale using numerical modelling. Aust. J. Earth Sci. 2008, 55, 101–122. [Google Scholar] [CrossRef]
  20. Hu, F.F.; Fan, H.R.; Jiang, X.H.; Li, X.C.; Yang, K.F.; Mernagh, T. Fluid inclusions at different depths in the Sanshandao gold deposit, Jiaodong Peninsula, China. Geofluids 2013, 13, 528–541. [Google Scholar] [CrossRef]
  21. Gao, X.; Zhang, D.; Absai, V.; Feng, H.; Yi, J. Computational simulation of coupled geodynamics for forming the Makeng deposit in Fujian Province, China: Constraints of mechanics, thermotics and hydrology. J. Geochem. Explor. 2015, 160, 31–43. [Google Scholar] [CrossRef]
  22. Liu, Y.; Dai, T. Numerical modeling of pore-fluid flow and heat transfer in the Fushan iron ore district, Hebei, China: Implications for hydrothermal mineralization. J. Geochem. Explor. 2014, 144, 115–127. [Google Scholar] [CrossRef]
  23. Liu, X.; Xing, H.; Zhang, D. Influences of fluid properties on the hydrothermal fluid flow and alteration halos at the Dajishan tungsten deposit, China. J. Geochem. Explor. 2016, 163, 53–69. [Google Scholar] [CrossRef]
  24. Liu, Y.; Dai, T.; Qiu, L.; Xia, S. Three-dimensional numerical simulation of ore-forming processes of the Fushan skarn iron deposit in Handan-Xingtai ore cluster, North China: Implication for tectonic effects on skarn-iron mineralization. J. Geochem. Explor. 2016, 169, 144–156. [Google Scholar] [CrossRef]
  25. Liu, X.; Ma, Y.; Xing, H.; Zhang, D. Chemical responses to hydraulic fracturing and wolframite precipitation in the vein-type tungsten deposits of southern China. Ore Geol. Rev. 2018, 102, 44–58. [Google Scholar] [CrossRef]
  26. Yang, J.H.; Zhang, Z.; Peng, J.T.; Liu, L.; Leng, C.B. Metal source and wolframite precipitation process at the Xihuashan tungsten deposit, South China: Insights from mineralogy, fluid inclusion and stable isotope. Ore Geol. Rev. 2019, 111, 102965. [Google Scholar] [CrossRef]
  27. Zou, Y.-H.; Liu, Y.; Pan, Y.; Yang, K.-D.; Dai, T.-G.; Mao, X.-C.; Lai, J.-Q.; Tian, H.-L. Numerical simulation of hydrothermal mineralization associated with simplified chemical reactions in Kaerqueka polymetallic deposit, Qinghai, China. Trans. Nonferrous Met. Soc. China 2019, 29, 165–177. [Google Scholar] [CrossRef]
  28. Ju, M.; Zhao, C.; Dai, T.; Yang, J. Finite element modeling of pore-fluid flow in the Dachang ore district, Guangxi, China: Implications for hydrothermal mineralization. Geosci. Front. 2011, 2, 463–474. [Google Scholar] [CrossRef]
  29. Zhao, C.; Lin, G.; Hobbs, B.; Wang, Y.; Mühlhaus, H.; Ord, A. Finite element modelling of reactive fluids mixing and mineralization in pore-fluid saturated hydrothermal/sedimentary basins. Eng. Comput. 2002, 19, 364–387. [Google Scholar] [CrossRef]
  30. Zhao, C.; Hobbs, B.E.; Ord, A. Convective and Advective Heat Transfer in Geological Systems; Springer: Berlin/Heidelberg, Germany, 2008. [Google Scholar]
  31. Chadam, J.; Hoff, D.; Merino, E.; Ortoleva, P.; Sen, A. Reactive Infiltration Instabilities. IMA J. Appl. Math. 1986, 36, 207–221. [Google Scholar] [CrossRef]
  32. Chen, J.-S.; Liu, C.-W. Numerical simulation of the evolution of aquifer porosity and species concentrations during reactive transport. Comput. Geosci. 2002, 28, 485–499. [Google Scholar] [CrossRef]
  33. Chen, J.-S.; Liu, C.-W. Interaction of reactive fronts during transport in a homogeneous porous medium with initial small non-uniformity. J. Contam. Hydrol. 2004, 72, 47–66. [Google Scholar] [CrossRef]
  34. Chen, J.-S.; Liu, C.-W.; Lai, G.-X.; Ni, C.-F. Effects of mechanical dispersion on the morphological evolution of a chemical dissolution front in a fluid-saturated porous medium. J. Hydrol. 2009, 373, 96–102. [Google Scholar] [CrossRef]
  35. Zhao, C.; Hobbs, B.E.; Hornby, P.; Ord, A.; Peng, S.; Liu, L. Theoretical and numerical analyses of chemical-dissolution front instability in fluid-saturated porous rocks. Int. J. Numer. Anal. Method. Géoméch. 2007, 32, 1107–1130. [Google Scholar] [CrossRef]
  36. Zhao, C.; Hobbs, B.E.; Ord, A.; Peng, S. Effects of Mineral Dissolution Ratios on Chemical-Dissolution Front Instability in Fluid-Saturated Porous Media. Transp. Porous Media 2009, 82, 317–335. [Google Scholar] [CrossRef]
  37. Lai, K.-H.; Chen, J.-S.; Liu, C.-W.; Hsu, S.-Y.; Steefel, C. Effect of medium permeability anisotropy on the morphological evolution of two non-uniformities in a geochemical dissolution system. J. Hydrol. 2015, 533, 224–233. [Google Scholar] [CrossRef]
  38. Itasca Consulting Group. Fast Lagrangian Analysis of Continua (FLAC); Itasca Consulting Group, Inc.: Minneapolis, MN, USA, 1995. [Google Scholar]
  39. Carman, P.C. Flow of Gases through Porous Media; Academic Press: New York, NY, USA, 1956. [Google Scholar]
  40. Zienkiewicz, O.C. The Finite Element Method; McGraw-Hill: London, UK, 1977. [Google Scholar]
  41. Lewis, R.W.; Schrefler, B.A. The Finite Element Method in the Static and Dynamic Deformation and Consolidation of Porous Media; John Wiley and Sons: New York, NY, USA, 1998. [Google Scholar]
  42. Zhao, C.; Hobbs, B.; Ord, A. Near-field performance of chemical dissolution-front instability around a circular acid-injection-well in fluid-saturated porous media. Sci. China Technol. Sci. 2023, 66, 1–11. [Google Scholar] [CrossRef]
  43. Terzaghi, K. Theoretical Soil Mechanics; John Wiley and Sons: New York, NY, USA, 1943. [Google Scholar]
  44. Carslaw, H.S.; Jaeger, J.C. Conduction of Heat in Solids; Clarendon Press: Oxford, UK, 1959. [Google Scholar]
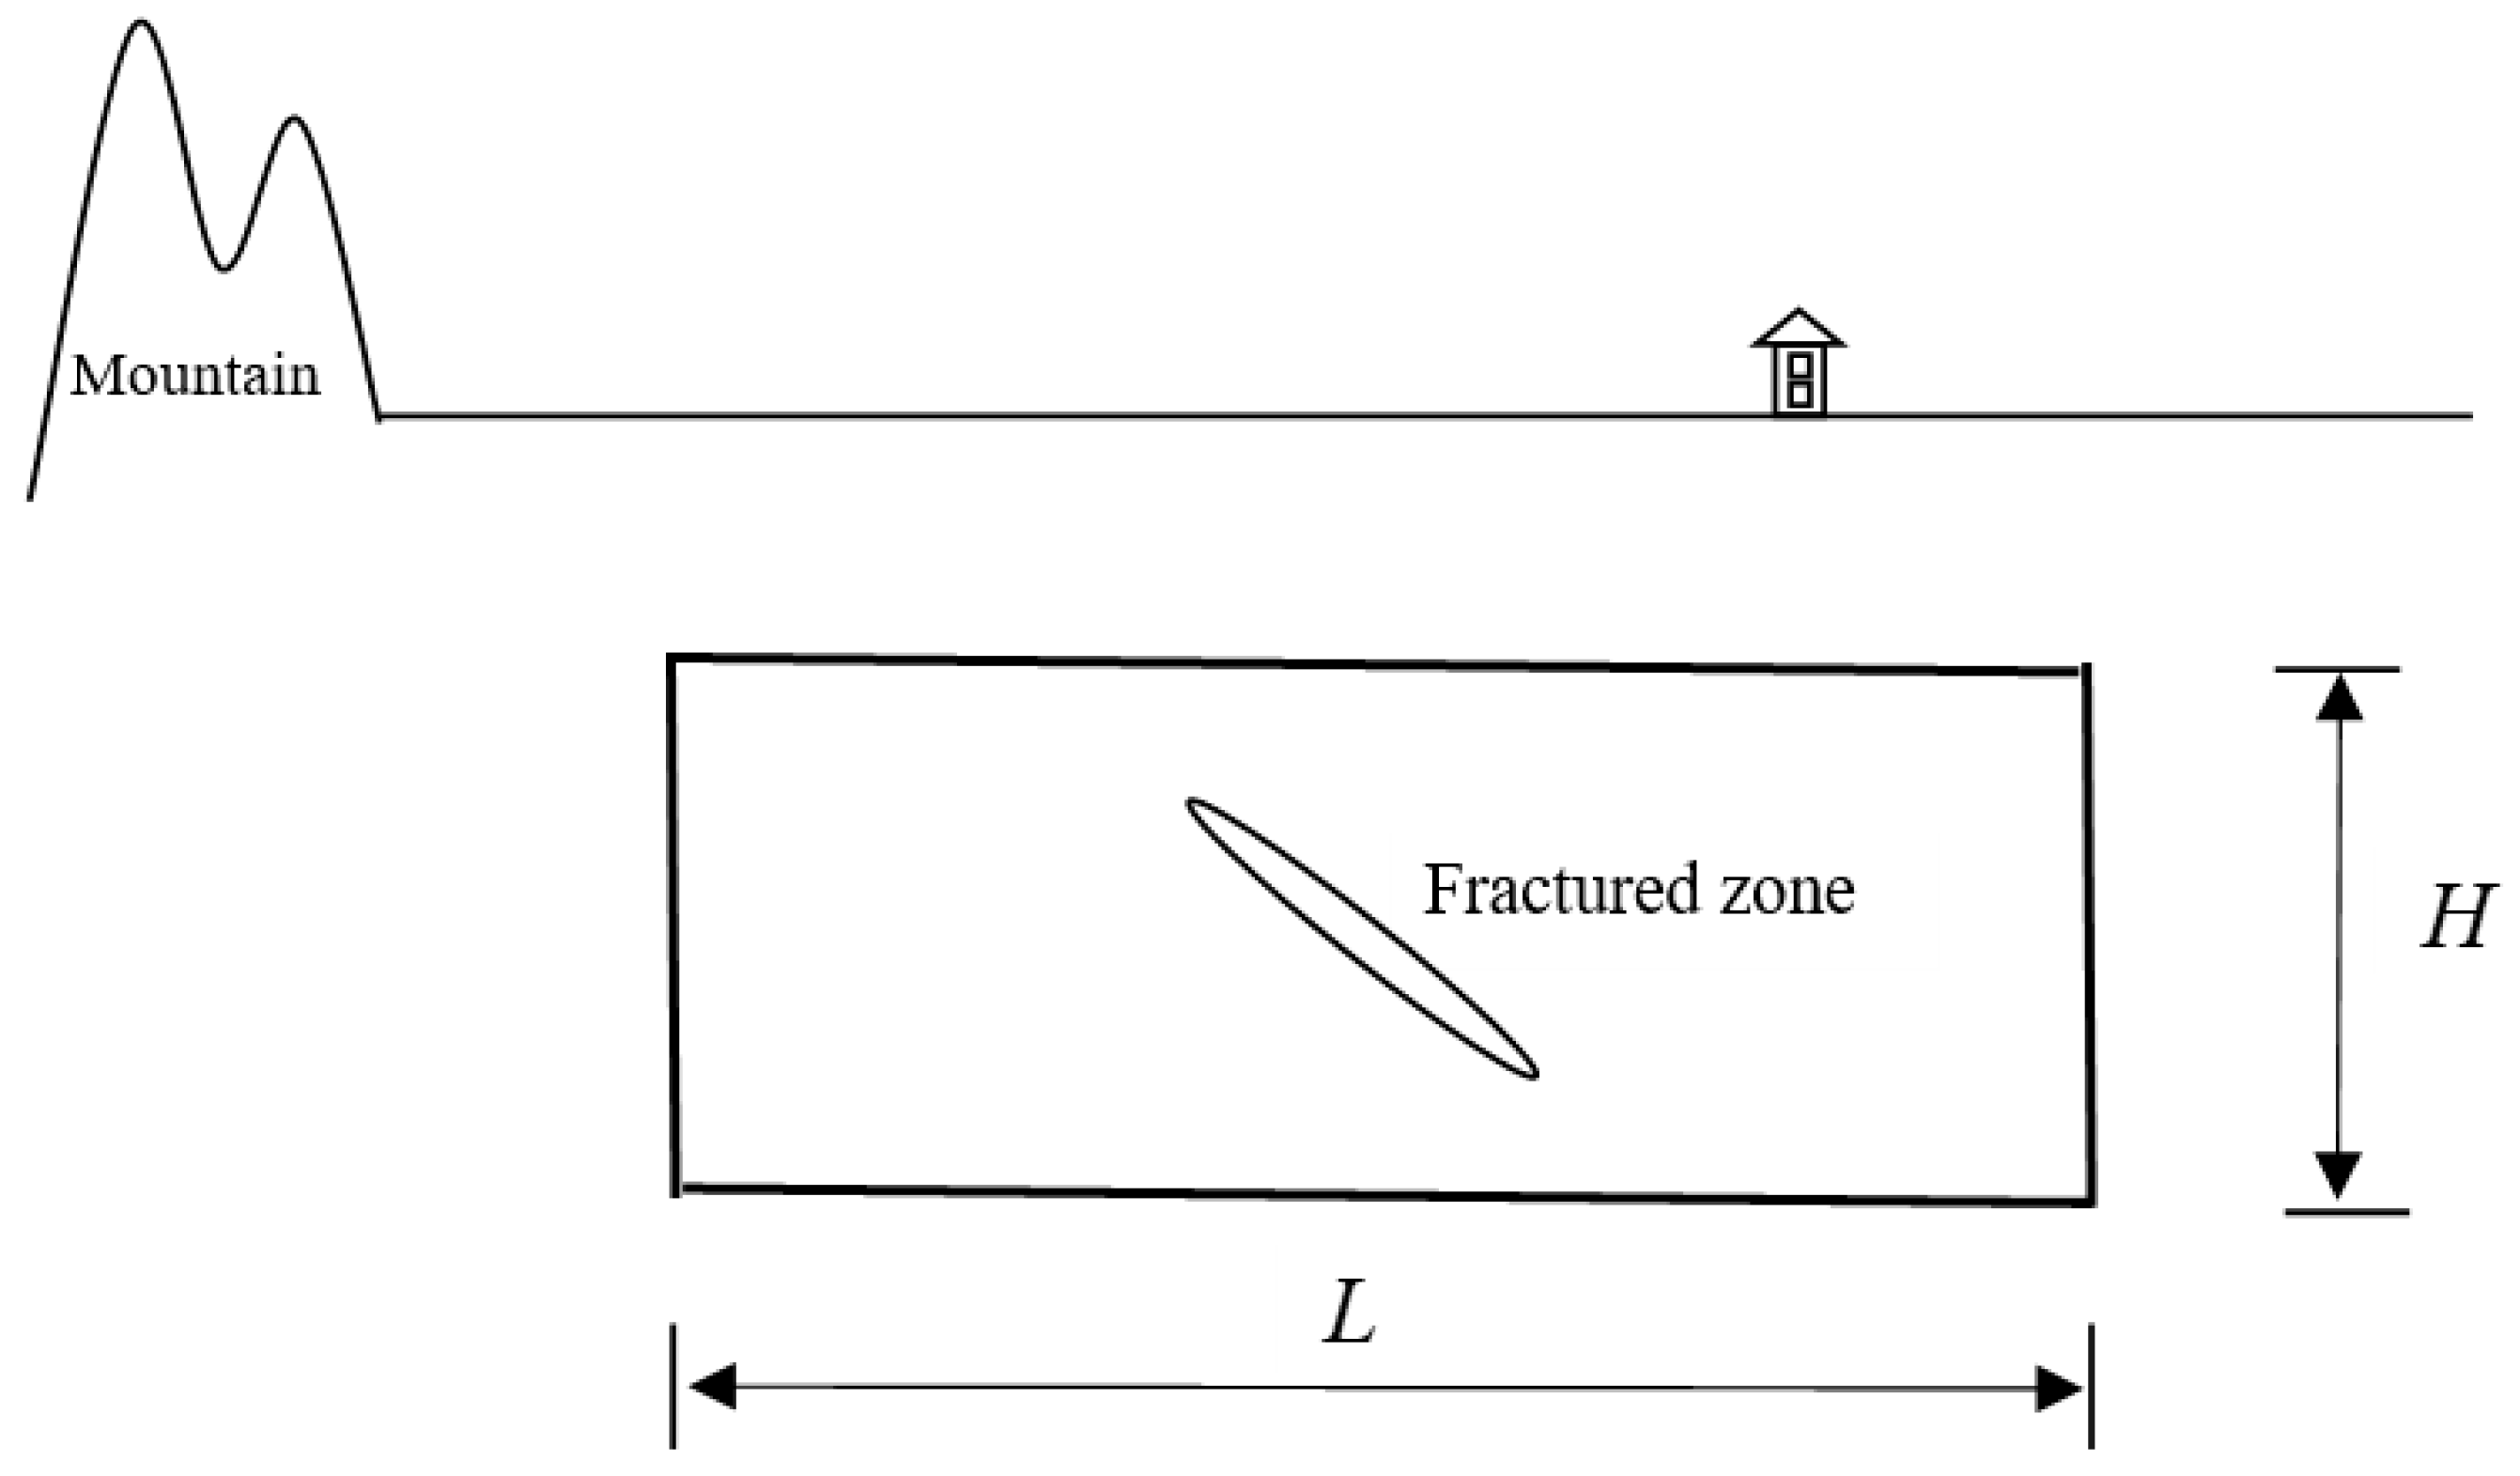
Figure 1. The generic model representing a portion of the porous rock within the upper crust of the Earth.
Minerals 13 00664 g001
Figure 2. Geometry of the benchmark problem for the coupled rock deformation and pore-fluid flow problem.
Minerals 13 00664 g002
Figure 3. Geometry of the computational simulation model for simulating the benchmark problem.
Minerals 13 00664 g003
Figure 4. Comparison of the excess pore-fluid pressure distributions in the benchmark problem.
Minerals 13 00664 g004
Figure 5. Effect of porosity–permeability evolution on the excess pore-fluid pressure distributions in the computational domain of the benchmark problem.
Minerals 13 00664 g005
Figure 6. Geometry of the computational simulation model for solving the coupled rock deformation, porosity–permeability evolution and pore-fluid flow problem in fluid-saturated porous rocks.
Minerals 13 00664 g006
Figure 7. Effects of compressional and extensional deformation regimes on the mineralization distributions (t = 4.0 × 10⁵ s).
Minerals 13 00664 g007
Figure 8. Effects of compressional and extensional deformation regimes on the mineralization distributions (t = 8.0 × 10⁵ s).
Minerals 13 00664 g008
Figure 9. Effects of top and bottom boundary conditions on the mineralization distributions (t = 1.6 × 10⁶ s).
Minerals 13 00664 g009
Figure 10. Effects of top and bottom boundary conditions on the mineralization distributions (t = 3.2 × 10⁶ s).
Minerals 13 00664 g010
Disclaimer/Publisher’s Note: The statements, opinions and data contained in all publications are solely those of the individual author(s) and contributor(s) and not of MDPI and/or the editor(s). MDPI and/or the editor(s) disclaim responsibility for any injury to people or property resulting from any ideas, methods, instructions or products referred to in the content.