Using Large-Size Three-Dimensional Marine Electromagnetic Data for the Efficient Combined Investigation of Natural Hydrogen and Hydrocarbon Gas Reservoirs: A Geologically Consistent and Process-Oriented Approach with Implications for Carbon Footprint Reduction
Abstract
:1. Introduction: Challenges and Conceptual Models
1.1. Net-Zero Emissions and Geological Complexity Challenges
1.2. Conceptual Models for Electromagnetic Investigation of Hydrocarbon and Hydrogen Reservoirs
1.3. Adaptive Play-Based Exploration Workflow for Combined Investigations of Hydrocarbon and Hydrogen Reservoirs
2. Quantitative Methodological Developments
2.1. Geologically Consistent CSEM Multi-Attribute Analysis: Effective Prior Settings for Optimized 3D Inversion
- DRI attribute shows the existence of a regional resistive play or carrier bed (characterized by symmetric in-tow and out-tow response profiles) and the desirable localized 3D resistors (characterized by asymmetric in-tow and out-tow response profiles). This meets the geological requirement for identifying the presence of reservoirs (regional plays or localized traps of exploration interest) in frontier regions. This attribute facilitates the rapid screening of CSEM data to select areas warranting follow-up, expensive, and rigorous 3D inversion, leading to significant efficiency gains and computational cost savings [1]. It is best used for the rapid polarization (ranking) of a portfolio of leads and prospects in offshore regions where there are competing targets previously identified using seismic data [1,34,35];
- The effective area or size of a hydrocarbon-charged 3D reservoir is a key requirement in reserve estimation [19]. EDA permits the accurate determination of the exact lateral boundaries of 3D resistive targets and, hence, the effective area necessary for reserve estimation;
- The ESR attribute provides a link to geochemical seabed data, and together these permit a judgment regarding the presence of a working petroleum system (i.e., presence of charge). The ESR profiles sample the near-surface area (top 10–50 m of the seabed based on skin-depth considerations) and should ideally correlate with seabed geochemistry profiles or seismic shallow gas clouds and, thus, provide a basis for comparing or integrating these disparate datasets to confirm the presence of a working petroleum system [1];
- The results from the analyses of these attributes make up the initial model m0 (i.e., robust model priors) for the subsequent tailored 3D-depth imaging of targeted reservoirs [1].
2.2. Geologically Consistent 3D Anisotropic Resistivity Inversion: Robust Depth Conversion
2.3. Electrostratigraphic Imaging: Accurate Post-Inversion Reservoir Boundary Mapping
2.4. Structurally Consistent 4D Time-Lapse Electromagnetic Imaging: Robust Fluid Tracking
- Risk mitigation in frontier ventures with no wells or good quality seismic data;
- Reduces the need to drill unnecessary wells, leading to significant cost savings;
- Potential to reduce prospect evaluation/maturation period;
- Maximize accuracy and reduce uncertainty, especially with regard to reservoir properties;
- Applying such a quantitatively integrated methodology can contribute significantly to a better understanding of the geological controls of the transport and distribution of fluids in clean-energy (especially geothermal and hydrogen) reservoirs, leading to improved resource mapping and monitoring, and hence, a technology that could play a critical role in helping the world meet the net-zero emissions target.
3. Instructive, Process-Oriented Case Studies
3.1. Play-Based Exploration in Deep Water in NW Borneo
3.1.1. Find the Right Basin and Play
3.1.2. Select the Right Block and Prospects
- The main plays in the blocks were clearly mapped based on their resistivity and anisotropy characteristics, as illustrated in Figure 8c,e–g. The 1–3 km thick conductive overburden (potential cap rock), resistive units (potential reservoirs in the turbidite fans), thick conductive underburden (possible source rock and shale detachment zone, as shown in Figure 8f) forming the post-rift play and rifted resistive basement with possible syn-rift play are evident;
- Structural compartmentalization is present in both the dip and strike directions (Figure 8c,e,g), which suggests the presence of different thrust wedges that are possibly separated by transfer faults, allowing relative block motions, with each compartment associated with a different prospectivity;
- The relatively rugged seabed topography suggests a recent deformational event and is structurally related to the geometry of the detachment zones in the upper 5 km in the resistivity anisotropy model (Figure 8f). The consistency between seafloor deformation and subsurface resistivity anisotropy suggests the active deformation of the sedimentary pile above the basement [11];
- The structure with the highest seabed expression is underlain by a steep southerly dipping basement edge, forming a buttress against which the transported sediments appear to have deformed considerably; this suggests a significant risk to any hydrocarbon accumulation; hence, the preferred sweet spot is the less disturbed fold structure properly centered on the basement high, which will focus hydrocarbon migration;
- The resistivity model is geologically consistent with seismic structure (Figure 8d), assuring confidence in the above interpretations and allowing the selection of the prospective play segments, dubbed “sweet spots” (Figure 8c,e), warranting further detailed integrated geological and geophysical analysis.
3.1.3. Drill the Right Well
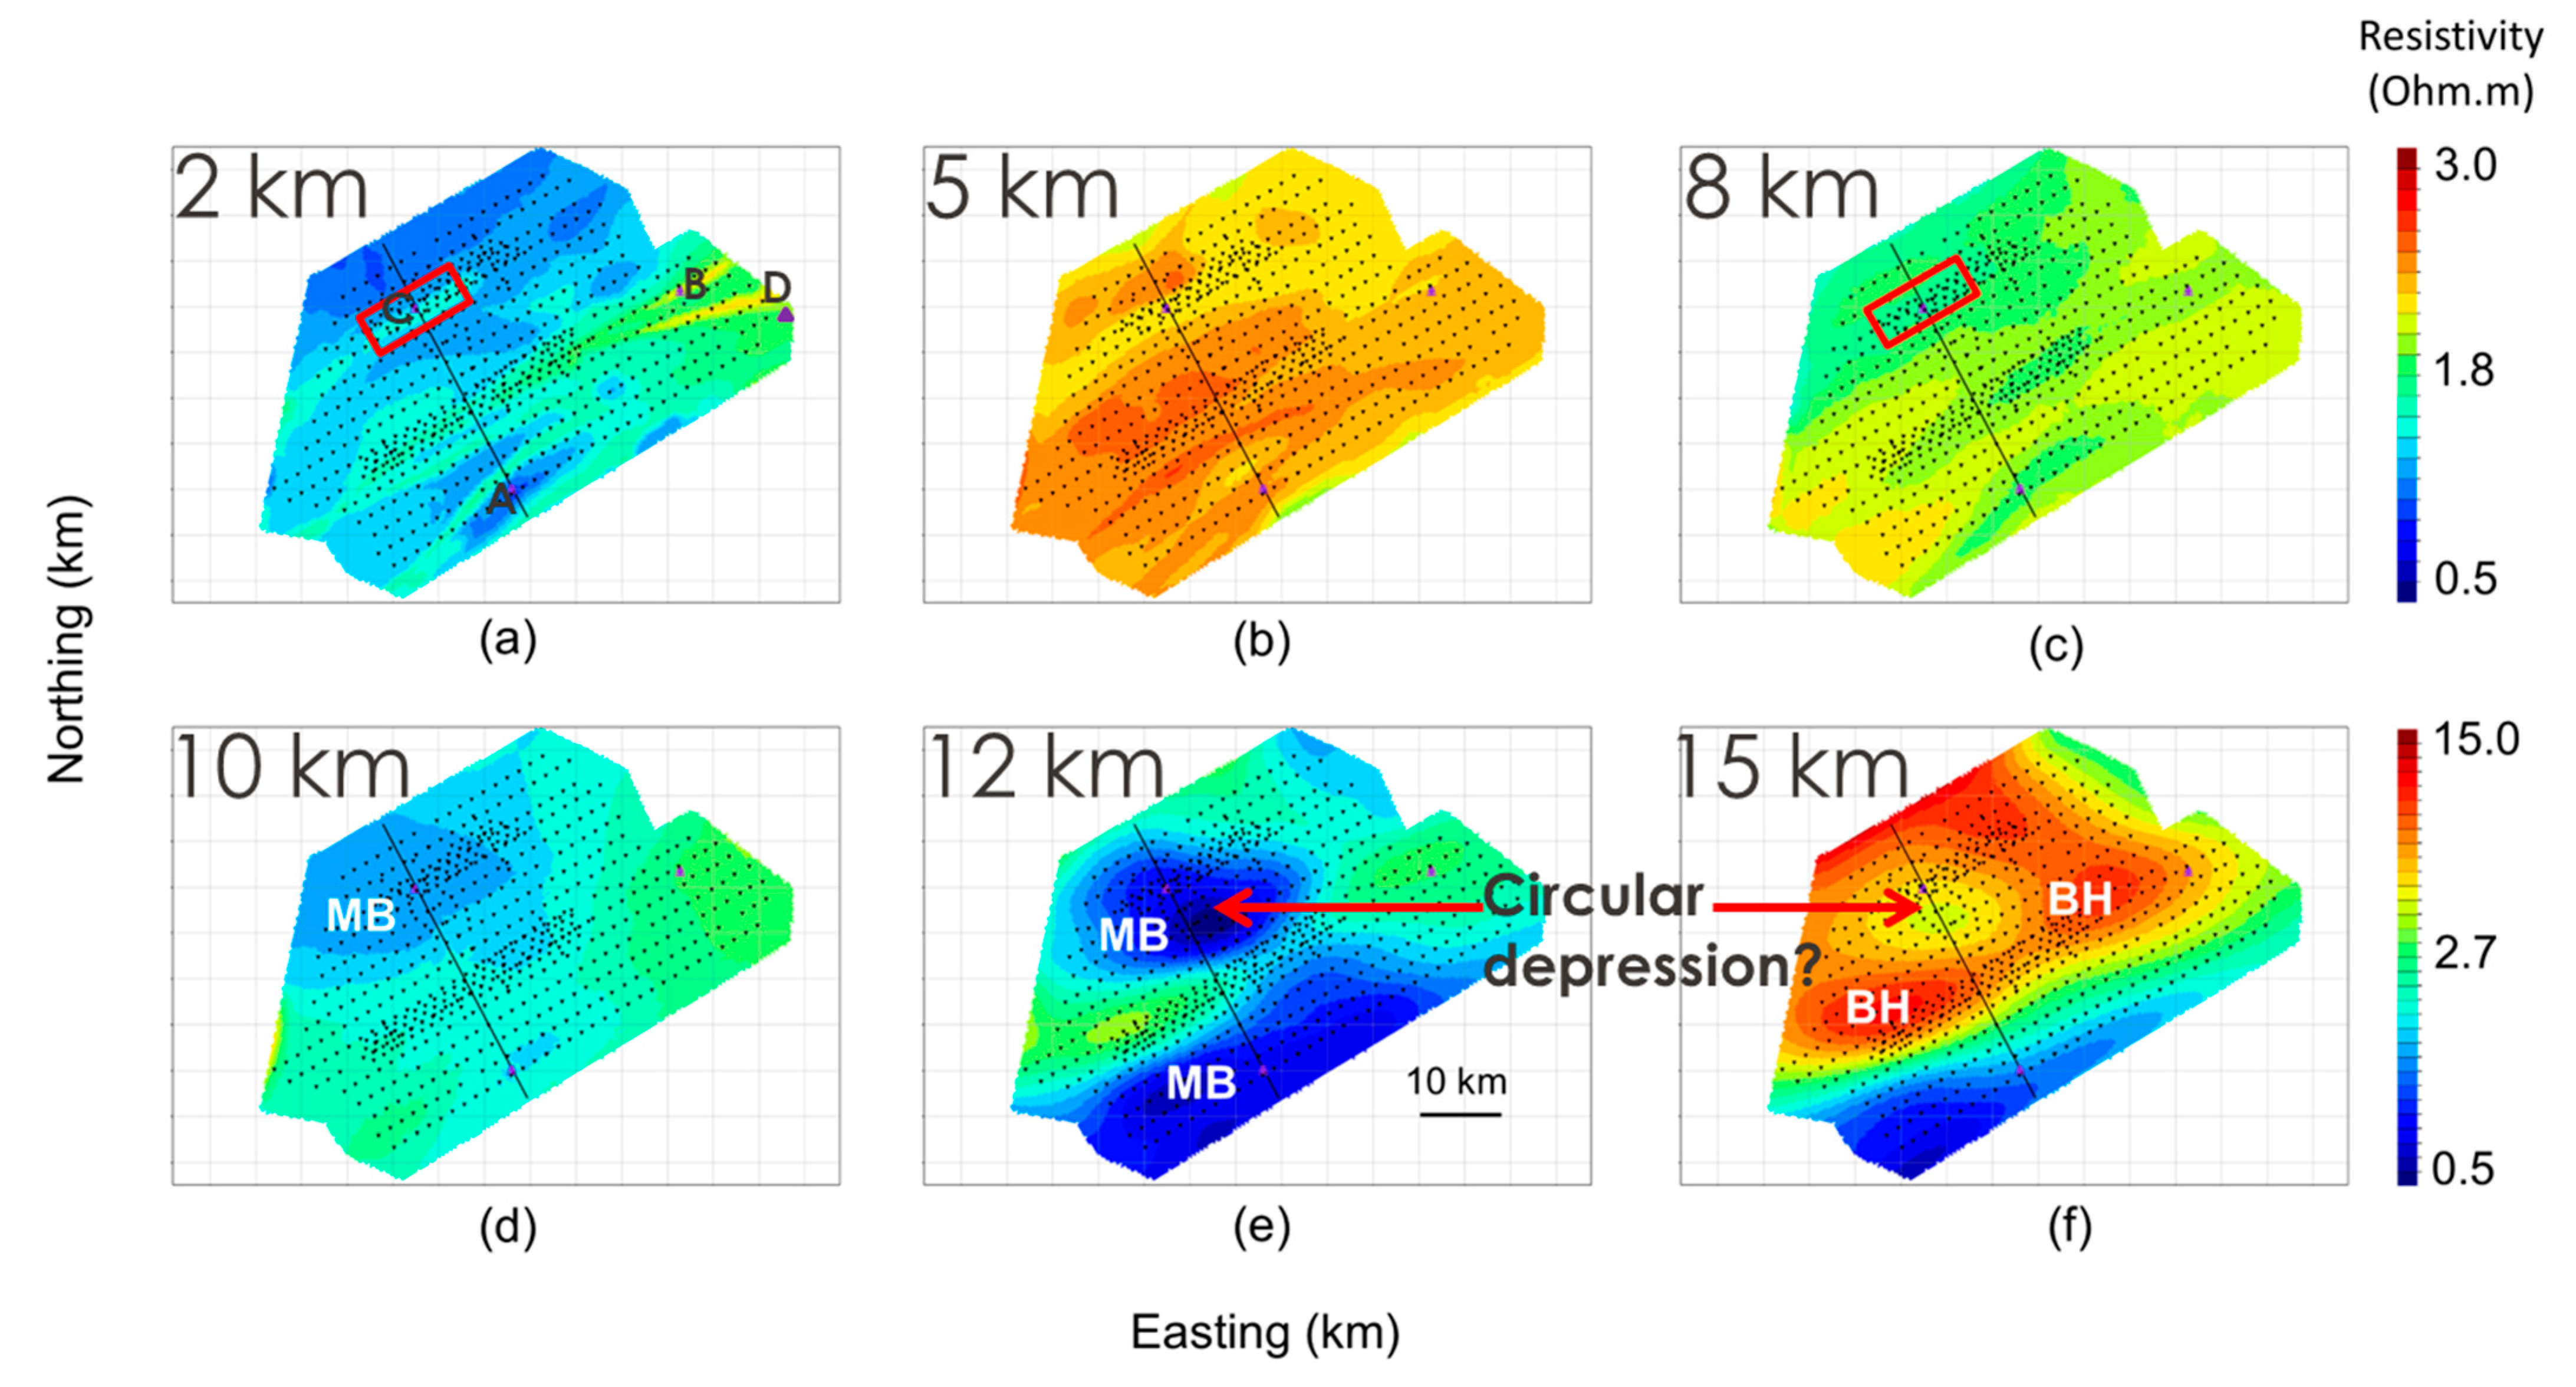
- The horizontal or seismic horizon-controlled resistivity slices, extracted at different depths from the 3D horizontal resistivity model, revealed how the basement structure influenced basin evolution (the vertical resistivity model could also be used for this);
- The presence of a circular depression beneath the sedimentary cover. A localized circular mini basin can be seen in the 15, 12, and 10 km depth slices (possibly a mini foreland basin due to flexural response to loading and/or igneous intrusion). This is overlain by a clastic play comprised of resistive (sandy or carbonate-bearing reservoir rocks) and conductive (shaley source and/or cap rocks) materials, as revealed by the horizontal resistivity slices at 8, 5, and 2 km depths. Pockmarks were observed on the seabed in this locality. Well C (Figure 9a) was drilled in 2016 and encountered hydrocarbons at the predicted reservoir. Unfortunately, the measurement of hydrogen gas was not considered at the time;
- Could this circular basin be a hydrogen prospect? The observed pockmarks suggest the presence of chemosynthetic communities, analogous to what is observed across ‘fairy circles’ on land, characterized by seepages of native hydrogen. It will be interesting to survey this area for native reservoir hydrogen in a future effort to help reduce the carbon footprint. A seafloor 3D self-potential survey and geochemical soil gas sampling for H2, CO2, CH4, and radon, followed by the appropriate gas sampling in the wells, will be the recommended way forward here.
3.1.4. Pick and Monitor the Right Reservoir
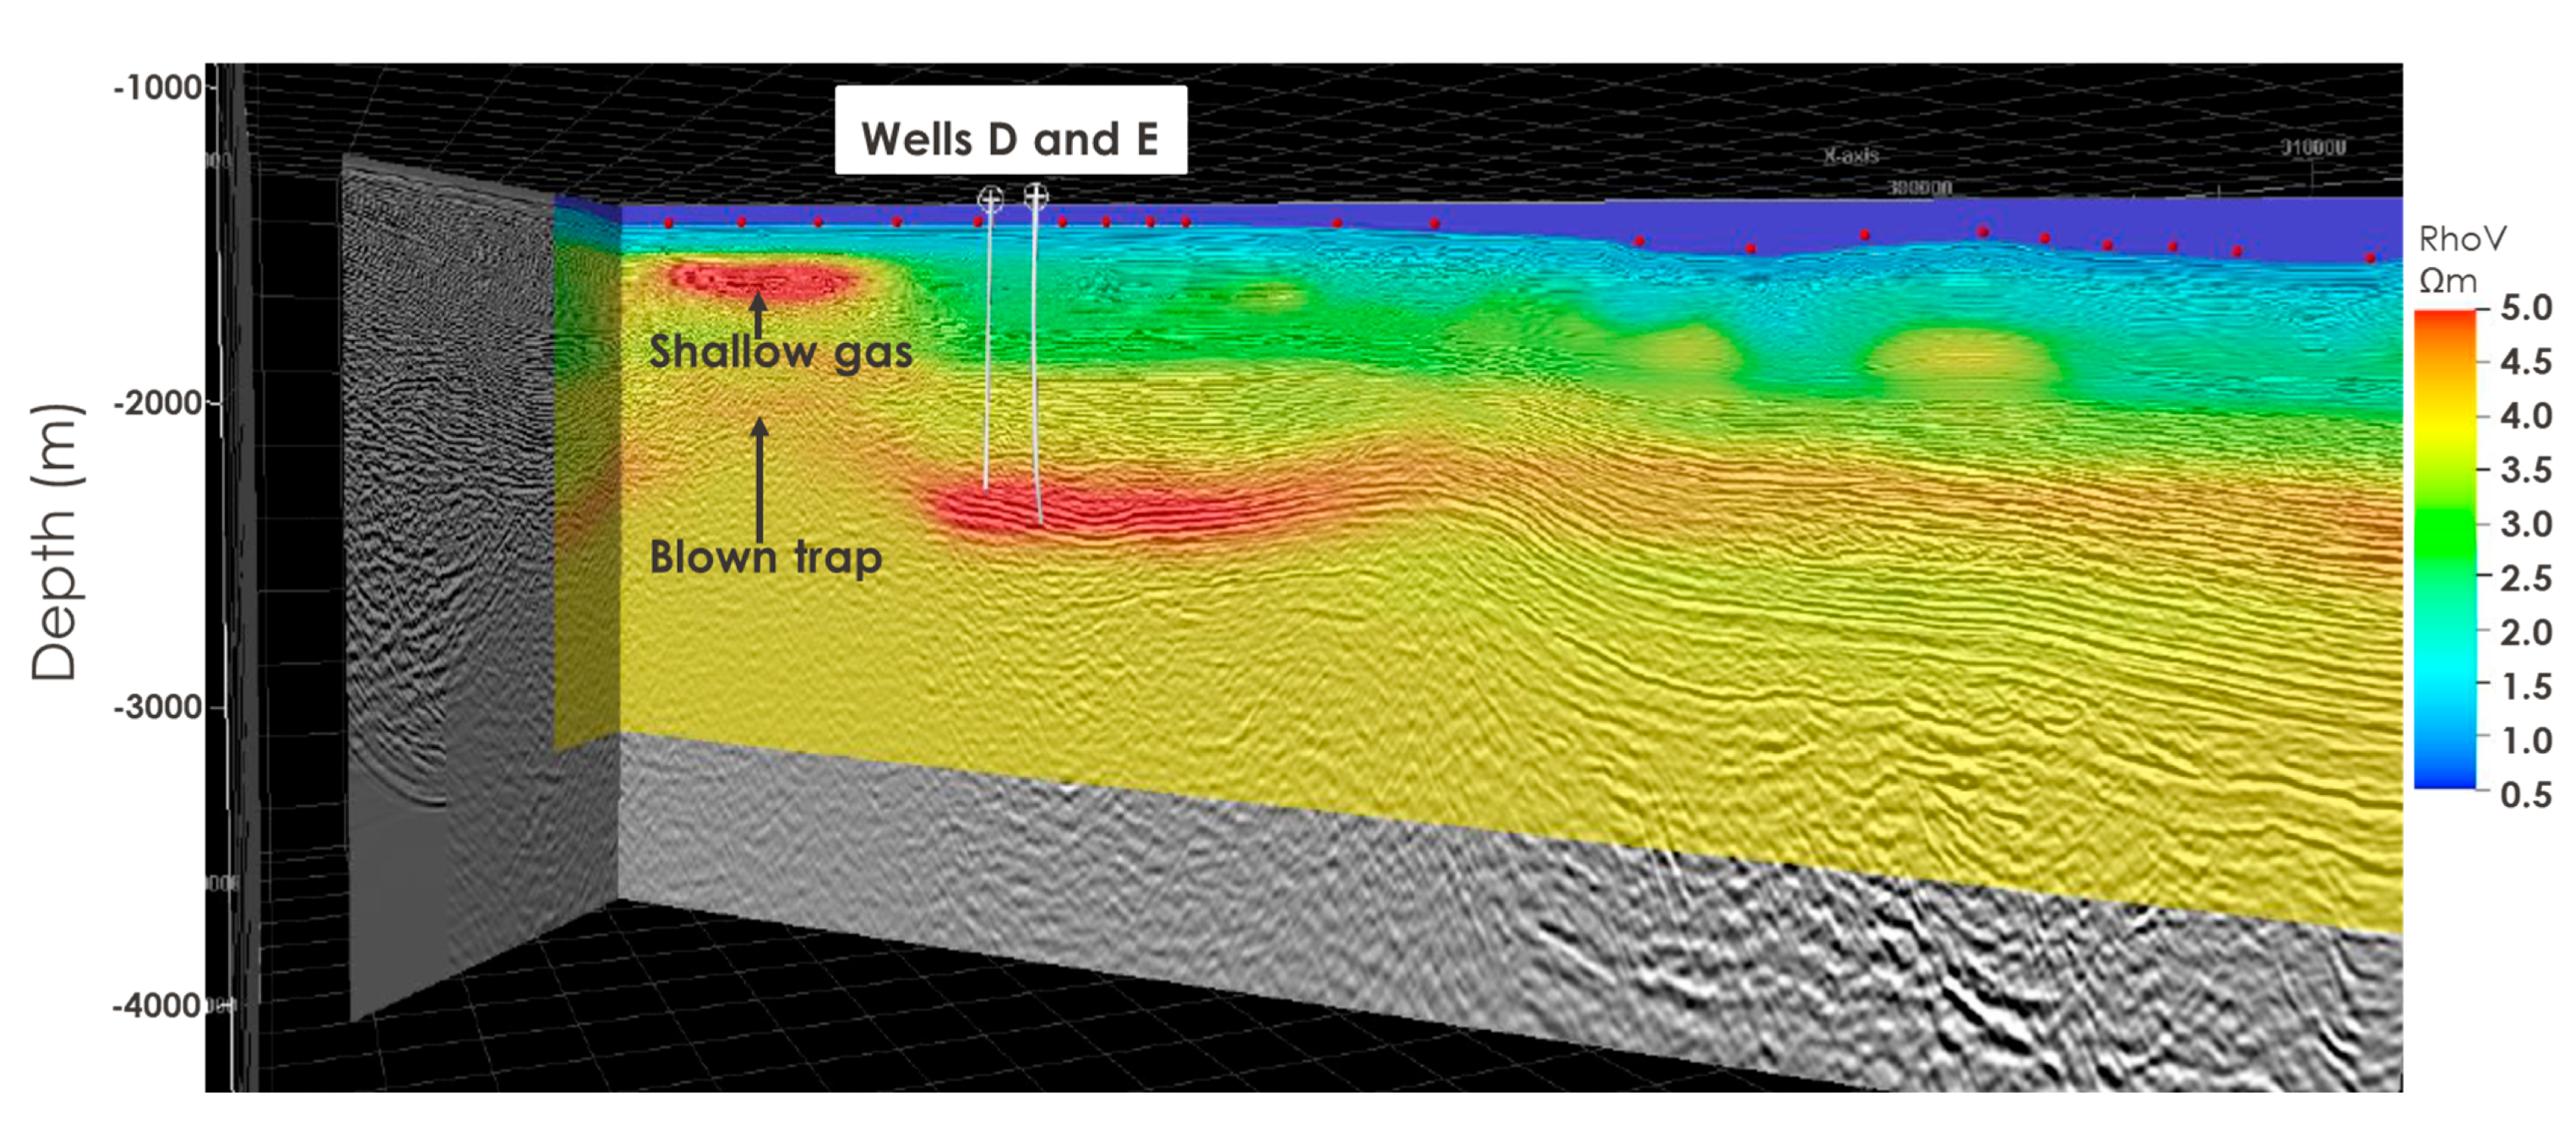
- Two wells sampled hydrocarbon at a depth correctly predicted by the 3D CSEM inversion (Wells D and E in Figure 10). So, this technology is useful for detecting and mapping potential hydrocarbon-charged reservoirs in this geologic setting;
- Note the strong presence of shallow resistive gas (evidence of a working petroleum system). A future 3D SP survey will be useful for assessing the gas flow pattern here;
- There is no major resistive cover at the crest of the anticlinal structure below this resistive shallow gas zone. This suggests that it is likely a blown trap allowing hydrocarbons to migrate vertically upward to form the observed shallow gas body. Parts of this reservoir may, therefore, be sub-optimal for future CO2 storage.
3.2. Understanding Deep Geologic Controls on the Genesis and Distribution of Hydrogen in the Investigated Area
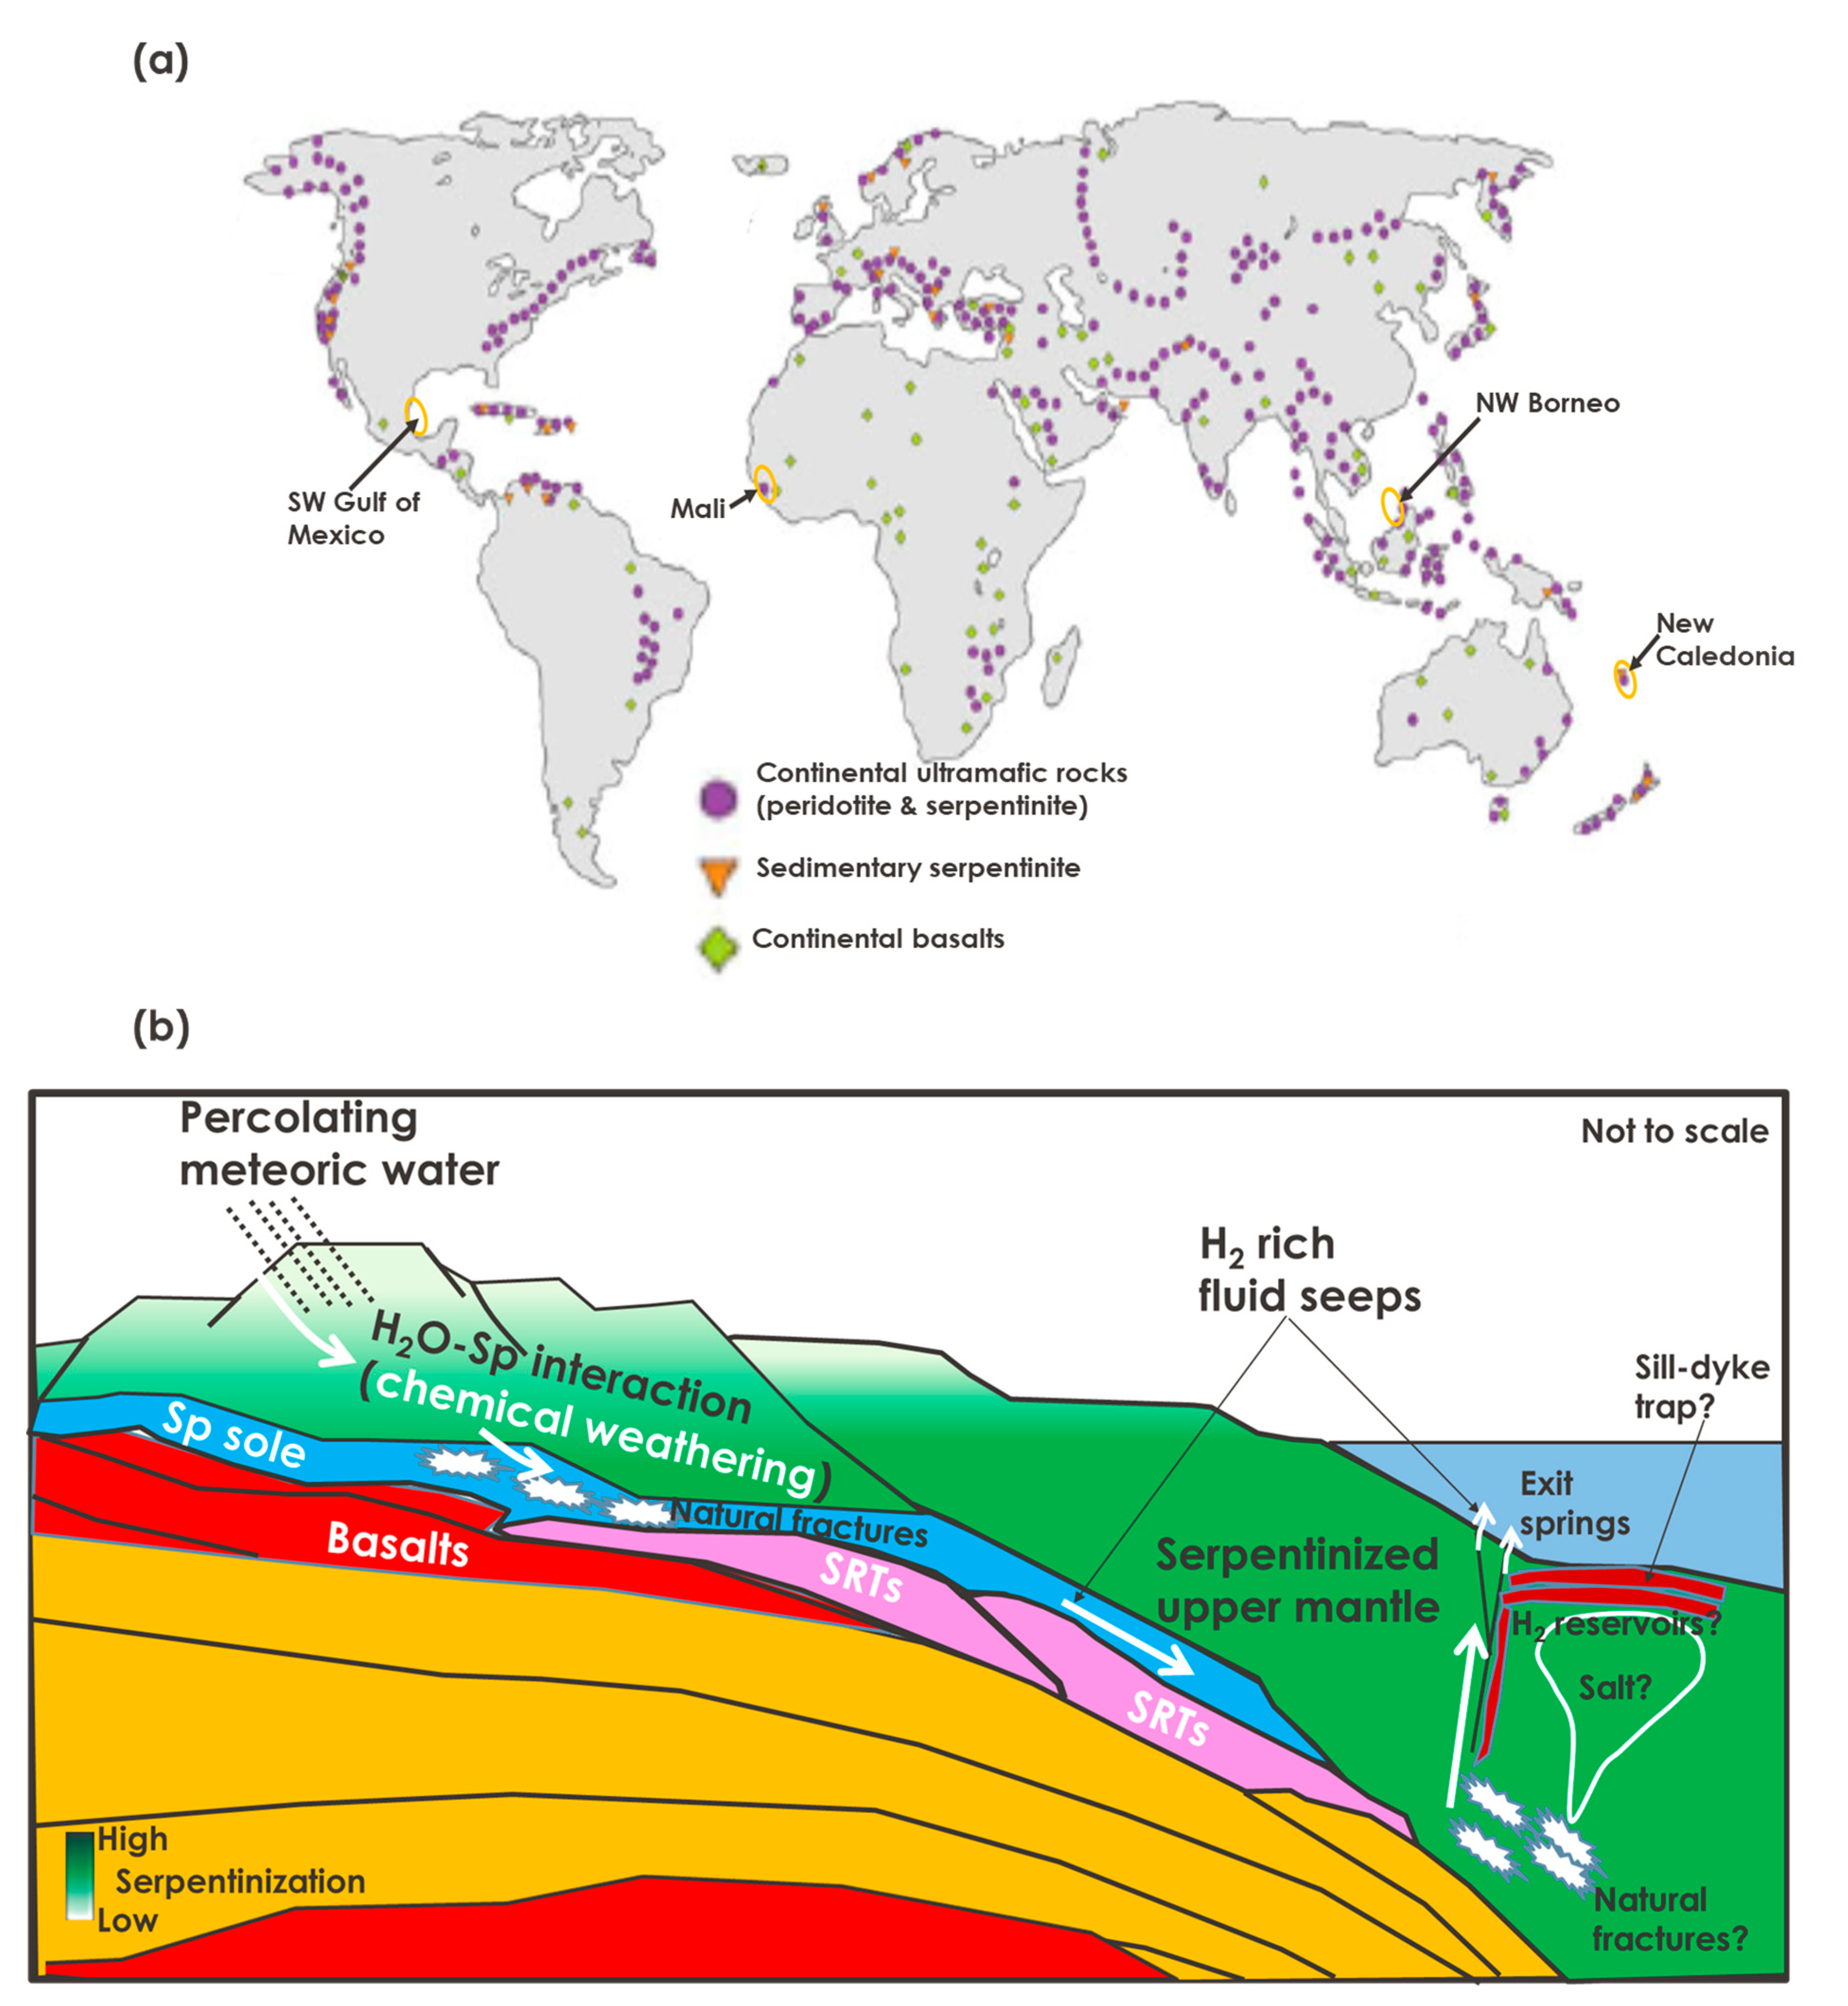
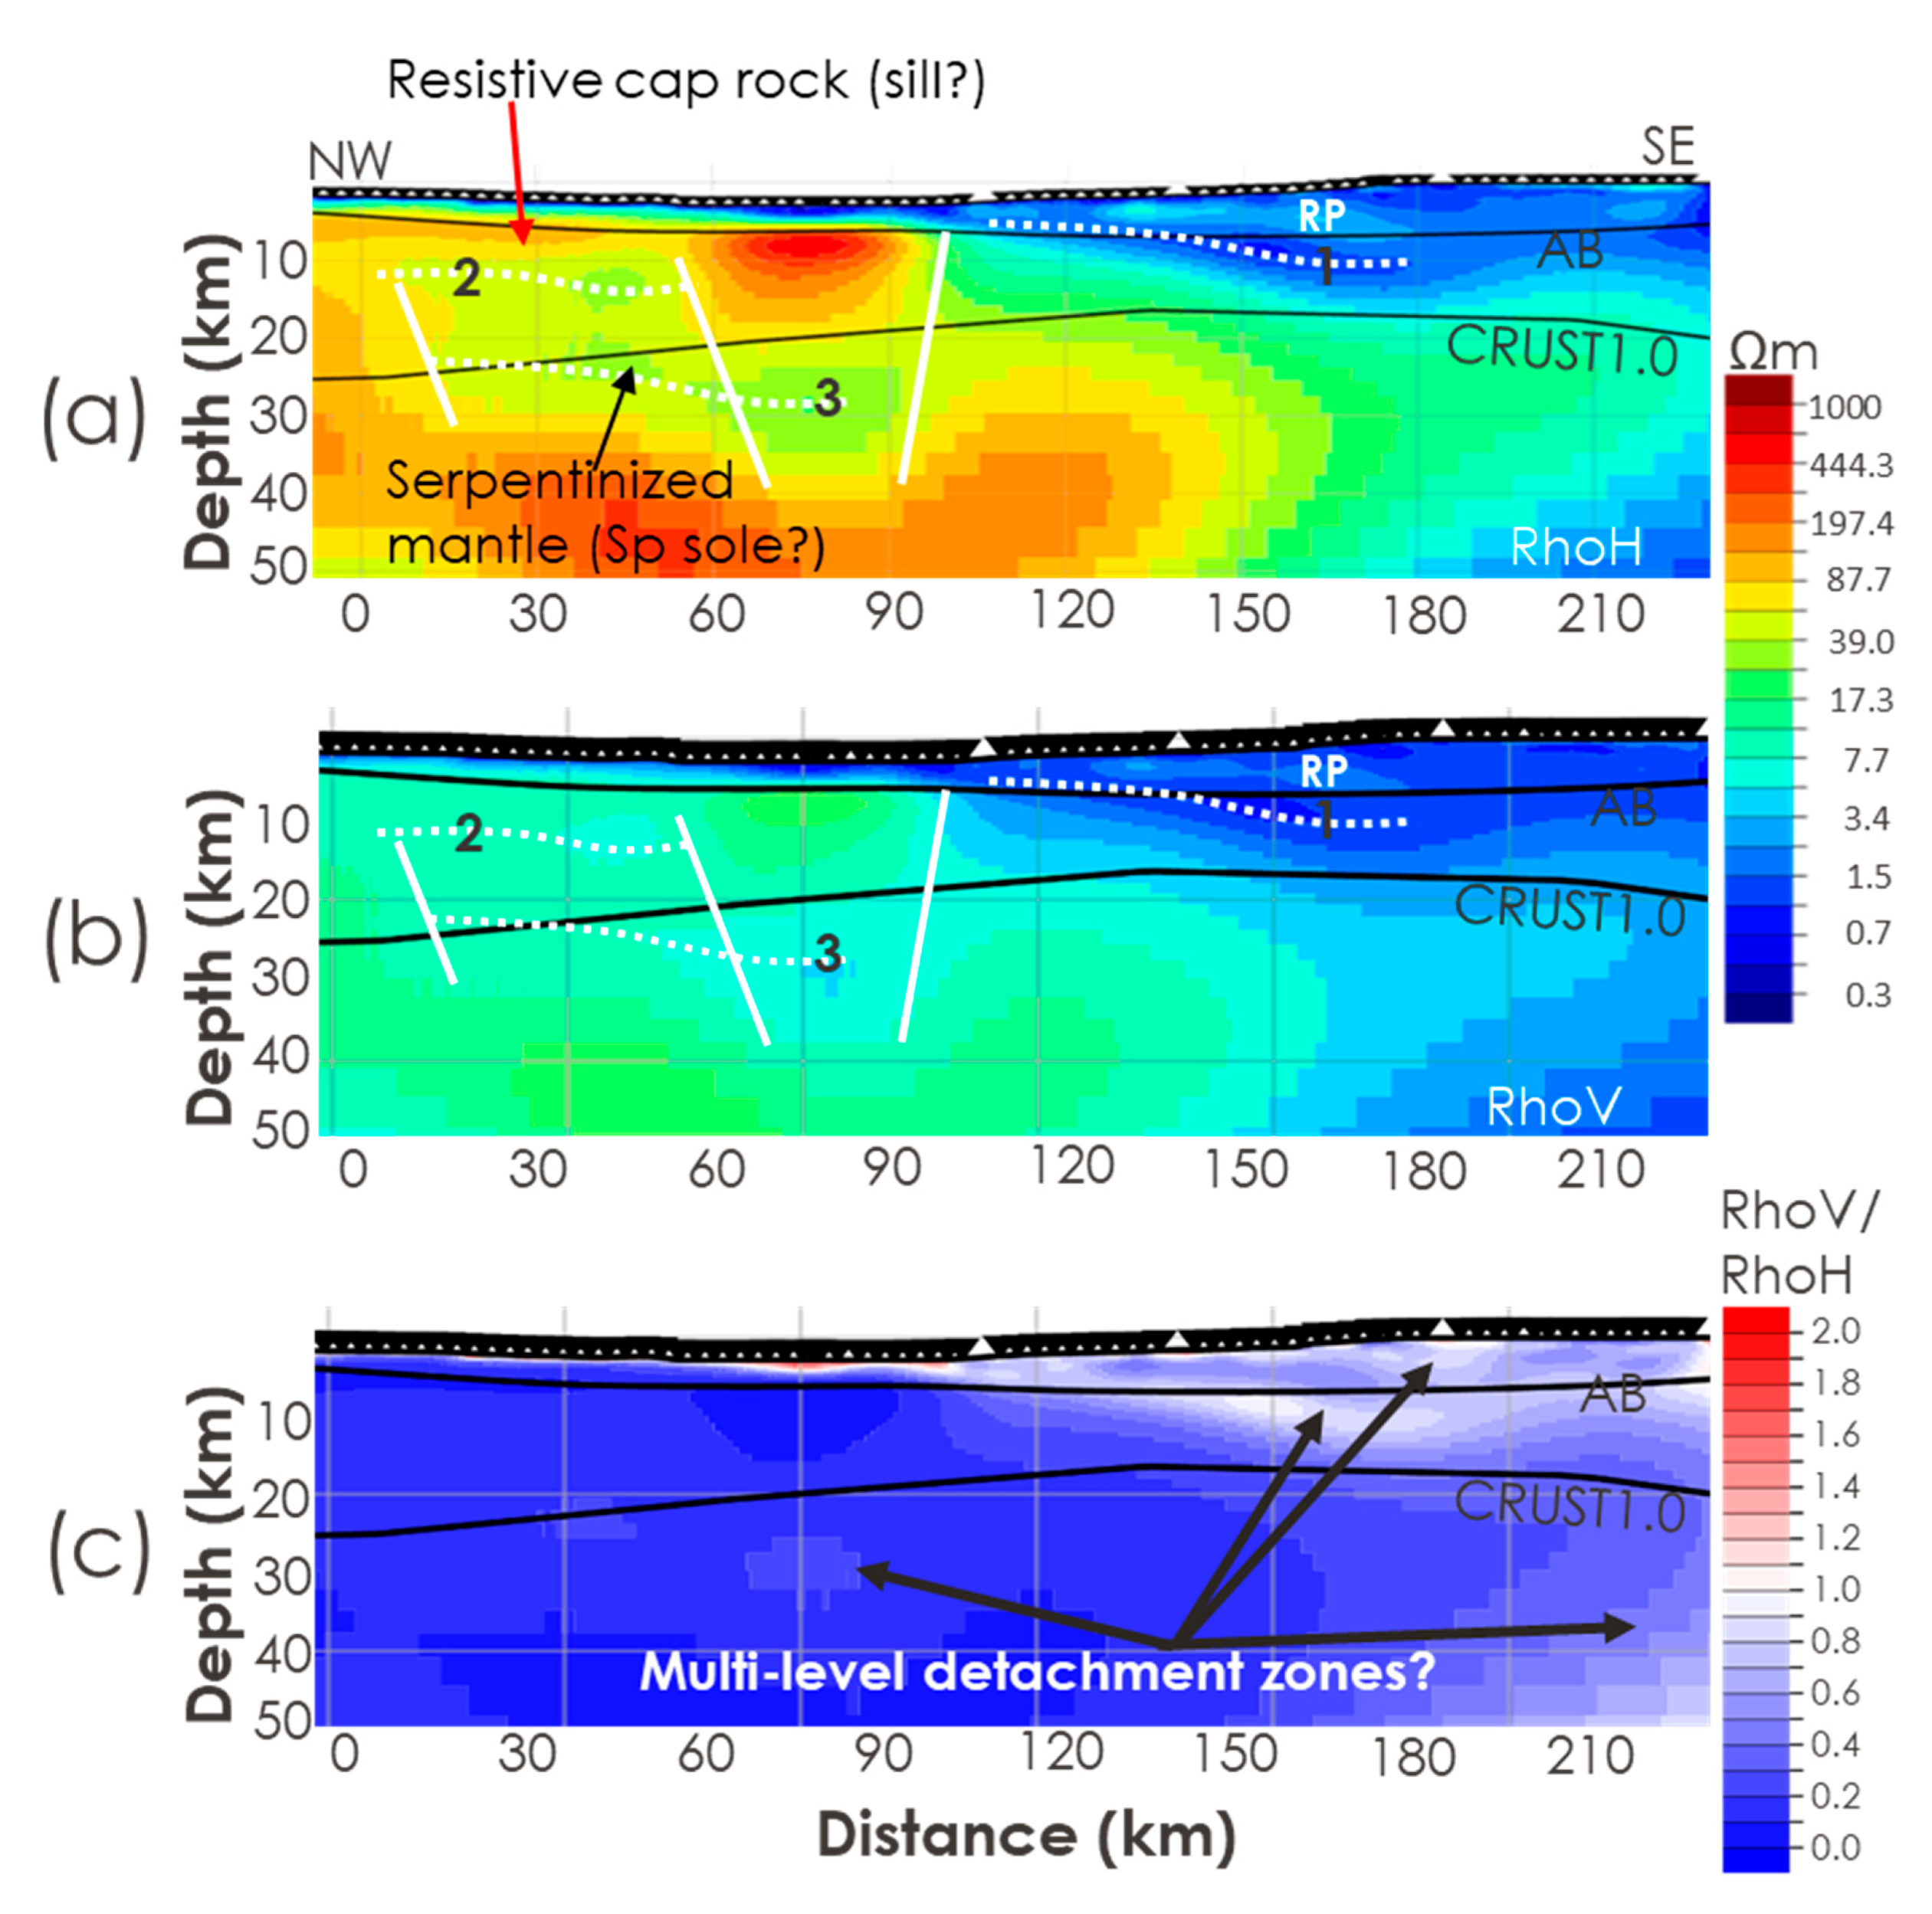
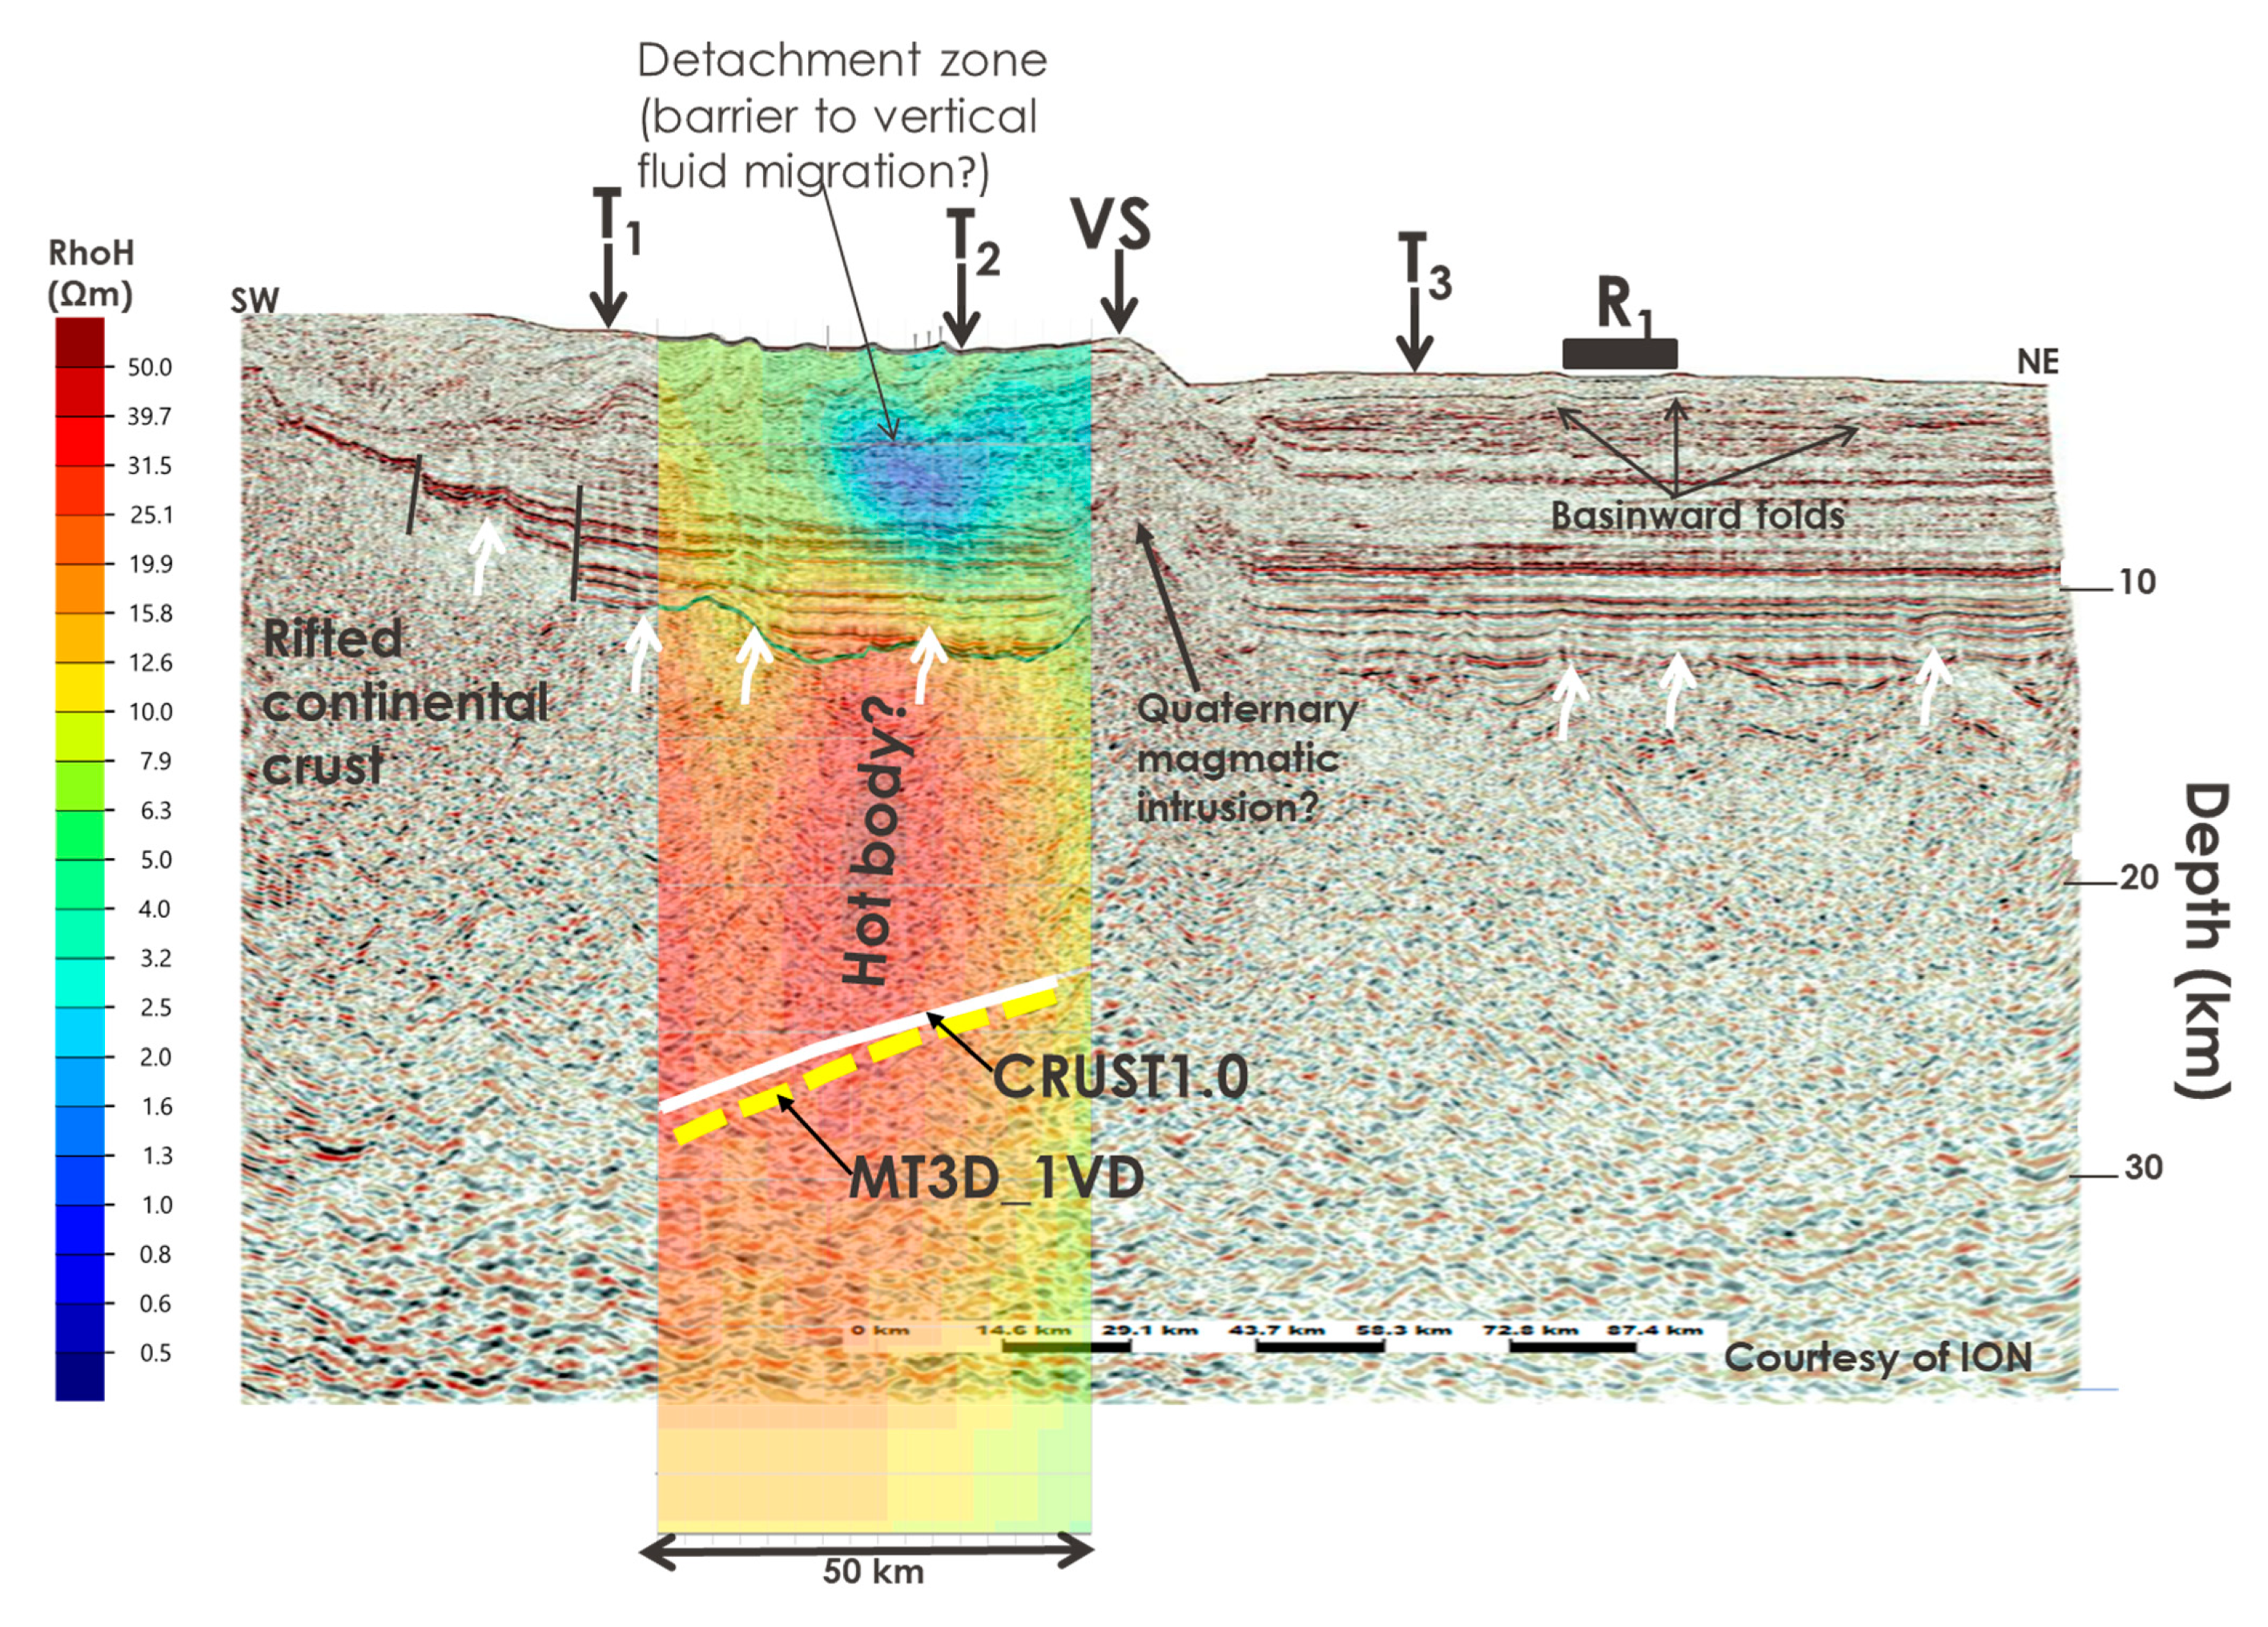
- MT imaging can detect anomalous, electrically conductive basement rocks. There are two interesting conductive bands (see the dotted white lines 1 and 2 in Figure 11) in the western half and a shallow conductive detachment in the eastern half of the transect. The deeper conductive band may be thrust-related and associated with serpentinized mantle rocks, which are important sources of native hydrogen. Note the possible structural similarity with the serpentinite sole in Figure 4b;
- MT imaging can robustly map deep-rooted steep faults (thick solid white lines in Figure 11) that may be tapping deep mantellic sources and act as a migration pathway to potential reservoirs at higher levels;
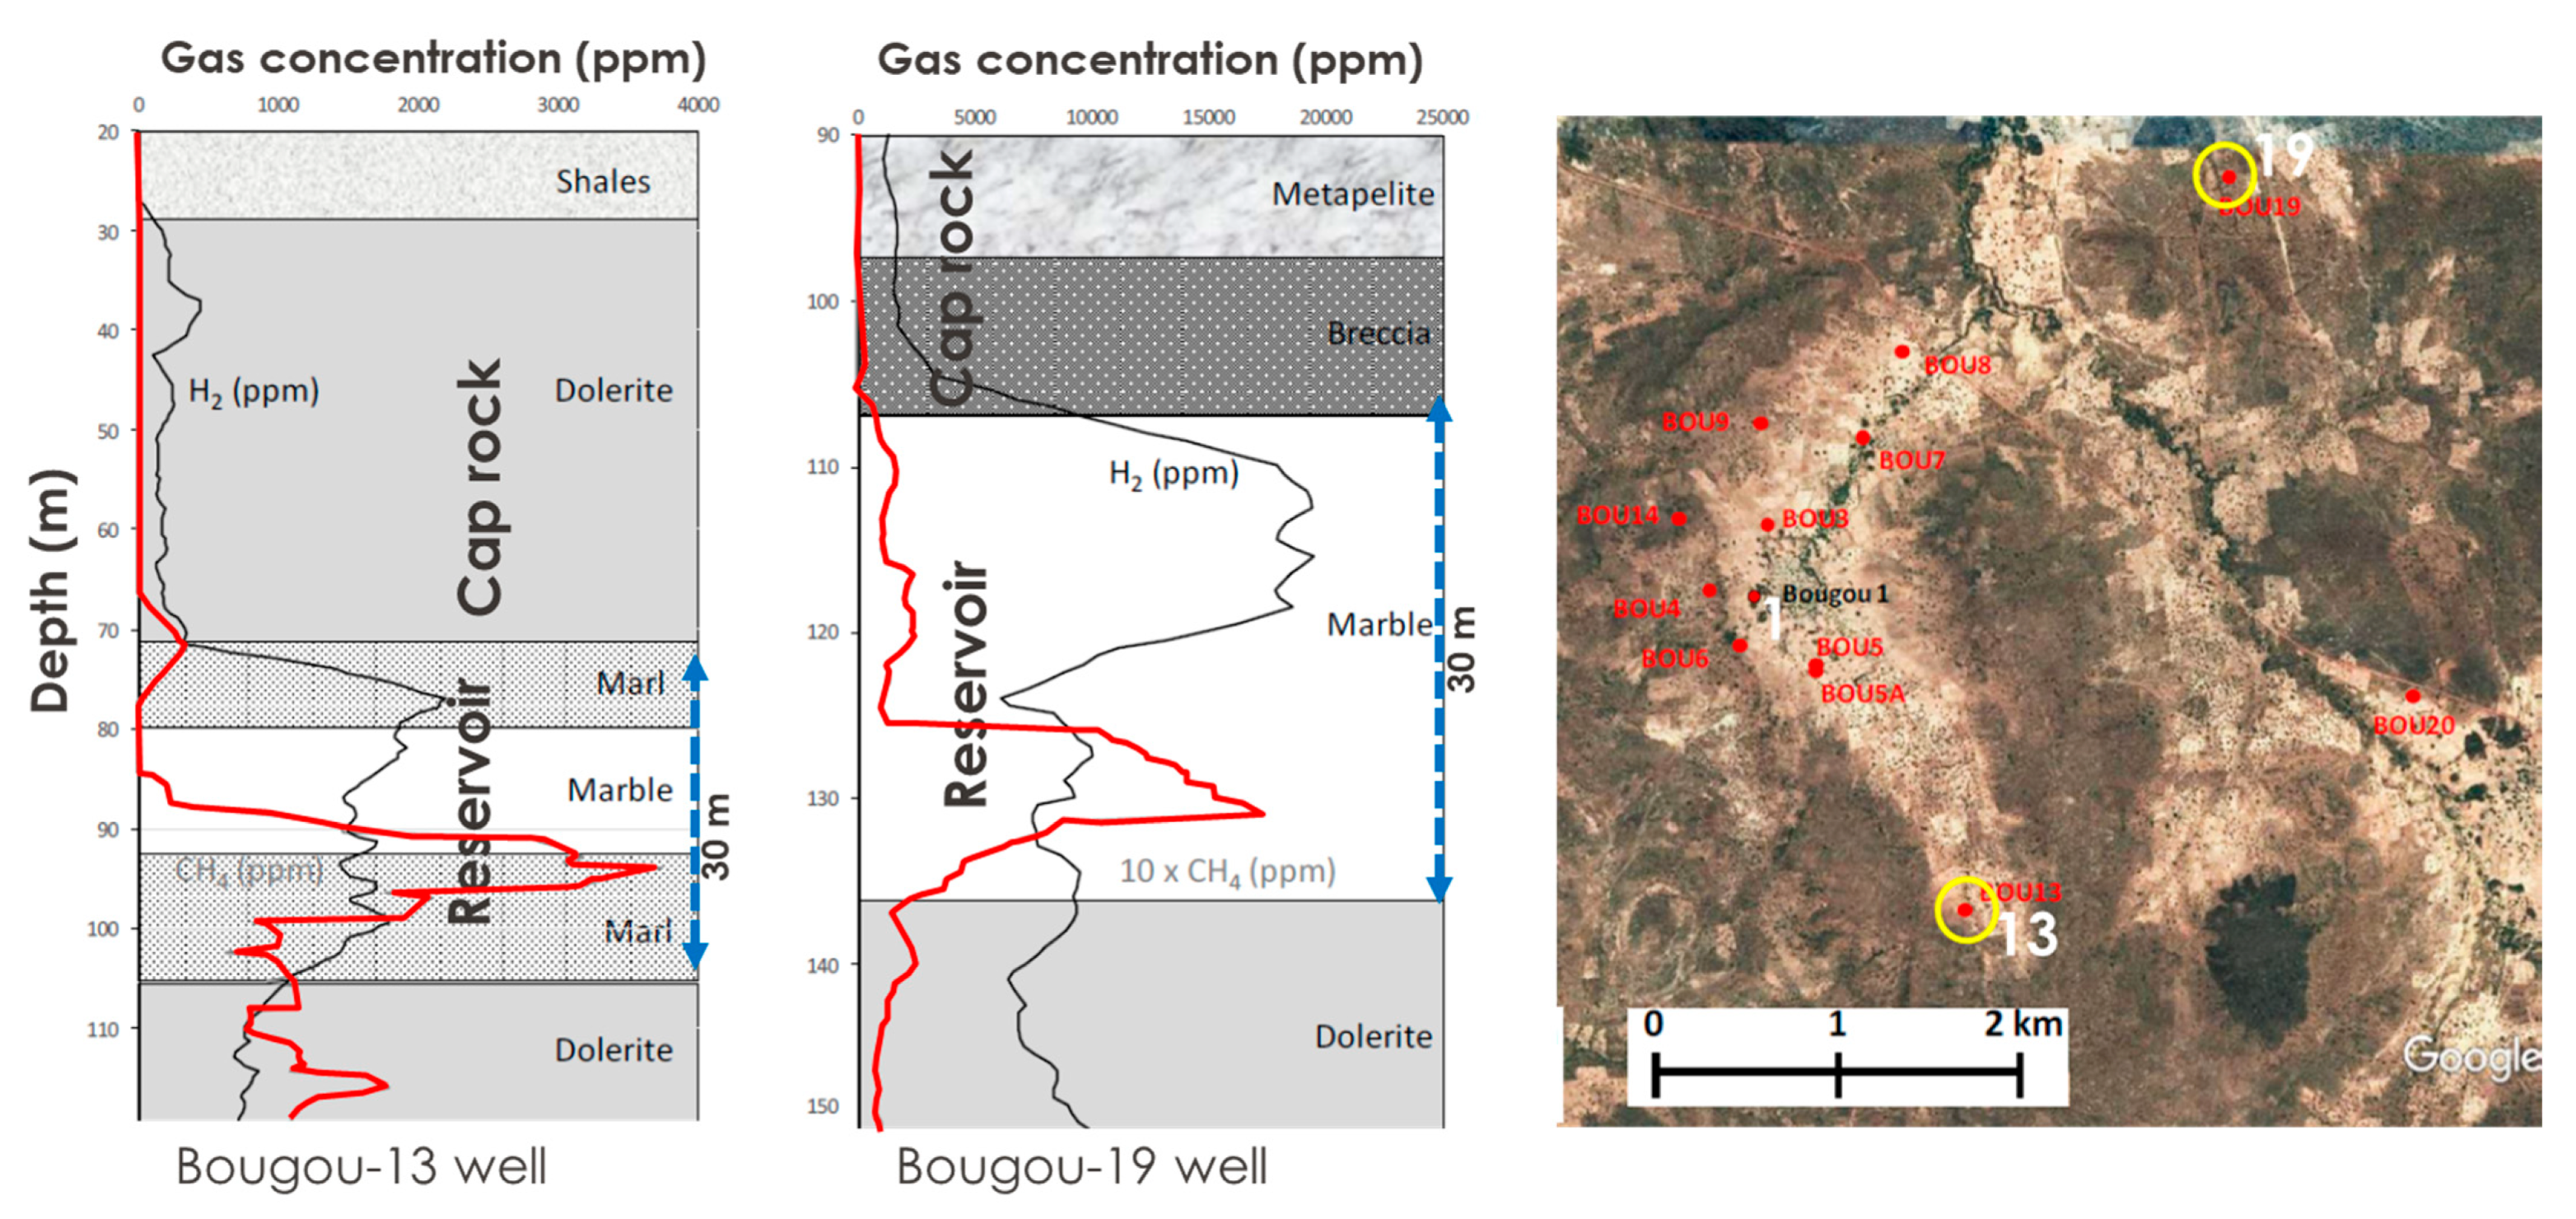
- There appear to be suitable cap rocks for hydrogen accumulation, such as electrically resistive igneous rocks (sills?) and conductive claystone or detachment zones, as suggested in Figure 11. Clays and igneous rocks are known to form cap rocks for significant hydrogen reservoirs elsewhere (e.g., Figure 5);
- The zones of relatively high anisotropy in the crust and mantle shown in Figure 11c may be multi-level detachment zones, suggesting active deformation involving a combination of tectonic- and gravity-driven processes.
4. Discussion
4.1. Extended Play-Based Workflow for Combined Hydrocarbon and Hydrogen Investigations
4.2. Wider Implications for Mapping Low-Carbon Reservoirs, Source Rocks, and Migration Paths
5. Conclusions
Author Contributions
Funding
Data Availability Statement
Acknowledgments
Conflicts of Interest
References
- Meju, M.A. A simple geologic risk-tailored 3D controlled-source electromagnetic multiattribute analysis and quantitative interpretation approach. Geophysics 2019, 84, E155–E171. [Google Scholar] [CrossRef]
- Meju, M.A.; Gallardo, L.A. Structural-coupling approaches in integrated geophysical imaging. In Integrated Imaging of the Earth; Moorkamp, M., Lelievre, P., Linde, N., Khan, A., Eds.; AGU Books/John Wiley & Sons Inc.: Hoboken, NJ, USA, 2016; pp. 49–67. ISBN 9781118929063. [Google Scholar] [CrossRef]
- Moorkamp, M.; Heincke, B.; Jegen, M.; Hobbs, R.W.; Roberts, A.W. Joint inversion in hydrocarbon exploration. In Integrated Imaging of the Earth; Moorkamp, M., Lelievre, P., Linde, N., Khan, A., Eds.; AGU Books/John Wiley & Sons Inc.: Hoboken, NJ, USA, 2016; pp. 167–189. ISBN 9781118929063. [Google Scholar] [CrossRef]
- Meju, M.A.; Saleh, A.S.; Mackie, R.L.; Miorelli, F.; Miller, R.V.; Mansor, N.K.S. Workflow for improvement of 3D anisotropic 3D CSEM resistivity inversion and integration with seismic using cross-gradient constraint to reduce exploration risk in a complex fold-thrust belt in offshore northwest Borneo. Interpretation 2018, 6, SG49–SG57. [Google Scholar] [CrossRef]
- Gallardo, L.A.; Fontes, S.L.; Meju, M.A.; Buonora, M.P.; de Lugao, P. Robust geophysical integration through structure-coupled joint inversion and multispectral fusion of seismic reflection, magnetotelluric, magnetic and gravity images: Example from Santos Basin, offshore Brazil. Geophysics 2012, 77, B237–B251. [Google Scholar] [CrossRef]
- Gallardo, L.A.; Meju, M.A. Structure-coupled multi-physics imaging in geophysical sciences. Rev. Geophys. 2011, 49, RG1003. [Google Scholar] [CrossRef]
- Mackie, R.L.; Meju, M.A.; Miorelli, F.; Miller, R.V.; Scholl, C.; Saleh, A.S. Seismic image-guided 3D inversion of marine controlled-source electromagnetic and magnetotelluric data. Interpretation 2020, 8, SS1–SS13. [Google Scholar] [CrossRef]
- Archie, G.E. The electrical resistivity log as an aid in determining some reservoir characteristics. Trans. AIME 1942, 146, 54–62. [Google Scholar] [CrossRef]
- Eidesmo, T.; Ellingsrud, S.; MacGregor, L.M.; Constable, S.; Sinha, M.C.; Johansen, S.; Kong, S.; Westerdahl, F.N. Sea bed logging (SBL): A new method for remote and direct identification of hydrocarbon filled layers in deepwater areas. First Break 2002, 20, 144–152. [Google Scholar]
- Ellingsrud, S.; Eidesmo, T.; Johansen, S.; Sinha, M.C.; MacGregor, L.M.; Constable, S. Remote sensing of hydrocarbon layers by sea bed logging (SBL): Results from a cruise offshore Angola. Lead. Edge 2002, 21, 972–982. [Google Scholar] [CrossRef]
- Meju, M.A.; Saleh, A.S.; Karpiah, A.B.; Masnan, M.S.; Miller, R.V.; Legrand, X.; Kho, J.H.W. Three-dimensional anisotropic inversion and electrostratigraphic imaging of marine magnetotelluric data to understand the control of crustal deformation by pre-existing lithospheric structures in the Mexican Ridges Fold belt, southwestern Gulf of Mexico. Geophys. J. Int. 2023, 234, 1032–1050. [Google Scholar] [CrossRef]
- Chesley, C.; Key, K.; Constable, S.; Behrens, J.P.; MacGregor, L.M. Crustal cracks and frozen flow in oceanic lithosphere inferred from electrical anisotropy. Geochem. Geophys. Geosystems 2019, 20, 5979–5999. [Google Scholar] [CrossRef]
- Meju, M.A.; Miller, R.V.; Shukri, S.; Mansor, N.K.S.; Kho, J.H.W.; Shahar, S. Unconstrained 3D anisotropic CSEM resistivity inversion: Industry benchmark. In Proceedings of the 80th EAGE Annual Conference & Exhibition, Copenhagen, Denmark, 11–14 June; 2018. Paper Tu E 10. [Google Scholar]
- Meju, M.A.; Fatah, A. Structurally-constrained 3D anisotropic inversion of CSEM data using crossgradient criterion. In Proceedings of the 6th 3DEM International Symposium, Berkeley, CA, USA, 28–30 March 2017. [Google Scholar]
- Meju, M.A.; Mackie, R.L.; Miorelli, F.; Saleh, A.S.; Miller, R.V. Structurally-tailored 3D anisotropic CSEM resistivity inversion with cross-gradients criterion and simultaneous model calibration. Geophysics 2019, 84, E311–E326. [Google Scholar] [CrossRef]
- Hoversten, G.M.; Mackie, R.L.; Hua, Y. Reexamination of controlled-source electromagnetic inversion at the Lona prospect, Orphan Basin, Canada. Geophysics 2021, 86, E157–E170. [Google Scholar] [CrossRef]
- Saleh, A.S.; Meju, M.A.; Ismail, N.A.B.; Nawawi bin Mohd Nordin, M. Optimization of seismic-guided 3-D marine magnetotelluric imaging in a complex fold-belt setting in NW Borneo, Malaysia. Geophys. J. Int. 2022, 230, 464–479. [Google Scholar] [CrossRef]
- Karpiah, A.B.; Meju, M.A.; Saleh, A.S.; Heng, P.M.; Das, P.S.; Omar, N. Use of structure-guided 3D controlled-source electromagnetic inversion to map karst features in carbonates in offshore northwest Borneo. Geophysics 2022, 87, E279–E290. [Google Scholar] [CrossRef]
- Rose, P.R. Risk Analysis and Management of Petroleum Exploration Ventures; AAPG Methods in Exploration Series; American Association of Petroleum Geologists: Tulsa, OK, USA, 2001; 164p. [Google Scholar]
- del Real, P.G.; Vishal, V. Mineral Carbonation in Ultramafic and Basaltic Rocks. In Geologic Carbon Sequestration: Understanding Reservoir Behavior; Vishal, V., Singh, T.N., Eds.; Springer International Publishing: Cham, Switzerland, 2016; pp. 213–229. [Google Scholar]
- Ulrich, M.; Muñoz, M.; Boulvais, P.; Cathelineau, M.; Cluzel, D.; Guillot, S.; Picard, C. Serpentinization of New Caledonia peridotites: From depth to (sub-)surface. Contrib. Mineral. Petrol. 2020, 175, 91. [Google Scholar] [CrossRef]
- Lodhia, B.H. Hydrogen exploration: The next big thing? Preview 2022, 2022, 39–40. [Google Scholar] [CrossRef]
- Dugamin, E.; Truche, L.; Donze, F.V. Natural hydrogen exploration guide. ISRN Geonum-NST 2019, 1, 16. Available online: https://www.researchgate.net/publication/330728855_Natural_Hydrogen_Exploration_Guide (accessed on 1 December 2022).
- Albers, E.; Bach, W.; Pérez-Gussinyé, M.; McCammon, C.; Frederichs, T. Serpentinization-driven H2 production from continental break-up to mid-ocean ridge spreading: Unexpected high rates at the West Iberia Margin. Front. Earth Sci. 2021, 9, 673063. [Google Scholar] [CrossRef]
- Lefeuvre, N.; Truche, L.; Donze, F.-V.; Ducoux, M.; Barre, G.; Fakoury, R.-A.; Calassou, S.; Gaucher, E.C. Native H2 Exploration in the Western Pyrenean Foothills. Geochem. Geophys. Geosystems 2021, 22, e2021GC009917. [Google Scholar] [CrossRef]
- Etiope, G.; Samardzic, N.; Grassa, F.; Hrvatovic, H.; Miosic, N.; Skopljak, F. Methane and hydrogen in hyperalkaline groundwaters of the serpentinized Dinaride ophiolite belt, Bosnia and Herzegovina. Appl. Geochem. 2017, 84, 286–296. [Google Scholar] [CrossRef]
- Briere, D.; Jerzykiewicz, T.; Śliwiński, W. On Generating a Geological Model for Hydrogen Gas in the Southern Taoudenni Megabasin (Bourakebougou Area, Mali). Search and Discovery Article #42041 2017. In Proceedings of the AAPG/SEG International Conference & Exhibition, Barcelona, Spain, 3–6 April 2016. [Google Scholar]
- Prinzhofer, A.; Cisse, C.S.T.; Diallo, A.B. Discovery of a large accumulation of natural hydrogen in Bourakebougou (Mali). Int. J. Hydrogen Energy 2018, 43, 19315–19326. [Google Scholar] [CrossRef]
- Prinzhofer, A.; Moretti, I.; Françolin, J.; Pacheco, C.; d’Agostino, A.; Werly, J.; Rupin, F. Natural hydrogen continuous emission from sedimentary basins: The example of a Brazilian H2-emitting structure. 2019. Int. J. Hydrogen Energy 2019, 44, 5676–5685. [Google Scholar] [CrossRef]
- Lamadrid, H.M.; Rimstidt, J.D.; Schwarzenbach, E.M.; Klein, F.; Ulrich, S.; Dolocan, A.; Bodnar, R.J. Effect of water activity on rates of serpentinization of olivine. Nat. Commun. 2017, 8, 16107. [Google Scholar] [CrossRef] [PubMed]
- Cannat, M.; Sauter, D.; Lavier, L.; Bickert, M.; Momoh, E.; Leroy, S. On spreading modes and magma supply at slow and ultraslow mid-ocean ridges. Earth Planet. Sci. Lett. 2019, 519, 223–233. [Google Scholar] [CrossRef]
- Gillard, M.; Leroy, S.; Cannat, M.; Sloan, H. Margin-to-margin seafloor spreading in the eastern Gulf of Aden: A 16 Ma-long history of deformation and magmatism from seismic reflection, gravity and magnetic data. Front. Earth Sci. 2021, 9, 707721. [Google Scholar] [CrossRef]
- Toft, P.B.; Arkani-Hamed, J.; Haggerty, S.E. The effects of serpentinization on density and magnetic susceptibility: A petrophysical model. Phys. Earth Planet. Int. 1990, 65, 137–157. [Google Scholar] [CrossRef]
- Meju, M.A.; Jong, J.; Ogawa, K.; Muhtar, M.A.; Chuan, T.G.; Saleh, A.S.; Velayatham, T. Integrated evaluation of seabed geochemistry, geomicrobial, CSEM and seismic data to reduce exploration risk in deepwater Block 2F, offshore Sarawak, Malaysia. In Proceedings of the EAGE-Asian Petroleum Geoscience Conference and Exhibition, Kuala Lumpur, Malaysia, 12–13 October 2015. Extended Abstract. [Google Scholar]
- Meju, M.A.; Muhtar, M.A.; Choo, M.; Chakraborty, S.; Anuar, A.; Miller, R.V. Integration of seismic, CSEM and seabed geochemical data to reduce exploration risk in deepwater Block 2C, offshore Sarawak, Malaysia. In Proceedings of the EAGE-Asian Petroleum Geoscience Conference and Exhibition, Kuala Lumpur, Malaysia, 12–13 October; 2015. Extended Abstract. [Google Scholar]
- Karpiah, A.B.; Meju, M.A.; Miller, R.V.; Legrand, X.; Das, P.S.; Musafarudin, R.N.B.R. Crustal structure and basement-cover relationships in the Dangerous Grounds, offshore northwest Borneo, from 3D joint CSEM and MT imaging. Interpretation 2020, 8, SS97–SS111. [Google Scholar] [CrossRef]
- Gallardo, L.A.; Meju, M.A. Joint two-dimensional DC resistivity and seismic travel time inversion with cross-gradients constraints. J. Geophys. Res. 2004, 109, B03311. [Google Scholar] [CrossRef]
- Rodi, W.; Mackie, R.L. Nonlinear conjugate gradients algorithm for 2-D magnetotelluric inversion. Geophysics 2001, 66, 174–187. [Google Scholar] [CrossRef]
- Meju, M.A. Advances in structure-coupled multiphysics inversion theory. In Proceedings of the SEG Workshop on Multiphysics Imaging for Integrated Exploration and Field Development, Dubai, United Arab Emirates, 4–6 October 2016. [Google Scholar]
- Mackie, R.L. Geologically consistent inversion of geophysical data; a role for joint inversion. In Proceedings of the International Workshop on Gravity, Electrical and Magnetic Methods and Their Applications, Xi’an, China, 9–22 May 2019. [Google Scholar] [CrossRef]
- Meju, M.A. Regularized extremal bounds analysis (REBA): An approach to quantifying uncertainty in nonlinear geophysical inverse problems. Geophys. Res. Lett. 2009, 36, L03304. [Google Scholar] [CrossRef]
- Mackie, R.L.; Miorelli, F.; Meju, M.A. Practical methods for model uncertainty quantification in electromagnetic inverse problems. In Proceedings of the Expanded Abstract, SEG International Exposition and 88th Annual Meeting 2018, Anaheim, CA, USA, 14–19 October 2018. [Google Scholar] [CrossRef]
- Saleh, A.S.; Meju, M.; Mackie, R.; Andersen, E.; Ismail, N.A.; Nawawi, M. Seismic-Electromagnetic Projection attribute: Application in integrating seismic quantitative interpretation and 3D CSEM-MT broadband data inversion for robust ranking and sweet-spotting of hydrocarbon prospects in offshore NW Borneo. Geophysics 2023, in review. [Google Scholar]
- Ingram, G.M.; Chisholm, T.J.; Grant, C.J.; Hedlund, C.A.; Stuart-Smith, P.; Teasdale, J. Deepwater North West Borneo: Hydrocarbon accumulation in an active fold and thrust belt. Mar. Pet. Geol. 2004, 21, 879–887. [Google Scholar] [CrossRef]
- Laske, G.; Masters, G.; Ma, Z.; Pasyanos, M.E. CRUST1.0: An updated global model of Earth’s crust. Geophys. Res. Abstr. 2012, 14, 743. [Google Scholar]
- Hall, R. Contraction and extension in northern Borneo driven by subduction. J. Asian Sci. 2013, 76, 399–411. [Google Scholar] [CrossRef]
- Nguyen, L.A.; Mann, P. Gravity and magnetic constraints on the Jurassic opening of the oceanic Gulf of Mexico and the location and tectonic history of the Western Main transform fault along the eastern continental margin of Mexico. Interpretation 2016, 4, SC23–SC33. [Google Scholar] [CrossRef]
- Pindell, J.; Miranda, C.; Ceron, A.; Hernandez, L. Aeromagnetic map constrains Jurassic-Early Cretaceous synrift, break up, and rotational seafloor spreading history in the Gulf of Mexico. Mesozoic of the Gulf Rim and Beyond: New Progress in Science and Exploration of the Gulf of Mexico Basin. In Proceedings of the 35th Annual Gulf Coast Section SEPM Foundation Perkins-Rosen Research Conference. GCS SEPM Foundation, Houston, TX, USA, 8–9 December; 2016; pp. 123–153. [Google Scholar]
- Soyer, W.; Mackie, R.; Hallinan, S.; Pavesi, A.; Nordquist, G.; Suminar, A.; Intani, R.; Nelson, C. Geologically consistent multiphysics imaging of the Darajat geothermal steam field. First Break 2018, 36, 77–83. [Google Scholar] [CrossRef]





Disclaimer/Publisher’s Note: The statements, opinions and data contained in all publications are solely those of the individual author(s) and contributor(s) and not of MDPI and/or the editor(s). MDPI and/or the editor(s) disclaim responsibility for any injury to people or property resulting from any ideas, methods, instructions or products referred to in the content. |
© 2023 by the authors. Licensee MDPI, Basel, Switzerland. This article is an open access article distributed under the terms and conditions of the Creative Commons Attribution (CC BY) license (https://creativecommons.org/licenses/by/4.0/).
Share and Cite
Meju, M.A.; Saleh, A.S. Using Large-Size Three-Dimensional Marine Electromagnetic Data for the Efficient Combined Investigation of Natural Hydrogen and Hydrocarbon Gas Reservoirs: A Geologically Consistent and Process-Oriented Approach with Implications for Carbon Footprint Reduction. Minerals 2023, 13, 745. https://doi.org/10.3390/min13060745
Meju MA, Saleh AS. Using Large-Size Three-Dimensional Marine Electromagnetic Data for the Efficient Combined Investigation of Natural Hydrogen and Hydrocarbon Gas Reservoirs: A Geologically Consistent and Process-Oriented Approach with Implications for Carbon Footprint Reduction. Minerals. 2023; 13(6):745. https://doi.org/10.3390/min13060745
Chicago/Turabian StyleMeju, Max A., and Ahmad Shahir Saleh. 2023. "Using Large-Size Three-Dimensional Marine Electromagnetic Data for the Efficient Combined Investigation of Natural Hydrogen and Hydrocarbon Gas Reservoirs: A Geologically Consistent and Process-Oriented Approach with Implications for Carbon Footprint Reduction" Minerals 13, no. 6: 745. https://doi.org/10.3390/min13060745
APA StyleMeju, M. A., & Saleh, A. S. (2023). Using Large-Size Three-Dimensional Marine Electromagnetic Data for the Efficient Combined Investigation of Natural Hydrogen and Hydrocarbon Gas Reservoirs: A Geologically Consistent and Process-Oriented Approach with Implications for Carbon Footprint Reduction. Minerals, 13(6), 745. https://doi.org/10.3390/min13060745


