Abstract
Dolomite exhibits a wide distribution in geological strata. The metabolic activities of microorganisms in marine sediments play a crucial role in the formation of dolomite. Semiconducting minerals, such as hematite, goethite, and rutile, generate photoelectrons when exposed to sunlight, which can impact the community structure and metabolic activities of microorganisms. In this study, a simulated photoelectron system was conducted to investigate the response of the microbial community, as well as the regulation of sulfate reduction, to photoelectrons using high-throughput sequencing of the 16S rRNA gene. The regulatory effect of semiconducting mineral photoelectrons on the induction of carbonate precipitation by sulfate-reducing bacteria was explored. X-ray diffraction and Raman spectroscopy were used to characterize carbonate precipitation. During cultivation, the pH values of the system increased from 8.0 to approximately 8.5 and the rate of sulfate reduction was significantly enhanced under the influence of simulated photoelectrons. The alpha diversity of the microbial community decreased, and the semiconducting mineral photoelectronic system had a promoting effect on the enrichment of sulfate-reducing bacteria, mainly Desulfovibrio. Under the regulation of photoelectrons, sulfate-reducing bacteria can effectively oxidize organic matter and reduce sulfate in the environment, and proto-dolomite can be formed at a low Mg/Ca ratio. This process has important implications for carbon and sulfur element cycling in estuarine and oceanic photic zones, and provides a new explanation for the formation of large amounts of dolomite in geological history.
1. Introduction
Dolomite is widely distributed in the strata from the Precambrian to the Pleistocene, especially in Paleozoic or earlier formations [1]. These dolomites often have thicknesses of several hundred meters and extend for hundreds of kilometers in width [1], such as the dolomites in the early Paleozoic of North China Craton [2,3], while the thickness of dolomite formations in the Quaternary is generally less than 1 meter and widths do not exceed tens of kilometers [1,4].
There are many unresolved questions regarding the differences in distribution patterns of dolomites during different geological periods. Seawater chemistry has changed over geologic time from the Precambrian to the present, especially in terms of Mg/Ca ratio and pCO2, and periods of extensive platform growth correspond to periods of widespread dolomitization [5]. Hardie [6] argued that magnesium content in the oceans has remained relatively stable, but changes in the rate of seafloor spreading have altered the calcium content in seawater, thereby affecting the main mineralogical characteristics of carbonate and evaporite precipitation in the oceans. In contrast, Holland et al. [7] proposed that the characteristic of low magnesium content during the Cretaceous may reflect extensive dolomitization and carbonate platform growth events. In this case, dolomite formation would have altered seawater chemistry, contrary to the argument put forth by Hardie [6]. On the other hand, Burns et al. [8] contended that the relative levels of Mg/Ca ratio and pCO2 in dolomite precipitating fluids are far less important than oceanic oxygen levels in controlling the intensity of anaerobic bacterial metabolism during dolomite precipitation in different volumes of dolomite.
The metabolic activity of microorganisms in seabed sediments plays an important driving role in the cycling of chemical elements, which has drawn the attention of scholars to the promotion of dolomite precipitation by microbial activity. Vasconcelos et al. [9] proposed that bacterial activity can overcome the kinetic barriers to dolomite precipitation and may play a positive role in the formation of limestone. This process can occur under any conditions suitable for bacterial growth, covering a range from sediment surfaces to depths of 1000–3000 m. Nielsen et al. [10] associated the formation of spherulitic dolomite with hydrocarbon seepage and suggested that bacterial metabolism of hydrocarbon substances mediated the growth of dolomite. In addition, dumbbell- and spindle-shaped dolomite crystals have also been recorded in other microbial-influenced sedimentary environments [11,12]. Observations with scanning electron microscopy have also revealed the presence of bacterial microfossils preserved in dolomite rocks, which are typically preserved as spherical and compressed carbonate mineral structures. Organic tissues such as bacterial cells and filaments are easily decomposed, leaving behind well-developed micropores, which can explain the origin of abundant micropores in spherulitic- and dumbbell-shaped crystals in ancient dolomite rocks [10].
In the process of microbial-induced dolomite formation, the most well-studied anaerobic respiration pathway is microbial sulfate reduction (MSR). Vasconcelos and McKenzie proposed a new model called the microbial dolomite model based on a dolomite lake formation near Rio de Janeiro, Brazil [13]. Sulfate-reducing bacteria (SRB) have been present throughout much of Earth’s history and continue to be major contributors to the carbon cycle in modern ecosystems. Isotopic evidence suggests that sulfate reduction has been occurring for at least 3.7 billion years, predating the appearance of oxygenic photosynthesis and cyanobacteria [14]. SRB are major contributors to modern microbial mat systems, driving up to 80% of carbon oxidation in marine sediments [15] and playing a significant role in microbial mats throughout geological history. The role of sulfate-reducing bacteria in the formation of dolomite is complex and controversial. Vasconcelos and McKenzie [13] emphasize the direct mediation of anaerobic microorganisms, where the microorganisms regulate their own microenvironment to facilitate dolomite precipitation under surface conditions. The activity of these bacteria can raise pH values and carbonate alkalinity, thereby overcoming the chemical kinetic barriers in dolomite formation. This model differs from the model that suggests sulfate ions inhibit dolomite formation [16], as it proposes that, in cases where sulfate-reducing bacteria play an important role, continuous supplies of Ca2+ and Mg2+ are required for dolomite precipitation, while SO42− serves as an electron acceptor for sulfate-reducing bacteria and must be continuously supplied. Therefore, an abundance of sulfate ions not only does not inhibit dolomite precipitation but, in fact, becomes a necessary condition for it because it can sustain microbial metabolism. Another study also indicates that the precipitation rate of dolomite near the mineral surface appears to increase with higher levels of dissolved sulfate [17]. In the past decade, an increasing number of studies have supported this viewpoint [18,19,20]. Notably, the role of extracellular polymeric substances (EPS) in the process of dolomite formation has gained significant attention in recent research [21,22]. EPS are typically composed of carboxylate compounds, including methylated glucuronic acid, pyruvic acid, and succinic acid, as well as small amounts of amines and phosphates [23]. The negatively charged functional groups present in EPS and their preferential affinity for Ca and Mg ions can locally increase the saturation state of dolomite in the pore water system [21]. The carboxylate and other functional groups present in EPS, with their negatively charged ligands, exhibit different coordination geometries and affinity for Ca and Mg cations. This allows them to serve as nucleation sites and templates for dolomite precipitation [21,22,24].
Semiconducting minerals, such as hematite, goethite, and rutile, are widely present in marine sediments and suspended particles [25,26], and generate photoelectrons of different energy levels under sunlight exposure [27]. These photoelectrons can directly impact the composition of the microbial community, the efficiency of extracellular electron transfer, and the metabolic activity of microorganisms [27,28,29,30]. For example, under sunlight irradiation, the semiconducting mineral coating on soil generates photoelectrons, which can be transferred to the chemolithoautotrophic microorganism M. thermoacetica through microbial extracellular electron transfer. This transfer process facilitates the conversion of carbon dioxide into acetic acid [31]. Additionally, photoelectrons stimulate the growth and metabolic activity of the chemoautotrophic microbe A. ferrooxidans, resulting in significant enhancements in bacterial concentration, Fe2+ consumption rate, CO2 absorption and conversion rate, and organic carbon growth rate [27]. Hence, semiconducting minerals widely present in marine and estuarine environments can generate photoelectrons under sunlight, which may have an impact on the community composition and metabolic processes of sulfate-reducing bacteria in the environment, consequently influencing the process of dolomite formation. Our study offers new insights and perspectives on the precipitation of dolomite from the perspective of photoelectron energy. In this study, samples of surface sediments from the Yellow Sea were collected, and a multi-channel potentiostat was used to simulate different photoelectron energies of semiconducting minerals, constructing an H-shaped dual-chamber electrochemical system. The photoelectron response and community succession of the microbial community in the sediment, as well as the regulation of photoelectrons on sulfate reduction, were studied using high-throughput sequencing of 16S rRNA gene. The microbial community, mainly composed of sulfate-reducing bacteria, was enriched, and the regulatory effect of semiconducting mineral photoelectrons on the induction of carbonate mineral precipitation by sulfate-reducing bacteria was explored. X-ray diffraction and Raman spectroscopy were used to characterize the carbonate precipitation.
2. Materials and Methods
2.1. Sample Collection
The original sediment sample was collected on research vessel Kexue III during the Open Cruises of Chinese Offshore Oceanography Research, conducted by the Institute of Oceanology, Chinese Academy of Sciences (IOCAS), in November 2019. The sampling site (35.01° N, 122.00° E) is located in the western Yellow Sea with a water depth of 51 meters. The seabed sediment samples were collected using a box corer, and the surface sediment was scraped with a sterilized scraper and stored in a sterile storage box. The samples were stored at a temperature of 4 °C for bacterial cultivation, and −20 °C for DNA extraction and sequencing. The bacterial cultivation and DNA extraction were performed within 48 h after sample collection.
2.2. Bacterial Cultivation and Enrichment
A simulated photoelectron system was constructed to investigate the impact of semiconducting mineral photocatalysis on microbial community structure. The system (Figure 1a) consists of an H-type double-chamber glass reactor with a plate graphite electrode (7.5 cm × 3.5 cm × 0.5 cm) as the anode and a comb graphite electrode (7.5 cm × 3.5 cm × 0.5 cm) as the cathode. A saturated calomel electrode (SCE) was used as the reference electrode. A proton exchange membrane (Dupont, Wilmington, DE, USA) was employed to separate the cathode and anode chamber. The graphite electrodes were soaked in 1 M HCl and 1 M NaOH solutions for 1 h each, followed by ultrasonic cleaning. The entire device was sterilized at 121 °C for 30 min. After sterilization and cooling, the device was assembled in an anaerobic glove box. Five grams of sediment was added to the cathode chamber as the microbial source, and 80 mL of pre-sterilized and deoxygenated seawater was used as the culture medium. To this, 1 mL of 1 M sodium acetate solution was added as the carbon source, and 1 mL of 1 M FeSO4 and 1 mL of 1 g/L ascorbic acid solution were added as the sulfate reduction indicator and deoxygenating agent, respectively. The anode chamber was filled with 85 mL of sterilized seawater. Different energy levels of mineral photoelectrons were simulated using a multi-channel potentiostat (CHI 1000E, Shanghai Chenhua Instrument, Shanghai, China) with −0.2 V, −0.4 V, and −0.6 V potentials as the experimental conditions and open-circuit (OC) as control group. Three parallel experiments were conducted for each potential condition. During the experiment, 1 mL of cathode chamber solution was collected every 5 days to measure the pH value and sulfate concentration of the solution. After culturing for 30 days, the solution was filtered and DNA was extracted for high-throughput sequencing of 16S rRNA to analyze the response and evolutionary characteristics of the original microbial community under simulated photocurrent.
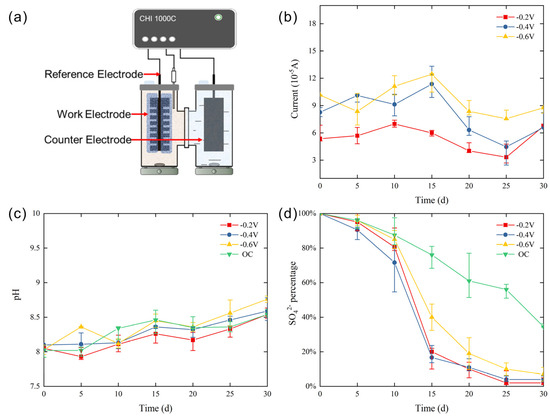
Figure 1.
Diagram of the simulated semiconducting mineral photoelectron system (a), I-t curve (b), pH curve (c), and sulfate reduction curve (d) during cultivation.
2.3. DNA Extraction and Sequencing
DNA of cathode solution after cultivation was extracted using the PowerSoil DNA Isolation Kit (MoBio Laboratories, Carlsbad, CA, USA), following the manual. The purity and quality of the genomic DNA were checked on 1% agarose gels and a NanoDrop spectrophotometer (Thermo Scientific, Waltham, MA, USA). The V3-4 hypervariable region of the bacterial 16S rRNA gene was amplified with the primers 338F (ACTCCTACGGGAGGCAGCAG) and 806R (GGACTACHVGGGTWTCTAAT). For each soil sample, an 8-digit barcode sequence was added to the 5′ end of the forward and reverse primers (provided by Allwegene Company, Beijing, China). The PCR was carried out on a Mastercycler Gradient (Eppendorf, Hamburg, Germany) using 25 μL reaction volumes containing 12.5 μL KAPA 2G Robust Hot Start Ready Mix, 1 µL forward primer (5 µM), 1 µL reverse primer (5 µM), 5 µL DNA (total template quantity: 30 ng), and 5.5 µL H2O. Cycling parameters were 95 °C for 5 min, followed by 28 cycles of 95 °C for 45 s, 55 °C for 50 s, and 72 °C for 45 s, with a final extension at 72 °C for 10 min. The PCR products were purified using an Agencourt AMPure XP Kit. Deep sequencing was performed on the Miseq platform at Allwegene Company (Beijing, China). All sequences were submitted to NCBI under SRA Accession No. PRJNA975218.
Initial demultiplexing and trimming of raw sequences were performed with the Illumina Analysis Pipeline, version 2.6. Quality control, merging of forward and reverse reads, chimera removal, and denoising was analyzed using QIIME 2 (Version 2023.2) with the DADA2 [32] plugin. Alpha and beta diversity analysis was conducted using the q2-diversity plugin. Taxonomical classification of ASVs (amplicon sequence variants) was performed using the q2-feature-classifier plugin with Silva 16S database version 138.
2.4. Carbonate Precipitation Experiment
To investigate the ability and mechanism of sulfate-reducing bacteria to promote carbonate mineral precipitation under the modulation of photoelectrons, a simulated semiconducting mineral photoelectronic system was constructed. The system utilized an H-type dual-chamber glass reactor as previously described. The culture medium was prepared by adding the following components per 1000 mL: KCl (314 mg), NaHCO3 (966 mg), Na2CO3 (1770 mg), Na2SO4 (4260 mg), NaCl (6605 mg), sodium dl-lactate (500 mg), yeast extract (1000 mg), and resazurin (1 mg). After the culture medium was prepared, nitrogen gas was introduced into the medium to remove dissolved oxygen from the culture medium. When the color of resazurin in the solution disappeared, ascorbic acid (100 mg) was added. In order to investigate the precipitation formation under different Mg/Ca ratios, MgCl2 was added to the culture medium at a concentration of 5713 mg/L and CaCl2 at a concentration of 666 mg/L, resulting in an Mg/Ca ratio of 10. Alternatively, MgCl2 was added at a concentration of 1904 mg/L and CaCl2 at a concentration of 1110 mg/L, resulting in an Mg/Ca ratio of 2.
The experiment was designed with two different potential conditions: open-circuit (OC) and −0.4 V, and a sterilized control group was also set up. Three parallel experiments were conducted for each condition. The cathode and anode chambers were filled with culture medium as described above, and 1 mL of enriched bacteria culture was added to the cathode chamber. The sterilized control group was set by adding 1 mL heat-sterilized enriched bacteria culture instead. The entire experimental process was conducted in an anaerobic glove box to maintain strict anaerobic conditions.
During the experiment, the pH, alkalinity, and concentration of sulfate, Ca2+, and Mg2+ of the solution were measured every 5 days. Alkalinity was determined by titration using 0.1 M HCl with methyl orange as an indicator. The concentrations of HCO3− and CO32− in the solution were calculated based on the measured pH and alkalinity. The concentrations of Ca2+ and Mg2+ in the solution were measured using inductively coupled plasma optical emission spectroscopy (ICP-OES, iCAP7200 DUO). Saturation indices of dolomite were calculated using PHREEQC Version 3. After 30 days, the cathode chamber solutions from each group were filtered to obtain precipitates, which were then washed 5 times with deionized water. The precipitates were characterized using confocal Raman microscopy (Renishaw inVia Reflex, Gloucestershire, UK) equipped with a 532 nm laser with 50% laser intensity and a 50× objective. The scanning range was 100–1340 cm−1, with 1 cm−1 of spectral resolution. The spectra were subjected to AAv denoising and baseline subtraction processing to minimize the influence of fluorescence. X-ray diffraction (XRD) pattern of the precipitates were collected using an X-ray powder diffractometer (X’pert Pro MPD, PANalytical, The Netherlands) equipped with Cu Kα radiation (λ = 1.5406 Å). The patterns were recorded from 5° to 85° and the scanning speed was 0.02°/s for 2θ. The XRD spectra were subjected to baseline subtraction.
3. Results and Discussion
3.1. (Electro)Chemical Parameters during Bacterial Cultivation
In the three sets of experiments, the −0.6 V group displayed a higher initial current, fluctuating around 8–12 × 10−5 A. In the −0.2 V and −0.4 V groups, the current slowly decreased during the first half of the reaction, dropping from 5.5 × 10⁻⁵ A and 8.2 × 10⁻⁵ A to 3.0 × 10⁻⁵ A and 4.5 × 10⁻⁵ A, respectively. The current then rebounded to 6.9 × 10⁻⁵ A at the end of the reaction in all groups (Figure 1b). The pH value changes in all four experiments showed a similar trend, with the pH value in the −0.2 V and −0.4 V groups increasing from 8.0 to 8.5–8.7 by the end of the experiment, indicating higher sulfate reduction efficiency (Figure 1c).
The results of the sulfate reduction rate curves (Figure 1d) showed that in the three sets of experiments with potentials of −0.2 V, −0.4 V, and −0.6 V, the reduction rate of sulfate significantly increased, with a rapid decline in sulfate concentration starting from day 10. Among them, the −0.4 V group showed the largest sulfate reduction rate, with 20%–50% of sulfate being reduced on day 10, and an approximate reduction rate of 98% at the end of the 30-day reaction. The −0.2 V group exhibited a sulfate reduction rate of approximately 96% at the end of the reaction, while the −0.6 V group showed a reduction rate of around 90% on day 30, with 15%–20% reduction on day 10. In contrast, the OC group maintained a slow and relatively stable sulfate reduction rate, with a reduction rate of approximately 65% after 30 days. These results preliminarily demonstrate that the simulation of mineral photocurrent has a promoting effect on microbial sulfate reduction, with the most significant effect observed at −0.4 V.
3.2. Microbial Community Evolution
In the original sediment sample, the alpha diversity of the microbial community was relatively high, but under the influence of simulated photocurrent, the alpha diversity significantly decreased (Figure 2). Chao1 estimates species richness, while the evenness index, Shannon index, and Simpson index assess the distribution and relative abundance of species within the community. These indices provide different perspectives on the diversity and structure of a community. Among the four experimental groups (−0.2 V, −0.4 V, −0.6 V, OC), the average values of the Chao1 index decreased by 65%, 70%, 45%, and 73%, respectively. The evenness index decreased by 57%, 58%, 50%, and 61%, respectively, and the Shannon index decreased by 56%, 58%, 49%, and 64%, respectively.
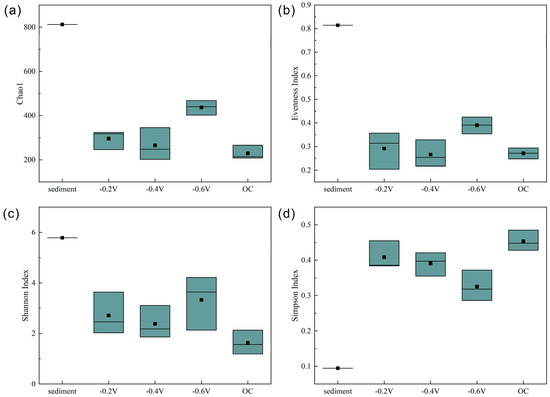
Figure 2.
Chao1 index (a), evenness index (b), Shannon index (c), and Simpson index (d) of bacterial communities before and after cultivation.
Analysis of the microbial community structure at the phylum level (Figure 3a) revealed that Proteobacteria was the dominant phylum in the original samples, accounting for 71% of the total abundance, while phyla such as Bacteroidetes, Actinobacteria, Firmicutes, and Chloroflexi were also present in the community, with abundances ranging from 3% to 5%. In the −0.2 V group, the abundance of Proteobacteria further increased to 80%–85%, and the abundance of SAR406 significantly increased to approximately 3%–8%, while Bacteroidetes accounted for approximately 4%–10%. In the −0.4 V group, the abundance of Proteobacteria slightly increased to 75%–80%, and the abundance of SAR406 significantly increased to approximately 6%–8%, while Bacteroidetes accounted for approximately 2%–6%. In the −0.6 V group, the abundance of Proteobacteria slightly increased to 73%–80%, and the abundance of SAR406 significantly increased to approximately 5%, while Bacteroidetes accounted for approximately 1%–4%. In the open circuit control group, the abundance of Proteobacteria reached over 90%.
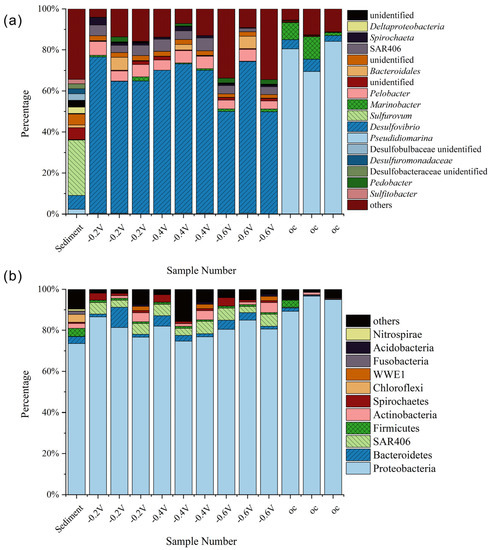
Figure 3.
Taxonomic bar plot of bacterial communities at phylum (a) and genus (b) level after cultivation.
At the genus level (Figure 3b), sulfate-reducing bacteria such as Desulfovibrio, Sulfurovum, and Sulfitobacter, as well as chemoheterotrophic bacteria such as Pseudidiomarina, Marinobacter, Pelobacter, and Spirochaeta, had relatively high abundances in the original samples. In the −0.2 V and −0.4 V groups, Desulfovibrio, a genus of sulfur-reducing bacteria, dominated the microbial communities, constituting 60% to 75% of the community. In the −0.6 V group, the proportion of Desulfovibrio ranged from 46% to 74%. In the OC group, a chemoheterotrophic bacterium, Pseudidiomarina, was significantly enriched in the community, constituting 70% to 85% of the community, and Desulfovibrio accounted for 5% to 8%, which is consistent with the results of sulfate reduction rate. These results indicate that the evolution direction of microbial communities under simulated photocatalytic conditions changed significantly, promoting the enrichment of sulfate-reducing bacteria, particularly Desulfovibrio, which is the dominant genus of sulfate-reducing bacteria.
Desulfovibrio, a group of Gram-negative anaerobic sulfate-reducing bacteria, widely exist in various natural environments such as sediments, soils, and aquatic environments, and play important roles in the biogeochemical cycling of sulfur and carbon elements [33]. During anaerobic respiration, Desulfovibrio use sulfate as the terminal electron acceptor, producing sulfide as a metabolic byproduct [34]. Desulfovibrio possess a complex electron transfer system, including a series of electron transfer proteins such as hydrogenases, cytochromes, and iron-sulfur proteins, which participate in the energy conversion process during sulfate reduction [35]. The extracellular electron transfer capacity of Desulfovibrio has been extensively studied, and Kang et al. [36] found that Desulfovibrio desulfuricans can directly transfer electrons to treated graphite electrodes through Cytochrome c. Another strain of Desulfovibrio, Desulfovibrio ferrophilus IS5, can use graphite cathode (−0.4 V) as a direct electron donor through Cytochrome c to reduce sulfate [37,38,39]. Semiconducting minerals in the euphotic zone can generate photoelectrons with energy similar to that produced under sunlight irradiation, providing an additional energy source in environments where electron donors are scarce, which may promote sulfate reduction dominated by Desulfovibrio.
3.3. Chemical Parameters during Carbonate Precipitation
3.3.1. pH Value and Sulfate Concentration
During the reaction process in the system, notable changes in pH values were observed (Figure 4a,b). In the Mg/Ca = 10 group, the pH of the −0.4 V group started to rise after day 5 and reached 9.41 on day 20, followed by a gradual increase, reaching 9.60 at the end of the experiment. In contrast, the OC group exhibited a slower rate of pH increase, with a relatively constant rate of pH change and a pH value of 9.00 at the end of the experiment. The sterilized control group showed a slight increase in pH at the beginning of the reaction, followed by a slow decrease to 7.22, maintaining a stable state. When the Mg/Ca ratio was 2, the −0.4 V group showed a similar pattern, with pH starting to increase after day 5 and reaching 9.51 on the 25th day, and then remaining relatively stable at 9.52 until the end of the experiment. The OC group also exhibited an increase in pH after the start of the reaction, but at a slower rate compared to the −0.4 V group, with a relatively constant rate of pH increase and a pH value of 9.11 at the end of the experiment. The primary reason for the observed changes in pH values in these groups was attributed to the release of S2−/HS− and CO32−/HCO3− into the solution due to the metabolic activity of sulfate-reducing bacteria, resulting in an increase in the pH of the solution.
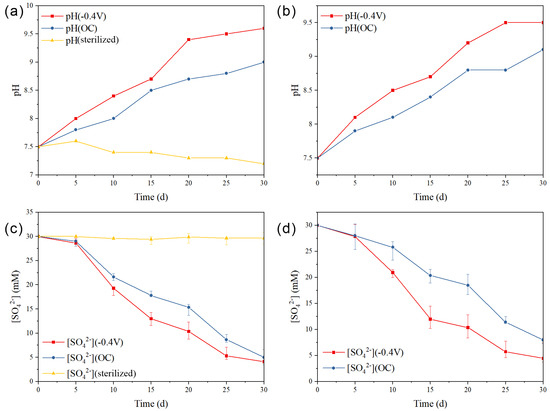
Figure 4.
Variation curve of pH during the reaction process: (a) Mg/Ca = 10, (b) Mg/Ca = 2; reduction curve of sulfate during the reaction process: (c) Mg/Ca = 10, (d) Mg/Ca = 2.
During the reaction process in the system with an Mg/Ca ratio of 10, in the OC group (Figure 4c), the concentration of SO42− experienced a decrease from day 5 due to the metabolic activity of sulfate-reducing bacteria, maintaining a relatively constant rate of sulfate reduction, with a sulfate reduction rate of 83.3% observed at day 30. In the −0.4 V group, the concentration of SO42− exhibited a rapid decrease from day 5, with a sulfate reduction rate approximately 20% higher than that of the OC group. The sulfate reduction rate at the end of the experiment was measured to be 86.3%. In contrast, the concentration of SO42− in the sterilized control group remained unchanged. Similarly, when the Mg/Ca ratio was 2 (Figure 4d), in the OC group, the concentration of SO42− decreased from day 5 and maintaining a relatively constant rate of SO42− reduction, with a sulfate reduction rate of 71.3% observed on day 30. In the −0.4 V group, the concentration of SO42− also decreased rapidly from day 5 with a sulfate reduction rate about 20% higher than that of the OC group. The sulfate reduction rate at the end of the reaction was measured to be 84.4%.
3.3.2. Concentration of Mg2+ and Ca2+
Through the measurement of calcium and magnesium ion concentrations in the solution (Figure 5), the extent of calcium and magnesium ion incorporation into the precipitate can be monitored. When the Mg/Ca ratio was 10, in the OC group, the concentration of magnesium ions in the solution exhibited a relatively stable decrease starting from day 5. In contrast, in the −0.4 V group, the rate of magnesium ion incorporation into the precipitate was significantly higher compared to the OC group, resulting in a greater amount of magnesium ions being incorporated into the precipitate by the end of the reaction. However, the precipitation rate and total amount of calcium ions showed no significant changes in either the OC group and the −0.4 V group. In the sterilized control group, the concentration of calcium and magnesium ions in the solution remained unchanged.
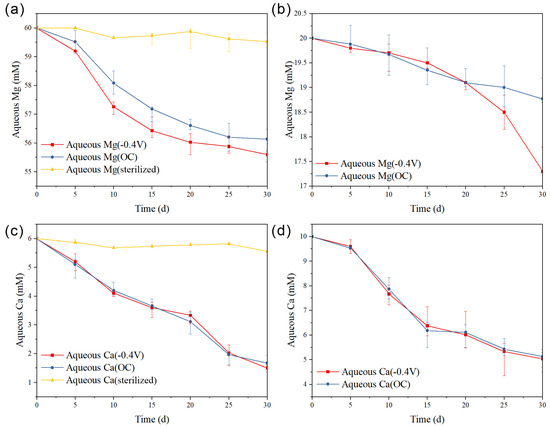
Figure 5.
The concentration curve of magnesium ion during the reaction process: (a) Mg/Ca = 10, (b) Mg/Ca = 2; The concentration curve of calcium ion: (c) Mg/Ca = 10, (d) Mg/Ca = 2.
When the Mg/Ca ratio was 2, in both the OC group and the −0.4 V group, the concentration of magnesium ions in the solution showed a slow and low rate of decrease during the first 20 days. From day 25 to day 30, in the −0.4 V group, the Mg/Ca ratio increased as the calcium ion concentration decreased, and magnesium ions also began to incorporate into the precipitate. However, in the OC group, the concentration of magnesium ions continued to decrease slowly. The precipitation rate of calcium ions did not show significant changes in either the OC group and the −0.4 V group.
These findings indicate that sulfate-reducing bacteria have the potential to promote the precipitation of carbonate minerals in the solution, and, under simulated photoelectron effects, the rate and total amount of magnesium ions incorporating into the precipitate are significantly increased, which may facilitate the formation of dolomite.
3.3.3. Alkalinity and Saturation Index
The alkalinity of the solution was quantified by measuring the concentration of carbonate ions, which plays a crucial role in the precipitation−dissolution equilibrium of carbonate minerals. The metabolic activity of sulfate-reducing bacteria resulted in the generation of carbonate ions and bicarbonate ions, which were released into the solution, leading to a rapid increase in solution alkalinity (Figure 6a,b). In the OC group, when the Mg/Ca ratio was 10, the alkalinity increased from 45.1 to 52.3 mM. However, under simulated photoelectronic effects, the −0.4 V group exhibited a higher sulfate reduction rate and total reduction amount, resulting in a more significant increase in alkalinity to 55.1 mM. The change in Mg/Ca ratio had a minor impact on the variation of solution alkalinity. When the Mg/Ca ratio was 2, in the OC group, the alkalinity increased from 46.3 to 52.4 mM. Similarly, under simulated photoelectron action, the −0.4 V group showed a higher sulfate-reducing rate and total reduction, resulting in an alkalinity rise to 56.5 mM.
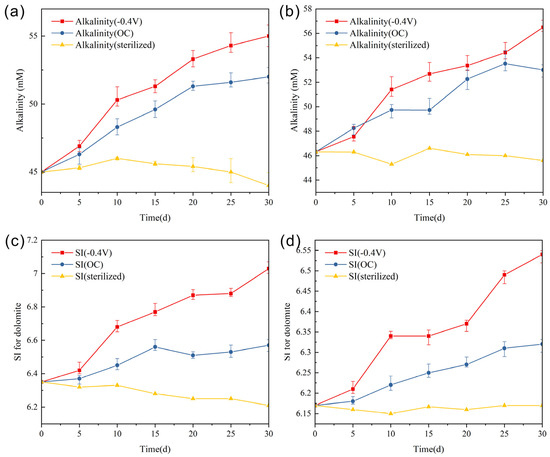
Figure 6.
Variation curve of alkalinity during the reaction process: (a) Mg/Ca = 10, (b) Mg/Ca = 2; variation curve of saturation index of dolomite: (c) Mg/Ca = 10, (d) Mg/Ca = 2.
The saturation index (SI) of dolomite can be calculated using the following formula:
where IAP represents the ion activity product of dolomite, and Ksp is the precipitation-dissolution equilibrium constant of dolomite. In both the OC group and the −0.4 V group, the metabolic activity of sulfate-reducing bacteria generated CO32−/HCO3−, leading to an increase in solution pH, and more HCO3− was converted to CO32−, further increasing the concentration of CO32− in the solution. When the Mg/Ca ratio was 10, in the OC group, the saturation index increased from 6.35 to 6.57, while in the −0.4 V experimental group, the SI value increased from 6.35 to 7.03. When the Mg/Ca ratio was 2, in the OC group, the SI value increased from 6.17 to 6.32, while in the −0.4 V experimental group, the SI value increased from 6.17 to 6.54 (Figure 6c,d). The calculation of SI values indicates that simulated photoelectron can significantly increase the SI value of dolomite in solution, making the solution thermodynamically more prone to precipitating dolomite.
3.4. Mineralogical Characterization of Carbonate Mineral Precipitate
3.4.1. Mg-Ca Equilibrium in Precipitation
Through quantifying the concentrations of calcium and magnesium ions in solution, the extent of magnesium and calcium ions entering precipitation at different stages of the reaction can be determined (Figure 7). When the Mg/Ca ratio is 10, in the initial phase of the reaction, the proportion of magnesium ions entering precipitation is around 20% to 25% in the OC group, and 30% to 40% in the −0.4 V experimental group. In the latter phase of the reaction, the saturation index of dolomite increases significantly in both experimental groups, indicating a higher rate of magnesium ions entering precipitation. By the end of the reaction, the proportion of magnesium ions entering precipitation in the −0.4 V experimental group reaches 50%, resulting in a precipitate with a chemical formula of Ca0.50Mg0.50CO3. In the OC group, the proportion of magnesium ions entering precipitation is 41%, with a precipitate chemical formula of Ca0.59Mg0.41CO3.
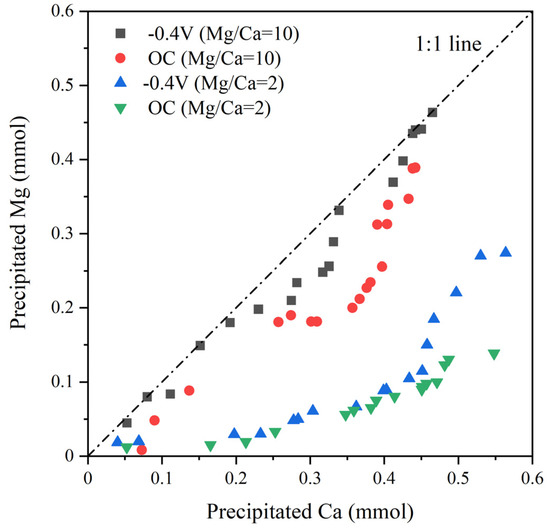
Figure 7.
Aqueous chemistry data of precipitated Mg vs. precipitated Ca.
When the Mg/Ca ratio is 2, in the initial phase of the reaction, the proportion of magnesium ions entering precipitation in both experimental groups is around 10% to 15%. In the latter phase of the reaction, the −0.4 V group exhibits a higher saturation index of dolomite compared to the OC group, indicating a higher rate of magnesium ions entering precipitation. By the end of the reaction, the proportion of magnesium ions entering precipitation in the −0.4 V group reaches 33%, resulting in a precipitate with a chemical formula of Ca0.67Mg0.33CO3. In the OC group, the proportion of magnesium ions entering precipitation is 15%, with a precipitate chemical formula of Ca0.87Mg0.13CO3.
Based on the findings elucidated above, it can be inferred that in systems with varying Mg/Ca ratios, the −0.4 V group has a higher proportion of magnesium ions entering precipitation compared to the open circuit experimental group, and can produce precipitates with a Ca0.5Mg0.5CO3 composition, indicating that simulated photoelectron has a promoting effect on magnesium ion precipitation.
3.4.2. XRD Patterns of Carbonate Mineral Precipitate
In calcite containing 30 mol% MgCO3, the increase in Mg2+ content is linearly correlated with the decrease in interplanar spacing (d) of the (104) plane [40]. This transition is attributed to the substitution of Mg2+ for Ca2+, resulting in a decrease in the unit cell parameters. Similar effects are observed when Fe2+ and Mn2+ substitute for Ca2+ [41]. Zhang et al. [42] developed a curve that can be used to calculate the Ca2+ content of high-Mg calcite (HMC) and very high-Mg calcite (VHMC) based on the shift in the position of the (104) diffraction peak. Natural dolomite typically contains 5 mol% or more of CaCO3, and these dolomites are different from ideal dolomite as they have larger unit cells [43]. Lumsden [44] established an equation for calculating the Ca content in dolomite based on the shift of the (104) diffraction peak. The equation is given by:
where is the molar percentage of CaCO3, and d is the measured d-value of the (104) diffraction peak in Å. However, this method has limitations as it does not consider changes in other substituting cations or ordering of cations [45]. Despite these limitations, the (104) peak shift method [44] remains a useful semi-quantitative method for rapidly determining the Ca/Mg ratio in dolomite.
The (101), (015), and (021) diffraction peaks, which reflect the ordering of Ca and Mg ions in dolomite, are the most prominent features in dolomite XRD patterns, and they can effectively distinguish between the (dolomite) and (calcite) space groups. The degree of cation ordering in dolomite can be qualitatively determined by comparing the intensity of the (110) diffraction peak with that of the (015) diffraction peak [43]. In XRD patterns of dolomite with ordered and stoichiometric compositions, the intensities of these two peaks are nearly equal.
The XRD patterns (Figure 8) of the precipitates reveal that in the OC group with an Mg/Ca ratio of 2, the main precipitate formed is calcite with a d(104) lattice spacing of 3.02 Å. In the −0.4 V group, the main precipitate formed is high-magnesium calcite with a d(104) lattice spacing of 2.99 Å. When the Mg/Ca ratio is increased to 10, the main precipitate formed in the OC group is high-magnesium calcite with a d(104) lattice spacing of 2.95 Å. In the −0.4 V group, the main precipitate formed is proto-dolomite with a d(104) lattice spacing of 2.88 Å, and no diffraction peaks corresponding to ordered arrangement of calcium and magnesium ions, such as (101), (015), and (021), are observed.
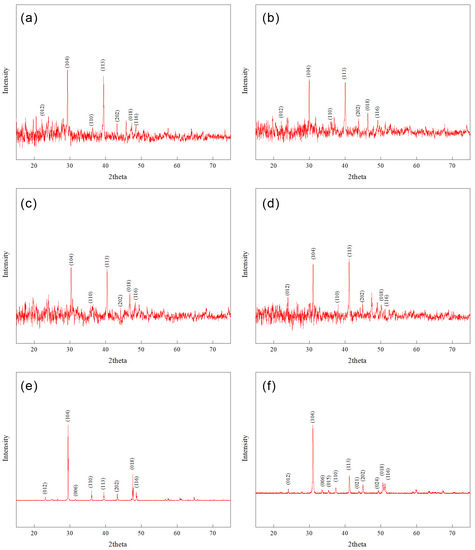
Figure 8.
XRD patterns of precipitate: (a) Mg/Ca = 2, OC, (b) Mg/Ca = 2, −0.4 V; (c) Mg/Ca = 10, OC; (d) Mg/Ca = 10, −0.4 V; (e) reference XRD spectrum of Calcite (RRUFF ID: R040070); (f) reference XRD spectrum of dolomite (RRUFF ID: R050357).
Chemical stoichiometry of the above precipitates was calculated using the formula proposed by Lumsden [44]. The results show that the proportion of magnesium ions in the precipitates is 6%, 16%, 32%, and 50%, respectively. Based on these proportions, the chemical formulas of the precipitates were calculated, as shown in Table 1.

Table 1.
XRD peak positions and interplanar distances of precipitates under different conditions.
The chemical formulas of the precipitates obtained from XRD and solution ion concentration calculations show slight differences, which could be attributed to the incorporation of calcium and magnesium ions into amorphous precipitates or microbial cells. However, both methods yield precipitates with consistent trends under different conditions.
3.4.3. Raman Spectra of Carbonate Mineral Precipitate
Due to the widespread occurrence and strong Raman signals of carbonate minerals, their Raman spectra have been extensively investigated [46,47]. The vibrational modes of carbonate minerals can be categorized into internal vibrations of (CO3)2− groups (600–1700 cm−1) and lattice vibrations involving translations and deformations of (CO3)2− groups with respect to Ca2+ or Mg2+ ions (100–500 cm−1). The vibrational modes of (CO3)2− groups are characterized by symmetric stretching vibrations (600–200 cm−1) and antisymmetric stretching vibrations (1200–1700 cm−1). Calcite spectra exhibit sharp peaks at 1086 cm−1 (ν1, symmetric stretching vibration of (CO3)2− groups), as well as peaks at 156 cm−1, 282 cm−1, and 712 cm−1 (ν4, in-plane bending vibrations of (CO3)2− groups) [48]. Spectra of dolomite are similar to those of calcite. However, due to shorter inter-ionic distances, the vibrational frequencies of all dolomite minerals are higher and accompanied by stronger inter-ionic forces. The layered calcium–magnesium structure of magnesite results in an additional vibrational mode at 335 cm−1, which can be used to distinguish it from all other carbonate minerals.
Borromeo et al. [48] determined the positions of four major vibrational modes in calcite crystals with magnesium content ranging from 0.1% to 19.3%: rotation (152.0–160.0 cm−1), translation (278.0–288.7 cm−1), in-plane bending vibration (711.6–717.1 cm−1), and symmetric stretching vibration (1086.0–1090.8 cm−1). Some samples exhibited a peak at 1013–1015 cm−1, attributed to the presence of HCO3−. The Raman spectra of carbonate minerals are sensitive to the structural and chemical changes that occur when Mg2+ ions replace the larger Ca2+ ions in the calcite lattice, and the positions of vibrational peaks are directly controlled by the magnesium content in the lattice, increasing linearly with increasing magnesium content, reflecting a decrease in atomic spacing after the substitution of Ca2+ ions with smaller Mg2+ ions.
Raman spectra (Figure 9) of the precipitates showed that the −0.4 V group exhibited a characteristic shift of vibrational modes to higher frequencies compared to the OC group, indicating an increase in magnesium content in the lattice for Mg/Ca ratios of 2 and 10 (Table 2). No vibrational modes near 335 cm−1 were detected in any of the four experimental groups, indicating the random ordering of calcium and magnesium ions in the crystals. The Raman spectra exhibited a trend consistent with the XRD results, indicating a significant promoting effect of magnesium ions into carbonate minerals.
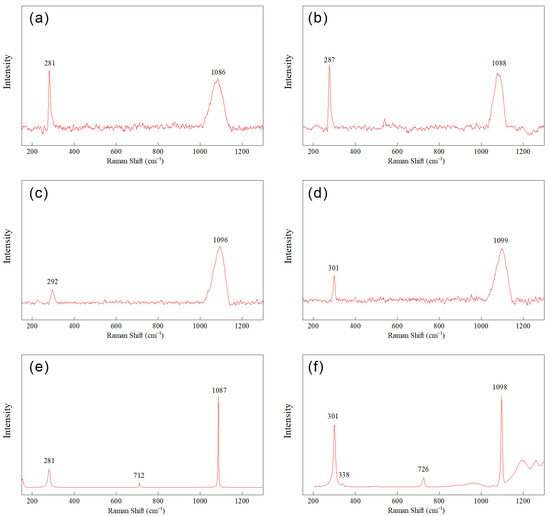
Figure 9.
Raman spectra of precipitates: (a) Mg/Ca = 2, OC; (b) Mg/Ca = 2, −0.4 V; (c) Mg/Ca = 10, OC; (d) Mg/Ca = 10, −0.4 V; (e) reference Raman spectrum of Calcite (RRUFF ID: R040070); (f) reference Raman spectrum of dolomite (RRUFF ID: R050063).
Table 2.
Raman peaks of precipitates under different conditions.
4. Conclusions
In this study, a simulated semiconducting mineral photoelectronic system was constructed using a potentiostat, with four conditions set at −0.2 V, −0.4 V, −0.6 V, and open circuit, to investigate the community succession of microorganisms under the influence of photoelectrons. The pH value of the system increased from 8.0 to approximately 8.5, and the rate of sulfate reduction was significantly enhanced under the influence of simulated photoelectrons. The alpha diversity of the microbial community decreased, and the evolution of the microbial community structure exhibited directionality. The semiconducting mineral photoelectronic system had a promoting effect on the enrichment of sulfate-reducing bacteria, mainly Desulfovibrio.
Under the regulation of photoelectrons, sulfate-reducing bacteria can effectively oxidize organic matter and reduce sulfate in the environment. As a result, pH and concentration of dissolved inorganic carbon greatly increased. When the pH increases to above 9, the dissolved inorganic carbon transitions from HCO3− to CO32−. Due to its larger translational and vibrational energy, CO32− can better replace the water dipole associated with Mg2+, promoting the precipitation of Mg. Under the regulation of photoelectrons, proto-dolomite can be formed at a relatively low Mg/Ca ratio (Figure 10). This process has important implications for carbon and sulfur element cycling in estuarine and oceanic photic zones, and provides a new explanation for the formation of large amounts of dolomite in geological history.
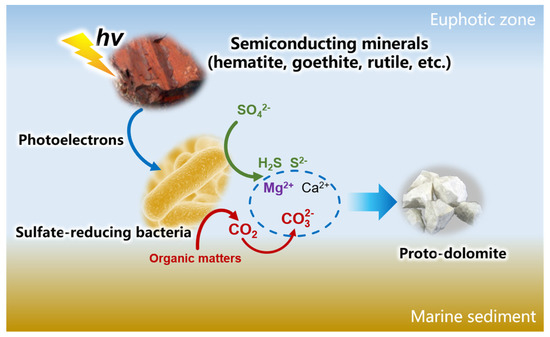
Figure 10.
Diagram of photoelectron regulation on dolomite precipitation in marine sediments.
Author Contributions
Conceptualization, A.L. and H.D.; methodology, Y.S., F.L. and H.D.; software, F.L.; formal analysis, Y.S. and F.L.; investigation, Y.S. and J.L.; resources, Y.S., J.L. and L.C.; writing—original draft, Y.S.; writing—review and editing, F.L., A.L. and Y.L.; supervision, A.L. and H.D.; project administration, A.L.; funding acquisition, A.L. All authors have read and agreed to the published version of the manuscript.
Funding
This research was funded by National Natural Science Foundation of China (92251301), (91851208), (42102340).
Data Availability Statement
All sequences were submitted to NCBI under SRA Accession No. PRJNA975218.
Conflicts of Interest
The authors declare no conflict of interest.
References
- Sibley, D.F.; Gregg, J.M. Classification of Dolomite Rock Textures. J. Sediment. Res. 1987, 57, 967–975. [Google Scholar]
- Wang, H.-l.; Gao, X.-z.; Yang, D.-x.; Li, H.; Zhang, Z.-y.; Wang, X. Distribution Characteristics and Controlling Factors of the Lower Cretaceous Lacustrine Dolomitic Rock in Erlian Basin. Geoscience 2014, 28, 163. [Google Scholar]
- Kuang, L.; Yong, T.; Dewen, L.; Chang, Q.; Ouyang, M.; Lianhua, H.; Deguang, L. Formation Conditions and Exploration Potential of Tight Oil in the Permian Saline Lacustrine Dolomitic Rock, Junggar Basin, NW China. Pet. Explor. Dev. 2012, 39, 700–711. [Google Scholar] [CrossRef]
- McCormack, J.; Bontognali, T.R.; Immenhauser, A.; Kwiecien, O. Controls on Cyclic Formation of Quaternary Early Diagenetic Dolomite. Geophys. Res. Lett. 2018, 45, 3625–3634. [Google Scholar] [CrossRef]
- Given, R.K.; Wilkinson, B.H. Dolomite Abundance and Stratigraphic Age; Constraints on Rates and Mechanisms of Phanerozoic Dolostone Formation. J. Sediment. Res. 1987, 57, 1068–1078. [Google Scholar] [CrossRef]
- Hardie, L.A. Secular Variation in Seawater Chemistry: An Explanation for the Coupled Secular Variation in the Mineralogies of Marine Limestones and Potash Evaporites over the Past 600 My. Geology 1996, 24, 279–283. [Google Scholar] [CrossRef]
- Holland, H.D.; Horita, J.; Seyfried, W.E., Jr. On the Secular Variations in the Composition of Phanerozoic Marine Potash Evaporites. Geology 1996, 24, 993–996. [Google Scholar] [CrossRef]
- Burns, S.J.; Mckenzie, J.A.; Vasconcelos, C. Dolomite Formation and Biogeochemical Cycles in the Phanerozoic. Sedimentology 2000, 47, 49–61. [Google Scholar] [CrossRef]
- Vasconcelos, C.; McKenzie, J.A.; Bernasconi, S.; Grujic, D.; Tiens, A.J. Microbial Mediation as a Possible Mechanism for Natural Dolomite Formation at Low Temperatures. Nature 1995, 377, 220–222. [Google Scholar] [CrossRef]
- Nielsen, P.; Swennen, R.; Dickson, J.A.D.; Fallick, A.E.; Keppens, E. Spheroidal Dolomites in a Visean Karst System–Bacterial Induced Origin? Sedimentology 1997, 44, 177–195. [Google Scholar] [CrossRef]
- Khalaf, F.I. Occurrence of Phreatic Dolocrete within Tertiary Clastic Deposits of Kuwait, Arabian Gulf. Sediment. Geol. 1990, 68, 223–239. [Google Scholar] [CrossRef]
- El-Sayed, M.I.; Fairchild, I.J.; Spiro, B. Kuwaiti Dolocrete: Petrology, Geochemistry and Groundwater Origin. Sediment. Geol. 1991, 73, 59–75. [Google Scholar] [CrossRef]
- Vasconcelos, C.; McKenzie, J.A. Microbial Mediation of Modern Dolomite Precipitation and Diagenesis under Anoxic Conditions (Lagoa Vermelha, Rio de Janeiro, Brazil). J. Sediment. Res. 1997, 67, 378–390. [Google Scholar]
- Shen, Y.; Buick, R. The Antiquity of Microbial Sulfate Reduction. Earth-Sci. Rev. 2004, 64, 243–272. [Google Scholar] [CrossRef]
- Canfield, D.E.; Des Marais, D.J. Biogeochemical Cycles of Carbon, Sulfur, and Free Oxygen in a Microbial Mat. Geochim. Cosmochim. Acta 1993, 57, 3971–3984. [Google Scholar] [CrossRef]
- Baker, P.A.; Kastner, M. Constraints on the Formation of Sedimentary Dolomite. Science 1981, 213, 214–216. [Google Scholar] [CrossRef]
- Brady, P.V.; Krumhansl, J.L.; Papenguth, H.W. Surface Complexation Clues to Dolomite Growth. Geochim. Cosmochim. Acta 1996, 60, 727–731. [Google Scholar] [CrossRef]
- Sánchez-Román, M.; McKenzie, J.A.; de Luca Rebello Wagener, A.; Rivadeneyra, M.A.; Vasconcelos, C. Presence of Sulfate Does Not Inhibit Low-Temperature Dolomite Precipitation. Earth Planet. Sci. Lett. 2009, 285, 131–139. [Google Scholar] [CrossRef]
- Deng, S.; Dong, H.; Lv, G.; Jiang, H.; Yu, B.; Bishop, M.E. Microbial Dolomite Precipitation Using Sulfate Reducing and Halophilic Bacteria: Results from Qinghai Lake, Tibetan Plateau, NW China. Chem. Geol. 2010, 278, 151–159. [Google Scholar] [CrossRef]
- Melim, L.A.; Scholle, P.A. Dolomitization of the Capitan Formation Forereef Facies (Permian, West Texas and New Mexico): Seepage Reflux Revisited. Sedimentology 2002, 49, 1207–1227. [Google Scholar] [CrossRef]
- Kenward, P.A.; Fowle, D.A.; Goldstein, R.H.; Ueshima, M.; González, L.A.; Roberts, J.A. Ordered Low-Temperature Dolomite Mediated by Carboxyl-Group Density of Microbial Cell Walls. AAPG Bull. 2013, 97, 2113–2125. [Google Scholar] [CrossRef]
- Roberts, J.A.; Kenward, P.A.; Fowle, D.A.; Goldstein, R.H.; González, L.A.; Moore, D.S. Surface Chemistry Allows for Abiotic Precipitation of Dolomite at Low Temperature. Proc. Natl. Acad. Sci. USA 2013, 110, 14540–14545. [Google Scholar] [CrossRef]
- Wingender, J.; Neu, T.R.; Flemming, H.-C. What Are Bacterial Extracellular Polymeric Substances? Springer: Berlin/Heidelberg, Germany, 1999. [Google Scholar]
- Alibrahim, A.; Al-Gharabally, D.; Mahmoud, H.; Dittrich, M. Proto-Dolomite Formation in Microbial Consortia Dominated by Halomonas Strains. Extremophiles 2019, 23, 765–781. [Google Scholar] [CrossRef]
- Sun, Y.; Ren, G.; Liu, Y.; Liu, J.; Li, Y.; Lu, A.; Ding, H. Mineral Composition and Photochemical Reactivity of Suspended Particulate Matters in the Euphotic Zones of China’s Nearshore and Estuarine Regions. Minerals 2023, 13, 552. [Google Scholar] [CrossRef]
- Liu, J.; Sun, Y.; Lu, A.; Liu, Y.; Ren, G.; Li, Y.; Li, Y.; Ding, H. Extracellular Electron Transfer of Electrochemically Active Bacteria Community Promoted by Semiconducting Minerals with Photo-Response in Marine Euphotic Zone. Geomicrobiol. J. 2021, 38, 329–339. [Google Scholar] [CrossRef]
- Lu, A.; Li, Y.; Jin, S.; Wang, X.; Wu, X.-L.; Zeng, C.; Li, Y.; Ding, H.; Hao, R.; Lv, M.; et al. Growth of Non-Phototrophic Microorganisms Using Solar Energy through Mineral Photocatalysis. Nat. Commun. 2012, 3, 768. [Google Scholar] [CrossRef]
- Ren, G.; Sun, Y.; Ding, Y.; Lu, A.; Li, Y.; Wang, C.; Ding, H. Enhancing Extracellular Electron Transfer between Pseudomonas Aeruginosa PAO1 and Light Driven Semiconducting Birnessite. Bioelectrochemistry 2018, 123, 233–240. [Google Scholar] [CrossRef]
- Ren, G.; Yan, Y.; Sun, M.; Wang, X.; Wu, X.; Li, Y.; Lu, A.; Ding, H. Considerable Bacterial Community Structure Coupling with Extracellular Electron Transfer at Karst Area Stone in Yunnan, China. Geomicrobiol. J. 2018, 35, 424–431. [Google Scholar] [CrossRef]
- Liu, Y.; Sun, Y.; Ding, H.; Ren, G.; Lu, A.; Li, Y. Photoelectron Shaping Marine Microbial Compositional and Metabolic Variation in the Photic Zone Around Estuary and Offshore Area of Yellow Sea, China. Geomicrobiol. J. 2020, 37, 716–725. [Google Scholar] [CrossRef]
- Sakimoto, K.K.; Wong, A.B.; Yang, P. Self-Photosensitization of Nonphotosynthetic Bacteria for Solar-to-Chemical Production. Science 2016, 351, 74–77. [Google Scholar] [CrossRef]
- Callahan, B.J.; McMurdie, P.J.; Rosen, M.J.; Han, A.W.; Johnson, A.J.A.; Holmes, S.P. DADA2: High-Resolution Sample Inference from Illumina Amplicon Data. Nat. Methods 2016, 13, 581–583. [Google Scholar] [CrossRef]
- Devereux, R.; He, S.-H.; Doyle, C.L.; Orkland, S.; Stahl, D.A.; LeGall, J.; Whitman, W.B. Diversity and Origin of Desulfovibrio Species: Phylogenetic Definition of a Family. J. Bacteriol. 1990, 172, 3609–3619. [Google Scholar] [CrossRef]
- Voordouw, G. The Genus Desulfovibrio: The Centennial. Appl. Environ. Microbiol. 1995, 61, 2813–2819. [Google Scholar] [CrossRef]
- Postgate, J.R. The Sulfate-Reducing Bacteria: Contemporary Perspectives; Springer Science & Business Media: New York, NY, USA, 2013. [Google Scholar]
- Kang, C.S.; Eaktasang, N.; Kwon, D.-Y.; Kim, H.S. Enhanced Current Production by Desulfovibrio Desulfuricans Biofilm in a Mediator-Less Microbial Fuel Cell. Bioresour. Technol. 2014, 165, 27–30. [Google Scholar] [CrossRef]
- Deng, X.; Dohmae, N.; Nealson, K.H.; Hashimoto, K.; Okamoto, A. Multi-Heme Cytochromes Provide a Pathway for Survival in Energy-Limited Environments. Sci. Adv. 2018, 4, eaao5682. [Google Scholar] [CrossRef]
- Deng, X.; Nakamura, R.; Hashimoto, K.; Okamoto, A. Electron Extraction from an Extracellular Electrode by Desulfovibrio ferrophilus Strain IS5 Without Using Hydrogen as an Electron Carrier. Electrochemistry 2015, 83, 529–531. [Google Scholar] [CrossRef]
- Deng, X.; Okamoto, A. Direct Extracellular Electron Transfer to an Indium Tin Doped Oxide Electrode via Heme Redox Reactions in Desulfovibrio Ferrophilus IS5. Electrochim. Acta 2023, 453, 142293. [Google Scholar] [CrossRef]
- Chave, K.E. A Solid Solution between Calcite and Dolomite. J. Geol. 1952, 60, 190–192. [Google Scholar] [CrossRef]
- Goldsmith, J.R.; Graf, D.L.; Joensuu, O.I. The Occurrence of Magnesian Calcites in Nature. Geochim. Cosmochim. Acta 1955, 7, 212–230. [Google Scholar] [CrossRef]
- Zhang, F.; Xu, H.; Konishi, H.; Roden, E.E. A Relationship between D104 Value and Composition in the Calcite-Disordered Dolomite Solid-Solution Series. Am. Mineral. 2010, 95, 1650–1656. [Google Scholar] [CrossRef]
- Goldsmith, J.R.; Graf, D.L. Structural and Compositional Variations in Some Natural Dolomites. J. Geol. 1958, 66, 678–693. [Google Scholar] [CrossRef]
- Lumsden, D.N. Discrepancy between Thin-Section and X-Ray Estimates of Dolomite in Limestone. J. Sediment. Res. 1979, 49, 429–435. [Google Scholar]
- Reeder, R.J.; Sheppard, C.E. Variation of Lattice Parameters in Some Sedimentary Dolomites. Am. Mineral. 1984, 69, 520–527. [Google Scholar]
- Sun, J.; Wu, Z.; Cheng, H.; Zhang, Z.; Frost, R.L. A Raman Spectroscopic Comparison of Calcite and Dolomite. Spectrochim. Acta Part A Mol Biomol. Spectrosc. 2014, 117, 158–162. [Google Scholar] [CrossRef]
- Gunasekaran, S.; Anbalagan, G.; Pandi, S. Raman and Infrared Spectra of Carbonates of Calcite Structure. J. Raman Spectrosc. 2006, 37, 892–899. [Google Scholar] [CrossRef]
- Borromeo, L.; Zimmermann, U.; Andò, S.; Coletti, G.; Bersani, D.; Basso, D.; Gentile, P.; Schulz, B.; Garzanti, E. Raman Spectroscopy as a Tool for Magnesium Estimation in Mg-Calcite: Raman as a Tool for Mg Estimation in Mg-Calcite. J. Raman Spectrosc. 2017, 48, 983–992. [Google Scholar] [CrossRef]
Disclaimer/Publisher’s Note: The statements, opinions and data contained in all publications are solely those of the individual author(s) and contributor(s) and not of MDPI and/or the editor(s). MDPI and/or the editor(s) disclaim responsibility for any injury to people or property resulting from any ideas, methods, instructions or products referred to in the content. |
© 2023 by the authors. Licensee MDPI, Basel, Switzerland. This article is an open access article distributed under the terms and conditions of the Creative Commons Attribution (CC BY) license (https://creativecommons.org/licenses/by/4.0/).