
Chronolgy and Geochemistry of the Sijiaying Iron Deposit in Eastern Hebei Province, North China Craton: Implications for the Genesis of High-Grade Iron Ores


Abstract
:1. Introduction
2. Geological Setting
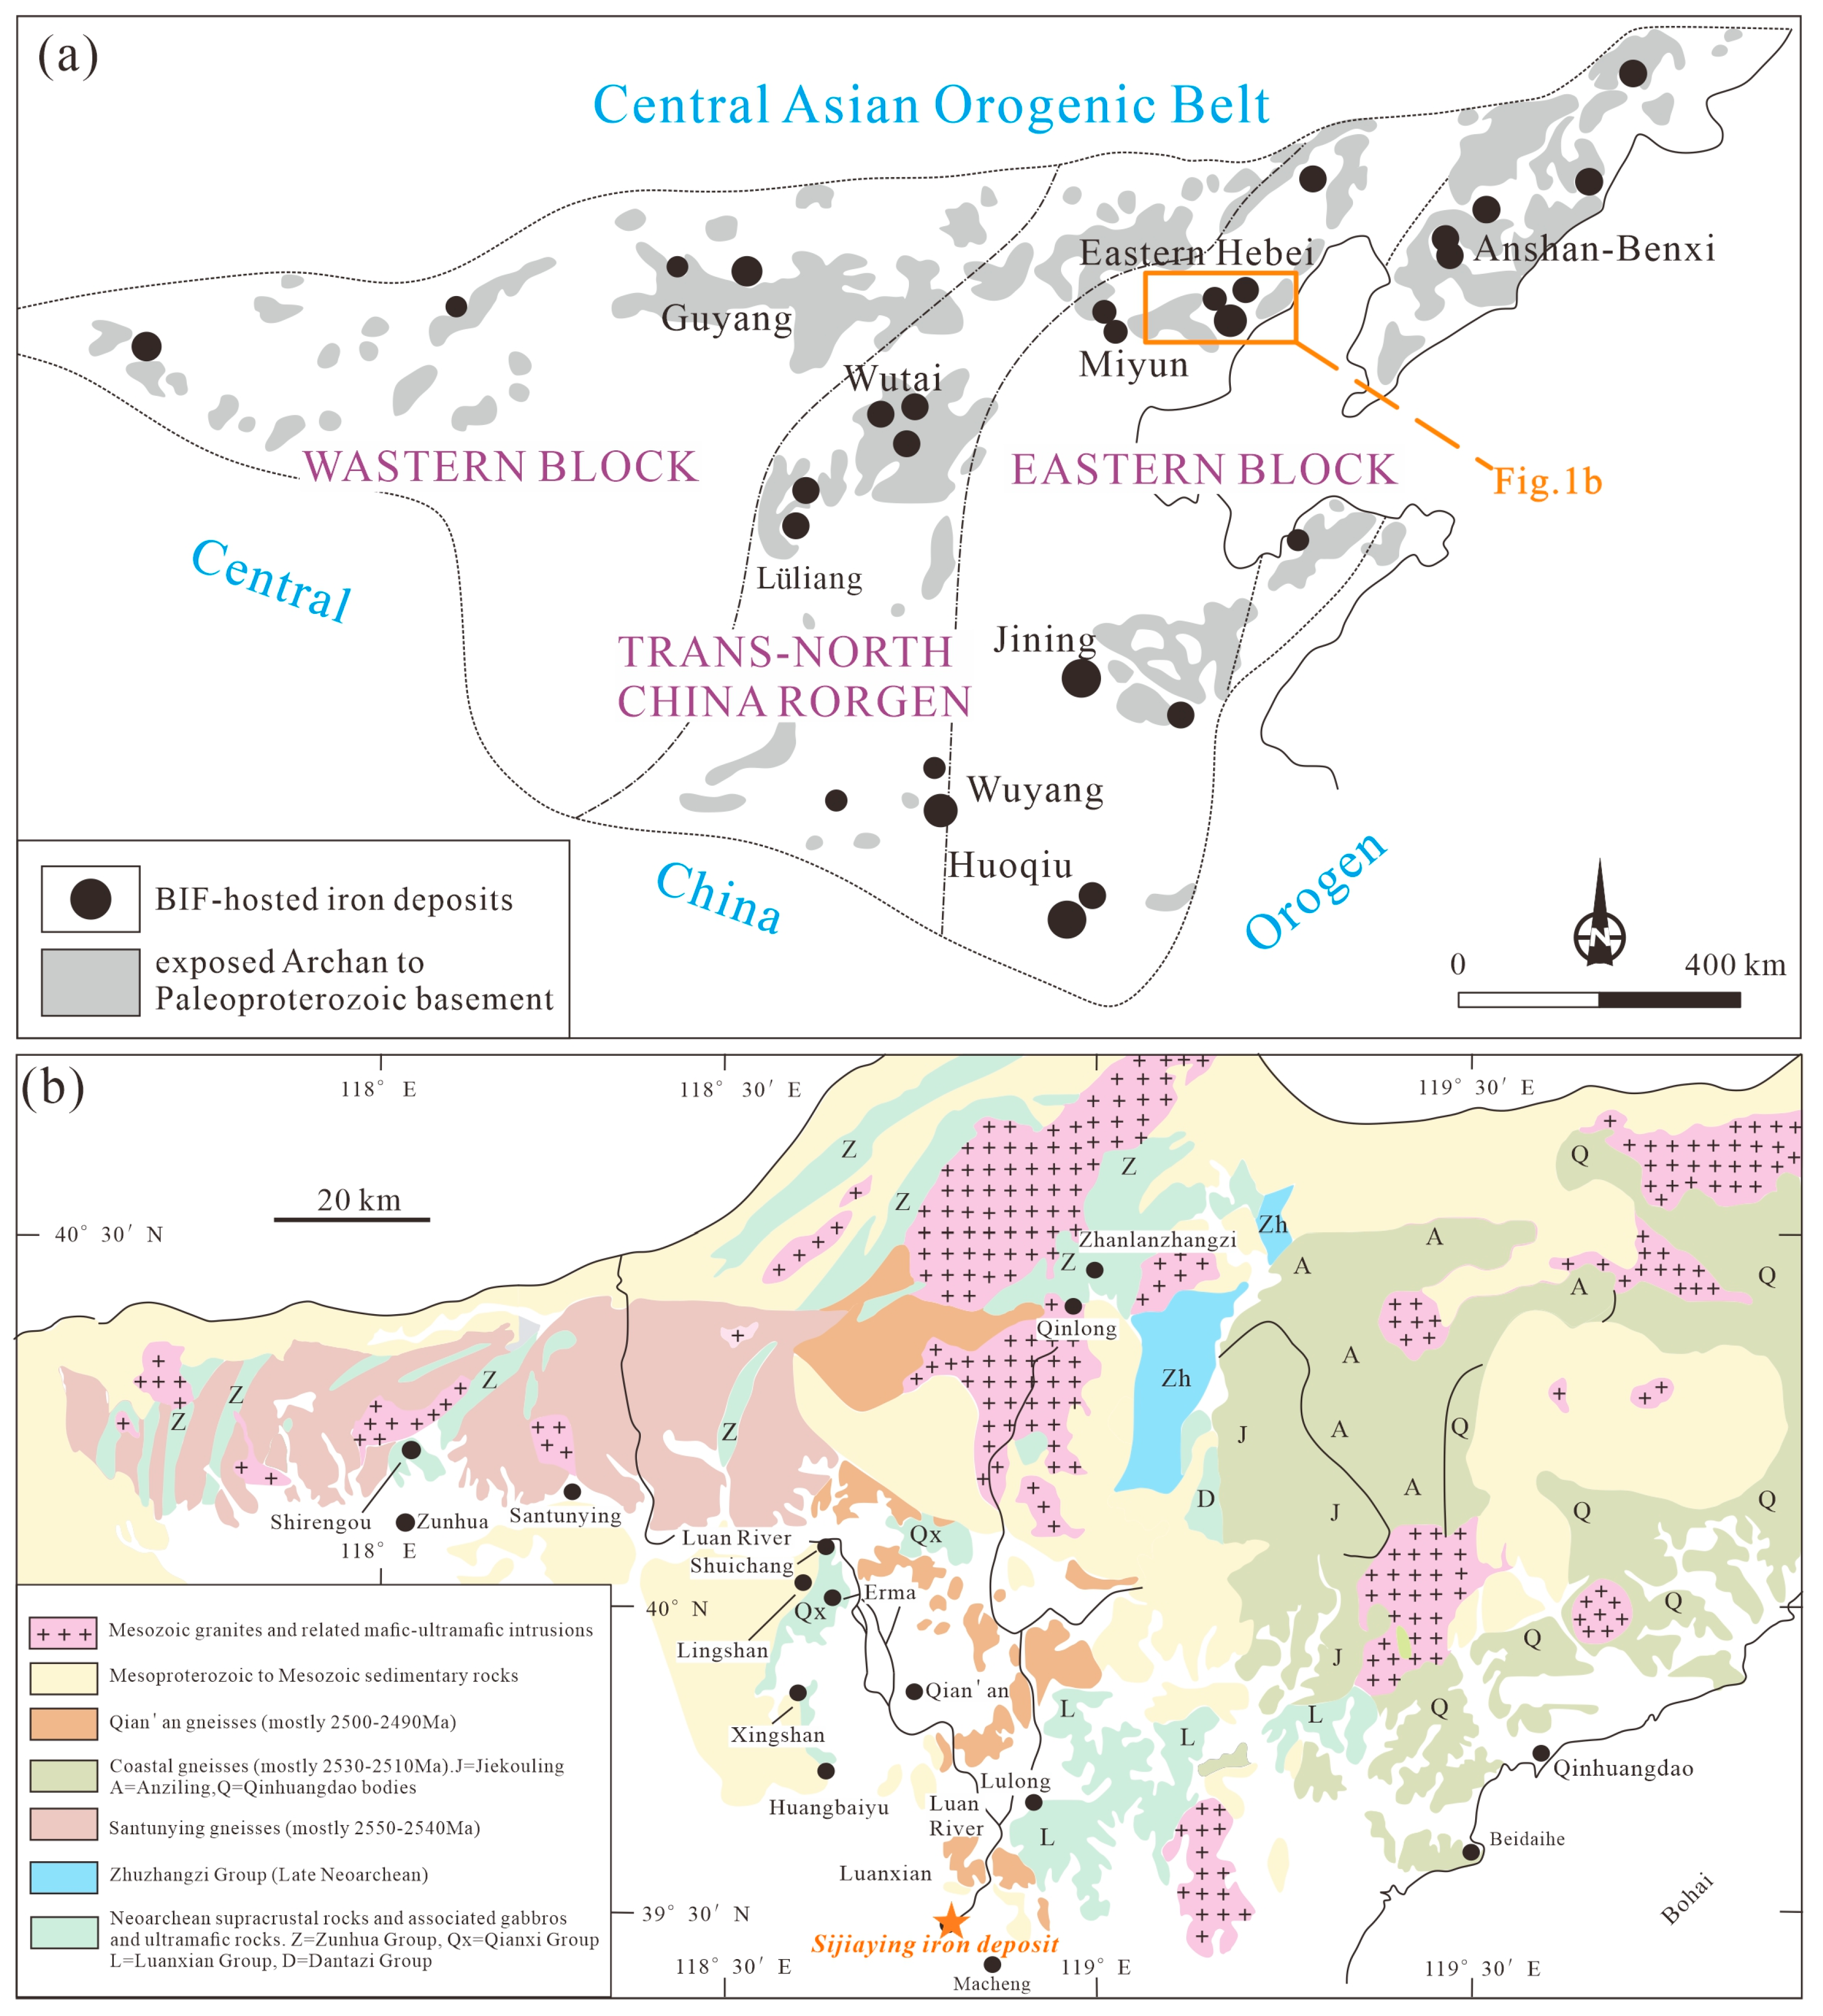
2.1. Regional Geology
2.2. Deposit Geology
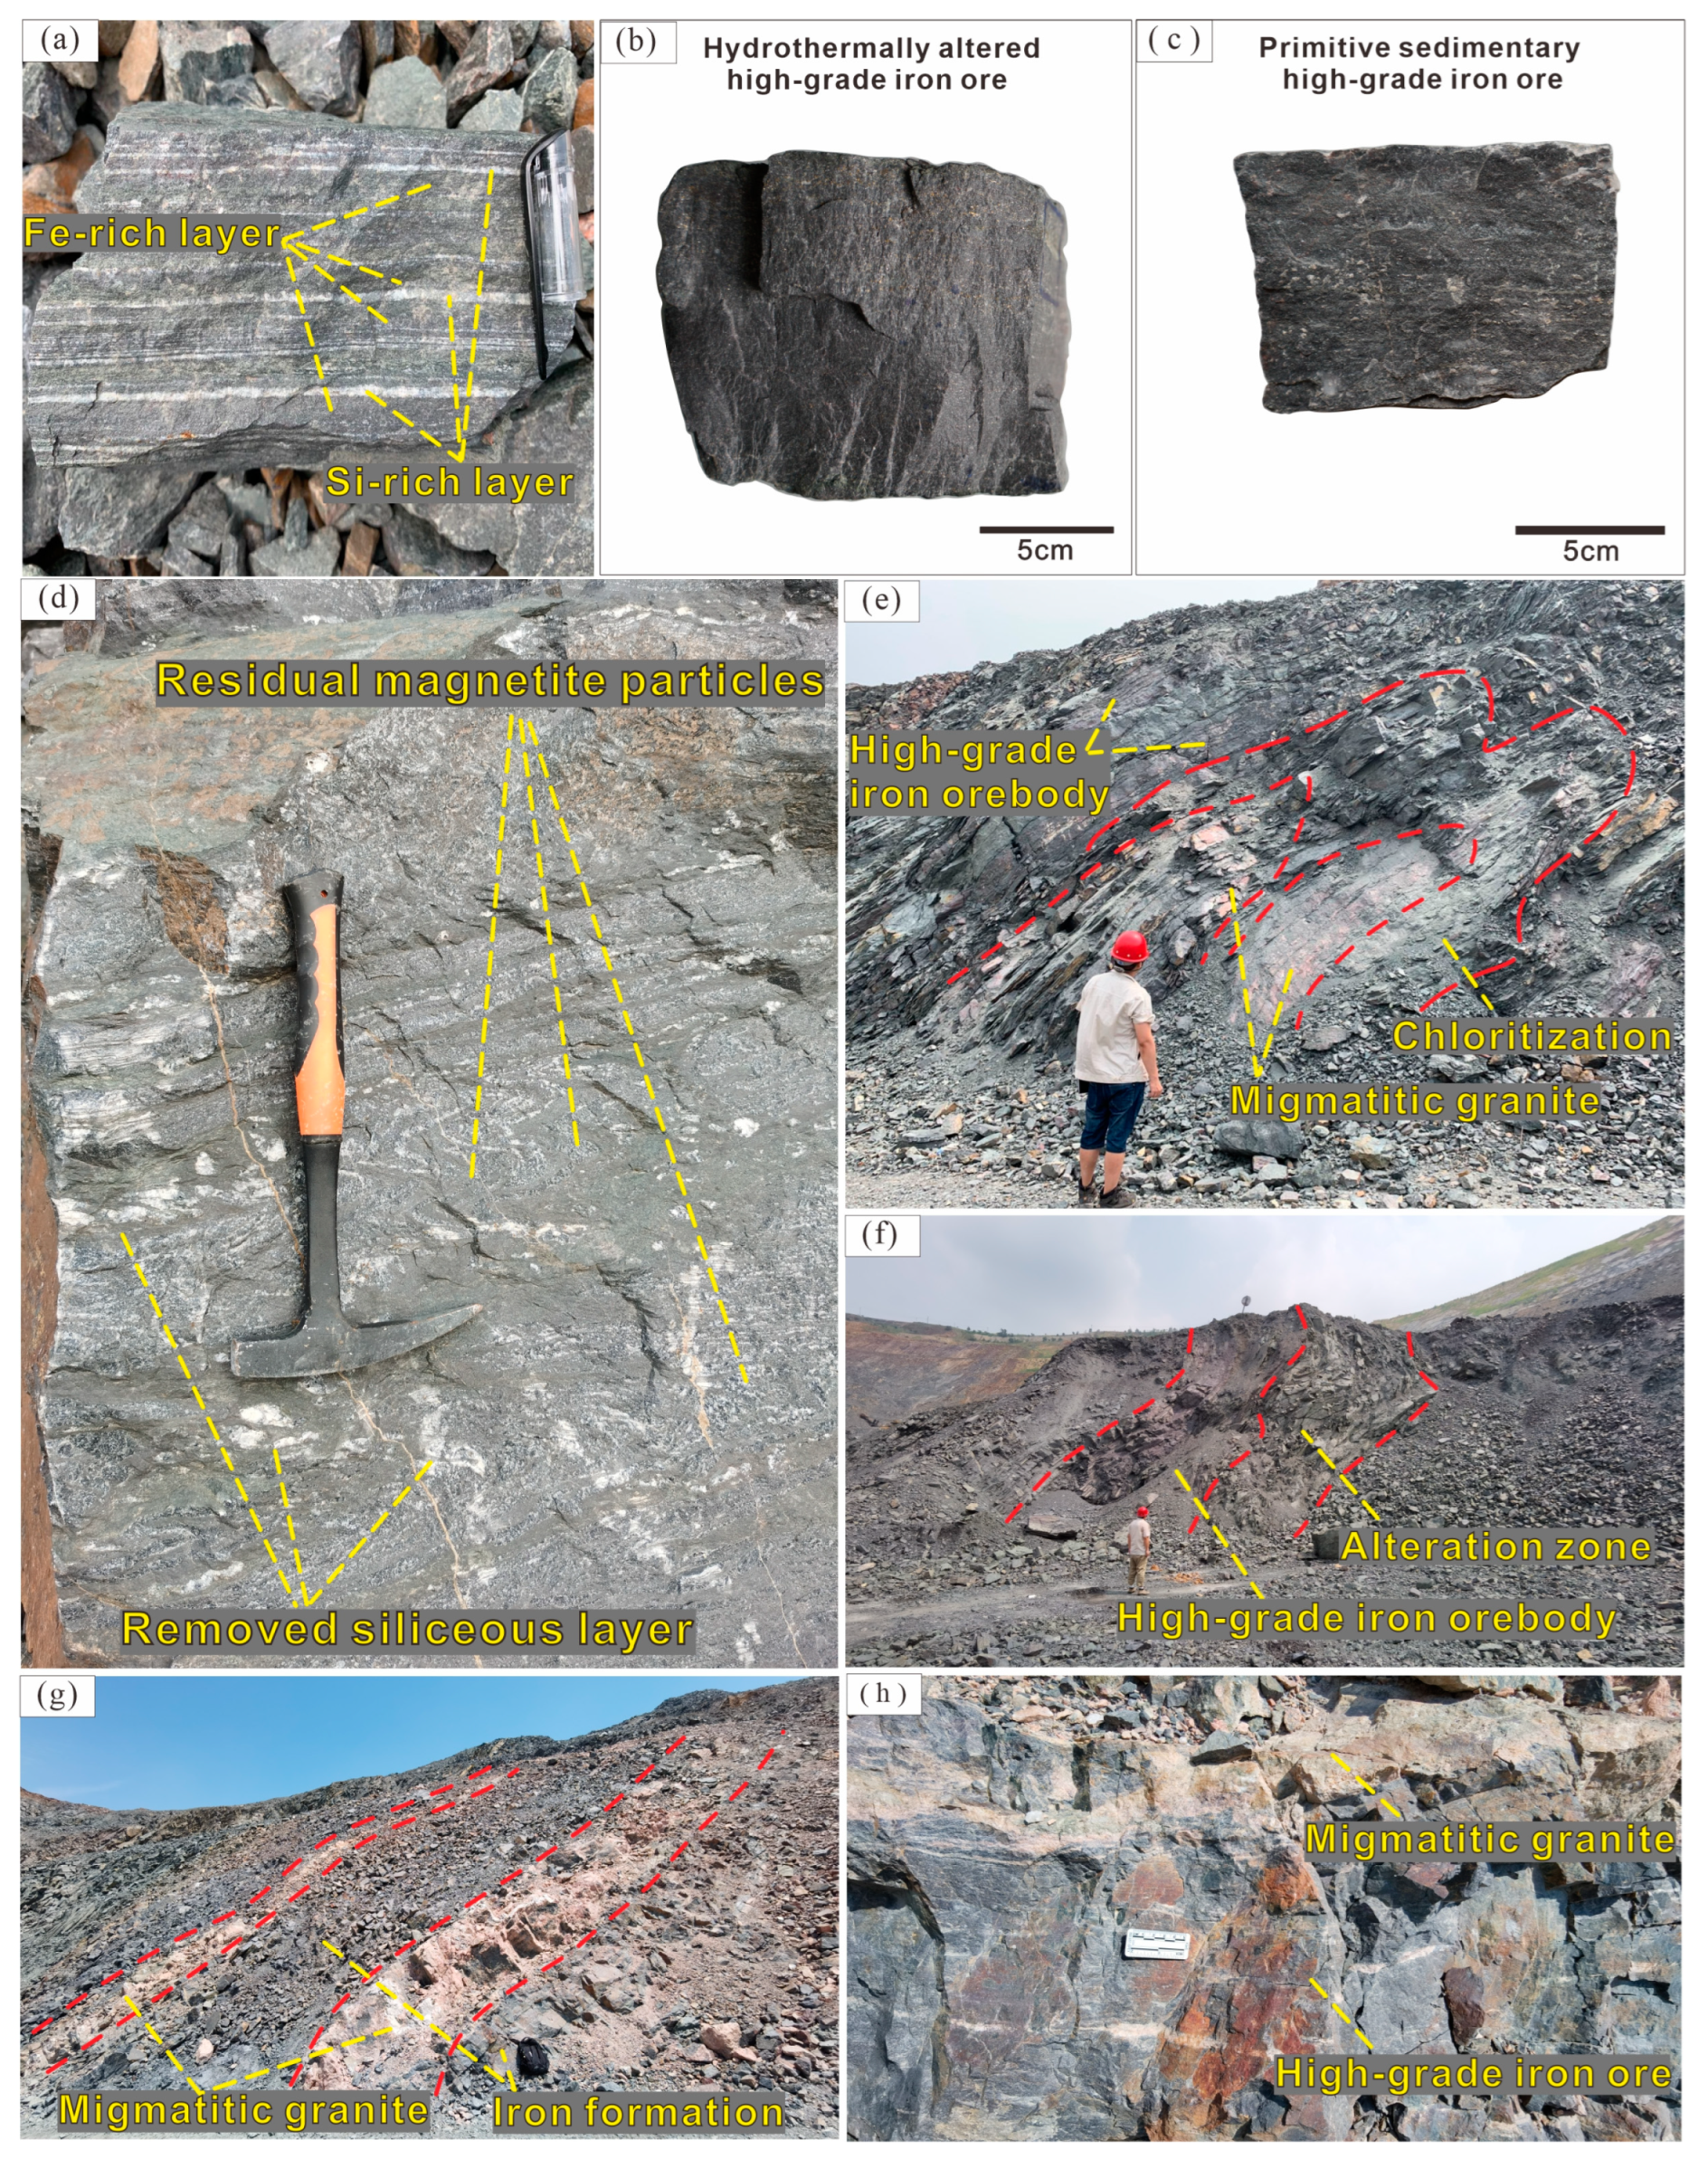
2.2.1. Associated Rocks
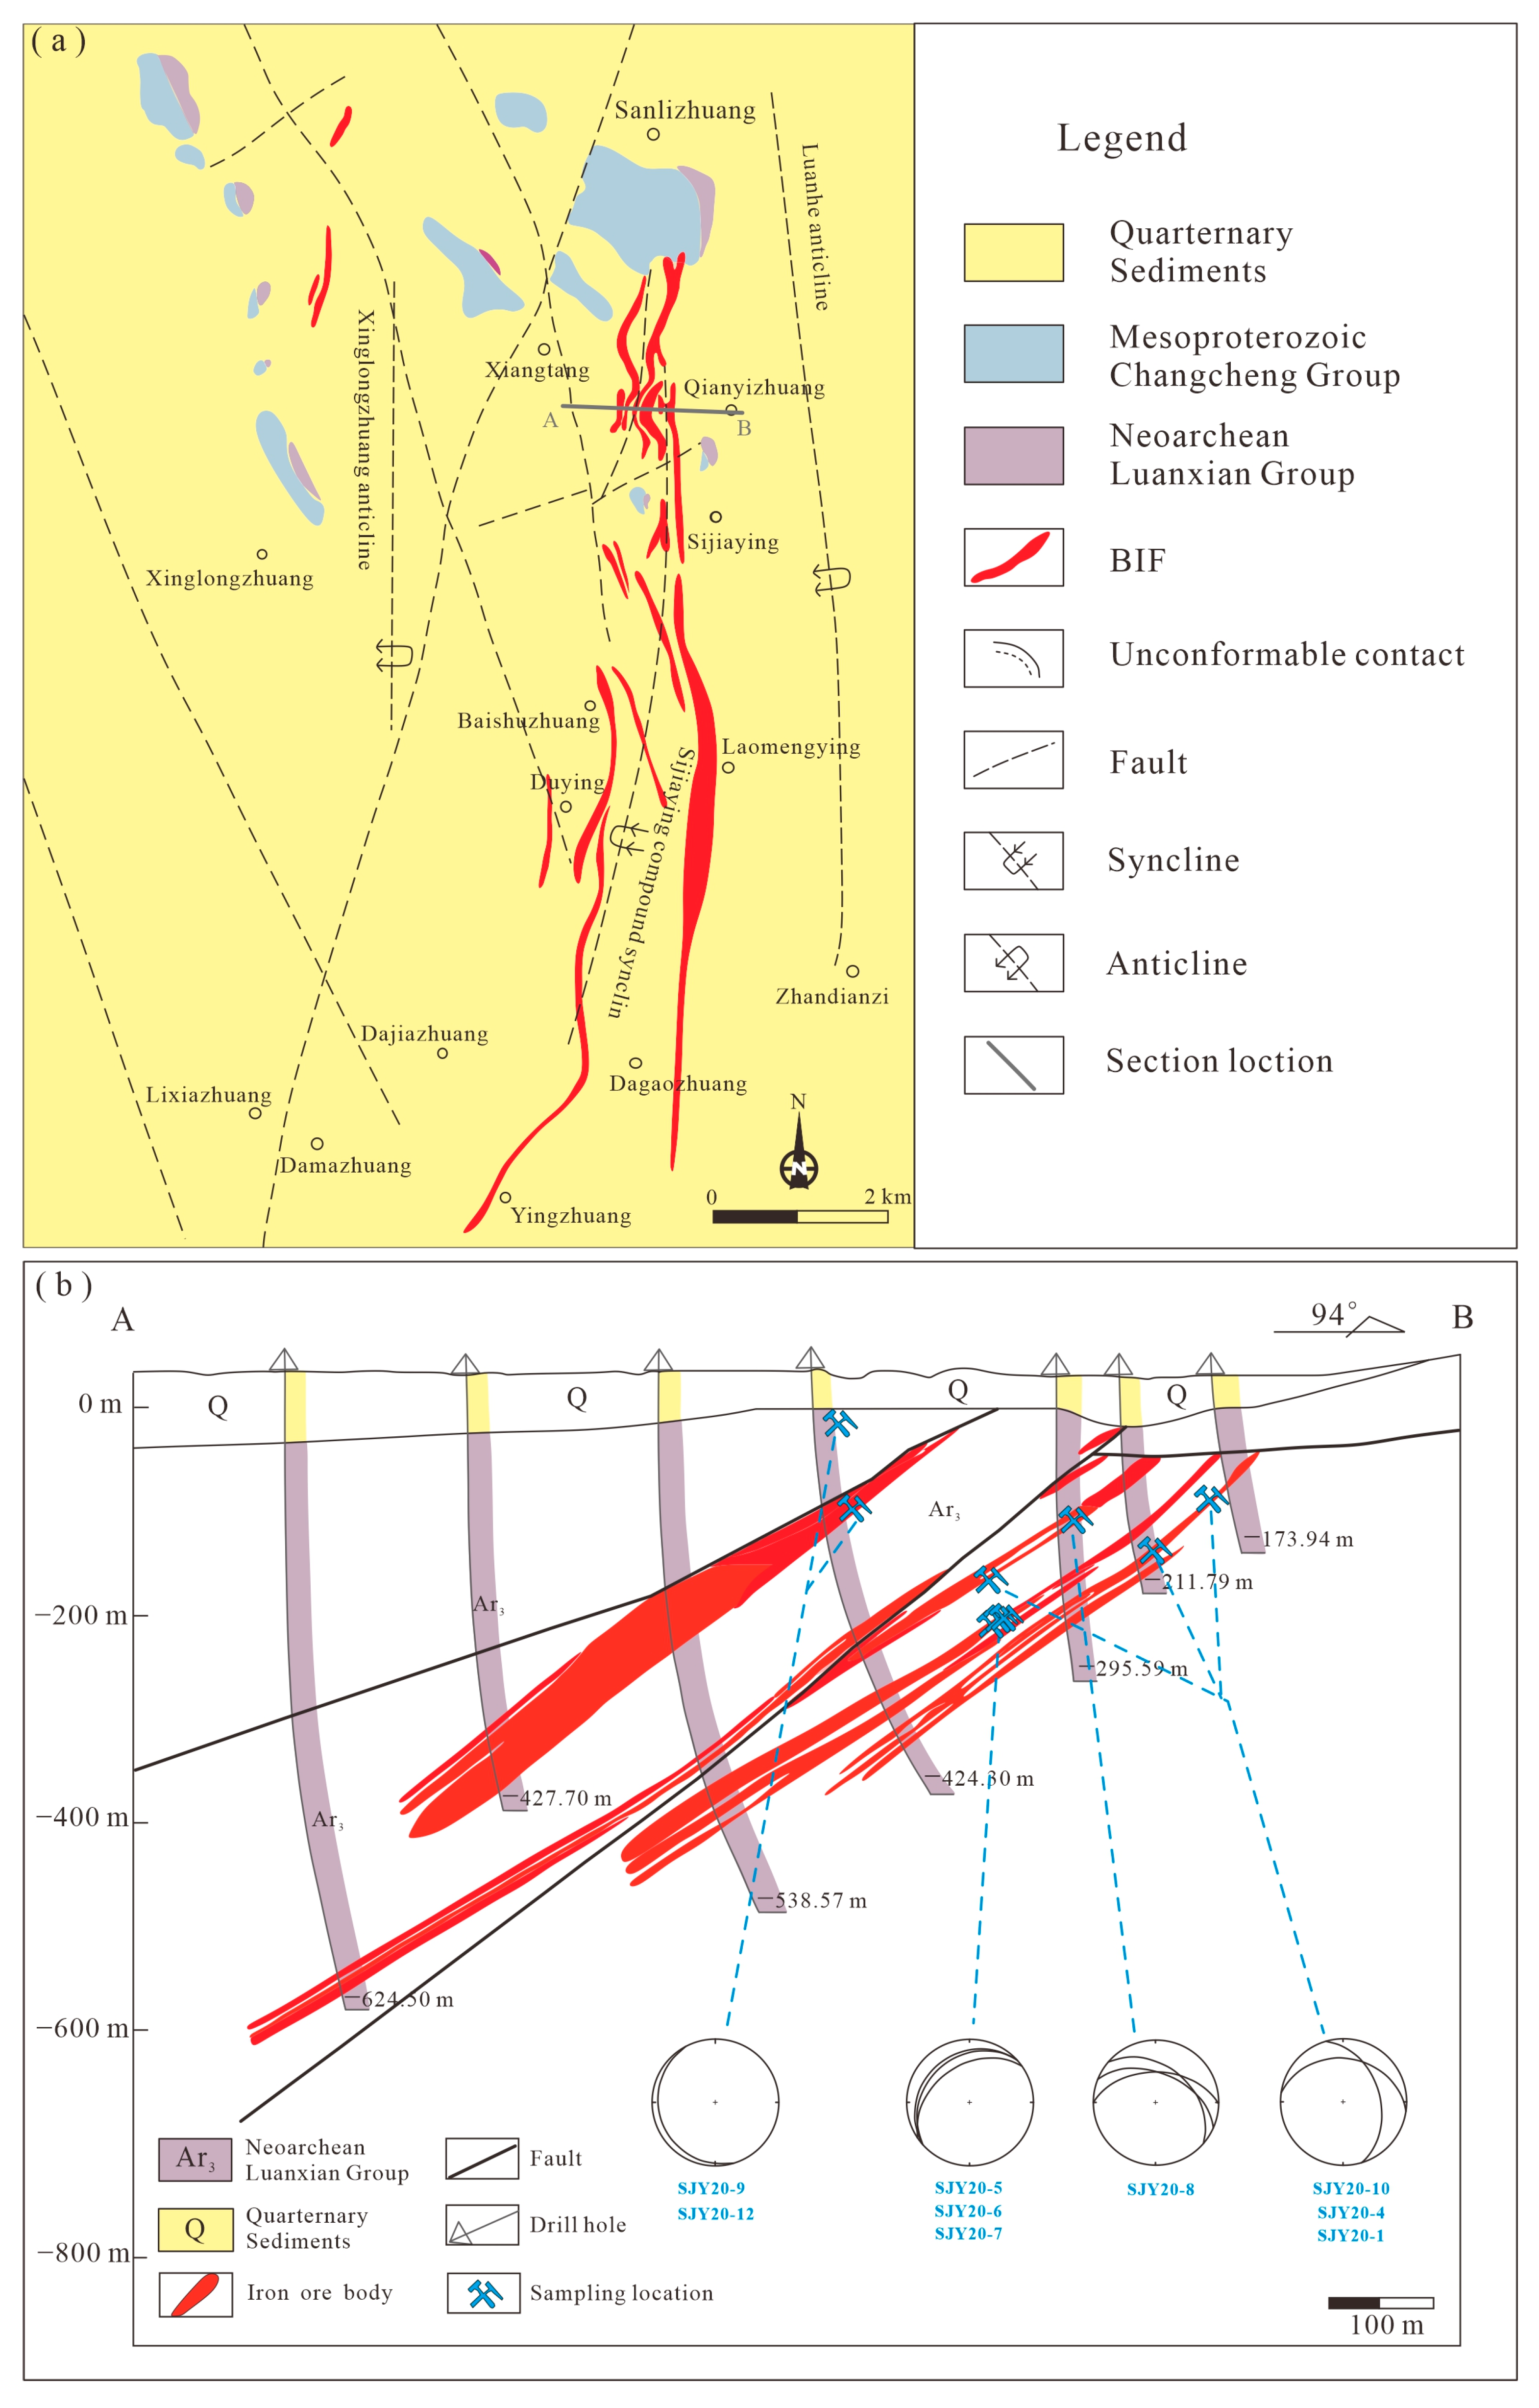
2.2.2. Geometry of Orebodies
2.2.3. Ore Mineralogy
3. Sample and Analytical Techniques
3.1. Sampling
3.1.1. Quartz-Magnetite BIFs
3.1.2. Wall Rock
3.2. Analytical Methods
3.2.1. Whole-Rock Geochemistry
3.2.2. Zircon U–Pb Geochronology
4. Geochemical Results
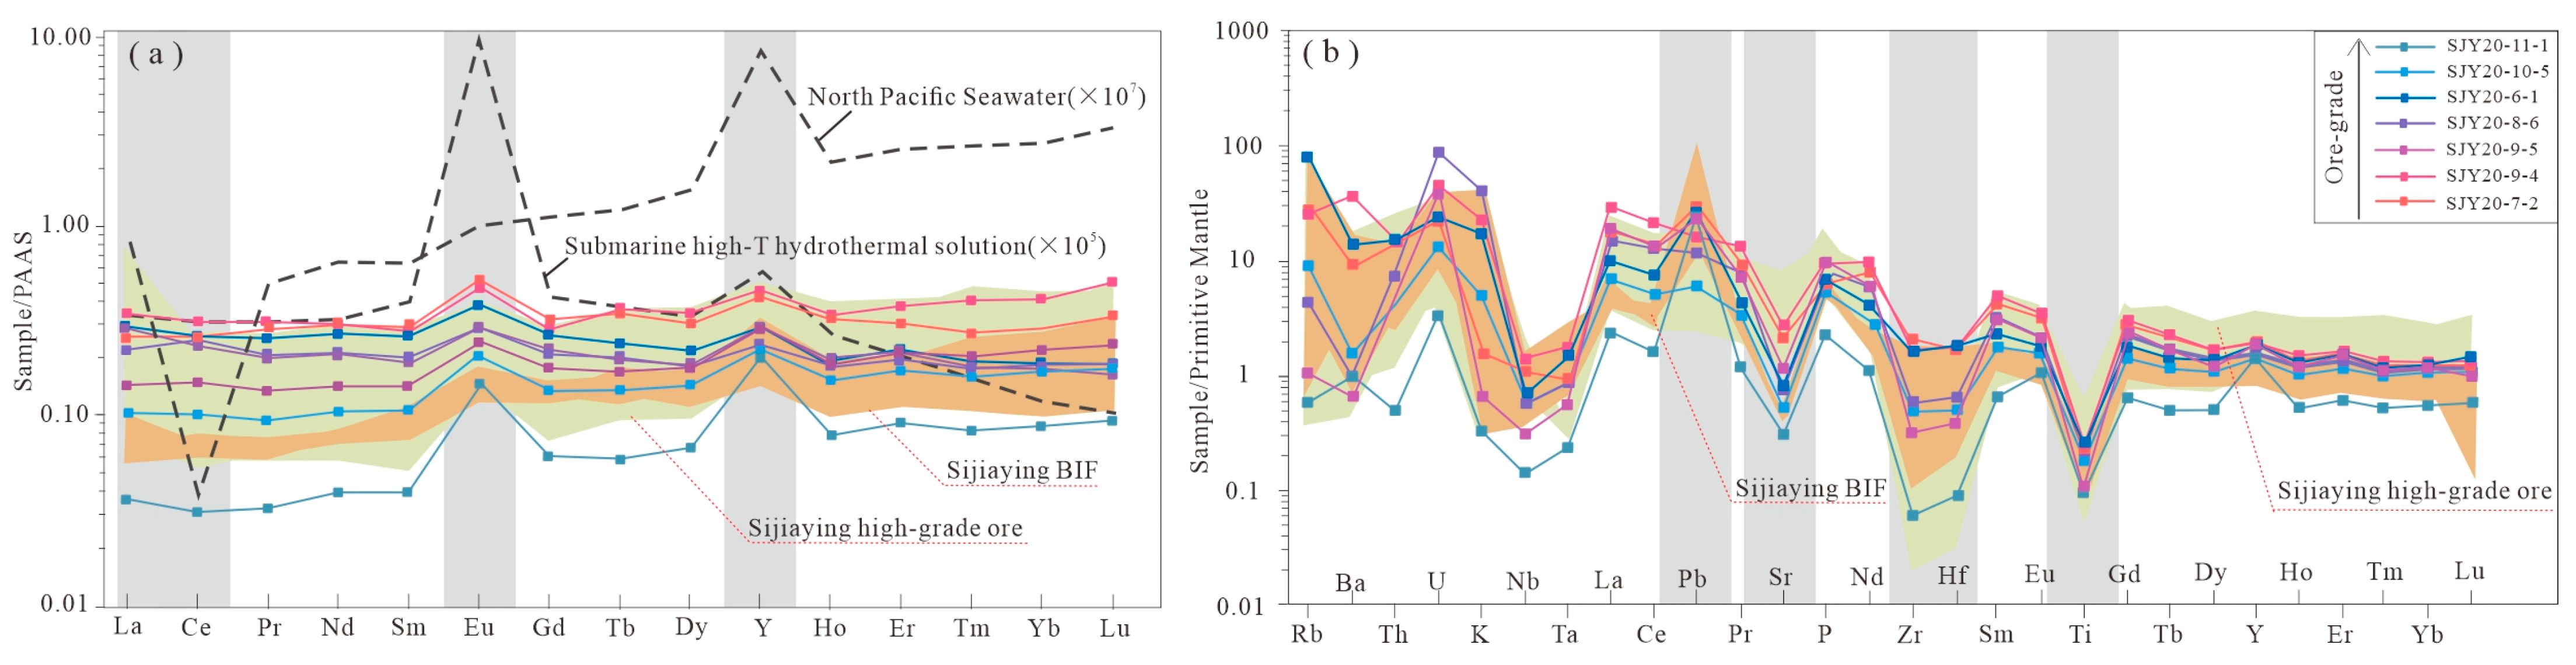
4.1. Iron Ores
4.2. Wall Rock
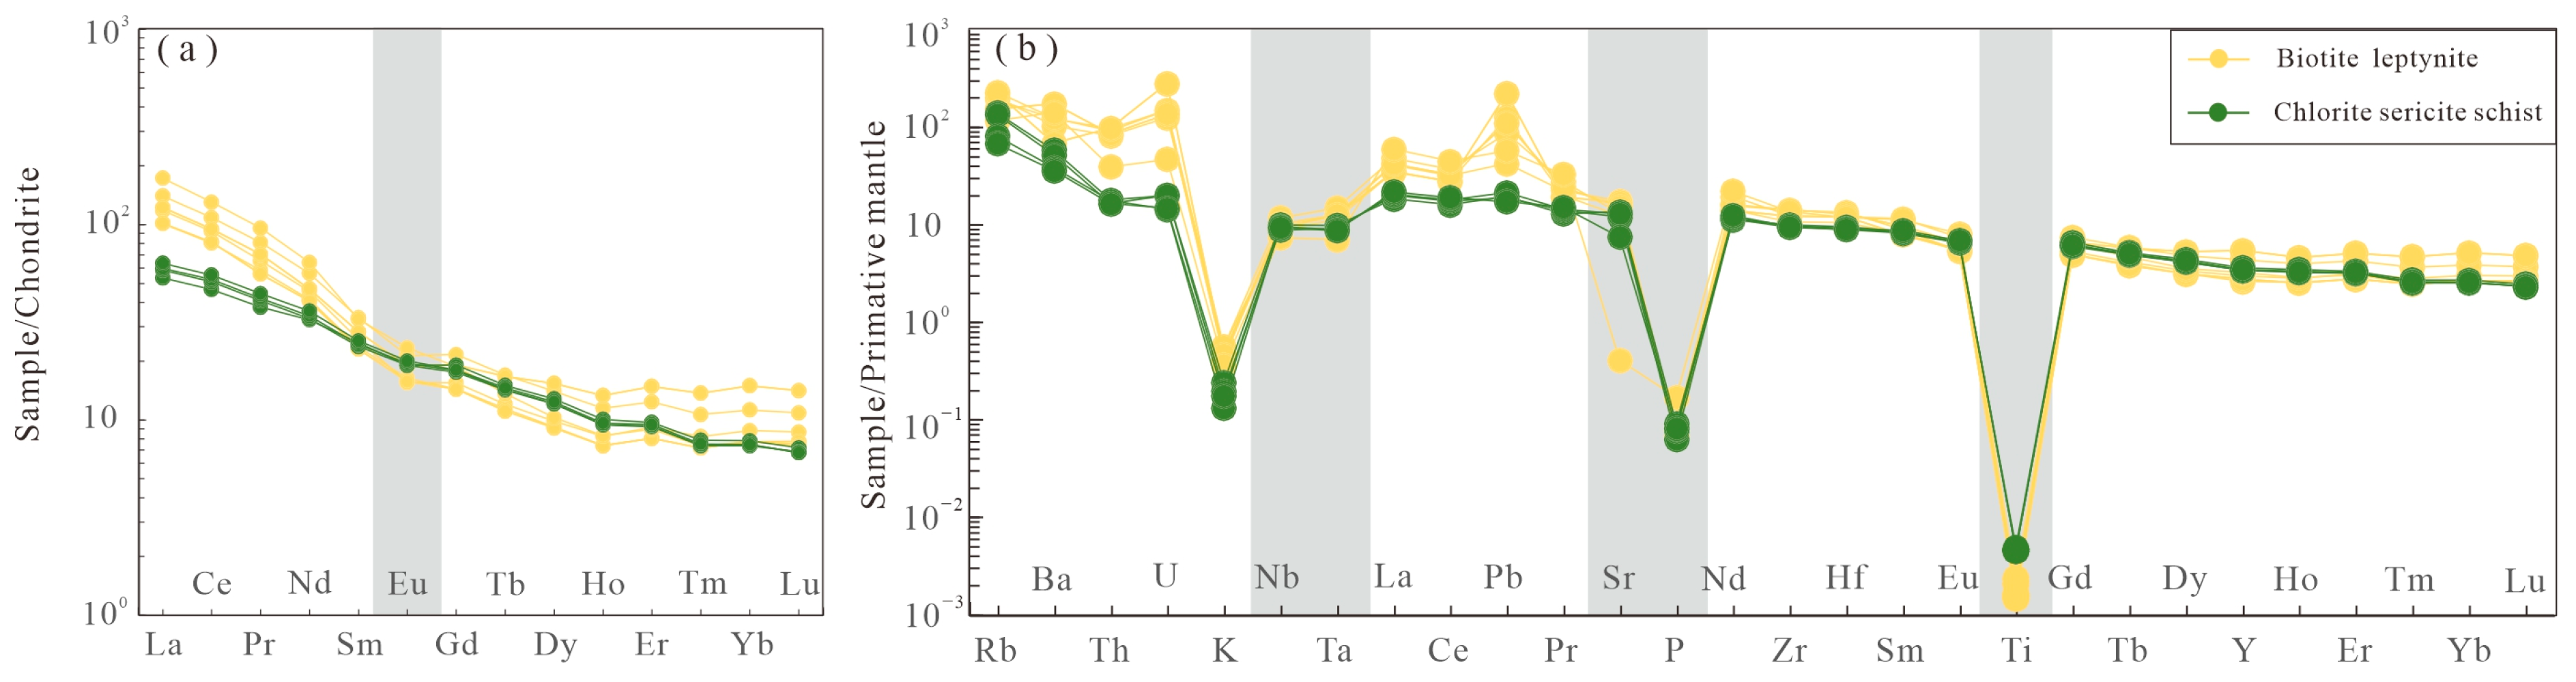
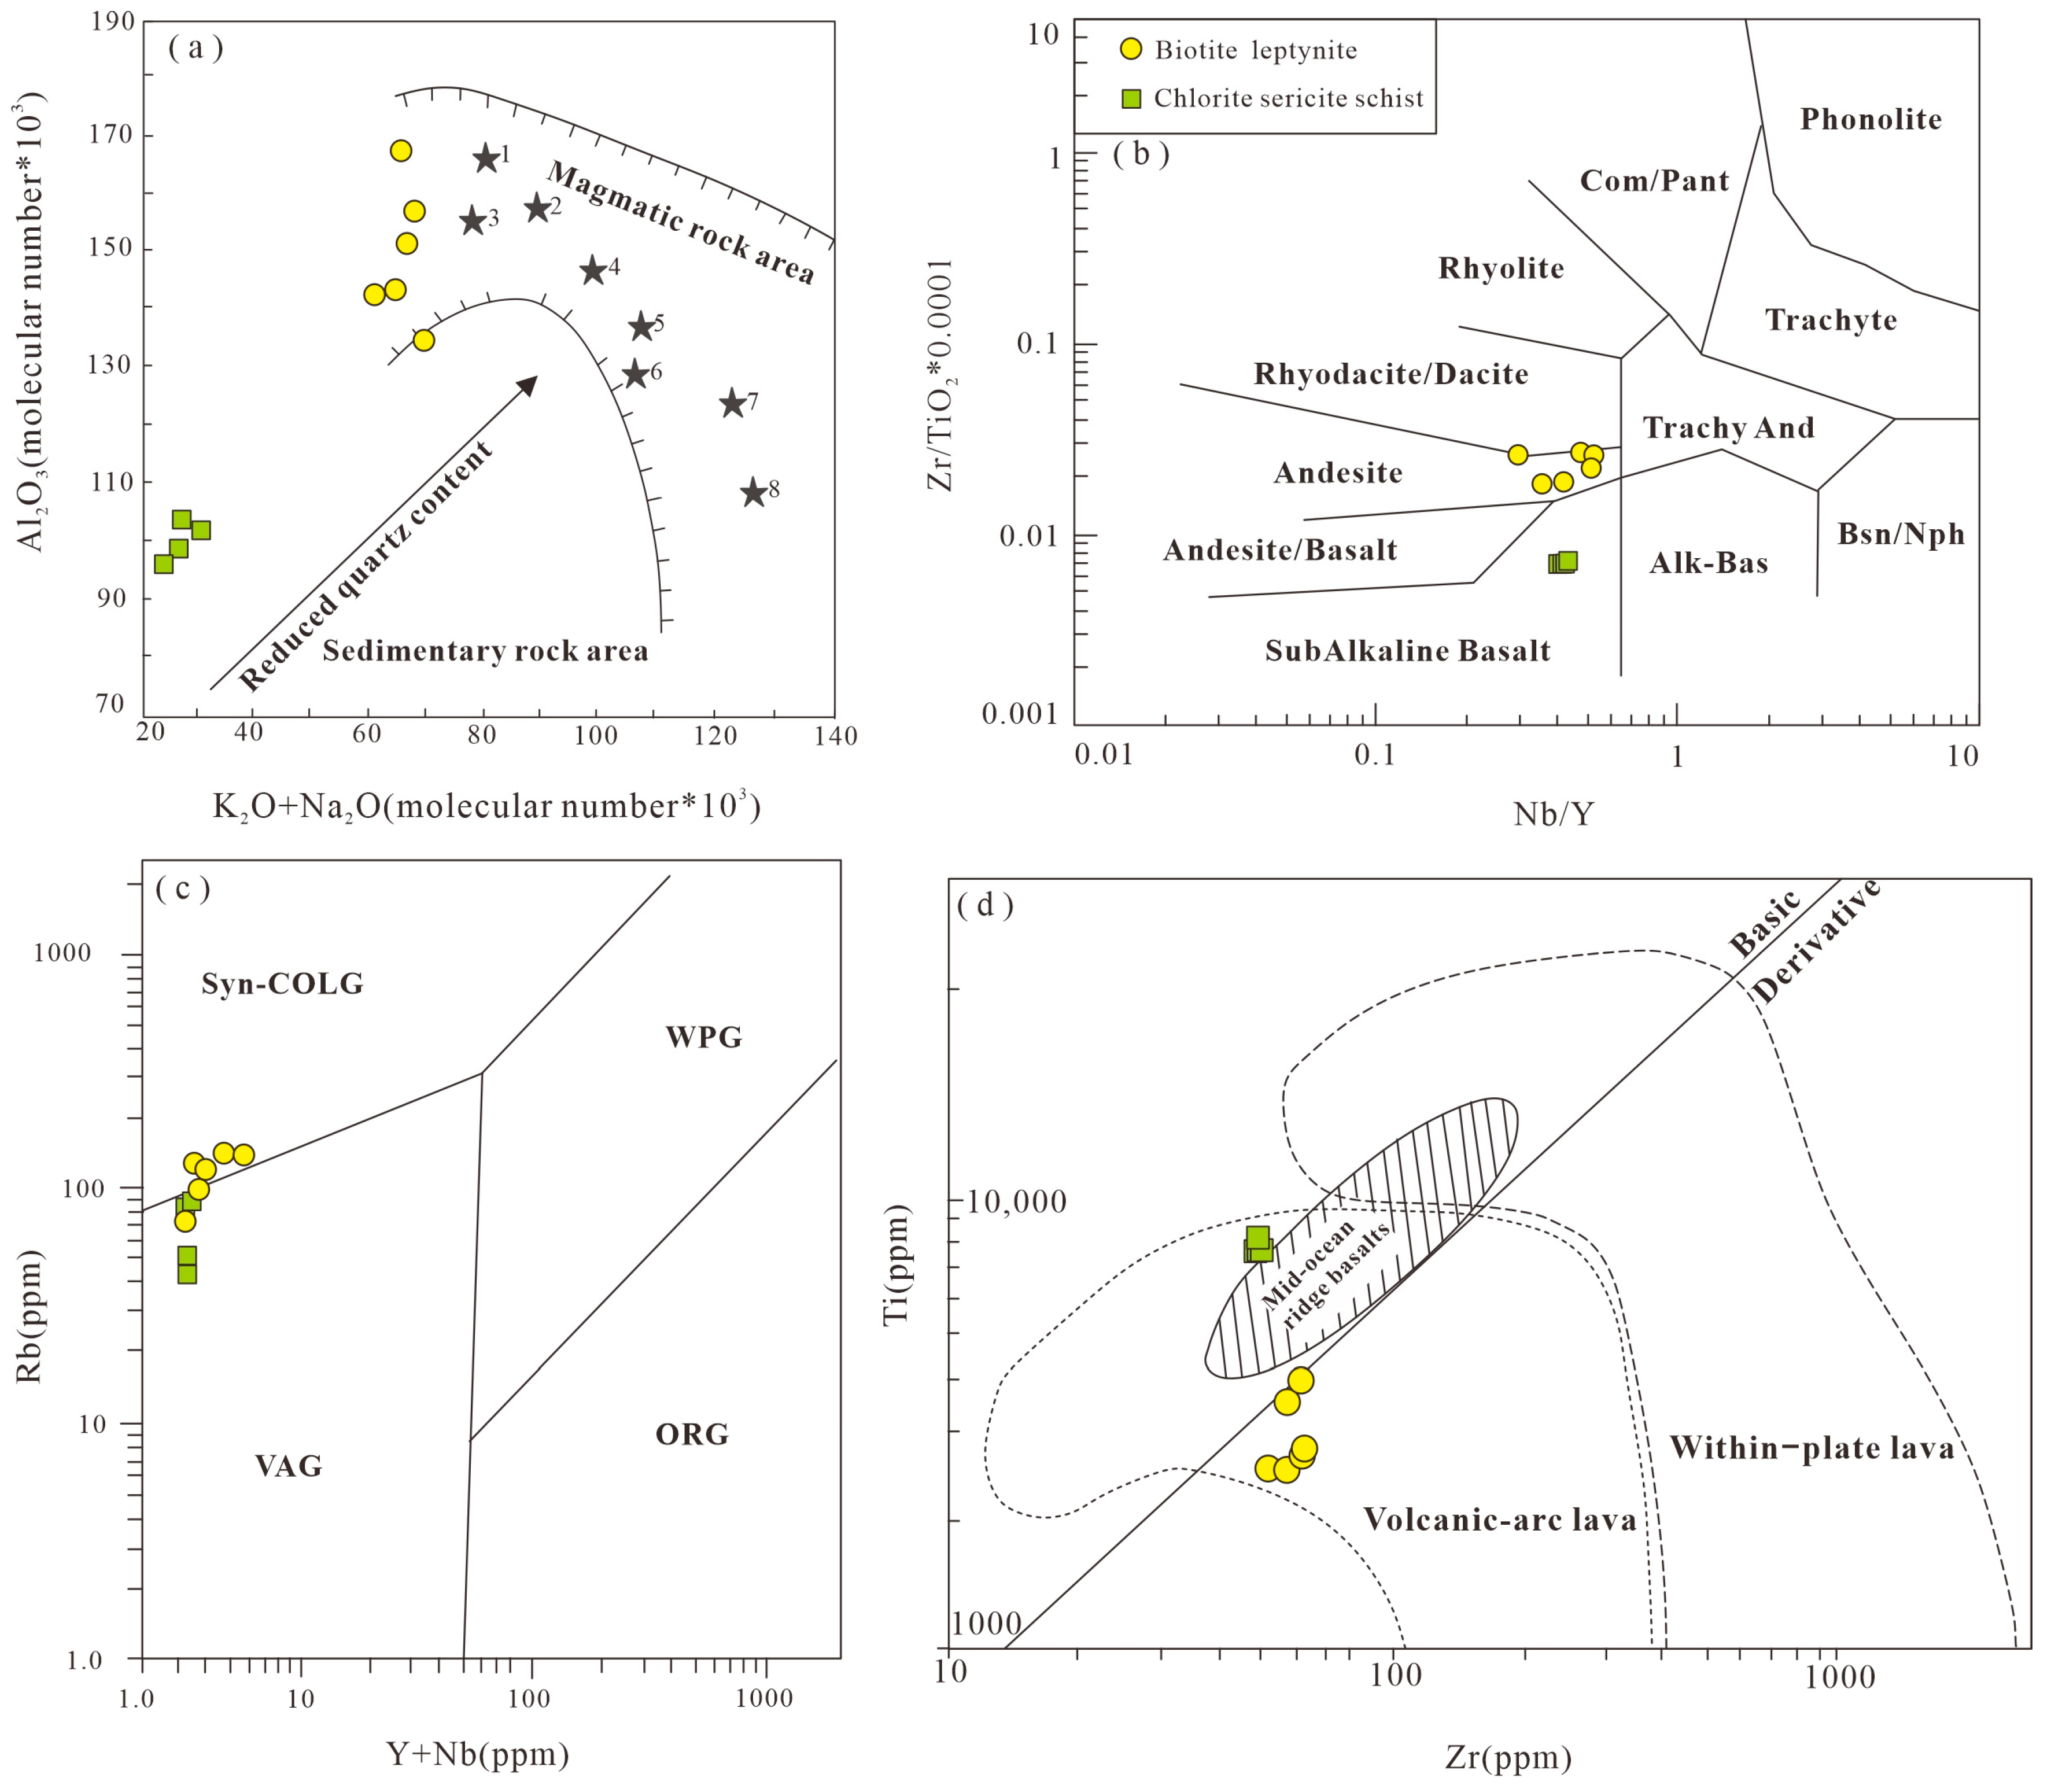
4.2.1. Biotite–Leptynite
4.2.2. Chlorite–Sericite Schist
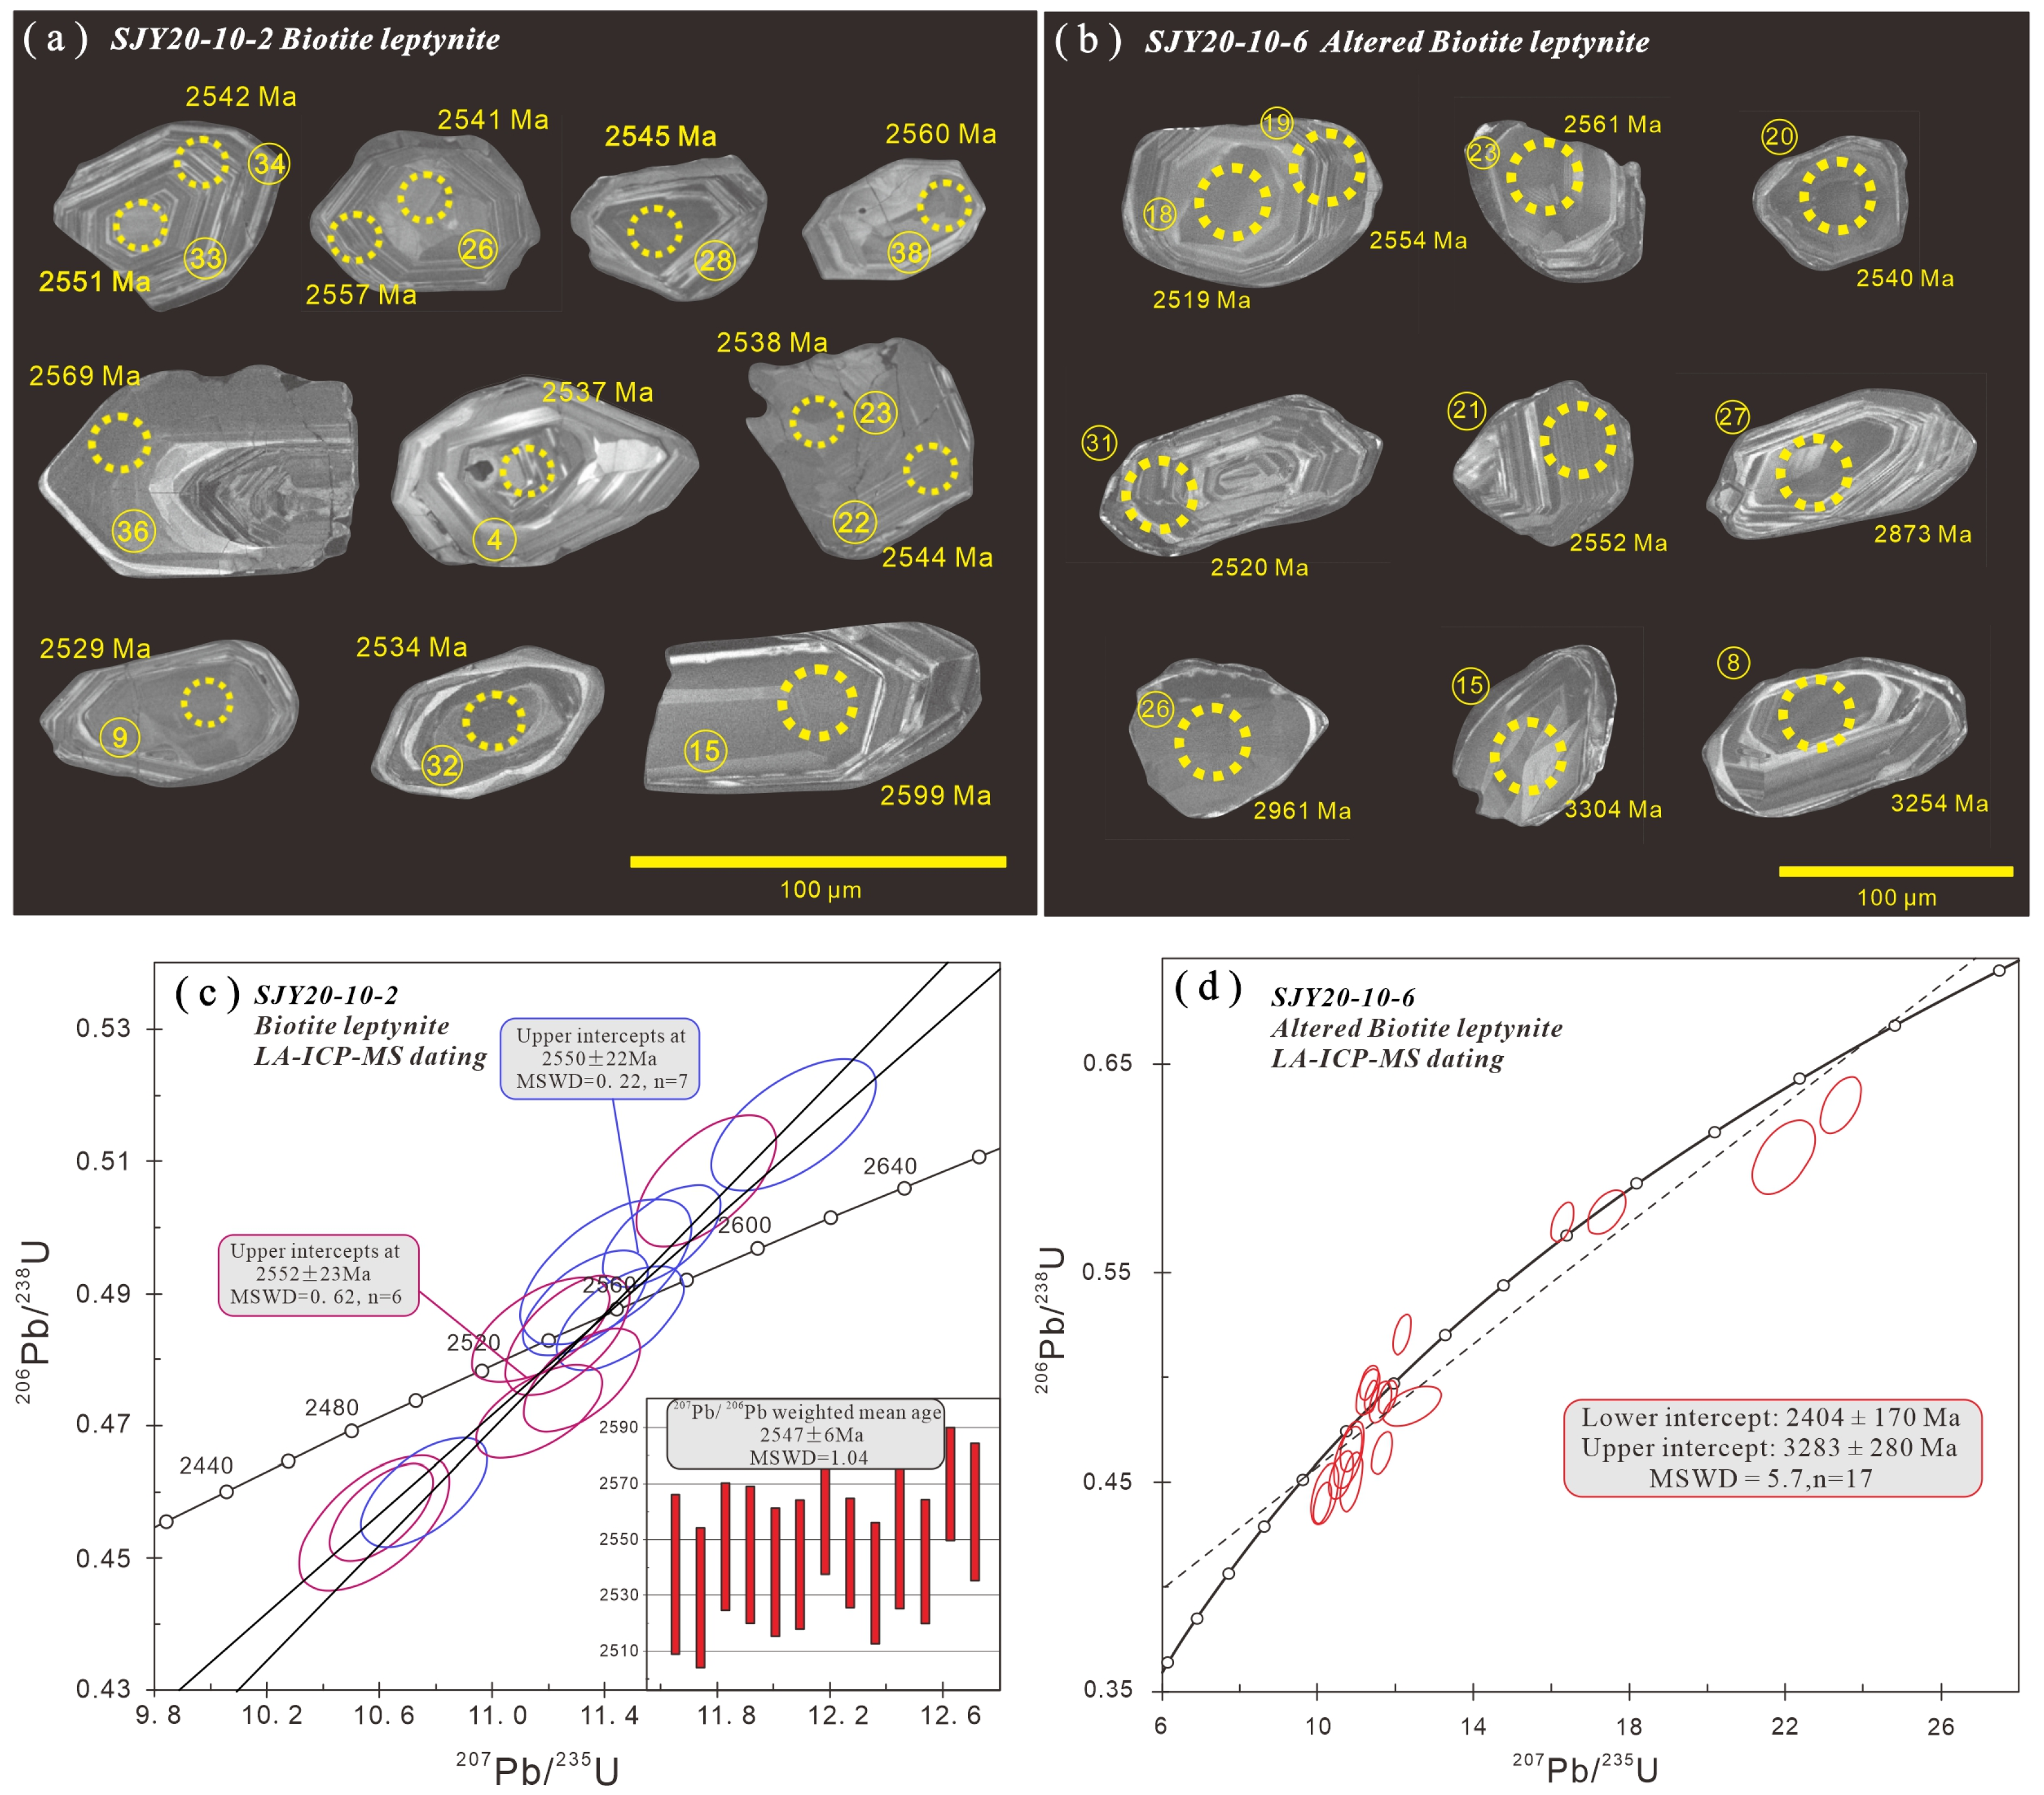
4.3. LA–ICP–MS Zircon U–Pb Dating
5. Discussion
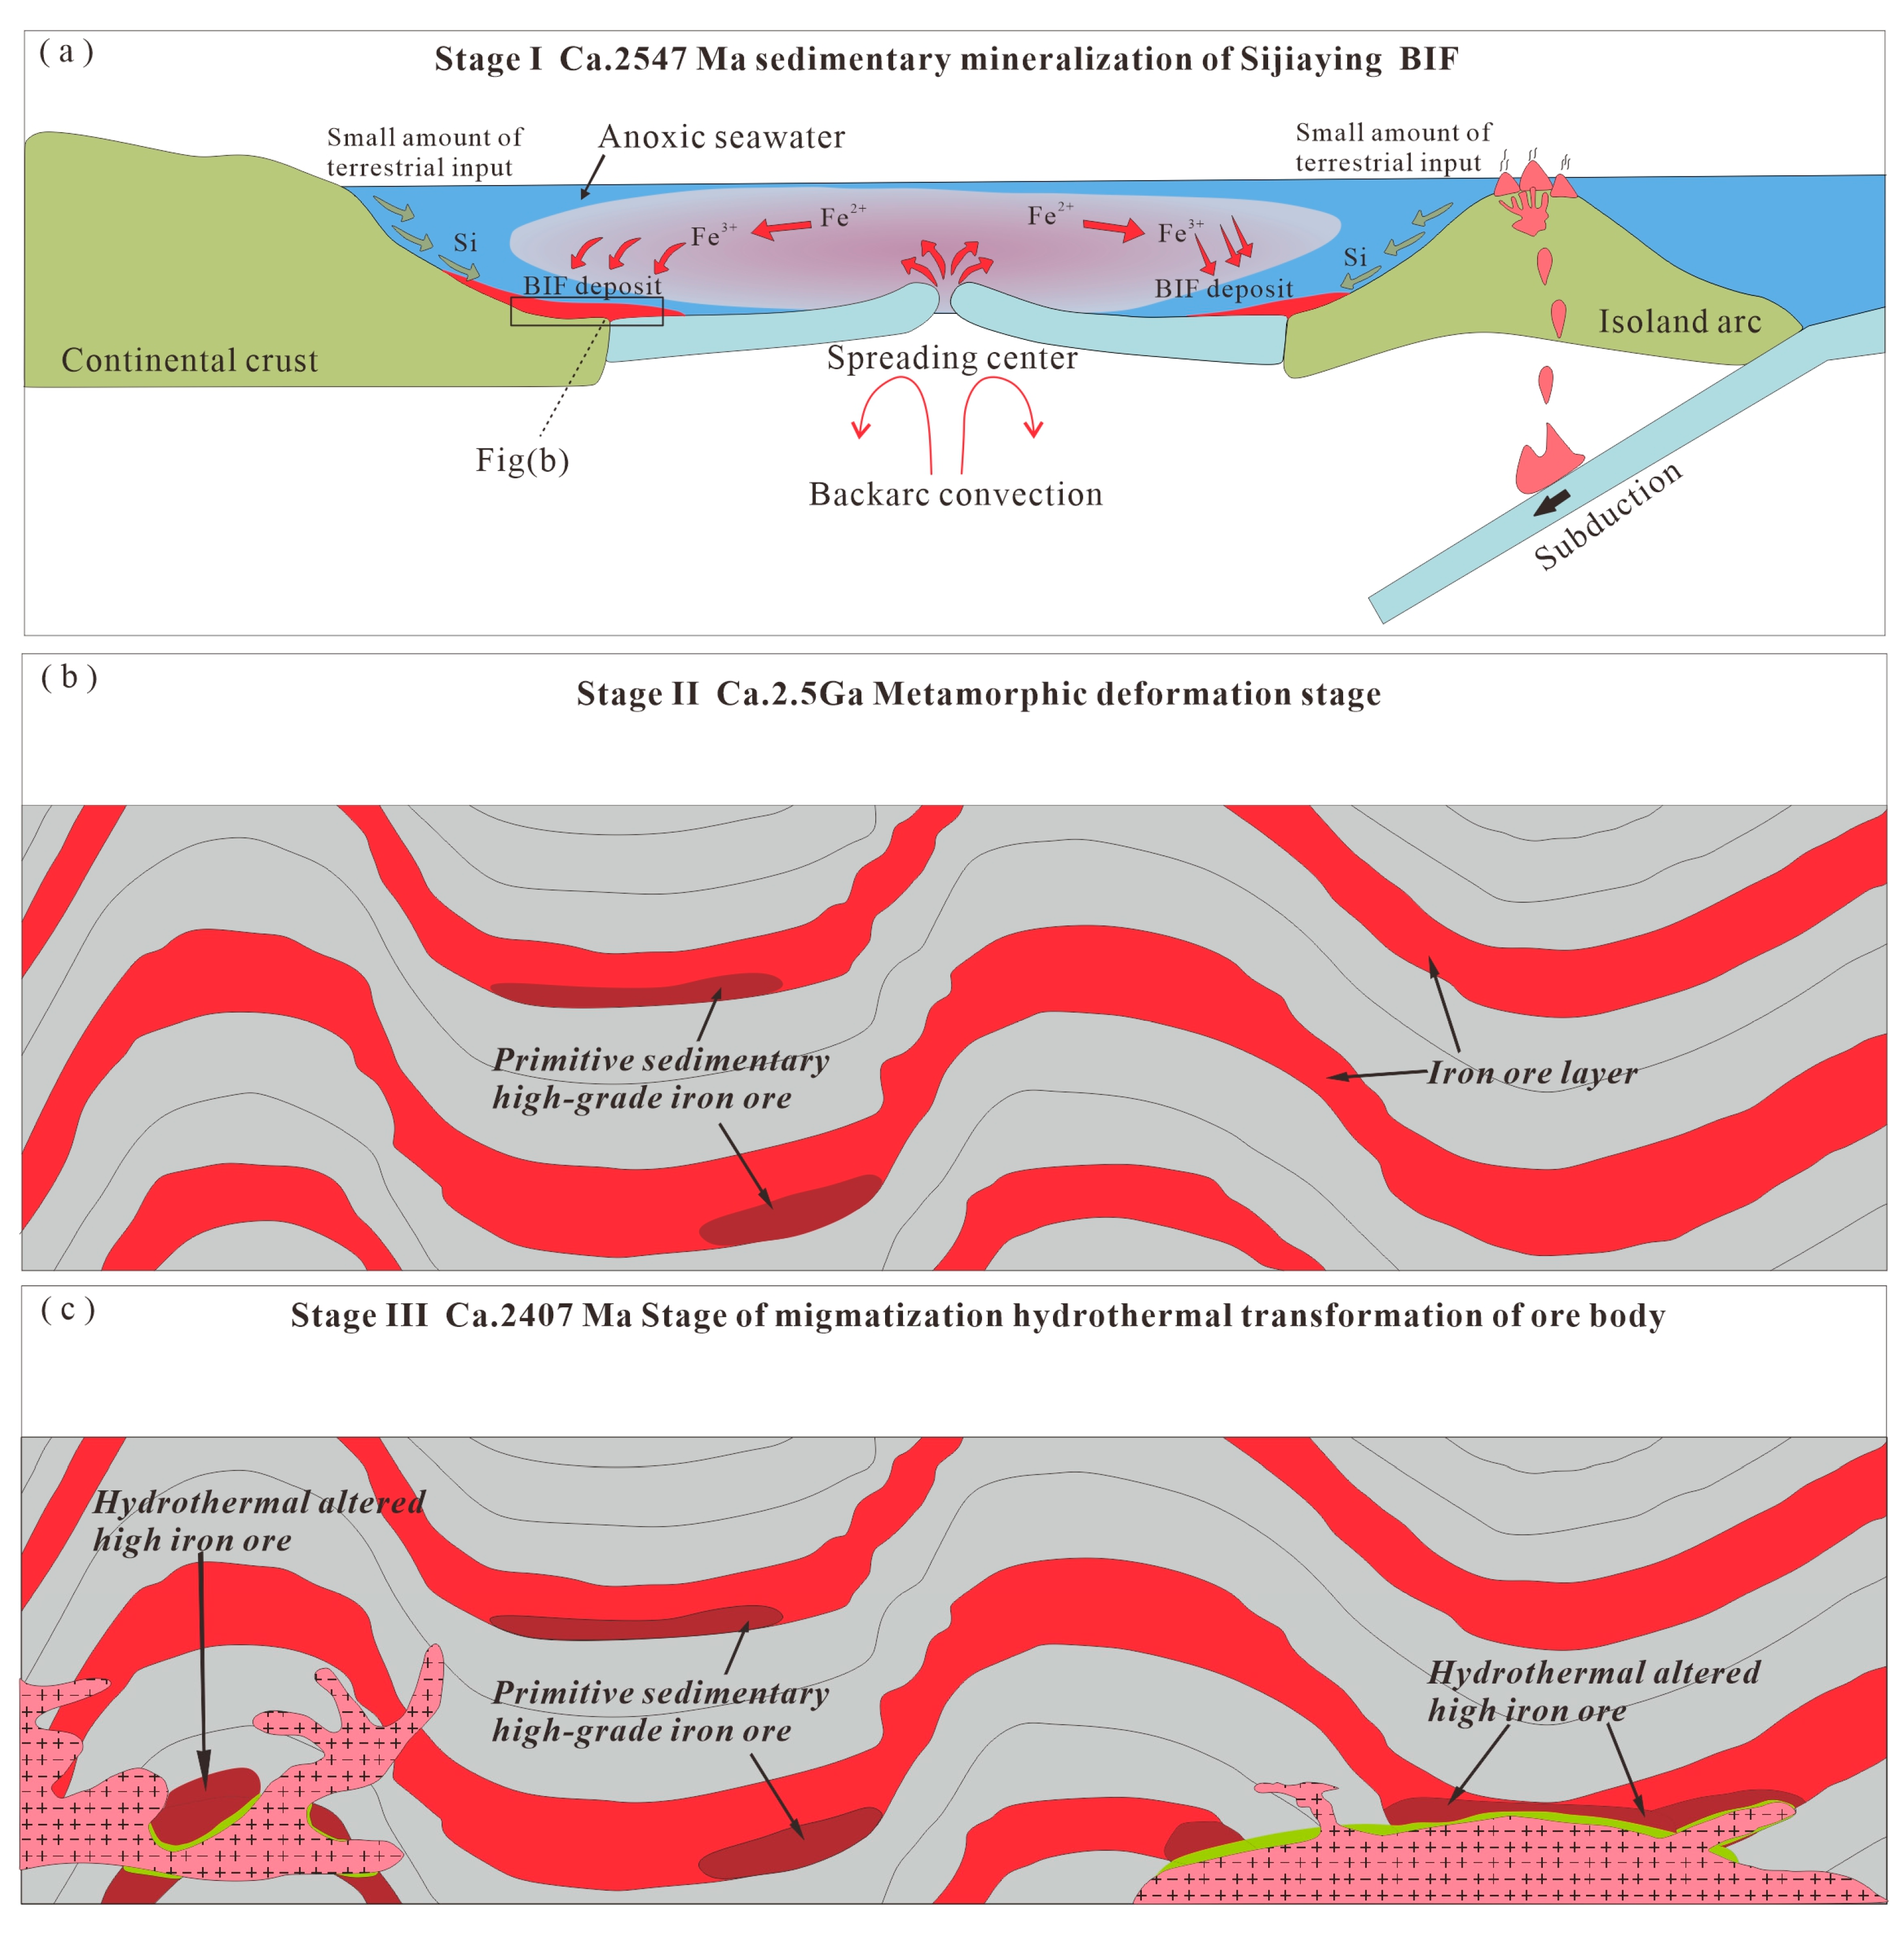
5.1. Stages of Iron Formation
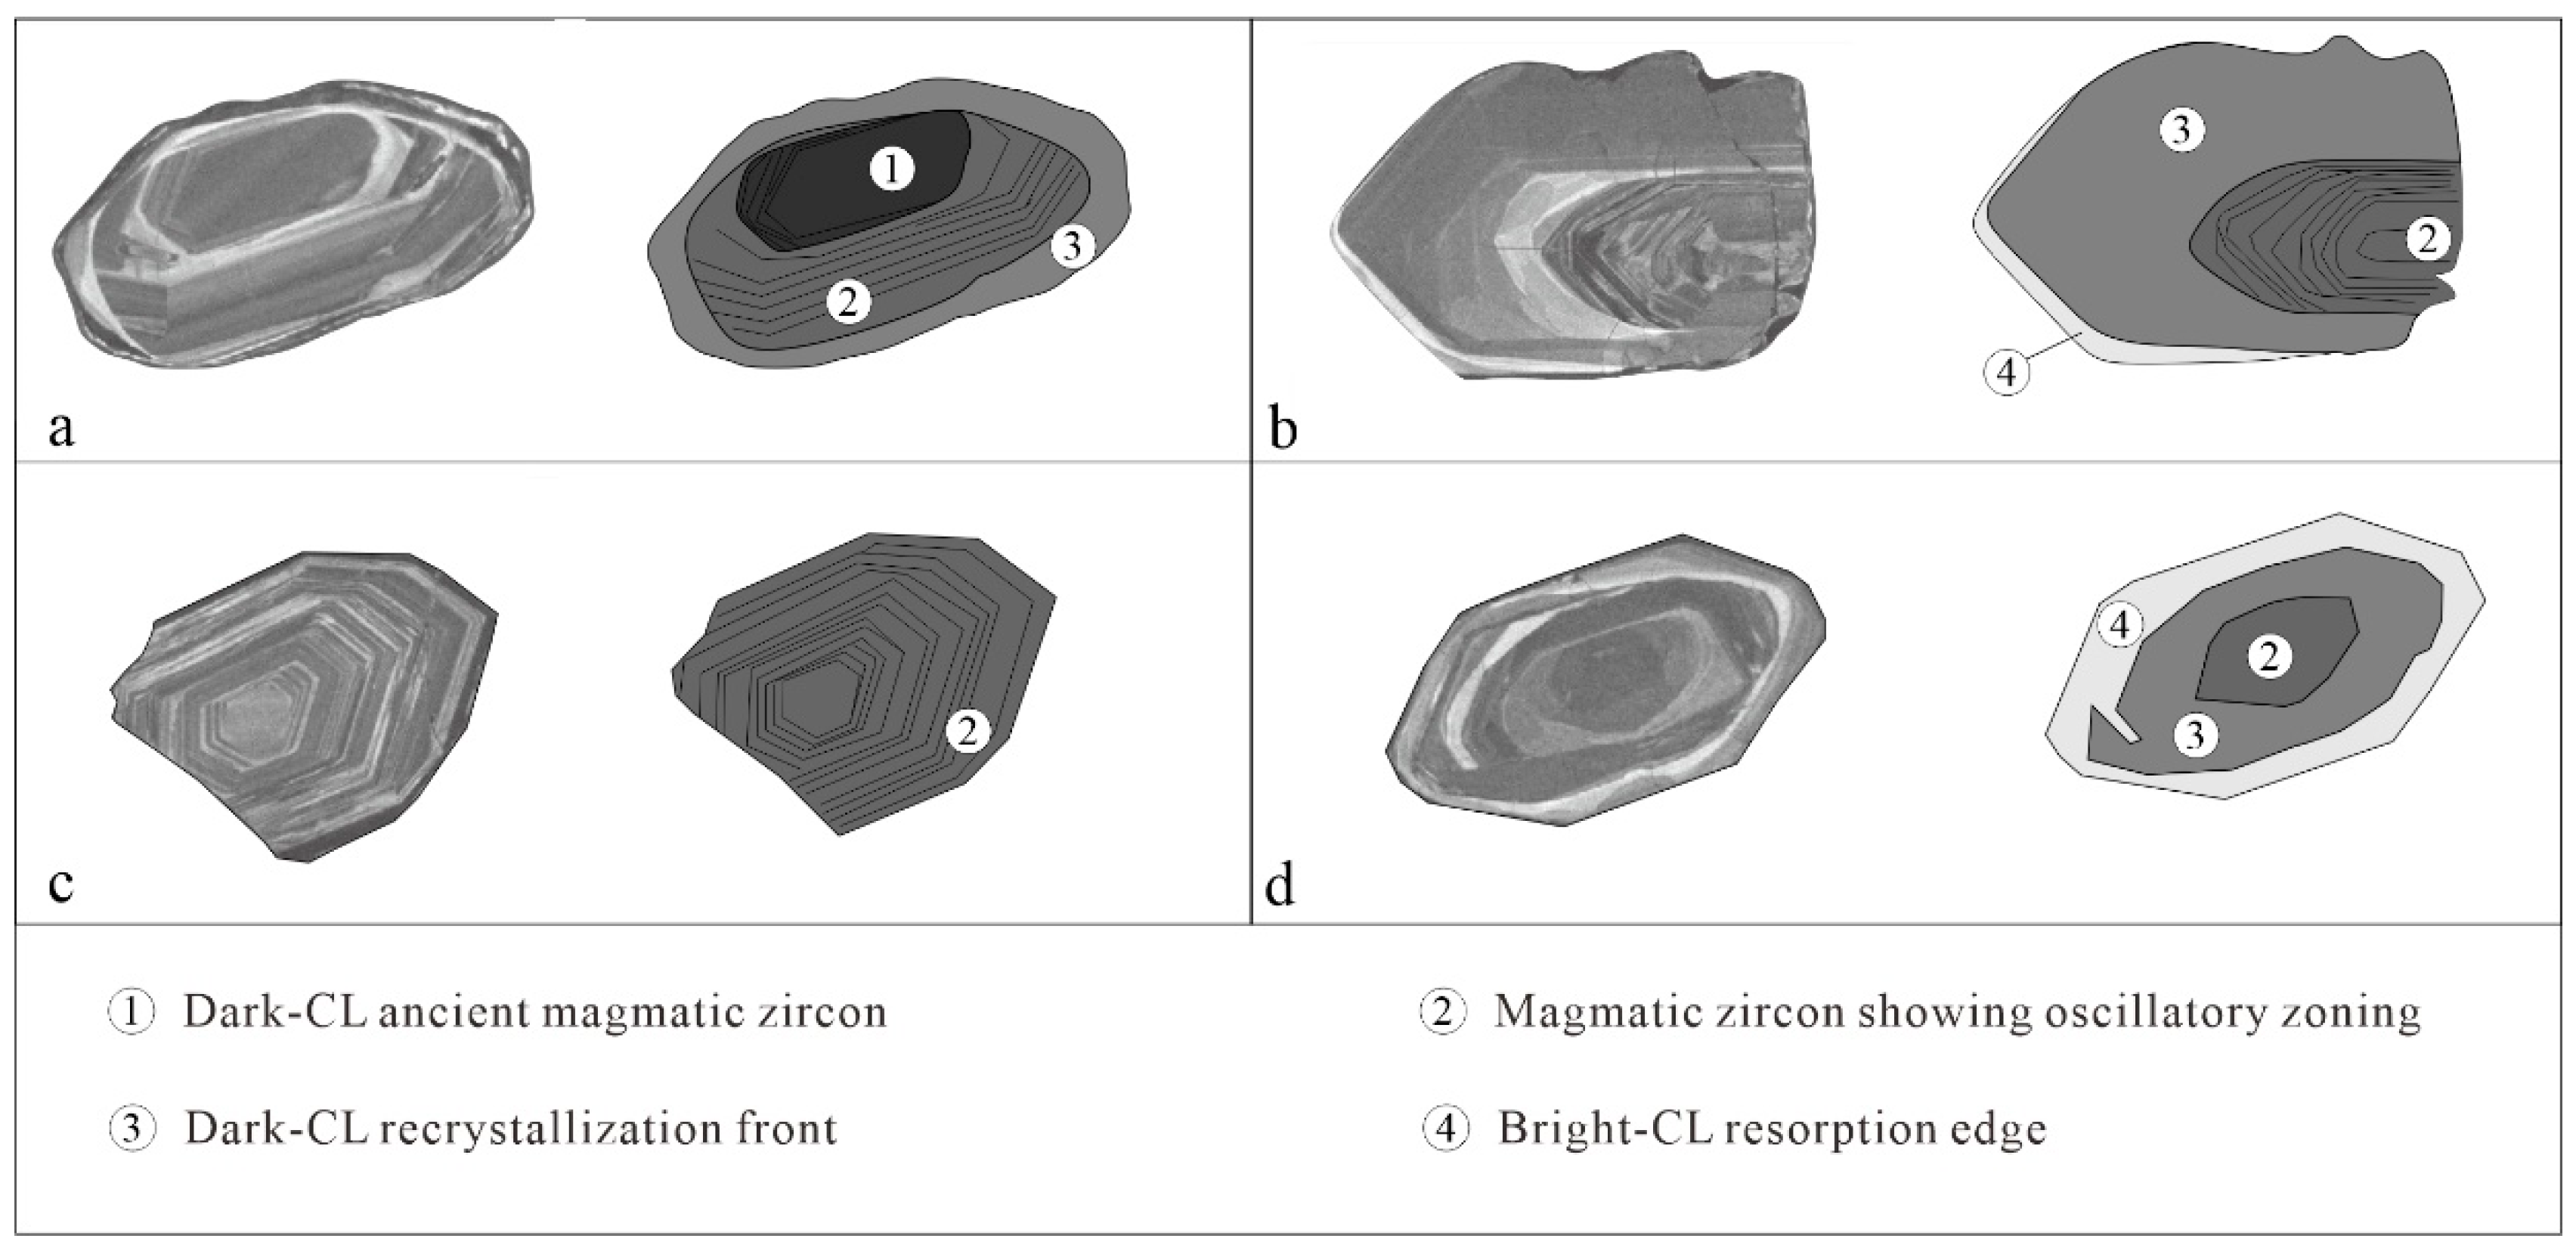
5.1.1. Dark-CL Ancient Magmatic Zircons
5.1.2. Magmatic Zircons Showing Oscillatory Zoning
5.1.3. Dark-CL Recrystallization Front
5.1.4. Bright-CL Resorption Edge
5.1.5. Timing of Deposition
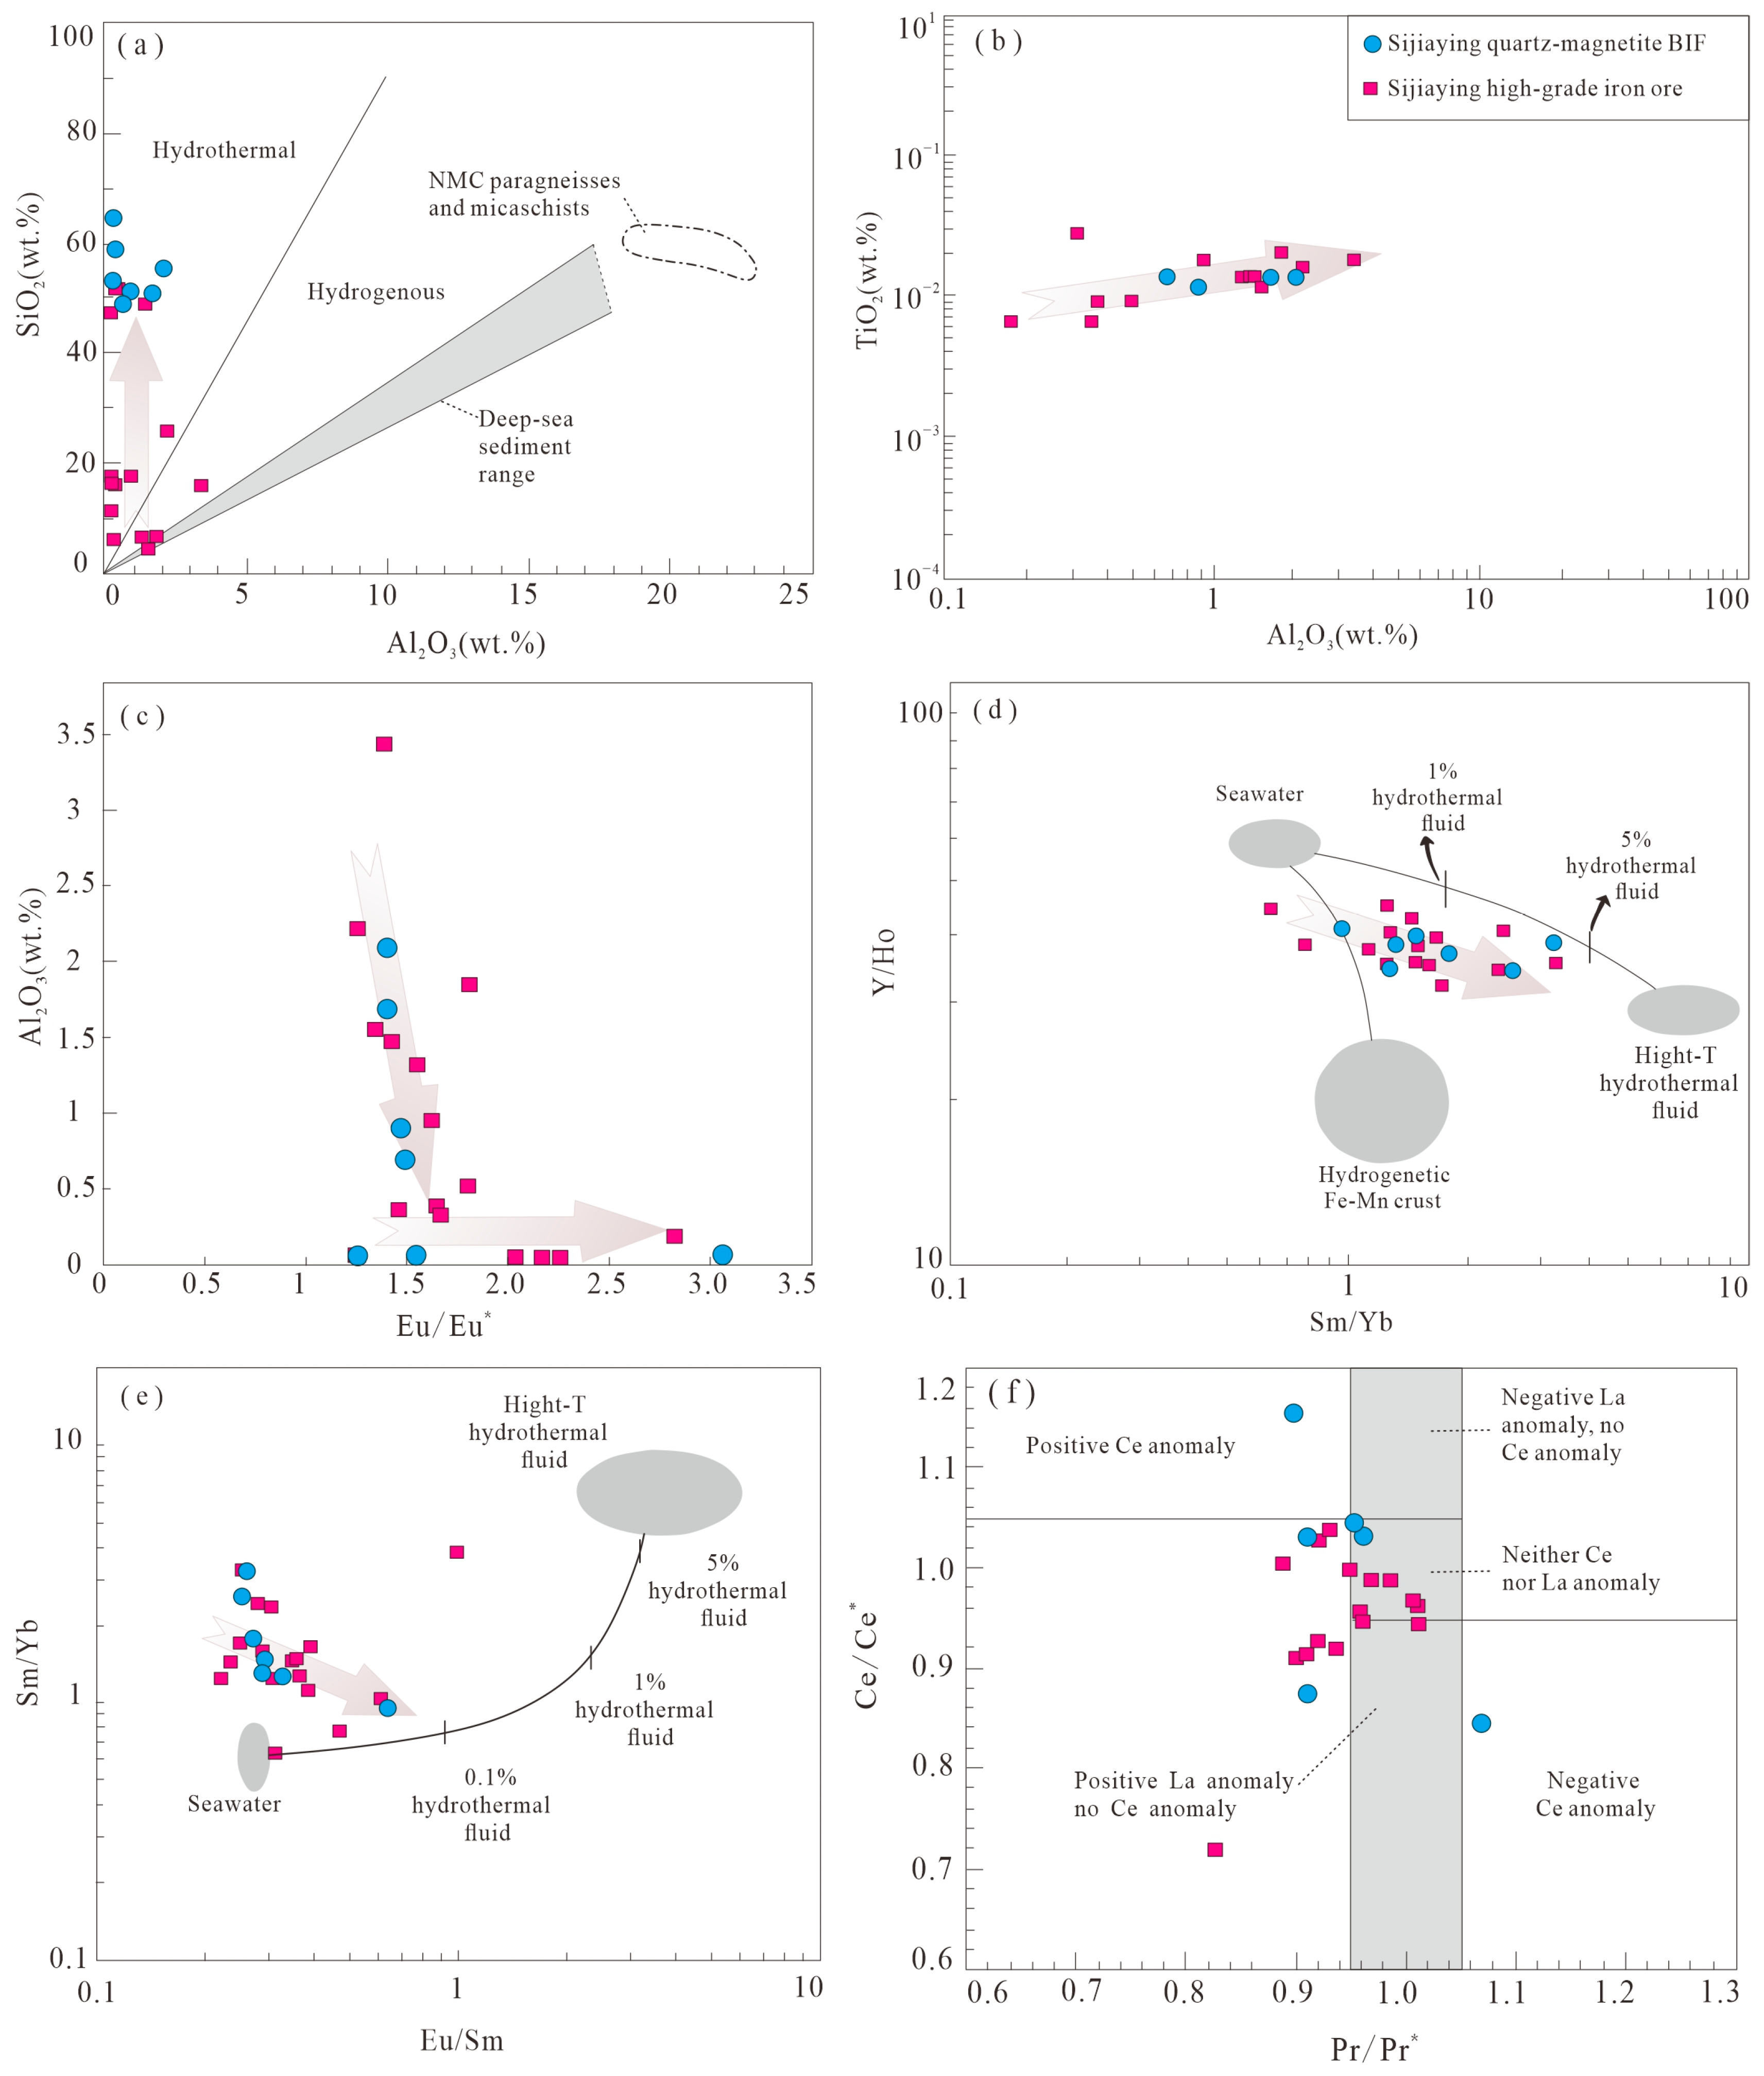
5.2. Depositional Conditions of BIF
5.3. Genesis of High-Grade Iron Ores
5.4. Genetic Model of Ore Deposits
6. Conclusions
- (1)
- The Sijiaying BIF is the source of ore-forming materials provided via submarine volcanic hydrothermal solution, which was mineralized in an anoxic paleo-ocean.
- (2)
- There are two types of high-grade iron ores in the deposit: primitive sedimentary and hydrothermally altered iron ores. Primitive sedimentary high-grade iron ores are of the same mineralization age as BIFs, while hydrothermally altered high-grade iron ores were formed later than BIFs.
- (3)
- The biotite–leptynite that is closely related to the orebody was formed at 2547 ± 6 Ma, which represents the main mineralization age of the iron formation. After mineralization, it underwent regional metamorphism (~2500 Ma) and migmatization (2407 ± 170 Ma). Migmatization is the process that most likely provided a hydrothermal solution to alter iron orebodies and improve ore grades.
Author Contributions
Funding
Acknowledgments
Conflicts of Interest
References
- Gross, G.A. A classification of iron formations based on depositional environments. Canad. Miner. 1980, 18, 215–222. [Google Scholar]
- Klein, C. Some Precambrian banded iron-formations (BIFs) from around the world: Their age, geologic setting, mineralogy, meta-morphism, geochemistry, and origin. Am. Miner. 2005, 90, 1473–1499. [Google Scholar] [CrossRef]
- Shen, B.F.; Zhai, A.M.; Miao, P.S.; Sima, X.Z.; Li, J.J. Geological character and potential resources of iron deposits in the north China block. Geol. Surv. Res. 2006, 29, 244–252, (In Chinese with English Abstract). [Google Scholar]
- Zhang, Z.C.; Hou, T.; Santosh, M.; Li, H.M.; Zhang, Z.H.; Song, X.Y.; Wang, M. Spatio-temporal distribution and tectonic settings of the major iron deposits in China: An overview. Ore Geol. Rev. 2014, 57, 247–263. [Google Scholar] [CrossRef]
- Li, H.M.; Zhang, Z.J.; Li, L.X.; Zhang, Z.C.; Chen, J.; Yao, T. Types and general characteristics of the BIF–related iron deposits in China. Ore Geol. Rev. 2014, 57, 264–287. [Google Scholar] [CrossRef]
- Li, H.M.; Wang, D.H.; Li, L.X.; Chen, J.; Yang, X.Q.; Liu, M.J. Metallogeny of iron deposits and resource potential of major iron minerogenetic units in China. Geol. China 2012, 39, 559–580, (In Chinese with English Abstract). [Google Scholar]
- Zhang, L.C.; Zhai, M.G.; Wan, Y.S.; Guo, J.H.; Dai, Y.P.; Wang, C.L.; Liu, L. Study of the Precambrian BIF-iron deposits in the North China Craton: Progresses and questions. Acta Petrol. Sin. 2012, 28, 3431–3445, (In Chinese with English Abstract). [Google Scholar]
- Gao, X.Y.; Wang, D.H.; Chen, Y.C.; Huang, F.; Wang, C.H.; Di, Y.J. Metallogenic series and prospecting direction of iron deposits in north China block. Acta Geosci. Sin. 2022, 10, 1–16. Available online: http://kns.cnki.net/kcms/detail/11.3474.P.20221019.1629.002.html (accessed on 7 May 2023). (In Chinese with English Abstract).
- Chen, G.Y.; Li, M.H.; Wang, X.F.; Sun, D.S.; Sun, C.M.; Wang, Z.F.; Su, Y.X.; Lin, J.X. The genetical mineralogy of garnets from Gongchangling, China. Mineral. Petrol. 1984, 4, 1–254, (In Chinese with English Abstract). [Google Scholar]
- Wan, Y.S. Formation and Evolution of Iron Bearing Rock Series in Gongchangling, Liaoning; Beijing Science and Technology Press: Beijing, China, 1993; pp. 1–108. (In Chinese) [Google Scholar]
- Li, Y.H.; Zhang, Z.J.; Hou, K.J.; Duan, C.; Wan, D.F.; Hu, G.Y. The Genesis of Gongchangling High-Grade-Iron Ores, Anshan-Benxi Area, Liaoning Province, NE China: Evidence from Fe-Si-O-S Isotopes. Acta Geol. Sin. 2014, 88, 2351–2372, (In Chinese with English Abstract). [Google Scholar] [CrossRef]
- Cheng, Y.Q. Probelms on the genesis of the high-grade ore in the pre-sinian (precambrian) Banded iron ore deposits of the Anshan-type of Liaoning and Shantung provinces. Acta Geol. Sin. 1957, 37, 153–178, (In Chinese with English Abstract). [Google Scholar]
- Guan, G.Y. On the significance of metamorphism in the formation of Anshan type iron ore deposits. Acta Geol. Sin. 1961, 1, 65–76, (In Chinese with English Abstract). [Google Scholar]
- Li, H.M.; Li, Y.H.; Li, L.X.; Li, Z.H.; Fu, J.F.; Hou, K.J.; Fan, C.F. Re-forming conditions of the sedimentary metamorphic iron deposit and metallogenesis of the high-grade iron deposit. Acta Geol. Sin. 2022, 96, 3211–3233, (In Chinese with English Abstract). [Google Scholar] [CrossRef]
- Chen, Y.C.; Xue, C.J.; Wang, D.H.; Li, H.Q.; Lu, Y.F. A discussion on the regional mineralizing pedigree of the ore deposits in the northern margin of the north China landmass. Geol. J. China Univ. 2003, 9, 520–535. [Google Scholar]
- Qian, X.L.; Cui, W.Y.; Wang, S.Q.; Wang, G.Y. Geology of Precambrian Iron Deposits in Eastern Hebei Province; Hebei Science and Technology Press: Shijiazhuang, China, 1985; pp. 1–273. (In Chinese) [Google Scholar]
- Cui, M.L.; Zhang, L.C.; Wu, H.Y.; Xu, Y.X.; Li, W.J. Timing and tectonic setting of the Sijiaying banded iron deposit in the eastern Hebei province, North China Craton: Constraints from geochemistry and SIMS zircon U–Pb dating. J. Asian Earth Sci. 2014, 94, 240–251. [Google Scholar] [CrossRef]
- Wang, C.L.; Wu, H.Y.; Li, W.J.; Peng, Z.D.; Zhang, L.C.; Zhai, M.G. Changes of Ge/Si, REE+Y and Sm-Nd isotopes in alternating Fe-and Si-rich mesobands reveal source heterogeneity of the ~2.54 Ga Sijiaying banded iron formation in Eastern Hebei, China. Ore Geol. Rev. 2017, 80, 363–376. [Google Scholar] [CrossRef]
- Zhao, G.C.; Wilde, S.A.; Cawood, P.A.; Sun, M. Archean blocks and their boundaries in the North China Craton: Lithological, geochemical, structural and P-T path constraints and tectonic evolution. Precambr. Res. 2001, 107, 45–73. [Google Scholar] [CrossRef]
- Zhao, G.C.; Sun, M.; Wilde, S.A.; Li, S.Z. Late Archean to Paleoproterozoic evolution of the North China Craton: Key issues revisited. Precambr. Res. 2005, 136, 177–202. [Google Scholar] [CrossRef]
- Zhai, M.G.; Santosh, M. The early Precambrian odyssey of the North China Craton: A synoptic overview. Gondwana Res. 2011, 20, 6–25. [Google Scholar] [CrossRef]
- Zhai, M.G.; Santosh, M. Metallogeny of the North China Craton: Link with secular changes in the evolving Earth. Gondwana Res. 2013, 24, 275–297. [Google Scholar] [CrossRef]
- Zhai, M.G. Multi-stage crustal growth and cratonization of the North China Craton. Geosci. Front. 2014, 5, 457–469. [Google Scholar] [CrossRef] [Green Version]
- Shen, B.F.; Zhai, A.M.; Yang, C.L.; Cao, X.L. Temporal-spatial distribution and evolutional characters of Precambrian iron deposits in China. Geol. Surv. Res. 2005, 28, 196–206, (In Chinese with English Abstract). [Google Scholar]
- Nutman, A.P.; Wan, Y.S.; Du, L.L.; Friend, R.L.; Dong, C.Y.; Xie, H.Q.; Wang, W.; Sun, H.Y.; Liu, D.Y. Multistage late Neoarchaean crustal evolution of the North China Craton, eastern Hebei. Precambrian Res. 2011, 189, 43–65. [Google Scholar] [CrossRef]
- Jahn, B.M.; Auvray, B.; Cornichet, J.; Bai, Y.L.; Shen, Q.H.; Liu, D.Y. 3.5 Ga old amphibolites from eastern Hebei Province, China: Field occurrence, petrography, Sm-Nd isochron age and REE geochemistry. Precambrian Res. 1987, 34, 311–346. [Google Scholar] [CrossRef]
- Liu, D.Y.; Nutman, A.P.; Compston, W.; Wu, J.S.; Shen, Q.H. Remnants of ≥3800 Ma crust in the Chinese part of the Sino-Korean craton. Geology 1992, 20, 339. [Google Scholar] [CrossRef]
- Han, C.M.; Xiao, W.J.; Su, B.X.; Chen, Z.L.; Zhang, X.H.; Ao, S.J.; Zhang, J.E.; Zhang, Z.Y.; Wan, B.; Song, D.F.; et al. Neoarchean Algoma-type banded iron formations from Eastern Hebei, North China Craton: SHRIMP U-Pb age, origin and tectonic setting. Precambrian Res. 2014, 251, 212–231. [Google Scholar] [CrossRef]
- Wan, Y.S.; Dong, C.Y.; Jie, H.Q.; Wang, S.J.; Song, M.C.; Xu, Z.Y.; Wang, S.Y.; Zhou, H.Y.; Ma, M.Z.; Liu, D.Y. Formation Ages of Early Precambrian BIFs in the North China Craton: SHRIMP Zircon U-Pb Dating. Acta Geol. Sin. 2012, 86, 1447–1478, (In Chinese with English Abstract). [Google Scholar]
- Gao, X.Y.; Wang, D.H.; Huang, F.; Wang, Y.; Guo, W.M. Discussion on deep prospecting of Sijiaying iron deposit in eastern Hebei Province. Acta Geol. Sin. 2022, 96, 2494–2505, (In Chinese with English Abstract). [Google Scholar] [CrossRef]
- Xu, Y.X.; Zhang, L.F.; Gao, X.M.; Li, H.M.; Jia, D.S.; Li, L.X. Metallogenic Conditions of High-grade Ores in the Sijiaying Sedimentary Metamorphic Iron Deposit, Eastern Hebei Province. Geol. Explor. 2014, 50, 675–688, (In Chinese with English Abstract). [Google Scholar]
- Xu, Y.X.; Zhang, L.F.; Li, H.M.; Li, L.X.; Gao, X.M.; Jia, D.S. The Exploration Model of the Sijiaying Sedimentary Metamorphic Iron Deposit in Eastern Hebei Province. Geol. Explor. 2015, 51, 23–35, (In Chinese with English Abstract). [Google Scholar]
- Hou, K.; Li, Y.; Tian, Y.Y. In situ U-Pb zircon dating using laser ablation-multi ion counting-ICP-MS. Miner. Depos. 2009, 28, 481–492, (In Chinese with English Abstract). [Google Scholar]
- Nasdala, L.; Hofmeister, W.; Norberg, N.; Mattinson, J.M.; Corfu, F.; Dor, W.; Kamo, S.L.; Kennedy, A.K.; Kronz, A.; Reiners, P.W.; et al. Zircon M257—A homogeneous natural reference material for the ion microprobe U-Pb analysis of zircon. Geostand. Geoanal. Res. 2008, 32, 247–265. [Google Scholar] [CrossRef]
- Ludwig, K.R. User’s Manual for Isoplot3.0: A Geochronological Toolkit for Microsoft Excel; Berkeley Geochronology Center4: Berkeley, CA, USA, 2003; pp. 1–71. [Google Scholar]
- Pourmand, A.; Dauphas, N.; Ireland, T.J. A novel extraction chromatography and MC-ICP-MS technique for rapid analysis of REE, Sc and Y: Revising CI-chondrite and Post-Archean Australian Shale (PAAS) abundances. Chem. Geol. 2012, 291, 38–54. [Google Scholar] [CrossRef]
- Sun, S.S.; Mcdougall, W.F. Chemical and Isotopic Systematics of Oceanic Basalts: Implications for Mantle Composition of the Earth and Mantle Evolution. Earth Planet. Sci. Lett. 1989, 35, 429–448. [Google Scholar] [CrossRef]
- Alibo, D.S.; Nozaki, Y. Rare earth elements in seawater: Particle association, shale-normalization, and Ce oxidation. Geochim. Cosmochim. Acta 1999, 63, 363–372. [Google Scholar] [CrossRef]
- Bau, M.; Dulski, P. Comparing yttrium and rare earths in hydrothermal fluids from the Mid-Atlantic Ridge: Implications for Y and REE behaviour during near-vent mixing and for the Y/Ho ratio of Proterozoic seawater. Chem. Geol. 1999, 155, 77–90. [Google Scholar] [CrossRef]
- Shi, C.Y.; Yan, M.C.; Liu, C.M.; Chi, Q.H.; Hu, S.Q.; Gu, T.X.; Bu, W.; Yan, W.D. Abundances of chemical elements in granitoids of China and their characterisitics. Geochimica 2005, 5, 470–482, (In Chinese with English Abstract). [Google Scholar]
- Mogahed, M.; Abdelfadil, K.M. Constraints of Mantle and Crustal Sources Interaction during Orogenesis of Pre- and Post-Collision Granitoids from The Northern Arabian–Nubian Shield: A Case Study from Wadi El-Akhder Granitoids, Southern Sinai, Egypt. Acta Geol. Sin.-Engl. Ed. 2021, 95, 1527–1550. [Google Scholar] [CrossRef]
- Taylor, S.R.; McLennan, S.M. The Continental Crust: Its Composition and Evolution: An Examination of the Geochemical Record Preserved in Sedimentary Rocks; Blackwell Science: Oxford, UK, 1985; pp. 1–312. [Google Scholar]
- Hoskin, P.W.O.; Black, L.P. Metamorphic zircon formation by solid-state recrystallization of protolith igneous zircon. Metamorph. Geol. 2000, 18, 423–439. [Google Scholar] [CrossRef]
- Vavra, G.; Gebauer, D.; Schmid, R.; Compston, W. Multiple zircon growth and recrystallization during polyphase Late Carboniferous to Triassic metamorphism in granulites of the Ivrea Zone (Southern Alps): An ion microprobe (SHRIMP) study. Contrib. Miner. Pet. 1996, 122, 337–358. [Google Scholar] [CrossRef]
- Hoskin, P.W.O. Trace-element composition of hydrothermal zircon and the alteration of Hadean zircon from the Jack Hills, Australia. Geochim. Cosmochim. Acta 2005, 69, 637–648. [Google Scholar] [CrossRef]
- Wu, Y.B.; Zheng, Y.F. Genetic mineralogy of zircons and its constraints on U-Pb age interpretation. Chin. Sci. Bull. 2004, 49, 1589–1604, (In Chinese with English Abstract). [Google Scholar] [CrossRef]
- Pickard, A.L. SHRIMP U–Pb zircon ages for the Palaeoproterozoic Kuruman Iron Formation, northern Cape Province, South Africa: Evidence for simultaneous BIF deposition on Kaapvaal and Pilbara craton. Precambrian Res. 2003, 125, 275–315. [Google Scholar] [CrossRef]
- Zhou, J.X.; Chen, Z.Y. Study on Cathodoluminescence of Zircon under Electron Probe; University of Electronic Science and Technology Press: Chengdu, China, 2007; pp. 1–104. (In Chinese) [Google Scholar]
- Hinton, R.W.; Upton, B.G.J. The chemistry of zircon: Variations within and between large crystals from syenite and alkali basalt xenoliths. Geochim. Cosmochim. Acta 1991, 55, 3287–3302. [Google Scholar] [CrossRef]
- Hanchar, J.M.; Miller, C.F. Zircon zonation patterns as revealed by cathodoluminescence and backscattered electron images: Implications for interpretation of complex crustal histories. Chem. Geol. 1993, 110, 1–13. [Google Scholar] [CrossRef]
- Corfu, F.; Hanchar, J.M.; Hoskin, P.W.O.; Kinny, P. Atlas of zircon textures. Rev. Mineral. Geochem. 2003, 53, 469–500. [Google Scholar] [CrossRef]
- Schaltegger, U.; Fanning, C.M.; Günther, D.; Maurin, J.C.; Schulmann, K.; Gebauer, D. Growth, annealing and recrystallization of zircon and preservation of monazite in high-grade metamorphism: Conventional and in-situ U–Pb isotope, cathodoluminescence and microchemical evidence. Contrib. Miner. Pet. 1999, 134, 186–201. [Google Scholar] [CrossRef]
- Shen, Q.H.; Zhang, Z.Q.; Xia, M.X.; Wang, X.Y.; Lu, J.Y. Rb-Sr Age Determination on the Late Archean Ferrosiliceous Rock Series in Sijiaying, Luanxian, Hebei. Geol. Rev. 1981, 27, 207–212, (In Chinese with English Abstract). [Google Scholar]
- Mahdy, N.M.; Ntaflos, T.; Pease, V.; Sami, M.; Slobodnık, M.; Abu Steet, A.A.; Abdelfadil, K.M.; Fathy, D. Combined zircon U-Pb dating and chemical Th–U–total Pb chronology of monazite and thorite, Abu Diab A-type granite, Central Eastern Desert of Egypt: Constraints on the timing and magmatic-hydrothermal evolution of rare metal granitic magmatism in the Arabian Nubian Shield. Geochemistry 2020, 80, 125669. [Google Scholar]
- Li, W.J.; Jin, X.D.; Cui, M.L.; Wang, C.L. Characterisics of rare earth elements, trace elements and geological significations of BIF from Sijiaying in eastern Hebei. Acta Petrol. Sin. 2012, 28, 3670–3678, (In Chinese with English Abstract). [Google Scholar]
- Wang, R.M. Graphic Discrimination of Metamorphic Rock; Geological Publishing House: Beijing, China, 1981; pp. 1–199. (In Chinese) [Google Scholar]
- Winchester, J.A.; Floyd, P.A. Geochemical discrimination of different magma series and their differentiation products using immobile elements. Chem. Geol. 1977, 20, 325–343. [Google Scholar] [CrossRef] [Green Version]
- Huston, D.L.; Logan, G.A. BIFs and bugs: Evidence for the evolution of the Earth’s early hydrosphere. Earth Planet. Sci. Lett. 2004, 220, 41–55. [Google Scholar] [CrossRef] [Green Version]
- Planavsky, N.; Bekker, A.; Rouxel, O.J.; Kamber, B.; Hofmann, A.; Knudsen, A.; Timothy, W.L. Rare earth element and yttrium compositions of Archean and Paleoproterozoic Fe formations revisited: New perspectives on the significance and mechanisms of deposition. Geochim. Cosmochim. Acta 2010, 74, 6387–6405. [Google Scholar] [CrossRef]
- Cox, G.M.; Halverson, G.P.; Minarik, W.G.; Heron, D.P.L.; Macdonald, F.A.; Bellefroid, E.J.; Strauss, J.V. Neoproterozoic iron formation: An evaluation of its temporal, environmental and tectonic significance. Chem. Geol. 2013, 362, 232–249. [Google Scholar] [CrossRef] [Green Version]
- Pearce, J.A.; Harris, N.B.; Tindle, A.G. Trace element discrimination diagrams for the interpretation of granitic rocks. J. Petrol. 1984, 25, 957–983. [Google Scholar] [CrossRef] [Green Version]
- Pearce, J.A. Trace Element Characteristics of Lavas from Destructive Plate Boundaries. In Orogenic Andesites and Related Rocks; Thorpe, R.S., Ed.; J. Wiley and Sons: Chichester, UK, 1982; pp. 525–547. [Google Scholar]
- Zhang, L.C.; Zhai, M.G.; Zhang, X.J.; Xiang, P.; Dai, Y.P.; Wang, C.L.; Pirajno, F. Formation age and tectonic setting of the Shirengou Neoarchean banded iron deposit in eastern Hebei Province: Constraints from geochemistry and SIMS zircon U–Pb dating. Precambrian Res. 2012, 222–223, 325–338. [Google Scholar] [CrossRef]
- Zhang, X.J.; Zhang, L.C.; Xiang, P.; Wan, B.; Pirajno, F. Zircon U–Pb age, Hf isotopes and geochemistry of Shuichang Algoma-type banded iron-formation, North China Craton: Constraints on the ore-forming age and tectonic setting. Gondwana Res. 2011, 20, 137–148. [Google Scholar] [CrossRef]
- Li, Y.H.; Zhang, Z.J.; Wu, J.S.; Shang, L.P. Metamorphic chronology of the BIF in Malanzhuang of eastern Hebei Province and its geological implications. Miner. Depos. 2011, 30, 645–653, (In Chinese with English Abstract). [Google Scholar]
- Dirks, P.; Hand, M. Structural and metamorphic controls on the distribution of zircon in an evolving quartzofeldspathic migmatite: An example from the Reynold Range, central Austrilia. Metamorph. Geol. 1991, 9, 191–201. [Google Scholar] [CrossRef]
- Andersson, J.; Möller, C.; Johansson, L. Zircon geochronology of migmatite gneisses along the Mylonite Zone (S Sweden): A major Sveconorwegian terrane boundary in the Baltic Shield. Precambrian Res. 2002, 114, 121–147. [Google Scholar] [CrossRef]
- Li, L.X.; Li, H.M.; Xu, Y.X.; Chen, J.; Yao, T.; Zhang, L.F.; Yang, X.Q.; Liu, M.J. Zircon growth and ages of migmatites in the Algoma-type BIF-hosted iron deposits in Qianxi Group from eastern Hebei Province, China: Timing of BIF deposition and anatexis. J. Asian Earth Sci. 2015, 113, 1017–1034. [Google Scholar] [CrossRef]
- Bonatti, E. Metallogenesis at oceanic spreading centers. Annu. Rev. Earth Planet. Sci. 1975, 3, 401–433. [Google Scholar] [CrossRef]
- Bolhar, R.; Kamber, B.S.; Moorbath, S.; Fedo, C.M.; Whitehouse, M.J. Character-isation of early Archaean chemical sediments by trace element signatures. Earth Planet. Sci. Lett. 2004, 222, 43–60. [Google Scholar] [CrossRef]
- German, C.R.; Masuzawa, T.; Greaves, M.J.; Elderfield, H.; Edmond, J.M. Dis-solved rare earth elements in the Southern Ocean: Cerium oxidation and the influence of hydrography. Geochim. Cosmochim. Acta 1995, 59, 1551–1558. [Google Scholar] [CrossRef]
- Bau, M. Rare-earth element mobility during hydrothermal and metamorphicfluid rock interaction and the significance of the oxi-dation state of europium. Chem. Geol. 1991, 93, 219–230. [Google Scholar] [CrossRef]
- Douville, E.; Bienvenu, P.; Charlou, J.L.; Donval, J.P.; Fouquet, Y.; Appriou, P.; Gamo, T. Yttrium and rare earth elements in fluids from various deep-sea hydrothermal systems. Geochim. Cosmochim. Acta 1999, 63, 627–643. [Google Scholar] [CrossRef]
- Bekker, A.; Slack, J.F.; Planavsky, N.; Krapež, B.; Hofmann, A.; Konhauser, K.O.; Rouxel, O.J. Iron formation: The sedimentary product of a complex interplay among mantle, tectonic, oceanic, and biospheric processes. Econ. Geol. 2010, 105, 467–508. [Google Scholar] [CrossRef] [Green Version]
- Slack, J.F.; Grenne, T.; Bekker, A.; Rouxel, O.J.; Lindberg, P.A. Suboxic deep seawater in the late Paleoproterozoic: Evidence from hematitic chert and iron formation related to seafloor-hydrothermal sulfide deposits, central Arizona, USA. Earth Planet. Sci. Lett. 2007, 255, 243–256. [Google Scholar] [CrossRef]
- Wonder, J.; Spry, P.; Windom, K. Geochemistry and origin of manganese-rich rocks related to iroformation and sulfide deposits, western Georgia. Econ. Geol. 1988, 83, 1070–1081. [Google Scholar] [CrossRef]
- Alexander, B.W.; Bau, M.; Andersson, P.; Dulski, P. Continentally derived solutes in shallow Archean seawater: Rare earth element and Nd isotope evidence in iron formation from the 2.9Ga Pongola Supergroup, South Africa. Geochim. Cosmochim. Acta 2008, 72, 378–394. [Google Scholar] [CrossRef]
- Bau, M.; Dulski, P. Distribution of yttrium and rare-earth elements in the Penge and Kuruman iron-formations, Transvaal Supergroup, South Africa. Precambrian Res. 1996, 79, 37–55. [Google Scholar] [CrossRef]
- Kamber, B.S.; Webb, G.E. The geochemistry of late Archaean microbial carbonate: Implications for ocean chemistry and continental erosion history. Geochim. Cosmochim. Acta 2001, 65, 2509–2525. [Google Scholar] [CrossRef]
- Gross, G.A. Tectonic systems and the deposition of iron formation. Precambrian Res. 1983, 20, 171–187. [Google Scholar] [CrossRef]
- Li, S.G.; Hou, Z.H.; Yang, Y.C.; Sun, W.D.; Zhang, G.W.; Li, Q.L. Geochemical characteristics and formation age of Sanchazi paleo-magmatic arc in Mianle tectonic belt, South Qinling. Sci. Sin. 2003, 33, 1163–1173. (In Chinese) [Google Scholar]
- Dai, Y.P.; Zhang, L.C.; Zhu, M.T.; Wang, C.L.; Liu, L.; Peng, X. The composition and genesis of the Mesoarchean Dagushan banded iron formation (BIF) in the Anshan area of the North China Craton. Ore Geol. Rev. 2014, 63, 353–373. [Google Scholar] [CrossRef]
- Zhu, M.T.; Dai, Y.P.; Zhang, L.C.; Wang, C.L.; Liu, L. Geochronology and geochemistry of the Nanfen iron deposit in the Anshan-Benxi area, North China Craton: Implications for ~2.55 Ga crustal growth and the genesis of high-grade iron ores. Precambrian Res. 2015, 260, 23–38. [Google Scholar] [CrossRef]
- Danielson, A.; Moller, P.; Dulski, P. The europium anomalies in banded iron formations and the thermal history of the oceanic crust. Chem. Geol. 1992, 97, 89–100. [Google Scholar] [CrossRef]
- Frei, R.; Dahl, P.S.; Duke, E.F.; Frei, K.M.; Hansen, T.R.; Frandsson, M.M.; Jensen, L.A. Trace element and isotopic characterization of Neoarchaean and Paleo-proterozoic iron formations in the Black Hills (South Dakota, USA): Assessment of chemical change during 2.9–1.9 Ga deposition bracketing the 2.4–2.2 Ga first rise of atmospheric oxygen. Precambrian Res. 2008, 162, 441–474. [Google Scholar] [CrossRef]
- Bau, M.; Möller, P. Rare earth element systematics of the chemically precipitated component in early Precambrian iron formations and the evolution of the terrestrial atmosphere–hydrosphere–lithosphere system. Geochim. Cosmochim. Acta 1993, 57, 2239–2249. [Google Scholar] [CrossRef]
- Veizer, J.; Ala, D.; Azmy, K.; Bruckschen, P.; Buhl, D.; Bruhn, F.; Carden, G.A.F.; Diener, A.; Ebneth, S.; Godderis, Y.; et al. 87Sr/86Sr, δ13C and δ18O evolution of Phanerozoic seawater. Chem. Geol. 1999, 161, 59–88. [Google Scholar] [CrossRef] [Green Version]
- Zhang, L.F.; Xu, Y.X.; Gao, X.M.; Li, H.M.; Jia, D.S.; Li, L.X.; Wang, Y.; Feng, H.Y. SHRIMP U-Pb Chronology of Zircon from Potassified Granite of Sijiaying Iron Mine in Eastern Hebei Province. Miner. Depos. 2012, 31 (Suppl. 1), 163–164. (In Chinese) [Google Scholar]
- Shen, Q.H.; Song, H.X. Progress, prospecting and key scientific problems in origin researches of high-grade iron ore of the banded iron formation (BIF) in the North China Craton. Acta Petrol. Sin. 2015, 31, 2795–2815, (In Chinese with English Abstract). [Google Scholar]
- Zhai, M.G.; Guo, J.H.; Liu, W.J. Neoarchean to Paleoproterozoic continental evolution and tectonic history of the North China craton. Asian Earth Sci. 2005, 24, 547–561. [Google Scholar] [CrossRef]
- Johnson, C.M.; Beard, B.L.; Beukes, N.J.; Klein, C.; O’Leary, J.M. Ancient geochemical cycling in the Earth as inferred from Fe isotope studies of banded iron formations from the Transvaal Craton. Contrib. Mineral. Petrol. 2003, 144, 523–547. [Google Scholar] [CrossRef]
- Planavsky, N.J.; Rouxel, O.J.; Bekker, A.; Hoffmann, A.; Little, C.T.; Lyons, T.W. Iron isotope composition of some Archean and Proterozoic iron formations. Geochim. Cosmochim. Acta 2012, 80, 158–169. [Google Scholar] [CrossRef]
- Zhang, Q.S. Geology and Mineralization of Early Precambrian in China; Jilin People’s Publishing House: Jilin, China, 1984; pp. 1–536. (In Chinese) [Google Scholar]
- Li, Y.; Zou, H.; Said, N.; Liu, H. A new classification of barite deposits in China. Ore Energy Resour. Geol. 2023, 14, 100019. [Google Scholar] [CrossRef]
- Cao, H.W.; Pei, Q.M.; Santosh, M.; Li, G.M.; Zhang, L.K.; Zhang, X.F.; Zhang, Y.H.; Zou, H.; Dai, Z.F.; Lin, B.; et al. Himalayan leucogranites: A review of geochemical and isotopic characteristics, timing of formation, genesis, and rare metal mineralization. Earth-Sci. Rev. 2022, 234, 104229. [Google Scholar] [CrossRef]
- Cao, H.W.; Pei, Q.M.; Yu, X.; Cao, A.B.; Chen, Y.; Liu, H.; Zhang, K.; Liu, X.; Zhang, X.F. The long-lived partialmelting of the Greater Himalavas in southern-Tibet, constraints from the Miocene Gyirong anatectic pegmatite and itsprospectingpotentialforrare elementminerals. China Geol. 2023, 6, 303–321. [Google Scholar]


| Sample Type | N | Sample Name | Location | Coordinates | Deth (m) | BIF Facies | Texture | Major Mineral Assemblage | |
|---|---|---|---|---|---|---|---|---|---|
| East | North | ||||||||
| BIF (Open Pit) | 1 | SJY20-5-1 | Near Prospecting Line 16 | 118.751825 | 39.681657 | −187 | Oxide | Black quartz bands | Magnetite and quartz, a little chlorite |
| 2 | SJY20-6-1 | Near Prospecting Line 16 | 118.752249 | 39.679825 | −217 | Oxide | Black and white quartz bands | Magnetite and quartz | |
| 3 | SJY20-7-2 | Near Prospecting Line 16 | 118.751478 | 39.681492 | −189 | Oxide | Medium coarse-grained bands cut by green alternating veins | Magnetite, quartz, chlorite, and pyrite | |
| 4 | SJY20-8-6 | Near Prospecting Line 16 | 118.753249 | 39.674220 | −112 | Oxide | Fine quartz bands | Magnetite and quartz | |
| 5 | SJY20-9-4 | Near Prospecting Line 16 | 118.750482 | 39.681629 | −164 | Oxide | Fine and little quartz bands | Magnetite and quartz | |
| 6 | SJY20-9-5 | Near Prospecting Line 16 | 118.750482 | 39.681629 | −164 | Oxide | Banded gray–brown, crosscutting veins | Magnetite and quartz | |
| 7 | SJY20-10-5 | Near Prospecting Line 16 | 118.751900 | 39.681886 | −167 | Oxide | Banded green alternating bands | Magnetite, quartz, and chlorite | |
| 8 | SJY20-11-1 | Near Prospecting Line 16 | 118.755412 | 39.675196 | −124 | Oxide | Fine black–grey alternating bands | Magnetite and quartz | |
| Sample Type | N | Sample Name | Location | Coordinates | Deth(m) | Sampling Site | Texture | Major Mineral Assemblage | |
| East | North | ||||||||
| Biotite leptynite | 1 | SJY20-7-4 | Near Prospecting Line 16 | 118.751478 | 39.681492 | −189 | The wall rock of the roof of ore body III | Fine-grained flake-like granoblastic structure, as well as a parallel granular structure | Biotite, quartz, plagioclase, and a small amount of magnetite |
| 2 | SJY20-8-1 | Near Prospecting Line 16 | 118.753249 | 39.674220 | −112 | The wall rock of the floor of orebody III | Biotite, quartz, plagioclase, and a small amount of magnetite | ||
| 3 | SJY20-8-3 | Near Prospecting Line 16 | 118.753249 | 39.674220 | −112 | The wall rock of the floor of orebody III | Biotite, quartz, plagioclase, and a small amount of magnetite | ||
| 4 | SJY20-10-2 | Near Prospecting Line 16 | 118.751900 | 39.681886 | −167 | The wall rock of the roof of orebody III | Biotite, quartz, plagioclase, and a small amount of magnetite | ||
| 5 | SJY20-10-7 | Near Prospecting Line 16 | 118.751900 | 39.681886 | −167 | The wall rock of the floor of orebody III | Biotite, quartz, plagioclase, and a small amount of magnetite | ||
| 6 | SJY20-11-5 | Near Prospecting Line 16 | 118.755412 | 39.675196 | −124 | The wall rock on the north side of the orebody | Biotite, quartz, plagioclase, and pyrite | ||
| Chlorite–sericite schist | 7 | SJY20-9-2 | Near Prospecting Line 16 | 118.750482 | 39.681629 | −164 | The wall rock on the north side of the orebody | Scaly granular crystalline structure; schistose structure | Feldspar, quartz, biotite, sericite, and chlorite |
| 8 | SJY20-13-1 | Near Prospecting Line 16 | 118.753480 | 39.687973 | −186 | Near the orebody in the northern mining area | |||
| 9 | SJY20-13-2 | Near Prospecting Line 16 | 118.753480 | 39.687973 | −186 | ||||
| 10 | SJY20-13-3 | Near Prospecting Line 16 | 118.753480 | 39.687973 | −186 | ||||
| Sample Name | SJY20-5-1 | YS-2 | SJY-2-1 | SJY-ZK601-591. 3 | SJY20-7-2 | SJY20-8-6 | SJY20-6-1 | SJY20-9-4 | SJY20-9-5 | SJY20-10-5 | SJY20-11-1 | SJY-19 | SJY-ZK602-717. 2 | SJY-ZK602-747 | SJY-ZK602-750. 5 | SJY-ZK602-778 | SJY-ZK602-789. 7 | SJY-ZK602-794. 7 | SJY-ZK602-805. 5 | SJY-ZK602-809 | SJY-ZK602-822 | SJY-ZK602-797 | SJY-ZK602-735. 5 |
|---|---|---|---|---|---|---|---|---|---|---|---|---|---|---|---|---|---|---|---|---|---|---|---|
| Lithology | Normal-grade magnetite–quartzite | Normal-grade magnetite–quartzite | Normal-grade magnetite–quartzite | Normal-grade magnetite–quartzite | Normal-grade magnetite–quartzite | Normal-grade magnetite–quartzite | Normal-grade magnetite–quartzite | Normal-grade magnetite–quartzite | Normal-grade magnetite–quartzite | Normal-grade magnetite–quartzite | High-grade magnetite–quartzite | High-grade magnetite–quartzite | High-grade magnetite–quartzite | High-grade magnetite–quartzite | High-grade magnetite–quartzite | High-grade magnetite–quartzite | High-grade magnetite–quartzite | High-grade magnetite–quartzite | High-grade magnetite–quartzite | High-grade magnetite–quartzite | High-grade magnetite–quartzite | High-grade magnetite–quartzite | High-grade magnetite–quartzite |
| References | This study | Data from Xu et al., 2014 [31] | Data from Xu et al., 2014 [31] | Data from Xu et al., 2014 [31] | This study | This study | This study | This study | This study | This study | This study | Data from Xu et al., 2014 [31] | Data from Xu et al., 2014 [31] | Data from Xu et al., 2014 [31] | Data from Xu et al., 2014 [31] | Data from Xu et al., 2014 [31] | Data from Xu et al., 2014 [31] | Data from Xu et al., 2014 [31] | Data from Xu et al., 2014 [31] | Data from Xu et al., 2014 [31] | Data from Xu et al., 2014 [31] | Data from Xu et al., 2014 [31] | Data from Xu et al., 2014 [31] |
| wt.% | |||||||||||||||||||||||
| SiO2 | 55.30 | 64.51 | 58.69 | 53.28 | 51.02 | 50.61 | 48.77 | 48.68 | 51.58 | 51.56 | 47.18 | 6.51 | 15.77 | 16.59 | 17.18 | 16.42 | 6.59 | 17.57 | 11.22 | 4.25 | 6.09 | 25.63 | 15.95 |
| Al2O3 | 2.09 | <0.10 | <0.10 | <0.01 | 0.90 | 1.68 | 0.69 | 1.46 | 0.36 | 0.51 | 0.18 | 1.31 | 3.43 | <0.01 | <0.01 | <0.01 | 1.84 | 0.94 | <0.01 | 1.55 | 0.32 | 2.21 | 0.38 |
| CaO | 1.97 | 0.37 | 0.97 | 3.22 | 2.68 | 0.92 | 2.13 | 0.86 | 0.90 | 0.97 | 0.88 | 0.44 | 2.39 | 4.1 | 3.08 | 3.43 | 2.93 | 2.17 | 3.28 | 5.42 | 5.86 | 2.17 | 5.01 |
| TFe2O3 | 34.84 | 33.91 | 38.12 | 39.68 | 39.18 | 43.24 | 44.58 | 46.67 | 46.53 | 45.23 | 51.17 | 85.05 | 72.7 | 75.23 | 77.57 | 75.74 | 81.63 | 74.25 | 80.61 | 78.08 | 77.96 | 65.58 | 74.09 |
| FeO | 8.59 | 1.5 | 2 | 13.1 | 7.36 | 8.77 | 11.68 | 8.98 | 6.79 | 10.53 | 12.90 | 2.4 | 24.8 | 23.1 | 20.7 | 23.8 | 26 | 23.6 | 24.2 | 24.1 | 23.9 | 20.7 | 23.2 |
| K2O | 1.30 | 0.06 | 0.07 | <0.01 | 0.05 | 1.22 | 0.52 | 0.68 | 0.02 | 0.15 | 0.01 | 0.03 | 1 | <0.01 | <0.01 | 0.02 | 0.02 | 0.54 | 0.05 | 0.03 | 0.02 | 0.04 | 0.01 |
| MgO | 1.41 | 0.43 | 0.9 | 1.92 | 2.01 | 1.48 | 1.95 | 0.80 | 0.38 | 1.26 | 1.79 | 2.71 | 3.97 | 3.51 | 1.74 | 3.57 | 4.28 | 3.62 | 3.15 | 4.72 | 3.98 | 3.7 | 3.99 |
| MnO | 0.12 | 0.04 | 0.03 | 0.16 | 0.09 | 0.11 | 0.14 | 0.06 | 0.09 | 0.10 | 0.13 | 0.04 | 0.18 | 0.18 | 0.09 | 0.18 | 0.2 | 0.22 | 0.16 | 0.25 | 0.22 | 0.18 | 0.17 |
| Na2O | <0.01 | 0.14 | 0.19 | 0.08 | <0.01 | 0.03 | 0.05 | <0.01 | <0.01 | 0.01 | 0.03 | 0.09 | 0.19 | 0.14 | 0.11 | 0.18 | 0.11 | 0.09 | 0.14 | 0.11 | 0.19 | 0.2 | 0.17 |
| P2O5 | 0.11 | 0.14 | 0.12 | 0.15 | 0.13 | 0.17 | 0.17 | 0.21 | 0.23 | 0.12 | 0.05 | 0.13 | 0.29 | 0.16 | 0.19 | 0.31 | 0.44 | 0.25 | 0.25 | 0.12 | 0.34 | 0.23 | 0.19 |
| TiO2 | 0.05 | 0.02 | 0.07 | 0.02 | 0.04 | 0.05 | 0.05 | 0.05 | 0.02 | 0.03 | 0.02 | 0.05 | 0.07 | 0.09 | 0.01 | 0.09 | 0.08 | 0.07 | 0.05 | 0.04 | 0.12 | 0.06 | 0.03 |
| LOI | 2.37 | 1.47 | 1.41 | 1.7 | 2.42 | 0.04 | 0.39 | 0.03 | 0.03 | −0.53 | −1.37 | 3.37 | <0.10 | <0.10 | <0.10 | <0.10 | 1.74 | 0.26 | 1.93 | 5.15 | 4.62 | <0.10 | <0.10 |
| CO2 | 3.16 | - | - | - | 4.61 | 0.17 | 1.88 | 0.34 | 0.17 | 0.17 | 0.17 | - | - | - | - | - | - | - | - | - | - | - | - |
| H2O+ | 1.02 | - | - | - | 0.68 | 0.60 | 0.42 | 0.64 | 0.36 | 0.42 | 0.28 | - | - | - | - | - | - | - | - | - | - | - | - |
| ppm | |||||||||||||||||||||||
| Li | 14.06 | 19.30 | 11.60 | 5.44 | 14.53 | 13.78 | 11.84 | 8.16 | 5.41 | 12.00 | 1.63 | 95.30 | 26.10 | 3.69 | 4.44 | 4.19 | 13.50 | 35.40 | 31.70 | 11.50 | 20.40 | 19.80 | 5.58 |
| Be | 0.76 | 0.48 | 0.70 | 0.70 | 0.60 | 0.29 | 0.67 | 0.34 | 0.20 | 0.44 | 0.39 | 1.78 | 1,41 | 1.71 | 0.51 | 1.70 | 0.29 | 0.80 | 0.94 | 0.38 | 0.43 | 0.44 | 1.04 |
| V | 6.51 | 8.95 | 8.01 | 6.94 | 22.48 | 16.51 | 10.22 | 12.42 | 5.70 | 13.71 | 2.63 | 68.30 | 61.40 | 30.10 | 22.20 | 24.80 | 46.00 | 40.10 | 26.50 | 43.90 | 48.10 | 36.40 | 33.80 |
| Ni | 2.04 | 8.15 | 2.91 | 9.08 | 5.37 | 5.37 | 2.34 | 3.05 | 1.13 | 1.38 | 1.25 | 6.93 | 12.50 | 12.20 | 3.07 | 5.15 | 6.24 | 10.40 | 6.51 | 3.71 | 9.70 | 3.75 | 9.39 |
| Co | 0.63 | 3.24 | 0.83 | 3.91 | 1.43 | 0.88 | 0.85 | 1.28 | 0.31 | 0.69 | 0.18 | 3.97 | 3.55 | 2.93 | 1.48 | 1.90 | 2.67 | 4.25 | 1.68 | 1.11 | 3.86 | 1.56 | 2.53 |
| Cr | 9.42 | 7.95 | 4.07 | 13.60 | 26.34 | 13.86 | 7.92 | 11.03 | 6.09 | 6.83 | 10.69 | 7.05 | 16.50 | 2.97 | 2.90 | 12.50 | 13.30 | 16.00 | 14.50 | 1.89 | 14.90 | 6.12 | 1.94 |
| Sc | 1.66 | 1.68 | 0.89 | 0.46 | 2.28 | 2.47 | 1.90 | 2.55 | 1.33 | 1.37 | 0.50 | 1.86 | 2.14 | 0.84 | 0.28 | 1.77 | 1.54 | 1.89 | 0.59 | 1.01 | 1.82 | 1.49 | 0.54 |
| Rb | 50.80 | 3.62 | 2.42 | 0.53 | 18.60 | 2.67 | 49.27 | 16.52 | 0.66 | 5.69 | 0.38 | 1.30 | 57.10 | 0.28 | 0.24 | 0.87 | 1.12 | 30.40 | 1.11 | 0.83 | 1.12 | 1.73 | 0.40 |
| Ba | 127.93 | 45.50 | 5.61 | 30.40 | 63.95 | 6.51 | 100.29 | 258.07 | 4.63 | 11.18 | 6.89 | 28.00 | 79.40 | 8.47 | 3.12 | 7.71 | 9.04 | 111.00 | 25.10 | 6.42 | 5.81 | 9.55 | 3.61 |
| Sr | 39.08 | 10.20 | 8.17 | 38.80 | 45.73 | 15.19 | 16.80 | 56.01 | 24.68 | 11.05 | 6.44 | 12.40 | 155.00 | 44.10 | 26.10 | 33.00 | 52.80 | 48.70 | 43.10 | 38.90 | 80.70 | 37.70 | 57.40 |
| Th | 1.21 | 0.53 | 0.34 | 0.23 | 1.14 | 0.67 | 1.33 | 1.25 | 0.46 | 0.35 | 0.04 | 0.39 | 1.56 | 0.43 | 0.25 | 0.57 | 1.29 | 2.06 | 0.25 | 0.10 | 0.42 | 1.36 | 0.28 |
| Zr | 18.59 | 7.37 | 9.26 | 1.19 | 23.06 | 6.61 | 18.84 | 18.99 | 3.65 | 5.49 | 0.68 | 10.90 | 1.27 | 0.82 | 0.66 | 1.89 | 0.50 | 1.46 | 0.91 | 0.24 | 1.46 | 0.56 | 0.54 |
| Cu | 1.88 | 17.50 | 16.00 | 24.20 | 3.82 | 9.34 | 2.00 | 25.85 | 1.66 | 2.09 | 1.45 | 14.00 | 1.27 | 27.50 | 20.20 | 1.02 | 1.14 | 2.16 | 13.40 | 7.86 | 2.42 | 0.94 | 0.89 |
| Zn | 12.66 | 12.10 | 5.62 | 43.90 | 9.94 | 7.47 | 25.43 | 6.50 | 10.43 | 9.58 | 4.34 | 29.20 | 32.10 | 24.90 | 20.10 | 19.60 | 32.60 | 24.40 | 35.50 | 16.80 | 15.90 | 22.90 | 15.10 |
| Ga | 2.30 | 1.45 | 1.48 | 1.29 | 0.97 | 1.24 | 1.67 | 1.89 | 0.57 | 1.09 | 0.19 | 11.10 | 6.34 | 2.46 | 1.63 | 3.00 | 5.65 | 5.82 | 2.48 | 4.56 | 6.15 | 4.29 | 2.51 |
| Nb | 1.15 | 0.38 | 0.28 | 0.28 | 0.78 | 0.41 | 0.48 | 1.01 | 0.23 | 0.47 | 0.10 | 0.27 | 1.22 | 0.38 | 0.48 | 0.59 | 0.49 | 1.62 | 0.99 | 0.62 | 0.48 | 0.60 | 0.63 |
| Cs | 0.77 | 0.33 | 0.29 | 0.16 | 0.15 | 0.38 | 0.33 | 0.21 | 0.04 | 0.26 | 0.07 | 0.56 | 9.67 | 0.06 | 0.03 | 0.13 | 0.20 | 4.88 | 0.31 | 0.14 | 0.26 | 0.34 | 0.10 |
| La | 3.22 | 2.64 | 4.63 | 3.45 | 12.00 | 10.41 | 6.63 | 20.90 | 13.36 | 4.76 | 1.68 | 34.00 | 12.70 | 5.35 | 3.02 | 5.90 | 8.37 | 15.90 | 3.69 | 3.89 | 12.10 | 6.79 | 4.62 |
| Ce | 7.21 | 5.61 | 6.53 | 5.33 | 24.58 | 22.75 | 13.51 | 38.15 | 22.04 | 9.29 | 2.86 | 23.50 | 25.10 | 9.57 | 5.40 | 13.10 | 16.60 | 29.00 | 6.23 | 6.32 | 24.10 | 12.50 | 7.73 |
| Pr | 0.80 | 0.65 | 0.70 | 0.67 | 2.74 | 2.16 | 1.46 | 3.75 | 2.10 | 1.00 | 0.34 | 1.83 | 2.89 | 1.11 | 0.63 | 1.73 | 1.96 | 3.32 | 0.71 | 0.72 | 2.98 | 1.46 | 0.89 |
| Nd | 3.22 | 2.88 | 2.90 | 2.36 | 10.57 | 8.12 | 5.58 | 13.50 | 8.03 | 4.03 | 1.53 | 6.33 | 11.80 | 4.45 | 2.30 | 7.60 | 7.60 | 11.90 | 3.04 | 3.21 | 11.60 | 5.92 | 3.72 |
| Sm | 0.78 | 0.67 | 0.55 | 0.48 | 1.89 | 1.45 | 1.03 | 2.21 | 1.34 | 0.78 | 0.29 | 1.09 | 2.03 | 0.76 | 0.38 | 1.75 | 1.51 | 2.03 | 0.67 | 0.54 | 2.12 | 1.18 | 0.87 |
| Eu | 0.22 | 0.22 | 0.15 | 0.31 | 0.49 | 0.37 | 0.30 | 0.57 | 0.38 | 0.28 | 0.18 | 0.40 | 0.51 | 0.30 | 0.18 | 0.39 | 0.53 | 0.59 | 0.26 | 0.17 | 0.65 | 0.28 | 0.27 |
| Gd | 0.94 | 0.85 | 0.74 | 0.60 | 1.69 | 1.34 | 1.13 | 2.00 | 1.40 | 0.86 | 0.38 | 1.71 | 1.86 | 0.71 | 0.47 | 1.58 | 1.60 | 1.82 | 0.69 | 0.83 | 2.02 | 1.18 | 0.87 |
| Tb | 0.15 | 0.16 | 0.12 | 0.09 | 0.23 | 0.18 | 0.16 | 0.25 | 0.18 | 0.12 | 0.05 | 0.27 | 0.33 | 0.15 | 0.09 | 0.30 | 0.28 | 0.33 | 0.14 | 0.11 | 0.32 | 0.17 | 0.17 |
| Dy | 0.97 | 0.90 | 0.64 | 0.62 | 1.22 | 1.02 | 1.02 | 1.27 | 1.00 | 0.80 | 0.37 | 1.60 | 2.06 | 0.72 | 0.55 | 1.99 | 1.69 | 1.93 | 0.87 | 0.74 | 1.72 | 1.22 | 1.00 |
| Y | 7.55 | 5.86 | 4.03 | 6.51 | 8.66 | 6.81 | 8.38 | 8.49 | 8.19 | 6.41 | 6.41 | 11.60 | 14.10 | 7.05 | 4.94 | 13.70 | 12.70 | 12.90 | 8.19 | 9.27 | 12.00 | 9.75 | 8.95 |
| Ho | 0.20 | 0.17 | 0.11 | 0.16 | 0.23 | 0.20 | 0.21 | 0.24 | 0.20 | 0.17 | 0.09 | 0.29 | 0.44 | 0.18 | 0.13 | 0.39 | 0.36 | 0.37 | 0.22 | 0.21 | 0.35 | 0.23 | 0.20 |
| Er | 0.65 | 0.54 | 0.36 | 0.43 | 0.72 | 0.64 | 0.71 | 0.78 | 0.66 | 0.55 | 0.29 | 0.83 | 1.33 | 0.50 | 0.40 | 1.20 | 1.08 | 1.21 | 0.67 | 0.65 | 0.98 | 0.78 | 0.67 |
| Tm | 0.09 | 0.08 | 0.05 | 0.07 | 0.09 | 0.08 | 0.10 | 0.10 | 0.08 | 0.08 | 0.04 | 0.13 | 0.21 | 0.08 | 0.07 | 0.22 | 0.15 | 0.19 | 0.10 | 0.12 | 0.13 | 0.14 | 0.10 |
| Yb | 0.60 | 0.53 | 0.31 | 0.50 | 0.58 | 0.56 | 0.70 | 0.67 | 0.55 | 0.52 | 0.28 | 0.86 | 1.19 | 0.46 | 0.49 | 1.41 | 1.03 | 1.28 | 0.60 | 0.85 | 0.90 | 0.82 | 0.70 |
| Lu | 0.09 | 0.08 | 0.05 | 0.08 | 0.09 | 0.08 | 0.11 | 0.10 | 0.08 | 0.08 | 0.04 | 0.13 | 0.18 | 0.07 | 0.09 | 0.21 | 0.17 | 0.23 | 0.10 | 0.15 | 0.15 | 0.13 | 0.12 |
| Hf | 0.54 | 0.20 | 0.08 | 0.06 | 0.51 | 0.20 | 0.55 | 0.52 | 0.12 | 0.15 | 0.03 | 0.20 | 0.10 | 0.05 | 0.03 | 0.15 | 0.02 | 0.09 | 0.04 | 0.01 | 0.07 | 0.03 | 0.04 |
| Ta | 0.12 | 0.03 | 0.03 | 0.03 | 0.04 | 0.04 | 0.06 | 0.07 | 0.02 | 0.04 | 0.01 | 0.15 | 0.01 | 0.00 | 0.02 | 0.01 | 0.01 | 0.01 | 0.00 | 0.00 | 0.04 | 0.01 | - |
| Pb | 2.72 | 7.21 | 19.50 | 4.15 | 5.64 | 2.19 | 5.31 | 2.99 | 4.24 | 1.12 | 4.76 | 8.05 | 1.55 | 0.90 | 0.53 | 0.77 | 1.06 | 2.95 | 3.49 | 1.50 | 1.04 | 1.24 | 0.80 |
| U | 0.83 | 0.79 | 0.63 | 0.21 | 0.47 | 1.85 | 0.50 | 0.99 | 0.86 | 0.28 | 0.07 | 2.29 | 0.72 | 0.18 | 0.14 | 0.28 | 0.41 | 0.72 | 0.22 | 0.13 | 0.14 | 0.37 | 0.10 |
| ΣREE | 19.13 | 15.98 | 17.84 | 15.15 | 57.11 | 49.38 | 32.66 | 84.49 | 51.40 | 23.33 | 8.41 | 72.97 | 62.63 | 24.41 | 14.20 | 37.77 | 42.93 | 70.10 | 17.99 | 18.51 | 60.12 | 32.80 | 21.93 |
| LREE | 15.46 | 12.67 | 15.46 | 12.60 | 52.28 | 45.27 | 28.52 | 79.08 | 47.25 | 20.14 | 6.87 | 67.15 | 55.03 | 21.54 | 11.91 | 30.47 | 36.57 | 62.74 | 14.60 | 14.85 | 53.55 | 28.13 | 18.10 |
| HREE | 3.67 | 3.31 | 2.38 | 2.55 | 4.83 | 4.11 | 4.14 | 5.41 | 4.15 | 3.19 | 1.54 | 5.82 | 7.60 | 2.87 | 2.29 | 7.30 | 6.36 | 7.36 | 3.39 | 3.66 | 6.57 | 4.67 | 3.83 |
| LREE/HREE | 4.21 | 3.83 | 6.50 | 4.94 | 10.83 | 11.02 | 6.90 | 14.61 | 11.39 | 6.32 | 4.45 | 11.54 | 7.24 | 7.51 | 5.20 | 4.17 | 5.75 | 8.52 | 4.31 | 4.06 | 8.15 | 6.02 | 4.73 |
| LaN/YbN | 0.37 | 0.34 | 1.01 | 0.47 | 1.40 | 1.25 | 0.64 | 2.10 | 1.64 | 0.61 | 0.41 | 2.67 | 0.72 | 0.79 | 0.42 | 0.28 | 0.55 | 0.84 | 0.42 | 0.31 | 0.91 | 0.56 | 0.45 |
| δEu | 1.40 | 1.55 | 1.25 | 3.07 | 1.47 | 1.40 | 1.50 | 1.43 | 1.47 | 1.80 | 2.82 | 1.56 | 1.39 | 2.17 | 2.26 | 1.25 | 1.81 | 1.63 | 2.03 | 1.35 | 1.67 | 1.26 | 1.65 |
| δCe | 1.08 | 1.03 | 0.87 | 0.84 | 1.03 | 1.16 | 1.05 | 1.04 | 1.00 | 1.03 | 0.91 | 0.72 | 1.00 | 0.95 | 0.94 | 0.99 | 0.99 | 0.96 | 0.93 | 0.91 | 0.97 | 0.96 | 0.92 |
| Y/Ho | 37.99 | 34.47 | 36.64 | 40.69 | 38.29 | 34.08 | 39.45 | 35.22 | 40.35 | 37.87 | 74.28 | 40.00 | 32.05 | 39.17 | 38.00 | 35.13 | 35.28 | 34.86 | 37.23 | 44.14 | 34.29 | 42.39 | 44.75 |
| REY | 26.68 | 21.84 | 21.87 | 21.66 | 65.76 | 56.18 | 41.04 | 92.98 | 59.59 | 29.74 | 14.82 | 84.57 | 76.73 | 31.46 | 19.14 | 51.47 | 55.63 | 83 | 26.18 | 27.78 | 72.12 | 42.55 | 30.88 |
| Sample Name | SJY20-10-2 | SJY20-10-7 | SJY20-7-4 | SJY20-8-1 | SJY20-8-3 | SJY20-11-5 | SJY20-13-1 | SJY20-13-2 | SJY20-13-3 | SJY20-9-2 |
|---|---|---|---|---|---|---|---|---|---|---|
| Lithology | Biotite leptynite | Biotite leptynite | Biotite leptynite | Biotite leptynite | Biotite leptynite | Biotite leptynite | chlorite–sericite schist | chlorite–sericite schist | chlorite–sericite schist | chlorite–sericite schist |
| location | On the roof of the main orebody | On the floor of the main orebody | On the roof of the main orebody | On the floor of the main orebody | On the roof of the main orebody | In the north of the main orebody | On the roof of the main orebody | On the roof of the main orebody | On the floor of the main orebody | On the floor of the main orebody |
| SiO2 (%) | 66.29 | 64.94 | 65.77 | 67.20 | 60.44 | 56.14 | 48.20 | 47.79 | 48.50 | 47.43 |
| Al2O3 (%) | 15.45 | 14.59 | 13.79 | 14.65 | 16.06 | 17.11 | 10.42 | 10.61 | 9.82 | 10.10 |
| CaO (%) | 2.02 | 3.16 | 1.44 | 1.85 | 2.09 | 5.81 | 6.48 | 7.11 | 7.60 | 6.71 |
| TFe2O3 (%) | 5.01 | 6.37 | 5.55 | 5.30 | 8.57 | 6.98 | 12.60 | 13.04 | 13.54 | 12.35 |
| FeO (%) | 3.48 | 4.06 | 3.92 | 3.77 | 6.72 | 3.70 | 9.09 | 9.59 | 9.30 | 8.51 |
| K2O (%) | 3.21 | 3.50 | 3.68 | 4.15 | 4.24 | 2.74 | 1.82 | 1.48 | 1.00 | 1.32 |
| MgO (%) | 2.52 | 3.00 | 3.38 | 2.67 | 3.52 | 3.64 | 14.95 | 14.84 | 14.76 | 15.32 |
| MnO (%) | 0.06 | 0.08 | 0.07 | 0.07 | 0.09 | 0.09 | 0.14 | 0.16 | 0.17 | 0.17 |
| Na2O (%) | 3.92 | 2.87 | 3.66 | 2.43 | 2.71 | 4.41 | 1.32 | 1.36 | 1.60 | 1.49 |
| P2O5 (%) | 0.14 | 0.16 | 0.16 | 0.16 | 0.18 | 0.35 | 0.19 | 0.13 | 0.16 | 0.17 |
| TiO2 (%) | 0.42 | 0.46 | 0.45 | 0.42 | 0.59 | 0.66 | 1.40 | 1.30 | 1.31 | 1.30 |
| CO2 (%) | 0.26 | 0.43 | 0.34 | 0.17 | 0.43 | 0.85 | 0.34 | 0.85 | 0.77 | 0.43 |
| H2O+ (%) | 1.00 | 1.24 | 1.70 | 1.66 | 1.32 | 1.22 | 2.56 | 1.78 | 1.22 | 3.54 |
| LOI (%) | 0.82 | 1.22 | 1.61 | 1.06 | 1.06 | 1.67 | 1.80 | 1.54 | 1.03 | 3.03 |
| ppm | ||||||||||
| Li | 25.69 | 41.56 | 32.49 | 41.68 | 44.31 | 19.72 | 72.58 | 35.53 | 11.93 | 58.72 |
| Be | 1.52 | 1.86 | 2.03 | 1.72 | 1.77 | 1.36 | 0.84 | 0.73 | 0.70 | 0.84 |
| V | 101.68 | 139.24 | 154.20 | 128.10 | 161.03 | 124.82 | 794.61 | 816.18 | 784.90 | 822.67 |
| Ni | 41.90 | 50.93 | 60.10 | 45.90 | 59.23 | 36.26 | 488.21 | 552.93 | 564.63 | 541.39 |
| Co | 14.86 | 15.21 | 20.44 | 16.07 | 19.02 | 19.34 | 63.72 | 70.79 | 64.43 | 62.77 |
| Cr | 100.38 | 131.12 | 163.47 | 123.00 | 130.44 | 34.68 | 1540.58 | 1620.43 | 1552.27 | 1635.78 |
| Sc | 10.64 | 13.76 | 12.95 | 11.48 | 14.96 | 11.36 | 32.55 | 30.53 | 28.29 | 29.08 |
| Rb | 97.99 | 141.58 | 122.32 | 129.12 | 144.53 | 74.03 | 89.06 | 85.73 | 51.68 | 43.09 |
| Ba | 1216.48 | 478.82 | 848.13 | 720.52 | 869.64 | 989.54 | 408.16 | 363.40 | 269.37 | 251.45 |
| Sr | 358.08 | 321.43 | 366.22 | 262.73 | 275.38 | 8.59 | 286.70 | 252.84 | 273.97 | 157.65 |
| Th | 7.22 | 8.30 | 8.21 | 6.94 | 7.81 | 3.34 | 1.52 | 1.41 | 1.51 | 1.40 |
| Zr | 137.29 | 158.52 | 156.02 | 119.85 | 138.33 | 153.70 | 111.65 | 106.19 | 109.87 | 106.49 |
| Cu | 40.15 | 26.70 | 28.20 | 36.73 | 25.22 | 24.24 | 88.62 | 95.18 | 101.21 | 90.07 |
| Zn | 70.32 | 67.47 | 68.59 | 79.21 | 92.47 | 66.32 | 99.27 | 104.74 | 104.59 | 99.75 |
| Ga | 18.82 | 17.65 | 18.52 | 17.92 | 20.62 | 19.94 | 16.30 | 15.68 | 14.55 | 15.31 |
| Nb | 6.68 | 7.32 | 6.47 | 6.16 | 8.41 | 5.26 | 7.12 | 6.27 | 6.79 | 6.68 |
| Cs | 5.36 | 8.88 | 5.91 | 6.40 | 9.28 | 7.76 | 6.92 | 7.80 | 4.51 | 3.40 |
| La | 24.02 | 28.88 | 27.89 | 23.92 | 33.10 | 40.91 | 12.62 | 13.82 | 14.10 | 14.98 |
| Ce | 49.65 | 57.83 | 56.41 | 49.12 | 66.21 | 79.43 | 28.40 | 31.05 | 31.96 | 33.68 |
| Pr | 5.29 | 6.67 | 6.19 | 5.52 | 7.67 | 9.10 | 3.58 | 3.87 | 3.98 | 4.20 |
| Nd | 18.94 | 21.86 | 21.25 | 19.32 | 26.25 | 29.85 | 15.16 | 15.38 | 15.93 | 16.83 |
| Sm | 3.52 | 4.32 | 3.95 | 3.62 | 5.11 | 5.01 | 3.79 | 3.63 | 3.72 | 3.88 |
| Eu | 0.91 | 1.09 | 0.90 | 0.95 | 1.24 | 1.35 | 1.10 | 1.10 | 1.13 | 1.16 |
| Gd | 2.94 | 3.92 | 3.18 | 2.96 | 4.43 | 3.85 | 3.92 | 3.59 | 3.67 | 3.70 |
| Tb | 0.41 | 0.62 | 0.45 | 0.43 | 0.63 | 0.51 | 0.56 | 0.53 | 0.54 | 0.54 |
| Dy | 2.31 | 3.90 | 2.50 | 2.33 | 3.56 | 2.61 | 3.25 | 3.06 | 3.07 | 3.14 |
| Y | 12.67 | 24.77 | 13.53 | 11.92 | 19.96 | 14.68 | 16.54 | 15.54 | 15.47 | 15.84 |
| Ho | 0.42 | 0.75 | 0.47 | 0.42 | 0.65 | 0.47 | 0.57 | 0.53 | 0.54 | 0.54 |
| Er | 1.33 | 2.45 | 1.52 | 1.33 | 2.05 | 1.48 | 1.61 | 1.52 | 1.54 | 1.56 |
| Tm | 0.18 | 0.35 | 0.21 | 0.18 | 0.27 | 0.19 | 0.20 | 0.19 | 0.19 | 0.19 |
| Yb | 1.31 | 2.54 | 1.50 | 1.32 | 1.91 | 1.31 | 1.33 | 1.25 | 1.27 | 1.27 |
| Lu | 0.20 | 0.36 | 0.22 | 0.19 | 0.28 | 0.19 | 0.18 | 0.17 | 0.17 | 0.17 |
| Hf | 3.70 | 4.00 | 4.13 | 3.27 | 3.74 | 3.69 | 2.94 | 2.76 | 2.83 | 2.76 |
| Ta | 0.51 | 0.52 | 0.51 | 0.47 | 0.61 | 0.29 | 0.40 | 0.38 | 0.37 | 0.36 |
| Pb | 41.13 | 20.34 | 7.86 | 23.21 | 16.04 | 10.63 | 3.59 | 3.51 | 3.95 | 3.21 |
| U | 2.87 | 5.88 | 3.14 | 2.63 | 3.14 | 0.99 | 0.42 | 0.42 | 0.30 | 0.31 |
| ΣREE | 111.45 | 135.54 | 126.63 | 111.60 | 153.35 | 176.26 | 76.27 | 79.70 | 81.79 | 85.86 |
| LREE | 102.34 | 120.65 | 116.59 | 102.44 | 139.57 | 165.65 | 64.66 | 68.85 | 70.81 | 74.73 |
| HREE | 9.10 | 14.89 | 10.04 | 9.16 | 13.77 | 10.61 | 11.61 | 10.86 | 10.97 | 11.13 |
| LREE/HREE | 11.24 | 8.10 | 11.61 | 11.18 | 10.14 | 15.62 | 5.57 | 6.34 | 6.45 | 6.72 |
| LaN/YbN | 13.12 | 8.16 | 13.36 | 13.03 | 12.45 | 22.33 | 6.82 | 7.92 | 7.97 | 8.45 |
| δEu | 0.86 | 0.81 | 0.78 | 0.88 | 0.80 | 0.94 | 0.87 | 0.93 | 0.93 | 0.94 |
| δCe | 1.08 | 1.02 | 1.05 | 1.05 | 1.02 | 1.01 | 1.04 | 1.04 | 1.05 | 1.04 |
| SJY20-10-2 | ||||||||||||
|---|---|---|---|---|---|---|---|---|---|---|---|---|
| Sample Spot | U (ppm) | Th (ppm) | Th/U | 207Pb/206Pb | 1σ | 207Pb/235U | 1σ | 206Pb/238U | 1σ | 207Pb/206Pb Age | 1σ | Concordance |
| spot.5 | 100.48 | 85.77 | 0.85 | 0.16839 | 0.00277 | 11.40404 | 0.24943 | 0.49332 | 0.00902 | 2538 | 29 | 98.29 |
| spot.7 | 113.42 | 64.21 | 0.57 | 0.18293 | 0.00244 | 13.56690 | 0.21552 | 0.54285 | 0.00844 | 2674 | 22 | 95.76 |
| spot. 9 | 148.36 | 99.69 | 0.67 | 0.16780 | 0.00249 | 11.17271 | 0.20038 | 0.48448 | 0.00652 | 2529 | 25 | 99.38 |
| spot.10 | 170.42 | 75.61 | 0.44 | 0.17821 | 0.00218 | 11.10259 | 0.16094 | 0.45614 | 0.00667 | 2632 | 20 | 91.28 |
| spot.11 | 104.48 | 50.29 | 0.48 | 0.16954 | 0.00228 | 10.58300 | 0.21966 | 0.45527 | 0.00842 | 2548 | 23 | 94.54 |
| spot.15 | 146.69 | 103.41 | 0.70 | 0.17486 | 0.00220 | 12.27662 | 0.17982 | 0.51192 | 0.00653 | 2600 | 21 | 97.62 |
| spot.20 | 30.05 | 20.18 | 0.67 | 0.16479 | 0.00395 | 11.18630 | 0.37162 | 0.49232 | 0.01210 | 2496 | 43 | 96.93 |
| spot.21 | 71.09 | 51.31 | 0.72 | 0.17273 | 0.00291 | 11.46805 | 0.25801 | 0.48229 | 0.00734 | 2576 | 28 | 98.37 |
| spot.22 | 148.14 | 59.24 | 0.40 | 0.16932 | 0.00250 | 11.60372 | 0.17145 | 0.49875 | 0.00627 | 2545 | 24 | 97.61 |
| spot.23 | 141.25 | 95.59 | 0.68 | 0.16862 | 0.00231 | 11.33147 | 0.18201 | 0.48856 | 0.00650 | 2538 | 23 | 99.05 |
| spot.26 | 116.25 | 86.05 | 0.74 | 0.16858 | 0.00242 | 11.76116 | 0.20508 | 0.50712 | 0.00816 | 2541 | 23 | 96.19 |
| spot.27 | 202.65 | 117.31 | 0.58 | 0.17045 | 0.00205 | 11.45603 | 0.18549 | 0.48624 | 0.00651 | 2558 | 20 | 99.81 |
| spot.29 | 179.83 | 103.37 | 0.57 | 0.16859 | 0.00196 | 11.26849 | 0.18203 | 0.48363 | 0.00742 | 2545 | 19 | 99.82 |
| spot.30 | 92.22 | 74.61 | 0.81 | 0.18524 | 0.00260 | 12.97982 | 0.25334 | 0.50734 | 0.00735 | 2695 | 23 | 98.06 |
| spot.31 | 104.87 | 62.26 | 0.59 | 0.18822 | 0.00270 | 13.72893 | 0.25148 | 0.52820 | 0.00732 | 2721 | 24 | 99.59 |
| spot.32 | 200.45 | 167.65 | 0.84 | 0.16818 | 0.00216 | 10.60670 | 0.15158 | 0.45690 | 0.00598 | 2535 | 22 | 95.46 |
| spot.33 | 110.65 | 78.35 | 0.71 | 0.17011 | 0.00264 | 12.07263 | 0.23783 | 0.51551 | 0.00799 | 2552 | 26 | 95.29 |
| spot.34 | 186.76 | 114.67 | 0.61 | 0.16897 | 0.00224 | 10.75917 | 0.18412 | 0.45994 | 0.00679 | 2542 | 22 | 95.70 |
| spot.36 | 125.71 | 101.53 | 0.81 | 0.17171 | 0.00204 | 11.32024 | 0.16965 | 0.47686 | 0.00639 | 2570 | 20 | 97.69 |
| spot.38 | 127.25 | 123.25 | 0.97 | 0.17050 | 0.00241 | 11.16960 | 0.18439 | 0.47217 | 0.00579 | 2560 | 25 | 97.26 |
| SJY20-10-6 | ||||||||||||
| Sample Spot | U (ppm) | Th (ppm) | Th/U | 207Pb/206Pb | 1σ | 207Pb/235U | 1σ | 206Pb/238U | 1σ | 207Pb/206Pb Age | 1σ | Concordance |
| spot.1 | 169.66 | 62.64 | 0.37 | 0.17313 | 0.00194 | 11.80878 | 0.19493 | 0.49050 | 0.00660 | 2590 | 20 | 99.43 |
| spot.5 | 154.72 | 102.18 | 0.66 | 0.18240 | 0.00620 | 12.42505 | 0.60462 | 0.48626 | 0.00788 | 2650 | 47 | 96.14 |
| spot.8 | 109.75 | 75.84 | 0.69 | 0.26216 | 0.00344 | 21.95509 | 0.64670 | 0.60526 | 0.01457 | 3255 | 21 | 93.06 |
| spot.11 | 225.78 | 138.11 | 0.61 | 0.16732 | 0.00177 | 10.12759 | 0.19588 | 0.44003 | 0.00814 | 2527 | 17 | 92.36 |
| spot.15 | 101.78 | 38.47 | 0.38 | 0.27032 | 0.00305 | 23.42254 | 0.43638 | 0.63013 | 0.01118 | 3304 | 18 | 94.97 |
| spot.16 | 201.83 | 206.10 | 1.02 | 0.17553 | 0.00258 | 10.87217 | 0.23523 | 0.44984 | 0.01129 | 2609 | 26 | 90.82 |
| spot.17 | 136.98 | 90.34 | 0.66 | 0.16971 | 0.00233 | 10.89254 | 0.24973 | 0.46676 | 0.00978 | 2553 | 22 | 96.47 |
| spot.18 | 69.91 | 79.67 | 1.14 | 0.16708 | 0.00302 | 11.30578 | 0.24830 | 0.49281 | 0.00906 | 2519 | 31 | 97.65 |
| spot.19 | 184.03 | 106.73 | 0.58 | 0.16993 | 0.00231 | 10.61513 | 0.25060 | 0.45311 | 0.00947 | 2555 | 24 | 93.79 |
| spot.20 | 208.42 | 134.60 | 0.65 | 0.16837 | 0.00187 | 11.38212 | 0.13789 | 0.49057 | 0.00646 | 2541 | 18 | 98.80 |
| spot.21 | 164.33 | 69.25 | 0.42 | 0.16995 | 0.00218 | 10.80472 | 0.30527 | 0.46181 | 0.01199 | 2552 | 21 | 95.48 |
| spot.22 | 91.61 | 68.59 | 0.75 | 0.17290 | 0.00305 | 11.62594 | 0.23693 | 0.48776 | 0.00797 | 2577 | 29 | 99.27 |
| spot.23 | 129.95 | 119.65 | 0.92 | 0.17055 | 0.00223 | 12.16836 | 0.18055 | 0.52032 | 0.00791 | 2561 | 21 | 94.92 |
| spot.25 | 96.45 | 75.71 | 0.78 | 0.16627 | 0.00272 | 11.33251 | 0.19176 | 0.49717 | 0.00675 | 2517 | 27 | 96.80 |
| spot.26 | 166.36 | 93.38 | 0.56 | 0.21818 | 0.00314 | 17.41854 | 0.40168 | 0.57895 | 0.00874 | 2961 | 24 | 99.33 |
| spot.27 | 143.22 | 82.20 | 0.57 | 0.20610 | 0.00242 | 16.28574 | 0.24471 | 0.57423 | 0.00755 | 2874 | 18 | 98.31 |
| spot.30 | 204.16 | 128.17 | 0.63 | 0.18278 | 0.00219 | 11.66460 | 0.21631 | 0.46400 | 0.00815 | 2674 | 20 | 91.07 |
| spot.31 | 293.18 | 194.87 | 0.66 | 0.16668 | 0.00177 | 10.19212 | 0.28303 | 0.44407 | 0.01194 | 2521 | 18 | 93.31 |
| SJY20-10-2 | ||||||||||||||||||
|---|---|---|---|---|---|---|---|---|---|---|---|---|---|---|---|---|---|---|
| Test Points | Spot.7 | Spot. 9 | Spot.10 | Spot.15 | Spot.20 | Spot.21 | Spot.22 | Spot.23 | Spot.26 | Spot.27 | Spot.29 | Spot.30 | Spot.31 | Spot.32 | Spot.33 | Spot.34 | Spot.36 | Spot.38 |
| La | 0.00 | 0.03 | 0.33 | 0.02 | 0.02 | 0.02 | 0.00 | 0.04 | 0.30 | 1.71 | 0.10 | 0.21 | 0.00 | 0.08 | 0.03 | 0.16 | 0.01 | 0.05 |
| Ce | 11.61 | 13.94 | 27.93 | 11.80 | 5.42 | 9.71 | 9.82 | 11.87 | 16.98 | 20.98 | 14.49 | 10.03 | 8.97 | 23.53 | 17.63 | 29.18 | 32.28 | 26.90 |
| Pr | 0.06 | 0.15 | 0.57 | 0.29 | 0.04 | 0.12 | 0.04 | 0.17 | 0.29 | 0.51 | 0.23 | 0.31 | 0.03 | 0.25 | 0.12 | 0.15 | 0.07 | 0.28 |
| Nd | 1.03 | 1.78 | 4.41 | 3.98 | 0.52 | 1.71 | 0.64 | 2.01 | 3.25 | 2.14 | 2.17 | 3.85 | 0.79 | 3.21 | 1.79 | 1.32 | 1.31 | 3.90 |
| Sm | 1.91 | 3.44 | 4.38 | 6.69 | 1.08 | 2.89 | 1.09 | 3.83 | 4.20 | 1.37 | 2.83 | 5.87 | 1.87 | 5.12 | 2.66 | 2.11 | 2.67 | 6.25 |
| Eu | 0.51 | 1.43 | 1.49 | 1.58 | 0.64 | 1.32 | 0.31 | 0.84 | 1.06 | 0.54 | 0.97 | 1.81 | 0.37 | 1.59 | 1.24 | 0.99 | 0.41 | 1.68 |
| Gd | 10.73 | 18.64 | 13.86 | 33.59 | 6.22 | 16.29 | 6.09 | 16.07 | 19.90 | 5.39 | 12.24 | 29.78 | 9.60 | 22.81 | 12.67 | 9.52 | 11.41 | 24.00 |
| Tb | 3.32 | 6.13 | 4.65 | 10.16 | 2.10 | 5.67 | 2.05 | 5.08 | 6.25 | 1.58 | 3.87 | 9.66 | 3.60 | 6.82 | 3.93 | 3.35 | 3.47 | 6.55 |
| Dy | 39.73 | 75.32 | 53.38 | 120.08 | 25.60 | 78.94 | 25.45 | 57.25 | 72.41 | 20.71 | 44.61 | 115.70 | 46.88 | 80.98 | 45.33 | 40.17 | 37.64 | 71.97 |
| Ho | 14.88 | 28.42 | 19.60 | 42.83 | 10.23 | 32.62 | 9.81 | 20.15 | 26.42 | 8.04 | 17.00 | 41.20 | 18.69 | 29.16 | 16.67 | 15.75 | 12.95 | 23.96 |
| Er | 71.43 | 140.87 | 98.86 | 194.13 | 53.30 | 171.50 | 49.31 | 95.51 | 128.59 | 42.63 | 84.78 | 192.17 | 98.40 | 140.73 | 86.85 | 78.61 | 58.39 | 110.88 |
| Tm | 14.65 | 30.11 | 21.31 | 38.05 | 12.42 | 37.99 | 10.65 | 19.37 | 26.61 | 9.94 | 19.27 | 38.37 | 21.60 | 30.19 | 19.54 | 18.52 | 12.21 | 23.61 |
| Yb | 143.17 | 292.96 | 221.19 | 342.23 | 130.90 | 382.85 | 107.51 | 178.23 | 251.31 | 107.46 | 192.42 | 355.84 | 217.25 | 291.69 | 203.58 | 190.69 | 115.17 | 225.97 |
| Lu | 29.05 | 58.77 | 47.74 | 65.10 | 29.84 | 83.58 | 21.85 | 35.86 | 52.02 | 24.37 | 42.11 | 70.87 | 46.30 | 62.12 | 46.08 | 42.85 | 23.26 | 46.39 |
| SJY20-10-6 | ||||||||||||||||||
| Test points | spot.1 | spot.5 | spot.8 | spot.11 | spot.15 | spot.16 | spot.17 | spot.18 | spot.19 | spot.20 | spot.21 | spot.22 | spot.23 | spot.25 | spot.26 | spot.27 | spot.30 | spot.31 |
| La | 0.39 | 0.19 | 0.28 | 0.08 | 0.09 | 0.11 | 0.14 | - | 28.31 | 0.03 | 0.05 | 0.13 | 0.00 | 0.00 | 0.05 | 0.25 | 1.16 | 4.85 |
| Ce | 17.94 | 13.92 | 12.25 | 14.91 | 7.55 | 32.06 | 20.30 | 21.30 | 101.12 | 12.18 | 14.61 | 28.06 | 27.02 | 17.05 | 30.10 | 14.02 | 24.51 | 48.17 |
| Pr | 0.44 | 0.23 | 0.50 | 0.26 | 0.21 | 0.31 | 0.26 | 0.15 | 10.68 | 0.18 | 0.10 | 0.28 | 0.14 | 0.12 | 0.32 | 0.54 | 1.18 | 2.84 |
| Nd | 3.22 | 2.38 | 5.09 | 3.01 | 2.81 | 3.64 | 3.16 | 2.98 | 48.57 | 2.54 | 1.09 | 3.25 | 2.39 | 2.52 | 5.64 | 4.89 | 7.81 | 13.40 |
| Sm | 3.95 | 3.80 | 5.79 | 4.58 | 3.44 | 4.98 | 4.40 | 4.28 | 12.31 | 4.60 | 1.16 | 3.90 | 4.40 | 4.76 | 9.70 | 6.04 | 6.80 | 7.25 |
| Eu | 0.82 | 0.77 | 2.05 | 0.95 | 2.17 | 1.41 | 1.14 | 1.07 | 2.79 | 0.95 | 0.71 | 1.65 | 0.93 | 0.83 | 1.60 | 2.19 | 2.62 | 1.84 |
| Gd | 17.80 | 12.48 | 18.33 | 20.03 | 11.64 | 18.67 | 20.80 | 18.70 | 17.86 | 21.65 | 4.91 | 14.19 | 19.72 | 21.26 | 27.84 | 28.82 | 19.24 | 20.77 |
| Tb | 5.87 | 3.94 | 4.78 | 5.85 | 2.99 | 5.64 | 6.51 | 5.06 | 3.92 | 6.75 | 1.22 | 4.01 | 5.68 | 6.63 | 5.67 | 9.35 | 5.07 | 5.84 |
| Dy | 74.12 | 44.94 | 54.40 | 68.50 | 29.92 | 61.37 | 82.21 | 56.20 | 42.26 | 74.11 | 14.20 | 45.93 | 68.22 | 78.03 | 46.22 | 115.19 | 57.17 | 68.84 |
| Ho | 29.48 | 16.58 | 18.99 | 24.39 | 10.22 | 22.08 | 31.14 | 19.77 | 14.82 | 26.56 | 6.01 | 16.70 | 25.00 | 28.05 | 11.33 | 43.41 | 20.34 | 25.46 |
| Er | 151.59 | 78.02 | 90.30 | 113.40 | 46.89 | 102.85 | 156.42 | 92.52 | 75.16 | 124.90 | 33.49 | 80.61 | 124.60 | 133.41 | 38.93 | 209.87 | 100.85 | 123.55 |
| Tm | 33.29 | 16.23 | 18.98 | 23.21 | 9.77 | 21.25 | 33.10 | 19.19 | 16.33 | 26.10 | 8.33 | 17.04 | 26.11 | 26.96 | 5.89 | 42.85 | 22.37 | 26.82 |
| Yb | 319.98 | 145.52 | 182.40 | 216.05 | 94.28 | 195.59 | 306.06 | 175.94 | 160.37 | 235.97 | 96.36 | 162.23 | 239.87 | 242.94 | 41.98 | 400.87 | 220.19 | 256.94 |
| Lu | 70.26 | 29.59 | 39.12 | 43.13 | 20.55 | 39.13 | 64.42 | 35.93 | 34.54 | 48.58 | 24.47 | 34.55 | 49.86 | 47.89 | 7.33 | 82.87 | 47.68 | 52.58 |
Disclaimer/Publisher’s Note: The statements, opinions and data contained in all publications are solely those of the individual author(s) and contributor(s) and not of MDPI and/or the editor(s). MDPI and/or the editor(s) disclaim responsibility for any injury to people or property resulting from any ideas, methods, instructions or products referred to in the content. |
© 2023 by the authors. Licensee MDPI, Basel, Switzerland. This article is an open access article distributed under the terms and conditions of the Creative Commons Attribution (CC BY) license (https://creativecommons.org/licenses/by/4.0/).
Share and Cite
Gao, X.; Wang, D.; Huang, F.; Wang, Y.; Wang, C. Chronolgy and Geochemistry of the Sijiaying Iron Deposit in Eastern Hebei Province, North China Craton: Implications for the Genesis of High-Grade Iron Ores. Minerals 2023, 13, 775. https://doi.org/10.3390/min13060775
Gao X, Wang D, Huang F, Wang Y, Wang C. Chronolgy and Geochemistry of the Sijiaying Iron Deposit in Eastern Hebei Province, North China Craton: Implications for the Genesis of High-Grade Iron Ores. Minerals. 2023; 13(6):775. https://doi.org/10.3390/min13060775
Chicago/Turabian StyleGao, Xinyu, Denghong Wang, Fan Huang, Yan Wang, and Chenghui Wang. 2023. "Chronolgy and Geochemistry of the Sijiaying Iron Deposit in Eastern Hebei Province, North China Craton: Implications for the Genesis of High-Grade Iron Ores" Minerals 13, no. 6: 775. https://doi.org/10.3390/min13060775