Article

Optimization of Soil-Sludge Mixtures by Compaction for Potential Use in Mine Site Reclamation

Research Institute on Mines and the Environment (RIME), Université du Québec en Abitibi—Témiscamingue (UQAT), 445 Boul. de l’Université, Rouyn-Noranda, QC J9X 5E4, Canada
*
Author to whom correspondence should be addressed.
Minerals 2023, 13(6), 806; https://doi.org/10.3390/min13060806
Submission received: 2 May 2023 / Revised: 7 June 2023 / Accepted: 7 June 2023 / Published: 13 June 2023
(This article belongs to the Special Issue Reutilization and Valorization of Mine Waste, Volume II)

Abstract

:
Studies have indicated the potential of mixtures of silty soil and sludge produced by active treatment of acid mine drainage for use in covers with capillary barrier effects for mine site reclamation. Very high water contents of sludge in the settling pond could negatively affect the required hydrogeotechnical properties of soil sludge mixtures with high sludge contents. The challenge is then to determine the optimum wet sludge content of soil-sludge mixtures with air entry values (AEV) and/or saturated hydraulic conductivity (ksat) required for use in mine site reclamation covers. This paper presents a method to determine the optimum wet sludge content βopt for obtaining the maximum dry density of compacted soil-sludge mixtures. Two types of soil (S1 and S2) and two types of sludge (A and W) were tested. It was observed that βopt can be determined when the initial water content of the soil used in the mixture is lower than the optimum water content determined from the Proctor curve of the soil alone (10 wt% and 6 wt% for soils S1 and S2, respectively) and that βopt does not change with increasing initial soil water content. Optimum wet sludge contents found were low (≈15 wt% and ≈7 wt% for mixtures containing soils S1 and S2, respectively) for the test conditions, indicting a limited quantity of reusable sludge in the mixtures. For all mixtures, the water content corresponding to βopt was close to the optimum water content of the soil alone. Results of soil water retention and saturated hydraulic conductivity (ksat) tests conducted on selected optimized mixtures indicated that the mixtures based on soils S1 and S2 have air entry values higher than 20 kPa and would be suitable for use in the moisture retention layer of covers with capillary barrier effects, while soil S2 and the derived mixtures exhibited ksat < 10−7 cm/s and would be potential materials for the low permeability layer in low saturated hydraulic conductivity covers.

1. Introduction

Mines generate acid mine drainage (AMD) due to the production of sulfide-rich wastes that are stored in tailings storage facilities. Direct and indirect oxidation reactions are involved in AMD generation. The chemical reaction of the direct oxidation processes of pyrite, which is the most abundant of the sulfide minerals, by oxygen in the presence of water is presented in Equation (1) [1,2]. At low pH, the ferrous iron (Fe2+), due to oxidation, turns into ferric iron (Fe3+), which in turn becomes an additional fuel for the pyrite’s indirect oxidation. Chemical reactions describing the steps for the indirect oxidation of pyrite using oxygen and ferric iron (Fe3+) for given pH conditions are extensively described in the literature [1,2].
2 F e S 2 + 7 O 2 + 2 H 2 O = 2 F e 2 + + 2 S O 4 2 + 4 H +
Reclamation gradually reduces the generation of this acidic water, which generally contains iron (Fe), zinc (Zn), other metals, and sulfate (SO42−). In humid climates, mines can be reclaimed using different types of covers that act as oxygen and/or water barriers to control oxygen and water infiltration into the reactive mine tailings to cut fuel to the chemical reaction described by Equation (1) [3,4,5]. Each cover type requires a specific hydrogeological design. A layered cover with capillary barrier effects (CCBE) is one option for an effective oxygen barrier [4,6,7]. A CCBE has at least one layer of fine material, the moisture-retaining layer (MRL) placed between two layers of coarse material to provide particle size contrast. This contrast and the resulting hydrogeological contrast act to create capillary barrier effects that allow the fine material to maintain its saturation. This greatly limits oxygen fluxes from the atmosphere from reaching the tailings, and consequently limits the amount of AMD [8,9]. However, the MRL must have a water retention capacity with an air-entry pressure (AEV) of at least 20 to 50 kPa [10,11], provided that the hydrogeotechnical properties of the underlying capillary break layer (CBL) creates capillary barrier effects when the AEV of the MRL is higher than the water entry value of the underlying CBL [12].
Low saturated hydraulic conductivity covers (LSHCCs) can also limit water infiltration. They generally include a layer of low saturated hydraulic conductivity (ksat) made of natural materials (clays) or geosynthetics (geomembranes and/or bentonite geocomposites) with a ksat less than 10−7 cm/s [3,13].
As long as a given mine site generates AMD (before and after reclamation), active water treatment techniques are generally used to neutralize the acidity before discharging harmless treated waters into the natural effluent (environment). Active AMD treatments use neutralization reactions involving alkaline chemicals such as ammonia, hydrated lime, and caustic soda [14,15,16,17]. Nowadays, the high-density sludge (HDS) process is favored compared to the low-density treatment method because the former allows for reducing the sludge volume by greatly increasing its solids concentration [14,15,16,17]. This chemical treatment produces enormous quantities of sludge, resulting in major environmental management issues for the mining industry. In 1997, authors of [18] reported that 6,736,600 m3 of AMD treatment sludge was produced annually in Canada, which required storage (settling ponds) 335 ha in area. The ecological footprint for sludge management could be reduced if the settled sludge in ponds could be recovered or reused, especially considering that the alkaline to neutral pH of sludge can be maintained for many years, or even centuries, due to excess alkalinity induced by alkaline chemicals [18]. This alkalinity contributes to the chemical stability of the sludge over time by preventing sludge dissolution and metal remobilization. It should be mentioned that new technologies for active AMD treatment are emerging, including the two-step neutralization ferrite-formation process, which presents some advantages compared to the HDS process [19,20].
Knowing that sludge alone cannot be used as a component of reclamation covers [21], previous studies investigated the potential valorization of waste rock–sludge, tailings–sludge, and soil-sludge mixtures in reclamation covers. Laboratory column leaching tests showed that waste rock-sludge mixtures placed over waste rock and tailings–sludge mixtures deposited over tailings reduced the metal loads in the column effluent [22]. A laboratory study by authors of [23] showed that silt-sludge mixtures can meet the hydrogeological properties required for the fine material (or moisture retention layer—MRL) of CCBEs. Experimental field plots have confirmed the performance of these mixtures as water and oxygen barriers in CCBEs [24,25]. These mixtures could be used in reclamation covers when fine materials with the abovementioned characteristics are unavailable in the vicinity of the sites to be reclaimed. The reuse of in-pond settled sludge would free up storage volume for new sludge and reduce the mass (or volume) of borrow soil required for mine site rehabilitation, as demonstrated by authors of [23].
Nevertheless, these promising studies on the potential use of soil-sludge mixtures in CCBEs were preliminary, as they were based on a single soil (a silt) and a single sludge type, which greatly limits the practical applicability. Hence, it would be advantageous to study other mixtures made of different sludge and soil types. However, one of the challenges in determining the optimal and efficient use of sludge in soil-sludge mixtures is the very high natural gravimetric water content (w) of sludge, even after settling and dewatering in ponds, which negatively affects the targeted hydrogeotechnical properties of the mixtures and limits the quantity of reusable sludge [23]. It would therefore be important to determine the optimum quantity of sludge in the mixtures.
This paper presents an optimization method that consists of determining the optimum sludge content in soil-sludge mixtures compacted using the modified effort test according to the ASTM D1557-12e1 standard [26]. Two types of soil and sludge were used for this study. The hydrogeotechnical properties (saturated hydraulic conductivity and water retention capacity) were determined for selected mixtures. Two hypotheses underlie this study: (i) for a given soil and sludge, an optimum sludge content that obtains a maximum dry density of the compacted mixture can be determined; and (ii) the optimized mixture has the required hydrogeotechnical characteristics for use as material for the water retention layer in CCBEs or the low permeability layer in LSHCCs.

2. Materials and Methods

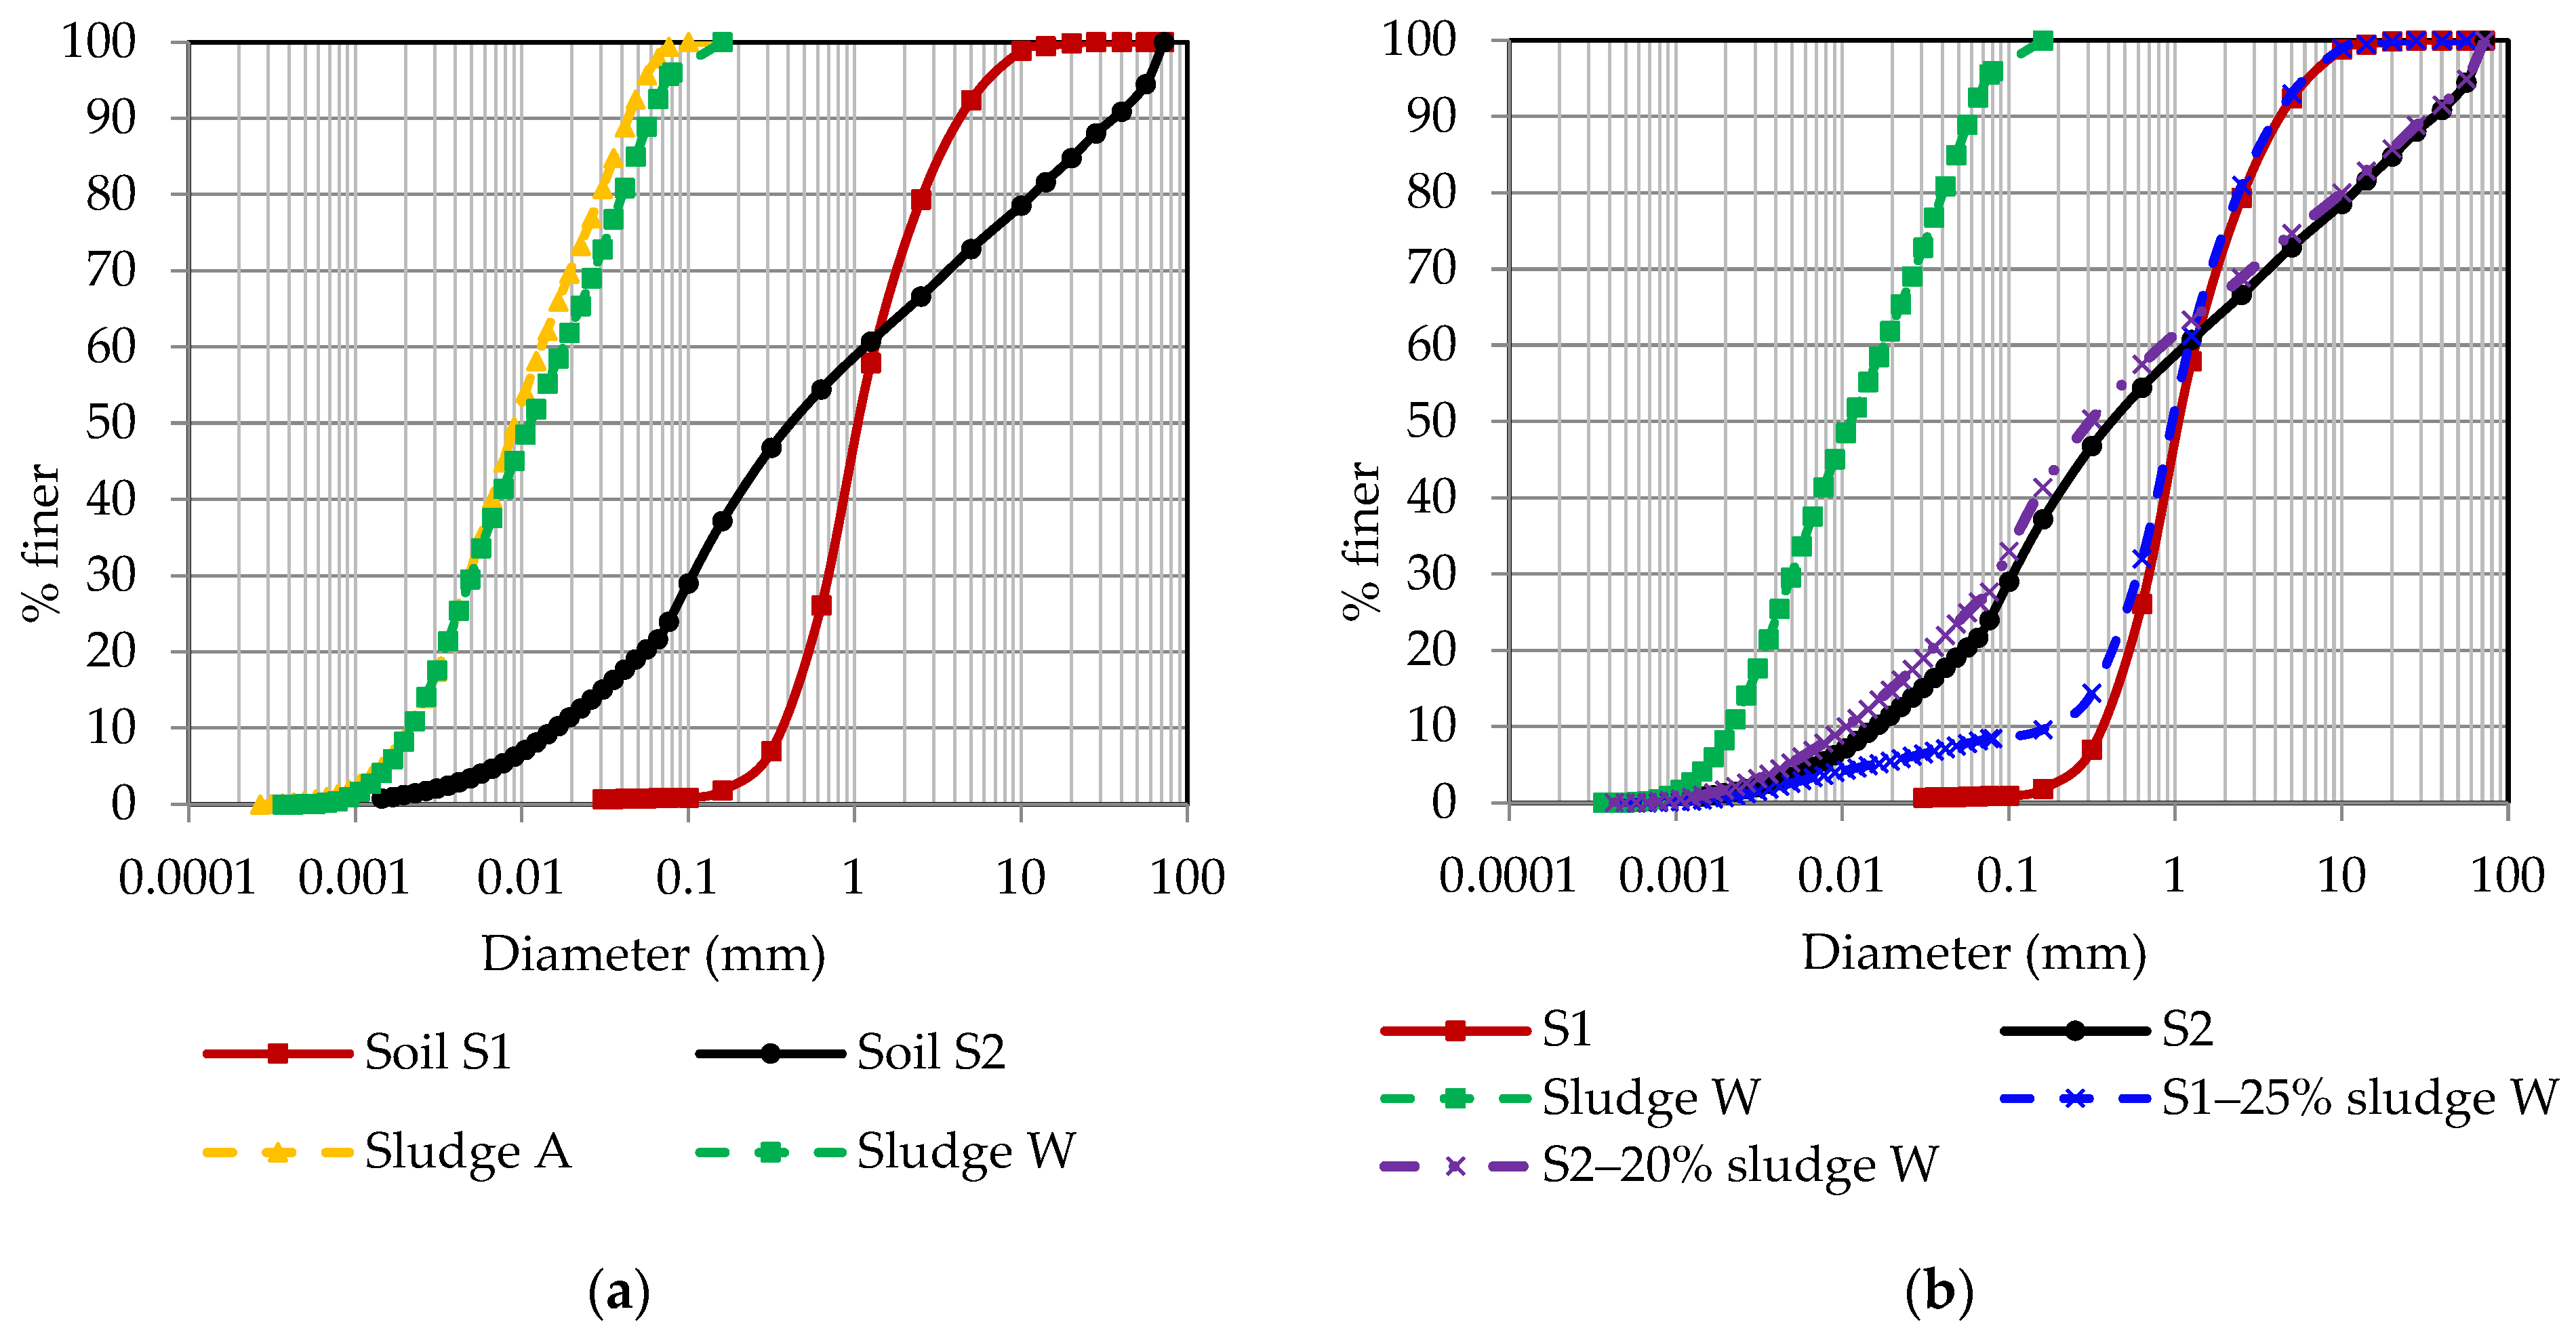
2.1. Characterization of Base Materials and Preparation of Soil-Sludge Mixtures

Two sludges, A and W, were sampled from settling ponds at mine sites A and W located in Abitibi (QC, Canada), respectively. Sludge A was freshly deposited (after emptying an existing settling pond), while sludge W was taken from a pond that has been inactive for several years, and on which a vegetation colony has developed naturally. Two soils (S1 and S2) sampled from mine site W were used. The materials were homogenized and kept in hermetically closed barrels to prevent any changes in water content. The initial/natural water contents of the sampled soils were 3.5% and 7.5% for soils S1 and S2, respectively, and the initial/natural water contents of the sampled sludges were 200% and 175% for sludges A and W, respectively.
Soil-sludge mixtures were prepared in the laboratory from wet materials with different sludge contents using a portable concrete/cement mixer. Sludge content can be defined in different ways. In this paper, the wet sludge content (β) is defined as the ratio of the mass of wet sludge to the mass of wet soil (see Equation (2)). This ratio presents the advantage of being easily applicable to determine the material proportions in the mixture for field trials.
β = M s l w e t M s o w e t
where Msl−wet is the mass of wet sludge (at a water content wsl), Mso−wet is the wet mass of the soil (at a water content wso).
The gravimetric water content of the mixture (wm) was determined using oven drying (at 105 °C). However, it can also be obtained from the water contents of the base materials using the following relationship [23]:
w m = w s o 1 + w s l + β w s l 1 + w s o 1 + w s l + β 1 + w s o
Physical, mineralogical, and chemical characterization of the base materials was conducted. For the physical characterization, the grain-size distribution (GSD) curve was obtained using dry or wet sieving combined with a Malvern Panalytical Mastersizer 3000 laser diffraction particle size analyzer, which provides the volume size distribution for diameters from 0.05 to 900 µm. The specific gravity of solid grains (Gs) was determined using a Micromeritics® AccuPyc II 1330 helium pycnometer according to ASTM D5550-14 [27]. Once the GSD curves of the base materials are determined, the GSD of any soil-sludge mixture can be obtained using the following Equation (4):
P m ( d ) = P s o d + α P s l d 1 + α
and
α = M s l d M s o d = 1 + w s o 1 + w s l β
where Pm(d) is the fraction of the mixture particles finer than the diameter d, Pso(d) and Psl(d) are the soil and sludge particle fractions finer than diameter d, respectively, and α is the ratio of the solid dry mass of sludge to the solid dry mass of soil (see Equation (5)).
The consistency limits (plastic and liquid) were determined on the fraction passing the No. 40 sieve (425 μm) for the sludges and soil S2 according to the ASTM D4318-17e1 standard [28].
Then, knowing the specific gravity of the sludge (Gs−sl) and the soil (Gs−so), the specific gravity Gs−m of a given mixture can be estimated using the following equation [23]:
G s m = G s s o G s s l 1 + w s l + β 1 + w s o 1 + w s l G s s l + β 1 + w s o G s s o .
Figure 1a shows the grain size distribution (GSD) curves for the base materials, and Table 1 presents the particle gradations (D10, D30, D60, CU, CC, P#200, P#4), the consistency limits (LL, PL, PI), and the specific gravity (Gs). Based on the USCS and according to ASTM D2487-17 [29], soil S1 is classified as a poorly graded sand (SP), soil S2 is a silty clayey sand with gravel (SC-SM), and sludge W is a silt (MH). It was impossible to classify sludge A because the PL could not be determined.
The mixtures of soil S1 and sludges A and W are labeled as S1-A and S1-W, respectively. The S2-sludge mixtures containing sludges A and W are labeled as S2-A and S2-W, respectively. Figure 1b presents typical GSD curves for the S1-W and S2-W mixtures with the highest sludge contents used in this study (βmax = 25% for the S1-mixtures and βmax = 20% for the S2-mixtures, see Table 3). As mentioned above, these curves were calculated from the curves presented in Figure 1a using Equations (4) and (5). The GSD curves for sludge W and soils S1 and S2 are also shown in this figure. It can be observed that the GSD curves for the mixtures closely resemble the GSD curve for soil S2 for the entire diameter range (the greatest difference in the percent passing is about 6% at d = 0.07 mm). The fine fraction (P#200) varies from 24% for soil S2 alone to 27% for the S2-mixture with 20% of sludge. For soil S1, the GSD curve for the mixture becomes finer with decreasing diameter, particularly for d < 0.6 mm (the greatest difference in the percent passing is about 8% at d = 0.16 mm). Adding 25% of sludge W increases the fine fraction (P#200) from 0% for soil S1 alone to about 8% for the S1-mixture with 25% of sludge.
Due to laboratory constraints (see Section 2.3), hydrogeotechnical tests were performed after the sludge content optimization by compaction using the granular fraction passing the 14 mm sieve for soil S2 (this undersized soil S2 is called S2-U hereafter). The mixtures are labelled S2-U-A and S2-U-W. Figure 2 presents the corresponding grain-size distribution curves for the S2-U and S2-U-W mixtures for sludge content βmax of 20%. Table 1 also provides the physical properties of the undersized soil S2-U.
The mineralogical characterization was conducted using semiquantitative Rietveld X-ray diffraction (XRD) analysis using TOPAS software [30]. For sludges that contain predominantly amorphous or poorly crystalline phases (e.g., [31]), only crystalline materials are identified using XRD. The XRD results for the soils and sludges are presented in Table 2. Quartz and albite (NaAlSiO8) constitute the main mineral phases in both soil S1 (54% and 35%, respectively) and soil S2 (35% and 42%, respectively). Soil S1 also contains 11% cordierite (Al3Mg2AlSi5O18) and traces of 2MI muscovite (KAl2(Si3Al)O10(OH,F)2) and IIb chlorite ((FeMgAl)6(SiAl)4O10(OH)8). Soil S2 has minor components of 2MI muscovite (10%), IIb chlorite (7%), and cordierite (5%), as well as traces of pyrite (FeS2), sphalerite (ZnS), and rutile (TiO2). Table 2 indicates that calcite (CaCO3), corundum, and quartz constitute the mineral phases in sludge A (51%, 35%, and 14%, respectively), while gypsum (CaSO4∙2H2O) and corundum (Al2O3) constitute the major mineral phases in sludge W (80% and 16%, respectively), with quartz (SiO2) in the minor phase at 4% content.
The chemical analyses included total sulfur and carbon content analysis using infrared absorption after combustion in an induction furnace, and total elemental chemical composition using inductively coupled plasma and atomic emission spectrometry (ICP-AES). The elemental chemical analysis results are not presented here. Table 2 presents the total sulfur and carbon contents of the mixture components. As expected, soils S1 and S2 have very low sulfur and carbon contents. Sludge W contains higher sulfur content (6.5%) compared to sludge A (0.8%). However, the total carbon content is lower in sludge W (0.65%) than sludge A (2.06%). These results are in agreement with the mineralogical analysis, which shows more gypsum in sludge W than A.

2.2. Optimization of Soil-Sludge Mixtures by Compaction

The optimization consisted of determining the dry density (ρd−m) of the soil-sludge mixtures with different sludge contents (β) compacted using the Proctor test with modified effort according to ASTM D1557-12e1 [26]. The mold and compaction procedures were selected based on the top grain size of the materials. For the S1-sludge mixtures (with about 8%wt of the material retained on the 4.75 mm sieve), compaction procedure A (for 20%wt or less retained on the 4.75 mm sieve) was selected using a mold 116.4 cm in height and 101.6 cm in diameter. For the S2-sludge mixtures (with about 21%wt and 15%wt of the material retained on the 9.53 mm and 19.0 mm sieve, respectively), compaction procedure C (for more than 20%wt retained on the 9.53-mm sieve and less than 30%wt retained on the 19.0 mm sieve) was applied to a mold 116.4 cm in height and 152.4 mm in diameter. The mixtures were compacted in five layers using a modified Proctor rammer with a mass of 4540 g, with 25 strokes for procedure A and 56 strokes for procedure C. The drop height was 457.2 mm. The compaction curves ρd−m(β) then allowed determining the optimum sludge content (βopt).
Table 3 summarizes the testing program. Water contents (wso) of 0, 3.5, 5, and 7% and of 0, 2.5, and 4% were considered for soils S1 and S2, respectively. Values of wso below the optimum water contents (wso−opt) of each soil (from the modified Proctor curve) were targeted for the reasons discussed below. The water contents of the sludge (wsl) considered were 200 and 175% for sludge A and sludge W, respectively (see Table 3). Different wet sludge contents (β) ranging from 0 to 25%wt were considered for the mixtures tested for the optimization by compaction, as shown in Table 3. For each soil, the compaction process started with the soil-sludge mixtures prepared using the dry soil and increasing sludge content. The results obtained made it possible to determine the sludge contents to be used for the next initial water content of the soil (wso).
Note that classic Proctor tests with modified effort were conducted on soils S1 and S2 alone, applying procedures A and C, respectively. The obtained Proctor curves were then used to determine the dry density of compacted soils (ρd−so) for the water contents (wso) shown in Table 3 (including for dry soils, i.e., wso = 0 at β = 0).

2.3. Hydrogeotechnical Properties of Base Materials and Optimized Soil-Sludge Mixtures

The saturated hydraulic conductivity (ksat) and water retention curve (WRC) were determined for soils S1 and S2 and for selected soil-sludge mixtures. Every effort was made to avoid the most important mistakes during ksat-tests, as described by [32]. The saturated hydraulic conductivity of soil S1 was determined using ASTM D 2434 [33], considering that the ksat value for this soil exceeds 1 × 10⁻⁵ m/s. Because less than 35% of soil S1 was retained on No. 10 Sieve (2.0 mm), the inner diameter of the permeameter (D) would be at least 76 mm. Hence, a permeameter with D = 114 mm was used.
For soil S2 and all the S1- and S2-mixtures, ksat was determined using rigid-wall, compaction-mold permeameters (according to ASTM D5856-95 [34]) by applying test method B (constant tailwater level). This test method can be used on laboratory compacted specimens having a hydraulic conductivity below or equal to 1 × 10⁻⁵ m/s. ASTM D5856-95 standard [34] recommends that the permeameter inner diameter (D) be equal to or larger than 6 times the maximum grain size (dmax) of the specimen (i.e., D/dmax ≥ 6) to prevent segregation of the materials and to reduce the formation of preferential paths on the walls. Based on the GSD curves presented in Section 2.1, dmax was 10 mm for the S1-mixtures and 72 mm for soil S2 and the S2-mixtures, indicating that a permeameter diameter D ≥ 60 mm and ≥432 mm should be used, respectively. The compaction molds available in the laboratory had diameters of 116.4 mm and 152.4 mm. For the S1-sludge mixtures, compaction procedure A was selected for the molds with diameters of 116.4 mm and 152.4 mm (D/dmax=10mm ≈ 12 and 15, respectively). For soil S2, the granular fraction passing the 14 mm sieve (i.e., soil S2-U, with only about 10% retained on the 4.75 mm sieve; see Section 2.1) and the derived soil-sludge mixtures were compacted in molds with diameter of 152.4 mm (D/dmax=14mm ≈ 11) following procedure A. Five tests were performed on each sample and the arithmetic mean was used as the average ksat value.
The saturated hydraulic conductivities (ksat) were determined for the soils S1 and S2 compacted to a compaction ratio of 98% on the wet side of the Proctor curve. Soil-sludge mixtures were compacted at the highest sludge content (β) corresponding to 98% of the maximum dry density obtained on the compaction curve when varying β, as described in the previous section. Details on the selected mixtures tested are presented in Section 3.4.
The water retention curves (WRCs) were determined for soil S1 in a column according to ASTM D6836-16 [35]. Considering potential suction-induced volume change or shrinkage in soils containing a fine fraction, the WRCs of soil S2 and all soil-sludge mixtures were obtained using a 100-bar (10,000 kPa) pressure plate extractor (Soilmoisture Equipment Corp., Goleta, CA, USA) according to ASTM D6836-16 [35]. Shrinkage can be expressed in terms of change of porosity (n) or void ratio (e) with respect to the suction (Ψ), i.e., n(Ψ) or e(Ψ) [36]. In the case of suction-induced volume change, a representative air entry value (AEV) must be determined on the WRC expressed in terms of variation in the degree of saturation Sr(Ψ) instead of the volumetric water content θ(Ψ) [36]. The 100-bar pressure plate extractor is provided with a dozen soil sample retaining rings of 50 mm inner diameter and 10 mm height. After each applied pressure level, a ring can be removed and used to determine the volume of the sample, i.e., n(Ψ). However, these rings are best suited for fine materials and not for soil S2 or mixtures that contain coarse particles (up to 70 mm). In accordance with hydraulic conductivity tests, larger and thicker soil sample retaining rings were required to prevent segregation of the material and to reduce the formation of preferential paths during fluid flow. Hence, rings of 90 mm inner diameter and 30 mm height were used. The maximum particle size was then limited to 14 mm (D/dmax = 6.4) instead of 70 mm. Given the inner volume of the extractor, only two samples could be tested simultaneously. Details on the selected mixtures tested are provided in Section 3.5.
The two samples were placed in the extractor and several levels of gas (nitrogen) pressure suction were applied in succession until equilibrium was reached. The maximum pressure was about 9000 kPa. Each sample was quickly removed from the cell after reaching equilibrium under each pressure level to determine the sample volume and weight. The sample volume was determined by measuring the actual sample diameter and thickness at several positions with a digital caliper (see details in [23,37]). It was then possible to deduce the gravimetric water content, w (knowing the initial mass of the solid grains), porosity (n), void ratio (e), volumetric water content (θ), and the degree of saturation (Sr) corresponding to the imposed suction (Ψ).

3. Results

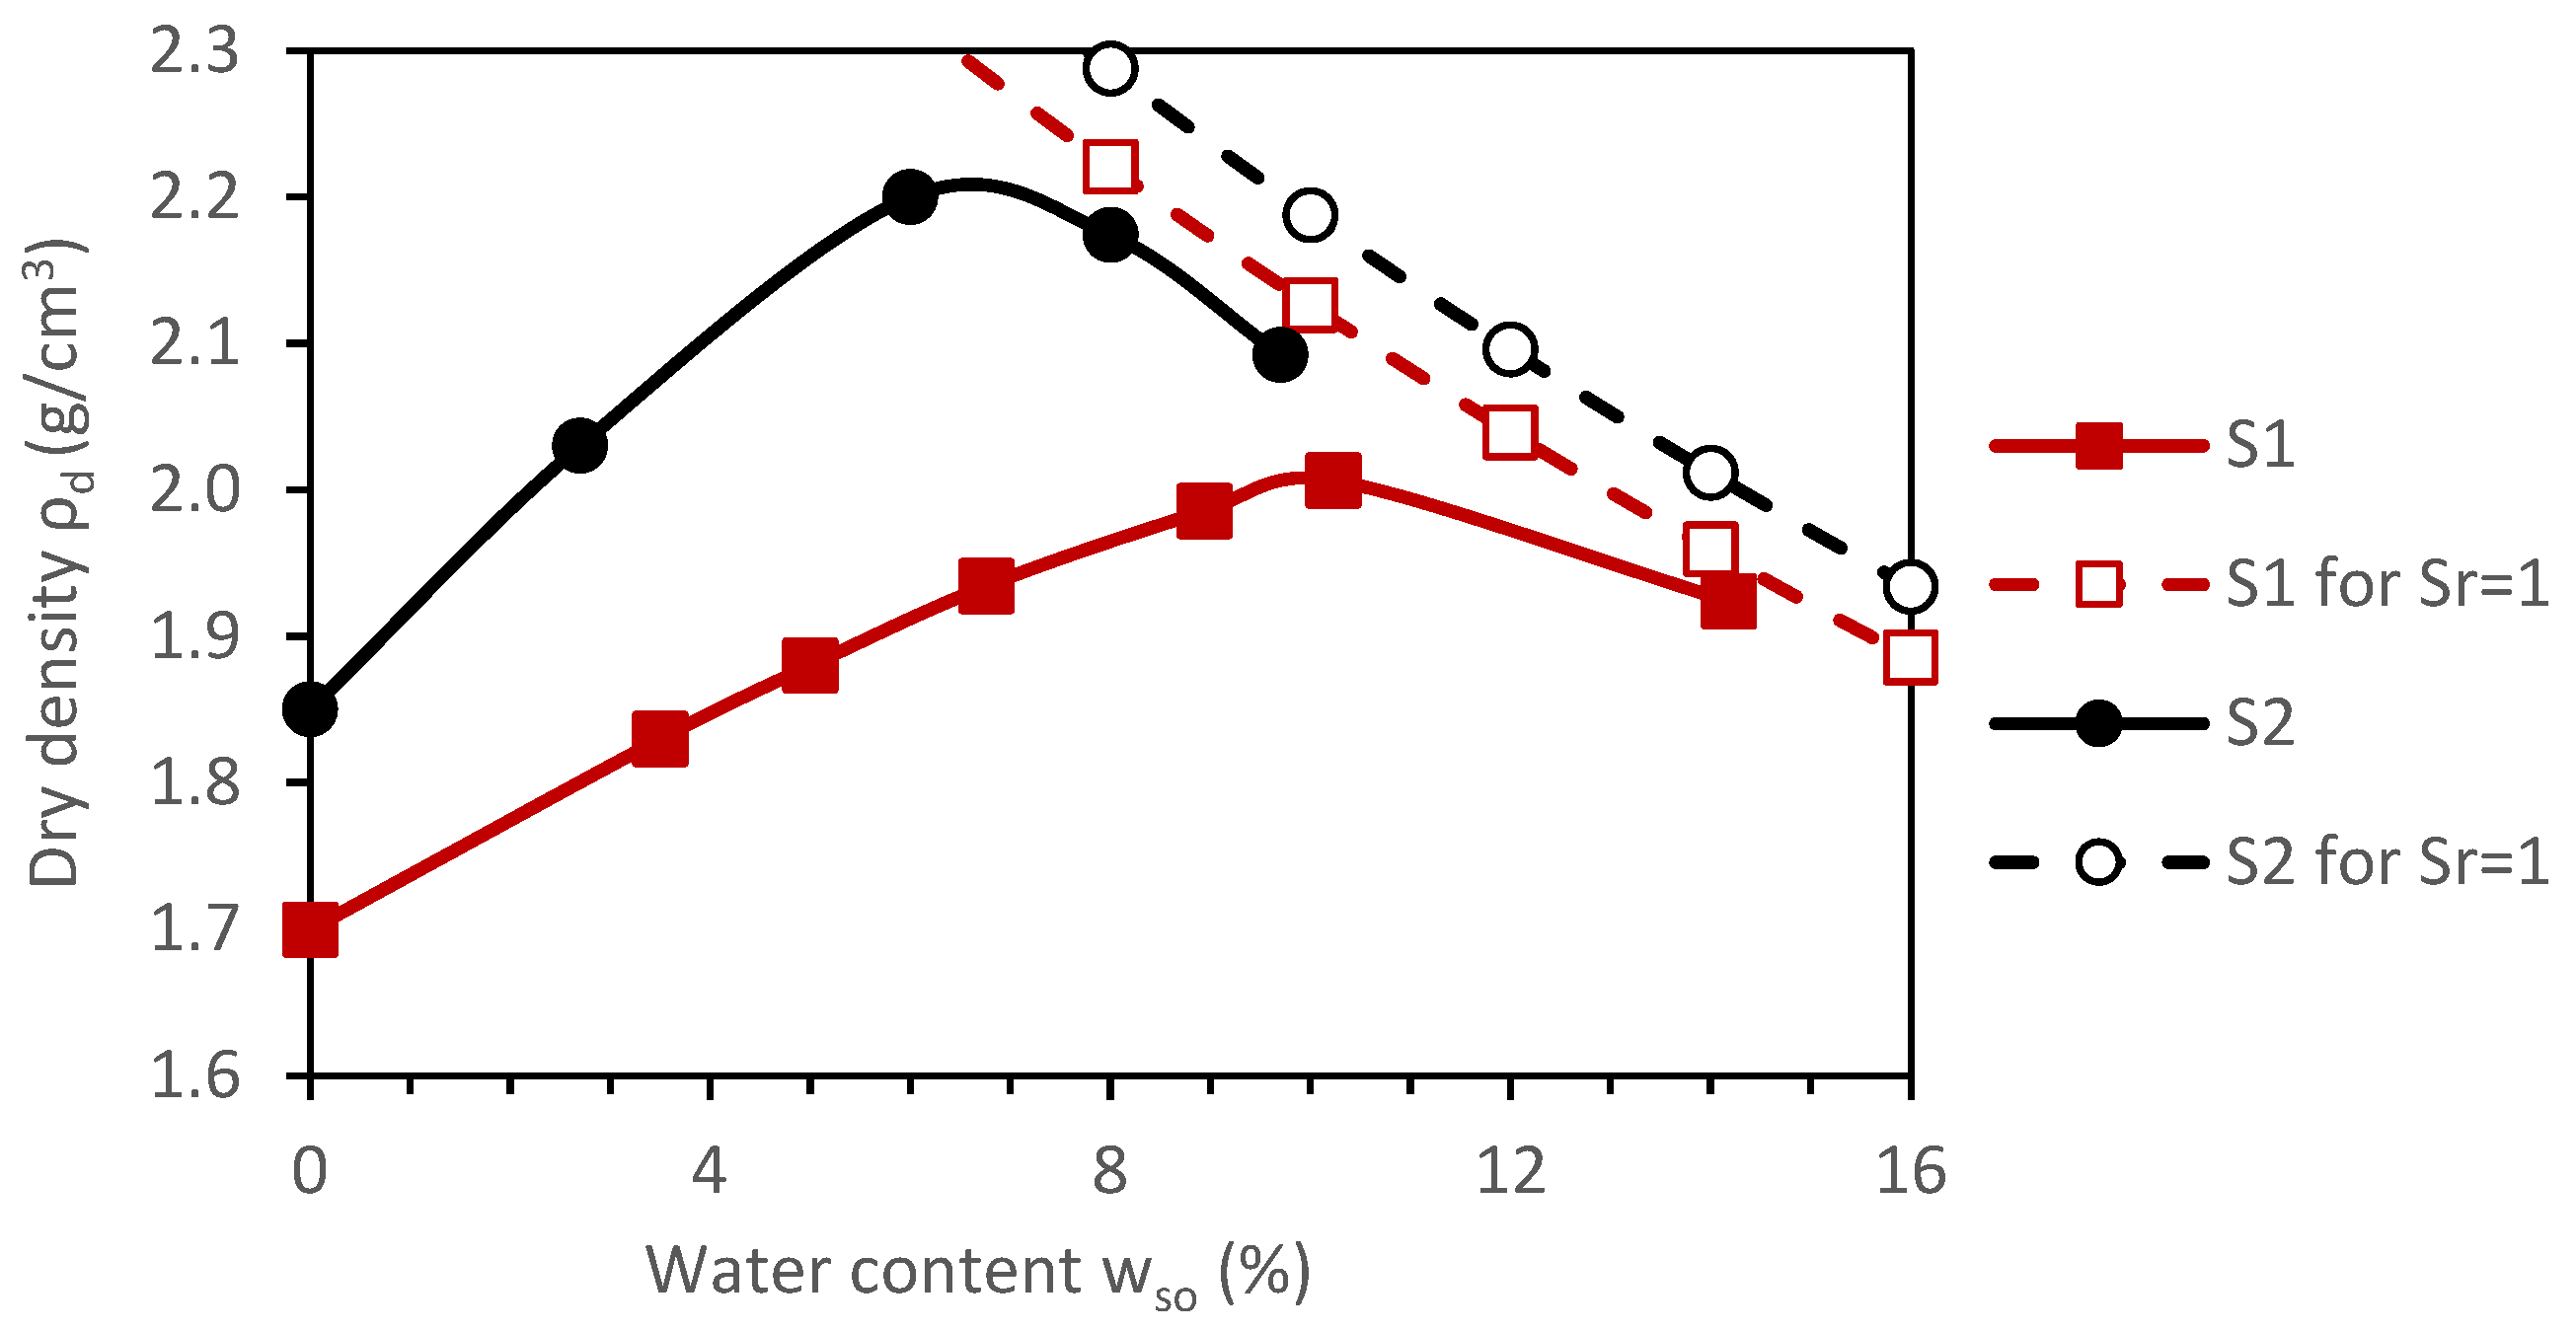
3.1. Compaction Characteristics of Soils S1 and S2

Figure 3 presents the Proctor compaction curves (using modified effort) for soils S1 and S2 used for sludge content optimization by compaction as well as the dry densities that could be obtained if these soils were compacted up to saturation (i.e., degree of saturation Sr = 1). The maximum dry densities are 2.01 and 2.21 g/cm3 and the corresponding optimum water contents (wopt) are 10% and 6% for soils S1 and S2, respectively.

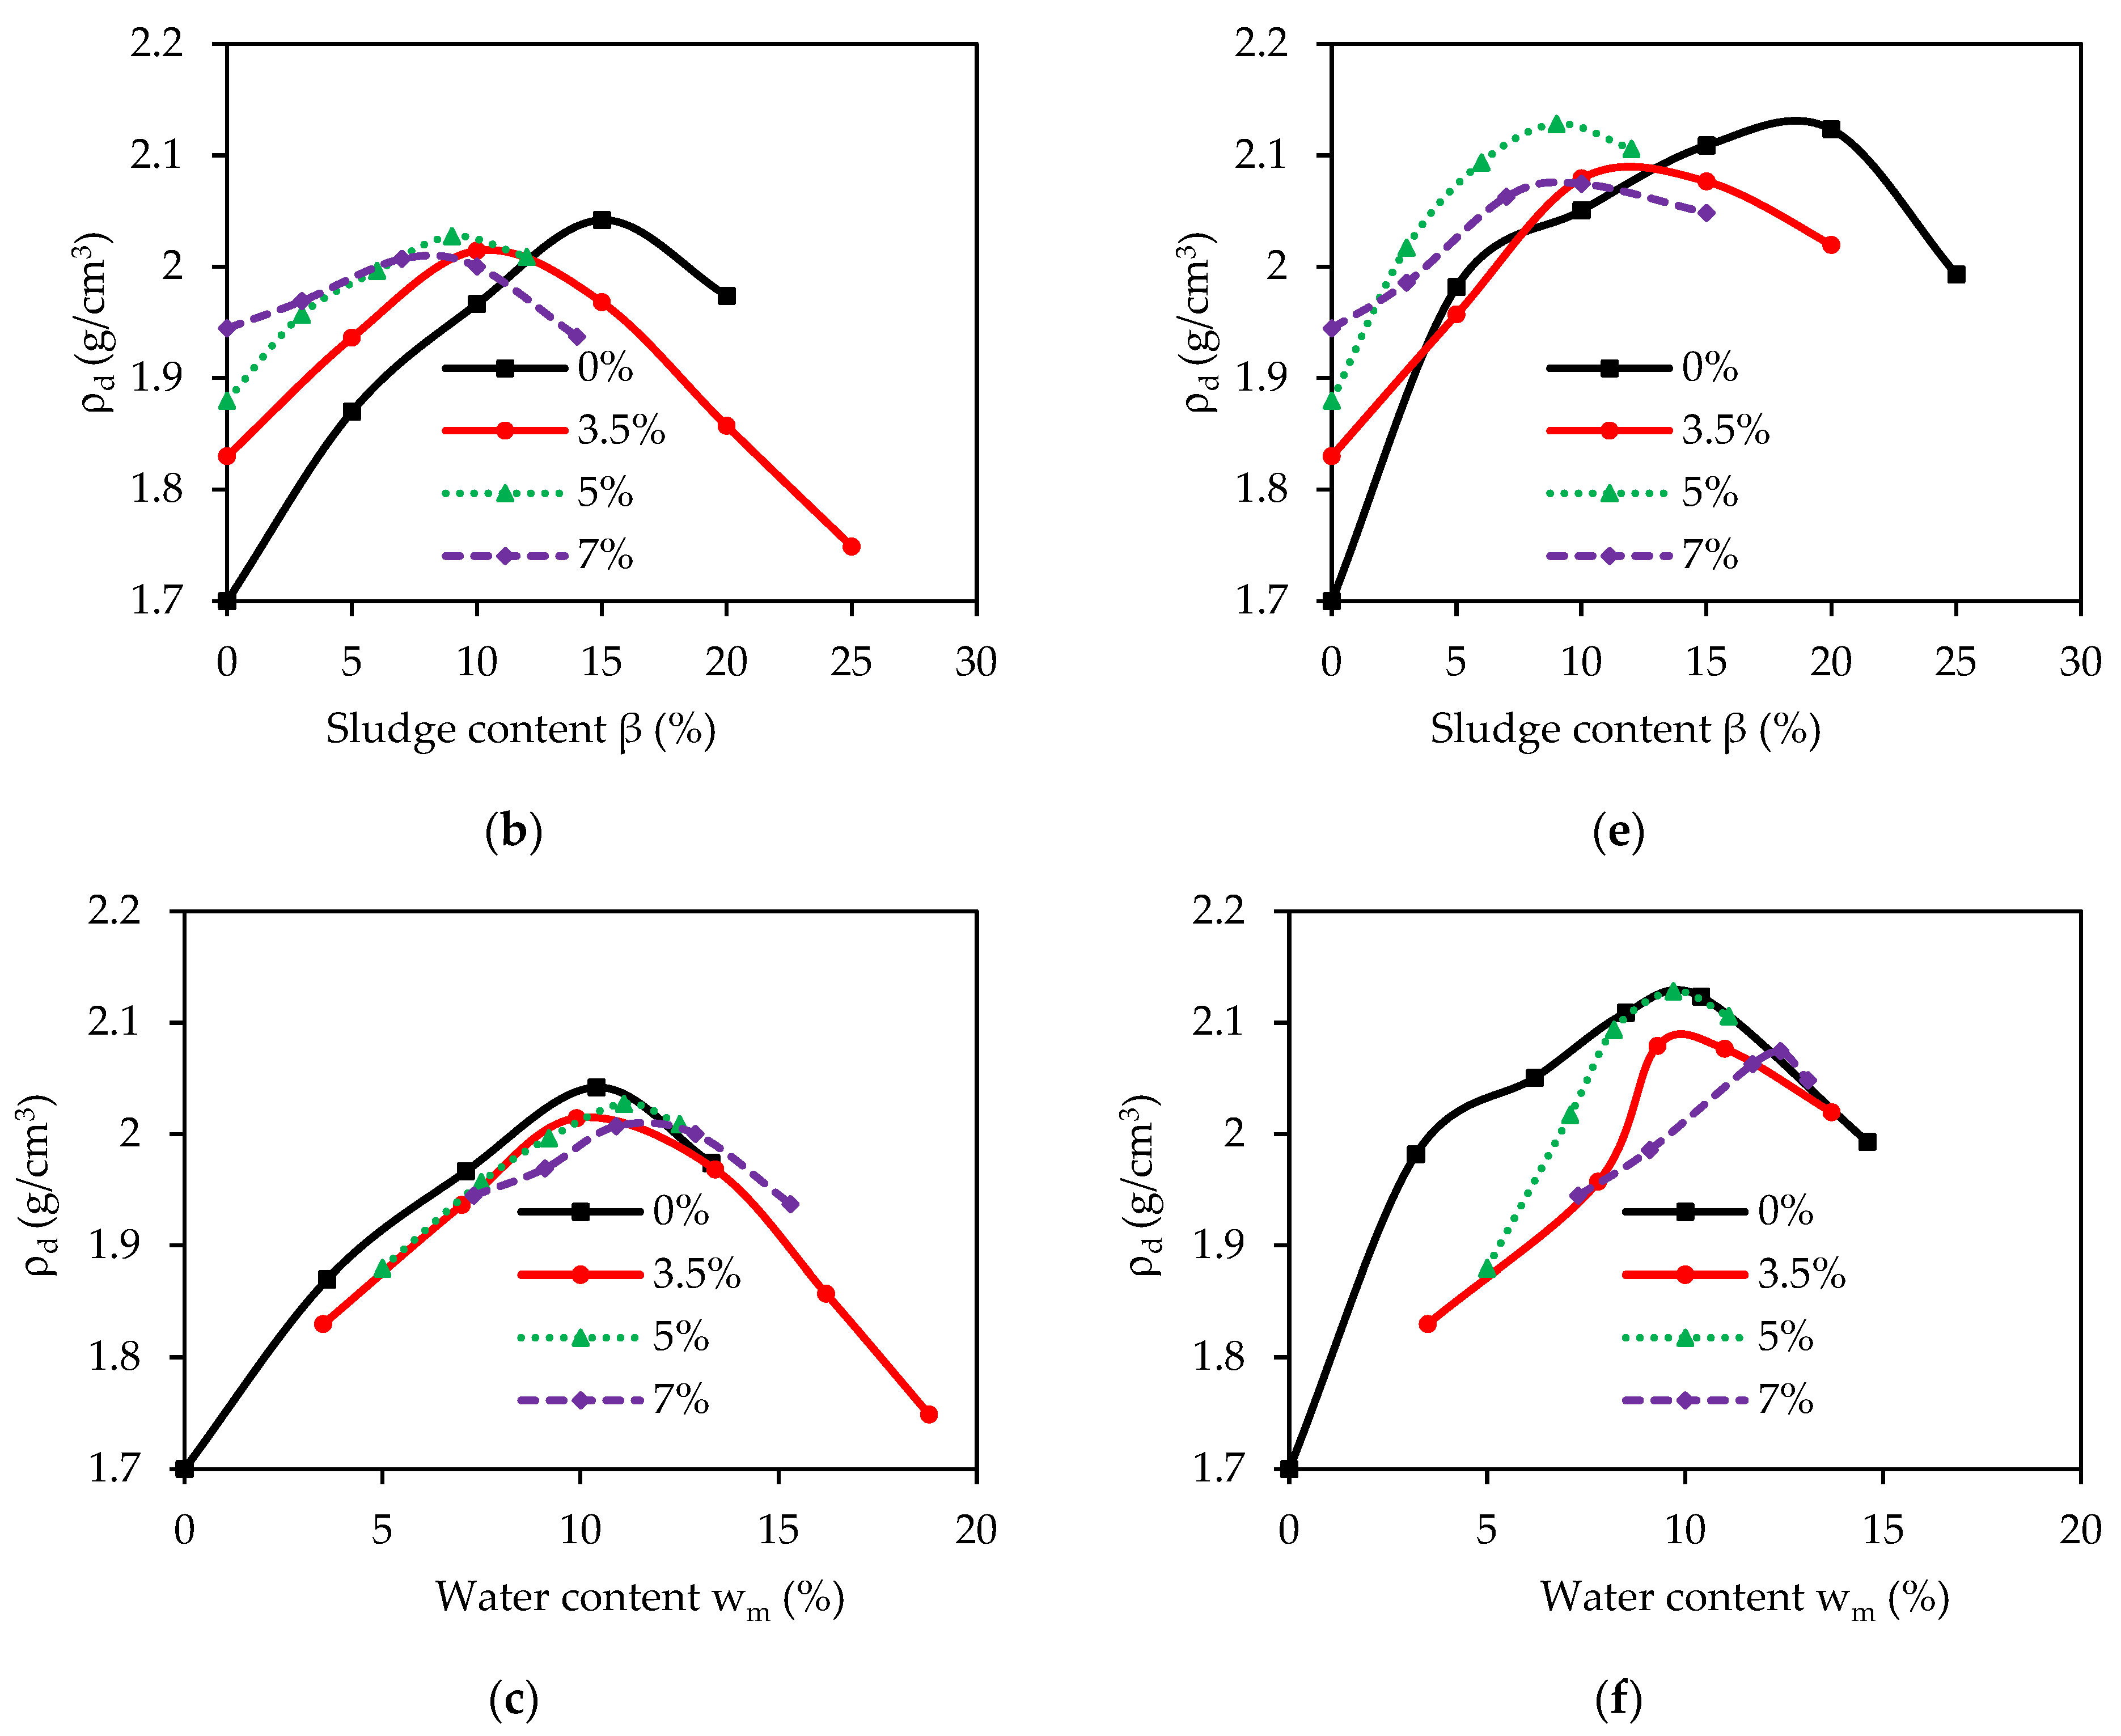
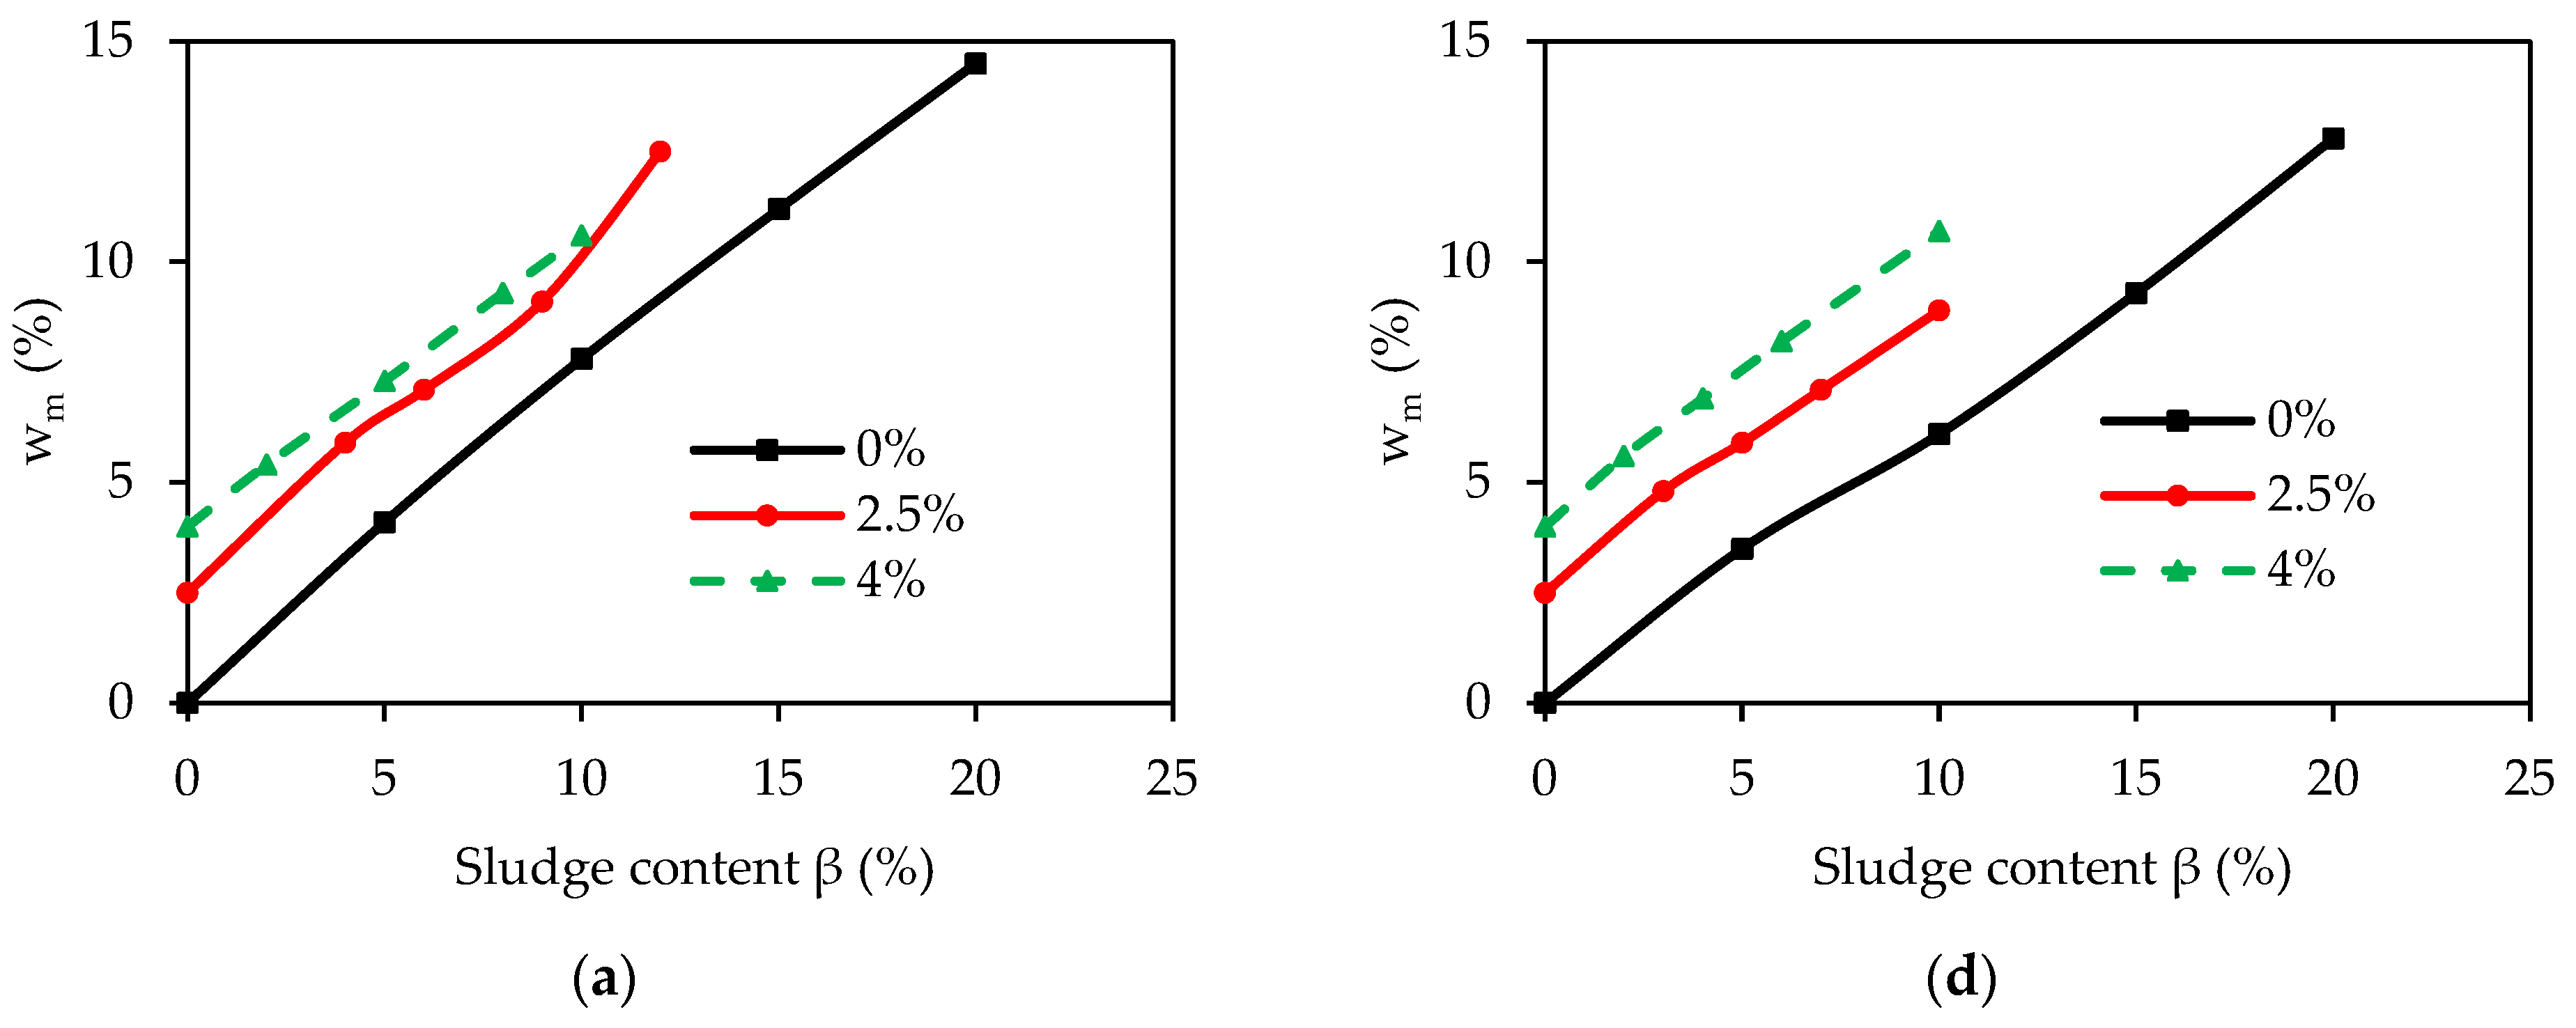
3.2. Compaction-Based Optimum Sludge Content for the S1-A and S1-W Mixtures

Figure 4a,b show the impact of sludge content (β) on the measured mixture water contents (wm) and dry densities (ρd), respectively, for mixtures S1-A prepared with soil S1 for water contents wso of 0, 3.5, 5, and 7% and sludge A (with water content wsl of 200%) (see Table 3). Figure 4c presents the variation in ρd as a function of wm for these mixtures. As expected, the mixture water content (wm) increases with increasing sludge content for a given soil water content (wso) and sludge water content wsl (see Equation (3)). A comparison between measured and calculated wm values is discussed in Section 4.2.
The compaction curves presented in Figure 4b are shaped similarly to the Proctor curve. Indeed, for a given soil water content wso, ρd increases with β, reaches a maximum, and decreases thereafter. Values of ρd at β = 0 correspond to the values provided by the true Proctor curve (see Figure 3). The density increase may be due to the coupled effect of the water content of the mixture, which increases toward the optimum water content, and the sludge fine particles in the mixture (see Figure 1b) that fill the voids between the coarse particles of the poorly graded sand S1. The optimum sludge content (βopt) and the corresponding maximum dry density (ρd−max) are 15% and 2.04 g/cm3, 10% and 2.00 g/cm3, 9% and 2.03 g/cm3, and 8% and 2.01 g/cm3 for soil water contents wso of 0, 3.5, 5, and 7%, respectively. All these dry density values are almost identical to the maximum dry density obtained in soil S1 alone (2.01 g/cm3, see Figure 3), which shows that the amount of sludge A added does not affect the maximum achievable dry density of soil S1 alone. For the S1-soil sludge mixtures studied, soil water contents ranging from 0 to 7% do not appear to affect the ρd−max value, nor do soil water contents ranging from 3 to 7% appear to affect the βopt value. Figure 4c shows the variation in dry density (ρd) as a function of water content wm of the mixtures. For all these mixtures, the maximum dry density is reached for a mixture water content wm of about 10% for water contents wso of 0, 3.5, 5, and 7%. Although these curves resemble the Proctor curves, it should be understood that the variation in water content is due to the variation in sludge content. Surprisingly, the water content wm of 10% corresponds to the optimum water content wopt for soil S1 alone (see Figure 3).
In the case of mixtures S1-W prepared with soil S1 for water contents wso of 0, 3.5, 5, and 7% and sludge W (with a water content wsl of 175%) (see Table 3), the variation in measured water content (wm) as a function of sludge content β is highlighted in Figure 4d. The irregularly rising slope of the curves was unexpected, and may be explained by heterogeneity in these mixtures, probably due to insufficient energy to mix the soil and sludge W that is highly plastic and cohesive. Figure 4e shows the curves ρd(β). The abovementioned main conclusions drawn for the S1-A mixtures apply again here. The maximum dry density ρd−max and the corresponding optimum sludge content βopt are 2.12 g/cm3 and 19%, 2.09 g/cm3 and 12%, 2.13 g/cm3 and 9%, and 2.06 g/cm3 and 9% for soil water contents wso of 0, 3.5, 5, and 7%, respectively. Unlike the S1-A mixtures, all these values are higher than the maximum dry density obtained on the soil S1 alone (2.01 g/cm3, see Figure 3), which shows that the amount of sludge W added increases the maximum achievable dry density of soil S1 alone. When the water content of soil S1 increases from 0 to 3.5%, βopt decreases from 19% to 12%. Thereafter, βopt does not change with increasing water contents. Soil water contents ranging from 0 to 7% do not appear to affect the ρd−max value. Figure 4f shows the curves ρd(wm). The irregular shape of the curves compared to the results presented in Figure 4c can be explained by the results shown in Figure 4d, as explained above. For all these mixtures, the maximum dry density is obtained for a mixture water content wm of about 10%, as observed for the mixtures prepared with sludge A.
A comparison of the impact of sludge type (even with varying initial water contents wsl) indicates that the dry densities obtained were slightly higher for the mixture prepared with sludge W than sludge A.

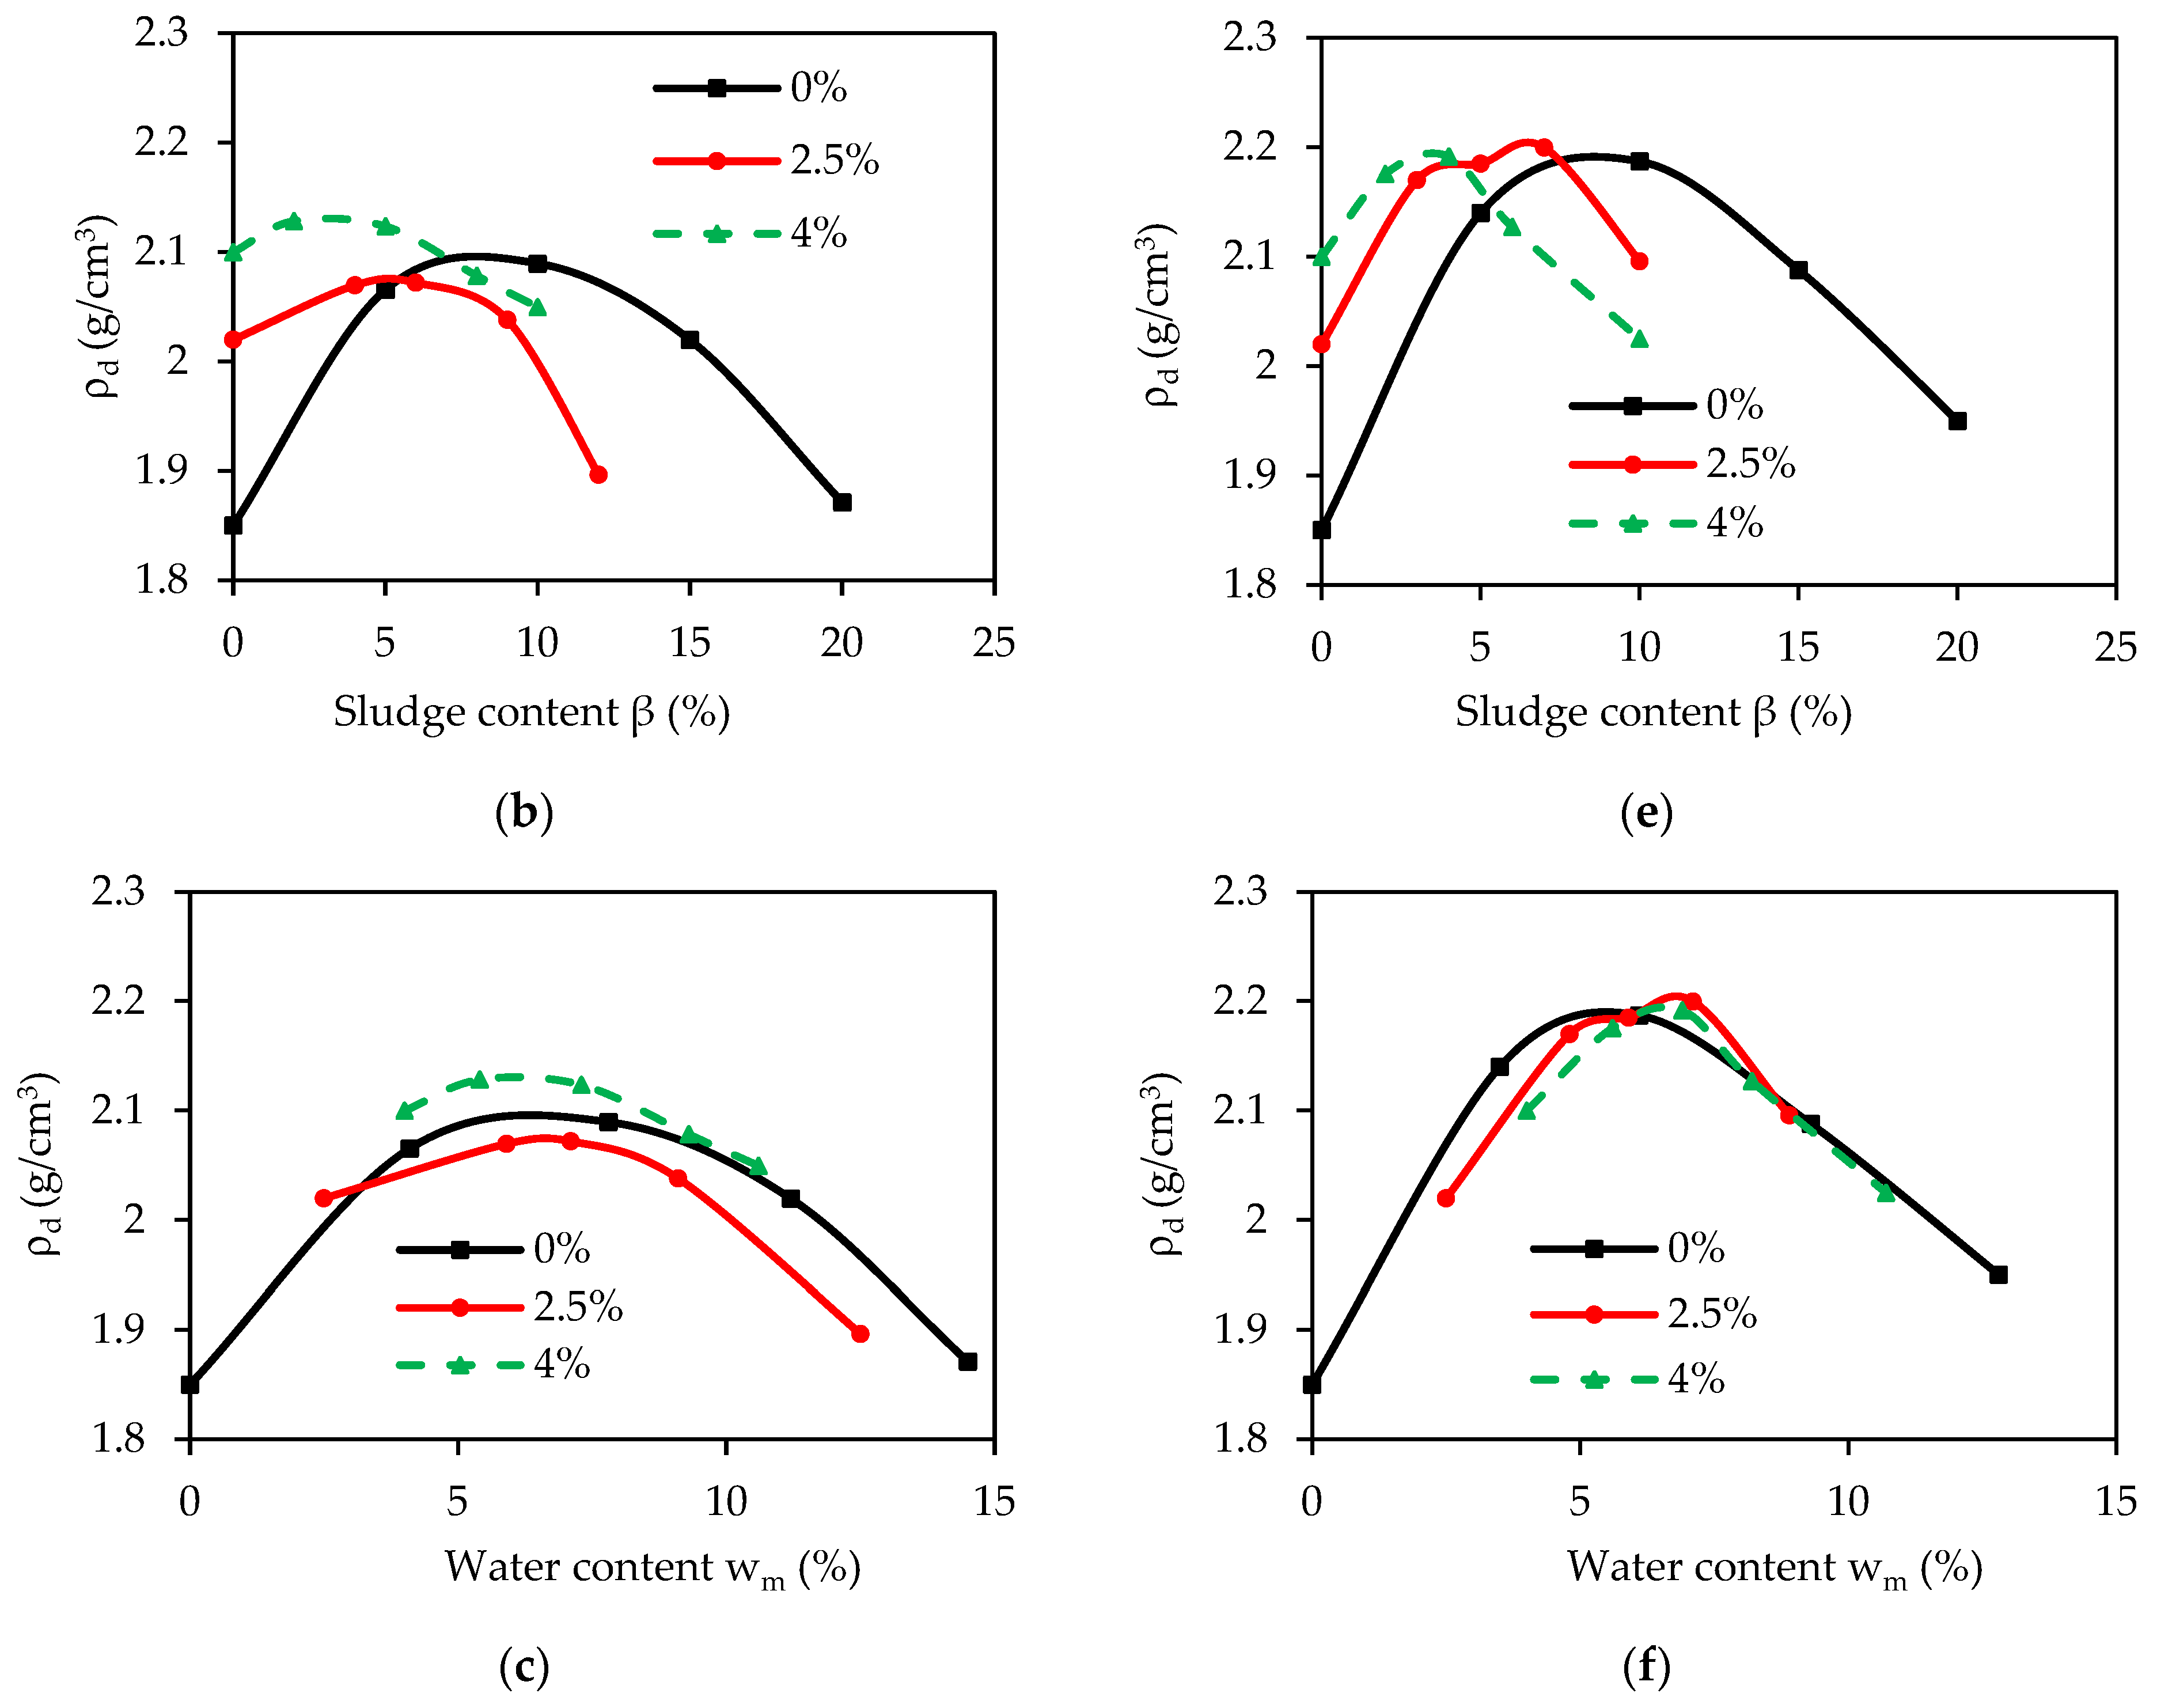
3.3. Compaction-Based Optimum Sludge Content for the S2-A and S2-W Mixtures

Figure 5a,d show the impact of sludge contents β on mixture water contents wm for S2-A and S2-W mixtures prepared with sludge A and W, respectively. Water contents of soil S2 wso of 0, 2.5, and 4% were considered, while sludge water contents wsl of 200 and 175% were used for sludge A and W, respectively. As expected, the mixture water content wm increased with the sludge content for a given wso.
The impacts of sludge content (β) on measured dry density (ρd) are illustrated in Figure 5b,e for mixtures S2-A and S2-W, respectively. Compaction curves ρd(β) shaped similarly to the Proctor curve were obtained for both the S2-A and S2-W mixtures. Adding sludge to soil S2 at a given water content wso increases the dry density up to a maximum value, as explained above. The dry densities of soil S2 alone (β = 0) are 1.85, 2.02, and 2.10 g/cm3 for soil water contents wso of 0, 2.5, and 4%, respectively (see Figure 3). For the S2-A mixtures, the maximum dry density ρd−max and optimum sludge content βopt are 2.10 g/cm3 and 8%, 2.08 g/cm3 and 6%, and 2.13 g/cm3 and 3% for soil water contents wso of 0, 2.5, and 4%, respectively.
These densities are close to each other but are lower than the maximum dry density obtained in soil S2 alone (2.21 g/cm3, see Figure 3). This means that adding sludge A to soil S2 negatively affects the maximum achievable dry density of soil S2 alone. For the S2-W mixtures, ρd−max and βopt are 2.19 g/cm3 and 10%, 2.20 g/cm3 and 7%, and 2.20 g/cm3 and 7% for soil water contents wso of 0, 2.5, and 4%, respectively. The amount of sludge W added does not affect the maximum achievable dry density of soil S2 alone. Indeed, all these values are similar to each other and are almost identical to the maximum dry density obtained on the soil S1 alone (2.21 g/cm3, see Figure 3). In the testing conditions of this study, the maximum dry density for the S2-A and S2-W mixtures appears to be unaffected by the initial soil water content, as observed for the mixtures prepared with soil S1.
The compaction curves ρd(wm) shown in Figure 5c,f for the S2-A and S2-W mixtures, respectively, typically follow a bell-shaped curve. As mentioned above, these curves differ from the Proctor curves in this case because the variation in water content wm is due to the variation in sludge content. The maximum dry density is obtained for a mixture water content wm of about 6% for the mixtures containing sludges A and W and for the studied soil water contents wso (0, 2.5, and 4%). The water content wm of 6% corresponds to the optimum water content wopt of soil S2 alone (see Figure 3).

3.4. Saturated Hydraulic Conductivity of Base Soils and Selected Mixtures

As mentioned above, saturated hydraulic conductivities (ksat) were determined for the base soils S1 and S2-U compacted at a water content corresponding to about 98% of the maximum dry density (see Figure 3). Mixtures made of soils S1 and S2-U at water contents of 3.5% and 4%, respectively, and having sludge contents β corresponding to about 98% of the maximum dry density for the mixtures (see Figure 4b,e and Figure 5b,e) were selected for the ksat measurements. Based on the results presented in these figures, Table 4 presents the maximum dry densities ρdmax, the 0.98% ρdmax values, the corresponding sludge contents β, and the corresponding porosities (n). The results show β = 15% for S1-A, β = 17% for S1-W, β = 7% for S2-U-A, and β = 6% for S2-U-W at β = 6%. Unfortunately, it was impossible to obtain the same porosities due to the different compaction water contents of the materials. For the testing conditions, adding both A and W sludges to soil S1 decreases ksat by an order of magnitude (from about 10−5 m/s for the soil alone to about 10−6 m/s for both mixtures), whereas adding sludge with β ≤ 7% to soil S2-U barely affects the ksat values (≈10−8 m/s) (see Table 4). Based on these results, soil S2-U and mixtures S2-U-A and S2-U-W, with ksat less than 10−7 m/s, could constitute appropriate materials for low saturated hydraulic conductivity covers to limit water infiltration, unlike soil S1 and mixtures S1-A and S1-W. This conclusion reflects the characteristics of the tested mixtures based on soil S2-U (fraction passing the 14 mm sieve), and not the characteristics of the S2 -sludge mixtures.

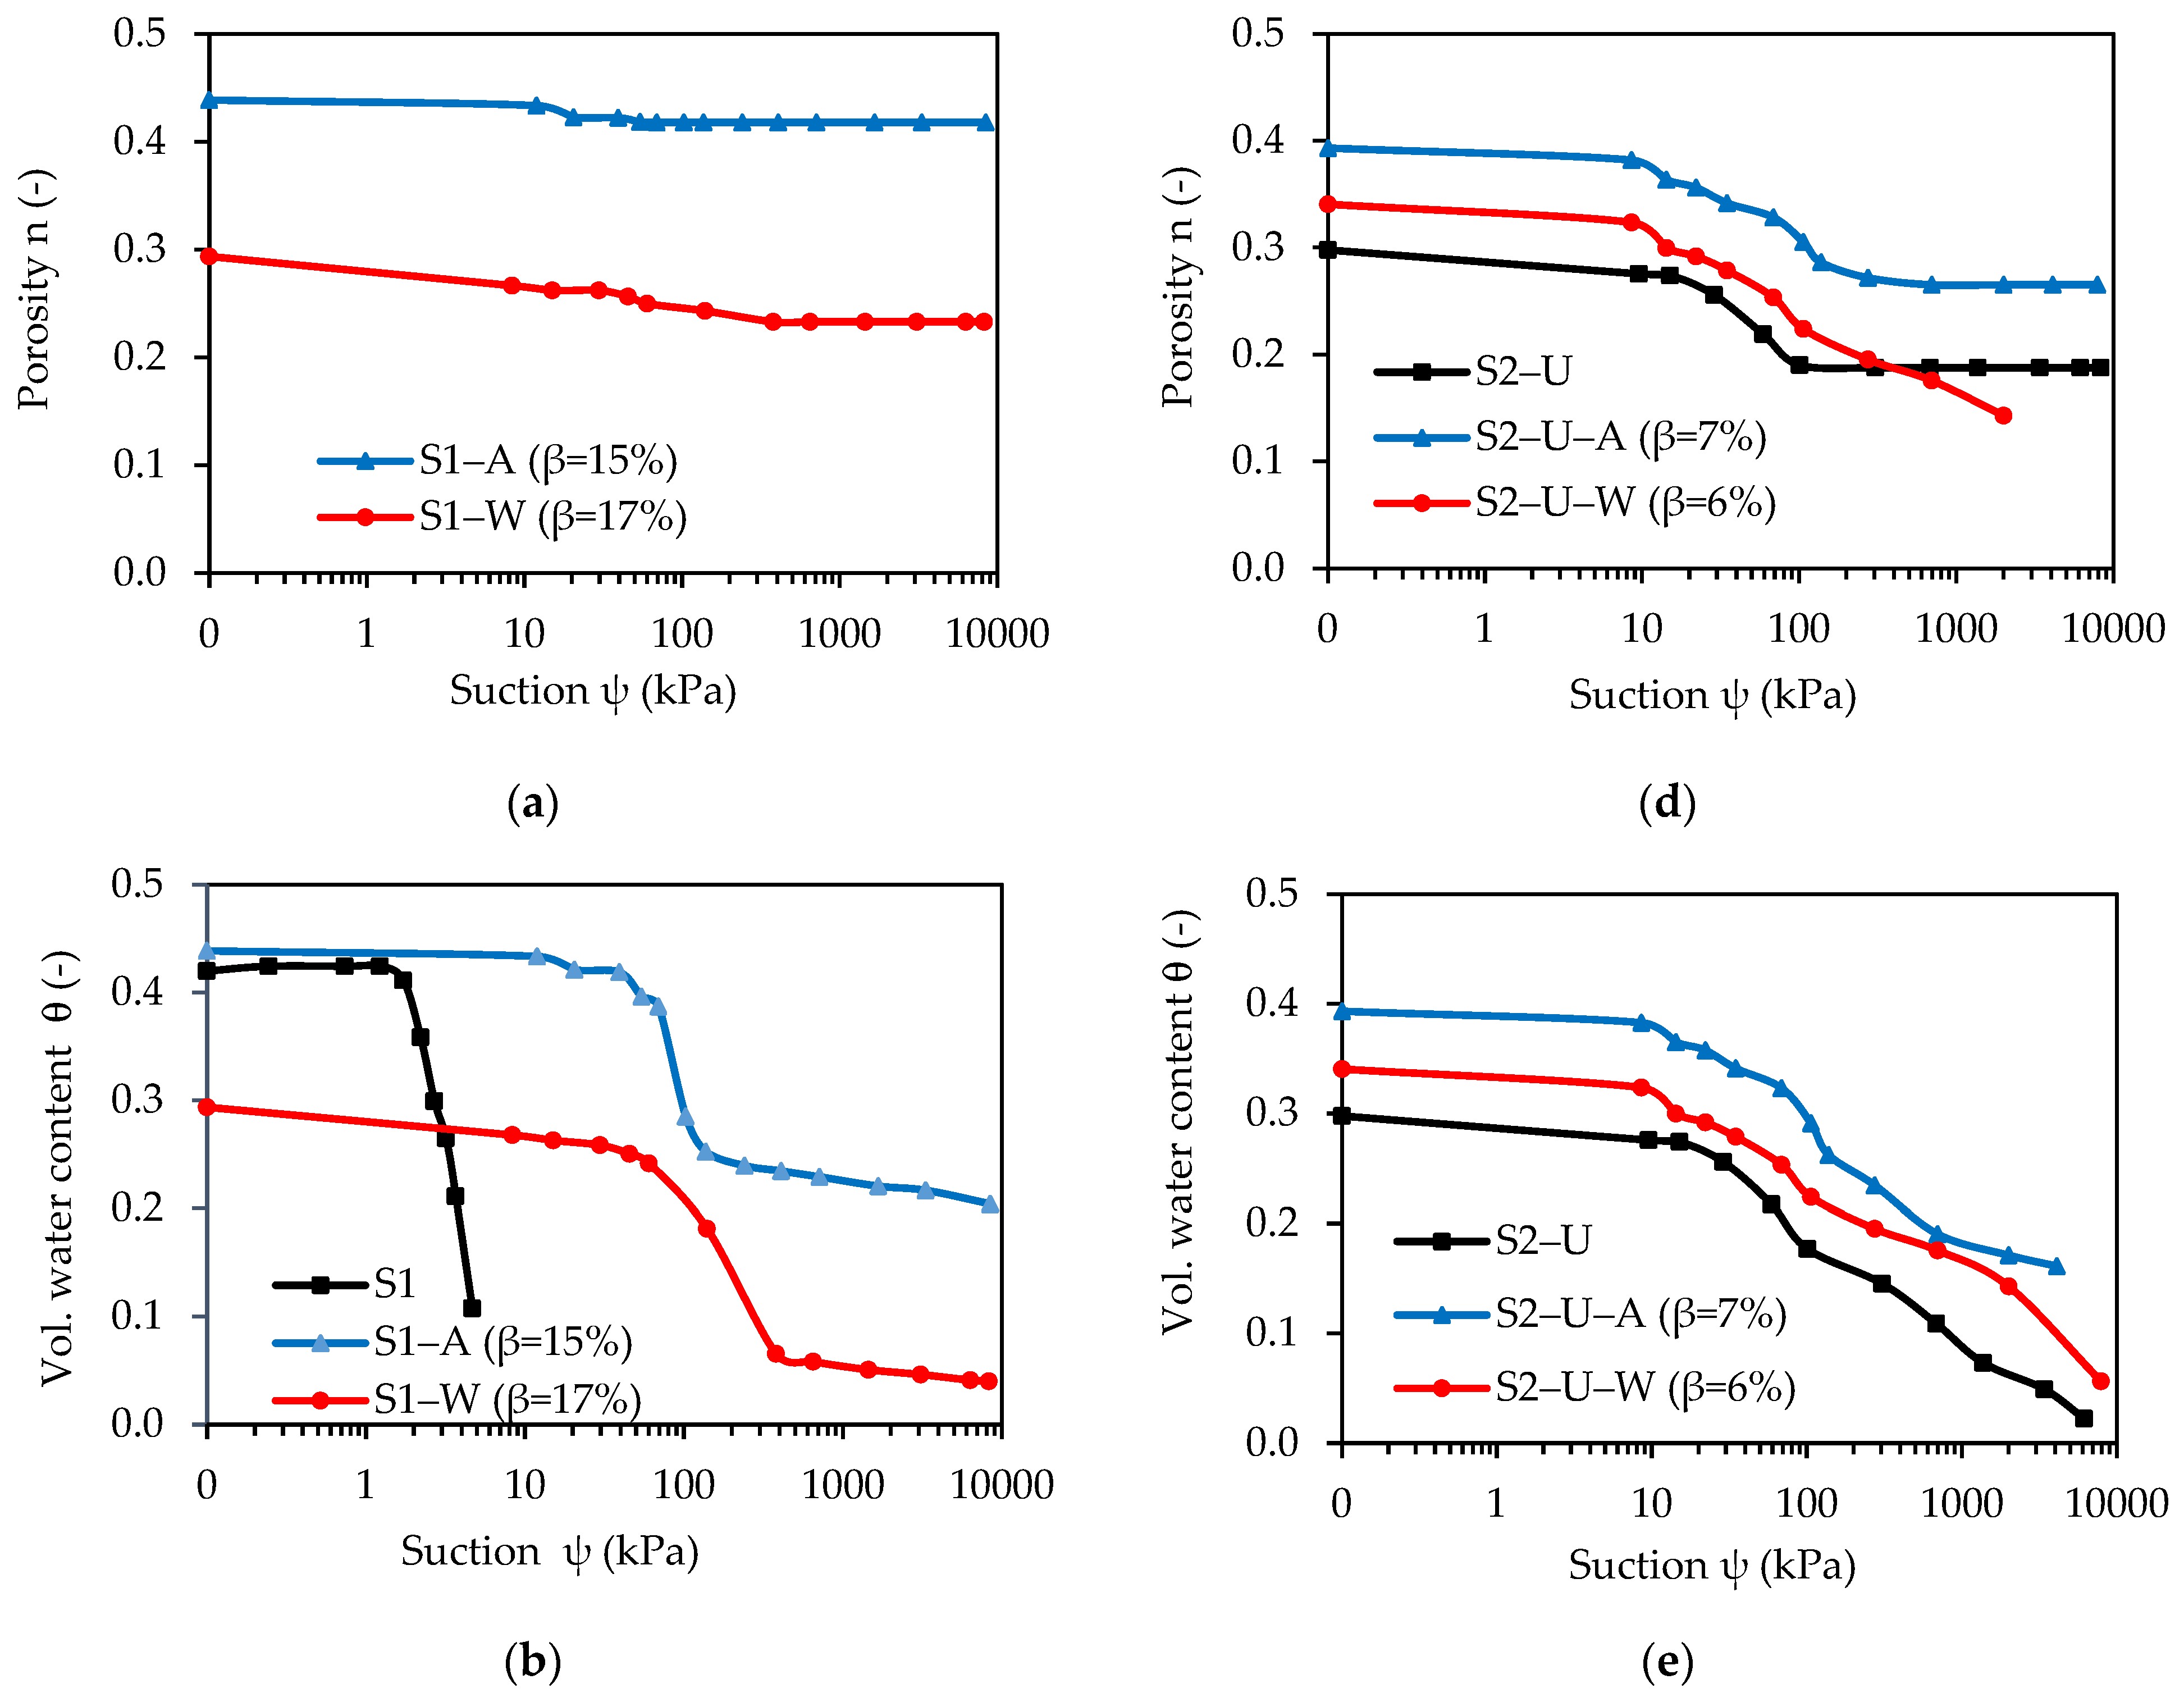
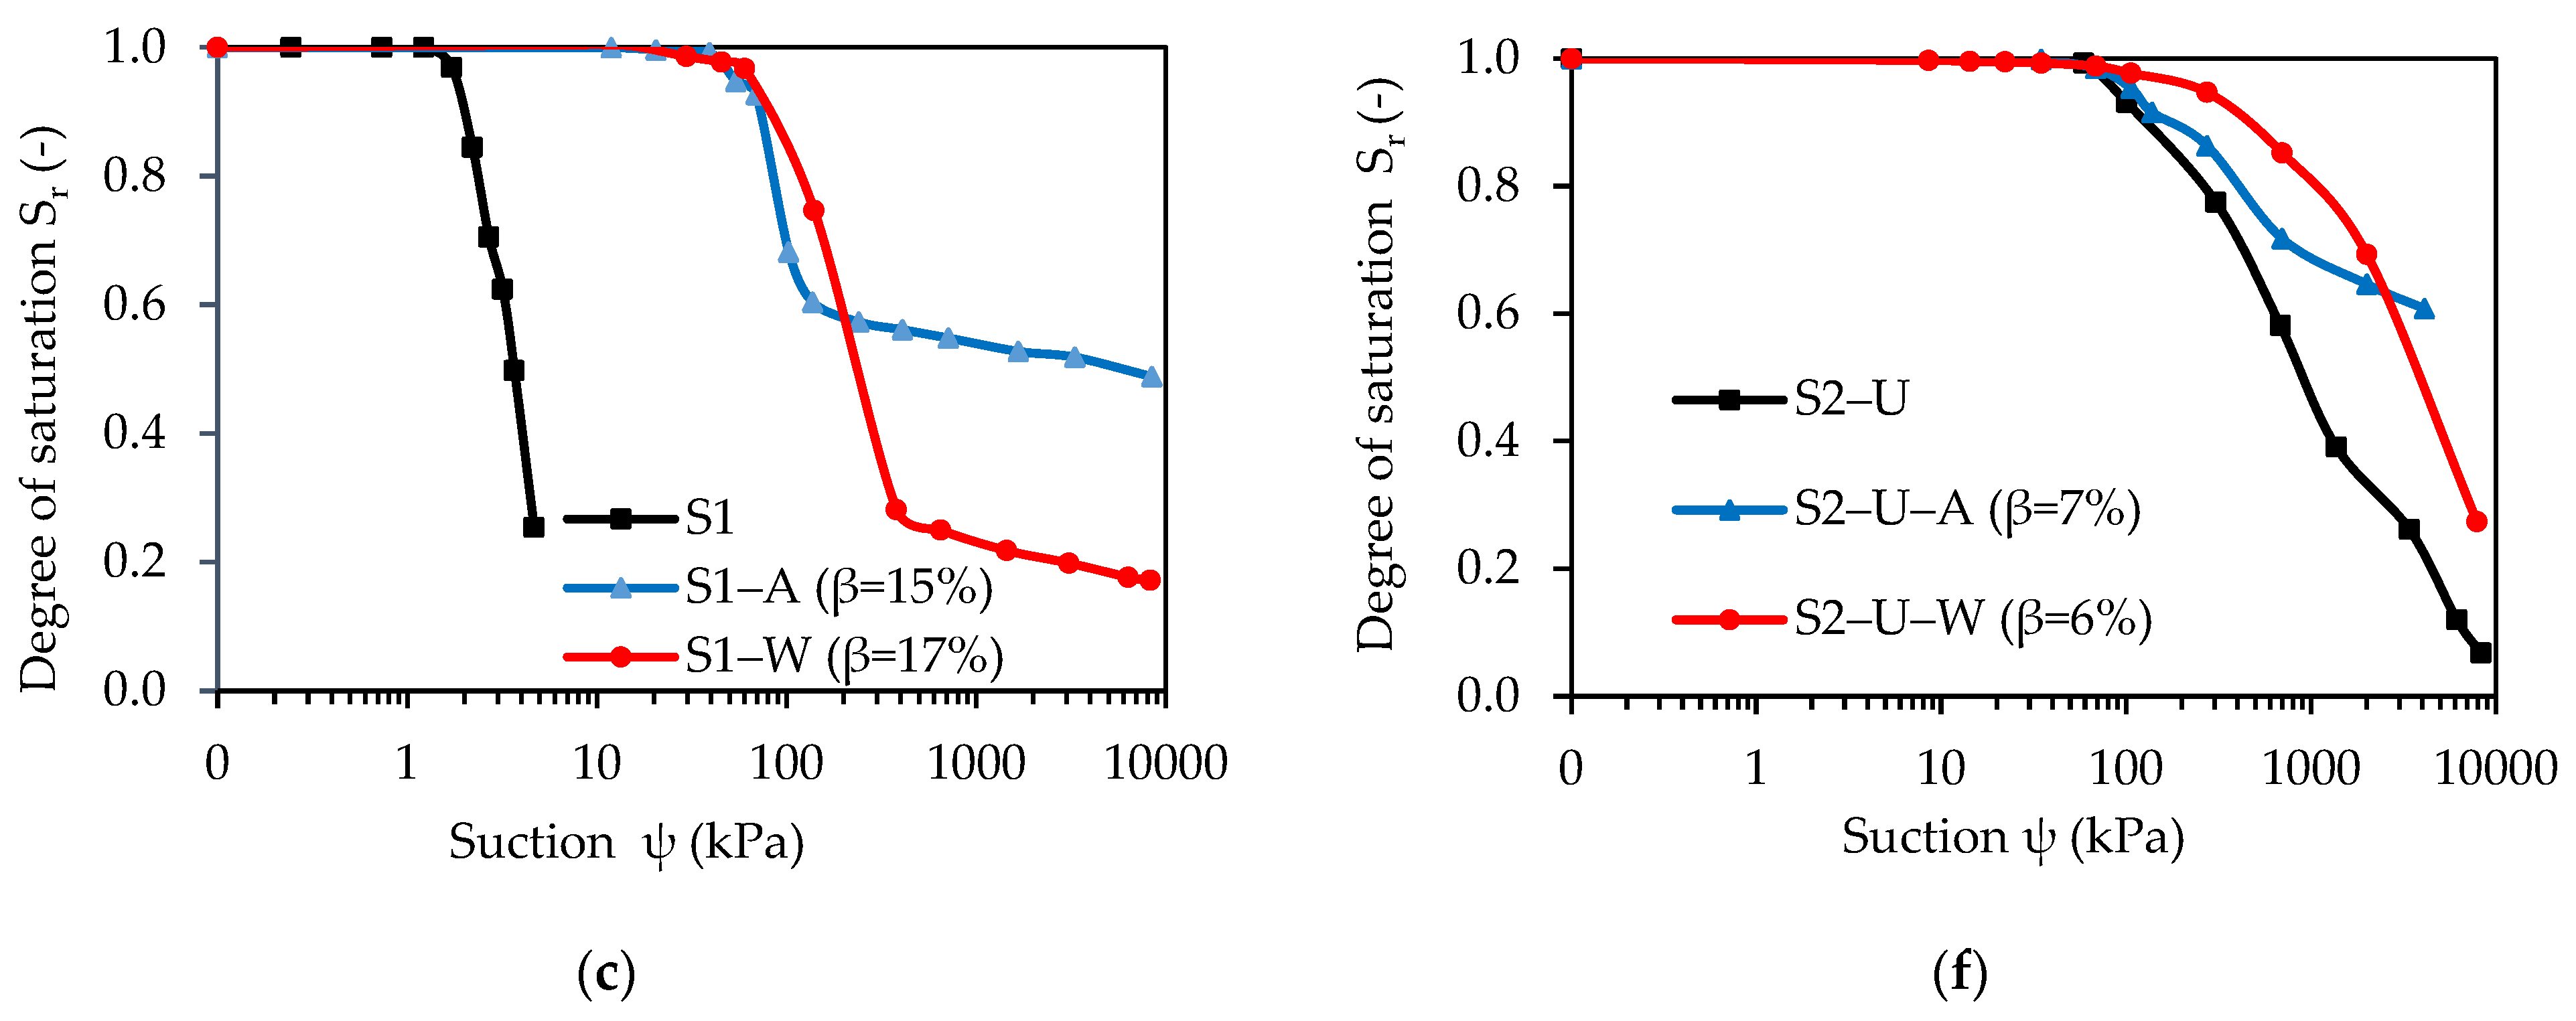
3.5. Water Retention Curves of Base Soils and Selected Mixtures

Table 5 presents the initial porosity (n) and initial void ratio (e) of base soils S1 and S2-U and the selected mixtures, as explained in Section 3.4. Samples of S1 and S2-U were tested at porosities of 0.42 and 0.30 (i.e., e = 0.72 and 0.43), respectively. The porosities of the initially saturated samples of selected mixtures S1-A and S1-W were 0.44 and 0.29 (i.e., e = 0.79 and 0.41), respectively. The porosities of the initially saturated samples of mixtures S2-U-A and S2-U-W were 0.39 and 0.34 (i.e., e = 0.64 and 0.52), respectively. Unfortunately, due to the sample preparation procedure, samples with different porosities were tested.
Figure 6a,d show the shrinkage curves expressed in terms of n(Ψ) for the selected mixtures S1-A and S1-W on the left and for soil S2-U and the selected mixtures S2-U-A and S2-U-W on the right. Soil S1 was assumed to be nondeformable (n and e remain constant) under increasing suction. The porosity decreased from 0.44 to 0.42 and from 0.29 to 0.23 for mixtures S1-A and S1-W, respectively. The porosity decreased from 0.30 to 0.19 and from 0.39 to 0.27 for soil S2-U and mixture S2-U-A, respectively. For mixture S2-U-W, the porosity decreases steadily with the applied suction levels.
Figure 6b,e show the WRC expressed in terms of θ(Ψ), and Figure 6b,e show the WRC expressed in terms of Sr(Ψ). The AEV can be determined on the curves Sr(Ψ) as the suction at which Sr becomes less than 1. The AEV (Ψa) is 1.3 kPa and 60 kPa for soils S1 and S2-U, respectively. Adding sludge to soil S1 appears to significantly increase the AEV. Thus, the AEV (Ψa) varies from 1.3 kPa to 39 kPa and 30 kPa for mixtures S1-A and S1-W, respectively. Under the testing conditions, the impact of the sludge on the WRC of the mixtures based on soil S2-U is limited: the AEV (Ψa) increases from 60 kPa for soil S2-U to 68 kPa for mixtures S2-U-A and S2-U-W. These observed impacts of the sludge on the WRC are in accordance with the impacts of the sludge on ksat: lower impact for the S2-U-mixtures compared to S1-mixtures. However, because the materials have different porosities, they should be compared with caution.
The selected optimum mixtures based on soils S1 and S2-U show AEV greater than 20 kPa. As such, they present suitable hydrogeotechnical properties for potential use as materials in a water retention layer in CCBEs. Nevertheless, effective application of these materials in CCBEs would depend on the overall CCBE system, which must be appropriately designed to create capillary barrier effects (e.g., choice of materials for the capillary break layer) and to enable long-term chemical stability of the mixtures when submitted to exchanges with the atmosphere (precipitation and freeze-thaw) and climate change impacts.

4. Discussion

4.1. Justification for the Chosen Initial Water Contents of the Base Soils

To investigate the impact of the initial water contents of the base materials on the dry densities of the compacted soil-sludge mixtures (see Table 3), initial water contents were chosen to obtain a compaction curve presenting a maximum point when varying the sludge content. This allows for determining the optimum sludge content (βopt). Obtaining an optimum point was impossible for initial water content of soils S1 and S2 higher than their optimum water contents. For example, Figure 7 presents curves ρdm(β) and wm(β) for mixtures with water contents of 7.5% and 200% for soil S2 and sludge A, respectively. The dry density (ρdm) decreases with increasing sludge content β so that the optimum sludge content βopt cannot be determined. Recall that the optimum water content wopt of soil S2 alone was around 6% (see Figure 3). Therefore, if sludge is added to a soil with a water content approaching wopt (here, 6%), the water content of the mixture wm increases significantly over wopt of the soil alone and the dry density decreases continuously. This is particularly true when the quantity of added sludge does not considerably modify the GSD curve of the soil (case of soil S2, see Figure 1b).

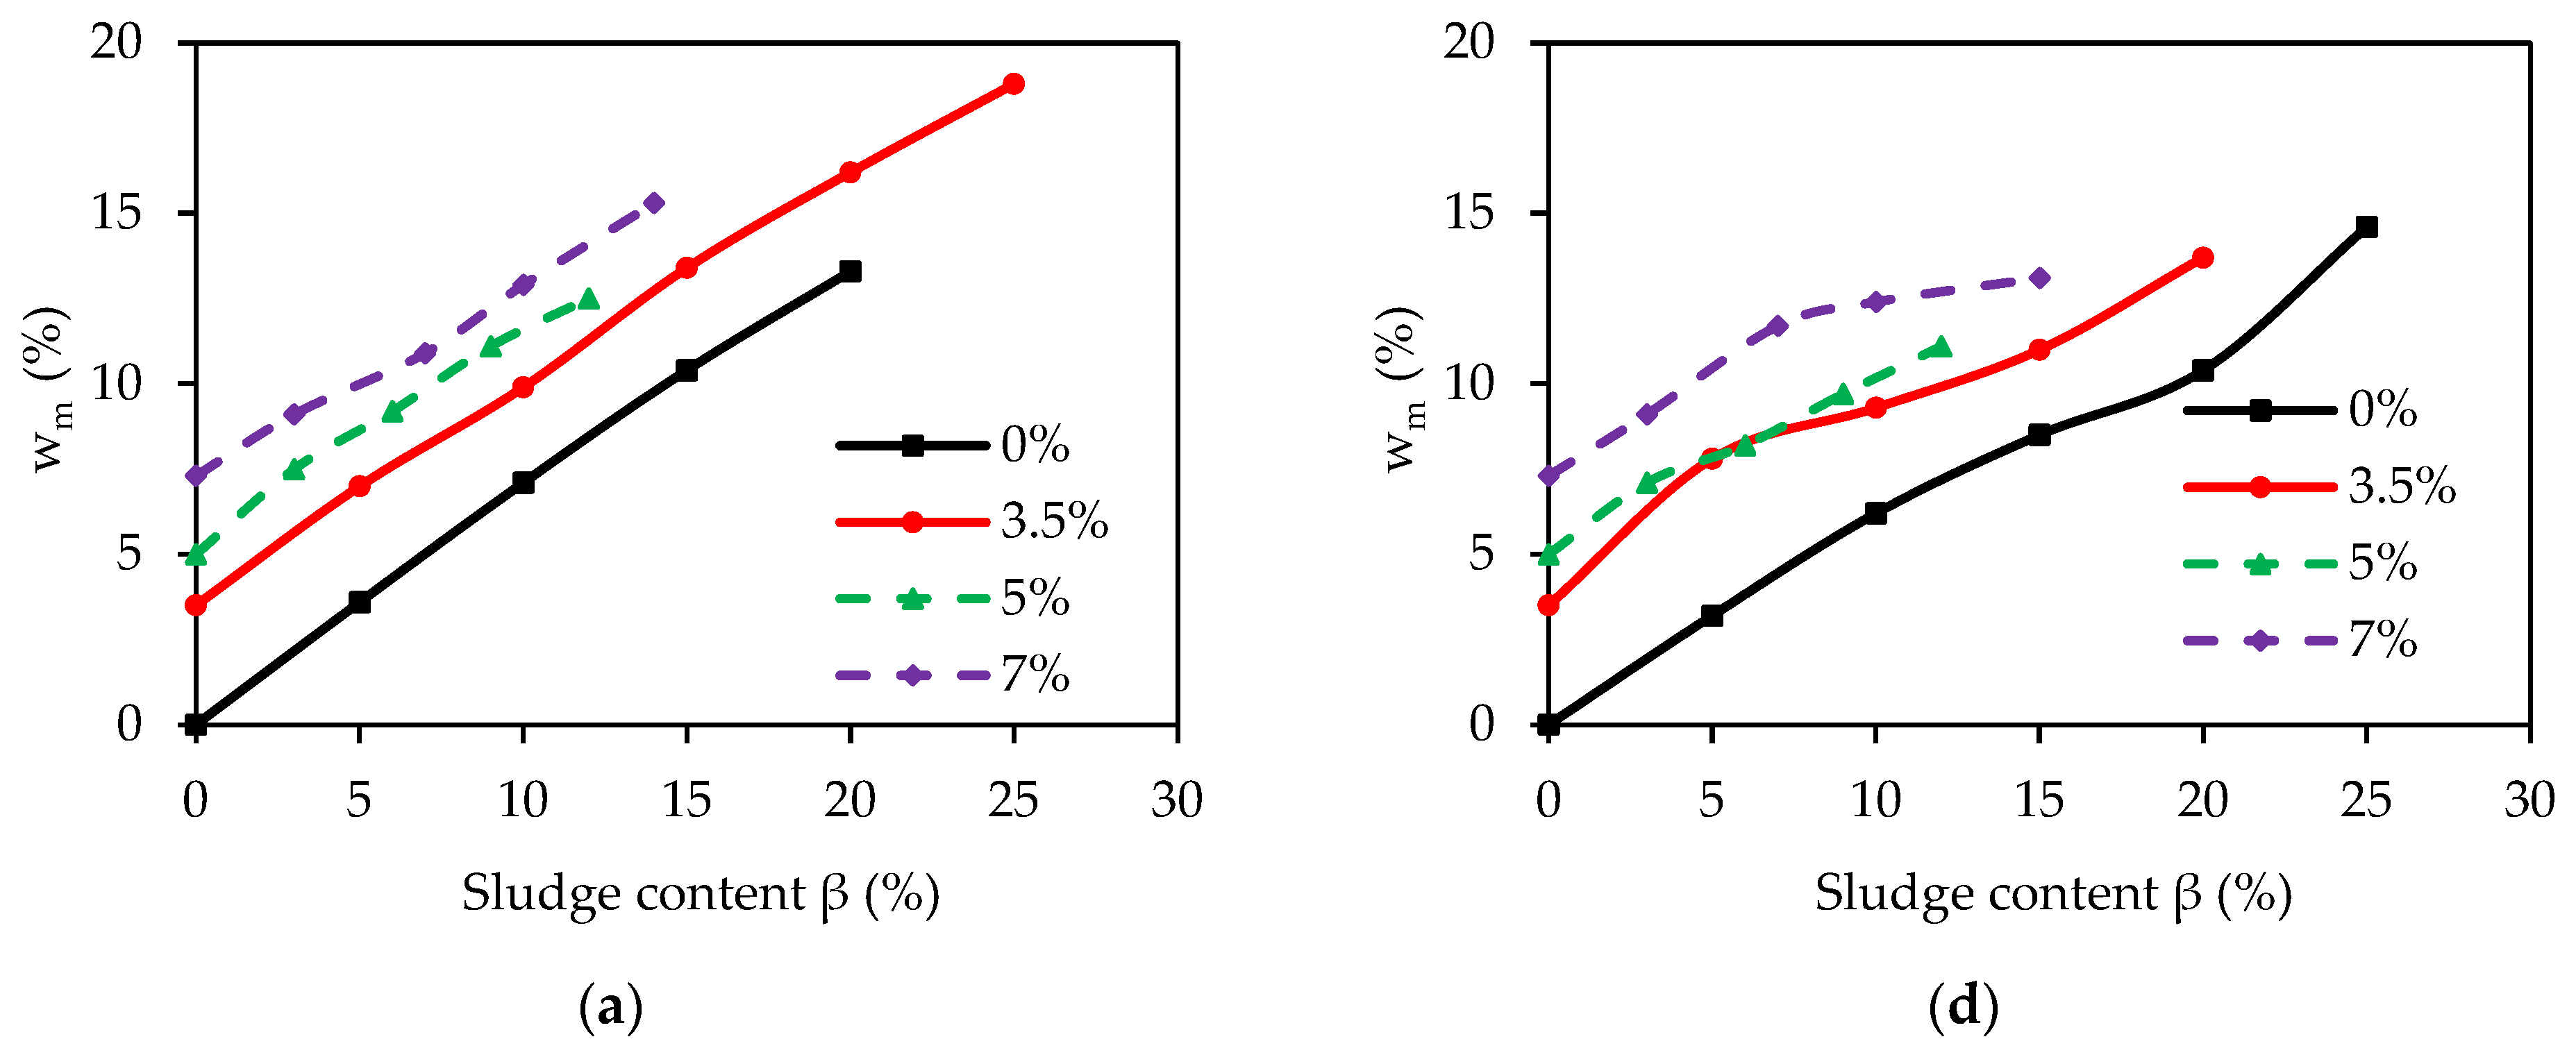
4.2. Comparison of Measured and Calculated Water Contents wm of the Mixtures

As mentioned above, Equation (3) can be used to estimate the water contents of the soil-sludge mixtures wm. Measured and calculated water contents wm of the mixtures prepared with soils S1 and S2 are presented in Figure 8a,b, respectively. Negligible discrepancies can be observed, which may be explained by the variability of the initial water contents of the soils and sludges, even though the samples were stored in an airtight container and homogenized before mixture preparation. The initial water contents of the homogenized soils and sludges were determined only once instead of before each mixture. Nevertheless, the mixture water contents can be estimated with acceptable accuracy. Indeed, the linear regressions show slopes close to 1 (0.96 and 1.04) with determination coefficients close to 1.

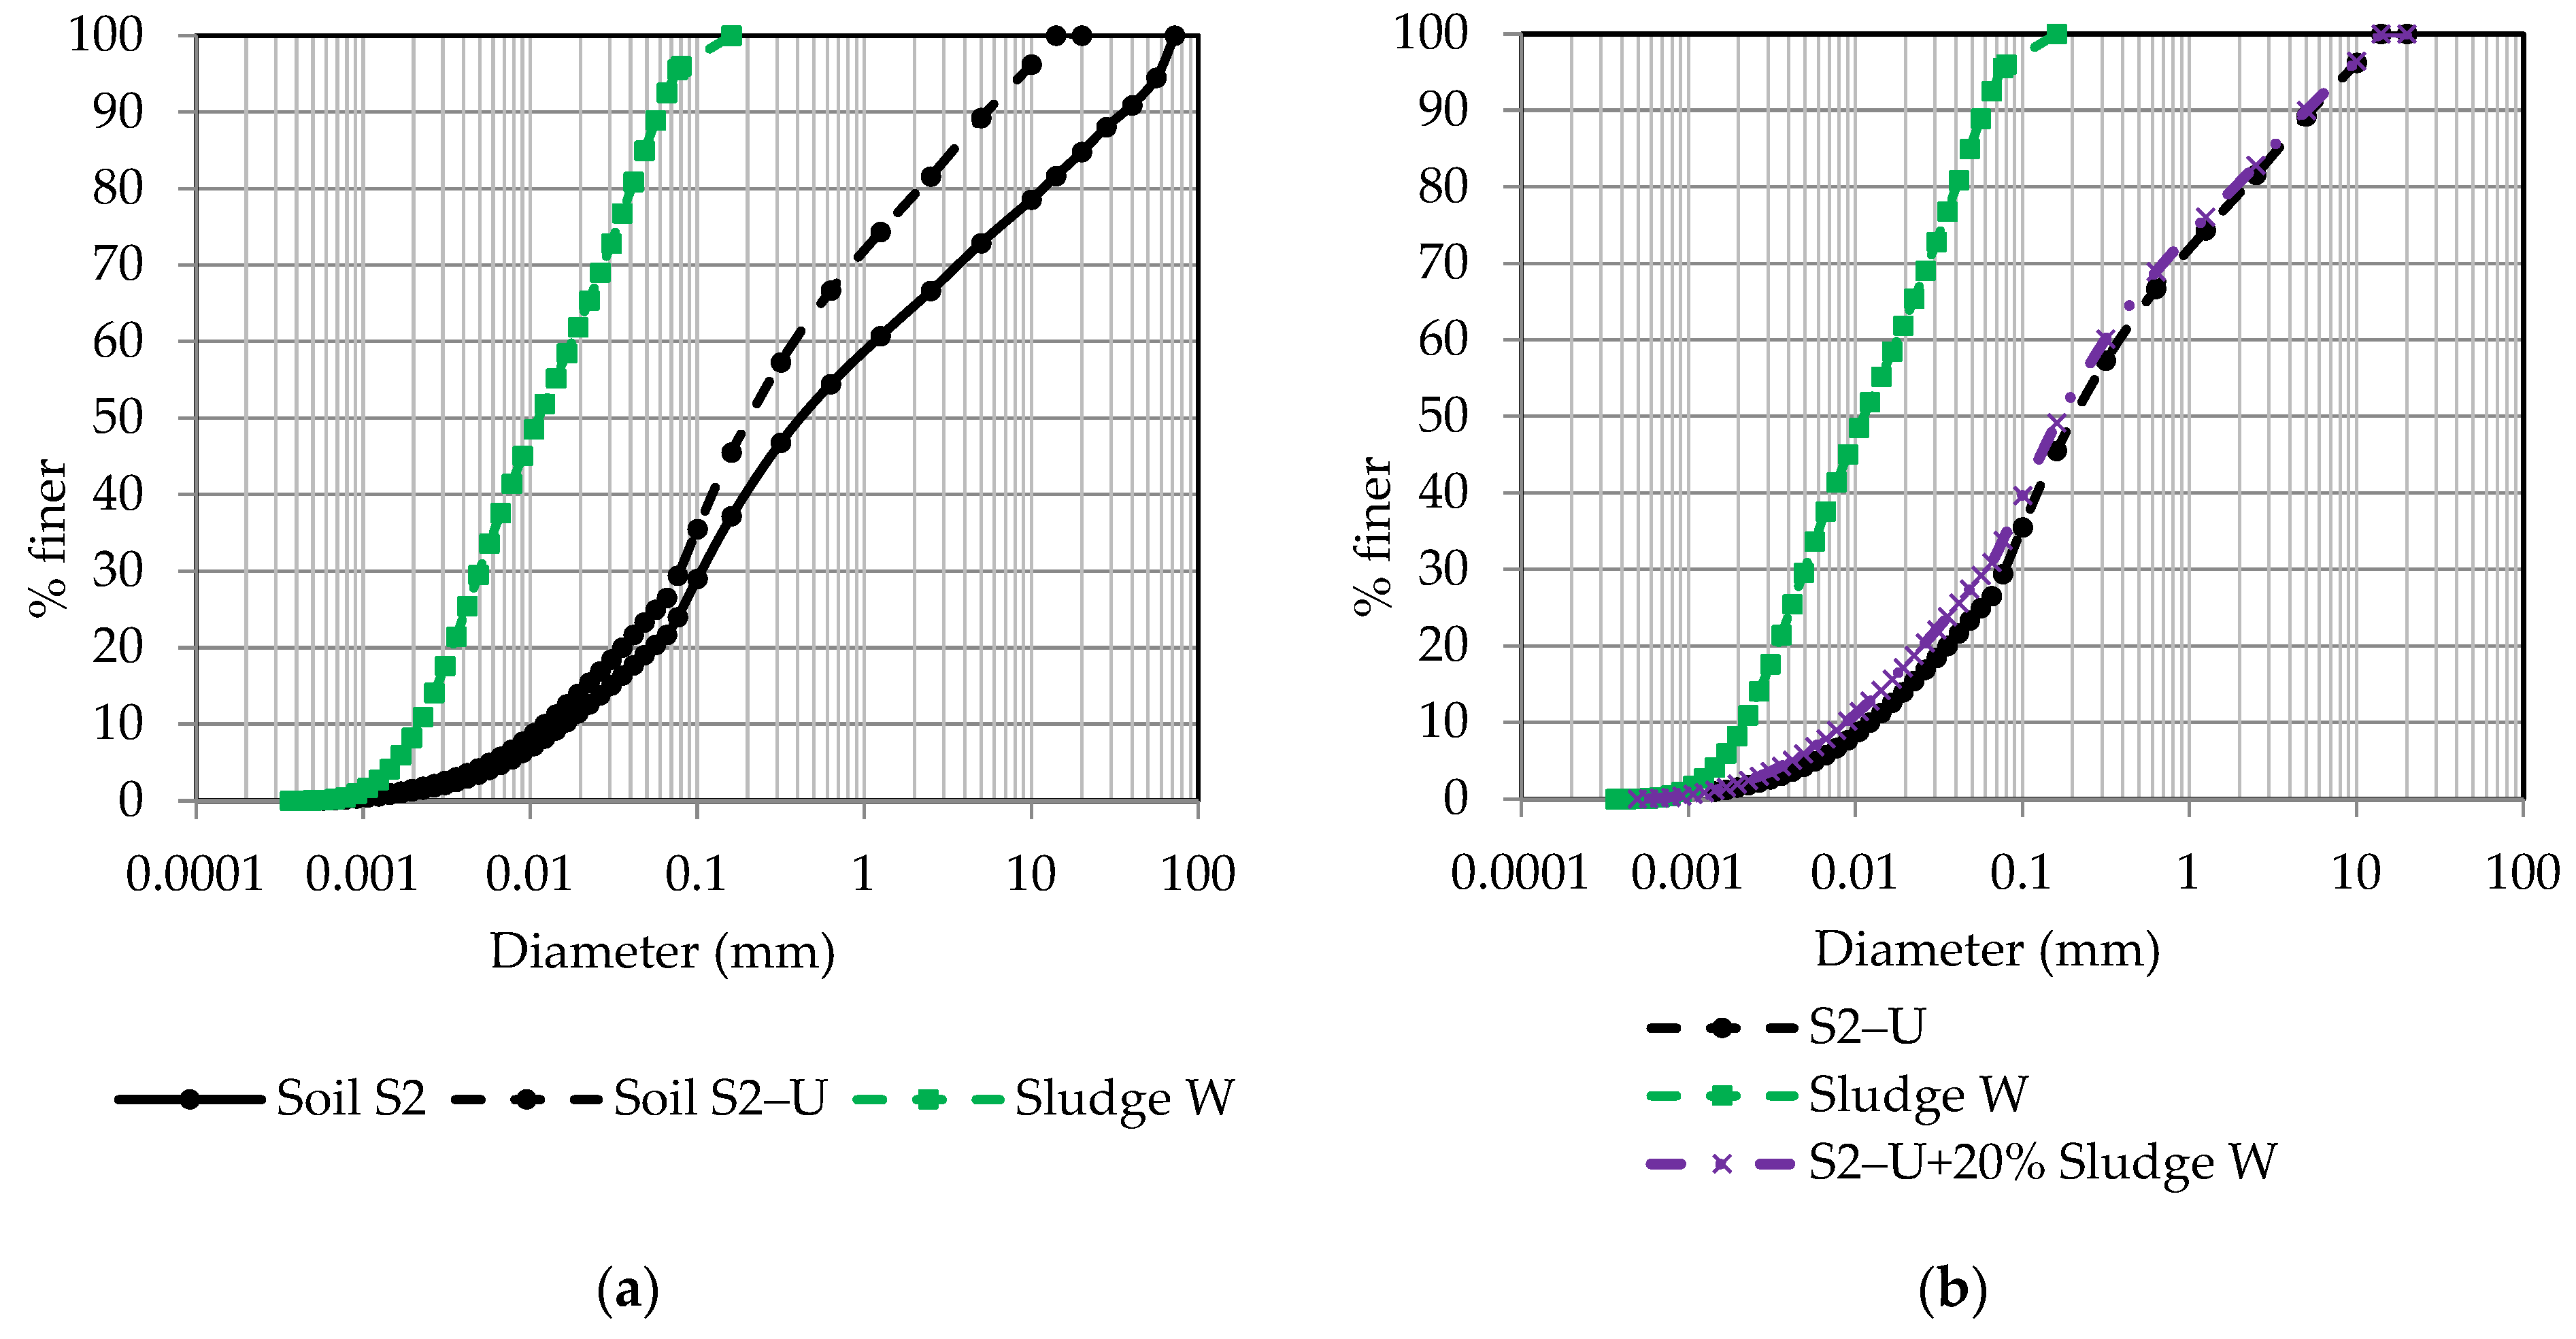
4.3. Correction of the Hydrogeotechnical Properties for Materials Containing Oversized Particles

The above-presented hydrogeotechnical properties were obtained on fractions passing the 14 mm sieve for soil S2 (i.e., S2-U) and mixtures based on soil S2-U, whereas the bulk soil S2 contains about 17% retained on this sieve (see Figure 1). Although ASTM D4718/D4718M-15 [38] prescribes the correction procedure for moisture content and density for the Proctor test when the data are known for the soil fraction with the oversize particles removed, to the authors’ knowledge, no method to date describes the correction procedure for the ksat and WRC results. Parallel theory can be used but was not applied in this case. The authors are aware that the properties of the S2 soil and the mixtures based on this soil containing particles larger than 14 mm would differ from those obtained on the 14 mm fraction.

4.4. Alternative Mixture Optimization Approaches

Various other mixture optimization methods are applied in the concrete, ceramic, asphalt, and similar industries. These approaches include models based on particle packing theory that produce a reference grain-size distribution curve using the maximum grain size (dmax) [39,40], the mean particle diameter (d50) [41] or dmax and the minimum grain size (dmin) [42] and models based on mixture theory used to determine a reference curve that shows variation in porosity (void ratio) of the mixture as a function of the proportion of fine particles and/or to obtain optimum proportions of particles in the mixtures [43,44,45,46]. Results on optimization of soil-sludge mixtures containing soils S1 and S2 using models based on particle packing theory suggested reference grain-size distribution curves that were coarser than the soils S1 and S2. These grain-size distribution curves are not feasible by adding sludge that are finer than S1 and S2. Mixture theory models have obtained optimum mixtures using sludge contents higher than those obtained using compaction. Results will be presented elsewhere.
Soil S2 alone (with an AEV of about 60 kPa) is suitable for use in the water retention layer in CCBEs that require an AEV > 20 kPa. Additional quantities of sludge up to 20% increased the AEV. This soil would have an optimization window for the amount of sludge to raise the AEV of the mixtures to slightly above 20 kPa, for example, 30 kPa. The increased sludge content in the S2-mixtures would allow for reusing a large quantity of wet sludge.

5. Conclusions

The objective of this study was to present an optimization method by compaction for soil-sludge mixtures. The optimum sludge content βopt corresponds to the content that allows for obtaining the maximum dry density of the soil-sludge mixtures using the modified effort as in the Proctor compaction test. Two soils (a poorly graded sand, S1; and a silty clayey sand with gravel, S2) at different initial water contents and two sludges (A, at 200% water content; and W, at 175% water content) were used. For the testing conditions, it was observed that βopt can be determined when the initial water content of each soil used in the mixture is lower than the optimum water content determined from the Proctor curve of the soil alone (10% and 6% for soils S1 and S2, respectively). Furthermore, βopt does not change with increasing initial water content of the soil. Indeed, for all the soils and sludges tested, βopt are low (≈15% for the S1 mixtures and ≈7% for the S2 mixtures), resulting in a limited quantity of reusable wet sludge in the mixtures. For all S1- and S2-mixtures tested, the maximum dry densities were obtained for mixture water contents wm that correspond to the optimum water contents wopt for soils S1 (wopt = 10%) and S2 (wopt = 6%). Results on the saturated hydraulic conductivity (ksat) and water retention capacity of selected optimized mixtures indicated that the optimized S2-mixtures (with ksat < 10−7 m/s) would be appropriate for use in the low permeability layer in LSHCCs, and that the optimized S1- and S2-mixtures (with AEV > 20 kPa) could be used as material for the water retention layer in CCBEs. In all cases, covers that contain a layer composed of soil-sludge mixtures should be rigorously designed to ensure effectiveness.

Author Contributions

Conceptualization, M.M.; methodology, M.M.; validation, M.M., T.B. and A.M.; formal analysis, É.T.N.; investigation, É.T.N. and O.K.; resources, M.M.; data curation, É.T.N.; writing—original draft preparation, M.M.; writing—review and editing, M.M., É.T.N., T.B., O.K. and A.M.; visualization, É.T.N. and M.M.; supervision, M.M., T.B. and A.M.; project administration, M.M.; funding acquisition, M.M. All authors have read and agreed to the published version of the manuscript.

Funding

This study was funded by the Fonds de Recherche Nature et Technologie (FRQNT), QUÉBEC—Programme de recherche en partenariat sur le développement durable du secteur minier—Volet valorisation des résidus miniers (grant number: 2017-MI-202883); the Iamgold Corporation—Westwood Mine; and the Research Institute of Mines and Environment (RIME UQAT—Polytechnique).

Data Availability Statement

Not applicable.

Acknowledgments

The authors would like to thank the RIME research professionals (Akué-Sylvette Awoh, Bini Mangane, and Ibrahima Hane) and the entire technical team, and particularly Yvan Poirier and Pierre-Alain Jacques for their technical support in performing the laboratory work. The authors would also like to acknowledge the contribution of the copy editor, Margaret McKyes.

Conflicts of Interest

The authors declare no conflict of interest. The funders had no role in the design of this study; in the collection, analyses, or interpretation of data; in the writing of the manuscript; or in the decision to publish the results.

References

  1. Evangelou, V.P. Pyrite Oxidation and Its Control; CRC Press Inc.: Boca Raton, FL, USA, 1995. [Google Scholar]
  2. Park, I.; Tabelin, C.B.; Jeon, S.; Li, X.; Seno, K.; Ito, M.; Hiroyoshi, N. A review of recent strategies for acid mine drainage prevention and mine tailings recycling. Chemosphere 2019, 219, 588–606. [Google Scholar] [CrossRef] [PubMed]
  3. Aubertin, M.; Pabst, T.; Bussière, B.; James, M.; Mbonimpa, M.; Benzaazoua, M.; Maqsoud, A. Revue des meilleures pratiques de restauration des sites d’entreposage de rejets miniers générateurs de DMA. In Proceedings of the Symposium 2015 sur L’environnement et les Mines, Rouyn-Noranda, QC, Canada, 14–17 June 2015. [Google Scholar]
  4. Bussière, B.; Aubertin, M.; Chapuis, R.P. The behavior of inclined covers used as oxygen barriers. Can. Geotech. J. 2003, 40, 512–535. [Google Scholar] [CrossRef]
  5. Nicholson, R.V.; Gillham, R.W.; Cherry, J.A.; Reardon, E.J. Reduction of acid generation in mine tailings through the use of moisture-retaining cover layers as oxygen barriers. Can. Geotech. J. 1989, 26, 1–8. [Google Scholar] [CrossRef]
  6. Bussière, B.; Aubertin, M.; Julien, M. Couvertures avec effets de barrière capillaire pour limiter le drainage minier acide: Aspects théoriques et pratiques. Vecteur Environ. 2001, 34, 37–50. [Google Scholar]
  7. Morel-Seytoux, H. The capillary barrier effect at the interface of two soil layers with some contrast in properties. HYDROWAR Report 92.4. Hydrol. Days Public 1992, 57, 94027-3926. [Google Scholar]
  8. Bussière, B.; Benzaazoua, M.; Aubertin, M.; Mbonimpa, M. A laboratory study of covers made of low-sulphide tailings to prevent acid mine drainage. Environ. Geol. 2004, 45, 609–622. [Google Scholar] [CrossRef]
  9. Mbonimpa, M.; Aubertin, M.; Aachib, M.; Bussière, B. Diffusion and consumption of oxygen in unsaturated cover materials. Can. Geotech. J. 2003, 40, 916–932. [Google Scholar] [CrossRef]
  10. Aubertin, M.; Chapuis, R. Considérations hydrogéotechniques pour l’entreposage des résidus miniers dans le nord-ouest du Québec. In Proceedings of the Second International Conference on the Abatement of Acidic Drainage, Montreal, MEND/Canmet, Montreal, QC, Canada, 16–18 September 1991; pp. 1–22. [Google Scholar]
  11. Aubertin, M.; Chapuis, R.P.; Aachib, M.; Bussière, B.; Ricard, J.-F.; Tremblay, L. Évaluation en Laboratoire de Barrières Sèches Construites à Partir de Résidus Miniers; MEND Report 2.22.2a; CANMET: Ottawa, ON, Canada, 1995. [Google Scholar]
  12. Demers, I.; Pabst, T. Covers with capillary barrier effects. In Hard Rock Mine Reclamation: From Prediction to Management of Acid Mine Drainage; Bussière, B., Guittonny, M., Eds.; CRC Press: Boca Raton, FL, USA, 2021; pp. 167–186. [Google Scholar]
  13. Maqsoud, A.; Bussière, B.; Mbonimpa, M. Low Saturated Hydraulic Conductivity Covers. In Hard Rock Mine Reclamation: From Prediction to Management of Acid Mine Drainage; Bussière, B., Guittonny, M., Eds.; CRC Press: Boca Raton, FL, USA, 2021; pp. 93–113. [Google Scholar]
  14. Brown, M.; Barley, B.; Wood, H. Minewater Treatment; IWA Publishing: London, UK, 2002. [Google Scholar]
  15. Younger, P.L.; Banwart, S.A.; Hedin, R.S. Mine Water: Hydrology, Pollution, Remediation; Springer Science & Business Media: Berlin, Germany, 2002; Volume 5. [Google Scholar]
  16. McDonald, D.M.; Webb, J.A.; Taylor, J. Chemical stability of acid rock drainage treatment sludge and implications for sludge management. Environ. Sci. Technol. 2006, 40, 1984–1990. [Google Scholar] [CrossRef]
  17. Zinck, J.; Griffith, W. Review of Acidic Drainage Treatment and Sludge Management Operations; MEND Report 3.43.1; CANMET: Ottawa, ON, Canada, 2013; 101p. [Google Scholar]
  18. Zinck, J.; Wilson, L.J.; Chen, T.T.; Griffith, W.; Mikhail, S.; Turcotte, S. Characterization and Stability of Acid Mine Drainage Sludges; MEND Report 3.42.2a; CANMET: Ottawa, ON, Canada, 1997; 319p. [Google Scholar]
  19. Herrera, P.; Uchiyama, H.; Igarashi, T.; Asakura, K.; Ochi, Y.; Iyatomi, N.; Nagae, S. Treatment of acid mine drainage through a ferrite formation process in central Hokkaido, Japan: Evaluation of dissolved silica and aluminium interference in ferrite formation. Miner. Eng. 2007, 20, 1255–1260. [Google Scholar] [CrossRef]
  20. Igarashi, T.; Herrera, P.S.; Uchiyama, H.; Miyamae, H.; Iyatomi, N.; Hashimoto, K.; Tabelin, C.B. The two-step neutralization ferrite-formation process for sustainable acid mine drainage treatment: Removal of copper, zinc and arsenic, and the influence of coexisting ions on ferritization. Sci. Total Environ. 2020, 715, 136877. [Google Scholar] [CrossRef]
  21. Zinck, J.; Fiset, J.; Griffith, W. Stability of treatment sludge in various disposal environments: A multi-year leaching study. In Proceedings of the IMWA 2010 Symposium, Sydney, NS, Canada, 5–9 September 2010; pp. 5–9. [Google Scholar]
  22. Demers, I.; Benzaazoua, M.; Mbonimpa, M.; Bouda, M.; Bois, D.; Gagnon, M. Valorisation of acid mine drainage treatment sludge as remediation component to control acid generation from mine wastes, part 1: Material characterization and laboratory kinetic testing. Miner. Eng. 2015, 76, 109–116. [Google Scholar] [CrossRef]
  23. Mbonimpa, M.; Bouda, M.; Demers, I.; Benzaazoua, M.; Bois, D.; Gagnon, M. Preliminary geotechnical assessment of the potential use of mixtures of soil and acid mine drainage neutralization sludge as materials for the moisture retention layer of covers with capillary barrier effects. Can. Geotech. J. 2016, 53, 828–838. [Google Scholar] [CrossRef]
  24. Demers, I.; Bouda, M.; Mbonimpa, M.; Benzaazoua, M.; Bois, D.; Gagnon, M. Valorization of acid mine drainage treatment sludge as remediation component to control acid generation from mine wastes, part 2: Field experimentation. Miner. Eng. 2015, 76, 117–125. [Google Scholar] [CrossRef]
  25. Demers, I.; Mbonimpa, M.; Benzaazoua, M.; Bouda, M.; Awoh, S.; Lortie, S.; Gagnon, M. Use of acid mine drainage treatment sludge by combination with a natural soil as an oxygen barrier cover for mine waste reclamation: Laboratory column tests and intermediate scale field tests. Miner. Eng. 2017, 107, 43–52. [Google Scholar] [CrossRef]
  26. ASTM D1557-12e1; Standard Test Methods for Laboratory Compaction Characteristics of Soil Using Modified Effort. ASTM International: West Conshohocken, PA, USA, 2012.
  27. ASTM D5550-14; Standard Test Method for Specific Gravity of Soil. ASTM International: West Conshohocken, PA, USA, 2014.
  28. ASTM D4318-17e1; Standard Test Methods for Liquid Limit, Plastic Limit, and Plasticity Index of Soils. ASTM International: West Conshohocken, PA, USA, 2018.
  29. ASTM D2487-17; Standard Practice for Classification of Soils for Engineering Purposes (Unified Soil Classification System). ASTM International: West Conshohocken, PA, USA, 2020.
  30. Young, R.A. The Rietveld Method; Oxford University Press: Oxford, UK, 1995. [Google Scholar]
  31. Martin, A.; Loomer, D.; Fawcett, S.; Rollo, A.; Gault, A.; Jamieson, H.; Simpson, S. MEND Report 3.44.1. Characterization and Prediction of Trace Metal Bearings Phases in ARD Neutralization Sludge; CANMET: Ottawa, ON, Canada, 2013. [Google Scholar]
  32. Chapuis, R.P. Predicting the saturated hydraulic conductivity of soils: A review. Bull. Eng. Geol. Environ. 2012, 71, 401–434. [Google Scholar] [CrossRef]
  33. ASTM D2434; Standard Test Method for Permeability of Granular Soils (Constant Head). ASTM International: West Conshohocken, PA, USA, 2000.
  34. ASTM D5856-95; Method for Measurement of Hydraulic Conductivity of Porous Material Using a Rigid-Wall, Compaction—Mold Permeameter. ASTM International: West Conshohocken, PA, USA, 2007.
  35. ASTM D6836-16; Standard Test Methods for Determination of the Soil Water Characteristic Curve for Desorption Using Hanging Column, Pressure Extractor, Chilled Mirror Hygrometer, or Centrifuge. ASTM International: West Conshohocken, PA, USA, 2016.
  36. Mbonimpa, M.; Aubertin, M.; Maqsoud, A.; Bussière, B. Predictive model for the water retention curve of deformable clayey soils. J. Geotech. Geoenviron. Eng. 2006, 132, 1121–1132. [Google Scholar] [CrossRef]
  37. Saleh-Mbemba, F.; Aubertin, M.; Mbonimpa, M.; Li, L. Experimental characterization of the shrinkage and water retention behaviour of tailings from hard rock mines. Geotech. Geol. Eng. 2016, 34, 251–266. [Google Scholar] [CrossRef]
  38. ASTM D4718/D4718M-15; Standard Practice for Correction of Unit Weight and Water Content for Soils Containing Oversize Particles. ASTM International: West Conshohocken, PA, USA, 2015.
  39. Fuller, W.B.; Thompson, S.E. The laws of proportioning concrete. Trans. Am. Soc. Civ. Eng. 1907, LIX, 67–143. [Google Scholar] [CrossRef]
  40. Andreasen, A.H.M.; Andersen, J. Über die Beziehung zwischen Kornabstufung und Zwischenraum in Produkten aus losen Körnern (mit einigen Experimenten). Kolloid-Z 1930, 50, 217–228. [Google Scholar] [CrossRef]
  41. Roquier, G. Étude de la Compacité Optimale des Mélanges Granulaires Binaires: Classe Granulaire Dominante, Effet de Paroi, Effet de Desserrement. Ph.D. Thesis, Université Paris Est, Paris, France, 15 February 2016. [Google Scholar]
  42. Dinger, D.R.; Funk, J.E. Predictive Process Control of Crowded Particulate Suspensions Applied to Ceramic Manufacturing; Kluwer Academic Publishers: Boston, MA, USA, 1994. [Google Scholar]
  43. Koltermann, C.E.; Gorelick, S.M. Fractional packing model for hydraulic conductivity derived from sediment mixtures. Water Resour. Res. 1995, 31, 3283–3297. [Google Scholar] [CrossRef]
  44. Côté, J.; Konrad, J.-M. Assessment of the hydraulic characteristics of unsaturated base-course materials: A practical method for pavement engineers. Can. Geotech. J. 2003, 40, 121–136. [Google Scholar] [CrossRef]
  45. Wickland, B.; Wilson, G.W.; Wijewickreme, D.; Klein, B. Design and evaluation of mixtures of mine waste rock and tailings. Can. Geotech. J. 2006, 43, 928–945. [Google Scholar] [CrossRef]
  46. Jehring, M.M.; Bareither, C.A. Tailings composition effects on shear strength behavior of co-mixed mine waste rock and tailings. Acta Geotech. 2016, 11, 1147–1166. [Google Scholar] [CrossRef]
Figure 1. (a) Grain size distribution curves for soils S1 and S2 and for sludges A and W; (b) typical grain size distribution curve for sludge W and mixtures S1-W and S2-W, considering the highest sludge contents used in this study (βmax = 25% for the S1-mixtures and βmax = 20% for the S2-mixtures; see Table 1).
Minerals 13 00806 g001
Figure 2. (a) Grain size distribution curves for sludge W, soil S2, and soil S2-U; (b) typical grain-size distribution curve for mixture S2-U-W considering the highest sludge content (βmax = 20%) used in this study for the S2-mixtures.
Minerals 13 00806 g002
Figure 3. Proctor compaction curves for soils S1 and S2.
Minerals 13 00806 g003
Figure 4. Mixtures prepared with soil S1 at initial water contents of 0, 3.5, 5, and 7% and sludges A (left column) and W (right column) at water contents of 200 and 175%, respectively (see Table 3): (a,d) impact of sludge content β on mixture water content wm; (b,e) impact of sludge content β on dry density ρd; (c,f) impact of mixture water content wm on dry density ρd.
Minerals 13 00806 g004aMinerals 13 00806 g004b
Figure 5. Mixtures prepared with soil S2 at initial water contents of 0, 2.5, and 4% and sludges A (left column) and W (right column) at water contents of 200 and 175%, respectively (see Table 3): (a,d) impact of sludge content β on mixture water content wm; (b,e) impact of sludge content β on dry density ρd; (c,f) impact of mixture water content wm on dry density ρd.
Minerals 13 00806 g005aMinerals 13 00806 g005b
Figure 6. Selected mixtures prepared using soil S1 and sludges A and W (left column) and with soil S2-U and sludges A and W (right column): (a,d) shrinkage curves expressed in terms of n(Ψ); (b,e) WRC expressed in terms of θ(Ψ); (c,f) WRC expressed in terms of Sr(Ψ).
Minerals 13 00806 g006aMinerals 13 00806 g006b
Figure 7. Impact of sludge content on dry density and water content of S2-A mixtures prepared using soil S2 at wso = 7.5% and sludge A at wsl = 200%.
Minerals 13 00806 g007
Figure 8. Comparison of measured and calculated water contents wm of the mixtures: (a) mixtures with soil S1; (b) mixtures with soil S2.
Minerals 13 00806 g008
Table 1. Physical properties of the base materials used for the soil-sludge mixtures.
Parameter *Soil S1Soil S2Soil S2-USludge ASludge W
D10 (mm)0.3500.0140.0120.0020.002
D30 (mm)0.6000.1000.0760.0050.005
D50 (mm)1.000.4000.2000.0090.011
D60 (mm)1.251.200.4030.0150.018
CU (−)3.685.733.659
CC (−)0.81.70.81.30.7
P#200 (%)0.824299798
P#4 (%)92728900
R75 (%)00000
LL (%)-171714275
PL (%)-1010-52
PI (%)-77-16
USCS classificationSPSC-SMSC-SM-MH
Gs (−)2.72.82.82.62.35
* Dx is the diameter corresponding to x% passing on the cumulative grain size distribution curve, CU is the coefficient of uniformity, CC is the coefficient of curvature, and P#x is the fraction of particles finer than sieve No. x (No. 200 and No. 4 correspond to approximately 0.080 mm and 5 mm according to the Unified Soil Classification System (USCS), respectively), R75 is the fraction of particles coarser than 75 mm, LL is the liquid limit, PL is the plastic limit, PI is the plasticity index (PI = LL − PL), and Gs is the specific gravity (or relative density) of the solid grains.
Table 2. Mineral phases and total carbon (C) and sulfur (S) contents.
Mineral/ElementSoil S1Soil S2Sludge ASludge W
Albite (%)35.442.3--
Calcite (%)--51-
IIb chlorite (%)0.16.4--
Cordierite (%)10.75.2--
Corundum (%)--3516
Gypsum (%)---80
2MI muscovite (%)0.110.0--
Pyrite (%)-0.2--
Quartz (%)53.735.2144
Rutile (%)-0.6--
Sphalerite (%)-0.2--
Total carbon C (%)0.0500.0502.0600.650
Total sulfur S (%)0.0230.0480.7586.537
Table 3. Initial water contents of soils (wso) and wet sludge contents (β) of the mixtures prepared for mixture optimization by compaction.
Base
Material
wso (%)Sludge Content, β (%wt)
S1-AS1-WS2-AS2-W
S105; 10; 15; 205; 10; 15; 20; 25
3.55; 10; 15; 20; 255; 10; 15; 20
5.03; 6; 9; 123; 6; 9; 12
7.03; 7; 10; 143; 7; 10; 14
S20 2; 5; 10; 15; 205; 10; 15; 20
2.5 4; 6; 9; 123; 5; 7; 10
4.0 2; 5; 8; 102; 4; 6; 10
Table 4. Saturated hydraulic conductivities of base soils S1 and S2 and selected soil-sludge mixtures prepared with S1 at wso = 3.5% and with S2-U at wso = 4%.
Materialρdmax (g/cm3)0.98 × ρdmax (g/cm3)β (%)n (−)ksat (m/s)
Soil S12.011.9700.302.03 × 10−5
S1-A2.001.96150.348.50 × 10−7
S1-W2.092.05170.302.02 × 10−6
Soil S22.212.1600.204.70 × 10−8
S2-U-A2.132.0970.295.23 × 10−8
S2-U-W2.202.1660.256.9 × 10−8
Table 5. Sample characteristics used to determine the WRC and ensuing AEV values.
Materialβ (%)Initial
Porosity n (−)
Initial
Void Ratio e (−)
AEV (kPa)
Soil S100.420.721.3
S1-A150.440.7939
S1-W170.290.4130
Soil S2-U00.300.4360
S2-U-A70.390.6468
S2-U-W60.340.5268
Disclaimer/Publisher’s Note: The statements, opinions and data contained in all publications are solely those of the individual author(s) and contributor(s) and not of MDPI and/or the editor(s). MDPI and/or the editor(s) disclaim responsibility for any injury to people or property resulting from any ideas, methods, instructions or products referred to in the content.

