Article

A Reduced-Order Fluid Flow Model for Gas Injection into Porous Media: For Application in Carbon Sequestration in Mine Tailings

1
Norman B. Keevil Institute of Mining Engineering, The University of British Columbia, Vancouver, BC V6T 1Z4, Canada
2
Department of Earth, Ocean and Atmospheric Science, The University of British Columbia, Vancouver, BC V6T 1Z4, Canada
*
Authors to whom correspondence should be addressed.
Minerals 2023, 13(7), 855; https://doi.org/10.3390/min13070855
Submission received: 3 April 2023 / Revised: 3 June 2023 / Accepted: 20 June 2023 / Published: 24 June 2023
(This article belongs to the Special Issue Carbon Dioxide Storage, Utilization & Reduction)

Abstract

:
One method to accelerate carbon sequestration within mine tailings from remote mines involves the injection of diesel generator exhaust into dry stack tailings. The techno-economic feasibility of this approach heavily depends on understanding the flow characteristics inside the perforated injection pipes embedded within the tailings. Two distinctive yet dynamically coupled transport phenomena were identified and evaluated: (i) gas transport inside the pipe and (ii) gas injection into the porous body of the tailings. This paper presents two models to investigate these transport phenomena, a three-dimensional (3D) and a one-plus-one-dimensional (1 + 1)D model. An experimental investigation of the pressure profile through the injection pipe was carried out to validate the models at the experimental scale. To apply the (1 + 1)D model to larger scales, the results were compared with those of the 3D model, as the (1 + 1)D model required significantly less computational resources and time. To include the effect of the perforations in the pipe on the pressure profile of the (1 + 1)D model, an analytical fluid velocity profile was developed in relation to geometric and physical parameters. The performance of the (1 + 1)D model with an impact factor was then evaluated against the 3D model results for the inlet pressure, pressure profile and gas outflow distribution under various conditions than those investigated experimentally. The developed (1 + 1)D model can be used to design an energy-efficient approach for large-scale implementation with a wide range of desired operating parameters.

1. Introduction

Many mines across the globe are categorized as remote due to their lack of access to the electric grid or to natural gas pipelines [1]. Most of these mines rely on fossil fuels for heat and power generation. This dependency on fossil fuels, mainly diesel, causes these mines to emit substantial amounts of carbon dioxide (CO2) into the atmosphere [2,3]. Increasing anthropogenic greenhouse gas concentrations contribute to the rise in the global surface temperature [4]. As a result, there is an increasing global demand for large-scale solutions to capture, transport, and safely store atmospheric carbon dioxide [5,6,7]. The sequestration of carbon dioxide in the form of carbonate minerals offers a long-lasting, stable solution for carbon capture and storage [8]. This can be carried out through the reaction of CO2 with an alkalinity source, as found in ultramafic-hosted rocks [9]. These minerals react with carbon dioxide relatively rapidly and form mineral carbonates when exposed to the surface. These reactions can occur passively at the surface of mine tailings storage facilities (TSFs) [10,11]. Carbonation rates in ultramafic tailings are highly variable and are limited by several factors, including the mineralogy and availability of CO2 and water [12,13,14,15]. Field studies of different ultramafic-hosted mines showed that the CO2 drawdown rates are largely controlled by the centimeter-scale depth to which CO2 can diffuse, even when reactive minerals are present [9,16,17]. This means that significant reactivity remains unrealized. There are proposed technologies for enhancing the carbon dioxide supply to the tailings to accelerate the carbonation rate [13,18]. A relatively inexpensive and viable solution is injecting CO2-rich flue gas (~10% CO2 content) sourced from mine power generation into the tailings [9,19,20,21]. The unsaturated tailings conditions needed for homogeneous injection require the tailings to be filtered and stored as dry-stack tailings [22,23]. Flue gas could be injected into the dry stack TSF through a network of embedded perforated pipes [24].
Modeling simulations are necessary for optimizing the injection design. A perforated pipe can be defined as a cylinder with holes that allow for a uniform distribution of flow throughout the pipe [25,26]. Studies on perforated pipes can generally be categorized into three types: discrete, analytical, and computational fluid dynamics (CFD) simulations, based on their methodologies to investigate pressure drops and flow [27]. Several studies have used either energy equations [28] or momentum conservation methods [29] to investigate the pressure profile in perforated pipes. Acrivos et al. [30] conducted an extensive experimental and theoretical evaluation by including an empirical alteration of the Bernoulli equation to estimate the flow distribution and pressure variation in a perforated pipe. These findings were later simplified by Greskovich and O’Bara [31] with the assumption of uniform flow through the perforations [32]. Wang [27] explained the pressure response of perforated pipes by deriving an energy balance of the fluid flow in the boundary layer and the pipe center (see also [33]). Several studies have focused on the application of perforated pipes for micro-irrigation applications. Vallesquino and Luque-Escamilla [34] treated lateral irrigation outflow as a discrete event and employed Taylor polynomials to calculate flow rates. Maynes et al. [35] proposed a theoretical solution based on laboratory experiments to calculate the head loss coefficient across a perforated pipe. Discrete models, also known as network models, have been employed by several researchers due to their simplicity [36]. In these models, the perforated pipe or manifold was represented as a combination of several intersections through which fluid traveled. For each intersection, the conservation equation for mass and momentum was applied and solved with the iteration of a set of differential equations. At the same time, the analytical models provided an explicit analytical solution while considering a continuously branched fluid flow throughout the manifold. Although widely accepted due to their simplistic approach [29], both discrete and analytical approaches have limitations in terms of their applicability to complex cases.
The application of CFD models has the potential to solve problems related to perforated pipes. The researchers in [37] conducted several parametric studies on the hydraulic performance of a perforated pipe. They developed a numerical model [37,38] to investigate the hydraulic characteristics of porous pipe underdrains. Minocha et al. [39] employed three-dimensional (3D) CFD simulations to investigate potential design scenarios to optimize the pressure drops in a divided manifold system. Kulkarni et al. [32] performed 3D CFD simulations along with experimental work to investigate the pressure and flow distribution in pipe and ring spargers to achieve a uniform pressure and flow distribution. Though the application of CFD has been extremely useful in this research field, it demands extensive computation resources, which makes it inconvenient for a preliminary analysis where a significant number of iterations are required.
To the best of the authors’ knowledge, no study has undertaken the design of a large-scale carbon sequestration system by injecting diesel flue gas into mine tailings through perforated pipes. Analysing the strengths and weaknesses of each of the approaches mentioned earlier, a research framework was developed to obtain a reduced-order numerical (ROM) model to achieve the most effective solution for the problem concerned. A ROM provides similar accuracy as 3D CFD models in solving complex scenarios but requires significantly less computational resources and time [40]. This study aimed to develop a (1 + 1)D reduced-order numerical model that could (1) be validated by the results of an experimental investigation, (2) provide the same accuracy as a 3D finite element (FE) model for different operating and design parameters and (3) be applied to establish an energy-efficient large-scale design for injecting flue gas into mine tailings.

2. Methodology

2.1. Conceptual Design

The conceptual design proposed in Figure 1 would require cooling the exhaust with an exhaust heat recovery system [41,42,43] and transporting the exhaust from the power plant to the dry stack TSF through a pipeline (Transport-1). We propose that the exhaust could then be injected into an array of perforated pipes buried in deposited filtered tailings to ensure the consistent delivery of CO2. The proposed concept considers dividing the tailings into a series of blocks with similar dimensions. Each block has an injection pipe buried at its center, with each pipe having a certain volume of surrounding tailings. Two concurrent phenomena will occur within the injection pipes: the transportation of the exhaust through the injection pipes (Transport-2) and the injection of the exhaust into the tailings through the pipe perforations (Transport-3). Once a layer of tailings has fully reacted, a new layer of tailings can be built up with a new set of injection pipes.
In Transport-1 and 2, frictional pressure losses occur due to the viscosity of the exhaust gas within the respective pipes. During Transport-2, the flue gas outflow creates a momentum loss as the gas exits through the perforations into the tailings leading to a pressure rise [44]. The total pressure drop in Transport-2 is the net value of the pressure losses and gains and can be denoted as the transportation pressure losses (TPL). Simultaneously, in Transport-3, the system is faced with another pressure drop due to the outflow of the exhaust into the tailings [45]. This can be denoted as the injection pressure loss (IPL). A compressor, a fan, or a blower will be necessary for flowing exhaust into the tailings and providing a steady discharge throughout the entire length of the pipe to ensure a homogeneous reaction of the tailings with CO2. The major design challenge in the large-scale implementation of this concept is to reduce the power required to overcome the pressure drops. The first step to address this challenge is to study the gauge pressure and outflow behavior of gas injected into a perforated injection pipe embedded in a porous medium.
The methodology of this study involved an experimental investigation which was used to validate a 3D FE numerical simulation and a (1 + 1)D ROM. To create the (1 + 1)D model, the relationship between various perforation arrangements and the pressure profile along the injection pipe was established through a parameter termed the m -factor. Making the (1 + 1)D model independent avoids the use of the computationally demanding 3D numerical model. To evaluate the performance of the (1 + 1)D ROM, the model was compared against the 3D FE results under different design parameters to establish its ability to aid independently in selecting an optimal design.

2.2. Perforated Injection Experimental Design

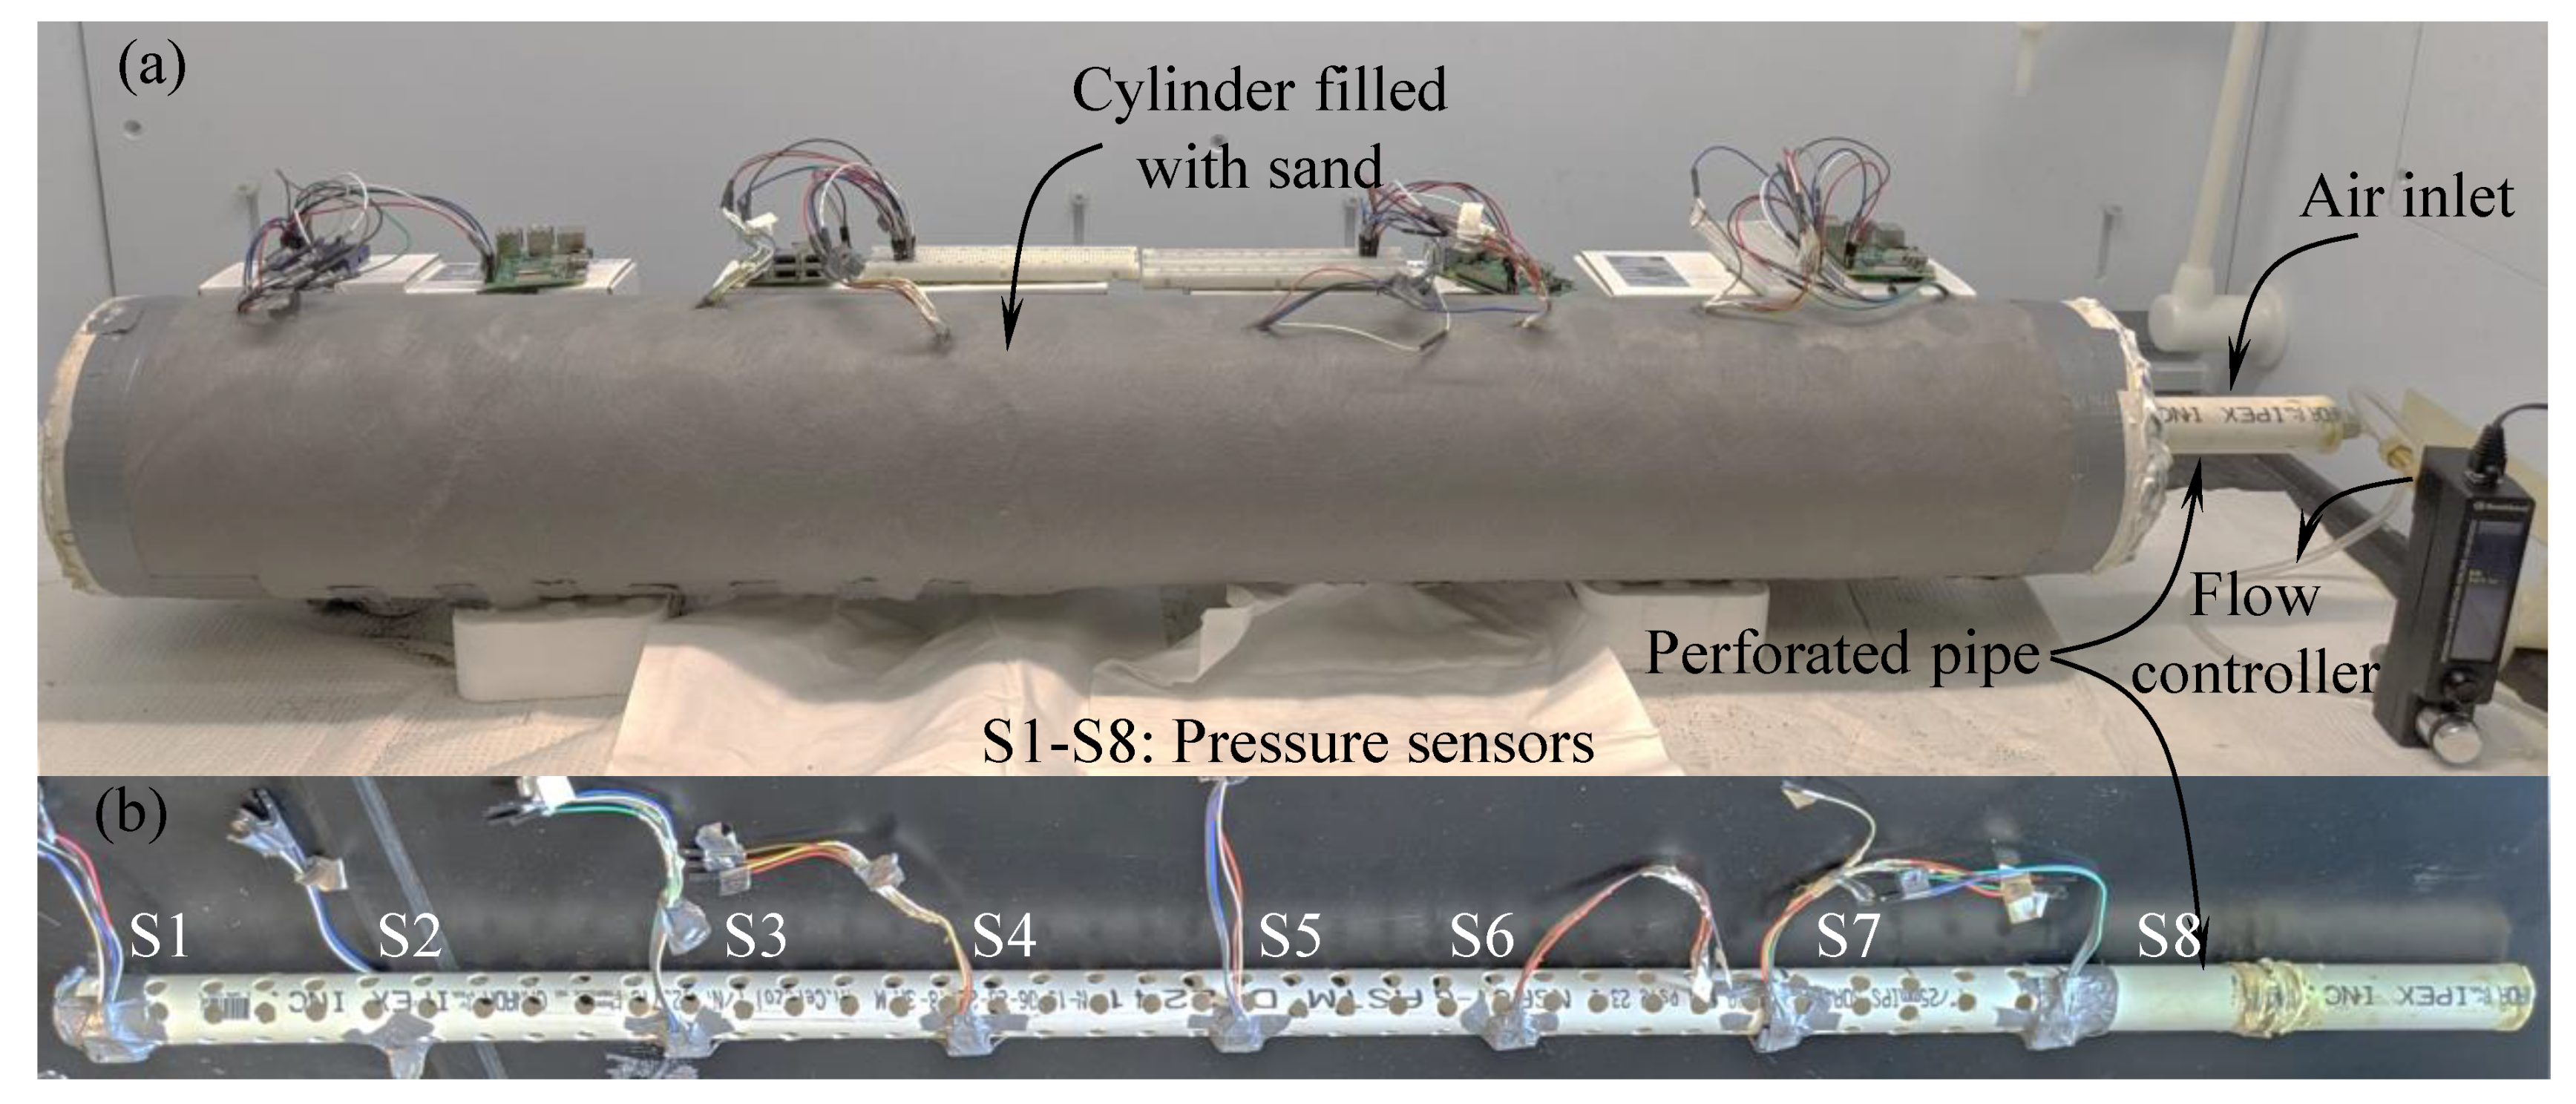
A meter-scale injection experimental set-up was built to validate the developed (1 + 1)D model. This set-up comprised a perforated injection pipe (1.10 m in length and 0.029 m in diameter) nested within a larger, perforated cylinder (1.024 m in length and 0.15 m in diameter; shown in Figure 2). The perforations of the injection pipe and the external cylinder were covered with a gray, breathable fabric membrane. Along the injection pipe, eight precise, low-noise Bosch Sensortec BMP 388 pressure sensors (labeled as S1–S8 in Figure 2b; relative accuracy of ±8 Pa) were installed in approximately equal intervals. The sand was compacted in the larger cylinder, around the injection pipe, with the membrane retaining the sand from exiting through the external perforations and from entering inside the injection pipe. The sand was used as the porous material as it is more homogenous and has a permeability range similar to the tailing’s permeability ( 10 9 10 14 m 2 ), as mentioned in reference [24]. Two particle size distributions (PSD) of sand were used to achieve different permeabilities, termed coarse sand (CS; <2 mm and >425 μm) and fine sand (FS; <425 μm). The PSD of the sand was assessed through the application of sieving and laser diffraction, with further details and results included in the Supplementary Information (SI). The cylinder was filled first with 26 kg of CS at 3% moisture content and then with 32 kg of FS at 5% moisture content. As the column was filled, the sand was compacted every ~3 kg. The physical conditions of the sand in the cylinder were simulated in a separate column which allowed the permeability to be measured. Once full, the ends of the large cylinder and injection pipe were sealed with epoxy.
The system was connected to a compressed air cylinder, and a MASS-VIEW MV-306 flow regulator (accuracy of ±2% of the reading for >100 LPM and ±1% of the reading + 0.5% of full scale for <100 LPM) was used to control the flow rate into the injection pipe. Gas flowed through the perforations of the injection pipe, into the porous medium of the sand and out through the perforations in the larger cylinder. Air was injected into the CS at three flow rates: 100, 110 and 120 LPM. For the FS, the injection rates were 70, 85 and 100 LPM. Each injection rate was conducted twice to examine the experimental repeatability. The entire surface of the cylinder discharged at ambient pressure ( p 0 ), and any air entrapment was prevented by the well-distributed external perforations. The pressure sensors were used to measure the gauge pressure along the injection pipe. The real-time pressure monitoring and data collection were accomplished by a Raspberry Pi 3B+.
In measuring both the flow rate and pressure values, the experimental errors were considered, and the ranges for these two parameters were calculated with the following equations:
p = p m ± p e
Q = Q m ± Q e
Here, p m and Q m represent the measured values for the pressure and the flowrate, respectively and p e and Q e are the associated error range for each measurement due to the sensitivity accuracy of the devices were used. Combining the measured values with the error range, we derived the actual values of the pressure and the flowrate, denoted by p and Q , respectively.

Permeability Measurement

A centimeter-scale permeameter was used to measure the permeability of the two sand samples at the same moisture content and density conditions as existed in the m-scale injection pipe set-up. The potential variability in permeability for both samples from different density conditions ( 1.4 × 10 3 1.8 × 10 3 k g / m 3 ) was also assessed. The permeameter consisted of a polycarbonate column manufactured by W.A. Hammond Drierite, with two Bosch Sensortec BMP 280 pressure sensors (relative accuracy of ±12 Pa) used to measure the gauge pressure at the column inlet and outlet (Figure 3). Sand at the targeted moisture content was introduced and compacted to the targeted bulk density in regular intervals. Test conditions can be found in the Supplementary Materials. Air was injected using a Bronkhorst EL-Flow Prestige mass flow controller at flow rates ranging from 0.5 to 8 LPM. From the pressure drop between the inlet and outlet, the permeability of the sand was calculated using the following equation:
k = 2 Q μ L p 0 A p i n 2 p o u t 2
Here, A = 0.0025 m 2 is the cross-sectional area of the column, L is the length of the column filled with sand, μ = 1.813 × 10 5 P a . s is the dynamic viscosity of air, and Q is the flow rate. p 0 is the ambient pressure, and p i n and p o u t are the measured pressures (in Pa) at the inlet and outlet of the column, respectively. Three flow rates were used per test, with the average permeability from the three tests being taken as the final value.

2.3. 3D Model Development

To model the experiment, a 3D model was developed that coupled the fluid flow in Transport-2 and 3 and solved the pressure distribution simultaneously. The governing equations describing the turbulent flow in the pipe (Transport-2) in terms of the time-averaged and fluctuating components of the velocity field ( U i , u i ; i = 1 3 ) are described in the form of the Reynolds averaged Navier–Stokes equations. For steady-state incompressible flow of Newtonian fluids, this equation can be written as follows:
ρ U j U i x j = x j p δ i j + μ U j x i + U i x j ρ u i u j
In this equation, ρ is the density of the fluid, μ is the viscosity of the fluid, p is the pressure, and ρ u i u j is the Reynolds stress tensor, which corresponds to the turbulent fluctuations in the flow field. To close this problem and solve the momentum equation given in Equation (4), the Reynolds stress tensor should be written in terms of the time-averaging components of the velocity vector using a turbulence model. In this study, the Algebraic yPlus model, which is based on Prandtl’s mixing-length theory, was used to validate the numerical solution. This model was found to be less sensitive to the mesh size and resulted in considerably lower computation times compared to other options.
The equation governing the flow of a fluid in a porous medium (Transport-3) follows the Brinkman–Forchheimer representation given as [46,47]:
p = μ k u + μ 2 u c F k 1 2 ρ u u
The first term on the right-hand side in Equation (5) is Darcy’s law, the second term is the Brinkman extension, which accounts for the viscous forces in the porous medium, and the last term is the Forchheimer extension, which accounts for the turbulent flow condition [48]. Here, μ is the effective viscosity at the wall, which is assumed to be the same as μ , and c F is a constant. For the simulations conducted in this research, the effect of inertial forces has been considered to be insignificant ( R e < 1 c F = 0 ).
The FE method was used to solve Equations (4) and (5) concurrently for the flow of a fluid in a perforated pipe separated by a thin interface (pipe wall) from a porous medium. The geometry of the domain and the boundary conditions implemented in the FE simulations are shown in Figure 4. The symmetry of the model allows the simulations to run over a quarter of the geometry. At the outer boundary of the geometry ( r = r o u t ), the pore pressure is set to the ambient pressure ( p = p 0 ). Continuity conditions were satisfied at the surface of the pipe where the perforations are located, and the Dirichlet boundary condition was assigned at the fluid–pipe interface. The thickness of the pipe was much smaller than the entire geometry and was therefore neglected in the simulations. A mesh independency analysis was carried out to ensure that the numerical results were independent of the mesh configuration.

2.4. (1 + 1)D Model Development

To accelerate the modeling iterations needed to select an optimal design, a (1 + 1)D numerical model is proposed that can simulate the experimental results and match the 3D model results. The developed model carries forward the calculations for the flow field iteratively through the direction of the flow (along the pipe) and concurrently towards the direction of injection (to the porous media). Therefore, the model is referred to as the (1 + 1)D model.
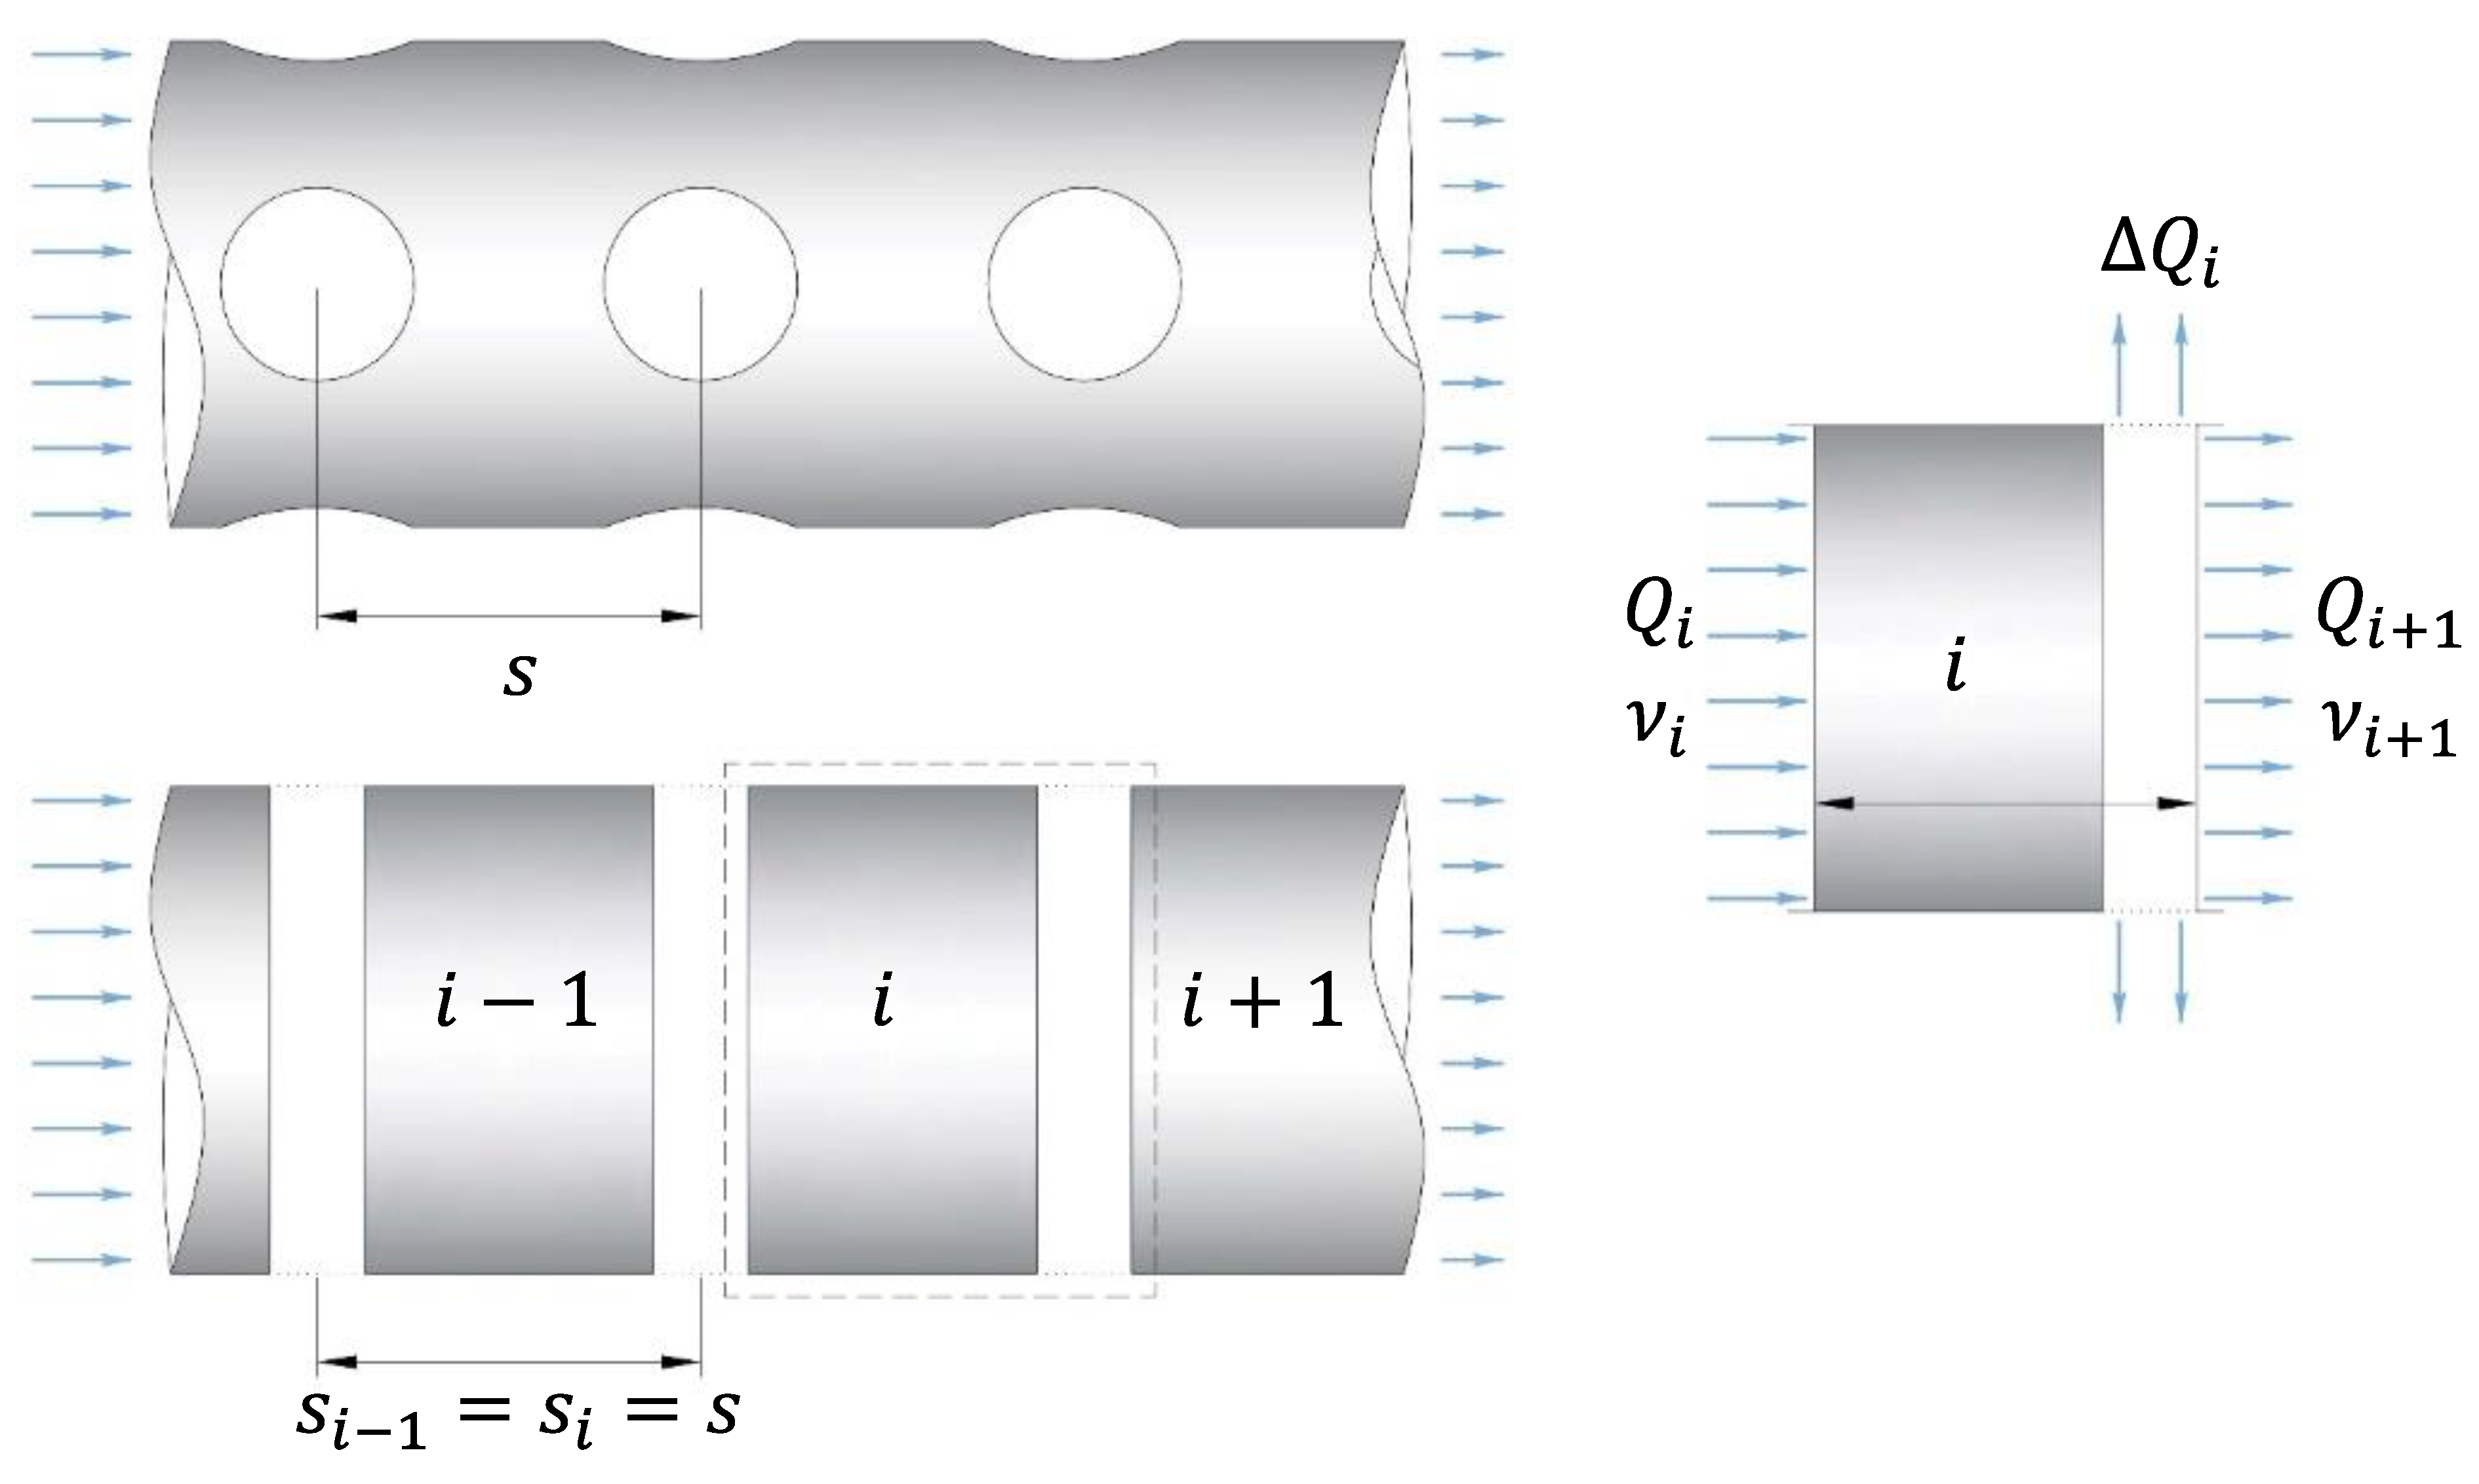
The developed numerical model divides the entire length of the pipe ( L ) into n z sections of equal length [ s i = s z i = 1 , 2 , , n ] , with each section receiving inputs from the previous one. s z is the center-to-center distance between the perforations in the longitudinal direction and is considered to be the smallest unit of discretization along a pipe of length L ( = n z s z ) . The discretization used in the (1 + 1)D ROM is shown in Figure 5. Q i is the amount of exhaust transported through the inflow into the i th section; Δ Q i is the amount of exhaust injected into the tailings (outflow) from that perforated section; and Q i + 1 is the flow transported from the i th section to the following section.
In Transport-2, the friction between the pipe wall and the flue gas is active along each section. The Darcy–Weisbach equation [49] is used to estimate the contributions of frictional pressure losses ( Δ p d i ) to the TPL from each section:
Δ p d i = s z ρ 2 d h Q i A i n 2 λ i
In this equation, d h is the hydraulic diameter of the pipe, which is equal to the diameter of a circular pipe; λ i is the Darcy–Weisbach friction coefficient [49] corresponding to the i th section, which in the case of turbulent flow is given as follows:
λ i = 0.0055 1 + 2 × 10 4 δ 2 r i n + 10 6 R e i 1 3
Additionally, laminar flow can be written as follows:
λ i = 64 R e i
Here, δ is the absolute roughness of the pipe, r i n is the inner radius of the injection pipe, A i n = π r i n 2 is the cross-sectional area of the pipe inlet, and R e i = ( 2 r i n ρ Q i ) / ( μ A i n ) is the Reynolds number for the i th section.
For Transport-3, the perforations drilled on the surface of the injection pipe were numerous enough to guarantee a smooth distribution of flow from the peripheral surface of the pipe. Note that this assumption does not necessarily result in a consistent outflow into the porous medium, as the outflow at each section depends on the local pressure difference between the inside and outside of the pipe, along with the permeability of the surrounding porous medium. Based on the Reynolds number, the flow regime in the porous media can be classified into laminar ( R e < 1 ), transitional ( 1 < R e < 10 ), and turbulent ( R e > 10 ) [47]. In the current configuration, the ratio of the flue gas injected into the tailings surrounding the injection pipe is in the laminar flow regime (viscous force dominated), and the inclusion of the Brinkman Equation becomes valid. The injection of exhaust into the porous medium through the section has been calculated by adapting Darcy’s law for radial coordinates in the following equation [50]:
Q i = p g i Δ p d i / 2 s z α
Here, α depends on the perforation arrangement applied to the injection pipe and its impact on the pressure profile through the pipe. When the impact of the perforations is negligible, the following equation can be applied:
α = μ 4 k 2 π ln r o u t d h
In this equation, p g i is the gauge pressure in the i th section that is iterated from the (1 + 1)D model to overcome the coupled TPL and IPL.
When the impact of the perforation arrangement of the injection pipe affects the pressure profile, α must be determined in one of two ways. The first method is to use the results from the 3D FE model as an input for the (1 + 1)D model, as shown in the following equation:
α = p L Q
where p is the pressure at the mid-perforation, which was obtained from the 3D FE simulations developed in Section 2.2.
The second method is to determine the value of p by correlating the value of a parameter, termed the m -factor, to different perforation arrangements. This method would enable the (1 + 1)D model to operate independently from the 3D FE model and is accomplished through the following process.
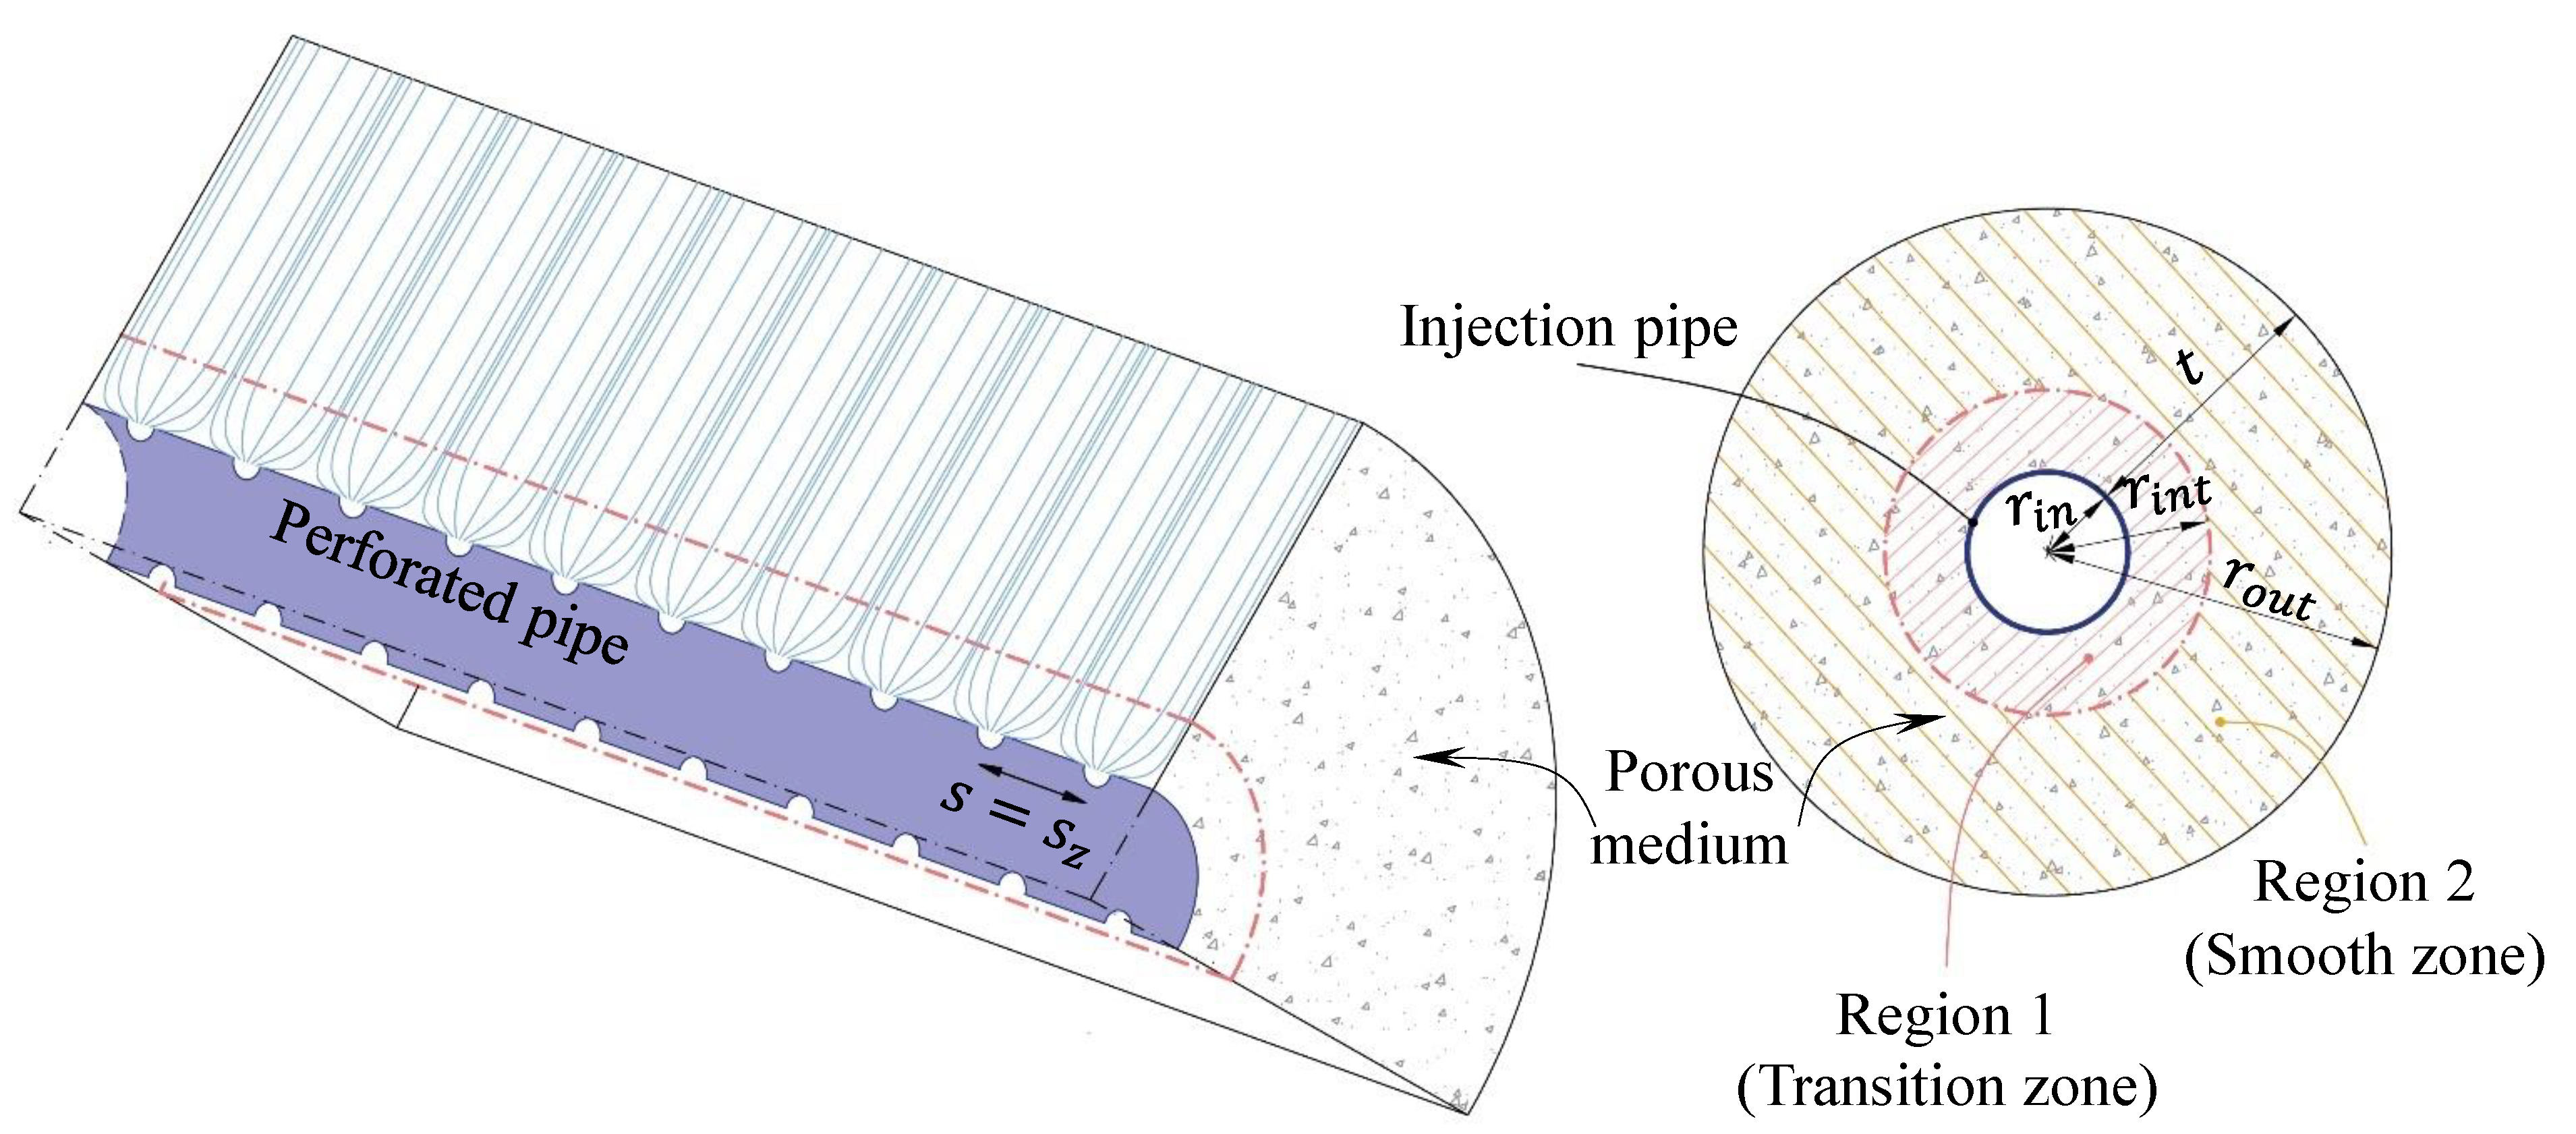
The perforation arrangement affects the pressure profile because it can cause non-uniform flow patterns as the gas first enters the porous medium (see Figure 6). This region (also denoted as Region 1 or the transition zone) extends to approximately ~ s / 2 within the porous domain for all perforation arrangements and corresponds to significant pressure drops following injection of the fluid into the tailings. Note that in this case, the center-to-center spacings are equal ( s z = s c = s ). Further within the porous domain, the flow is more uniform, and this is denoted as Region 2 or the smooth zone. The transition zone occupies the domain defined by r i n r r i n t ( = r i n + s / 2 ) , and the smooth zone occupies the region where r i n t r r o u t . The following representation of the radial velocity accounts for the abrupt change in the pressure profile of Region 1:
u r 1 r = Q 2 π r L + Q A p Q 2 π r L 1 r r i n s 2 m + m Q A p Q 2 π r i n t L r r i n s / 2 r r i n s / 2 1 ;               r i n r r i n t
For Region 2, it takes the following form:
u r ( 2 ) r = Q 2 π r L ;               r i n t r r o u t
In Equation (12), A p = π n c n z r p 2 is the total area of the perforations, n c is the number of perforations on the circumference of the pipe, n z is the number of perforations along the pipe direction, and r p is the radius of the perforations.
Equation (12) is a power function, and m ( m -factor) is a value that is dependent on the geometry of the perforations and the specific operating parameters. Equations (12) and (13) account for the continuity of flow variables ( p and u r ) and their derivatives at the interface of the two regions ( r = r i n t ). Here, the effect of the tangential and axial velocities (due to the presence of perforations) on the pressure loss in the porous medium is accounted for by only one velocity component, as represented in Equation (12). By substituting Equations (12) and (13) separately in Equation (5) and integrating with respect to the designated range of r , one can find a closed-form relation for pressure in regions 1 and 2, respectively. By solving Equation (5) for m and making it equal to the mid-perforation pressure obtained from the 3D FE solution for different perforation arrangements, one can correlate the value of m with other non-dimensional variables that describe the perforation arrangement and geometry of the design. Having made the m -factor an independent variable, it is introduced to the (1 + 1)D model as an input to describe the transport characteristics of the fluid into the porous domain from the perforated pipe.
Transport-2 and 3 can now be considered together as the processes are interrelated. Due to the momentum loss from the outflow through the perforations, pressure recovery (rise) occurs from one end of the perforation to the other. As the outflow contains the lower energy fluid from the boundary layer compared to the flow in the middle of the pipe, a pressure rise co-occurs with the friction effect [27]. The following equation [32] has been employed to iterate the pressure recovery ( Δ p r i ) for each pipe section:
Δ p r i = k i ρ v i 2 v i + 1 2
In this equation, k i is the momentum recovery factor that depends on the inflow and outflow velocities of the i th section (see Figure 5) and is iterated in each section by using the following equation [51]:
k i = α + χ v i 2 v i + 1 2 v i 2
The values of α and χ depend on the pipe length to the pipe diameter ratio and have been iterated for each section [51]. Finally, for the ( i + 1 ) th section, we have:
Q i + 1 = Q i Δ Q i
p g i + 1 = Δ p d i + Δ p r i

3. Results and Discussion

3.1. Validation of the Numerical Models

3.1.1. Experimental Results

Figure 7 shows the gauge pressures along the injection pipe for duplicate tests of air injection at three flow rates per sand sample. The results include the errors in the sensitivity of the pressure sensors and the flow controller. Measured gauge pressures were consistent with each other along the length of the pipe and were consistent between replicate experiments. The FS, having a lower permeability, recorded the highest gauge pressures, yielding average pressures of 227, 196 and 153 Pa for injection rates of 100, 85 and 70 LPM, respectively. The CS yielded pressures of 40, 37 and 33 Pa with respective injection rates of 120, 110 and 100 LPM.
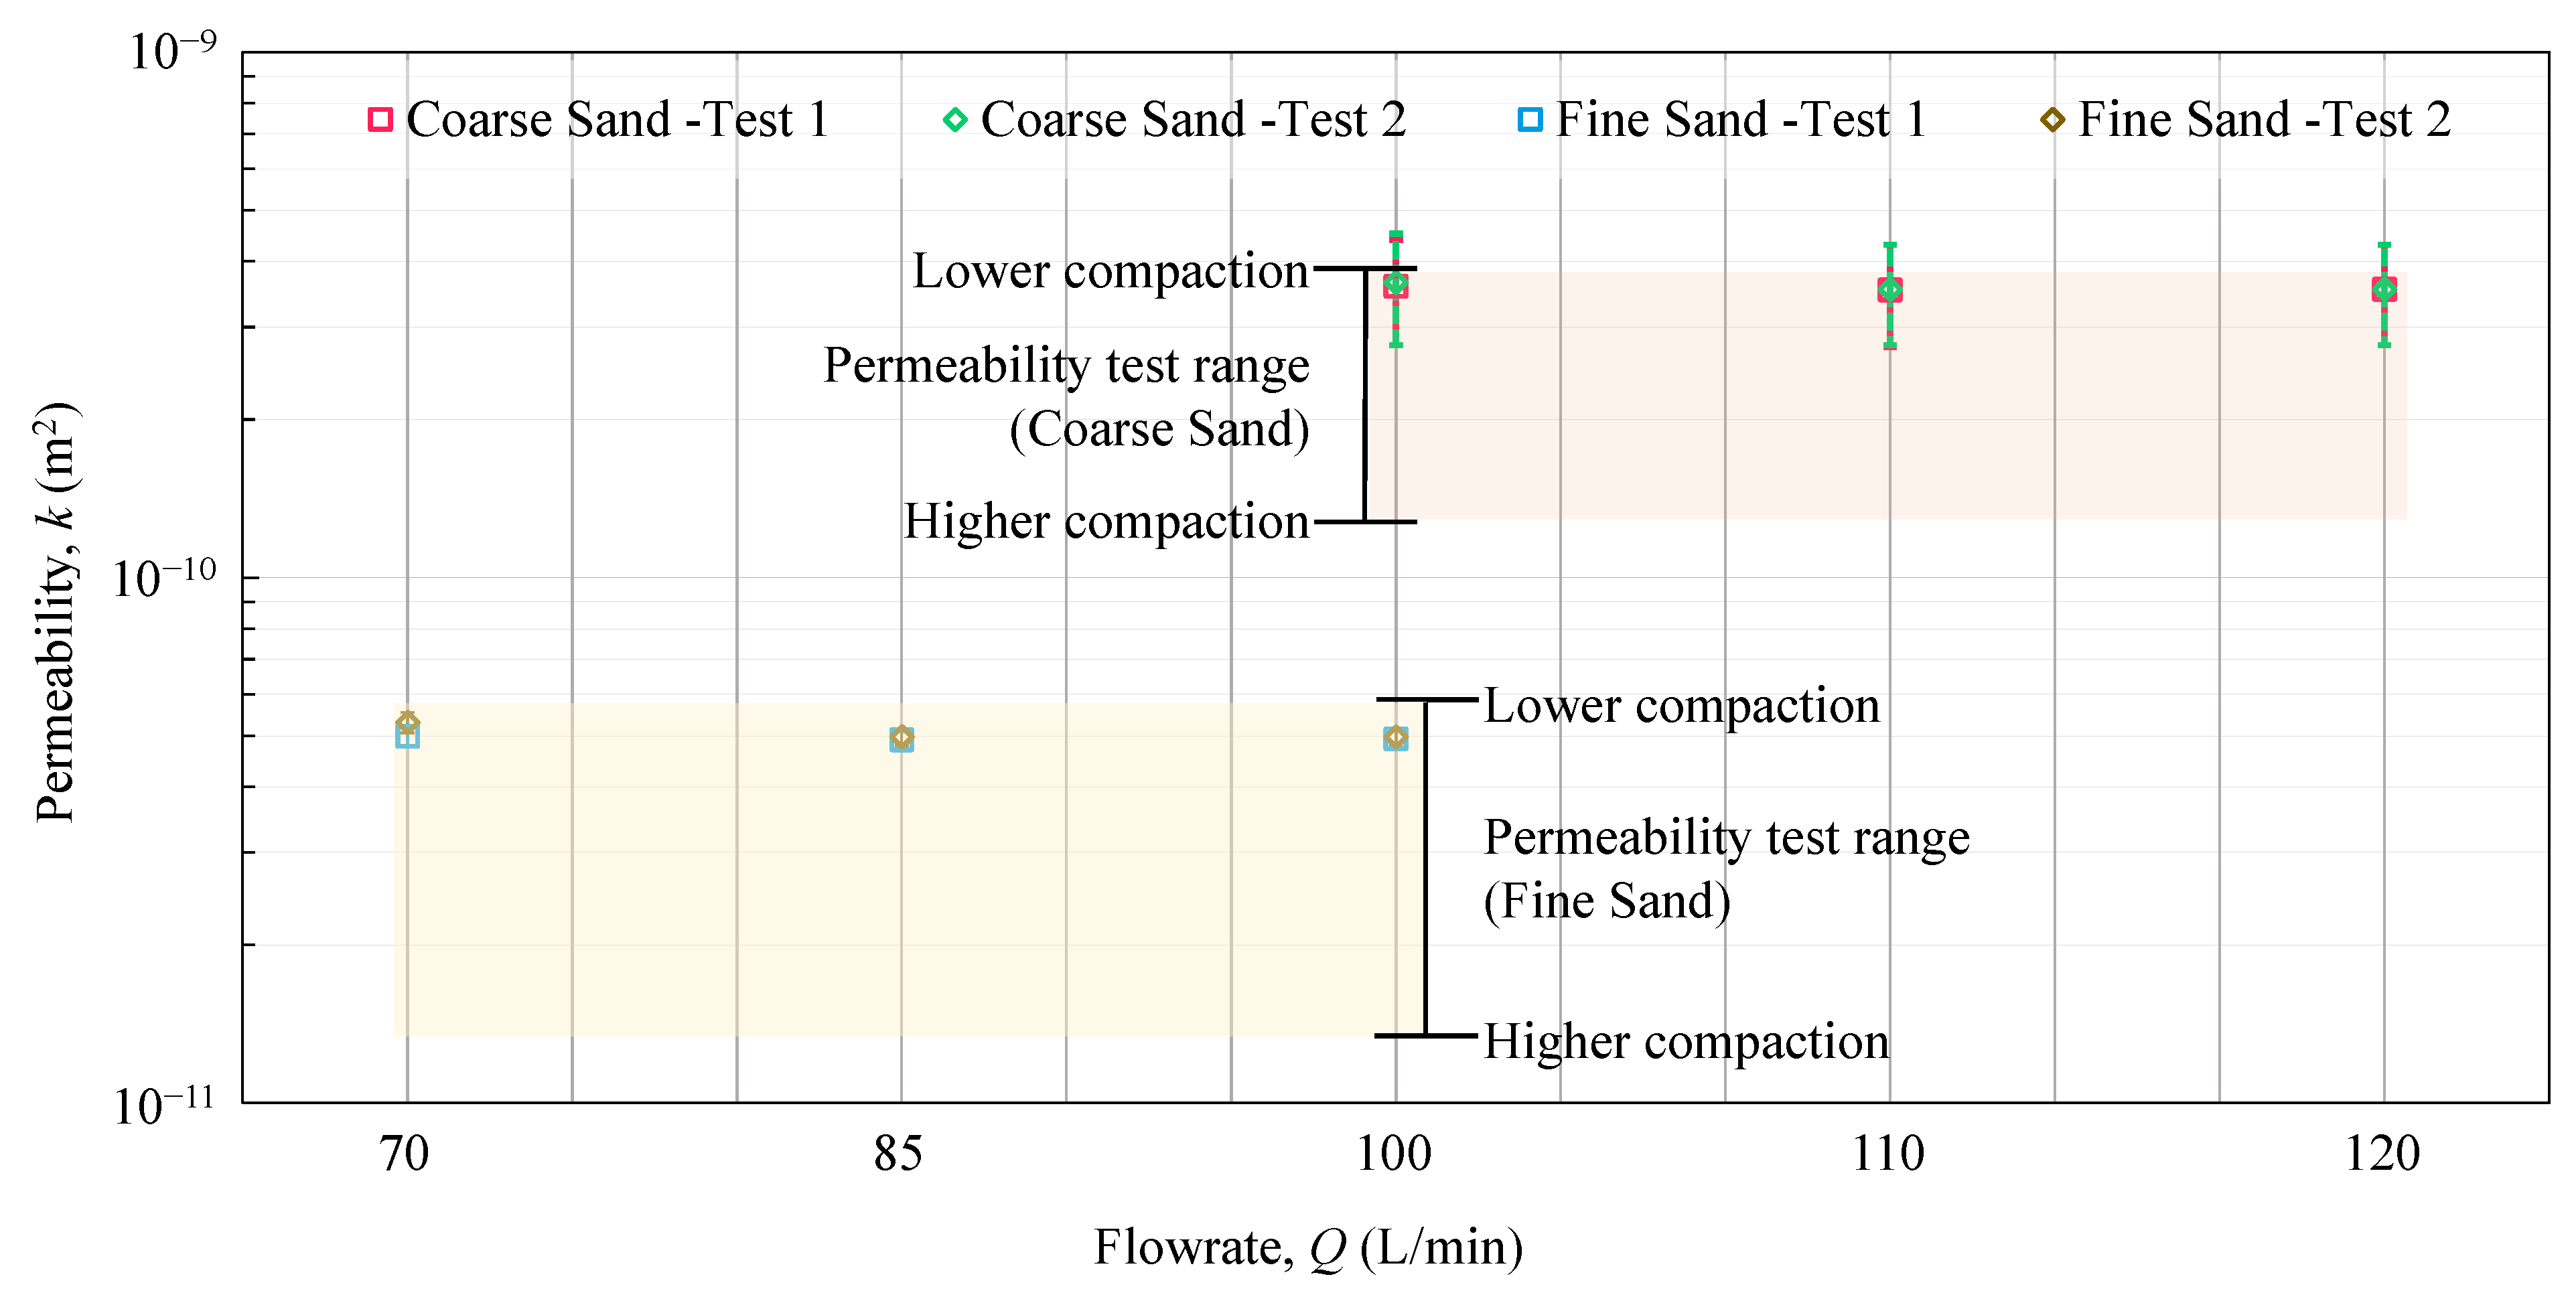
The measured permeabilities of the CS and FS at the physical conditions of the m-scale experiments were 3.2 × 10 10 m2 and 4.8 × 10 11 m2, respectively. Coarse-grained materials yield larger pores, which enable fluid transport compared to the small pore spaces of finer-grained materials. It was recognized that despite best efforts, the permeability of the sand within the m-scale apparatus would be heterogeneous and not accurately represented by the cm-scale permeameter measurement. The variability of the permeability of the sand at different degrees of compaction resulted in a range of permeability values, as shown in Figure 8. The CS’s permeability was as high as 3.8 × 10 10 m2 when loosely compacted and as low as 1.3 × 10 10 m2 when densely compacted. Likewise, the FS varied from 1.3 to 5.8 × 10 11 m2.

3.1.2. Comparison of the Experimental and Numerical Results

The experimental gauge pressure measurements along the pipe were compared with the results from the 3D FE and the (1 + 1)D model simulations using the sand’s permeability and injected flow rates (Figure 7). For all of the experiments, the results obtained from both the 3D and (1 + 1)D numerical models achieved an acceptable agreement with the experimental findings. Both models produced near identical gauge pressures that were uniform along the length of the injection pipe. The average difference between the experimental and numerical results was less than 6%, validating the developed numerical models for further use. However, a few individual experimental gauge pressure values at different points along the injection pipe were inconsistent with the modeling results (for example, see S2 in the FS at 100 LPM during test 1). This could be due to heterogeneous compaction, which promotes the potential for having a nonuniform permeability inside the cylinder, whereas the (1 + 1)D and 3D numerical models use a uniform permeability as the input.
To determine whether the variability in the sand’s permeability (permeability test range in Figure 8) could account for the individual sensors not matching the numerical model results, the pressure data from all sensors were used as an input for the (1 + 1)D model to back-calculate the permeability that would cause the observed gauge pressures. This process resulted in two permeability ranges, from the minimum to the maximum, from the eight sensor values for each test. Figure 8 shows the numerical model values compared to the ranges derived from the centimeter-scale permeameter tests.
The calculated permeability ranges derived from the numerical model for each flow rate are nearly identical for both the FS and CS. Furthermore, these ranges fit well within the measured permeability ranges for the FS. However, for each flow rate in the CS, the error bar on the calculated permeability ranges from the numerical model are slightly higher than the measured permeability range. However, the calculated permeability value itself is within the measured range. Therefore, the variability seen in the experimental results can be accounted for by the heterogeneity of the sand’s permeability. This validates the ability of the (1 + 1)D numerical model to estimate the outflow from an injection pipe into a porous medium.

3.2. Progression of the (1 + 1)D Reduced-Order Model

Having validated both the 3D FE and (1 + 1)D models, the aim was to make the (1 + 1)D model independent. The relationship between the perforation arrangement on the injection pipe and the pressure profile was determined from the 3D FE model and used to define the m -factor for the (1 + 1)D model. Using the 3D FE model, the relationship between the perforation arrangement and the m -factor was determined and analysed to understand which design parameters impact the m -factor. With the m -factor value related to design parameters, the (1 + 1)D model can be used independent of the 3D FE model. Note that for all 3D FE simulations, the center-to-center distances of the perforations were equal along the circumference and axial direction of the pipe ( s z = s c = s ).

3.2.1. Impact of Design Parameters on the m-Factor

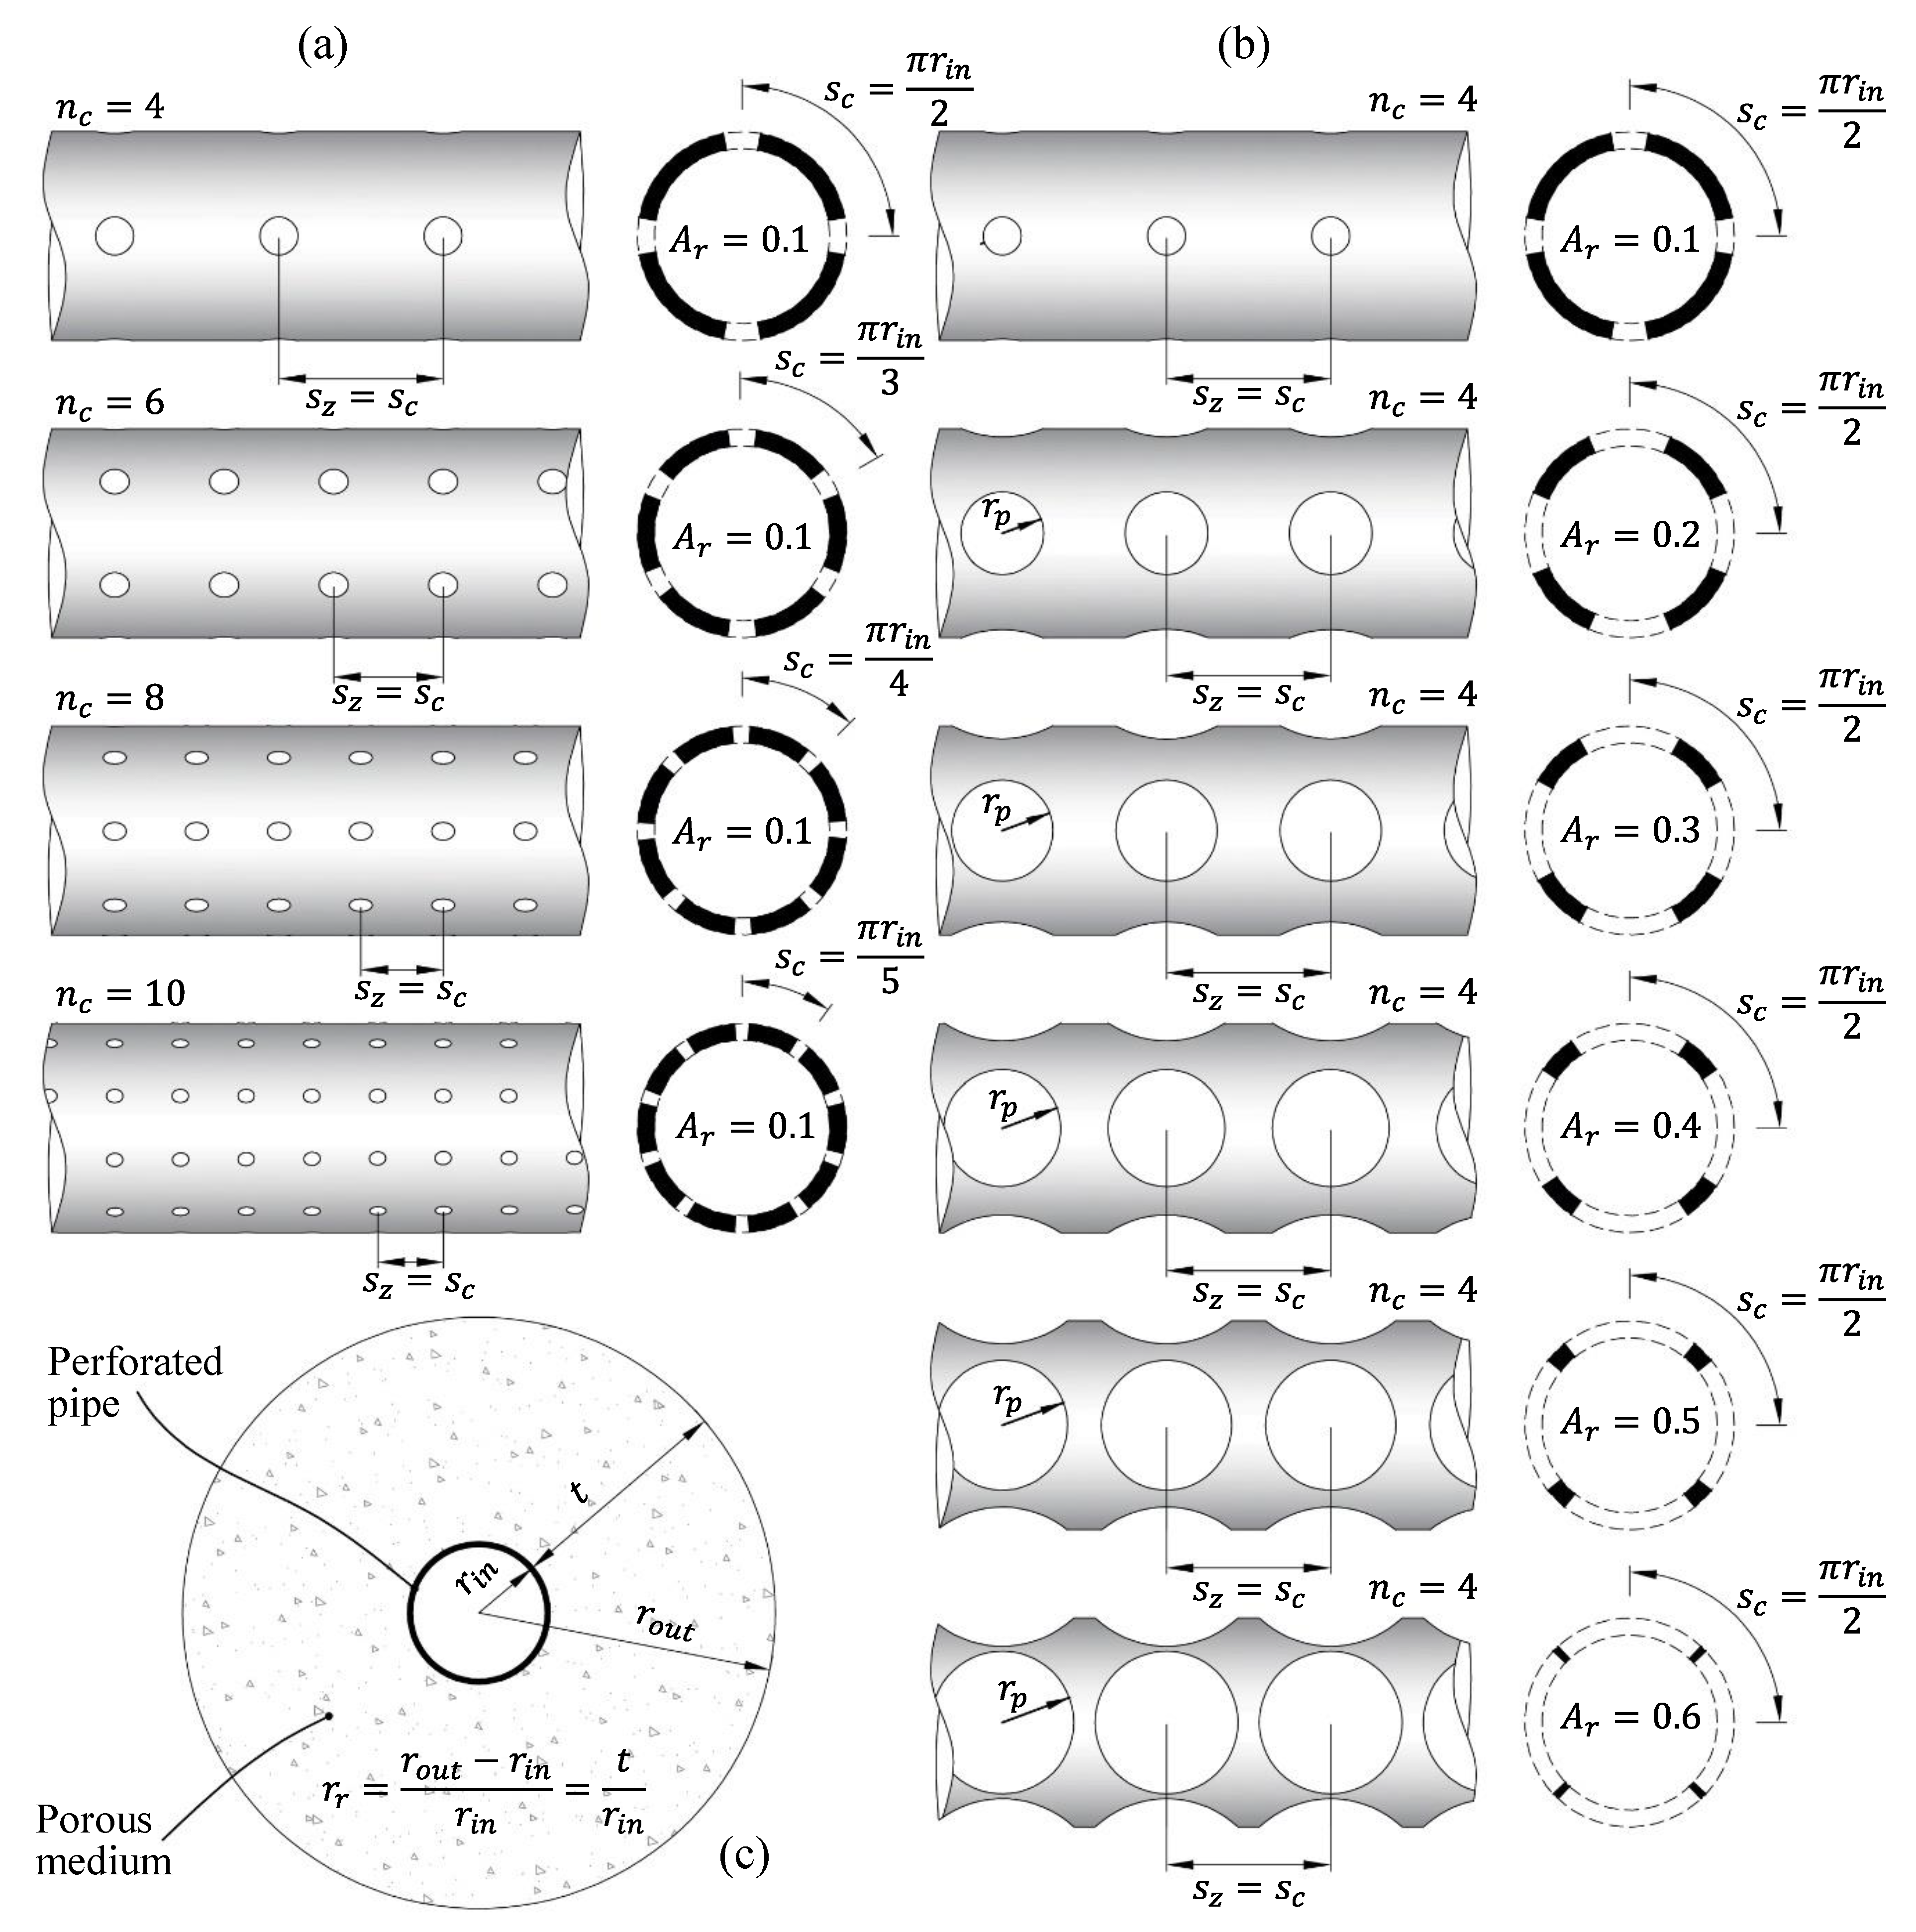
Five parameters were identified as potentially having a significant role in the value of the m -factor. The effects of these parameters on the value of the m -factor were studied by varying each while holding the others constant. A visual presentation of the cases studied in this paper is shown in Figure 9. These parameters, and the degree to which they varied, were as follows: the permeability ( k ; 10 9 10 12 m2), inlet flow rate ( Q ; 25–300 L/min), perforation arrangement (including the number of perforations: n c ; 4–10 or n z ; 44–110), the perforated area ratio of the pipe ( A r ; 10%–60%), and the ratio of the thickness of the porous domain to the injection pipe diameter ( r r ; 1–30).
.
Note that when the perforation density increased while the total perforated area was kept the same, the size of the perforation ( r p ) was reduced. The parameter range was chosen based on typical tailings permeabilities, physical constraints from the size of the system, and by considering what was physically possible. The default values for each parameter were chosen such that the permeability was equal to 4.8 × 10 11 m2, the inlet flow rate was 100 L/min, the perforation arrangement had 4 perforations around the circumference ( n c = 4 ) and 44 perforations along the axial length of the pipe ( n z = 44 ), the radius of the perforations resulted in 30% of the pipe surface being perforated ( A r = 0.3 ), and the ratio of the porous domain thickness to the injection pipe diameter was five ( r r = 5 ).
Figure 10 shows the results from the 3D FE model for the required m -factor to be used as an input for the (1 + 1)D model. The m -factor was found unaffected by the change in the permeability of the porous media or by the change in the inlet flow rate when larger than 50 L/min. Cases above 50 L/min were related to transitional and turbulent flow regimes through the pipe, with Reynold’s numbers larger than 2000 and 4000, respectively. The results showed a slightly higher m -factor for the lower flow rate of 25 L/min where the transition zone is in the laminar pipe flow regime. However, the impact of the pipe flow regime on the variance of the m -factor was overall negligible.
The m -factor was affected by changes in the perforation arrangement, perforation area, and thickness of the porous domain. The trend for the perforation arrangement and the porous domain thickness was that the m -factor decreased as each of these parameters increased. For the perforated area, the m -factor reaches a maximum value of 20% and gradually decreases as the perforation ratio of the pipe increases further. Values below 20% result in m -factors only slightly lower than the local maximum.

3.2.2. Establishing Dimensionless Correlations between Design Parameters and m-Factor

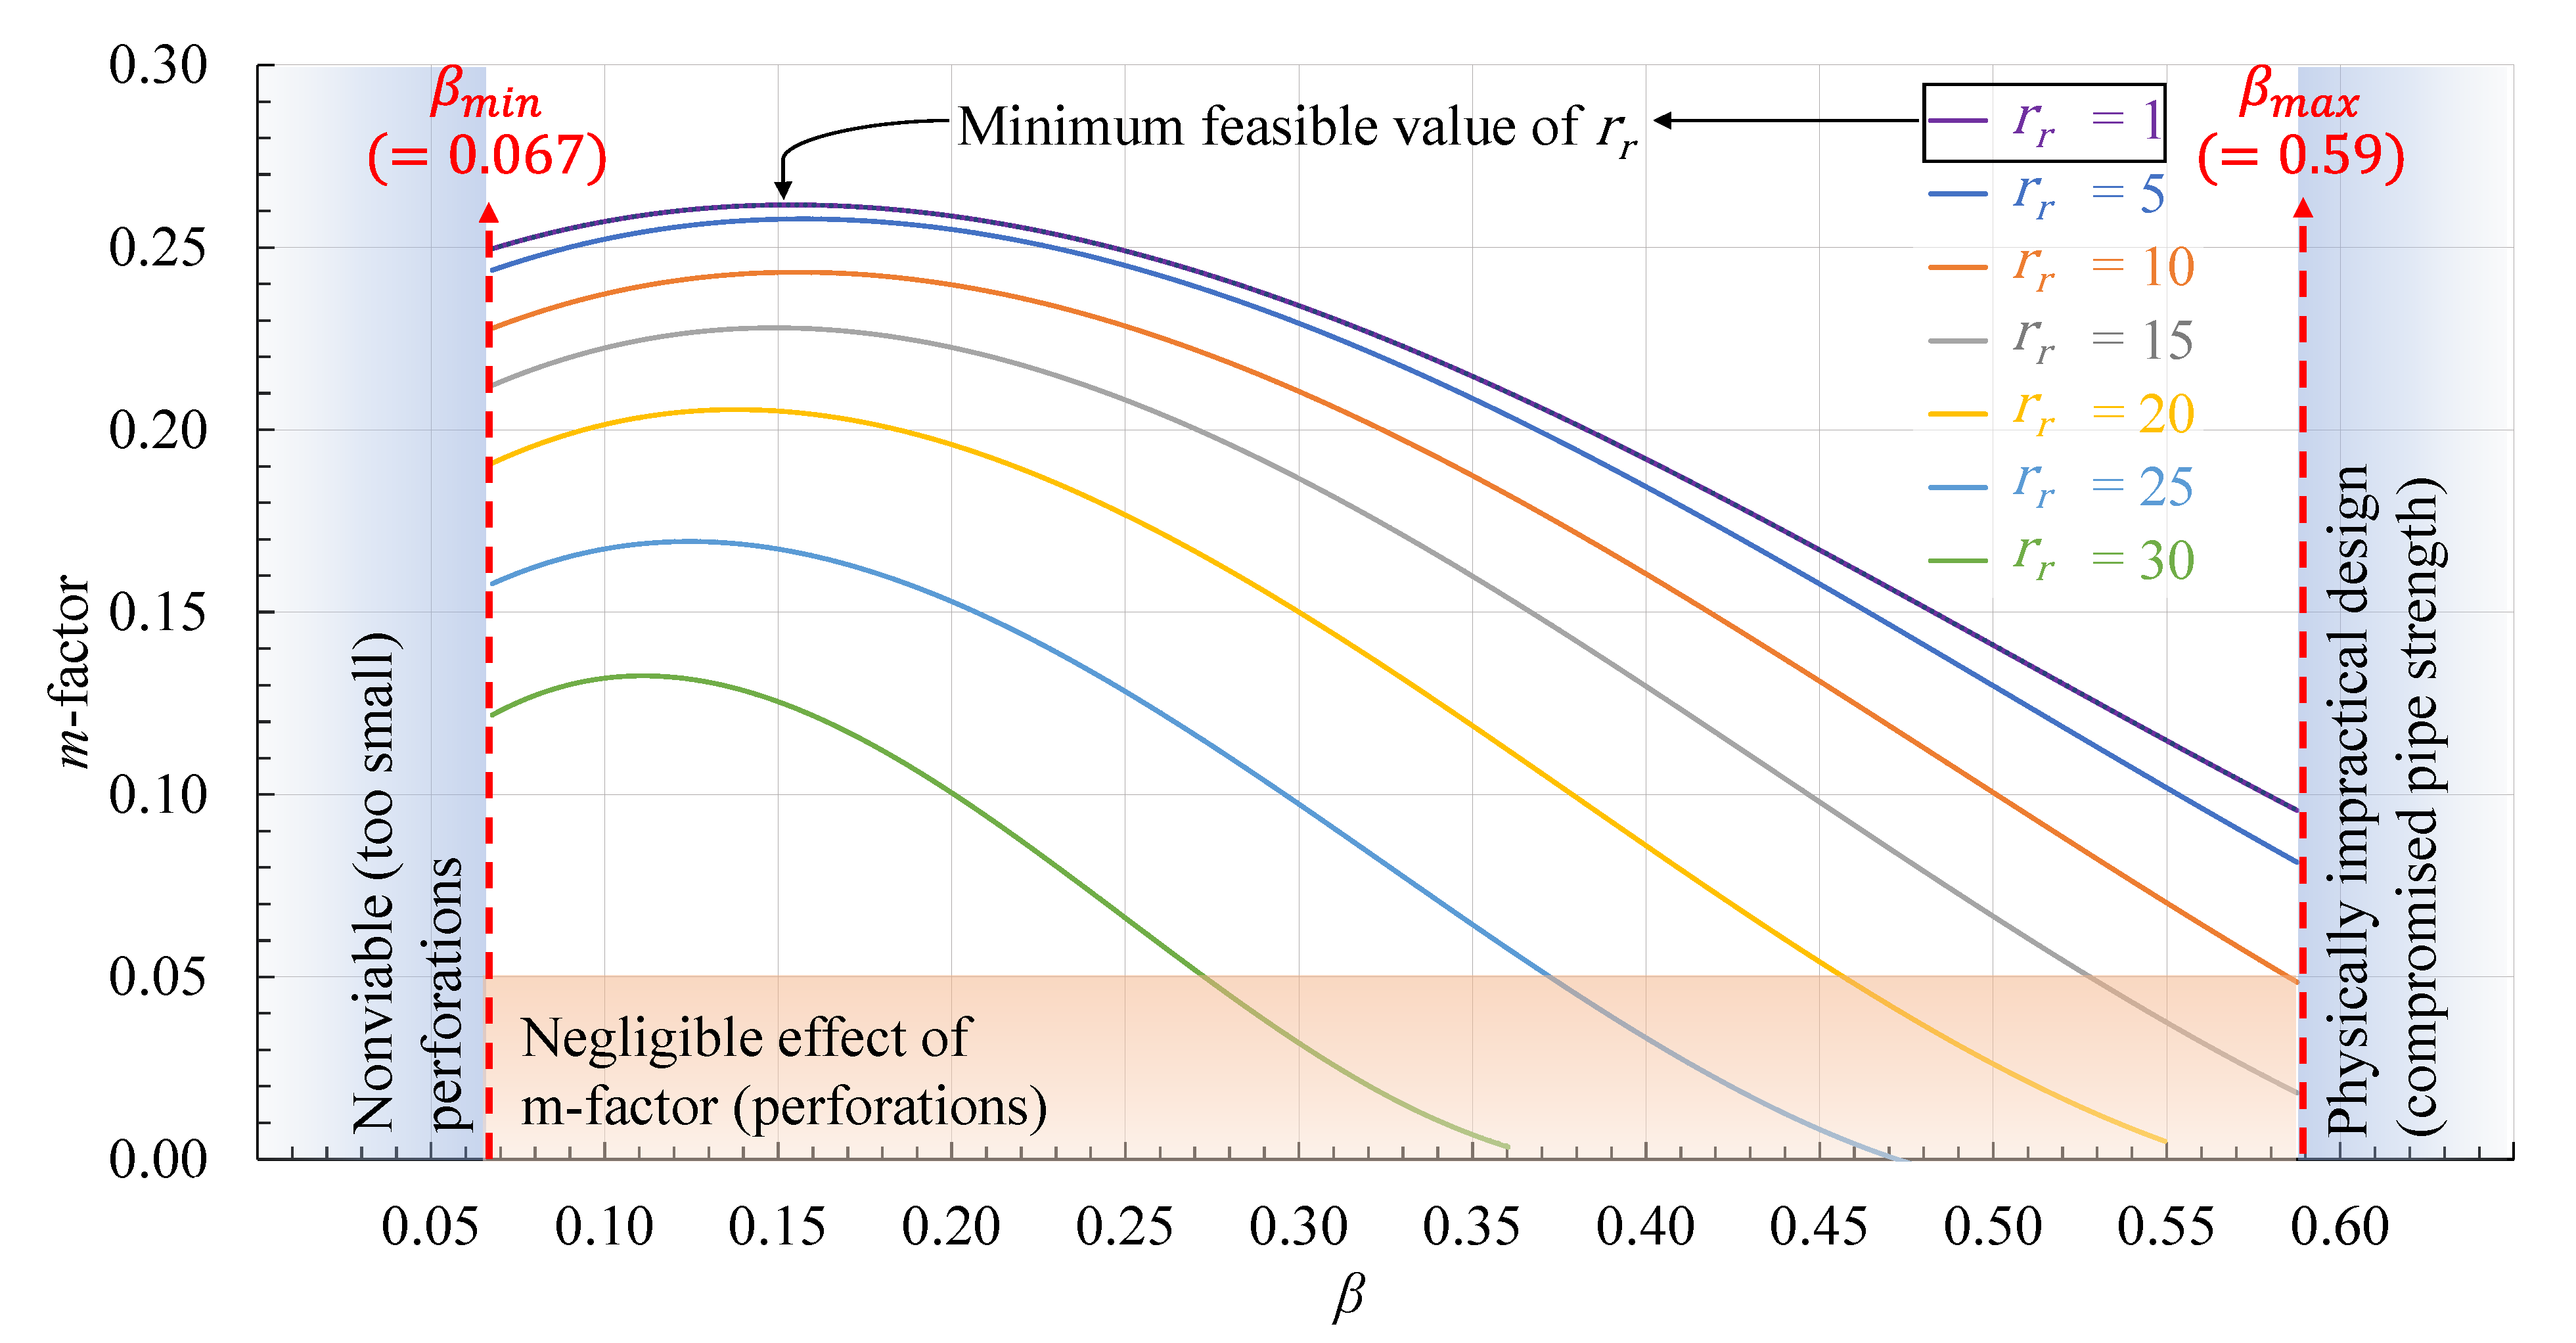
From the 3D FE simulations, the value of the m -factor was found to be dependent on the perforation arrangement of the injection pipe [ s , and ( n c or n z )], the ratio of the perforated area to the total surface area of the pipe ( A r ), and the ratio of the porous domain to the size of the injection pipe ( r r ). To independently relate the m -factor value to the design parameters, two of these variables were combined into a dimensionless number, β , the ratio of the total perforated area ( A p ) to the area of the cylindrical surface confining the transition zone ( β = A p / 2 π r i n t L ). The m -factor was then correlated with β and r r using the 3D FE model. To do so, four different perforation schemes were used: [ n c = 4 (or n z = 44 ), n c = 6 (or n z = 66 ), n c = 8 (or n z = 88 ), and n c = 10 (or n z = 110 )]. For each of these arrangements, different perforation ratios ( A r = 0.1 , 0.2 , 0.6 ) and porous domain thicknesses ( r r = 1 , 5 , 10 , 15 , 30 ) were considered. In total, one hundred sixty-eight design scenarios were used with various values for β and r r . The 3D Fe model was adapted for each of those scenarios. For every value of r r , twenty-four values of m -factor were plotted against the associated values of β . To approximate a smooth curve through all the values of m -factor at a specific value of r r , the B-Spline interpolation of β versus the m -factor was conducted. For different porous domain thicknesses, the values of m-factor against β are shown in Figure 11.
These results indicate that for all values of β greater than 0.15, the m -factor decreases with an increase in r r . For values less than 0.15, the m -factor only decreases slightly. This means that with an increase in the size of the porous domain compared to the injection pipe diameter, the impact of the perforations on the pressure profile diminishes as the value of m goes to zero. For all values of r r , the maximum m -factor value occurs when β is between 0.1 and 0.2. Necessary boundary conditions have been added from the input parameters to Figure 11 based on what is physically and economically feasible ( r r min = 1; β m i n = 0.067 and β m a x = 0.59 ). The effect of the m -factor on the pressure profile of an injection pipe becomes negligible for values less than 0.05. This implies that in the lower bound of the graph, the velocity of the flow in the entire porous domain is analogous to the velocity profile represented by Equation (13). Using this graph to determine the m -factor as an input for the (1 + 1)D ROM decouples this model from the 3D FE model, thereby saving significant computational resources and time.

3.3. Evaluation of the (1 + 1)D Model’s Performance

Having made the (1 + 1)D model independent from establishing the relationship between the m -factor and the porous domain thickness and perforation arrangement, the performance of the (1 + 1)D model was compared with the results obtained from the 3D FE model. For this analysis, three parameters were selected upon which to evaluate the model results: the pressure at the injection pipe inlet ( p i n ), the pressure throughout the injection pipe, and the outflow distribution throughout the injection pipe.

3.3.1. Inlet Pressure

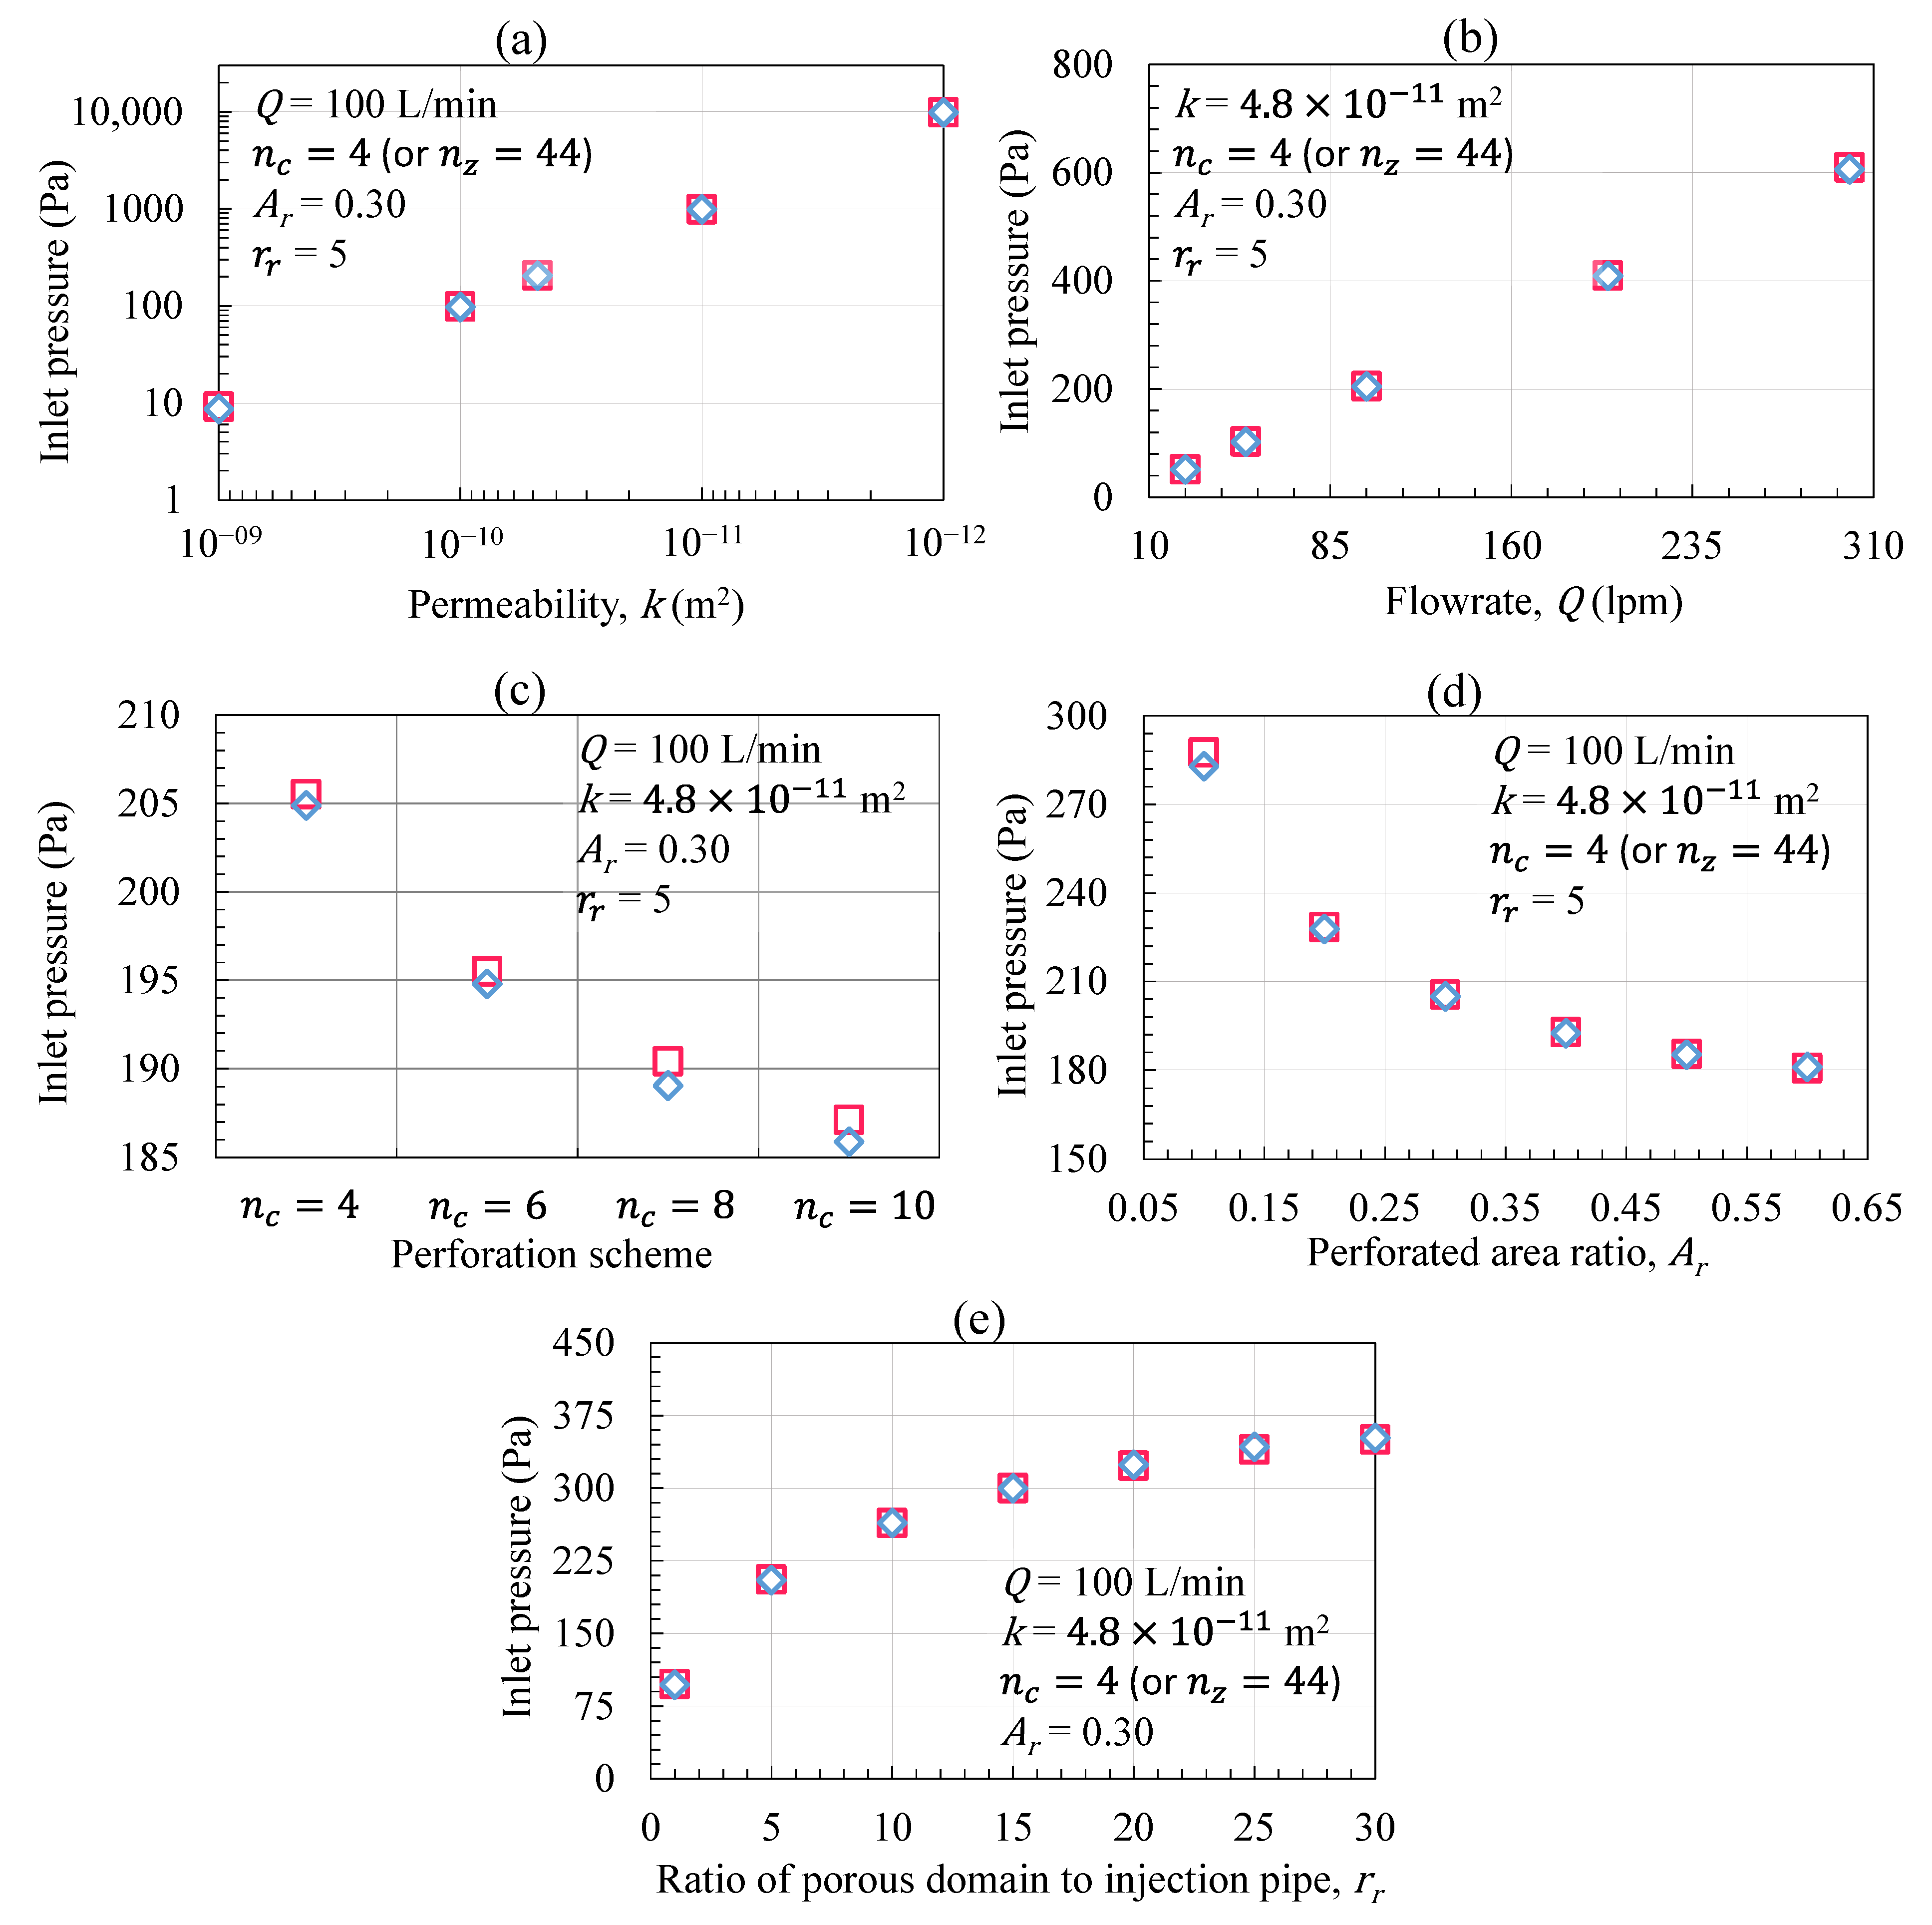
The pressure at the inlet of the injection pipe is a critical parameter that will be used to determine the power and energy requirements to inject the gas, which will impact the capital cost required for the pressurization equipment. Again, the permeability, inlet flow rate, perforation arrangements, perforated area of the pipe, and the ratio of the porous domain thickness to the injection pipe diameter, were all varied in the analyses. Figure 12 shows the inlet pressures obtained from the (1 + 1)D ROM and 3D FE numerical models.
For each case, the inlet pressure estimated by the (1 + 1)D model is nearly identical to the results of the 3D FE model but requires significantly less time and resources. The most variability occurs when the perforation density is changed; however, the difference is still minor. The inlet pressure increases with lower permeabilities, higher injection rates and greater porous domain thicknesses. Permeability exerts a linear control on the injection pressure and has the largest impact relative to other factors. Likewise, the injection rate increases linearly with the injection pressure, while for the porous domain thickness, the injection pressure levels off as the porous domain size increases. Additionally, the inlet pressure decreases as the perforation density and perforation area increase. Both these factors appear to reach an asymptote implying the largest impact is seen within the investigated parameter range.

3.3.2. Pressure Profile throughout the Injection Pipe

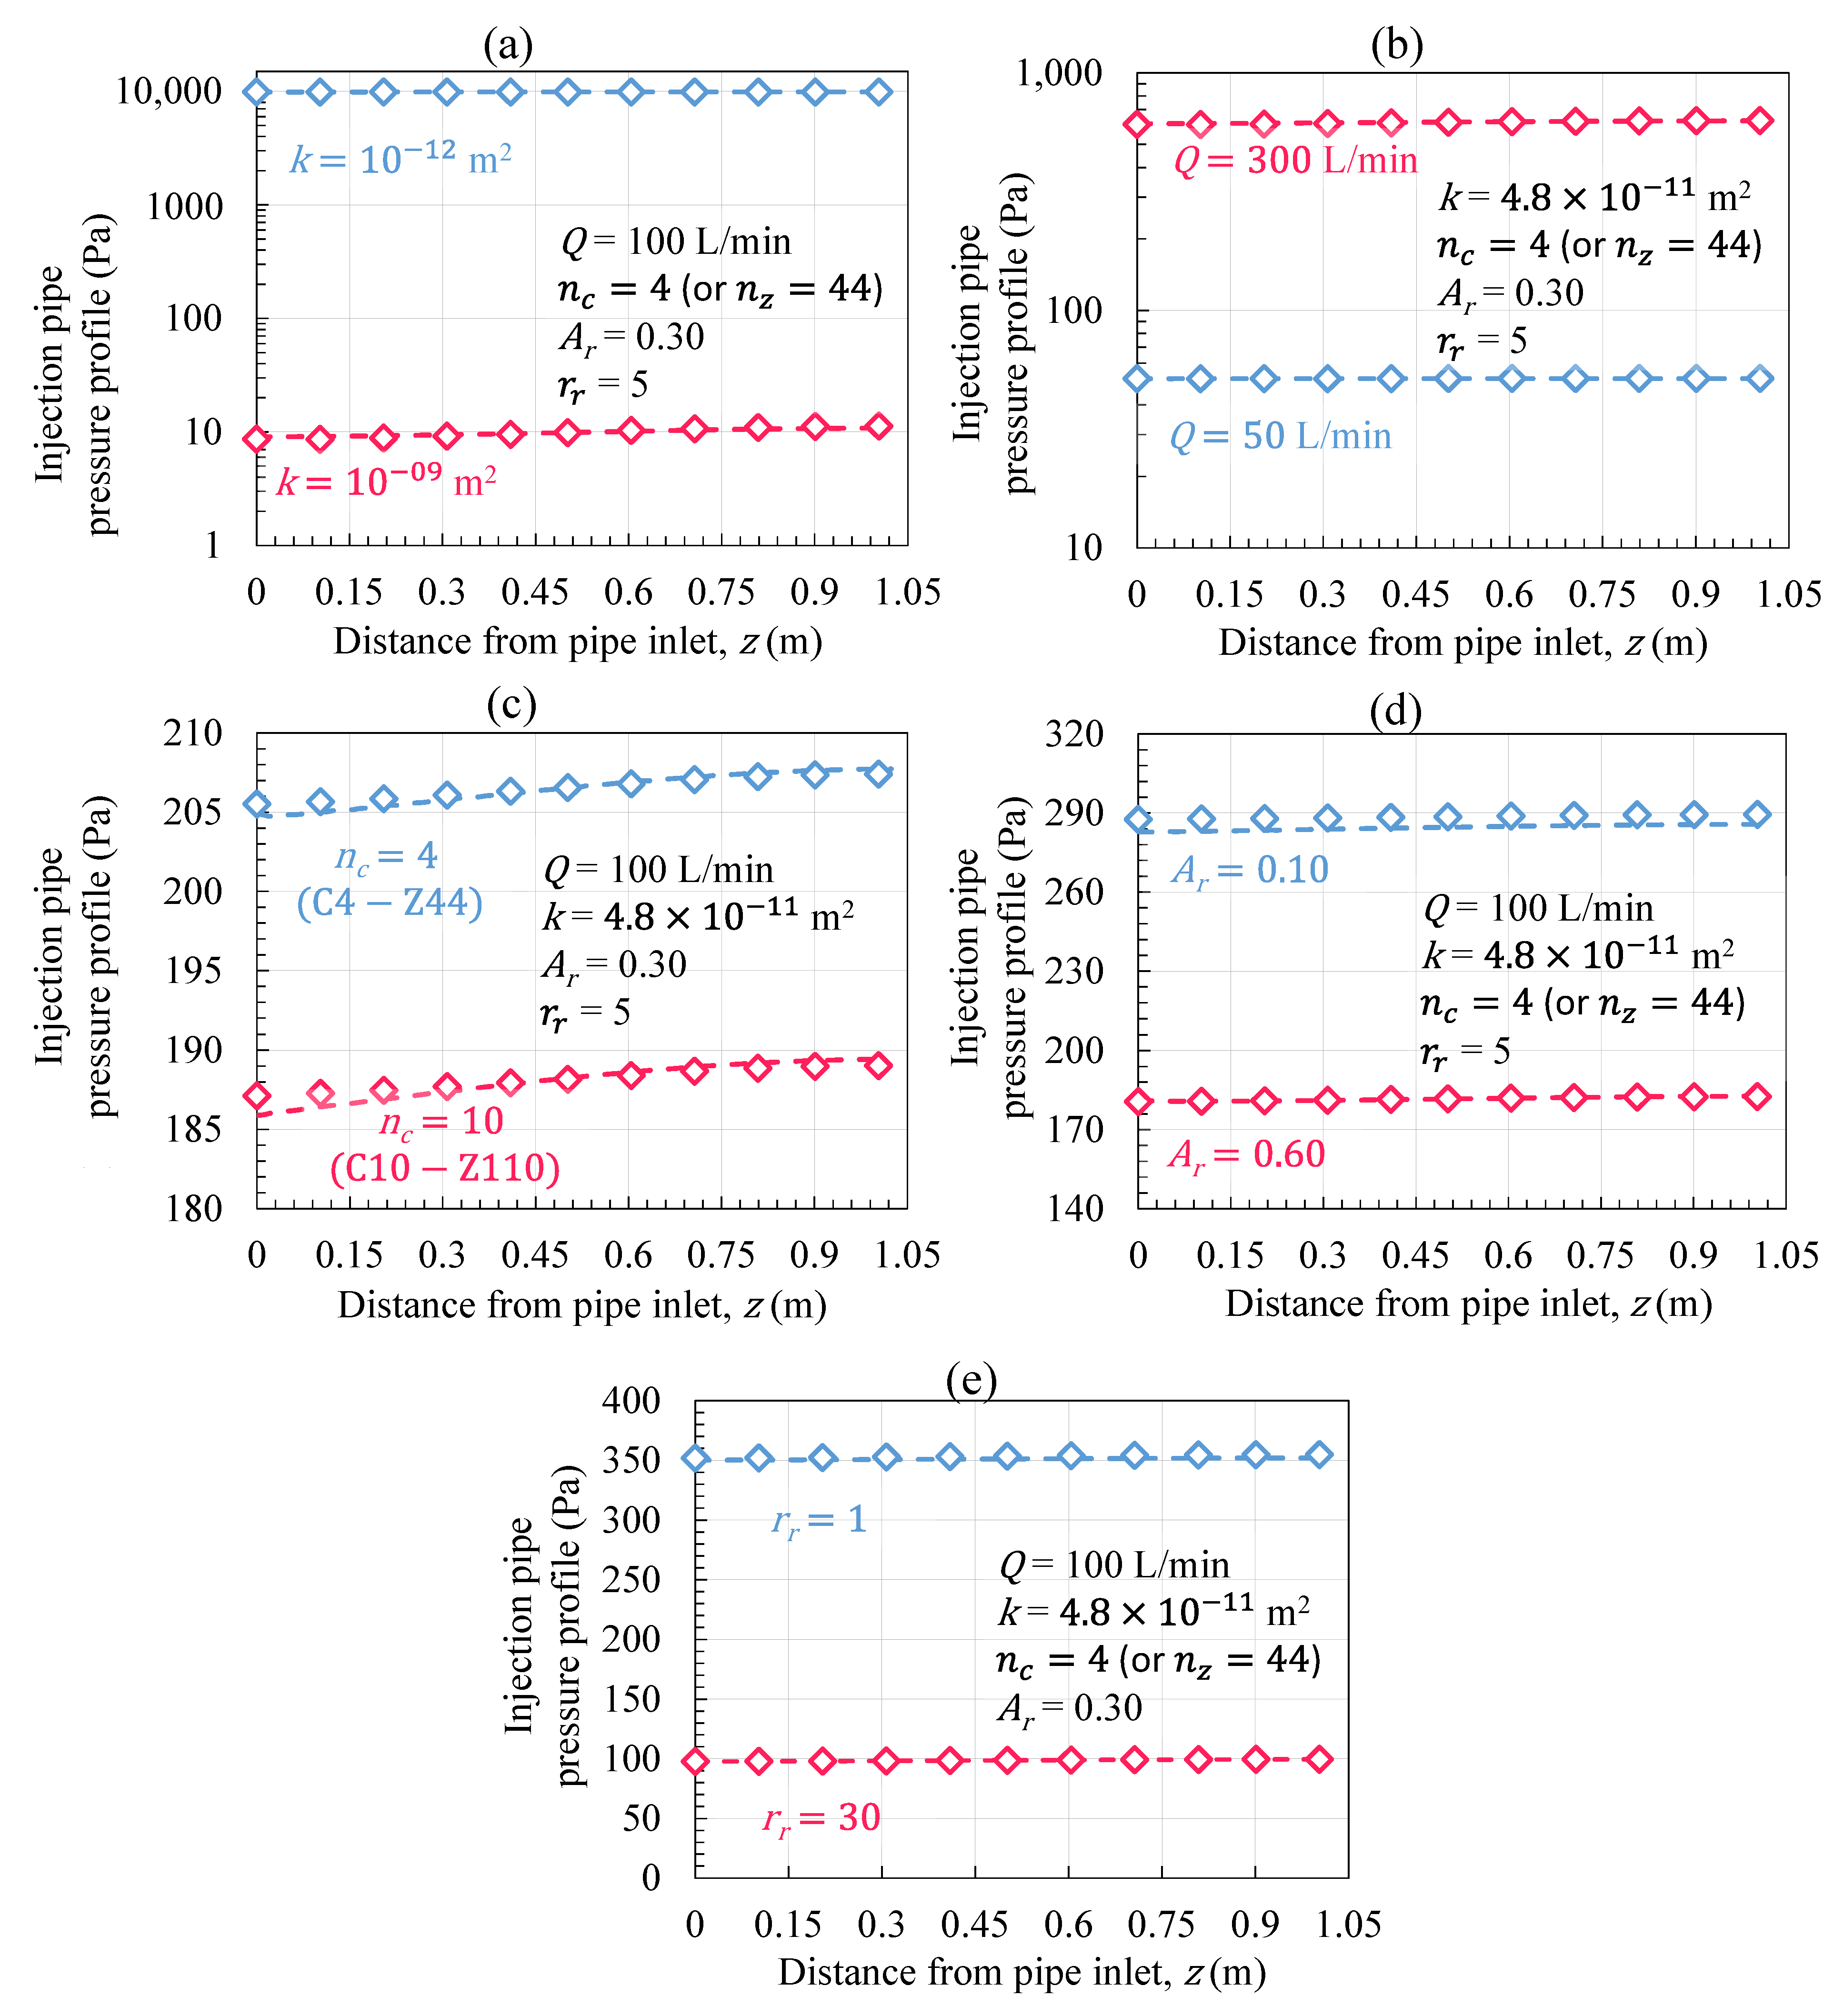
The (1 + 1)D model can estimate the pressure along the injection pipe by considering the concurrent effects of friction, momentum recovery, and the injection of gas through the perforations. The profile of the flue gas pressure is crucial for an optimum design to ensure uniform exposure of the porous medium to CO2. A comparison is made between the pressure profile along the pipe obtained from the (1 + 1)D model and the 3D FE results in Figure 13. For this analysis, for each parameter, a minimum and maximum value were analysed. The results for the pressure profile obtained from the (1 + 1)D model are in excellent agreement with the 3D FE results for every case. The pressure distribution through the pipe is largely consistent regardless of the permeability, injection rate and porous domain thickness. With increases in the perforation density and area, the pressure becomes higher the further from the injection point.

3.3.3. Outflow Distribution

A uniform outflow from the injection pipe allows for carbon sequestration to occur throughout the entire tailings block in a consistent manner. The outflow for the same design parameters as the pressure profile cases were analysed. The length of the pipe was discretized into sections. For each section, the outflow was calculated (using Equation (9)) and shown as a relative value compared to the average outflow over the length of the pipe (Figure 14).
Ideally, the outflow should remain ~1 throughout the length of the pipe to ensure a homogeneous outflow distribution. The outflow was found to be almost constant throughout the length of the pipe for most of the cases examined in this section. A slight trend can be observed for the highest and lowest permeability values where the outflow increases along the length of the pipe. Additionally, the 3D and (1 + 1)D model results differ the most here, but by less than 5%.

3.4. Application of the (1 + 1)D to an Optimal Design

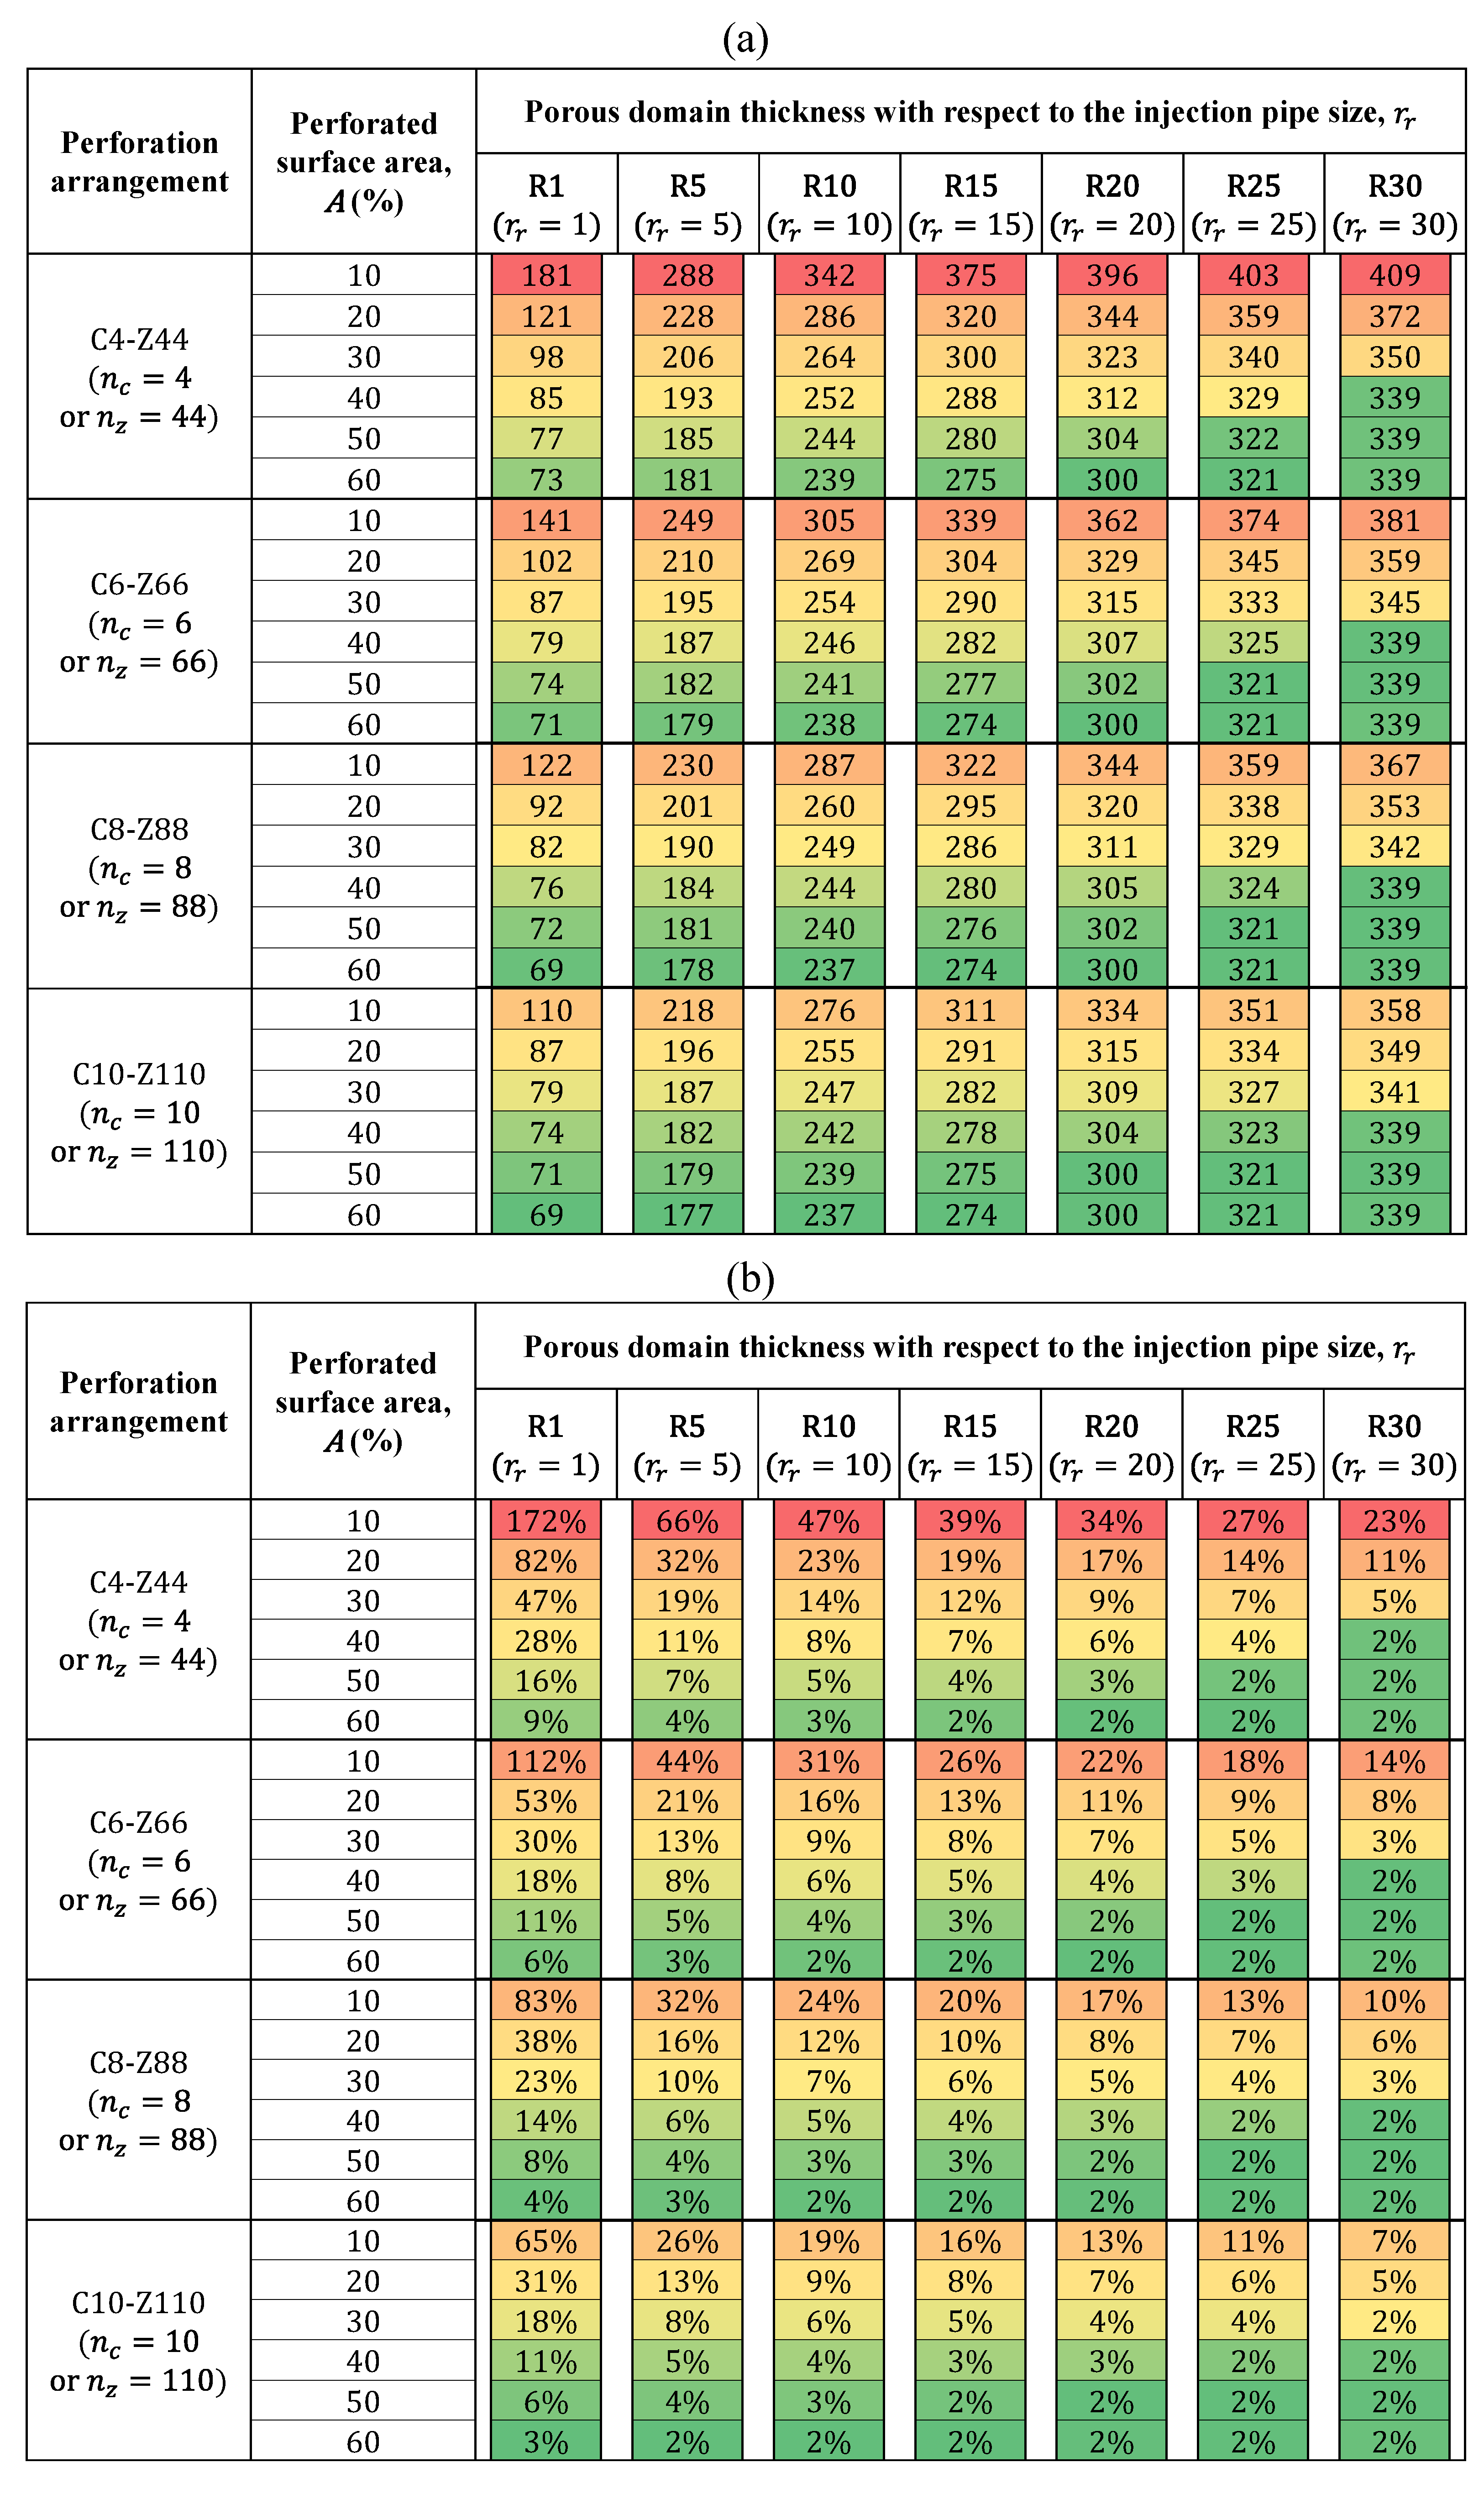
Having shown that the (1 + 1)D and 3D model results match for the inlet pressure, the pressure profile, and the outflow distribution, the developed (1 + 1)D model is therefore reliable and can be applied to the selection of an optimal design. The ultimate objective of this study was to optimize the pressure profile within the embedded perforated pipes to homogeneously supply flue gas for the carbon to be sequestered by carbonate mineral formation in the tailings. An optimum energy design requires an optimum pressure design. The results for the pressure at the pipe inlet from the 168 design scenarios were tabulated in the form of a heat map, as shown in Figure 15a. As a reminder, the injection flow rate was 100 LPM, and the permeability of the porous medium was 4.8 × 10⁻¹¹ m2. Using the model, a similar heat map could be produced for different injection rates or permeabilities.
From the heat map, we can observe that for any perforation arrangement with a certain perforation ratio, the inlet pressure keeps increasing as the porous domain thickness increases. In other words, higher pressures are required for injection into larger porous domains. On the other hand, the inlet pressure starts to decrease with an increase in the perforation surface area for a certain perforation arrangement. For example, the inlet pressure for the case with a 20% perforation area designated as C6-Z66-A20-R1 is 102 Pa. This value drops by 28% to 74 Pa when the perforation area is increased to 50%. Additionally, with the same perforation area, the inlet pressure is lower for denser perforation arrangements. For instance, the inlet pressure for the case designated as C4-Z44-A40-R5 is 193 Pa and decreases by 6% to 182 Pa when a denser perforation arrangement of C10-Z110-A40-R5 is applied. However, it is important to note that these effects are relatively smaller for higher values of A and r r . From a design perspective seeking to reduce the injection pressure and cost, the major controls are to be found in minimizing the porous domain size and maximizing the perforation area. Additionally, a denser perforation arrangement may have a minor effect on reducing the injection pressures further.
The perforation arrangement has a significant effect on the pressure profile and energy requirements of the injection operation. Figure 15b provides the heat map for the difference in the inlet pressure calculation that occurs when the effect of perforations determined by the m -factor was included or excluded. This figure shows when the m -factor must be included for the modeling results to be reliable in calculating the pressure profile of the perforated injection pipes. The inlet pressure difference decreases as the porous domain thickness, perforated surface area, and perforation arrangement density all increase. For example, in the case of the C6-Z66-A20-R10 configuration, the exclusion of the impact of the perforation could lead to a 16% error (under-designed) in the inlet pressure calculation. This error decreases to 9% when the porous domain thickness increases by two and a half times in the C6-Z66-A20-R25 configuration. With a denser perforation scheme such as C6-Z66-A60-R10 or C8-Z88-A40-R25 configuration, this error reduces to 2%. By using both the heat maps in Figure 15a,b, when the inclusion of the m -factor is needed can be determined, and the required injection pressure can be minimized, guiding toward a cost-effective and efficient design.

4. Conclusions

  • The large-scale implementation of CO2 injection into mine tailings for carbon sequestration requires an accurate understanding of the fluid flow to design the operation economically.
  • A 3D FE model and a (1 + 1)D ROM were developed in this study to assess injection pressures and gas outflow. An experimental investigation was conducted, and the experimental and analytical results were compared to establish the validity of the models. Upon this validation, the effort was made to develop the (1 + 1)D model as it required significantly less computational resources and time than the 3D FE model.
  • A variable called the m-factor was introduced, and its values were calculated for a wide range of feasible operating and design parameters to correlate the impact of the perforation arrangement on the pressure profile.
  • The (1 + 1)D model was compared with the 3D FE model and was found to perform consistently well in estimating the behavior of the gauge pressure through the perforated pipe, the pressure at the pipe inlet, and the outflow through the perforations into the surrounding porous tailings.
  • Validation of the model with the experimental and FE results established its viability for use in large-scale injection designs. Finally, the developed (1 + 1)D ROM was employed to establish a framework for constructing optimum design cases from an energy and pressure perspective.
  • Future work will focus on developing a cost model for optimal design scenarios selected from the (1 + 1)D model results. Optimal designs require the injection pressures and necessary power requirements to be minimized. The authors are also assessing other operating parameters that will impact the practical and economic feasibility of the proposed system.

Supplementary Materials

The following supporting information can be downloaded at: https://www.mdpi.com/article/10.3390/min13070855/s1. Figure S1: (a) Particle size analysis of the CS, (b) Cumulative distribution (%), and (c) distribution density of the FS used in the experiment.; Table S1: Summary results of different tests conducted to measure the sand permeability at various conditions.

Author Contributions

Conceptualization, S.A.G.-M. and G.D.; methodology, S.A.G.-M., D.B., P.S. and G.D.; software, D.B. and P.S.; validation, D.B., P.S., E.W. and S.A.G.-M.; formal analysis, D.B., P.S. and S.A.G.-M.; investigation, D.B. and E.W.; resources, S.A.G.-M. and G.D.; data curation, D.B.; writing—original draft preparation, D.B.; writing—review and editing, E.W., P.S., S.A.G.-M. and G.D.; visualization, D.B. and P.S.; supervision, S.A.G.-M. and G.D.; project administration, S.A.G.-M. and G.D.; funding acquisition, S.A.G.-M. and G.D. All authors have read and agreed to the published version of the manuscript.

Funding

This research was funded by the De Beers Group through the CarbonVault Program with matching funds from Natural Resources Canada (Clean Growth Program, grant number CGP-17-0739).

Data Availability Statement

Not applicable.

Conflicts of Interest

The authors declare no conflict of interest.

Nomenclature

CFDComputational fluid dynamics
CSCoarse Sand
DDimensional
FEFinite element
FSFine Sand
IPLInjection pressure loss
PSDParticle size distribution
ROMReduced-order model
SSensor
TPLTransportation pressure loss
TSFTailings storage facility
A Area (m2)
A r Perforated area ratio of the pipe
c F Forchheimer coefficient
k Permeability (m2)
L Length of the injection pipe (m)
z Distance from pipe inlet (m)
p Pressure (Pa)
p o Ambient pressure (Pa)
Q Volumetric flow rate (m3/s)
r Radius (m)
R e Reynolds number
r i n Pipe inlet radius (m)
r p Perforation radius (m)
r r The ratio of the porous domain thickness to the injection pipe diameter
s Pitch (m)
δ Pipe roughness (m)
Δ p Pressure drops or change (Pa)
Δ Q Change of volumetric flow rate (m3/s)
ρ Density (kg/m3)
λ Darcy–Weisbach friction coefficient
μ Dynamic viscosity (Pa·s)
p Mid-perforation pressure (Pa)
m measured
e Error
g Gauge
h Hydraulic
i Index
r Recovery
d Drop
c Circumference
z Axial direction
i n Inlet

References

  1. Royer, J. Status of Remote/Off-Grid Communities in Canada; Natural Resources Canada: Ottawa, ON, Canada, 2013.
  2. Baidya, D.; de Brito, M.A.R.; Sasmito, A.P.; Scoble, M.; Ghoreishi-Madiseh, S.A. Recovering waste heat from diesel generator exhaust; an opportunity for combined heat and power generation in remote Canadian mines. J. Clean. Prod. 2019, 225, 785–805. [Google Scholar] [CrossRef]
  3. de Brito, M.A.R.; Baidya, D.; Ghoreishi-Madiseh, S.A. Techno-Economic Feasibility Assessment of a Diesel Exhaust Heat Recovery System to Preheat Mine Intake Air in Remote Cold Climate Regions. Int. J. Min. Sci. Technol. 2020, 30, 517–523. [Google Scholar] [CrossRef]
  4. Ruddiman, W.F. The Anthropogenic Greenhouse Era Began Thousands of Years Ago. Clim. Chang. 2003, 61, 261–293. [Google Scholar] [CrossRef]
  5. Giammar, D.E.; Bruant, R.G.; Peters, C.A. Forsterite dissolution and magnesite precipitation at conditions relevant for deep saline aquifer storage and sequestration of carbon dioxide. Chem. Geol. 2005, 217, 257–276. [Google Scholar] [CrossRef]
  6. Larachi, F.; Daldoul, I.; Beaudoin, G. Fixation of CO2 by chrysotile in low-pressure dry and moist carbonation: Ex-situ and in-situ characterizations. Geochim. Cosmochim. Acta 2010, 74, 3051–3075. [Google Scholar] [CrossRef]
  7. O’connor, W.K.; Dahlin, D.C.; Rush, G.E.; Dahlin, C.L.; Collins, W.K. Carbon dioxide sequestration by direct mineral carbonation: Process mineralogy of feed and products. Min. Met. Explor. 2002, 19, 95–101. [Google Scholar] [CrossRef] [Green Version]
  8. Oelkers, E.H.; Gislason, S.R.; Matter, J. Mineral Carbonation of CO2. Elements 2008, 4, 333–337. [Google Scholar] [CrossRef]
  9. Assima, G.P.; Larachi, F.; Beaudoin, G.; Molson, J. Dynamics of carbon dioxide uptake in chrysotile mining residues—Effect of mineralogy and liquid saturation. Int. J. Greenh. Gas Control 2013, 12, 124–135. [Google Scholar] [CrossRef]
  10. Wilson, S.; Dipple, G.M.; Power, I.; Thom, J.M.; Anderson, R.G.; Raudsepp, M.; Gabites, J.E.; Southam, G. Carbon Dioxide Fixation within Mine Wastes of Ultramafic-Hosted Ore Deposits: Examples from the Clinton Creek and Cassiar Chrysotile Deposits, Canada. Econ. Geol. 2009, 104, 95–112. [Google Scholar] [CrossRef]
  11. Wilson, S.A.; Raudsepp, M.; Dipple, G.M. Verifying and quantifying carbon fixation in minerals from serpentine-rich mine tailings using the Rietveld method with X-ray powder diffraction data. Am. Miner. 2006, 91, 1331–1341. [Google Scholar] [CrossRef]
  12. Mervine, E.M.; Wilson, S.; Power, I.M.; Dipple, G.M.; Turvey, C.C.; Hamilton, J.; Vanderzee, S.; Raudsepp, M.; Southam, C.; Matter, J.M.; et al. Potential for offsetting diamond mine carbon emissions through mineral carbonation of processed kimberlite: An assessment of De Beers mine sites in South Africa and Canada. Miner. Pet. 2018, 112, 755–765. [Google Scholar] [CrossRef]
  13. Power, I.M.; McCutcheon, J.; Harrison, A.L.; Wilson, S.A.; Dipple, G.M.; Kelly, S.; Southam, C.; Southam, G. Strategizing Carbon-Neutral Mines: A Case for Pilot Projects. Minerals 2014, 4, 399–436. [Google Scholar] [CrossRef] [Green Version]
  14. Power, I.M.; Wilson, S.A.; Dipple, G.M. Serpentinite Carbonation for CO2 Sequestration. Elements 2013, 9, 115–121. [Google Scholar] [CrossRef]
  15. Woodall, C.M.; Lu, X.; Dipple, G.; Wilcox, J. Carbon Mineralization with North American PGM Mine Tailings—Characterization and Reactivity Analysis. Minerals 2021, 11, 844. [Google Scholar] [CrossRef]
  16. Wilson, S.A.; Barker, S.L.L.; Dipple, G.M.; Atudorei, V. Isotopic Disequilibrium during Uptake of Atmospheric CO2 into Mine Process Waters: Implications for CO2 Sequestration. Environ. Sci. Technol. 2010, 44, 9522–9529. [Google Scholar] [CrossRef] [PubMed]
  17. Wilson, S.A.; Dipple, G.M.; Power, I.M.; Barker, S.L.L.; Fallon, S.J.; Southam, G. Subarctic Weathering of Mineral Wastes Provides a Sink for Atmospheric CO2. Environ. Sci. Technol. 2011, 45, 7727–7736. [Google Scholar] [CrossRef]
  18. Harrison, A.L.; Power, I.M.; Dipple, G.M. Accelerated Carbonation of Brucite in Mine Tailings for Carbon Sequestration. Environ. Sci. Technol. 2013, 47, 126–134. [Google Scholar] [CrossRef]
  19. Assima, G.P.; Larachi, F.; Molson, J.; Beaudoin, G. New tools for stimulating dissolution and carbonation of ultramafic mining residues. Can. J. Chem. Eng. 2014, 92, 2029–2038. [Google Scholar] [CrossRef]
  20. Harrison, A.L.; Power, I.M.; Dipple, G.M.; Mayer, K.U.; Wilson, S.A. Controls on Carbon Mineralization in Ultramafic Mine Tailings. In Proceedings of the American Geophysical Union Fall Meeting, San Francisco, CA, USA, 9 December 2013. [Google Scholar]
  21. Kelemen, P.B.; McQueen, N.; Wilcox, J.; Renforth, P.; Dipple, G.; Vankeuren, A.P. Engineered carbon mineralization in ultramafic rocks for CO2 removal from air: Review and new insights. Chem. Geol. 2020, 550, 119628. [Google Scholar] [CrossRef]
  22. Harrison, A.L.; Dipple, G.M.; Power, I.M.; Ulrich Mayer, K. Influence of surface passivation and water content on mineral reactions in unsaturated porous media: Implications for brucite carbonation and CO2 sequestration. Geochim. Cosmochim. Acta 2015, 148, 477–495. [Google Scholar] [CrossRef]
  23. Harrison, A.L.; Dipple, G.M.; Power, I.M.; Mayer, K.U. The Impact of Evolving Mineral–Water–Gas Interfacial Areas on Mineral–Fluid Reaction Rates in Unsaturated Porous Media. Chem. Geol. 2016, 421, 65–80. [Google Scholar] [CrossRef]
  24. Wynands, E. Carbon Mineralization in Ultramafic Mine Tailings Via CO2 Injection. Master’s Thesis, University of British Columbia, Vancouver, BC, Canada, 2021. [Google Scholar]
  25. Azadi, M.; Aminossadati, S.M.; Chen, Z. Development of an integrated reservoir-wellbore model to examine the hydrodynamic behaviour of perforated pipes. J. Pet. Sci. Eng. 2017, 156, 269–281. [Google Scholar] [CrossRef] [Green Version]
  26. Oyarce, P.; Gurovich, L.; Duarte, V. Experimental Evaluation of Agricultural Drains. J. Irrig. Drain. Eng. 2016, 143, 1–13. [Google Scholar] [CrossRef]
  27. Wang, J. Theory of flow distribution in manifolds. Chem. Eng. J. 2011, 168, 1331–1345. [Google Scholar] [CrossRef]
  28. Ravikumar, V.; Ranganathan, C.R.; Bosu, S.S. Analytical Equation for Variation of Discharge in Drip Irrigation Laterals. J. Irrig. Drain. Eng. 2003, 129, 295–298. [Google Scholar] [CrossRef]
  29. Liu, H.; Zong, Q.; Lv, H.; Jin, J. Analytical equation for outflow along the flow in a perforated fluid distribution pipe. PLoS ONE 2017, 12, e0185842. [Google Scholar] [CrossRef] [Green Version]
  30. Acrivos, A.; Babcock, B.; Pigford, R. Flow distributions in manifolds. Chem. Eng. Sci. 1959, 10, 112–124. [Google Scholar] [CrossRef]
  31. Greskovich, E.J.; O’Bara, J.T. Perforated-Pipe Distributors. Ind. Eng. Chem. Proc. Des. Dev. 1968, 7, 593–595. [Google Scholar] [CrossRef]
  32. Kulkarni, A.V.; Roy, S.S.; Joshi, J.B. Pressure and Flow Distribution in Pipe and Ring Spargers: Experimental Measurements and Cfd Simulation—Sciencedirect. Chem. Eng. J. 2007, 133, 173–186. [Google Scholar] [CrossRef]
  33. Lu, G.-M.; Li, Y.-H.; Hassani, F.; Zhang, X. The influence of microwave irradiation on thermal properties of main rock-forming minerals. Appl. Therm. Eng. 2017, 112, 1523–1532. [Google Scholar] [CrossRef]
  34. Vallesquino, P.; Luque-Escamilla, P.L. New Algorithm for Hydraulic Calculation in Irrigation Laterals. J. Irrig. Drain. Eng. 2001, 127, 254–260. [Google Scholar] [CrossRef]
  35. Maynes, D.; Holt, G.J.; Blotter, J. Cavitation Inception and Head Loss Due to Liquid Flow Through Perforated Plates of Varying Thickness. J. Fluids Eng. 2013, 135, 031302. [Google Scholar] [CrossRef]
  36. Kapadia, S.; Anderson, W. Sensitivity analysis for solid oxide fuel cells using a three-dimensional numerical model. J. Power Sources 2009, 189, 1074–1082. [Google Scholar] [CrossRef]
  37. Afrin, T.; Kaye, N.B.; Khan, A.A.; Testik, F.Y. Parametric Study of Perforated Pipe Underdrains Surrounded by Loose Aggregate. J. Hydraul. Eng. 2016, 142, 04016066. [Google Scholar] [CrossRef]
  38. Afrin, T.; Khan, A.A.; Kaye, N.B.; Testik, F.Y. Numerical Model for the Hydraulic Performance of Perforated Pipe Underdrains Surrounded by Loose Aggregate. J. Hydraul. Eng. 2016, 142, 04016018. [Google Scholar] [CrossRef]
  39. Minocha, N.; Joshi, J.B. 3D CFD simulation of turbulent flow distribution and pressure drop in a dividing manifold system using openfoam. Int. J. Heat Mass Transf. 2020, 151, 119420. [Google Scholar] [CrossRef]
  40. Braun, J.; Sousa, J.; Paniagua, G. Numerical Assessment of the Convective Heat Transfer in Rotating Detonation Combustors Using a Reduced-Order Model. Appl. Sci. 2018, 8, 893. [Google Scholar] [CrossRef] [Green Version]
  41. Amiri, L.; De Brito, M.A.R.; Baidya, D.; Kuyuk, A.F.; Ghoreishi-Madiseh, S.A.; Sasmito, A.P.; Hassani, F.P. Numerical investigation of rock-pile based waste heat storage for remote communities in cold climates. Appl. Energy 2019, 252, 113475. [Google Scholar] [CrossRef]
  42. Baidya, D.; de Brito, M.A.R.; Ghoreishi-Madiseh, S.A. Techno-economic feasibility investigation of incorporating an energy storage with an exhaust heat recovery system for underground mines in cold climatic regions. Appl. Energy 2020, 273, 115289. [Google Scholar] [CrossRef]
  43. Baidya, D.; de Brito, M.A.R.; Sasmito, A.P.; Ghoreishi-Madiseh, S.A. Diesel generator exhaust heat recovery fully-coupled with intake air heating for off-grid mining operations: An experimental, numerical, and analytical evaluation. Int. J. Min. Sci. Technol. 2021, 32, 155–169. [Google Scholar] [CrossRef]
  44. Robert, H.R. Perry’s Chemical Engineering Handbook, 8th ed.; Mcgraw-Hill: New York, NY, USA, 2007. [Google Scholar]
  45. Zhong, W.; Xu, K.; Li, X.; Liao, Y.; Tao, G.; Kagawa, T. Determination of pressure drop for air flow through sintered metal porous media using a modified Ergun equation. Adv. Powder Technol. 2016, 27, 1134–1140. [Google Scholar] [CrossRef]
  46. Kaviany, M. Principles of Heat Transfer in Porous Media; Springer Science & Business Media: Berlin/Heidelberg, Germany, 2012. [Google Scholar]
  47. Nield, D.A.; Bejan, A. Convection in Porous Media; Springer: New York, NY, USA, 2006; Volume 3. [Google Scholar]
  48. Ho, C.K.; Webb, S.W. Gas Transport in Porous Media; Springer: New York, NY, USA, 2006; Volume 20. [Google Scholar]
  49. Brown, G.O. The History of the Darcy-Weisbach Equation for Pipe Flow Resistance. In Environmental and Water Resources History; American Society of Civil Engineers: Reston, VA, USA, 2002; pp. 34–43. [Google Scholar] [CrossRef] [Green Version]
  50. Economides, M.J.; Hill, A.D. Christine Ehlig-Economides Ding Zhu. In Petroleum Production Systems, 2nd ed.; Pearson Education: Westford, MA, USA, 2013; ISBN -13: 978-0-13-703158-0. [Google Scholar]
  51. Wang, J.; Gao, Z.; Gan, G.; Wu, D. Analytical solution of flow coefficients for a uniformly distributed porous channel. Chem. Eng. J. 2001, 84, 1–6. [Google Scholar] [CrossRef]
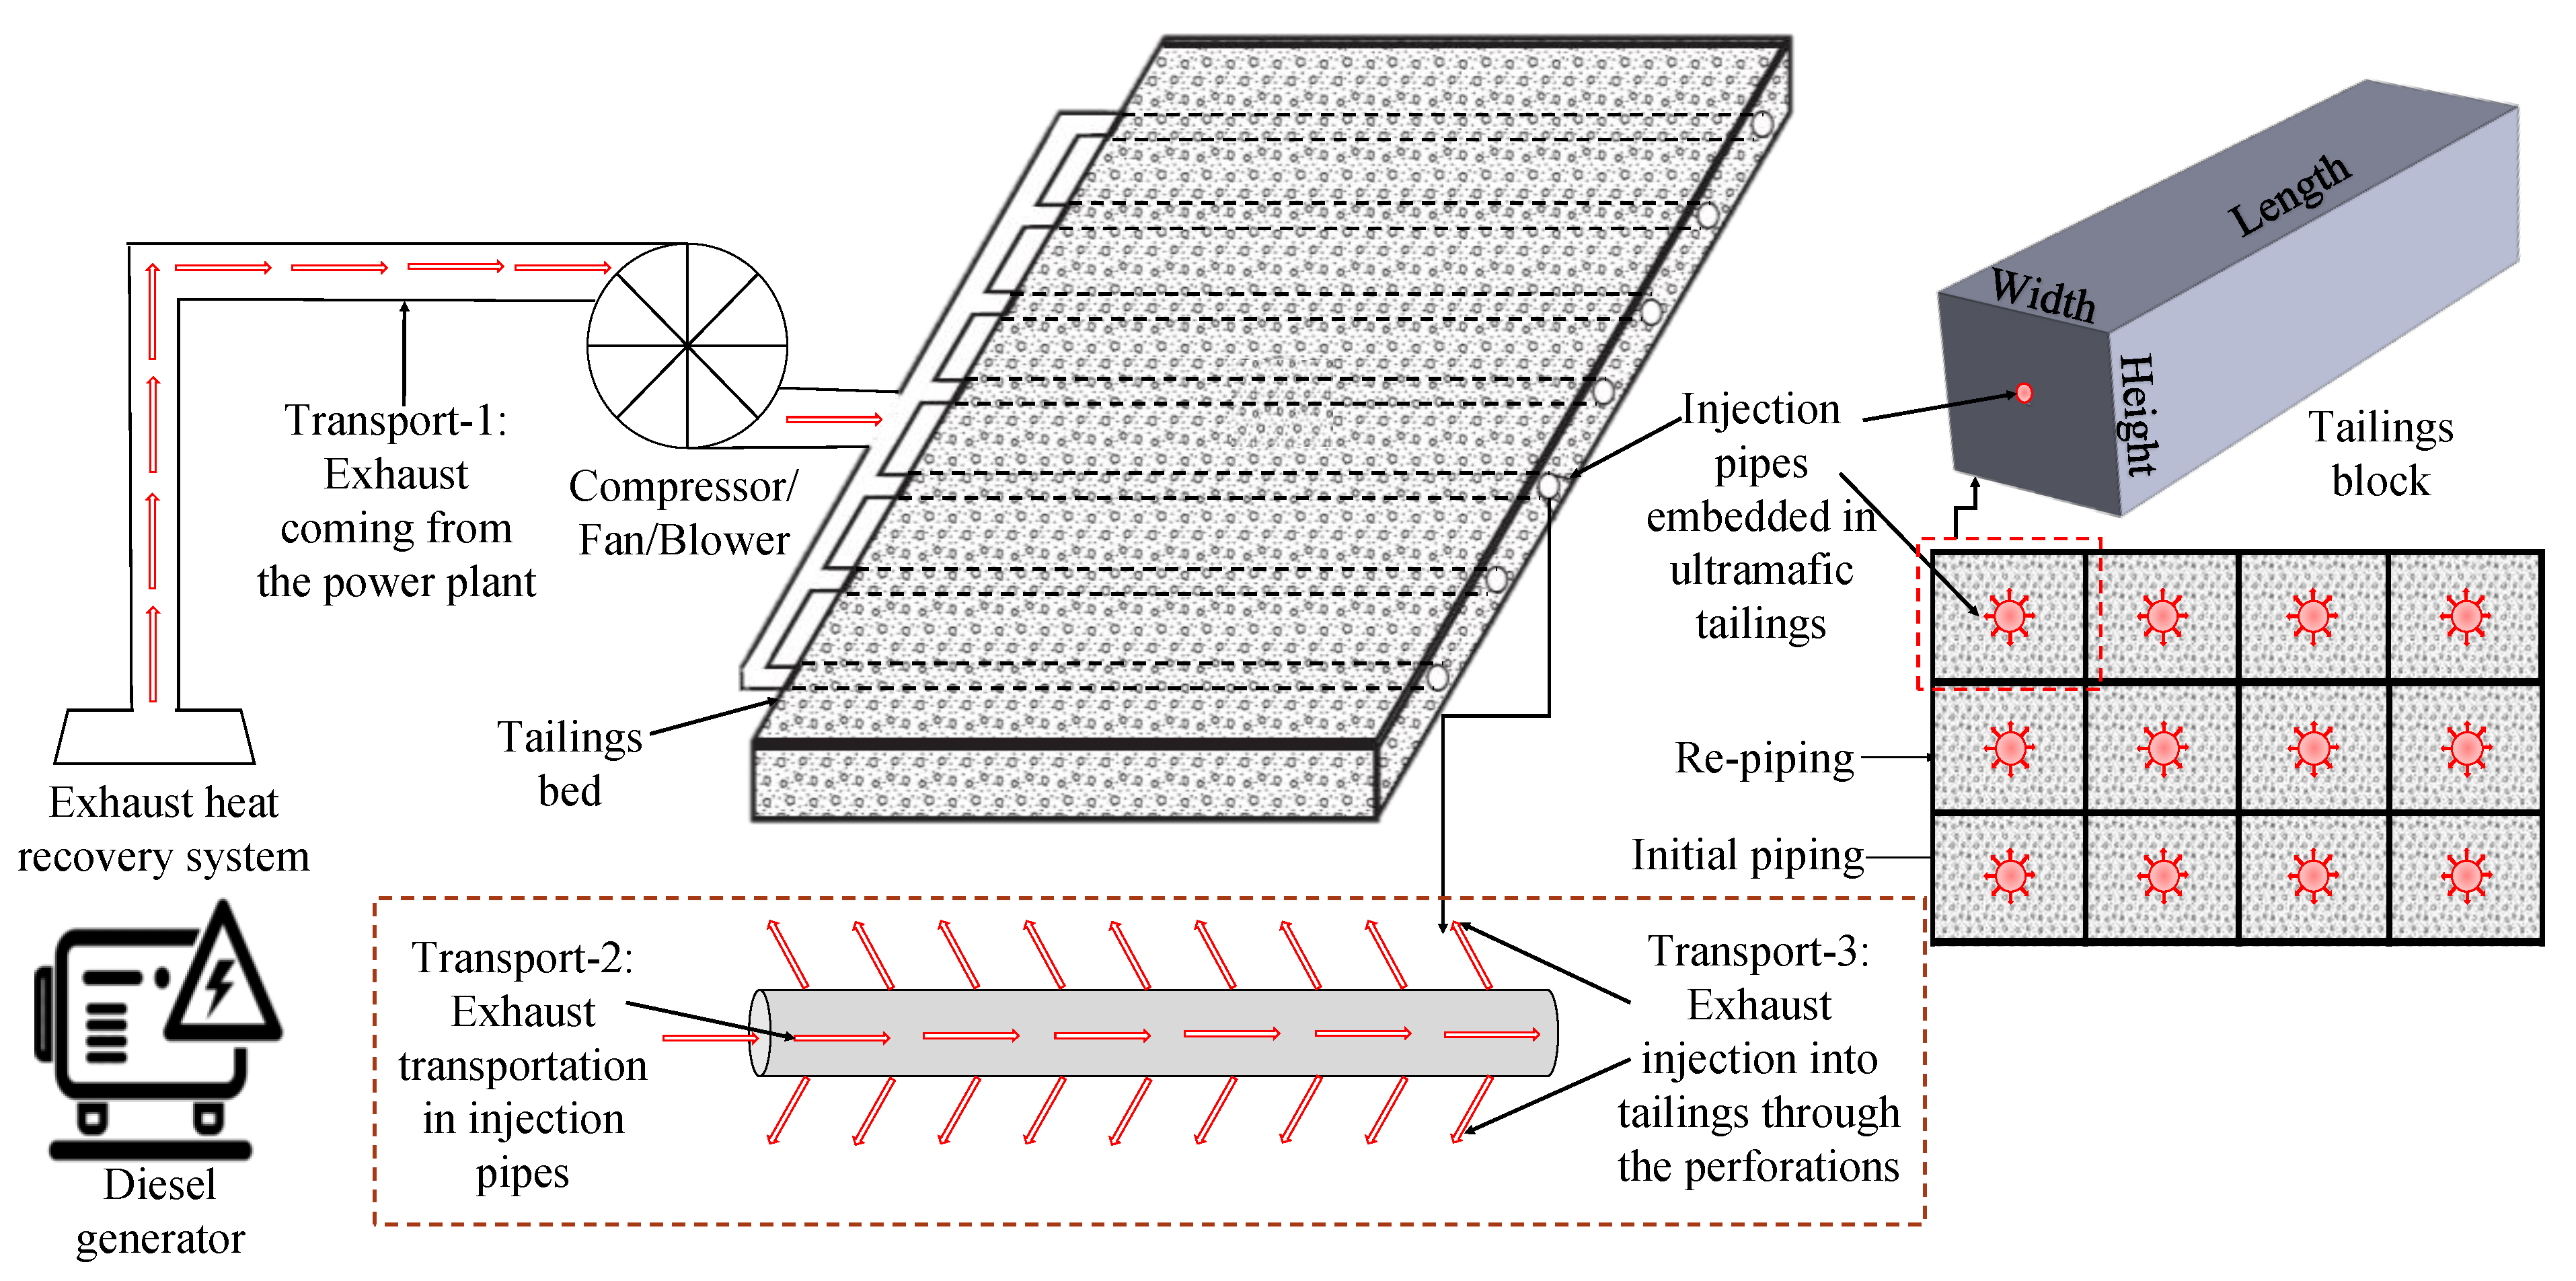
Figure 1. Schematic of the proposed carbon sequestration method implemented at remote mines.
Minerals 13 00855 g001
Figure 2. Experimental set-up for studying the outflow from a perforated pipe into a porous medium: (a) entire experimental set-up; and (b) perforated pipe.
Minerals 13 00855 g002
Figure 3. Permeameter set-up.
Minerals 13 00855 g003
Figure 4. The geometry and the boundary conditions implemented in the 3D FE simulations.
Minerals 13 00855 g004
Figure 5. The (1 + 1)D model development for perforated injection pipes embedded in a porous medium.
Minerals 13 00855 g005
Figure 6. Visual representation of the transition and smooth zone for gas flow into the porous medium.
Minerals 13 00855 g006
Figure 7. Comparison between the gauge pressure profiles in the injection pipe from the experimental and numerical results. The square and diamond-shaped markers represent the results from experimental tests 1 and 2, respectively. Distinct colors distinguish the different flow rates used for the CS and FS. The solid and the dash lines indicate the results obtained from the (1 + 1)D and the 3D FE results, respectively.
Minerals 13 00855 g007
Figure 8. Comparison between the measured permeability range of the sand samples and the predicted permeability range from the (1 + 1)D model results.
Minerals 13 00855 g008
Figure 9. Visual representation of the cases studied: (a) variation in the perforation arrangement for a constant perforation ratio, (b) variation in the perforation ratio for a fixed perforation arrangement, and (c) cross-section of the system and the definition of r r .
Minerals 13 00855 g009
Figure 10. Effect on the m-factor from changes in the: (a) permeability, (b) inlet flow rate, (c) perforation arrangement, (d) injection pipe perforated area, and (e) thickness of the porous domain.
Minerals 13 00855 g010
Figure 11. Range of m-factors for different porous domain thicknesses and injection pipe perforation schemes.
Minerals 13 00855 g011
Figure 12. Comparison of inlet pressures obtained from the 3D FE and the (1 + 1)D numerical model at different operating variables: (a) permeability; (b) inlet flow rate; (c) perforation arrangement; (d) perforation ratio; and (e) size of the porous domain. The blue diamond and red square shaped markers represent the 3D FE and (1 + 1)D results, respectively.
Minerals 13 00855 g012
Figure 13. Comparison of the pressure profile along the injection pipe obtained from the 3D FE and (1 + 1)D numerical models at different operating variables: (a) permeability, (b) inlet flow rate, (c) perforation arrangement, (d) perforation ratio, and (e) size of the porous domain. The diamond-shaped markers and dashed lines represent the 3D FE and (1 + 1)D results, respectively.
Minerals 13 00855 g013
Figure 14. Comparison of the outflow distribution obtained from the 3D FE and (1 + 1)D numerical models under different operating parameters: (a) permeability, (b) inlet flowrate, (c) perforation arrangement, (d) perforation ratio, and (e) size of the porous domain. The diamond-shaped markers and dashed lines represent the 3D FE and (1 + 1)D results, respectively.
Minerals 13 00855 g014
Figure 15. Heat maps: (a) inlet pressure variation for different perforation arrangements and porous domain sizes, and (b) difference in the inlet pressure calculations with and without considering the effect of the perforation arrangement.
Minerals 13 00855 g015
Disclaimer/Publisher’s Note: The statements, opinions and data contained in all publications are solely those of the individual author(s) and contributor(s) and not of MDPI and/or the editor(s). MDPI and/or the editor(s) disclaim responsibility for any injury to people or property resulting from any ideas, methods, instructions or products referred to in the content.