Article

Research on the Tectonic Characteristics and Hydrocarbon Prospects in the Northern Area of the South Yellow Sea Based on Gravity and Magnetic Data

1
School of Geophysics and Information Technology, China University of Geosciences, Beijing 100083, China
2
School of Earth Sciences and Engineering, Xi’an Shiyou University, Xi’an 710065, China
3
Xinjiang Research Centre for Mineral Resources, Xinjiang Institute of Ecology and Geography, Chinese Academy of Sciences, Ürümqi 830011, China
*
Author to whom correspondence should be addressed.
Minerals 2023, 13(7), 893; https://doi.org/10.3390/min13070893
Submission received: 13 May 2023 / Revised: 23 June 2023 / Accepted: 27 June 2023 / Published: 30 June 2023

Abstract

:
To further explore the geological structure and the Mesozoic–Paleozoic hydrocarbon prospects in the northern area of the South Yellow Sea (SYS), multiple geological and geophysical data were systematically gathered and compiled, including gravity and magnetic data, seismic surveys, drilling data, and previous research results. The characteristics and genesis of the gravity and magnetic anomalies are examined. This study employs residual gravity anomalies and multiple edge detection methods to identify fault lineament structures and assess the tectonic framework. Moreover, the study utilizes 2.5D gravity-seismic joint modellings and regression analysis to estimate the basement depth. Additionally, the study examines the basement characteristics and discusses the thickness of the Mesozoic–Paleozoic strata. Finally, the study further identifies prospects for hydrocarbons in the Mesozoic–Paleozoic. Our findings show that the faults are incredibly abundant and that the intensity of fault activity weakens gradually from NW to SE. Specifically, NE (NEE) trending faults are interlaced and cut off by NW (NWW), near-EW, and near-SN trending secondary faults, which form an en-echelon composite faults system with a dominant NE (NEE) orientation. Thick Mesozoic–Paleozoic strata are preserved, but we observe distinct variations in basement characteristics and the pre-Cenozoic structural deformation along the N-S direction. Therefore, the Northern Basin of SYS (NBSYS) and the Middle Uplift of SYS (MUSYS) are characterized by alternating sags and bulges in the S-N direction and in the E-W direction, respectively, forming a chessboard tectonic framework. Considering the oil and gas accumulation model, we identify three target hydrocarbon prospects in the NBSYS and two favorable hydrocarbon prospects in the MUSYS.

1. Introduction

The northern area of the South Yellow Sea (SYS) is mainly located in the Lower Yangtze Plate (LYP) east of the Tancheng–Lujiang fault zone (TLFZ), the north of which is close to the Shandong Peninsula (SP). This belongs to the Sino–Korean Plate (SKP), and the south of the SKP is tightly connected to the South China Plate (SCP) (Figure 1). Large numbers of geological and geophysical investigations for hydrocarbon exploration have been conducted in the SYS since the 1960s. Over the years, considerable geological and geophysical data have been collected. Exploration practices and research results indicate that the SYS is rich in hydrocarbons and other potential resources [1,2,3,4,5,6,7,8,9,10,11,12,13]. However, since the pre-Sinian period, the Mesozoic-Paleozoic marine sedimentary basin of the SYS has experienced the forceful action of multi-period tectonic movements, including the Caledonian, Hercynian, Indosinian, Yanshan, and Himalayan movements [4,5,6,7,14,15]. Moreover, the strata have experienced multiple tectonic events, including extrusion uplift and denudation, extensional rift sedimentation, and igneous rock intrusion across different ages, resulting in large structural fluctuations, fault development, significant lateral variations, and substantial heterogeneity. The pre-Cenozoic residual basins developed through these processes, creating a complex sedimentary system, fault system, and distinctive tectonic evolution characteristics [5,6,15,16,17,18]. As a result, these processes have made it significantly more challenging to understand the geological structure and to prospect for hydrocarbon resources in the pre-Cenozoic residual basins.
In recent years, several studies have utilized seismic and drilling data to investigate geological structures, sedimentary layers, and oil and gas potential [2,3,4,5,6,7,10,11,16,17,21,22,23,24,25,26,27,28]. However, the Paleozoic can suffer from low reflectivity in deep seismic imaging due to the strong shielding effect of the carbonate’s powerful reflection interface in a seismic profile, the weak reflection amplitude of the target strata, the low signal-to-noise ratio, and the poor lateral resolution. Although the results of two wide-angle seismic profiles have also been applied to the research of the SYS [29,30,31,32], they have only revealed the distribution of sediments, structural characteristics, and the splicing relationship between the plates in the local area. Furthermore, the geological features of the Mesozoic–Paleozoic are challenging to reveal due to the scarcity of drillings, which only comprise 26 wells with shallow depths. Thus, all these factors have hindered the effective determination of geological features, such as fault structures, tectonic evolution, the Mesozoic–Paleozoic distribution, and basement properties.
On the other hand, gravity and magnetic data play significant factors in regional geological structures and hydrocarbon exploration research. Refs. [33,34,35] effectively detected oil and gas potential areas by employing the normalized full gradient (NFG) method, which has been commonly used in structural studies. For example, Ref. [36] used the improved gravity NFG method to detect hydrocarbon reservoirs in the Shengli oil field in eastern China. Ref. [37] conducted a comprehensive investigation of the geological structure and oil and gas properties of the Hasankale Horasan petroleum exploration province, employing the NFG method in conjunction with the Filon method. Ref. [38] identified the hydrocarbon exploration targets in the Tabas basin in Yazd province, eastern Iran, utilizing the gravity NFG method.
Furthermore, significant progress has been achieved in studying geological structures and other aspects by applying gravity and magnetic data. For instance, Ref. [39] applied gravity and magnetic data to study the structural characteristics and oil and gas prospects in the Tobago Basin. Ref. [40] analyzed the geological structure of the Red Sea region through the use of gravity and magnetic data. Ref. [41] used gravity data and multiple field boundary detectors to map the detailed structure of the Wadi Umm Ghalqa area in the southeastern desert of Egypt. Ref. [42] described the lineament of the Thua Thien Hue area using Bouguer Gravity anomaly data. Ref. [43] used gravity and magnetic data to determine the structural characteristics of the Qattara Compression area in Egypt. Ref. [44] utilized Bouguer gravity data and 15 field boundary enhancement techniques to better understand the structural features of the southern Red Sea. Ref. [45] interpreted the gravity data of the study area to investigate the sedimentary cover and structural configuration in the eastern portion of the Suez area, Sinai, and Egypt. Ref. [46] employed advanced gravity edge detection methods to map the structural configuration of the western part of the Gulf of Guinea. Likewise, significant progress has been made in researching geological structures, hydrocarbon potential, and other aspects in the SYS using gravity and magnetic data [14,47,48,49,50,51,52,53,54,55,56,57]. Nevertheless, considerable controversies still exist in understanding the fault characteristics, basement structure, and stratigraphic distribution due to the long-time span, inconsistent quality, data precision, poor short-wave signal, and single or limited gravity and magnetic data processing methods.
Exploration for industrial hydrocarbon resources in the SYS remains challenging, despite substantial geophysical and geological research on faults, basement structure, stratigraphic distribution, and oil and gas prospects. Several fundamental reasons underlie this stagnation: there is relatively insufficient geophysical work; the target layers for oil and gas prospecting are not yet thoroughly determined; and little attention is paid to uplift areas or bulge belts. Furthermore, a unified understanding of geological problems such as fault systems, basement structure, and stratigraphic distribution is lacking. It is imperative to carry out comprehensive geological-geophysical research to study these geological features, including structural characteristics, basement structure, and the distribution of the Mesozoic–Paleozoic, and reduce the ambiguity of geophysical methods. Therefore, we integrate recent gravity and magnetic data with existing aero-gravity data (1:250,000) [54] for corresponding geophysical and geological interpretation. This study redetermines and constructs the faults system using high-precision geopotential field separation methods and edge detection techniques. By combining this information with known seismic constraint data, the regression analysis method is used to calculate the basement depth, from which the Mesozoic–Paleozoic thickness is obtained. In addition, we analyze the stratigraphic development characteristics and structural contact relationship. Then, based on these analyses, the oil and gas prospecting areas are determined. Hence, our findings provide the primary geophysical basis for exploring the structure and new strata resources of the Mesozoic–Paleozoic in the SYS.

2. Geological and Geophysical Setting

2.1. Geological Setting

The study area is predominantly situated in LYP in the east of the Sulu Orogenic Belt [58]. It has undergone the consolidated diagenesis and reactivation of the Late Sibao Movement in the Mesozoic–Proterozoic and the Jinning Movement in the Neo-Proterozoic, forming a two-layer crystalline basement of Meso-Neo-Proterozoic shallow metamorphic rock and Archean–Paleo-Proterozoic deep metamorphic rock [59,60]. Under the influence of the multi-period tectonic movement reformations and the action of various tectonic stresses, the study area has successively experienced various types of tectonic activity, such as stable sedimentation, gradual collage, oscillation migration, collision orogenesis, extrusion folds, compressive stress and tensile stress conversion, extensional fault depressions, and strike-slip subsidence [17]. Overall, it represents a marine-continental multi-cycle superimposed petroliferous basin formed based on a pre-Sinian metamorphic basement [5,6,14,17,21,25]. Simultaneously, frequent tectonic-magmatic activities and sustained magmatism have led to the development of multi-period igneous rocks. These strata and rocks are extensively distributed in the surrounding areas in the northern region of the SYS, of which Archean and Proterozoic magmatic rocks dominate basement igneous rocks, and igneous rock masses in the sedimentary layers are mainly rock stocks and rock branches. Although rocks of various properties are present, acidic and medium-acidic rocks remain dominant [17]. In addition, the complex fault development and tectonic patterns determine the distribution of various geological features, such as uplift and depression structures (secondary sag-bulge structures), strata, igneous rocks, and hydrocarbon resources.
Until now, according to drilling and seismic data, three sets of tectonic sequences have been revealed in the SYS: marine strata such as the Sinian, Paleozoic, and Middle–Lower Triassic; continental faulted formations such as the Upper Triassic, Jurassic, Cretaceous, Paleogene; and the Neogene depression sedimentary layer and Quaternary marine sedimentary structural layer. Ref. [61] studied the geothermal field characteristics and determined that the average heat flow value was 67.0 mW/m2, which is slightly higher than the global average heat flow value of 65.0 mW/m2. The study also revealed the thermal background characteristics of “cold crust and hot mantle”. The heat flow value formed by the combination of various sedimentary layers was 5.85 mW/m2, which comprised 8.9% of the surface heat flow. These chiefly influences the maturity of organic matter in the sedimentary layers, which is conducive to forming hydrocarbon resources. Extensive research has shown that the Mesozoic–Paleozoic provides excellent material foundation and geological structure conditions for hydrocarbon accumulation. Hence, it holds considerable potential for hydrocarbon exploration [5,6,7,8,9,10,11,12,17,62,63,64,65,66,67]. Moreover, this paper also summarizes the features of the sources, reservoirs, and cap layers in the Mesozoic-Paleozoic. As a whole, the tectonic activity over multiple periods contributed to the formation of five sets of source rocks, three sets of reservoirs, and five sets of cap layers in the Mesozoic–Paleozoic. These formations formed three sets of complete source-reservoir-cap assemblages, which exhibit characteristics of multi-source and multi-period oil and gas accumulations.

2.2. Physical Properties

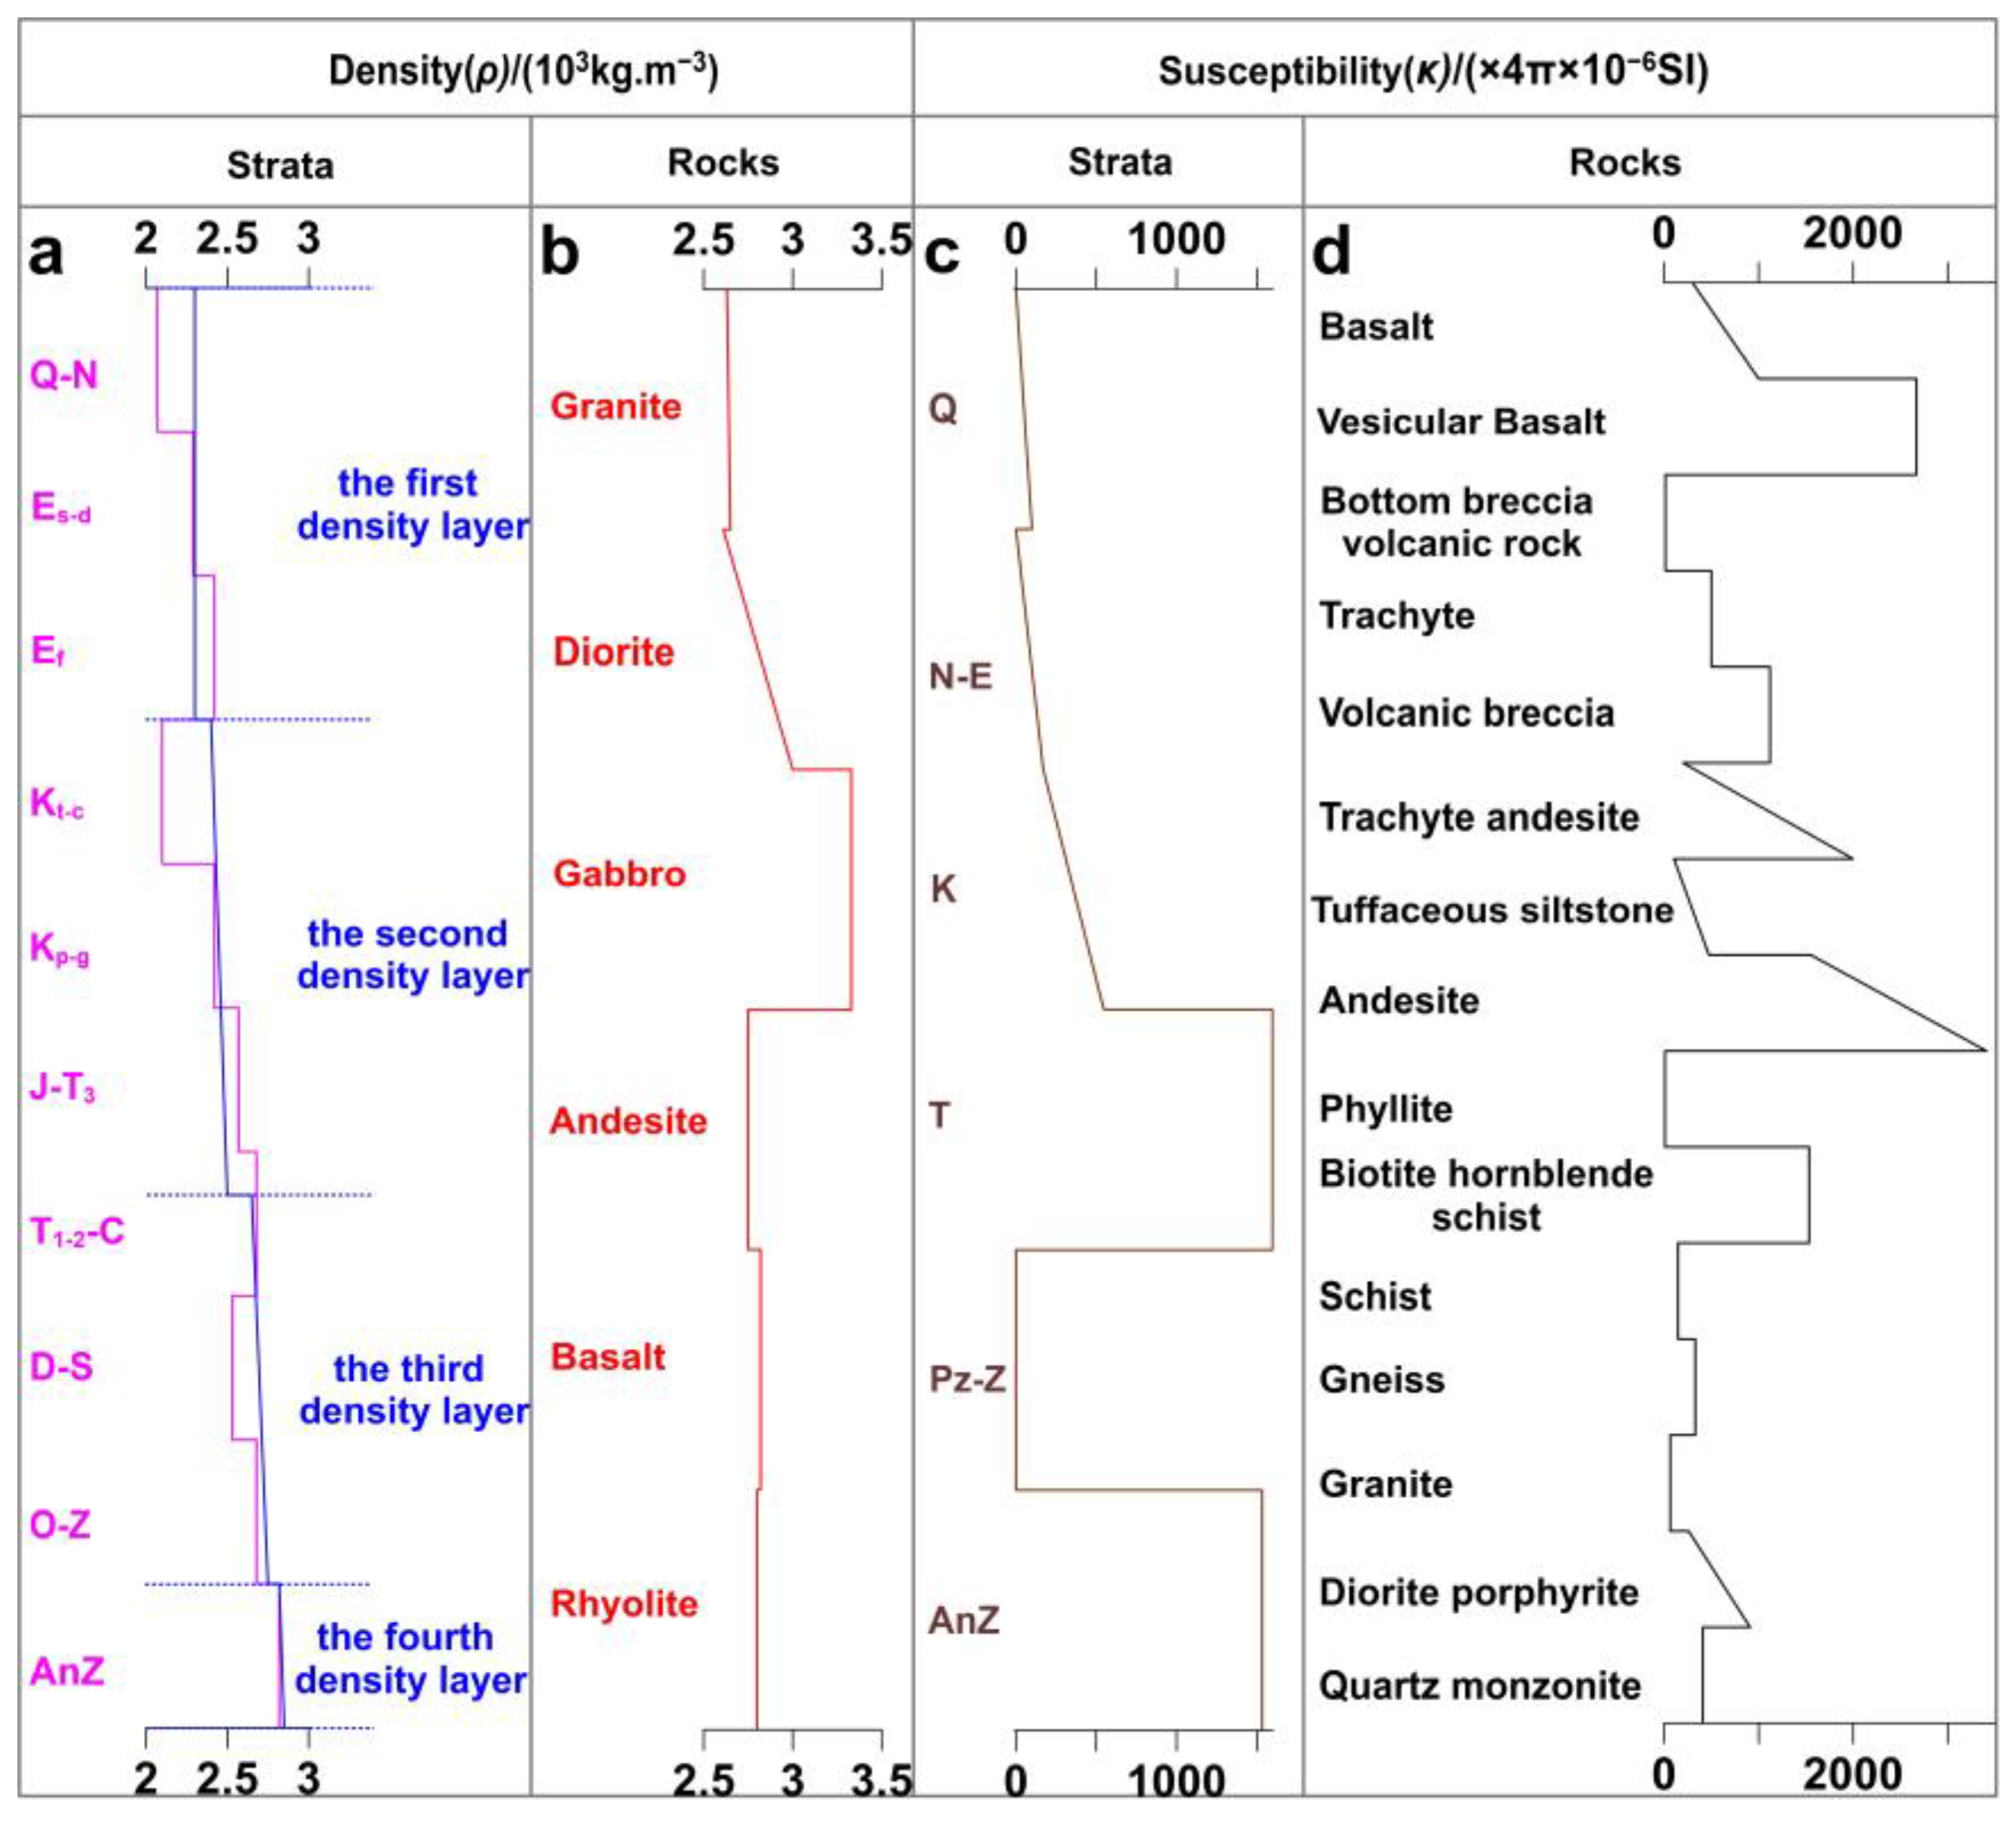
The physical property data of the northern area of the SYS are principally sourced from the neighbouring SP and northern Jiangsu region, while some physical properties are acquired from the drillings and the conversion of seismic wave velocity and density in the sea (Figure 2) [17,50,51,52,54,55,68,69]. Based on previous research, we propose that the density of the strata (rocks) in the study area gradually decreases with sedimentary age, from old to new, and with depth, from deep to shallow (Figure 2a). However, there is a reverse phenomenon in the Mesozoic and Paleozoic. Igneous rock densities increase gradually from acidic to ultrabasic, ranging from 2.63 to 2.82 × 10⁻³ kg/m3 (abbreviated as 2.63~2.82, the same below) (Figure 2b). Metamorphic rock densities increase with the degree of metamorphism, and the density values of shallow and deep metamorphic rocks range from 2.67 to 2.86 (Figure 2b). However, strata (rocks) densities in different structural units are different in horizontal and vertical directions according to the comprehensive statistical analysis of this study, which is prone to cause a strong gravity effect. While the macro density models exhibit general similarities across the northern region of the SYS and its surrounding areas, the simple density model can better represent the actual situation of the major density interfaces causing gravity anomalies. The strata can be, therefore, divided into four density layers and three density interfaces (Figure 2a).
The Cenozoic, Mesozoic, and Paleozoic normally have either weak or no magnetization, and only a few strata have moderate to strong magnetization (Figure 2c). For example, the susceptibility of the Upper Jurassic andesite is as high as 3410 × 10−6 × 4π SI (abbreviated as 3410, the same below), which is classified as a relatively strong magnetization. In contrast, the pre-Sinian crystalline basement composed of the Mesozoic–Paleozoic–Proterozoic and Archean has medium to strong magnetization. In addition, medium and shallow metamorphic rocks ordinarily present either negligible or weak magnetization, whereas deep metamorphic rocks generally display strong magnetization, with a susceptibility value exceeding 3000. In addition, the susceptibilities of igneous rocks are usually strong and vary greatly (Figure 2d). For instance, ultrabasic, basic, neutral intrusive rocks, and extruded rocks possess strong susceptibilities (especially basic and ultrabasic rocks have the strongest susceptibility), ranging primarily between 1000 and 3000. However, the susceptibility of acidic igneous rocks is commonly between the range of 500 and 1000, while granite porphyry reveals very weak magnetization, with a susceptibility of 5~500, and the magnetism of medium-acid igneous rocks is between that of the neutral and acid rocks. In addition, the Cenozoic and Mesozoic have weak or no magnetization in the eastern Shandong area on the land, while the Mesozoic Qingshan Group is composed of eruptive volcanic rocks with uneven susceptibility and significant variations. In igneous rocks, the ancient basic and ultrabasic complexes manifest strong susceptibility, and the Mesozoic igneous rocks present the characteristics of uneven susceptibility; however, the susceptibility dispersion of basic, medium and acid igneous rocks vary widely. The susceptibility of various intrusive rocks in the Yanshanian Period is uneven and varies widely, while the susceptibility of intrusive rocks in the Indosinian and Sinian Periods is weak and uniform.

3. Data and Methodology

3.1. Data

The gravity and magnetic data obtained from the National Geological Archives of the China Geological Survey are grid longitude and latitude. When integrating data, researchers perform various correction processes to remove deviations from between types of data. Gravity data consists of aero-gravity, land gravity, and marine shipborne gravity data. Among these, aero-gravity data are the major type (blue dashed range, Figure 3), and land gravity and marine shipborne gravity data supplement at the periphery. The magnetic data consist of aeromagnetic and marine magnetic survey data. In addition, WGS84 coordinate conversion is conducted on the gravity and magnetic data, in which the Gauss-Krüger projection is used to project to a plane coordinates system. Using the minimum curvature method, gravity and magnetic data are interpolated into a 2 km × 2 km grid Bouguer gravity anomaly (Figure 3a) and magnetic anomaly, and the magnetic anomaly data are reduced to the pole (RTP parameters: geomagnetic declination: −6.09°, geomagnetic inclination: 52.14°) (Figure 4a). Finally, the gravity and magnetic data are evaluated. The resolution of the gravity and magnetic data is equivalent to 1:500,000, which is higher than previously (1:1,000,000).

3.2. Methodology

The methods applied in this paper include regularization filtering (RF), vertical second derivative (VSDR), normalized vertical derivative of total horizontal derivative (NVDR-THDR), normalized standard deviation (NSTD), enhanced gradient amplitude (EHGA), improved logistic filter (IL), the constrained inversion of the 2.5D gravity profile, and regression analysis (RA).

3.2.1. Regularization Filtering (RF)

RF is a geopotential field separation method proposed by Ref. [70] based on the regularization theory [71]. The stable regularization factor can be expressed as follows:
f α m n = 1 / 1 + α e β f f 0 λ x
where β ≥ 2; f 0 refers to the minimum wavenumber of the high-frequency interference to be eliminated, which is equal to the reciprocal of its largest horizontal size λ 0 1 . f = m 2 + n 2 · λ x / λ y / λ x , λ x and λ y   are the fundamental wavelengths; the wavenumbers are u = m λ x , v = n λ y , f = u 2 + v 2 , (m = 0, 1, …, M − 1; n = 0, 1, …, N − 1). In addition, the regularization parameter α is determined through theoretical model tests and practical data applications [39,71], and in the 2D stable regularizing filter, α usually can be set as 2–3 (2 ≤ α ≤ 3). In this paper, α is set as 2.0, and βα.
This method uses regularization stable filtering factors to perform low-pass filtering on the geopotential field data, which can obtain anomalies with different filter scales (the size of the local field to be eliminated) from the gravity and magnetic geopotential field. Then high-frequency and low-frequency signals can be separated. The filter has an ideal low-pass filtering feature that can be used to filter the high frequency for all physical quantity evaluations when using the discrete Fourier transform. On the other hand, the filter can obtain a stable approximation, and the actual data processing effect is relatively good [67,69]. Therefore, it is a method with ideal low-pass filtering characteristics and strong adaptability.

3.2.2. Vertical Second Derivative (VSDR)

The calculation of vertical derivative is widely used in the geological interpretation of gravity and magnetic fields. Theoretical models prove that the calculation results of VSDR can more accurately describe the edge position of the geological body than the calculation results of the first vertical derivative. VSDR can suppress the anomaly influences caused by deep regional geological factors, thus highlighting the anomaly characteristics of small and shallow structures and distinguishing the superimposed anomalies caused by different sizes and depths of anomaly bodies. The position of the zero value can be used to detect the edge position of anomaly bodies [72,73].
There are many different numerical formulas for calculating VSDR. The derivation principles of these formulas are all approximate solutions using the technical approximation method, and only the processing methods are different, which causes the effect of the calculation results to be different. In particular, the Rosenbach formula retains the R4 term in the derivation and directly solves VSDR, which has the advantage of high calculation accuracy. Therefore, the Rosenbach formula [74] is applied in this study:
g z z = 1 24 R 2 96 g 0 72 g R 32 g 2 R + 8 g 5 R
where R refers to the number-picking radius, and g refers to the gravity and magnetic geopotential field.

3.2.3. Normalized Vertical Derivative of Total Horizontal Derivative (NVDR-THDR)

The NVDR-THDR edge detection method is proposed by Ref. [75]. This method integrates the characteristics of the total horizontal derivative, n-order vertical derivative, and total horizontal derivative peak methods. Firstly, the n-order vertical derivative is obtained by calculating the total horizontal derivative, and a threshold value greater than zero is applied to calculate the peak value of the total horizontal derivative. Secondly, the ratio of the peak value of the normalized total horizontal derivative to the total horizontal derivative is used to calculate the total horizontal derivative. The detailed calculation process is as follows:
(1) Total horizontal derivative (THDR) of gravity and magnetic data is calculated:
T H D R x , y = f x , y x 2 + f x , y y 2
where f (x, y) refers to the gravity and magnetic field.
(2) n-order vertical derivative ( V D R n ) of total horizontal derivative (THDR) is calculated:
V D R n x , y = n T H D R x , y z n
n refers to the order of vertical derivative, n = 1, 2, 3, …. Moreover, the larger the order, the higher the lateral resolution. Theoretically, it is more appropriate for gravity and magnetic anomalies when n is 2.
(3) Threshold values greater than 0 are used to calculate the peak value of total horizontal derivative (PTHDR):
P T H D R x , y = 0 , V D R n x , y < 0 V D R n x , y     0
(4) The ratio of total horizontal derivative peak (PTHDR) to total horizontal derivative (THDR) is calculated:
V D R T H D R x , y = 0 , P T H D R x , y < 0 P T H D R x , y T H D R x , y , P T H D R x , y     0
(5) The maximum value of the vertical derivative of the total horizontal derivative ( V D R T H D R m a x ) is calculated, and the maximum value is used to normalize the vertical derivative of a total horizontal derivative. Eventually, NVDR-THDR is acquired.
N V D R T H D R x , y = V D R T H D R x , y V D R T H D R m a x
The NVDR-THDR method identifies the fault structures with the position of the maximum values and improves the lateral resolution of the total horizontal derivative. Threshold technology is used to eliminate the information outside the edge of the geological body, making the lineament structure anomaly simple, straightforward, and easy to determine.

3.2.4. Normalized Standard Deviation (NSTD)

The NSTD method is a new method proposed by Ref. [76] from the perspective of mathematical statistics. The standard deviation is slight when the data are relatively smooth; the anomaly will be immense when data varies greatly (such as in the presence of boundaries). Therefore, this method is also essential for enhancing the edge of gravity and magnetic anomalies and has received extensive attention. The formula can be expressed as:
N S T D = σ Δ f z σ Δ f x + σ Δ f y + σ Δ f z
where Δ f refers to the gravity and magnetic field, and σ( ) refers to the standard deviation of the correlation quantity in a moving window of size m × n. The calculation result of the centre point in the current filter window is further determined by taking the ratio of the standard deviation of the vertical first derivative to the sum of the standard deviations of the first derivative in the x, y, and z directions. Its essence is to detect and enhance the field source boundary by utilizing the characteristics of the boundary position with the drastic change in gravity and magnetic anomalies and the significant standard deviation. The sliding window is traversed on the whole grid data to obtain the calculation results of all grid points. Finally, the maximum value positions of the results are obtained, which are the edge positions of the identified geological body.

3.2.5. Enhanced Gradient Amplitude (EHGA)

Ref. [77] proposed EHGA (Enhanced Gradient Amplitude) to accurately determine the horizontal boundary of the field source. This method is based on calculating the derivatives of the gradient amplitude of the gravity data. The maxima in the EHGA map is used to delineate the horizontal boundary of the source. The formula for the edge detector is as follows:
E H G A = R e a s i n p H G z H G x 2 + H G y 2 + H G z 2 1 + 1
with
H G = F x 2 + F y 2
where R e refers to the real part, and p is a positive dimensionless scalar number defined by the interpreter and is a constant greater than or equal to 2 [77]. This study used p = 3 to yield the best results [41,46,78].

3.2.6. Improved Logistic Filter (IL)

Another method introduced by Ref. [79] is based on the logic function of analyzing signals [80] to balance differential signals, using maxima to delineate the horizontal source boundaries. This is called the improved logic function (IL) and is represented by the following formula:
I L = 1 1 + e x p p R H G 1 + 1
where R H G is the ratio of the vertical gradient to the horizontal gradient amplitude of HG, given by the equation formula:
R H G = H G z H G x 2 + H G y 2
and p is a normal number defined by the interpreter. Model validation shows that an p -value between 2 and 5 will yield the optimal results [79].

3.2.7. Constrained Modelling of 2.5D Gravity Profile

The modelling technology of the 2.5D gravity anomaly profile is an important method for identifying structural features, stratigraphic densities, and rock mass distributions. This method employs a group of 2.5D prisms to simulate underground geological body structures with different densities. The technique combines model parameters modified through human-machine interactions and automatic computer iterative calculation to invert and forward the gravity anomalies of the profile. Moreover, the methodology involves forward calculating gravity field modelling through human-computer interaction and nonlinear optimization inversion solutions. A nonlinear optimization method is based on linearizing the inversion residual objective function, which applies the generalized inverse theory and solves the linear equations using singular value decomposition. Thus, this process yields physical properties and morphological corrections of the model, which are then updated to fulfill the inversion purpose. In practice, we first construct the initial geometry density model using preliminary geometric modelling obtained from seismic data and initial physical property information. The geometric and physical parameters of the model are then iteratively modified by using the residual between the measured gravity and the forward gravity. When the residual between the measured gravity and the forward gravity of the initial model is gradually reduced to the set threshold, the modification is stopped, and the geometric shape and physical properties of the model are obtained. Finally, the technique forms the gravitational geological interpretation profile in combination with the existing geological data.

3.2.8. Regression Analysis (RA)

The Parker-Oldenburg interface inversion method [81,82] is widely used to estimate the continuous density interface of horizontally uniform density strata; however, the stability of this method significantly decreases in the presence of complex tectonic structures. Since the Cenozoic sediments remain stable in the study area, the fluctuation and physical properties of strata change insignificantly. Therefore, the depth of the Cenozoic interface is calculated by the Parker-Oldenburg inversion method. Nevertheless, the Mesozoic–Paleozoic structures are characterized by complex features with numerous faults, and the basement fluctuation and physical properties across the north-south direction are significantly different; thus, the Parker-Oldenburg inversion method is not applicable. RA is a simple and effective method for calculating strata interface inversion, which is ideal for use in areas with complex structures and a lack of constraints. Refs. [39,83] used RA to calculate the basement depth of the Tobago basin and Pannonian basin, respectively, achieving good results. We found that the Bouguer gravity anomalies exhibited a significant correlation with the basement depth in the study area. Consequently, we utilized RA to estimate the basement interface of the study area and further acquire the Mesozoic–Paleozoic thickness.

4. Results and Analysis

4.1. Characteristics and Geological Significance of Gravity and Magnetic Anomalies

4.1.1. Characteristics and Geological Significance of Bouguer Gravity Anomaly

The Bouguer gravity anomaly (Figure 3) indicates that the study area exhibits anomaly zoning characteristics; the northern part has high gravity anomaly features, while the southern part has lower values. Notably, the edge regions of the study area display large-area mass high anomaly values, while the basin anomalies show low values. Moreover, the high and low anomalies exhibit significant fluctuation, with an amplitude contrast of 64 mGal. Furthermore, different sizes of horizontal gradient zones form apparent zoning characteristics, which mainly trend to the NE direction, as well as locally NW, near-EW, and near-SN directions. Based on the shape of the anomaly and the gradient zone range, it can be divided into three gravity anomaly zones: the western complex anomaly zone (I), the central high anomaly zone (II), and the eastern high–low alternating anomaly zone (III). These are generally similar to the zoning results of [52].
The western complex anomaly zone (I) is in the eastern part of the southwestern Shandong Uplift Fold Belt. It is characterized by low regional anomalies, accompanied by alternating high and low anomalies locally. In addition, the primary anomaly trend is towards the NE direction, with NW trending anomalies locally present. According to Ref. [84], the NE trending anomalies stem from the large-scale strike-slip activity of the TLFZ, while the NW trending anomalies are due to the tectonic transition from extrusion to tension. Hence, by analyzing the configuration and orientation of extensive gravity anomalies on land, the evolution of the regional tensile stress field, and the alteration of the strike-slip direction within the TLFZ, we infer that the NE trending structures likely formed at an earlier stage, whereas the NW trending tectonic deformations emerged at a relatively later stage.
The central high anomaly zone (II) is located in the holding area of TLFZ and JXFZ, and the overall anomaly trend is in the NE direction, with a regional high–low interphase distribution. A high anomalies area predominates this anomalies zone, and the anomaly shapes manifest wide and gentle features and large amplitudes. Low anomalies along Rizhao–Qingdao–Qianliyan–Rongcheng are mainly composed of mass low anomaly traps and NE trending beaded low anomalies, which roughly correspond to the Sulu ultra-high pressure (UHP) metamorphic belt. Large igneous rocks are in this anomaly area, and eclogites are exposed in many places on the surface (Figure 1b). Therefore, the consensus is that the positive anomaly zone may be the evidence of collision and splicing between the SKP and LYP, combined with the joint geological interpretation results of the wide-angle seismic profile velocity model and gravity [32].
The eastern high-low anomaly interphase zone (III) is located southeast of JXFZ, which is the principal research goal. The anomalies in this area are characterized by large-area regional low anomalies and the alternate distribution of high and low anomalies in part. In light of the anomaly characteristics, it can be further divided into the Northern Basin of SYS (NBSYS) anomaly area ( 1 ) and the Middle Uplift of SYS (MUSYS) anomaly area ( 2 ) (Figure 3). In the NBSYS ( 1 ), the gravity anomalies mainly present as low, and the anomaly trends mostly show NE–NEE and near-EW directions. The gradient zones are arranged in parallel, resembling a string of beads, and are alternatingly distributed. The massive low anomaly traps are apparent. The anomalies converge towards the west and radiate towards the northeast, producing a ‘trumpet-shaped’ figure that opens to the east. However, the overall anomalies of the MUSYS ( 2 ) manifest as relatively stable. They are mainly characterized by the gentle block high anomalies, and the anomaly gradient zone is rarely developed or undeveloped. In addition, the anomaly trends of the MUSYS gradually turn from NNE (NE) to SN directions, and are separated by a near-SN trending low anomaly in the middle. The anomaly trends in the west are primarily in the NE direction, and the anomalies in the east turn into NW and near-EW directions. In general, it is considered that the structural deformation of the MUSYS is weaker than that of the NBSYS. Therefore, combined with the seismic profiles [17,85], it is revealed that the tectonic stress decreases along the SN direction and gradually turns to EW-trending tectonic action in this area.

4.1.2. Characteristics and Geological Significance of the Magnetic Anomaly

The magnetic RTP anomaly of the study area (Figure 4) reveals belt-shaped anomalies mainly trending toward the NE direction in the northwest part. Moreover, the local anomalies in the northwest part manifest NW directions. Conversely, blocky-shaped anomalies characterize the southeast region, and the trend of the anomaly is complex and variable. In addition, the anomalies in the depression of the sea area present low-negative magnetic anomalies surrounded by high-positive anomalies. Overall, high-positive and low-negative magnetic anomalies change visibly and display apparent zoning. Similarly, the magnetic anomaly can be divided into four anomaly zones: a low-negative anomaly zone in East Shandong (I), a high-positive anomaly zone in the Sulu UHP (II), a central low-negative anomaly zone (III), and an eastern high-positive anomaly zone (IV) (Figure 4a). However, notable disparities exist between the zoning outcomes presented by [41] (Figure 4b) and our findings, particularly in the eastern region of the SYS. Fundamentally, the division in this study is identified by using the characteristics of the magnetic anomaly gradient zones. The results show that the magnetic anomaly zoning exhibits an east-west division in the sea area, while the zoning results reported by [52] show north-south zoning along the NEE direction.
The low-negative anomaly area in eastern Shandong (I) is located northwest of the Wulian–Jimo line. The magnetic anomalies in this area primarily manifest as varying sizes of positive anomaly traps on the low-negative background field, and the anomaly ridges show NE and NW directions. On the strength of the susceptibility (Figure 2c,d), the basement of this area is composed of a set of weak or no-magnetization pre-Cambrian and Archean–Neoproterozoic shallow metamorphic rock series. The magnetization of the overlying Cenozoic, Mesozoic Laiyang Group, and Wangshi Group is either weak or negligible. Thus, these strata (rocks) form the background of negative magnetic anomalies. In contrast, the magnetization of volcaniclastic rocks of the Cretaceous Qingshan Group is strong. It is inferred that the small-scale high-positive magnetic anomalies are caused by the volcaniclastic rocks of the Qingshan Group, basic and ultrabasic complexes, including amphibolite, and amphibolite gneiss with strong magnetization.
The high-positive anomaly zone in the Sulu UHP (II) is a conspicuous NE trending belt-shaped high-positive magnetic anomaly zone along the line of Rizhao-Qingdao-Rongcheng, which comprises multiple local positive anomaly traps. Under the influence of the Indosinian-Yanshan Movement, the mantle thermal material upwelled, and the basement continuously uplifted, resulting in the Paleoproterozoic–Archean deep metamorphic–shallow metamorphic basement being exposed to the surface (Figure 1). The Paleozoic strata above the basement were eroded and denuded, and the Mesozoic–Cenozoic was incompletely developed. Drilling results revealed that continental clastic sediments and pyroclastic sediments of the Early Cretaceous Qingshan Group and the Late Jurassic Laiyang Group were formed in this area. Furthermore, multi-period igneous rocks have developed in this area since the Yanshanian period. Consequently, it is speculated that the metamorphic basement and multi-period igneous rocks cause this high-positive magnetic value zone. However, large areas of high magnetic and low gravity anomalies have an excellent negative correlation in the southwest of this high-positive anomaly zone. We deduce that the low gravity anomalies are caused by the colossal low-density granite-like rocks overlying the high-density basement.
The central low-negative anomaly zone (III) is a broad and gentle low-negative magnetic anomaly area extending from Lianyungang–Xiangshui to the northeast sea of the SYS, trending in a NE direction. It is deduced that the anomaly zone is comprehensively caused by the combination of the weak susceptibility of the Sinian Yuntai Group, the non or weak susceptibility of strata in the NBSYS and surrounding areas, and the strong susceptibility of the crystalline basement composed of the underlying pre-Sinian metamorphic and igneous rocks. In contrast, small-scale low-positive anomalies sporadically distributed in part of the areas are caused by various intrusive rocks, igneous rocks, and pyroclastic materials formed in the basement or sedimentary layers by magmatic activities. In addition, the low magnetic anomaly on the east side of Qianliyan Island indicates that there are few volcanic intrusions and that the basement is not visibly damaged.
The eastern high-positive anomaly zone (IV) is located east of the study area, which is divided into two sub-anomaly zones in the north and south, with the line between well HH-2 and well HAEMA-1. Numerous NEE trending positive magnetic anomaly traps exist in the north ( 1 ), principally caused by the medium to strong magnetism of some sandstones formed by thermal fluid alteration. Cretaceous volcanic rocks and Cenozoic basalts were revealed in well HAEMA-1, which indicated that the sedimentary layers might be destroyed in this area. In addition, there are large-scale positive anomalies with unobvious trends and gentle changes in the south ( 2 ), but trap centres with negative anomalies are developed locally. According to drilling and seismic data, a large set of Cretaceous basalt has been discovered in the eastern part of the SYS. Especially in the east well KACHI-1, a layer of rhyolitic tuff was drilled in the Lower Cretaceous sandstone in the 2362–2368 m segment, and cryptocrystalline mid-basic volcanic rocks were found in the lower part. Furthermore, there are also light grey and light green grey granites on the south side of the NBSYS and the east side of the MUSYS. Therefore, we speculate that the massive positive anomaly in the southeast of the study area may be caused by the thinning of the lithosphere, materials with a high basic composition formed by the upwelling of thermal mantle materials, and igneous rocks intruding into the shallow layer during the subduction of the Pacific Plate.

4.2. Fault Structure

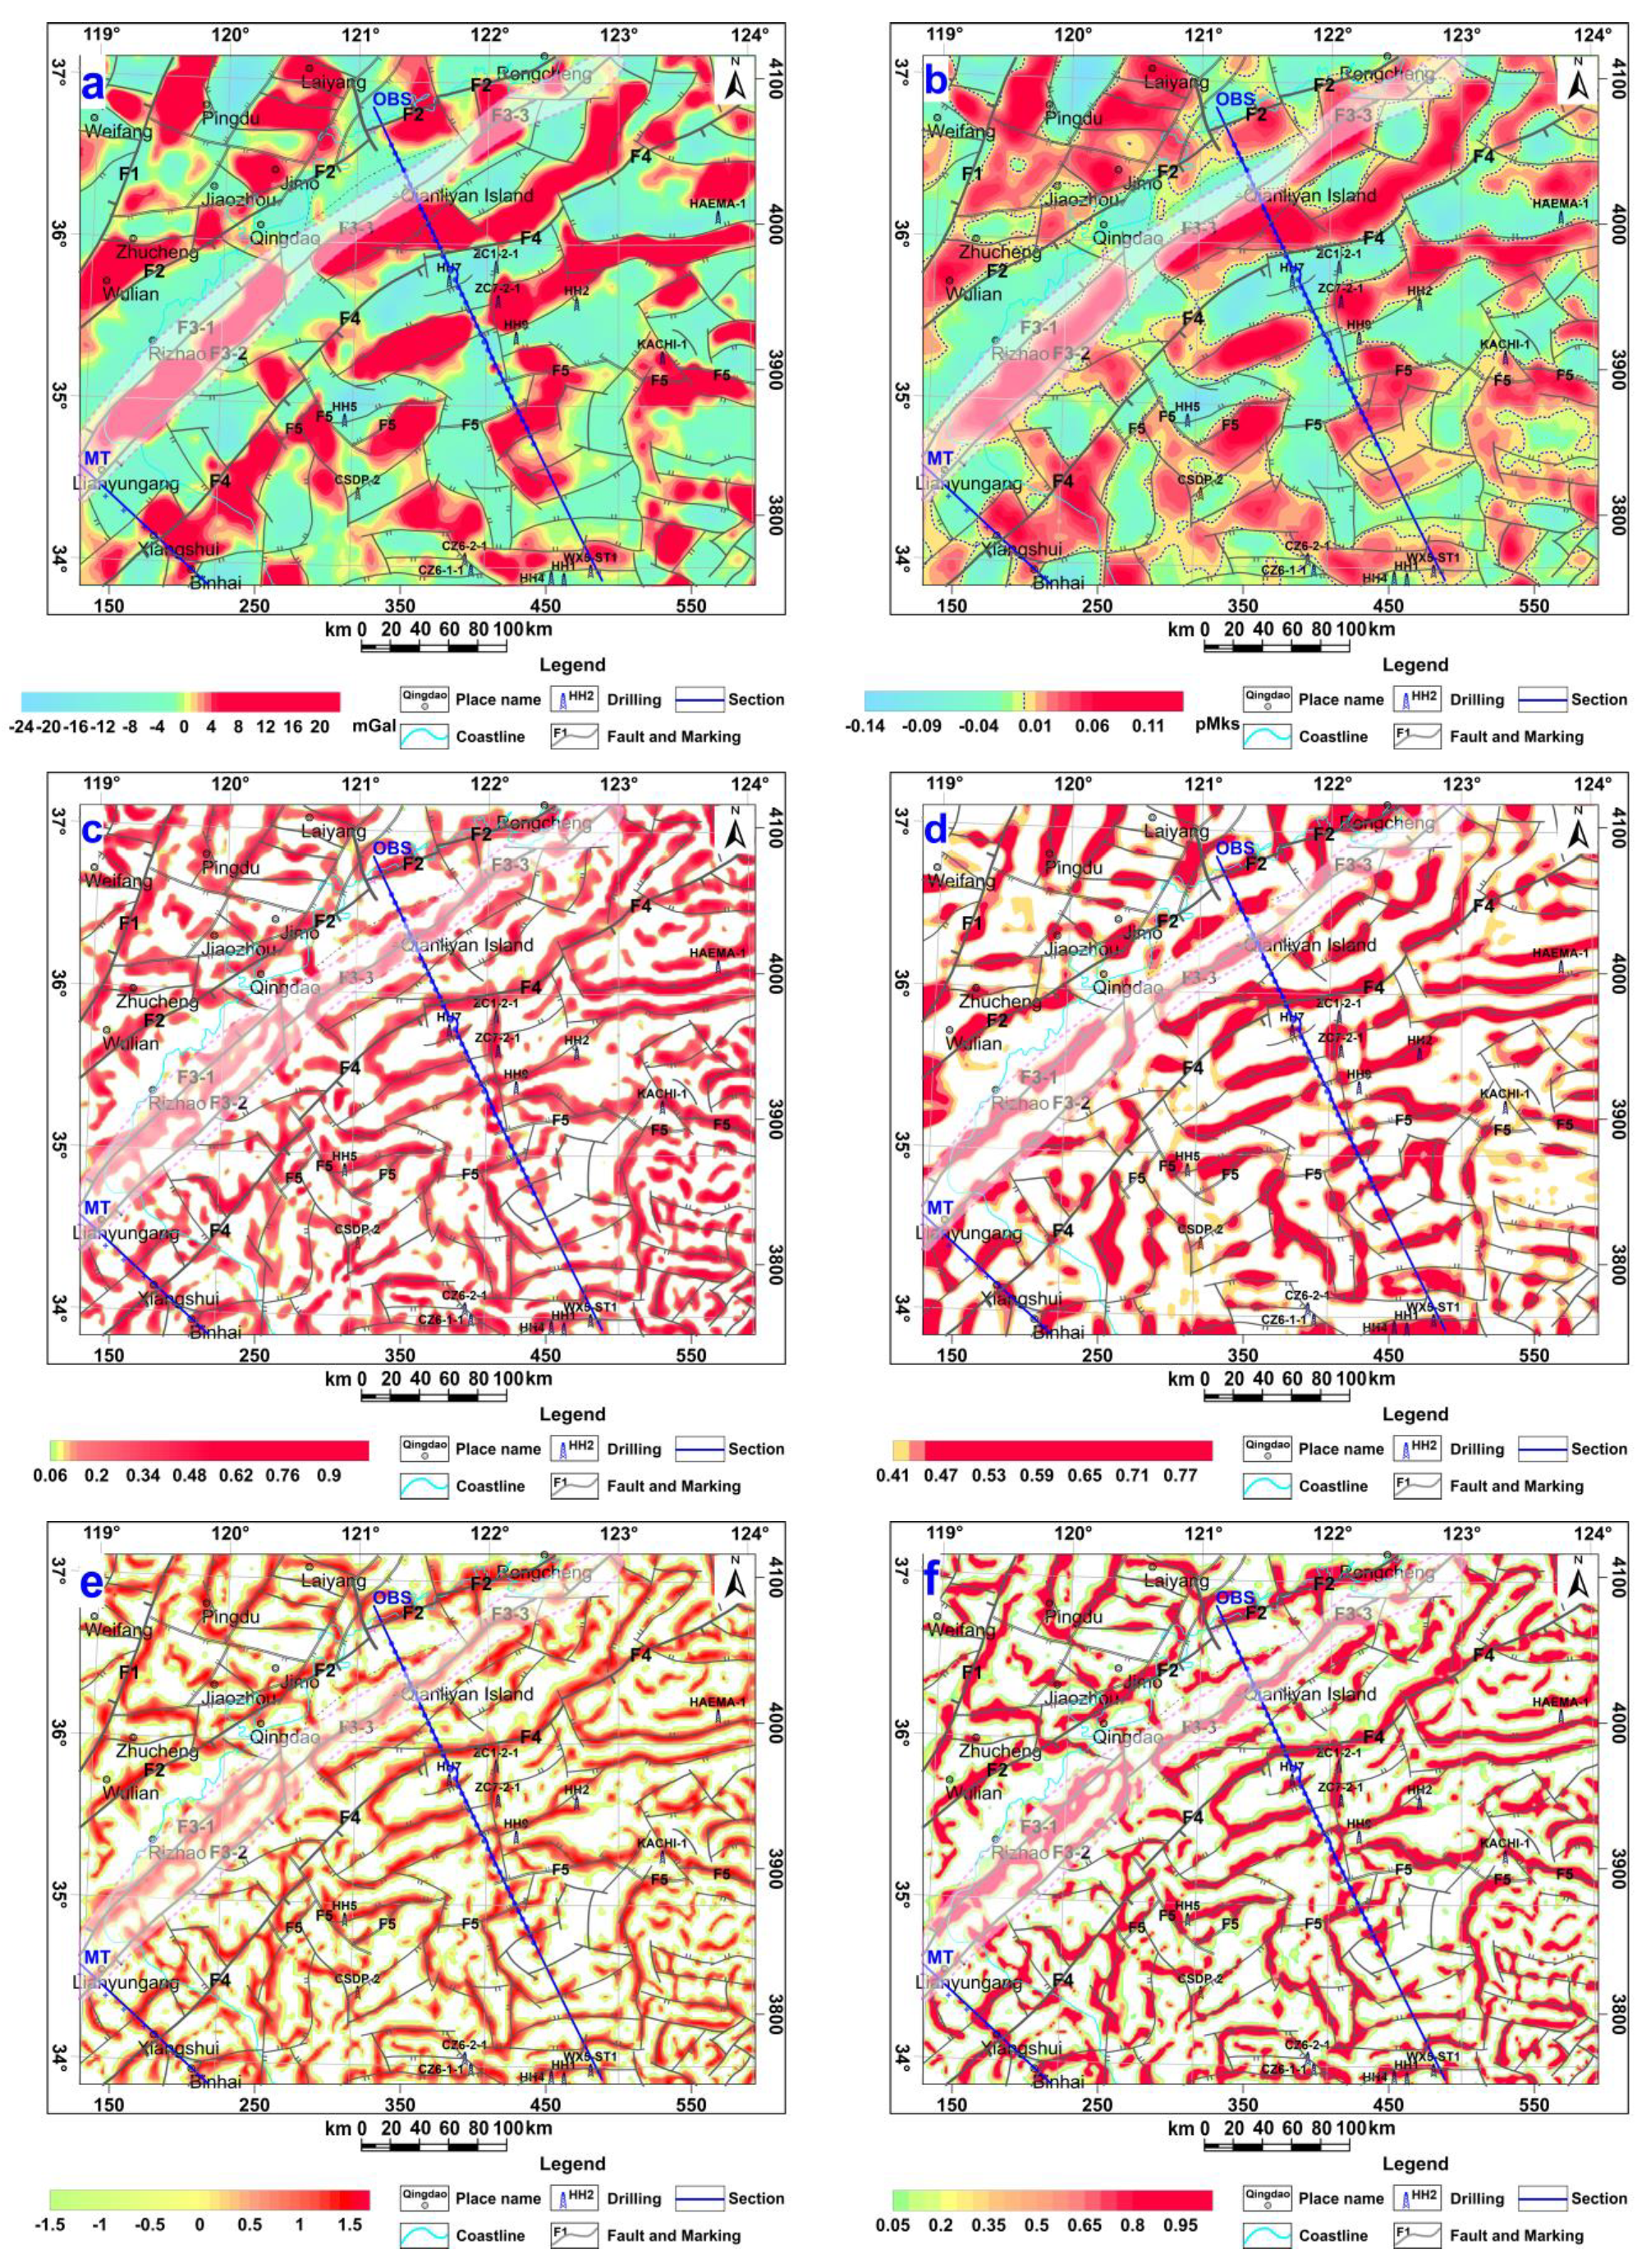
To effectively extract the linear anomaly information of the fault structures, the gravity and magnetic data are processed by derivative calculation and numerical statistics edge detection methods, such as VSDR (Figure 5b), NVDR-THDR (Figure 5c), NSTD (Figure 5d), EGHA (Figure 5e) and IL (Figure 5f). The linear structure information of various anomalies is extracted, and a wealth of fault structure information is obtained. After comprehensive analysis and comparison, NVDR-THDR, NSTD, EGHA, and IL anomalies exhibit higher resolution, sharper anomaly peaks, better linear structure continuity, and some weak linear anomaly information was strengthened, which is superior to VSDR. The fault trends reflected by this linear anomaly information are relatively clear and effective. The research results (Figure 5) show that the linear gravity anomaly information in the NE (NEE) directions and near-EW directions shows wide anomaly gradients, large peak anomaly zones, and preferable anomaly continuity; the NW (NWW) and near-SN trending linear gravity anomaly information shows narrow anomaly gradients, blurred traces of anomaly peaks, poor anomaly continuity and scattered distribution. Consequently, the fault structures system of the study area is redetermined (Figure 5), in combination with the results of geopotential field separation (Figure 5a), regional geological structure and tectonic evolution characteristics, as well as seismic, geology, and other previous research results [17,22,23,24,49,52,57].
Comparing the faults identified in this study with those previously delineated by researchers [17,49] and seismic profiles [17,21,22,23,24,30,31,32,85], the results of our fault division exhibit greater specificity and demonstrate excellent consistency with the seismic profiles and established structures. Furthermore, these findings align with the multi-period structural evolution and tectonic deformation characteristics of the study area. Thus, the results of this study could be more reliable and superior to previous research results.
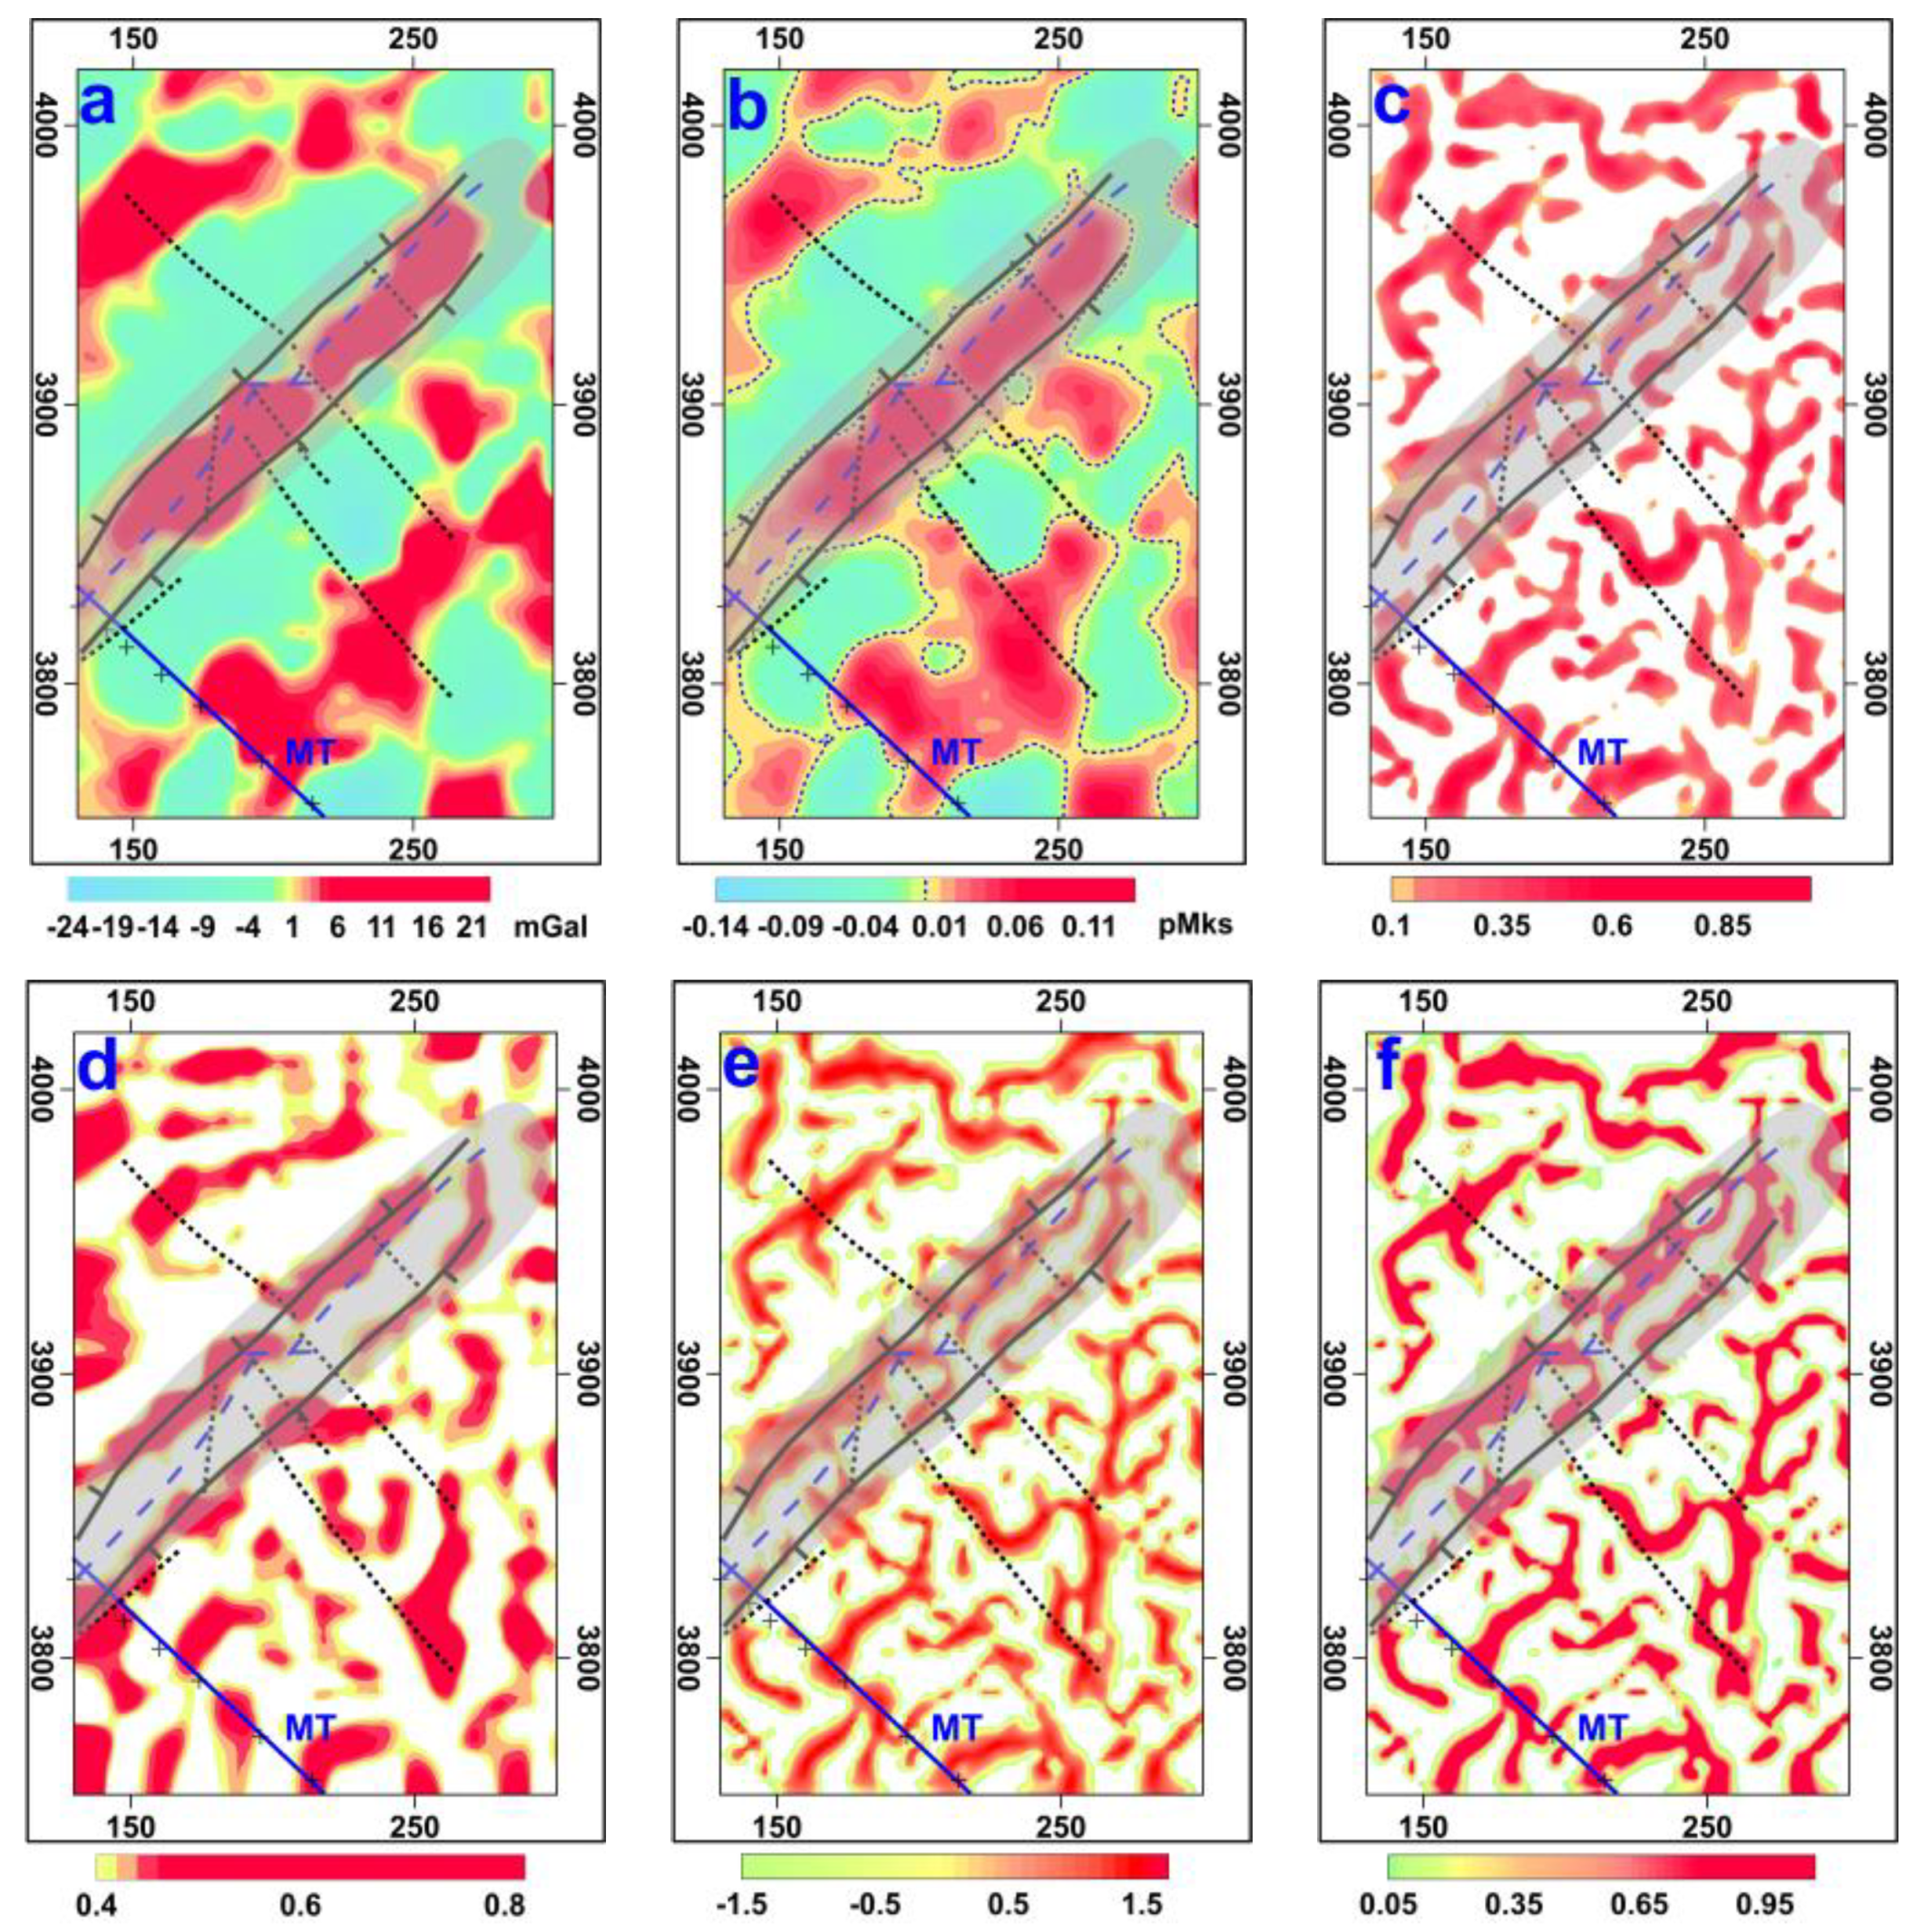
Using the F3 Lianyungang–Qianliyan fault zone (LQFZ) (F3-1, F3-2, F3-3, the shaded area in Figure 5) as an example, the fault zone shows a clear gravity anomaly gradient zone in the residual gravity anomaly (Figure 5a), with NE (NEE) directions. The north and south sides in the southwest segment of F3 are shown as parallel anomaly gradient belts, and the middle segment anomalies show negative gravity anomalies with NW directions and apparent dislocation traces. Additionally, F3 shows zero lines of VSDR; the zero lines on the north side of F3 exhibit reasonable continuity, but the continuity on the south side of the southwest segment is poor, and the zero lines in the middle segment are staggered. On the northern side of F3, the lineament anomaly peak belts of NVDR-THDR, NSTD, EGHA, and IL are also wide, conspicuous, and greatly continuous on the north side of F3. In contrast, the anomaly trends on the south side of the southwest segment of F3 are variable, with linear anomaly discontinuity. The anomaly trends are disconnected on the middle segment of F3, presenting NWW trending anomaly peak belts. Therefore, according to the analysis results of the various anomalies, the trend of F3 is in a NE (NEE) direction and is divided into three faults, and the southwest segment is divided into two branches. F3 is shown in both the interpretation results of MT [86] and the wide-angle seismic profile [32] (Figure 6); it is considered that the division result of F3 is reasonable and credible. Thus, the reliability of these division results is better than that of the previous fault results (Figure 7).
The MT interpretation results (Figure 6a) indicate apparent massive high-resistance bodies on both sides of the southwest segment of F3. The volume of the high-resistance body on the north side is more significant than that on the south side, and there is a low-resistance zone of nearly 20 km between the two high-resistance bodies. The interpretation results of the wide-angle seismic profile (Figure 6b) demonstrate that the V p wave is twisted northwest of F3, and there is a low-speed body in the southeast of F3. The crust thickness on the northwest side of F3 is greater than that on the southeast side. Based on the comprehensive analysis results, we believe that the two branches on the north side of F3 are the major faults, cutting off the Moho interface and controlling the stratigraphic distribution and structural boundary, which is the boundary fault between the Jiaonan Uplift (JNU) and Qianliyan Uplift (QLU) (Figure 6). In comparison, F3-2 on the south side of F3 is a secondary fault that controls the rocks and structures in the JNU.
Based on the aforementioned analyses, we assert that the faults can be effectively identified by combining multiple lineament structural anomaly detection methods. This application is particularly effective in complex structural areas, providing superior application and powerful adaptability. Moreover, this approach enables accurate determination of the plane extension characteristics and controlling the range of faults while facilitating an understanding of the movement patterns and tectonic frameworks.
The understanding of the newly determined faults system is as follows:
(1) The fault structures are numerous, and their development varies in scale. In addition, faults with varying directions interlace and intersect, creating a composite fault tectonic system that exhibits prominent hierarchical and regional features and multi-period activities. These characteristics are consistent with previous studies in the area.
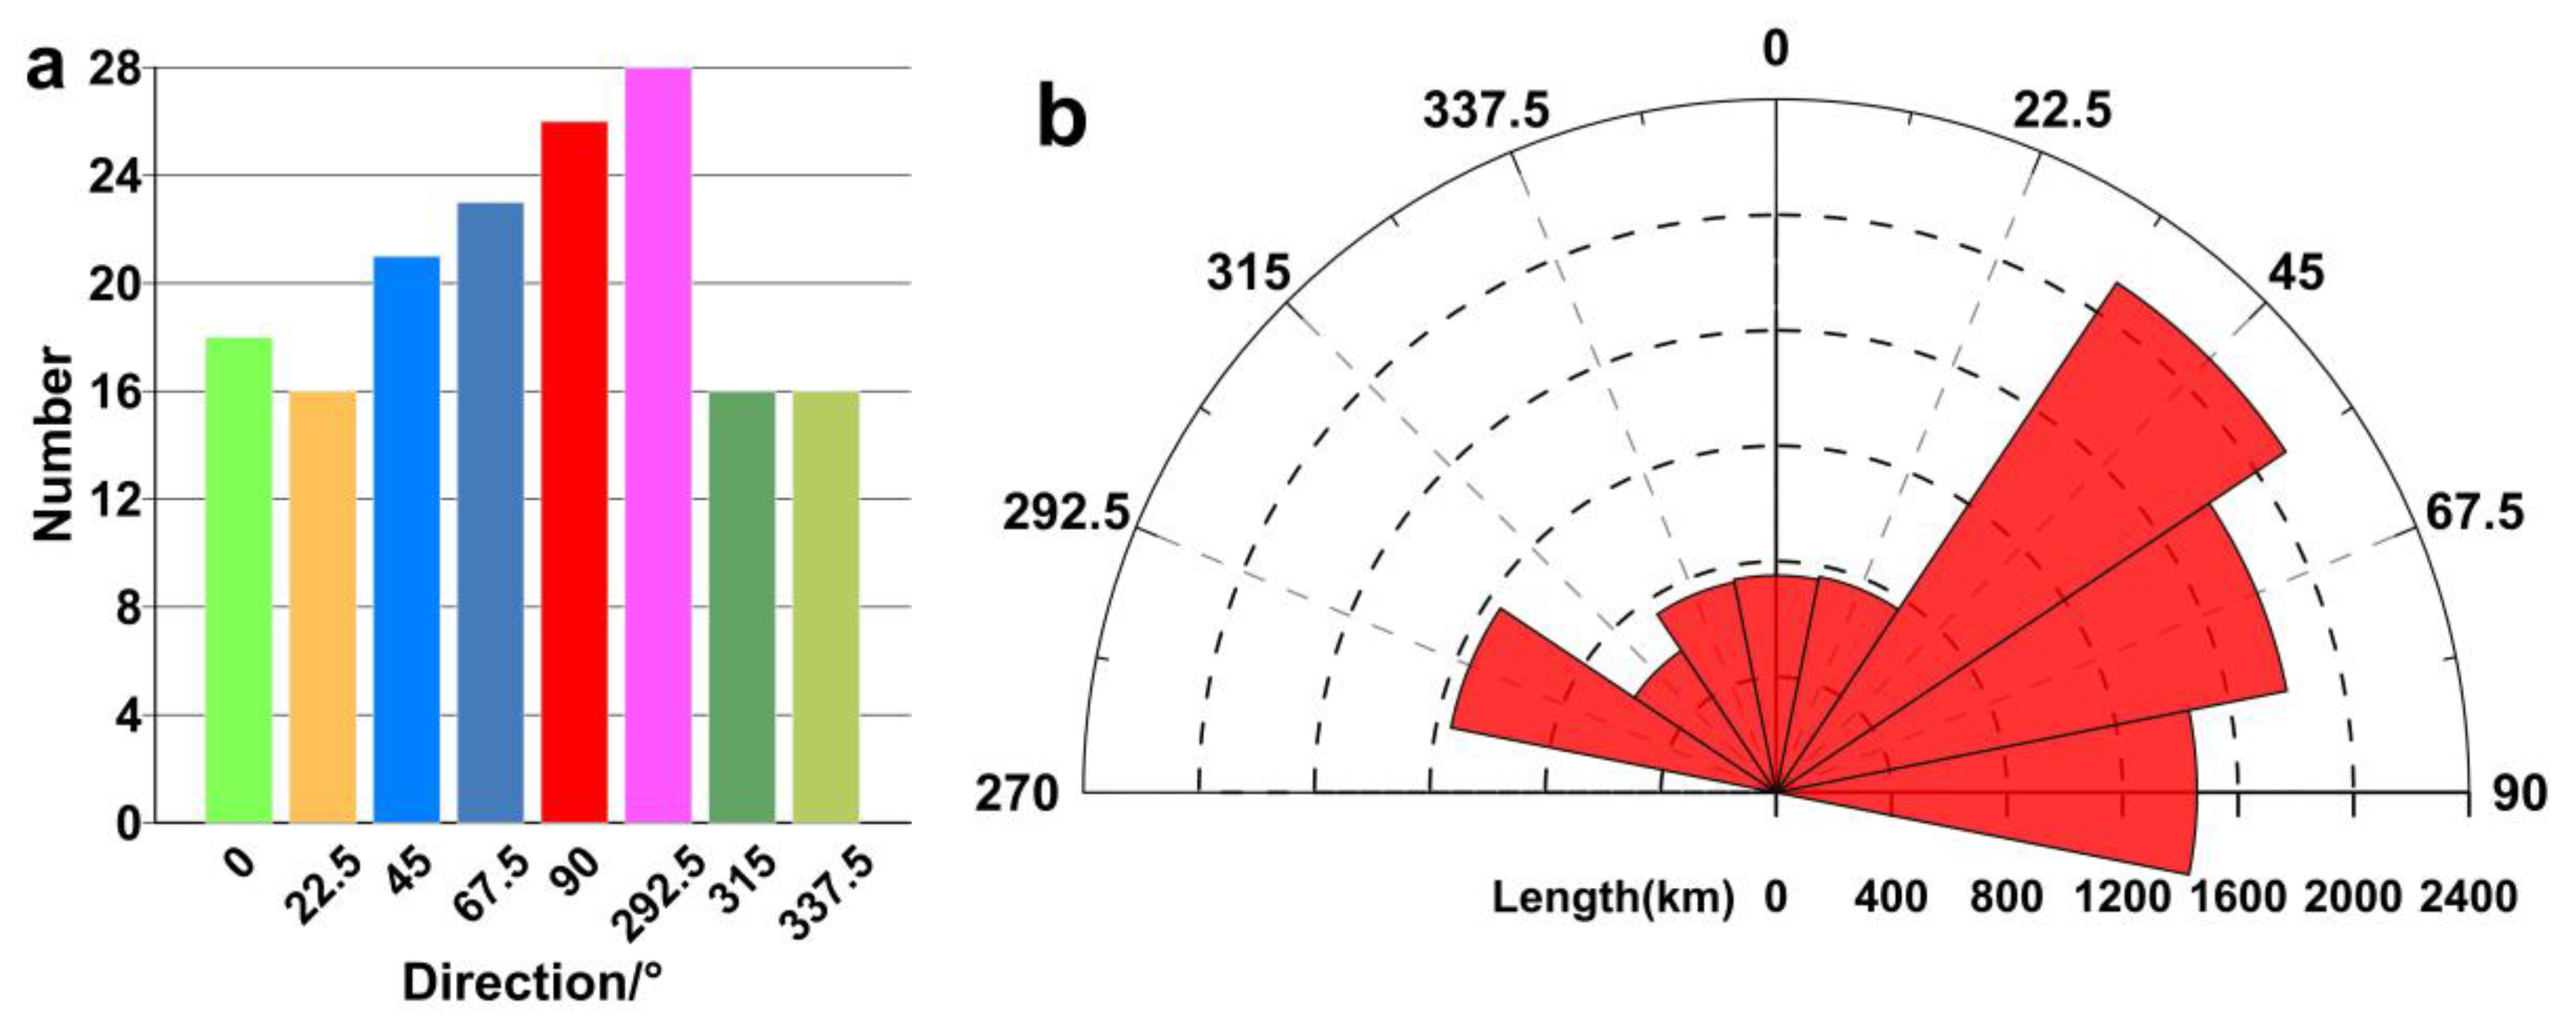
(2) The statistical analysis of faults with different trends (Figure 8) indicates that NE (NNE) trending faults are the dominant faults in terms of long extension distances and large scales. However, NW (NWW), near-EW, and near-SN trending faults exhibit more minor scales but are more numerous and widely distributed, with shorter extension distances. Furthermore, the major faults in the NE (NEE) direction are typically cut off and staggered by the NW (NWW), near-EW, and near-SN trending faults, creating a “chessboard-type” structural system.
(3) Several NE (NEE) trending major faults are consistent with the structural trend of the study area. Comparing the data from the wide-angle seismic interpretation profile [32] and MT interpretation profile [86], these faults exhibit early formation times, multiple tectonic periods, considerable fault distances, and deep vertical extensions. They govern the main structural framework of the study area, controlling the stratigraphic distribution, structural trends, and major boundaries of each secondary structural unit. In contrast, the NW (NWW), near-EW, and near-SN trending faults exhibit substantially shallower vertical extensions. These faults are typically interpreted as the basement or sedimentary layer faults based on seismic profiles [17,85] and form control boundaries of secondary structures in different sizes. Additionally, there are numerous near-EW trending faults in the MUSYS, which form fault-block structures. This results in the secondary structural units alternating between sags and bulges along the near-EW direction. The study area is thus divided into zones along NE (NNE) direction and blocks in the EW direction.
(4) The fault structures in the region exhibit differences and imbalances influenced by multi-period tectonic activities and various dynamics. NE(NEE) trending faults are distributed throughout the area, while NW (NWW) trending faults are mainly concentrated in the northwest corner of the study area, the NBSYS, and the east and west sides of the MUSYS. Near-EW trending faults are primarily distributed in the western regions of the NBSYS and the MUSYS. The triangular structure of the area consists of NE(NEE), near-EW, and NW (NWW) trending faults. It is speculated that the regional stress presents a north-south hedging pattern in the SN direction, with the EW direction of the MUSYS central to this pattern. This results from the collision of the SKP-LYP and the left-strike slip activity of TLFZ, alongside the strong almost N-S compression of the Indosinian–Yanshan Movement during the pre-rift period. Consequently, from south to north, tectonic deformation weakens, and the strata become shallower, thus forming the triangular structure pattern caused by these specific regional tectonic stresses.
(5) A new understanding of the fault division results has been achieved. The southwest segment of F3 (LQFZ) is divided into two branches: the west branch is the major fault and serves as the boundary between the JNU and QLU, whereas the east branch is the secondary fault that acts as a stress adjustment and buffering fault in QLU. In addition, the fault results in the southern margin of the NBSYS differ from the results of the previous divisions and show northerly results in this analysis.
(6) Analysis of the surface geological map (Figure 1b) and seismic interpretation of igneous rocks from [87,88] revealed that the distribution of igneous rocks is controlled by NE (NEE) trending large regional faults. Moreover, the development of igneous or intrusive rocks in sedimentary layers is regulated by the junction of NW, near-EW, and NE (NEE) trending. Consequently, we speculate that the deep magmatic source area is connected by NE (NEE) trending deep faults. Furthermore, the magmatic activity around these faults is affected by multi-period tectonic movements.

4.3. 2.5D Gravity Modelling

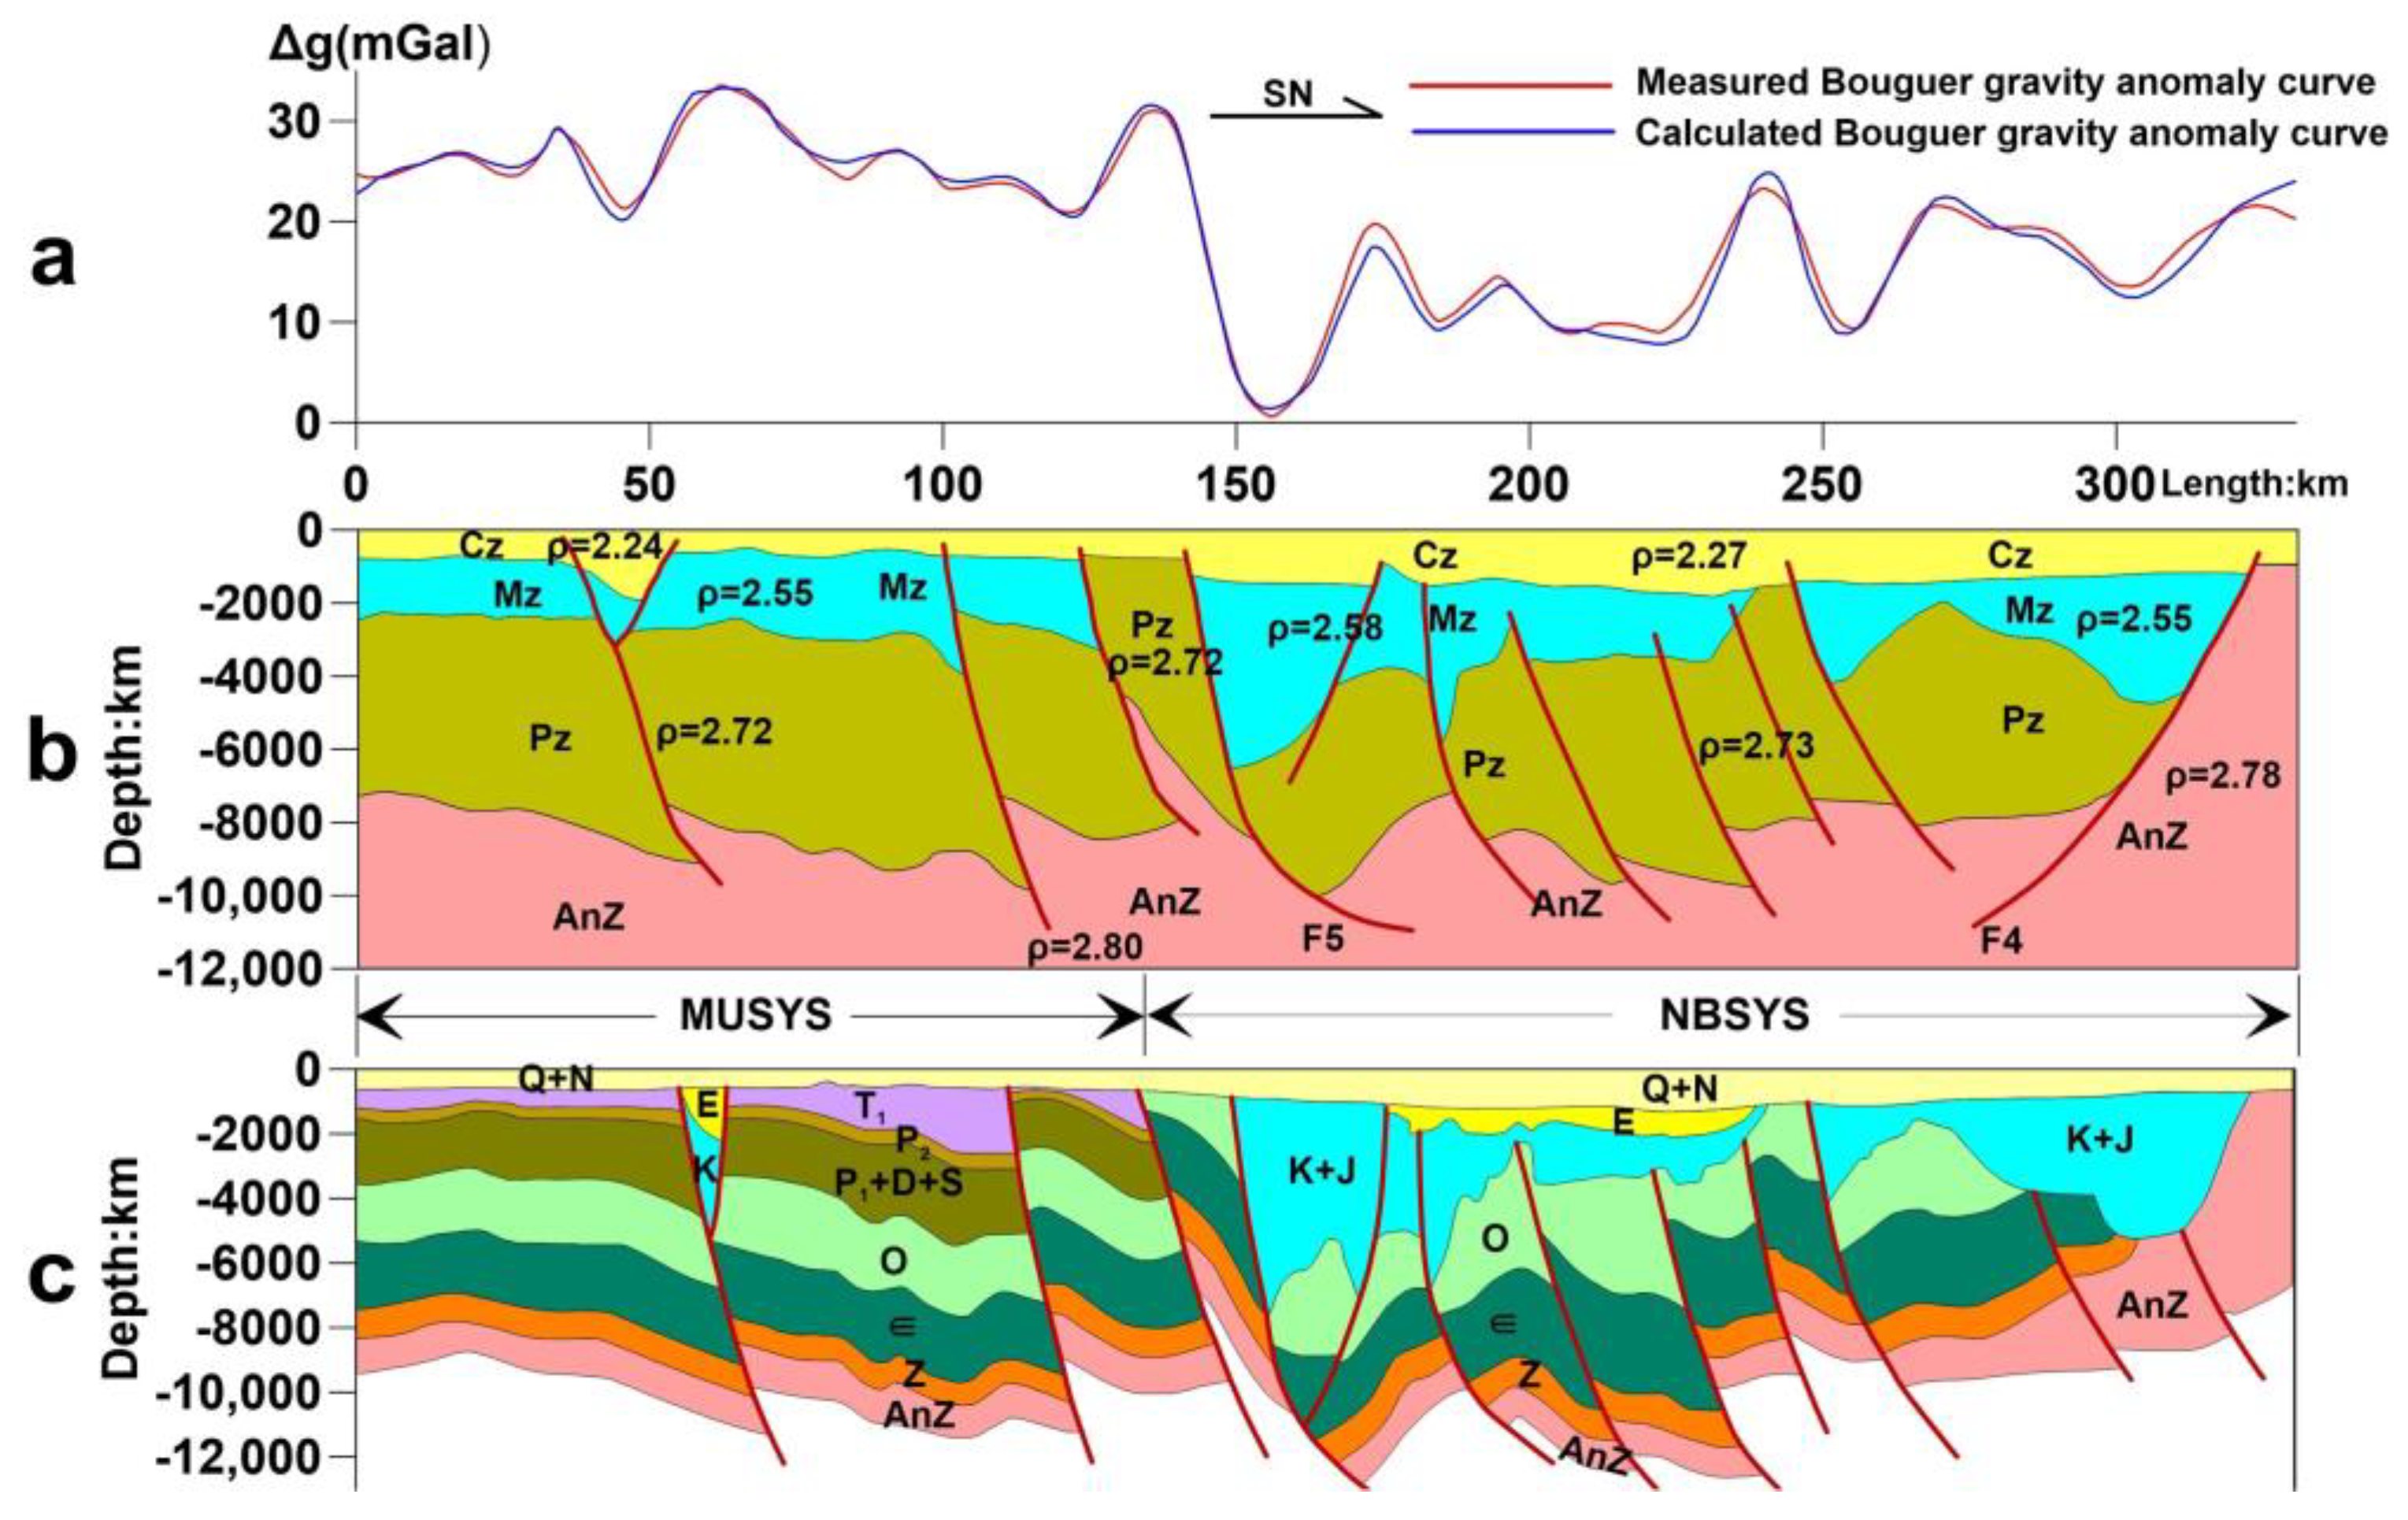
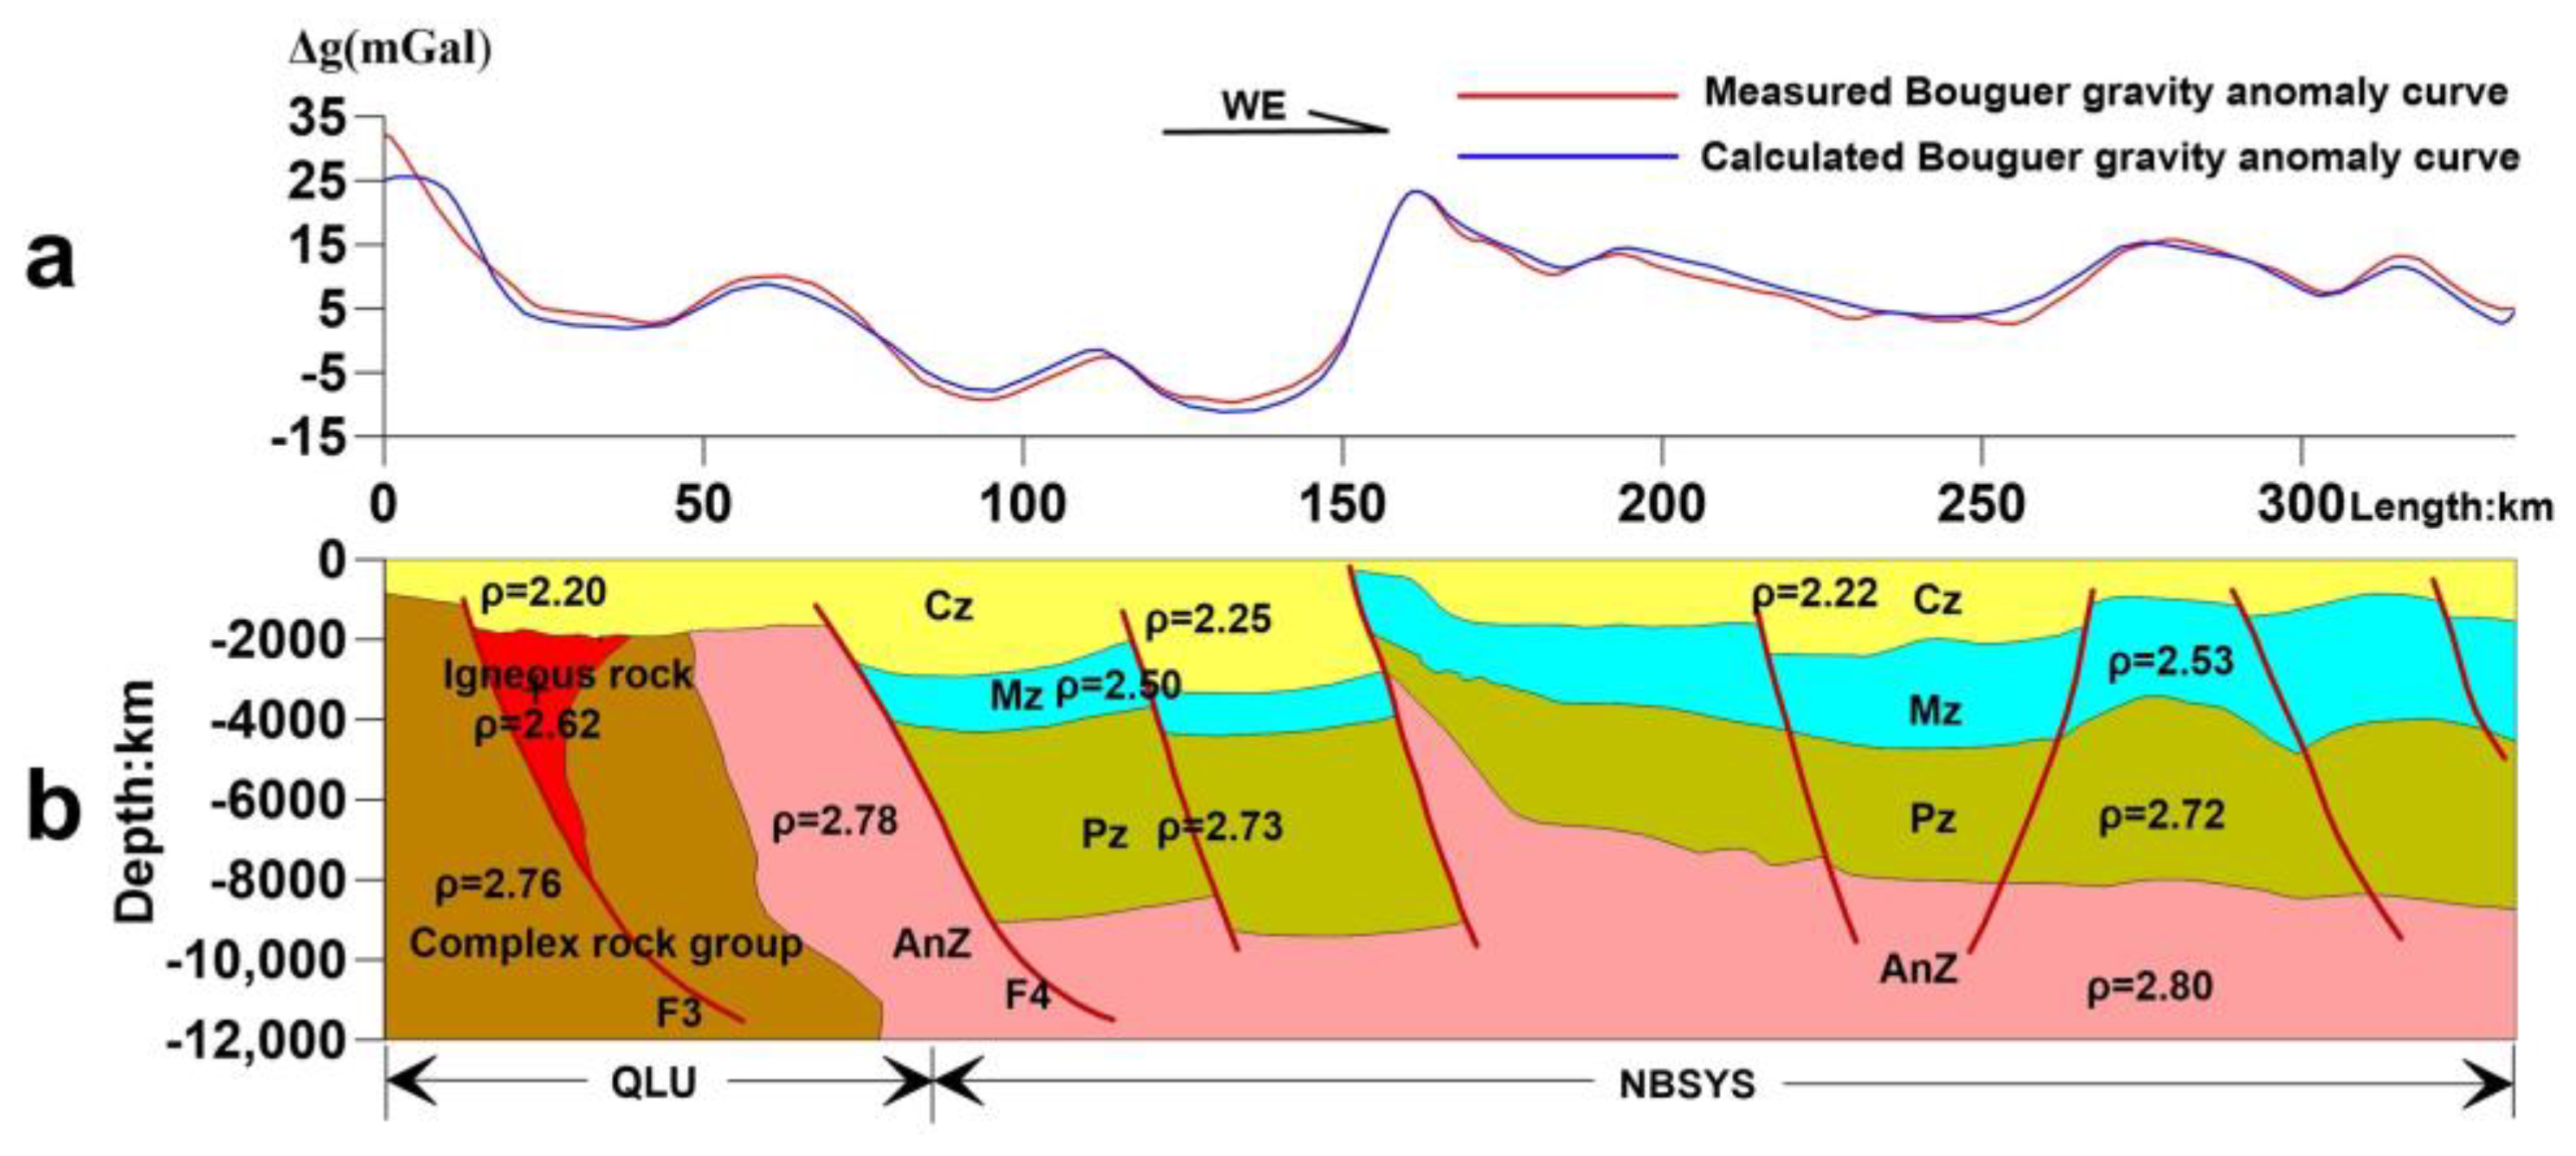
To further ascertain the characteristics of stratigraphic development and the relationship between structural units, the geometric constraints of the two seismic interpretation profiles XQ7-9 and HB09-5 are used (Figure 3 and Figure 4) in the gravity modelling. Also, the forward and inverse fitting of gravity anomaly is carried out (Figure 9 and Figure 10). (See Section 3.2.7 for the modelling process.) The calculated gravity anomaly is gratifyingly consistent with the measured anomaly. In addition, based on the known geological interpretation results, such as drillings and seismic profiles, an EW trending geological geometric constraint model (Figure 3 and Figure 4) is constructed, and gravity modelling is conducted (Figure 11).
The geological interpretation results of three gravity models are comprehensively analyzed (Figure 9, Figure 10 and Figure 11), and the structural features are as follows:
(1) High-positive gravities are primarily caused by the basement and the Paleozoic uplifts or bulges, the Mesozoic erosion, and the thin growth of the Cenozoic. In contrast, Low gravities are caused by the sedimentary layers with weak sedimentary diagenesis and low stratigraphic density in the Mesozoic–Cenozoic fault depressions, formed by the basement fault depression or faults.
(2) The QLU and JNU are pre-Sinian basement uplifts, where many large regional faults are developed and accompanied by magmatic rocks. Moreover, the Mesozoic is partly developed in local areas of the JNU, the partly faulted depression deposits of the QLU are thick, and the Cenozoic shows unconformity in the basement. Refs. [32,89] inferred that the QLU was a collision composite splicing zone between the SKP and YP based on seismic profiles. According to the characteristics of gravity and magnetic anomalies and the outcomes of gravity modelling, we conclude that the QLU and JNU belong to a part of the Sulu UHP belt, which represents the composite amalgamation zone between the SKP and YP collisional orogenic belts.
(3) The fault bulges or fault sags of the NBSYS are controlled by faults in the graben and half-graben types. Particularly, JXFZ is the primary controlling fault for the formation and development of the NBSYS, which controls the development of the northern fault sag. Furthermore, close to JXFZ, the sedimentary layers in the NBSYS are relatively thick, and it is the most developed in the north fault sag, which is a dustpan-shaped fault sag.
(4) The Cenozoic, Mesozoic, and Paleozoic are all widely developed in the SYS. In the NBSYS, the Paleozoic is widely distributed and thick but with significant formation fluctuations; the Mesozoic is widely distributed, but its continuity is generally poor, and there are substantial variations in strata thickness. These variations follow a pattern of gradual thickening from west to east while thinning or even absence can be observed in localized uplifted (bulge) areas. Especially with the central bulge zone as the boundary, the strata in the northwest part of the bulge zone are developed as a fault on the northwest segment and overlap on the southeast segment. However, the strata in the southeast part of the bulge zone are formed as northwest trending fault steps. The Cenozoic is well-developed in the whole basin, with good continuity and stable deposition, which however, fluctuates mainly in the form of a dustpan. In contrast, the Cenozoic–Mesozoic in the MUSYS is relatively thin, and the Mesozoic is absent or thin in some uplift (bulge) areas; however, the Paleozoic is thickly developed and stably subsided, and minor faults are relatively extensive in the Paleozoic.
(5) From the undulation characteristics of the basement and Paleozoic and the absence of the Mesozoic, we believe that the strata distribute in a complex, and the basement fluctuates significantly in the study area. In the pre-Cenozoic period, S-N trending tectonic stress weakened and gradually turned into E-W trending tectonic action in the study area. As a result, the Northern Basin of SYS (NBSYS) experienced more intense tectonic deformation than the Middle Uplift of SYS (MUSYS). In addition, the intensity of the N-S trending tectonic movement is more significant than that in the W-E direction, and the eastern basement is more stable than the western basement.

4.4. Basement Interface Inversion and Hydrocarbon Prospect Area

4.4.1. Interface Inversion

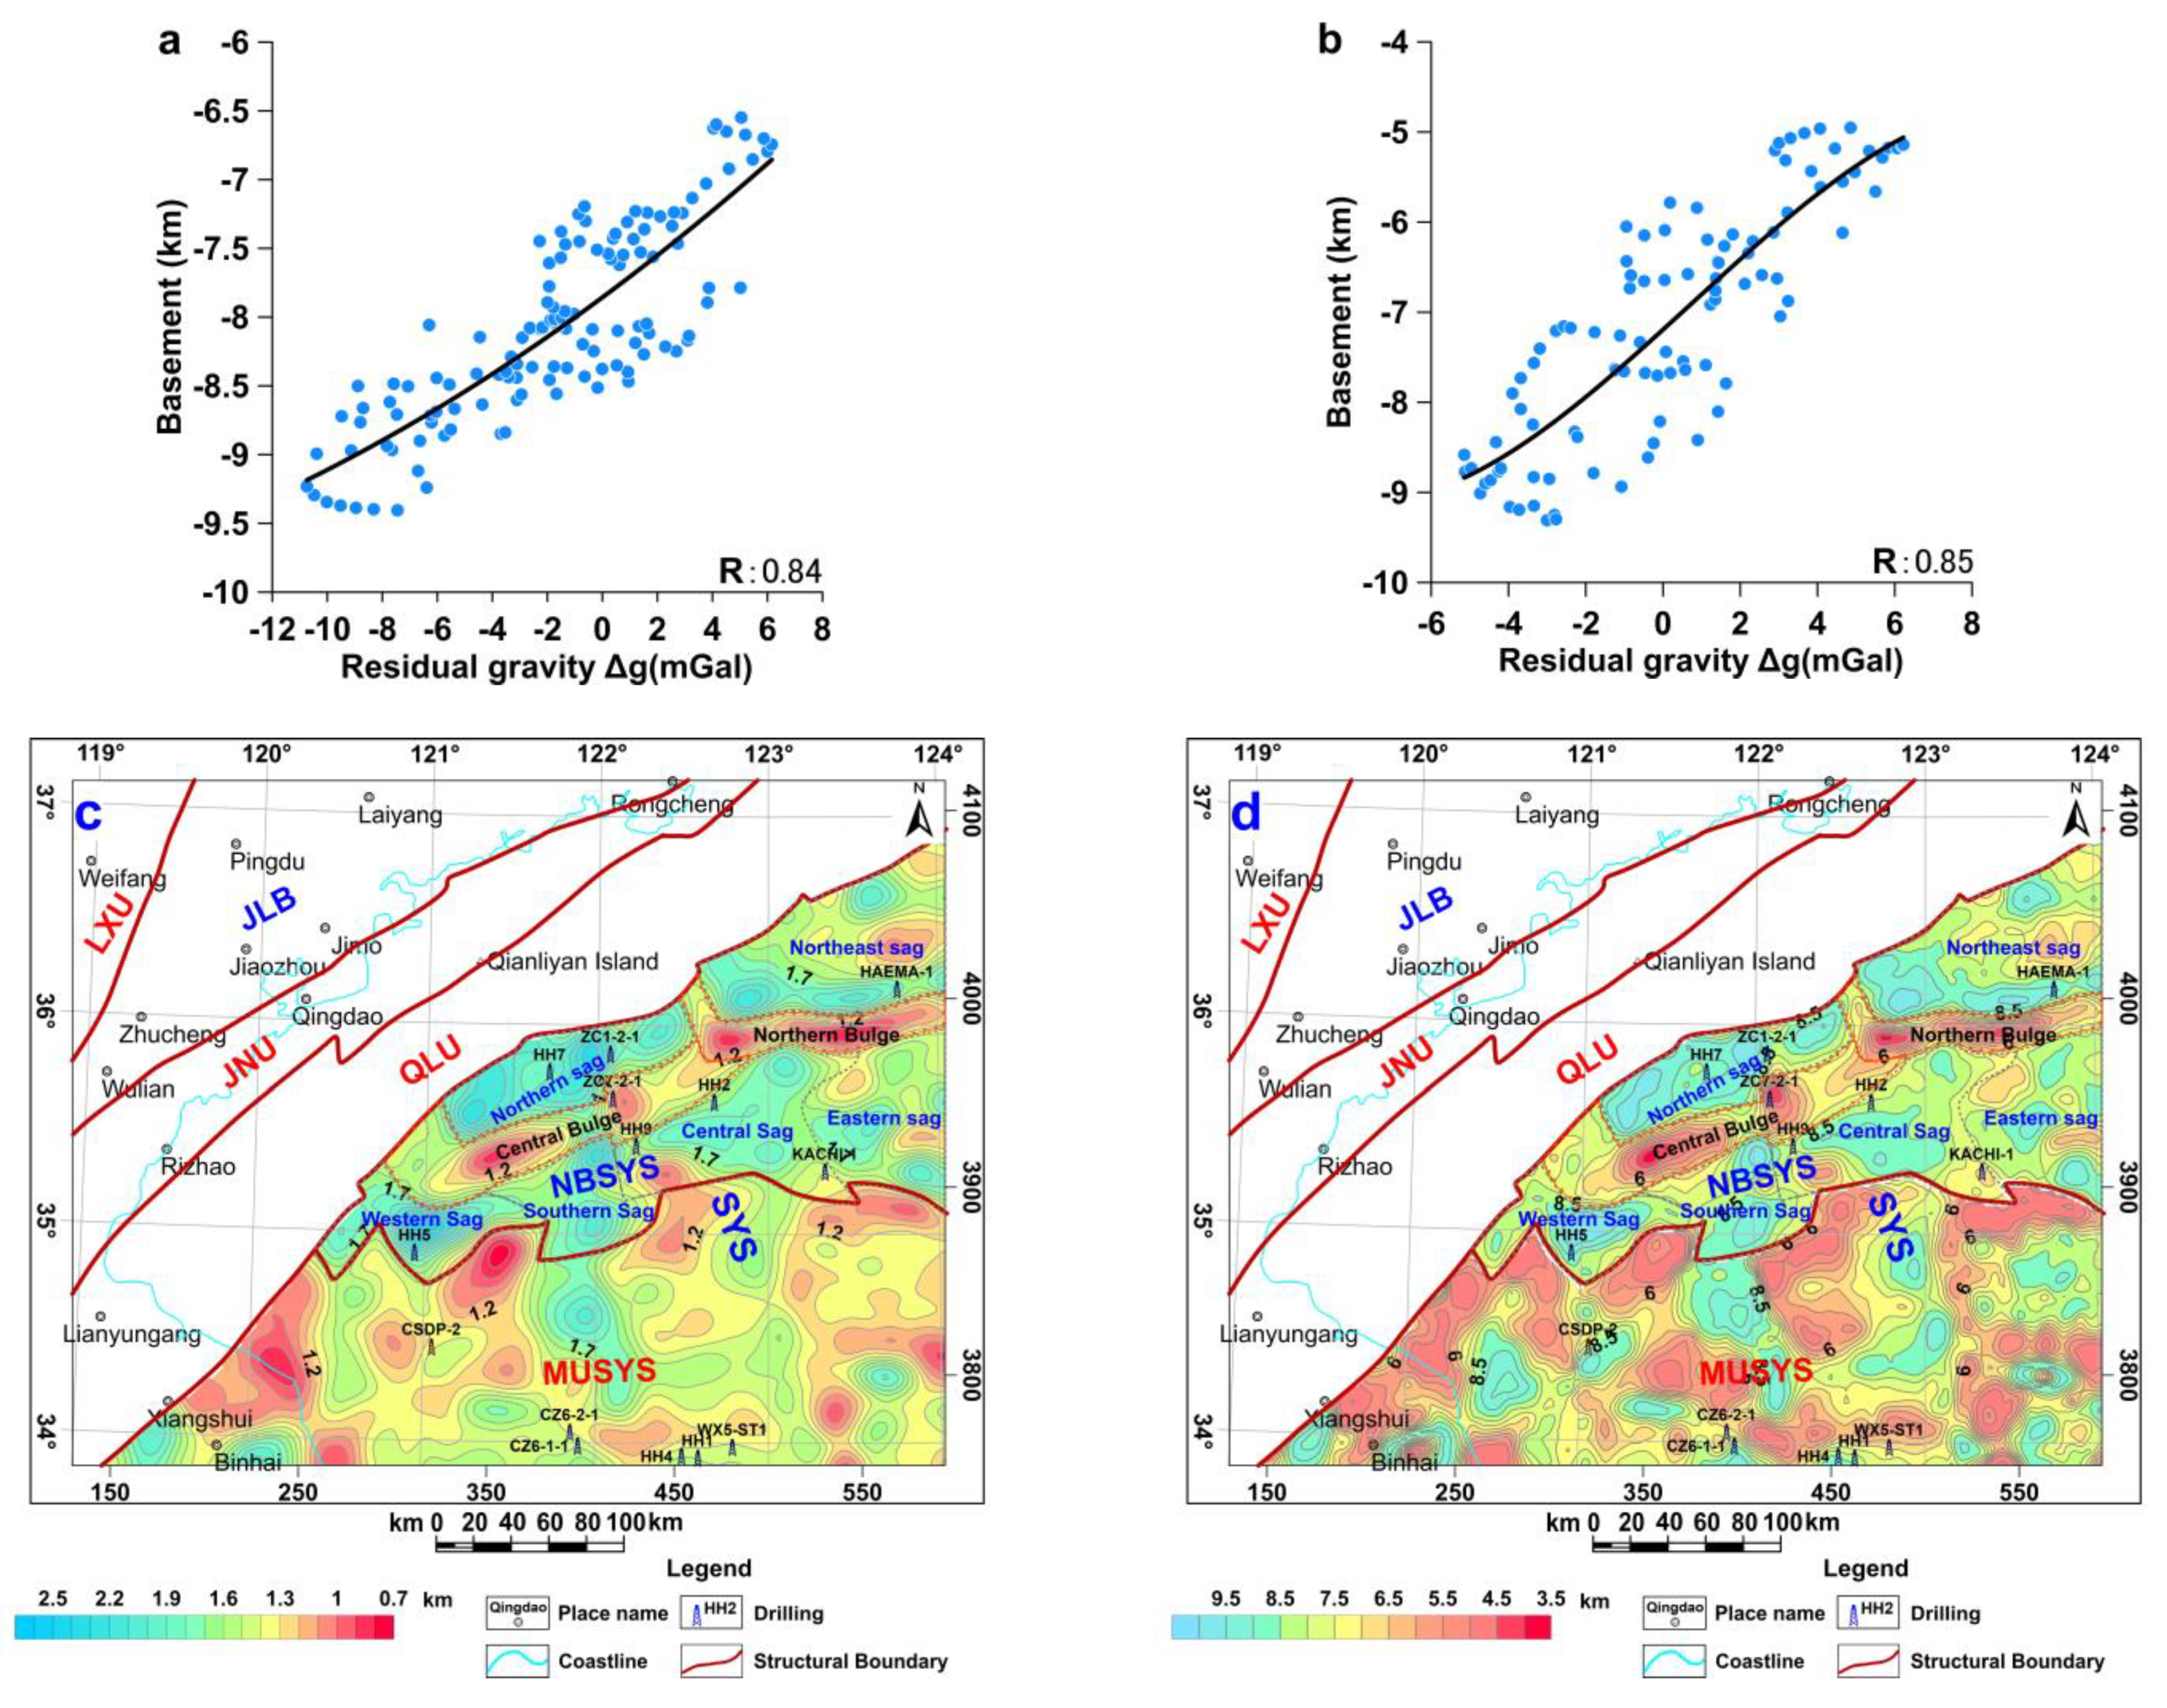
This study employs the Parker-Oldenburg inversion method [81,82] to calculate the Cenozoic depth. Instead of gravity anomalies, previous researchers usually utilized magnetic anomalies to compute the pre-Sinian basement depth [14,49,90,91]. In this work, however, we separated the Bouguer gravity anomaly by employing RF and calculated the residual gravity anomaly by the regularization scale factor of 50 km. An RA zoning gravity inversion method is used to estimate the basement depth of the NBSYS and the MUSYS for the first time (Figure 12a,b,d). Based on the gravity anomaly characteristics and the profile positions of the seismic interpretation results, the basement depth in the study area is further divided into the following two parts for inversion: the north-south trending zone of the NBSYS, and the west-east trending zone of the MUSYS (Figure 12). The correlation coefficient R between the basement and the residual gravity anomaly in the NBSYS is 0.84, and the quadratic polynomial regression formula for the basement depth of the NBSYS is H = 0.0023Δg2 + 0.148Δg − 7.856 (Figure 12a). Moreover, the correlation coefficient R between the basement and the residual gravity anomaly in the MUSYS is 0.85, and the cubic polynomial regression formula for the basement depth of the MUSYS is H = −0.00186Δg3 + 0.00406Δg2 + 0.390Δg − 7.194 (Figure 10b) (Δg: mGal, basement depth: km).
The pre-Sinian basement depth calculated by RA is shown in Figure 12d. To verify the reliability of the basement depths, we extracted 24 basement depth points of the seismic geological interpretation profiles [17,21]. Then we compared them with the basement depth obtained by RA at the exact location. The comparison results indicate that the maximum and minimum errors between them are 899 m and 34 m, respectively, with a mean square error of ±532.11 m (Table 1). Therefore, we conclude that the depths calculated by RA are relatively reliable and reflect the undulation features of the basement. However, the difference in basement depths is great in the depressions (sags) and the structural boundaries, and slight in the uplifts (bulges) region, which indicates that the areas with intense changes in strata depth can affect the results of RA when calculating the basement.

4.4.2. Basement Features

The basement depths (Figure 12d) show that the JXFZ bounds the north of the NBSYS, and the area to the south of that adjacent to the MUSYS bounded by faults is a “trumpet-shaped” basin opening eastward. Moreover, the basement depth of the basin fluctuates greatly, and the basement is cut into secondary structures of different sizes by faults. Macroscopically, the NBSYS presents a pattern of alternating sag and bulge from north to south (Figure 12d). Along the north-south direction, therefore, the NBSYS can be further divided into eight sub-units, such as northeast sag, northern bulge, eastern sag, central sag, northern sag, central bulge, western sag, and southern sag.
By contrast, the MUSYS and NBSYS are connected by faults and overlaps, and also the basement presents a pattern of alternating sag and bulge from west to east. However, the fluctuation difference in the regional basement is slight (Figure 12d). Furthermore, the two bulge areas exhibit a significant spatial extent, with relatively small variations in basement depth. These regions are characterized by a relatively stable structure and the presence of multiple small-scale internal faults within strata. From the basement characteristics, therefore, it is implied that the tectonic conditions of the NBSYS are relatively complex, and the later structural reformation is intense; hence, it is a region with intense tectonic activities. In contrast, the tectonic conditions of the MUSYS are relatively stable, and the later reformation is weak, indicating that it represents a region of reasonable stability on the LYP.

5. Discussion

5.1. Relationship between Tectonic Movement and Hydrocarbons

At the end of the Early Paleozoic, the Caledonian Movement induced significant vertical differential movement in the SYSB, resulting in the underlying Early Paleozoic strata being eroded and flattened to a certain extent. Therefore, the Upper Silurian and Middle and Lower Devonian sediments are lacking in the SYSB [5,21]. The SYSB experienced long-term subsidence during the Late Paleozoic to Early Triassic as it primarily accumulated marine carbonate rocks and marine continental interactive transitional clastic rock. According to geophysical data and drilling revelation, the SYS has extensively preserved vast thickness and relatively gentle strata of the Paleozoic and Middle and Lower Triassic [1,5,28], which are well-preserved. Additionally, it has multiple sets of source rocks and hydrocarbon reservoir-caprock combinations. The Indosinian Movement ended the long-term stable marine sedimentation in the SYSB. The collision of the LYP with the SKP caused the entire basin to uplift and undergo intense compression and deformation. The folding and uplift of the marine Mesozoic and Paleozoic led to these strata being eroded and transformed, forming the sedimentary basement of later continental Mesozoic and Cenozoic basins [14]. The marine strata experienced multi-period reformation and alteration, with most of the Mesozoic–Paleozoic faulting occurring during the Indosinian Stage [21].
Meanwhile, this tectonic movement in the SYSB led to the widespread development of sedimentary cover, which developed the Indosinian tectonic system [12,14]. The Indosinian Movement resulted in varying degrees of damage and modification of the Mesozoic–Paleozoic hydrocarbon reservoirs, causing the already accumulated oil and gas to be redistributed and re-migrated again. Caprocks play a critical factor in preserving oil and gas reservoirs in this region.
Following the Mesozoic, the NBSYS experienced intense tectonic activity and multi-period stretching and rifting under the influences of the Yanshan and Himalayan movements, creating fault-depression regions where the Paleogene–Neogene and Cretaceous strata were deposited. These dustpan-shaped fault-depression systems with thicker sediments protected previously damaged oil and gas systems and prevented the diffusion of oil and gas, which is conducive to preserving hydrocarbon reservoirs. The basement faults formed by tectonic movements not only facilitate the sealing and preservation of oil and gas but also provide pathways for oil and gas migration, thereby further changing the pattern of oil and gas preservation and distribution. The marine petroleum system could be rebuilt. In contrast, after the Indosinian Movement, the MUSYS underwent long-term uplift resulting in the absence of many strata. However, according to the results of gravity modelling and seismic data interpretation, the tectonic deformation of the Mesozoic–Paleozoic is relatively weak, the stratigraphic sedimentation is stable, and the influence of faults and magmatic activity on the MUSYS is relatively small. MUSYS has well-developed multiple sets of inner cover layers and is distributed with stable upper cover layers [1,5,6,7,8]. In addition, the Mesozoic–Paleozoic burial depth is shallow, the source rock is of late maturity, and the hydrocarbon generation is late, while the sealing of the Mesozoic–Cenozoic caprocks is good. These conditions are conducive to the enrichment and preservation of oil and gas in marine structural layers [12,21].

5.2. Hydrocarbon Prospect Area

The basement depth (Figure 12d) and the Mesozoic-Paleozoic thickness (Figure 13) show that the basement of the NBSYS is deep, and the Mesozoic–Paleozoic is widely distributed and thick. Although the basement and the Mesozoic–Paleozoic thickness fluctuate significantly, and the fault activities present are intense, the magmatic activity is weak, and there are few igneous rock intrusions. Therefore, the internal destruction of the Mesozoic–Paleozoic was not severe, and the reservoir conditions of oil and gas are relatively good. The basement depth (Figure 12d) in the sags of the NBSYS is relatively deep, with a depth of 3.5~10.0 km, and the Mesozoic–Paleozoic thickness is relatively thick (Figure 13), with a thickness of 3.0~8.0 km. Additionally, based on the oil and gas geological characteristics of the SYS, it is apparent that the oil and gas system in the NBSYS is well developed and has superior caprocks. Although fault activities have altered the distribution of oil and gas, their redistribution through fault structures has resulted in multiple fault traps. Consequently, the secondary structures in the NBSYS provide favorable geological conditions for oil and gas accumulation.
The depth of the basement in the central bulge and the northern bulge, adjacent to the north and south sides of the sag areas, is relatively shallow. According to the oil and gas accumulation model in the NBSYS [17,64], combined with the fault structures and stratigraphic evolution, we consider that the oil and gas in the sags can be migrated vertically or horizontally to the structural highs of the northern bulge and the central bulge through the faults. Under the influence of fault structures, oil and gas storage structures such as fault anticlines or fault block traps can develop. Based on the above analysis, therefore, three target prospect areas for oil and gas exploration of the Mesozoic-Paleozoic are determined in the NBSYS. These include the transition zone between the northern sag and central bulge, the transition zone between the northeastern sag and northern bulge, and the transition areas between the western sag, southern sag, central sag and eastern sag, as well as between the northern bulge and central bulge.
The basement depth of the MUSYS (Figure 12d) is relatively shallow; however, the Mesozoic-Paleozoic strata are thick, widely distributed, and well preserved (Figure 13), with thicknesses between 2.5 and 7.8 km. In addition, the Mesozoic–Paleozoic in the MUSYS is characterized by gentle fluctuations, stable structural conditions, weak faults, and poor magmatic activity; only the southeast corner of the MUSYS has igneous intrusions, which may destroy the basement and the Paleozoic. Moreover, the Mesozoic–Paleozoic is alternately distributed along the east-west direction with highs and lows, and the strata are imbricated under the influence of the north-south trending compression. In addition, the Mesozoic–Paleozoic has well-developed internal sedimentary faults, and two large-scale fault bulges exist in the MUSYS (Figure 13) that are characterized by extensive areas, mild deformation, stable structures, and numerous source rock formations. In this area, there are not only several sets of inner caprocks with favorable conditions, but also the overlying caprocks with superior conditions are widely distributed. In the later period, the oil and gas preservation conditions are superior, with multiple types of oil and gas resource reservoir-caprock assemblages.
Combined with the fault division results (Figure 5) and gravity modelling geological results, we consider that the sediments and structures of the MUSYS are relatively stable, the hydrocarbon storage conditions are favorable, and that there is a favorable combination of source, reservoir, and caprocks (Figure 9, Figure 10 and Figure 11). Additionally, according to the oil and gas accumulation pattern of the MUSYS [11], the faults can provide good passage and motive power for oil and gas migration and accumulation, as well as considerable structural traps for oil and gas accumulation. Furthermore, both the east and west sides of the two bulges are close to the sag areas, and the oil and gas in the sags can be migrated to the structural highs. Hence, the two bulges in the MUSYS should also be favorable prospective areas for further oil and gas exploration of the Mesozoic–Paleozoic.
It should be noted that the northern South Yellow Sea area has a complex geological setting, with significant variations in the strata thickness both vertically and horizontally. Therefore, calculating density interfaces and the thickness of the Mesozoic and Paleozoic strata using gravity data is based on approximation and inference. The results may differ from actual geological conditions. However, the macroscopic interface depth and strata thickness characteristics are relatively reliable. In addition, due to the low resolution of gravity data and the non-uniqueness of geophysical inversion methods, although we apply multiple geophysical data for joint interpretation, the determined fault structures, density interfaces, and predicted oil and gas favorable areas in this study may be differences due to these limitations. Nevertheless, our results still reflect the structural characteristics and strata features of the study area.
To improve the reliability of interpretation of the results and deepen the understanding of geological structures, it is necessary to obtain further high-resolution seismic profiles, drilling and geological data, and higher precision gravity and magnetic data in future work. Furthermore, the joint inversion method of gravity and seismic data should be enhanced to minimize the non-uniqueness inherent in geophysical inversion.

6. Conclusions

We analyzed the characteristics and genesis of gravity and magnetic anomalies. Based on higher precision gravity data, we refined the results of previous fault structures by implementing reasonable geopotential field separation and edge detection processing methods. In addition, we utilized the constraint information from the seismic profiles to estimate the basement depth and the Mesozoic–Paleozoic thickness by gravity inversion. The findings can be summarized as follows:
(1) In our study area, the structures exhibited considerable complexity, and regional tectonism varies. Specifically, the intensity of tectonic activities weakened gradually from NW to SE. During the pre-Cenozoic, the N-S trending tectonic movement was more powerful than the E-W trending movement, resulting in greater structural deformation in the NBSYS than that in the MUSYS. Additionally, the eastern basement was more stable than the western basement in the study area. Consequently, these factors led to the development of a chessboard tectonic pattern characterized by N-S trending zonings in the NBSYS and E-W trending blockings in the MUSYS.
(2) The rationality and reliability of our fault division findings have been enhanced through our study. The area features abundant faults, and the dominant faults in NE (NEE) directions were staggered and cut off by secondary faults in NW (NWW), near-EW, and near-SN directions. This geometric pattern gave rise to a complex en echelon-typed fault system that extends along the NE(NEE) directions. Notably, we successfully discovered a new fault, F3-2, trending in the NE direction.
(3) This study represents the first instance of utilizing RA and gravity data to estimate the pre-Sinian basement depth and the Mesozoic–Paleozoic thickness. The basement and strata features differed significantly along the N-S direction. The NBSYS displayed significant fluctuations in the basement and Mesozoic–Paleozoic thicknesses, coupled with intense fault activity. Conversely, the Mesozoic–Paleozoic in the MUSYS was characterized by mild fluctuations and relatively stable structural conditions.
(4) This paper assessed the potential for hydrocarbon exploration in the Mesozoic–Paleozoic strata. The investigation utilized geological information, including fault structures, stratigraphic distribution, and hydrocarbon accumulation models to identify three transitional areas between the bulges and the sags connected by faults and overlaps in the NBSYS, leading to the identification of prospective target areas for hydrocarbon exploration. Additionally, the study also identified two stable bulges in the MUSYS which are favorable prospective areas for further oil and gas exploration.
(5) The study found that the fault structures, density interfaces, and predicted favorable oil and gas areas inferred from the analysis of gravity and magnetic data are relatively reliable. However, the complex structures in the SYS, in conjunction with the low accuracy of the gravity and magnetic data and the inherent non-uniqueness of geophysical inversion methods, may lead to potential discrepancies from actual geological formations. Therefore, future investigations should supplement our findings with high-resolution seismic profiles, drillings, geological data, and high-precision gravity and magnetic data to enhance the reliability their interpretation. Furthermore, additional quantitative analyses of the gravity and magnetic data with geological structures are necessary. Additionally, it is crucial to improve the joint inversion method of gravity, magnetic, and seismic data to minimize the non-uniqueness of geophysical inversion methods.

Author Contributions

W.X.: Data collection and compiling, data processing and analyses, methodology, interpretation, and editing. C.Y.: Leading the study, data analyses, methodology, and review. B.Y.: Data collection, interpretation, and review. S.A., X.Y. (Xianzhe Yin) and X.Y. (Xiaoyu Yuan): Data collection, methodology and interpretation. All authors have read and agreed to the published version of the manuscript.

Funding

National Key R&D Program of China (2021YFB3900200).

Data Availability Statement

The data is available by request from the corresponding author.

Acknowledgments

This study has been partly supported by the Aero Geophysical Prospecting and Application for Marine Geology Project (Grant No. GZH2009005002) of the China Aero Geo-physical Survey and Remote Sensing Center for Land and Resources. We thank the National Geological Archives of China Geological Survey for permission to apply and release the data.

Conflicts of Interest

The authors declare that the research was conducted in the absence of any commercial or financial relationships that could be construed as a potential conflict of interest.

References

  1. Zhang, J.Q. Exploration prospects of Mesozoic and Paleozoic oil and gas in the South Yellow Sea. Mar. Geol. Lett. 2002, 18, 25–27. (In Chinese) [Google Scholar]
  2. Feng, Z.Q.; Yao, Y.J.; Zeng, X.H.; Wang, Q.; Wang, L.L.; Chen, Q.; Yi, H.; Jin, H.F. New understanding of Mesozoic-Paleozoic tectonics and hydrocarbon potential in Yellow Sea. China Offshore Oil Gas (Geol.) 2002, 16, 367–373. (In Chinese) [Google Scholar]
  3. Wu, S.G.; Ni, X.L.; Cai, F. Petroleum geological framework and hydrocarbon potential in the Yellow Sea. Chin. J. Oceanol. Limnol. 2008, 26, 23–34. [Google Scholar] [CrossRef]
  4. Yao, Y.J.; Chen, C.F.; Feng, Z.Q.; Zhang, S.Y.; Hao, T.Y.; Wan, R.S. Tectonic evolution and hydrocarbon potential in northern area of the South Yellow Sea. J. Earth Sci. 2010, 21, 71–82. [Google Scholar] [CrossRef]
  5. Liang, J.; Zhang, P.H.; Chen, J.W.; Gong, J.M.; Yuan, Y. Hydrocarbon preservation conditions in Mesozoic-Paleozoic marine strata in the South Yellow Sea Basin. Nat. Gas Ind. B 2017, 4, 432–441. [Google Scholar] [CrossRef]
  6. Chen, J.W.; Xua, M.; Lei, B.H.; Liang, J.; Zhang, Y.G.; Wu, S.Y.; Shi, J.; Yuan, Y.; Wang, J.Q.; Zhang, Y.X.; et al. Prospective prediction and exploration situation of marine Mesozoic-Paleozoic oil and gas in the South Yellow Sea. China Geol. (Engl. Ed.) 2019, 1, 67–84. [Google Scholar] [CrossRef]
  7. Lei, B.H.; Chen, J.W.; Liang, J.; Zhang, Y.G. Structural Characteristics and Favorable Zone for Marine Hydrocarbon Exploration of the Laoshan Uplift in the South Yellow Sea Basin. Acta Geol. Sin. (Engl. Ed.) 2019, 93, 102–103. [Google Scholar]
  8. Yuan, Y.; Chen, J.W.; Liang, J.; Xu, M.; Lei, B.H.; Zhang, Y.X.; Cheng, Q.S.; Wang, J.Q. Hydrocarbon geological conditions and exploration potential of Mesozoic–Paleozoic marine strata in the South Yellow Sea Basin. J. Ocean Univ. China (Ocean. Coast. Sea Res.) 2019, 18, 1329–1343. [Google Scholar] [CrossRef]
  9. Pang, Y.M.; Guo, X.W.; Han, Z.Z.; Zhang, X.H.; Zhu, X.Q.; Hou, F.H.; Han, C.; Song, Z.G.; Xiao, G.L. Mesozoic–Cenozoic denudation and thermal history in the Central Uplift of the South Yellow Sea basin and the implications for hydrocarbon systems: Constraints from the CSDP-2 borehole. Mar. Pet. Geol. 2019, 99, 355–369. [Google Scholar] [CrossRef]
  10. Cai, L.X.; Xiao, G.L.; Guo, X.W.; Wang, J.; Wu, Z.Q.; Li, B.G. Assessment of Mesozoic and Upper Paleozoic source rocks in the South Yellow Sea Basin based on the continuous borehole CSDP-2. Mar. Pet. Geol. 2019, 101, 30–42. [Google Scholar] [CrossRef]
  11. Cai, L.X.; Xiao, G.L.; Zeng, Z.G.; Zhang, X.H.; Guo, X.W.; Wang, S.P. New insights into marine hydrocarbon geological conditions in the South Yellow Sea Basin: Evidence from borehole CSDP-2. J. Oceanol. Limnol. 2020, 38, 1169–1187. [Google Scholar] [CrossRef]
  12. Wang, J.Q.; Sun, J.; Xiao, G.L.; Wu, Z.Q.; Li, S.L. Tectonic characteristics of the South Yellow Sea basin and implications for petroleum geology. Mar. Geol. Front. 2014, 30, 34–39. (In Chinese) [Google Scholar]
  13. Zhang, X.H.; Guo, X.W.; Wu, Z.Q.; Xiao, G.L.; Zhang, X.H.; Zhu, X.Q. Preliminary results and geological significance of Well CSDP-2 in the Central Uplift of South Yellow Sea Basin. Chin. J. Geophys. 2019, 62, 197–218. (In Chinese) [Google Scholar]
  14. Zhang, X.H.; Yang, J.Y.; Li, G.; Yang, Y.Q. Basement structure and distribution of Mesozoic-Paleozoic marine strata in the South Yellow Sea basin. Chin. J. Geophys. 2014, 57, 4041–4051. (In Chinese) [Google Scholar]
  15. Lei, B.H.; Xu, M.; Chen, J.W.; Liang, J.; Zhang, Y.G. Structural characteristics and evolution of the South Yellow Sea Basin since Indosinian. China Geol. 2018, 4, 466–476. [Google Scholar] [CrossRef]
  16. Feng, Z.Q.; Chen, C.F.; Yao, Y.J.; Zhang, S.Y.; Hao, T.Y.; Wan, R.S. Tectonic evolution and exploration target of the northern foreland basin of the South Yellow Sea. Earth Sci. Front. 2008, 15, 219–231. (In Chinese) [Google Scholar]
  17. Zhang, X.H.; Xiao, G.L.; Wu, Z.Q.; Li, S.L. Recognition and Discussion of Several Geological Problems in Oil&Gas Exploration of the South Yellow Sea—New Progress and Challenges in the Mesozoic-Paleozoic Marine Oil&Gas Exploration of the South Yellow Sea; Science Press: Beijing, China, 2017. (In Chinese) [Google Scholar]
  18. Cai, Q.Z. Oil & Gas Geology in China Seas; China Ocean Press: Beijing, China, 2005. (In Chinese) [Google Scholar]
  19. Ma, L.F. Geological Atlas of China (Shandong Geological Map & Jiangsu Geological Map); Geological Publishing House: Beijing, China, 2002. (In Chinese) [Google Scholar]
  20. Becker, J.J.; Sandwell, T.D.; Smith, W.H.F.; Braud, J.; Binder, B.; Depner, J.; Fabre, D.; Factor, J.; Ingalls, S.; Kim, S.-H.; et al. Global bathymetry and elevation data at 30 arc seconds resolution: SRTM30_PLUS. Mar. Geod. 2009, 32, 355–371. [Google Scholar] [CrossRef]
  21. Yao, Y.J.; Feng, Z.Q.; Hao, T.Y.; Xu, X.; Li, X.J.; Wan, R.S. A new understanding of structural layers in the South Yellow Sea Basin and their hydrocarbon-bearing characteristics. Earth Sci. Front. 2008, 15, 232–240. (In Chinese) [Google Scholar]
  22. Zhang, H.Q.; Chen, J.W.; Li, G.; Li, G.; Wu, Z.Q.; Zhang, Y.G. Discovery from seismic survey in Laoshan Uplift of the South Yellow Sea and the significance. Mar. Geol. Quat. Geol. 2009, 29, 107–113. (In Chinese) [Google Scholar]
  23. Wang, L.Y. Research on Pre-Tertiary Seismic Stratigraphy and Structural Characteristics of the South Yellow Sea. Master’s Thesis, Ocean University of China, Qingdao, China, 2011. (In Chinese). [Google Scholar]
  24. Li, N.; Li, W.R.; Long, H.Y. Tectonic evolution of the north depression of the South Yellow Sea Basin since Late Cretaceous. J. Ocean Univ. China (Ocean. Coast. Sea Res.) 2016, 15, 967–976. [Google Scholar] [CrossRef]
  25. Xu, H.; Zhang, H.Y.; Zhang, B.L.; Yan, G.J.; Shi, J.; Yang, Y.Q.; Sun, H.Q.; Li, J.W.; Dong, G.; Lu, S.C. Characteristics of the 26 wells from the South Yellow Sea Basin. Mar. Geol. Front. 2015, 31, 1–6. (In Chinese) [Google Scholar]
  26. Xu, X.; Sun, L.P.; Xiao, M.C.; Li, X.; Zhu, X.Y.; Gao, S.L. Structural characteristics and activity rules of faults in the Cenozoic faulted-basins in the Lower Yangtze Region. Geol. J. China Univ. 2018, 24, 723–733. (In Chinese) [Google Scholar]
  27. Yuan, Y.; Chen, J.W.; Zhang, Y.X.; Liang, J.; Zhang, Y.G.; Zhang, P.H. Tectonic evolution and geological characteristics of hydrocarbon reservoirs in marine Mesozoic-Paleozoic strata in the South Yellow Sea Basin. J. Ocean Univ. China (Ocean. Coast. Sea Res.) 2018, 17, 1075–1090. [Google Scholar] [CrossRef]
  28. Xu, M.; Chen, J.W.; Liang, J.; Zhang, Y.G.; Lei, B.H.; Shi, J.; Wang, J.Q. Basement structures underneath the northern South Yellow Sea basin (East China): Implications for the collision between the North China and South China blocks. J. Asian Earth Sci. 2019, 186, 104040. [Google Scholar] [CrossRef]
  29. Qi, J.H. Research on the Crustal Velocity Structure in the Southern Yellow Sea. Ph.D. Thesis, Ocean University of China, Qingdao, China, 2015. (In Chinese). [Google Scholar]
  30. Hou, F.H.; Guo, X.W.; Wu, Z.Q.; Zhu, X.Q.; Zhang, X.H.; Qi, J.H.; Wang, B.J.; Wen, Z.H.; Cai, L.X.; Pang, Y.M. Research progress and discussion on formation and tectonics of South Yellow Sea. J. Jinlin Univ. (Earth Sci. Ed.) 2019, 49, 96–105. (In Chinese) [Google Scholar]
  31. Zhao, W.N.; Wang, H.G.; Shi, H.C.; Xie, H.; Wu, Z.Q.; Chen, S.S.; Zhang, X.H.; Hao, T.Y.; Zheng, P.H. Crustal structure from onshore-offshore wide-angle seismic data: Application to Northern Sulu Orogen and its adjacent area. Tectonophysics 2019, 770, 1–12. [Google Scholar] [CrossRef]
  32. Liu, L.H.; Hao, T.Y.; Lü, C.C.; Wu, Z.Q.; Zheng, Y.P.; Wang, F.Y.; Xu, Y.; Kim, K.; Kim, H. Crustal deformation and detachment in the Sulu Orogenic Belt: New constraints from Onshore-Offshore Wide-Angle seismic data. Geophys. Res. Lett. 2021, 48, 1–10. [Google Scholar] [CrossRef]
  33. Berezkin, V.M. Method of analytical continuation of total vertical gradient of gravity field for the study of density masses distribution in the earth crust. Geol. I Razved. (Geol. Explor.) 1968, 12, 104–110. (In Russian) [Google Scholar]
  34. Berezkin, W.M. Application of the full vertical gravity gradient to determination to sources causing gravity anomalies. Expl. Geopys. 1967, 18, 69–76. (In Russian) [Google Scholar]
  35. Berezkin, W.M. Application of Gravity Exploration to Reconnaissance of Oil and Gas Reservoir; Nedra Publishing House: Moscow, Russia, 1973. (In Russian) [Google Scholar]
  36. Zeng, H.L.; Meng, X.H.; Yao, C.L.; Li, X.M.; Lou, H.; Guan, Z.N.; Li, Z.P. Detection of reservoirs from normalized full gradient of gravity anomalies and its application to Shengli oil field, east China. Geophysics 2002, 67, 1138–1147. [Google Scholar] [CrossRef]
  37. Aydin, A. Interpretation of gravity anomalies with the normalized full gradient (NFG) method and an example. Pure Appl. Geophys. 2007, 164, 2329–2344. [Google Scholar] [CrossRef]
  38. Aghajani, H.; Moradzadeh, A.; Zeng, H.L. Detection of high-potential oil and gas fields using normalized full gradient of gravity anomalies: A case study in the Tabas Basin, Eastern Iran. Pure Appl. Geophys. 2011, 168, 1851–1863. [Google Scholar] [CrossRef]
  39. Yuan, B.Q.; Song, L.J.; Han, L.; An, S.L.; Zhang, C.G. Gravity and magnetic field characteristics and hydrocarbon prospects of the Tobago Basin. Geophys. Prospect. 2018, 66, 1586–1601. [Google Scholar] [CrossRef]
  40. Saada, S.A.; Mickus, K.; Eldosouky, A.M.; Ibrahim, A. Insights on the tectonic styles of the Red Sea rift using gravity and magnetic data. Mar. Pet. Geol. 2021, 133, 105253. [Google Scholar] [CrossRef]
  41. Eldosoukya, A.M.; Pham, L.T.; Duong, V.-H.; Eitel, F.; Ghomsid, K.; Henaish, A. Structural interpretation of potential field data using the enhancement techniques: A case study. Geocarto Int. 2022, 37, 16900–16925. [Google Scholar] [CrossRef]
  42. Pham, L.T.; Nguyen, D.A.; Eldosouky, A.M.; Abdelrahman, K.; Vu, T.V.; Al-Otaibi, N.; Ibrahim, E.; Kharbish, S. Subsurface structural mapping from high-resolution gravity data using advanced processing methods. J. King Saud Univ.-Sci. 2021, 33, 101488. [Google Scholar] [CrossRef]
  43. Saada, S.A.; Eldosouky, A.M.; Kamel, M.; Khadragy, A.E.; Abdelrahman, K.; Fnais, M.S.; Mickus, K. Understanding the structural framework controlling the sedimentary basins from the integration of gravity and magnetic data: A case study from the east of the Qattara Depression area, Egypt. J. King Saud Univ.-Sci. 2022, 34, 101808. [Google Scholar] [CrossRef]
  44. Eldosouky, A.M.; Pham, L.T.; Henaish, A. High precision structural mapping using edge filters of potential field and remote sensing data: A case study from Wadi Umm Ghalqa area, South Eastern Desert, Egypt. Egypt. J. Remote Sens. Space Sci. 2022, 25, 501–513. [Google Scholar] [CrossRef]
  45. El-Sehamy, M.; Gawad, A.M.A.; Aggour, T.A.; Orabi, O.H.; Abdella, H.F.; Eldosouky, A.M. Sedimentary cover determination and structural architecture from gravity data: East of Suez Area, Sinai, Egypt. Arab. J. Geosci. 2022, 15, 109. [Google Scholar] [CrossRef]
  46. Pham, L.T.; Ghoms, F.E.K.; Vu, T.V.; Oksum, E.; Steffen, R.; Tenzer, R. Mapping the structural configuration of the western Gulf of Guinea using advanced gravity interpretation methods. Phys. Chem. Earth 2023, 129, 103341. [Google Scholar] [CrossRef]
  47. Liang, R.C.; Pei, Y.L.; Zheng, Y.P.; Wei, J.W.; Liu, Y.G. Gravity and magnetic field and tectonic structure character in the southern Yellow Sea. Chin. Sci. Bull. 2003, 48, 64–73. [Google Scholar] [CrossRef]
  48. Wang, W.Y.; Liu, J.L.; Qiu, Z.Y.; Huang, Y.J.; Cai, D.S. A research on Mesozoic thickness using satellite gravity anomaly in the southern Yellow Sea. China Offshore Oil Gas 2004, 16, 151–156,169. (In Chinese) [Google Scholar]
  49. Zhang, M.H.; Xu, D.S.; Chen, J.W. Geological structure of the yellow sea area from regional gravity and magnetic interpretation. Appl. Geophys. 2007, 4, 75–83. [Google Scholar] [CrossRef]
  50. Yao, Y.J. Tectonic of the South Yellow Sea: Application of Joint Gravity-Magnetic-Seismic Inversion. Ph.D. Thesis, Guangzhou Institute of Geochemistry, Chinese Academy of Sciences, Guangzhou, China, 2008. (In Chinese). [Google Scholar]
  51. Hao, T.Y.; Huang, S.; Xu, Y.; Li, Z.W.; Zhang, L.L.; Wang, J.L.; Suh, M.; Kim, K. Geophysical understandings on deep structure in Yellow Sea. Chin. J. Geophys. 2010, 53, 1315–1326. (In Chinese) [Google Scholar]
  52. Yang, J.Y. Research on the Tectonic Relation between the South Yellow Sea Basin and Its Adjacent Area and Distribution Characteristic and Tectonic Evolution of the Mesozoic-Paleozoic Marine Strata. Ph.D. Thesis, Zhejiang University, Hangzhou, China, 2009. (In Chinese). [Google Scholar]
  53. Choi, S.C.; Ryu, I.-C.; Gotze, H.-J. Depth distribution of the sedimentary basin and Moho undulation in the Yellow Sea, NE Asia interpreted by using satellite-derived gravity field. Geophys. J. Int. 2015, 202, 41–53. [Google Scholar] [CrossRef] [Green Version]
  54. Zhang, X.J.; Zhang, W.; Fan, Z.L.; Zhu, W.P.; Tong, J.; Yao, G.T. Characteristics of airborne gravity field and the main geological discovery in the northern South Yellow Sea. Geol. Surv. China 2017, 4, 50–56. (In Chinese) [Google Scholar] [CrossRef] [Green Version]
  55. Tong, J.; Zhang, X.J.; Zhang, W.; Xiong, S.Q. Marine strata morphology of the South Yellow Sea based on high-resolution aeromagnetic and airborne gravity data. Mar. Pet. Geol. 2018, 96, 429–440. [Google Scholar] [CrossRef]
  56. Zhang, R.Y.; Yang, F.L.; Zhao, C.J.; Zhang, J.W.; Qiu, E.K. Coupling relationship between sedimentary basin and Moho morphology in the South Yellow Sea, East China. Geol. J. 2020, 55, 6544–6561. [Google Scholar] [CrossRef]
  57. Xu, W.Q.; Yuan, B.Q.; Liu, B.L.; Yao, C.L. Multiple gravity and magnetic potential field edge detection methods and their application to the boundary of fault structures in northern South Yellow Sea. Geophys. Geochem. Explor. 2020, 44, 962–974. (In Chinese) [Google Scholar]
  58. Jin, X.L.; Yu, P.Z. Geological Structure of the Yellow Sea and East China Sea; Science Press: Beijing, China, 1982. (In Chinese) [Google Scholar]
  59. Qin, Y.S.; Zhao, Y.Y. The Yellow Sea Geology; China Ocean Press: Beijing, China, 1989. (In Chinese) [Google Scholar]
  60. Chen, H.S.; Zhang, Y.H. The Lithospheric Textural and Structural Features as Well as Oil and Gas Evaluation in the Lower Yangtze Area and Its Adjacent Region; Geological Publishing House: Beijing, China, 1999. (In Chinese) [Google Scholar]
  61. Sun, X.D.; Guo, X.W.; Zhang, X.H.; Li, Z.Y.; Liu, H.S.; Zhang, S.S. Radiogentic heat production of formation and thermal structure of lithosphere in the South Yellow Sea Basin. Earth Sci. 2023, 48, 1040–1057. (In Chinese) [Google Scholar]
  62. Xiao, G.L.; Zhang, Y.G.; Wu, Z.Q.; Lei, B.H.; Sun, J.; Wang, J.Q. Comparative assessment of hydrocarbon resource potential in the South Yellow Sea Basin. Mar. Geol. Front. 2014, 30, 25–33. (In Chinese) [Google Scholar]
  63. Xu, Z.Q.; Liang, J.; Chen, J.W.; Zhang, P.H.; Zhang, Y.G.; Wang, J.Q.; Lei, B.H.; Yang, C.S. Evaluation of hydrocarbon preservation on the Laoshan uplift. Mar. Geol. Quat. Geol. 2018, 38, 125–133. (In Chinese) [Google Scholar]
  64. Zhang, M.Q.; Gao, S.L.; Tan, S.Z. Geological characteristics of the Meso-Paleozoic in South Yellow Sea Basin and future exploration. Mar. Geol. Quat. Geol. 2018, 38, 24–34. (In Chinese) [Google Scholar]
  65. Zhang, X.H.; Zhang, X.H.; Wu, Z.Q.; Guo, X.W.; Xiao, G.L. New understanding of Mesozoic-Paleozoic strata in the central uplift of the South Yellow Sea basin from the drilling of well CSDP-02 OF THE “Continental Shelf Drilling Program”. Chin. J. Geophys. 2018, 61, 2369–2379. (In Chinese) [Google Scholar]
  66. Tan, S.Z.; Chen, C.F.; Xu, Z.Z.; Hou, K.W.; Wang, J. Geochemical characteristics and hydrocarbon generation potentials of Paleozoic source rocks in the Southern Yellow Sea basin. Mar. Geol. Quat. Geol. 2018, 38, 116–124. (In Chinese) [Google Scholar]
  67. Fu, Y.X.; Tan, S.Z.; Hou, K.W. Formation conditions and resource potentiality of Taizhou formation in north sag of South Yellow Sea Basin. J. Jilin Univ. (Earth Sci. Ed.) 2019, 49, 230–238. (In Chinese) [Google Scholar]
  68. Chen, Q.H.; Song, R.W.; Dai, J.S.; Lu, K.Z.; Xiong, J.H. Jiaolai basin gravity and magnetic data interpretation and structure analysis. Prog. Geophys. 1994, 9, 70–79. (In Chinese) [Google Scholar]
  69. Huang, T.L. Characteristic of regional geophysical field in Jiaolai Basin and its tectonic unit division. Shandong Geol. 2000, 16, 41–47. (In Chinese) [Google Scholar]
  70. An, Y.L.; Guan, Z.N. The regularized stable factors of removing high frequency disturbances. Comput. Tech. Geophys. Geochem. Explor. 1985, 7, 13–23. (In Chinese) [Google Scholar]
  71. Morozov, V.A. Methods for Solving Incorrectly Posed Problems; Springer: New York, NY, USA, 1984; pp. 1–31. [Google Scholar]
  72. Boschetti, F. Improved edge detection and noise removal in gravity maps via the use of gravity gradients. J. Appl. Geophys. 2005, 57, 213–225. [Google Scholar] [CrossRef]
  73. Zeng, H.L. Gravity Field and Gravity Exploration; In Chinese with English Contents; Geological Publishing House: Beijing, China, 2005. (In Chinese) [Google Scholar]
  74. Rosenbach, O. A Contribution to the computation of the “Second Derivative” from Gravity Data. Geophysics 1953, 18, 3113–3123. [Google Scholar] [CrossRef]
  75. Wang, W.Y. The Research on the Edge Recognition Methods and Techniques for Potential Field. Ph.D. Thesis, Chang’an University, Xi’an, China, 2009. (In Chinese). [Google Scholar]
  76. Cooper GR, J.; Cowan, D.R. Edge enhancement of potential-field data using normalized statistics. Geophysics 2008, 73, 1–4. [Google Scholar] [CrossRef]
  77. Pham, L.T.; Eldosouky, A.M.; Oksum, E.; Saada, S.A. A new high resolution filter for source edge detection of potential field data. Geocarto Int. 2020, 37, 3051–3068. [Google Scholar] [CrossRef]
  78. Ekwok, S.E.; Eldosouky, A.M.; Achadu, O.I.M.; Akpan, A.E.; Pham, L.T.; Abdelrahman, K.; Gómez-Ortiz, D.; Ben, U.C.; Fnais, M.S. Application of the enhanced horizontal gradient amplitude (EHGA) filter in mapping of geological structures involving magnetic data in southeast Nigeria. J. King Saud Univ. Sci. 2022, 34, 102288. [Google Scholar] [CrossRef]
  79. Pham, L.T.; Vu, T.V.; Thi, S.L.; Trinh, P.T. Enhancement of potential field source boundaries using an Improved Logistic Filter. Pure Appl. Geophys. 2020, 177, 5237–5249. [Google Scholar] [CrossRef]
  80. Pham, L.T.; Oksum, E.; Do, T.D.; Le-Huy, M. New method for edges detection of magnetic sources using logistic function. Geofiz. Zhurnal. 2018, 40, 127–135. [Google Scholar] [CrossRef] [Green Version]
  81. Parker, R.L. The rapid calculation of potential anomalies. Geophys. J. Int. 1973, 31, 447–455. [Google Scholar] [CrossRef] [Green Version]
  82. Oldenburg, D.W. The inversion and interpretation of gravity anomalies. Geophysics 1974, 39, 526–536. [Google Scholar] [CrossRef]
  83. Florio, G. Mapping the depth to basement by Iterative Rescaling of Gravity or Magnetic Data. J. Geophys. Res. Solid Earth 2018, 123, 9101–9120. [Google Scholar] [CrossRef]
  84. Liu, Y.M.; Wu, Z.P. Diachronous characteristics and genetic mechanism of the Paleogene tectonic transition in Bohai Bay basin: A case study of the southwest Bohai Sea and Jiyang Depression. J. Cent. South Univ. (Sci. Technol.) 2022, 53, 1095–1110. [Google Scholar]
  85. Qi, J.H. Mesozoic-Paleozoic Tectonic Evolution in the South Yellow Sea Basin and the Comparative Analysis with Sichuan Basin. Master’s Thesis, China University of Geosciences, Beijing, China, 2012. (In Chinese). [Google Scholar]
  86. Xiao, Q.B.; Zhao, G.Z.; Wang, J.J.; Zhan, Y.; Chen, X.B.; Tang, J.; Cai, J.T.; Wan, Z.S.; Wang, L.F.; Ma, W.; et al. Deep electrical structure of the Sulu Orogen and neighboring areas. Sci. China Ser. D Earth Sci. 2009, 52, 420–430. [Google Scholar] [CrossRef]
  87. Pang, Y.M.; Zhang, X.H.; Xiao, G.L.; Guo, X.W.; Wen, Z.H.; Wu, Z.Q.; Zhu, X.Q. Characteristics of Meso-Cenozoic igneous complexes in the South Yellow Sea Basin, Lower Yangtze Craton of Eastern China and the tectonic setting. Acta Geol. Sin. (Engl. Ed.) 2017, 91, 971–987. [Google Scholar] [CrossRef]
  88. Pang, Y.M.; Zhang, X.H.; Xiao, G.L.; Shang, L.N.; Guo, X.W.; Wen, Z.H. The Mesozoic-Cenozoic igneous intrusions and related sediment-dominated hydrothermal activities in the South Yellow Sea Basin, the Western Pacific continental margin. J. Mar. Syst. 2018, 180, 152–161. [Google Scholar]
  89. Chen, J.W.; Xu, M.; Lei, B.H.; Shi, J.; Liu, J. Collision of North China and Yangtze Plates: Evidence from the South Yellow Sea. Mar. Geol. Quat. Geol. 2020, 40, 1–12. (In Chinese) [Google Scholar]
  90. Xing, T.; Zhang, X.H.; Zhang, X.Y. Magnetic basement and structure of the Southern Yellow Sea. Oceanol. Limnol. Sin. 2014, 45, 946–953. (In Chinese) [Google Scholar]
  91. Li, W.Y.; Liu, Y.X.; Xu, J.C. Onshore–offshore structure and hydrocarbon potential of the South Yellow Sea. J. Asian Earth Sci. 2014, 90, 127–136. [Google Scholar] [CrossRef]
Figure 1. Map of geotectonic locations in the SYS and adjacent areas: (a) geological sketch map of the study area modified from [18]; (b) modified from [19]; topography and bathymetry data were derived from SRTM30_PLUS V11, which is sourced from the Scripps Institution of Oceanography, the University of California San Diego [20]. ① Tancheng–Lujiang Fault zone (TLFZ); ② Wulian–Qingdao–Rongcheng Fault zone (WQRFZ); ③ Qianliyan Fault zone (QLFZ); ④ Jiashan–Xiangshui Fault zone (JXFZ); ⑤ Jiangshan–Shaoxing Fault zone (JSFZ). SKP—Sino-Korean Plate; LYP—Lower Yangtze Plate; SCP—South China Plate; LNP—Lingnan Plate; GP—Gyeonggi Plate; LLP–Langlin Plate; SYS—the South Yellow Sea. YLU—Yanliao Uplift; BBB—Baohai Bay Basin; LDU—Liaodong Uplift; HYU—Haiyangdao Uplift; AZB—Anzhou Basin; NYSB—the North Yellow Sea Basin; LGU—Liugongdao Uplift; JDU—Jiaodong Uplift; LXU—Luxi Uplift; JLB—Jiaolai Basin; SOB—Sulu Orogenic Belt; LOB—Linjinjiang Orogenic Belt; QLU—Qianliyan Uplift; NBSYS—the Northern Basin of the South Yellow Sea; MUSYS—the Middle Uplift of the South Yellow Sea; SBSYS—Subei-the Southern Basin of the South Yellow Sea; WNSU—Wunansha Uplift.
Minerals 13 00893 g001
Figure 2. Histogram of strata (rocks) density and susceptibility in the northern area of the SYS: (a) histogram of sediment density; (b) histogram of igneous rocks density; (c) histogram of sediment susceptibility; and (d) histogram of igneous rocks susceptibility.
Minerals 13 00893 g002
Figure 3. Map of Bouguer gravity anomaly: (a) original zoning map; (b) zoning comparison map. The blue dashed line represents the aero-gravity range; the purple line represents the gravity modelling profile; the grey line represents the latitude and longitude; the white line represents the zoning result of [52]; and the black line represents the result of this zoning.
Minerals 13 00893 g003
Figure 4. Map of RTP magnetic anomaly: (a) original zoning map; (b) zoning comparison map. The purple line represents the gravity modelling section; the grey line represents the latitude and longitude; the white line represents the zoning result of [52]; and the black line represents the result of this zoning.
Minerals 13 00893 g004
Figure 5. Map of faults: (a) residual gravity anomalies of RF (filter factor 50 km); (b) VSDR of Bouguer gravity anomaly (R = 28 km); (c) NVDR-THDR of Bouguer gravity anomaly, (d) NSTD of Bouguer gravity anomaly; (e) EGHA of Bouguer gravity anomaly and (f) IL of Bouguer gravity anomaly. F1: Tancheng–Lujiang fault; F2: Wulian–Qingdao–Rongcheng fault; F3: Lianyungang–Qianliyan fault; F4: Jiashan–Xiangshui fault; F5: fault in the southern margin of NBSYS. The black lines represent faults; the blue lines represent wide-angle seismic line and MT line; the blue dots represent the OBS points and crosses represent MT points.
Minerals 13 00893 g005
Figure 6. The characteristics of F3 on MT and wide-angle seismic profile. The profile position is shown in Figure 5: (a) Pingyi–Binhai MT profile (modified from [86]); (b) Vp velocity inversion profile of OBS2013-SYS Line (modified from [32]). F1: Tancheng–Lujiang fault; F2: Wulian–Qingdao–Rongcheng fault; F3: Lianyungang–Qianliyan fault; F4: Jiashan–Xiangshui fault; F5: fault in the southern margin of NBSYS. SKP—Sino-Korea Plate; TLFZ—Tancheng–Lujiang Fault Zone; SOB—Sulu Orogenic Belt; YP—Yangtze Plate; JLB—Jiaolai Basin; JNU—Jiaonan Uplift; QLU—Qianliyan Uplift; NBSYS—Northern Basin of the South Yellow Sea; MUSYS—Middle Uplift of the South Yellow Sea.
Minerals 13 00893 g006
Figure 7. Comparison map between F3 fault zone on the south side and previous fault division results: (a) residual gravity anomaly of RF (filter factor 50 km); (b) VSDR of Bouguer gravity anomaly (R = 28 km); (c) NVDR-THDR of Bouguer gravity anomaly; (d) NSTD of Bouguer gravity anomaly; (e) EGHA of Bouguer gravity anomaly and (f) IL of Bouguer gravity anomaly. The blue line represents MT; the crosses represent MT point positions; the blue dashed lines represent the faults of Cai et al. (2005) [18], the black dotted lines represent the faults of Zhang et al. (2007) [49], the black lines represent the faults of this study.
Minerals 13 00893 g007
Figure 8. Statistical map of fault characteristics in the northern area of the SYS: (a) statistical diagram of the fault number and directions; and (b) rose diagram of fault directions.
Minerals 13 00893 g008
Figure 9. Map of A–A′ profile gravity modelling (the profile position is shown in Figure 3 and Figure 4): (a) gravity anomaly curve; (b) gravity modelling results; (c) seismic geological results. F2: Wulian–Qingdao–Rongcheng fault; F3: Lianyungang–Qianliyan fault; F4: Jiashan–Xiangshui fault; F5: fault in the southern margin of NBSYS. JLB—Jiaolai Basin; JNU—Jiaonan Uplift; QLU—Qianliyan Uplift; NBSYS—the Northern Basin of the South Yellow Sea; MUSYS—the Middle Uplift of the South Yellow Sea.
Minerals 13 00893 g009
Figure 10. Map of B–B′ profile gravity modelling (the profile position is shown in Figure 3 and Figure 4): (a) gravity anomaly curve; (b) gravity modelling results; (c) seismic geological results. F4: Jiashan–Xiangshui fault; F5: fault in the southern margin of NBSYS. NBSYS—the Northern Basin of the South Yellow Sea; MUSYS—the Middle Uplift of the South Yellow Sea.
Minerals 13 00893 g010
Figure 11. Map of C–C′ profile gravity modelling (the profile position is shown in Figure 3 and Figure 4): (a) gravity anomaly curve; (b) gravity modelling results. F3: Lianyungang–Qianliyan fault; F4: Jiashan–Xiangshui fault. QLU—Qianliyan Uplift; NBSYS—the Northern Basin of the South Yellow Sea.
Minerals 13 00893 g011
Figure 12. Map of the interface depth and tectonic unit division: (a) RA curve of gravity anomaly and pre-Sinian basement depth in the north; (b) RA curve of gravity anomaly and pre-Sinian basement depth in the south; (c) the map of Cenozoic depth; (d) the map of pre-Sinian basement depth. SYS—the South Yellow Sea; LXU—Luxi Uplift; JLB—Jiaolai Basin; JNU—Jiaonan Uplift; QLU—Qianliyan Uplift; NBSYS—the Northern Basin of the South Yellow Sea; MUSYS—the Middle Uplift of the South Yellow Sea. The red lines represent structural boundary; the red dashed lines represent secondary structural boundary.
Minerals 13 00893 g012
Figure 13. Map of the hydrocarbon prospects. The base map is the Mesozoic-Paleozoic thickness; the purple ranges represent the target prospect areas; the blue ranges represent the favorable prospect areas. SYS—the South Yellow Sea; LXU—Luxi Uplift; JLB—Jiaolai Basin; JNU—Jiaonan Uplift; QLU—Qianliyan Uplift; NBSYS—the Northern Basin of the South Yellow Sea; MUSYS—the Middle Uplift of the South Yellow Sea. The red lines represent structural boundary; the red dashed lines represent secondary structural boundary; the purple lines represent target hydrocarbon prospects; the blue lines represent favorable hydrocarbon prospects.
Minerals 13 00893 g013
Table 1. Comparison of the basement depth between seismic interpretation and the results of RA.
NumberBasement Depth by Seismic Interpretation (m)Basement Depth Calculated by the Regression Formula (m)Difference
(m)
Difference
%
17599.257564.6434.610.46
27818.268468.2−649.947.68
37781.768515.16−733.48.61
46832.747538.48−705.749.36
57307.257441.83−134.581.81
67562.758093.74−530.996.56
76650.247549.32−899.0811.81
86467.746664.87−197.132.96
98475.277889.26586.017.42
108438.778773.33−334.563.81
119533.788841.07692.717.84
128949.778781.61168.161.91
138781.069376.66−595.66.35
147622.427460.35162.072.17
156463.786502.93−39.150.60
167359.096506.29852.813.11
178201.749091.95−890.219.79
187464.428252.78−788.369.55
199149.728941.66208.062.33
σ = i = 1 N σ i σ ¯ 2 n = ± 532.11 , σ: mean square error.
Disclaimer/Publisher’s Note: The statements, opinions and data contained in all publications are solely those of the individual author(s) and contributor(s) and not of MDPI and/or the editor(s). MDPI and/or the editor(s) disclaim responsibility for any injury to people or property resulting from any ideas, methods, instructions or products referred to in the content.