

Extraction of Gallium from Brown Corundum Dust by Roasting—Acid Leaching Process


Abstract
1. Introduction
2. Experimental
2.1. Brown Corundum Dust
2.2. Reagents and Apparatus
2.3. Operational Procedure
3. Results and Discussion
3.1. Effect of Roasting
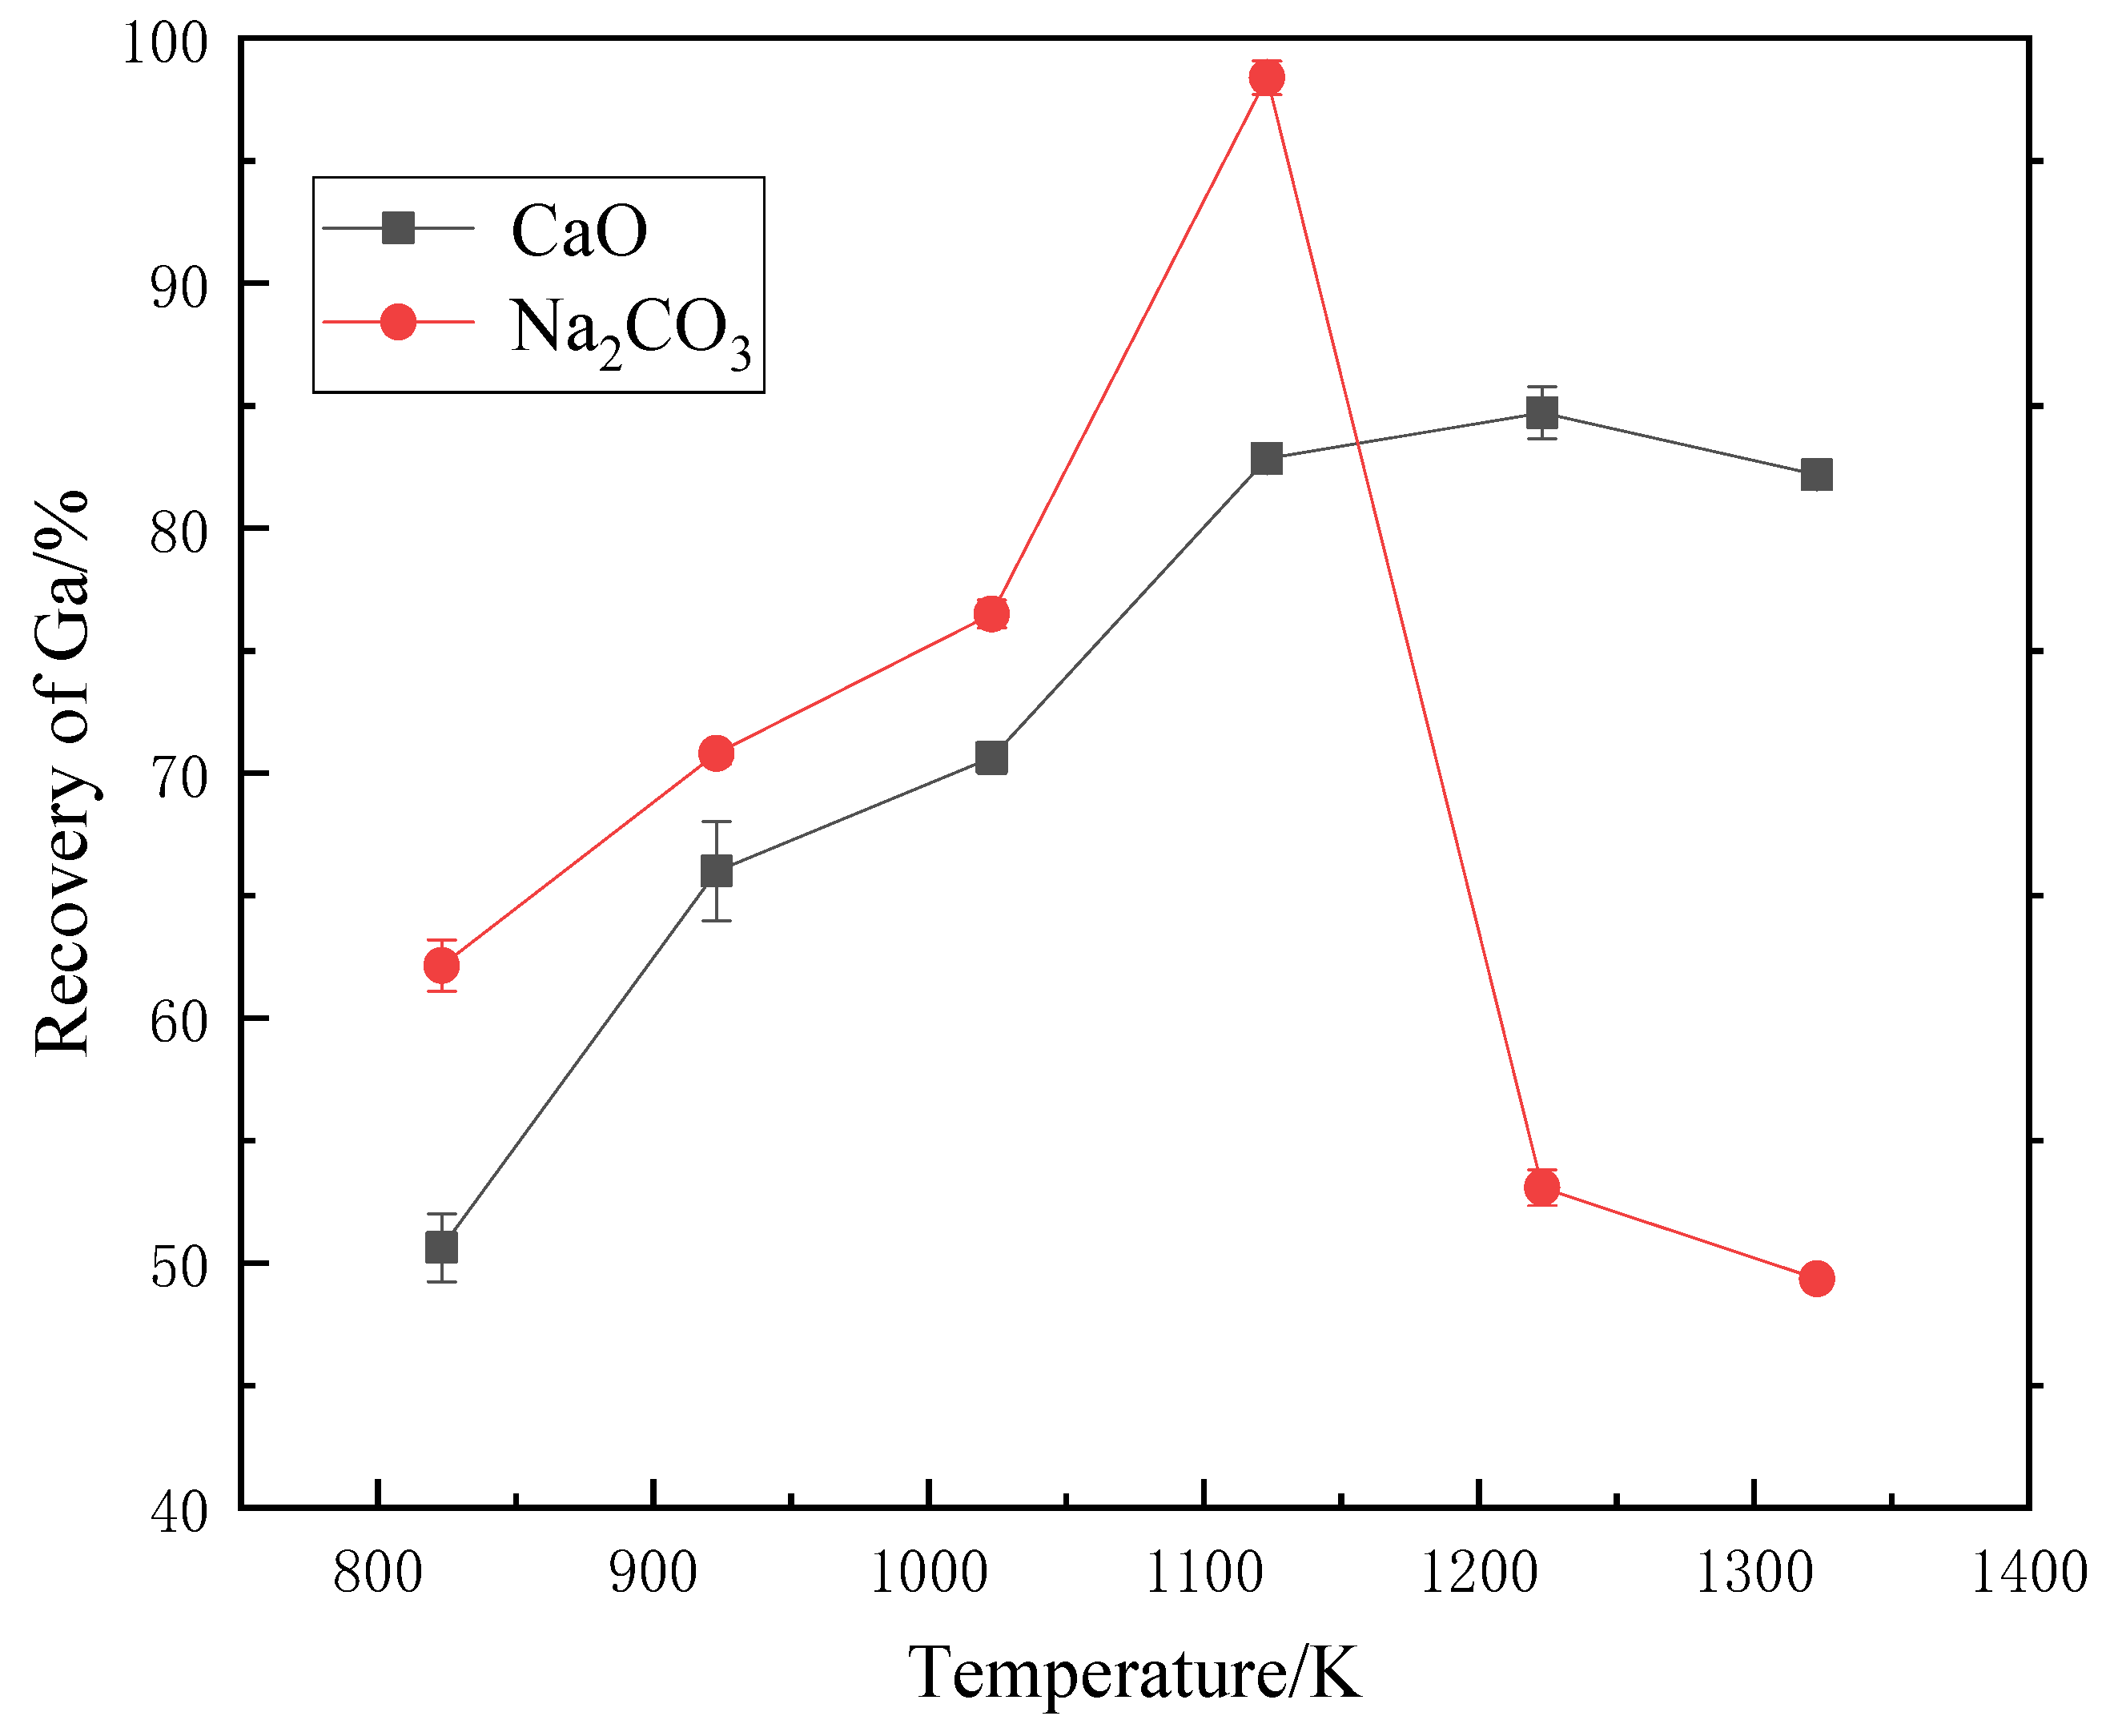
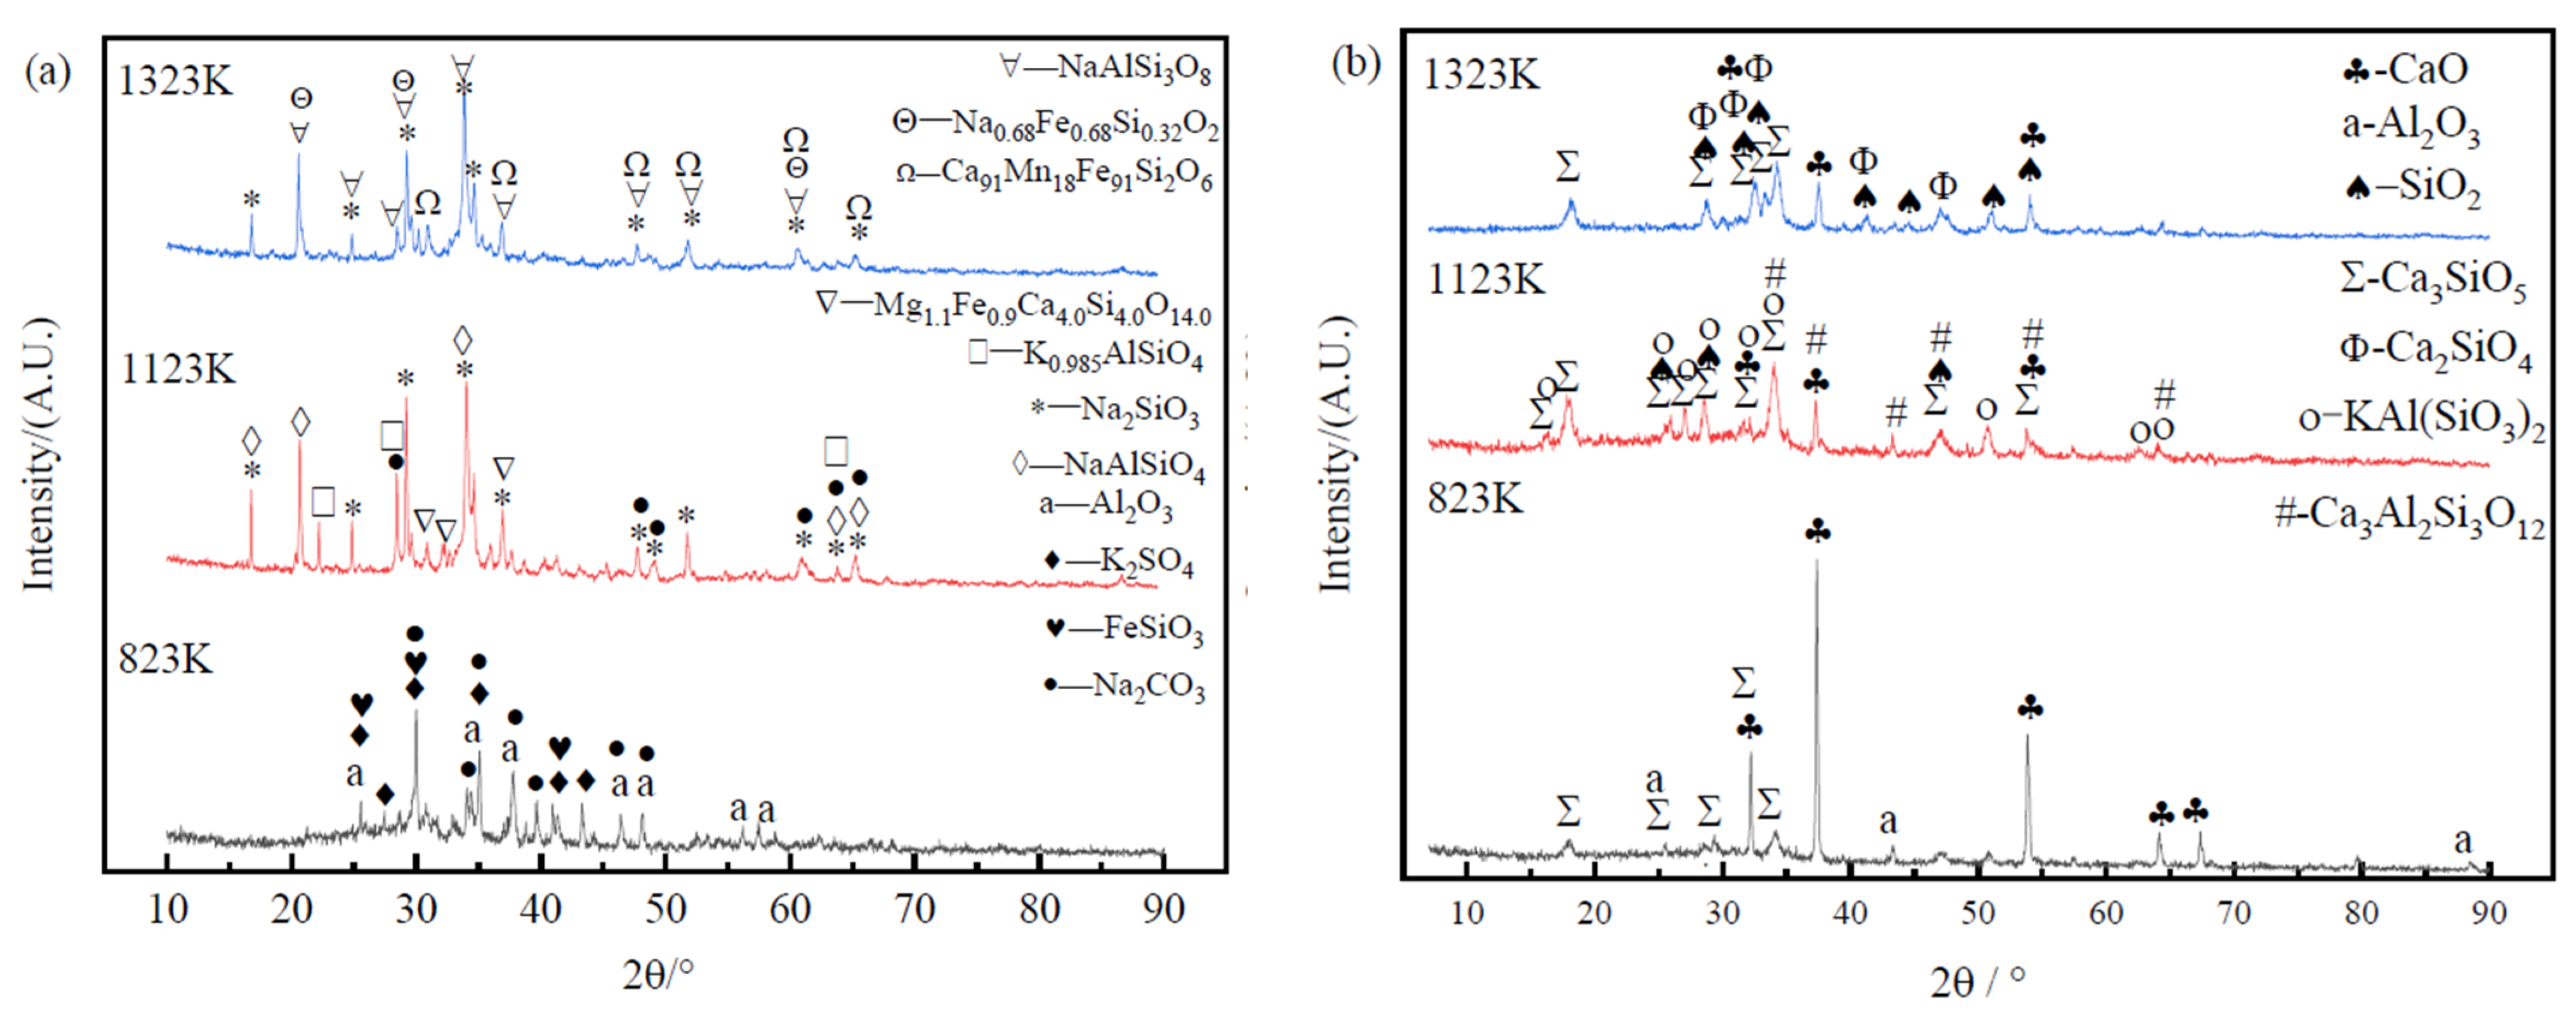
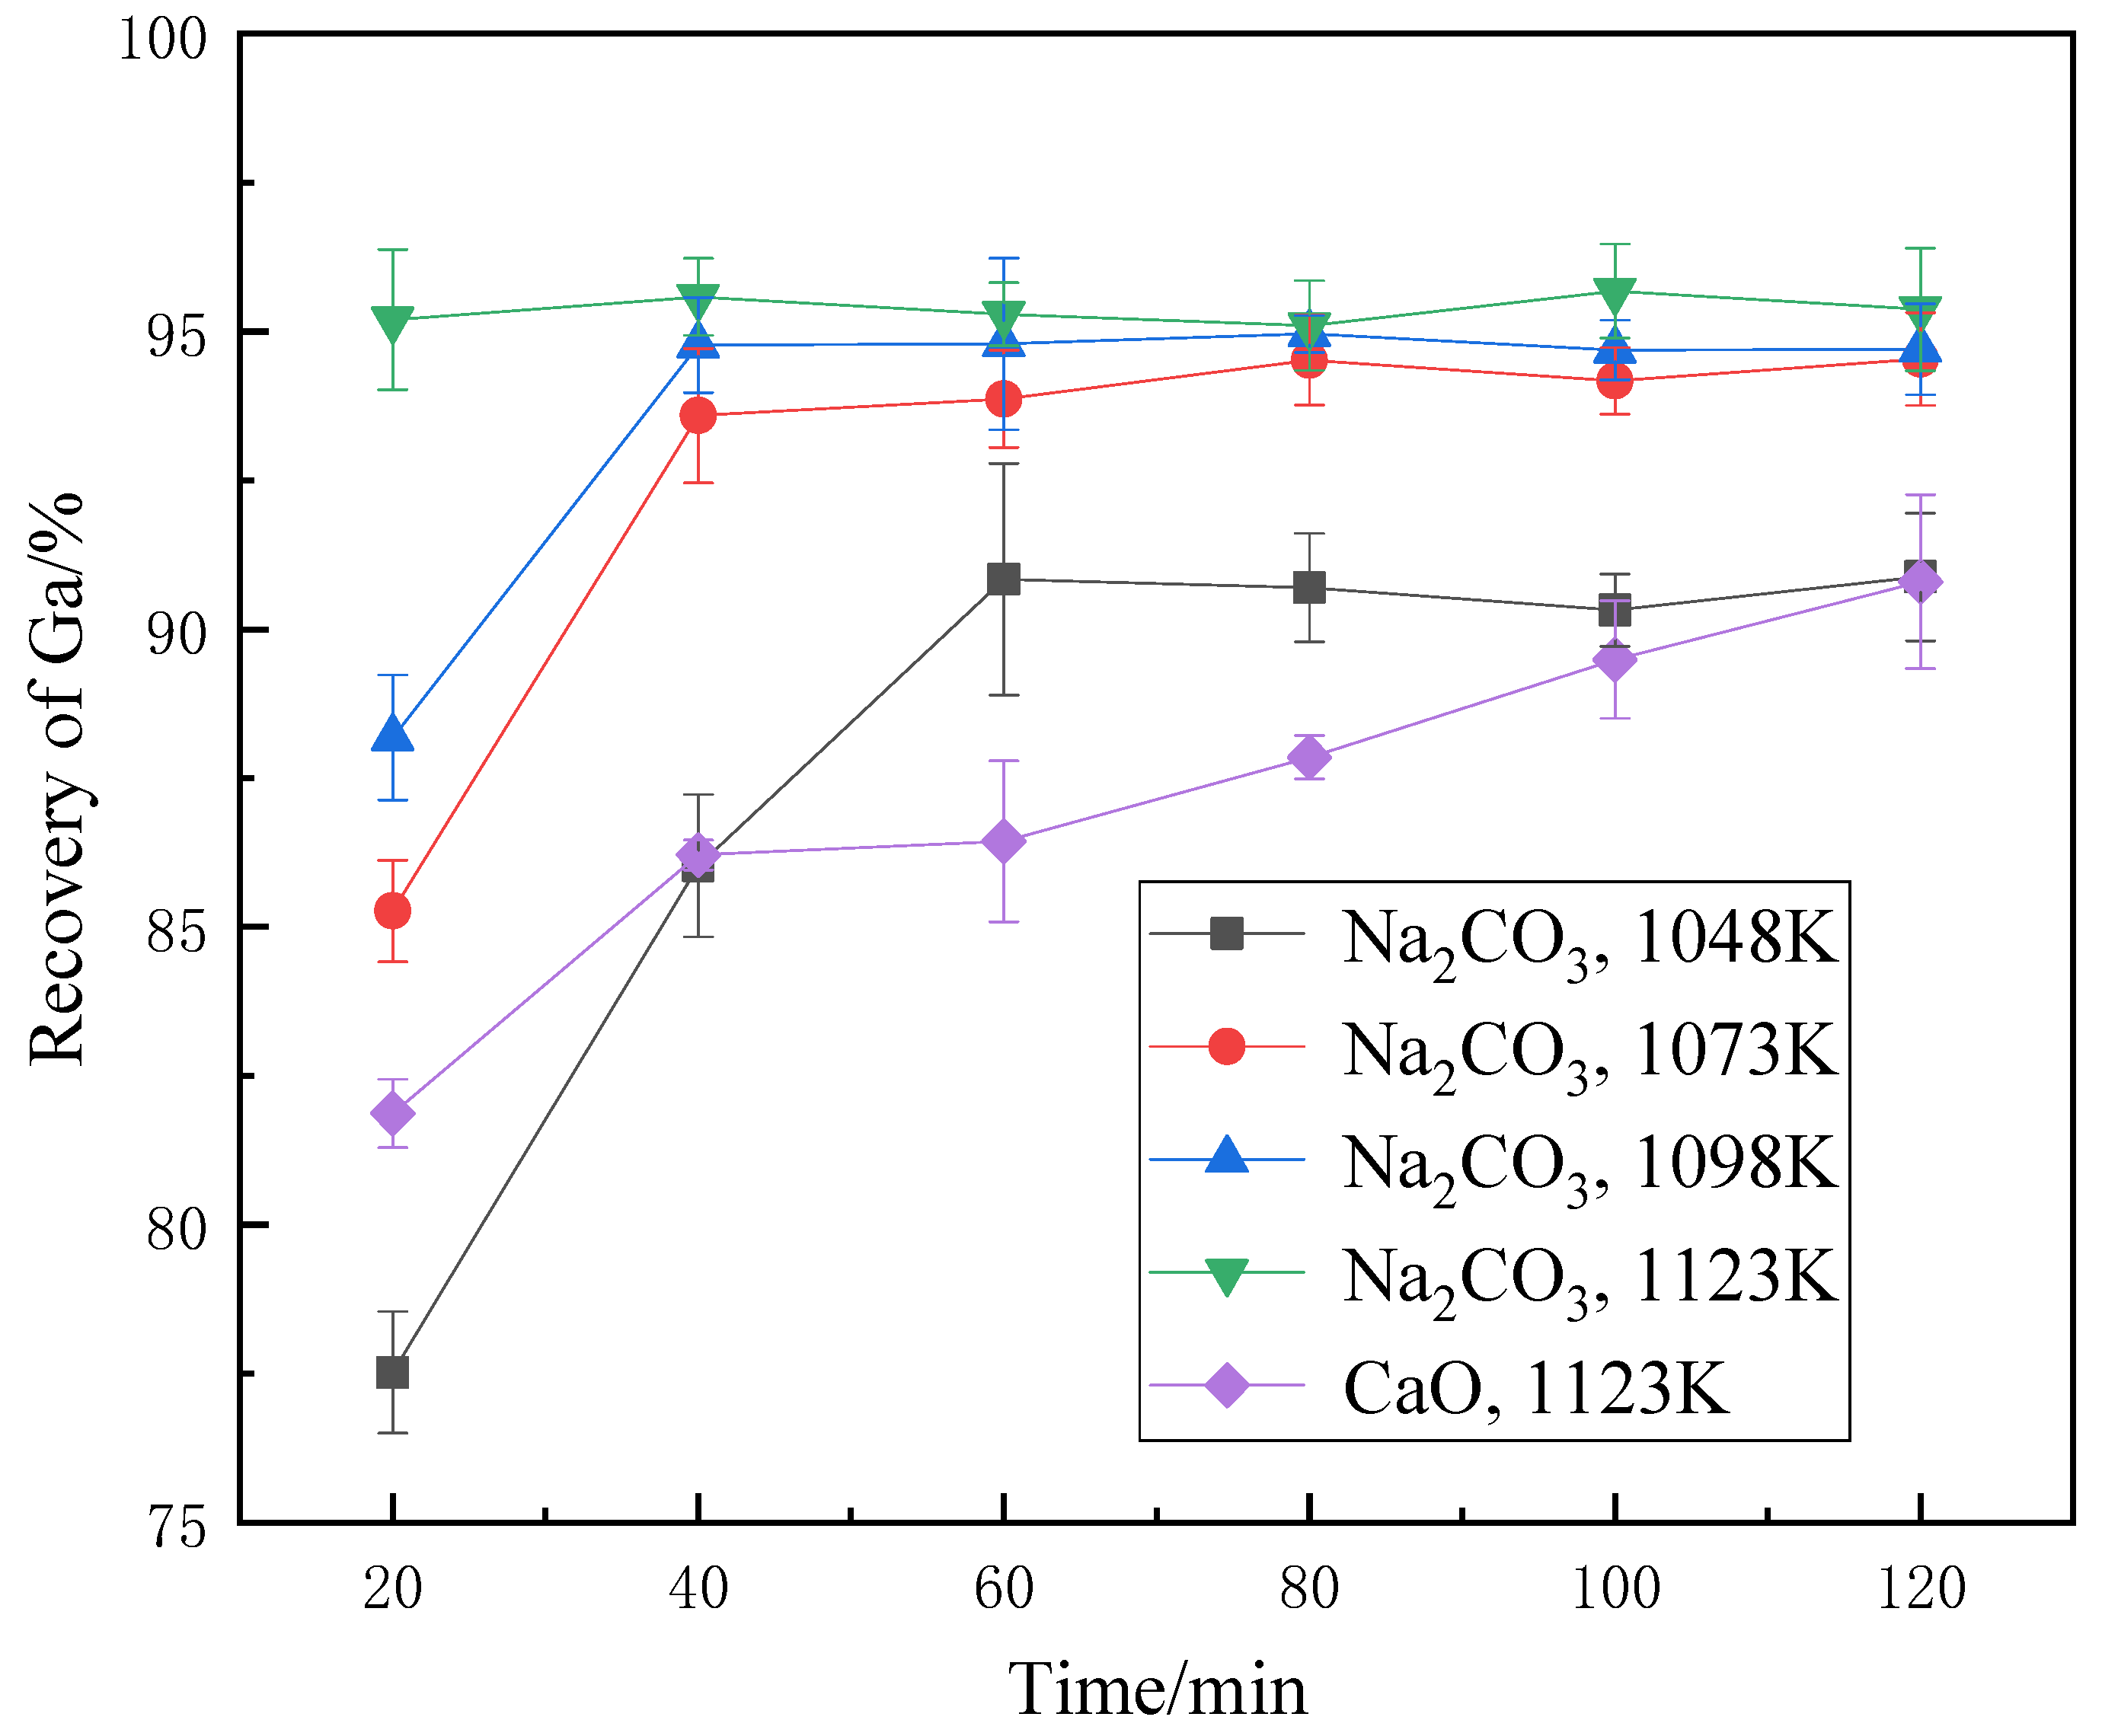
3.1.1. Roasting Temperature
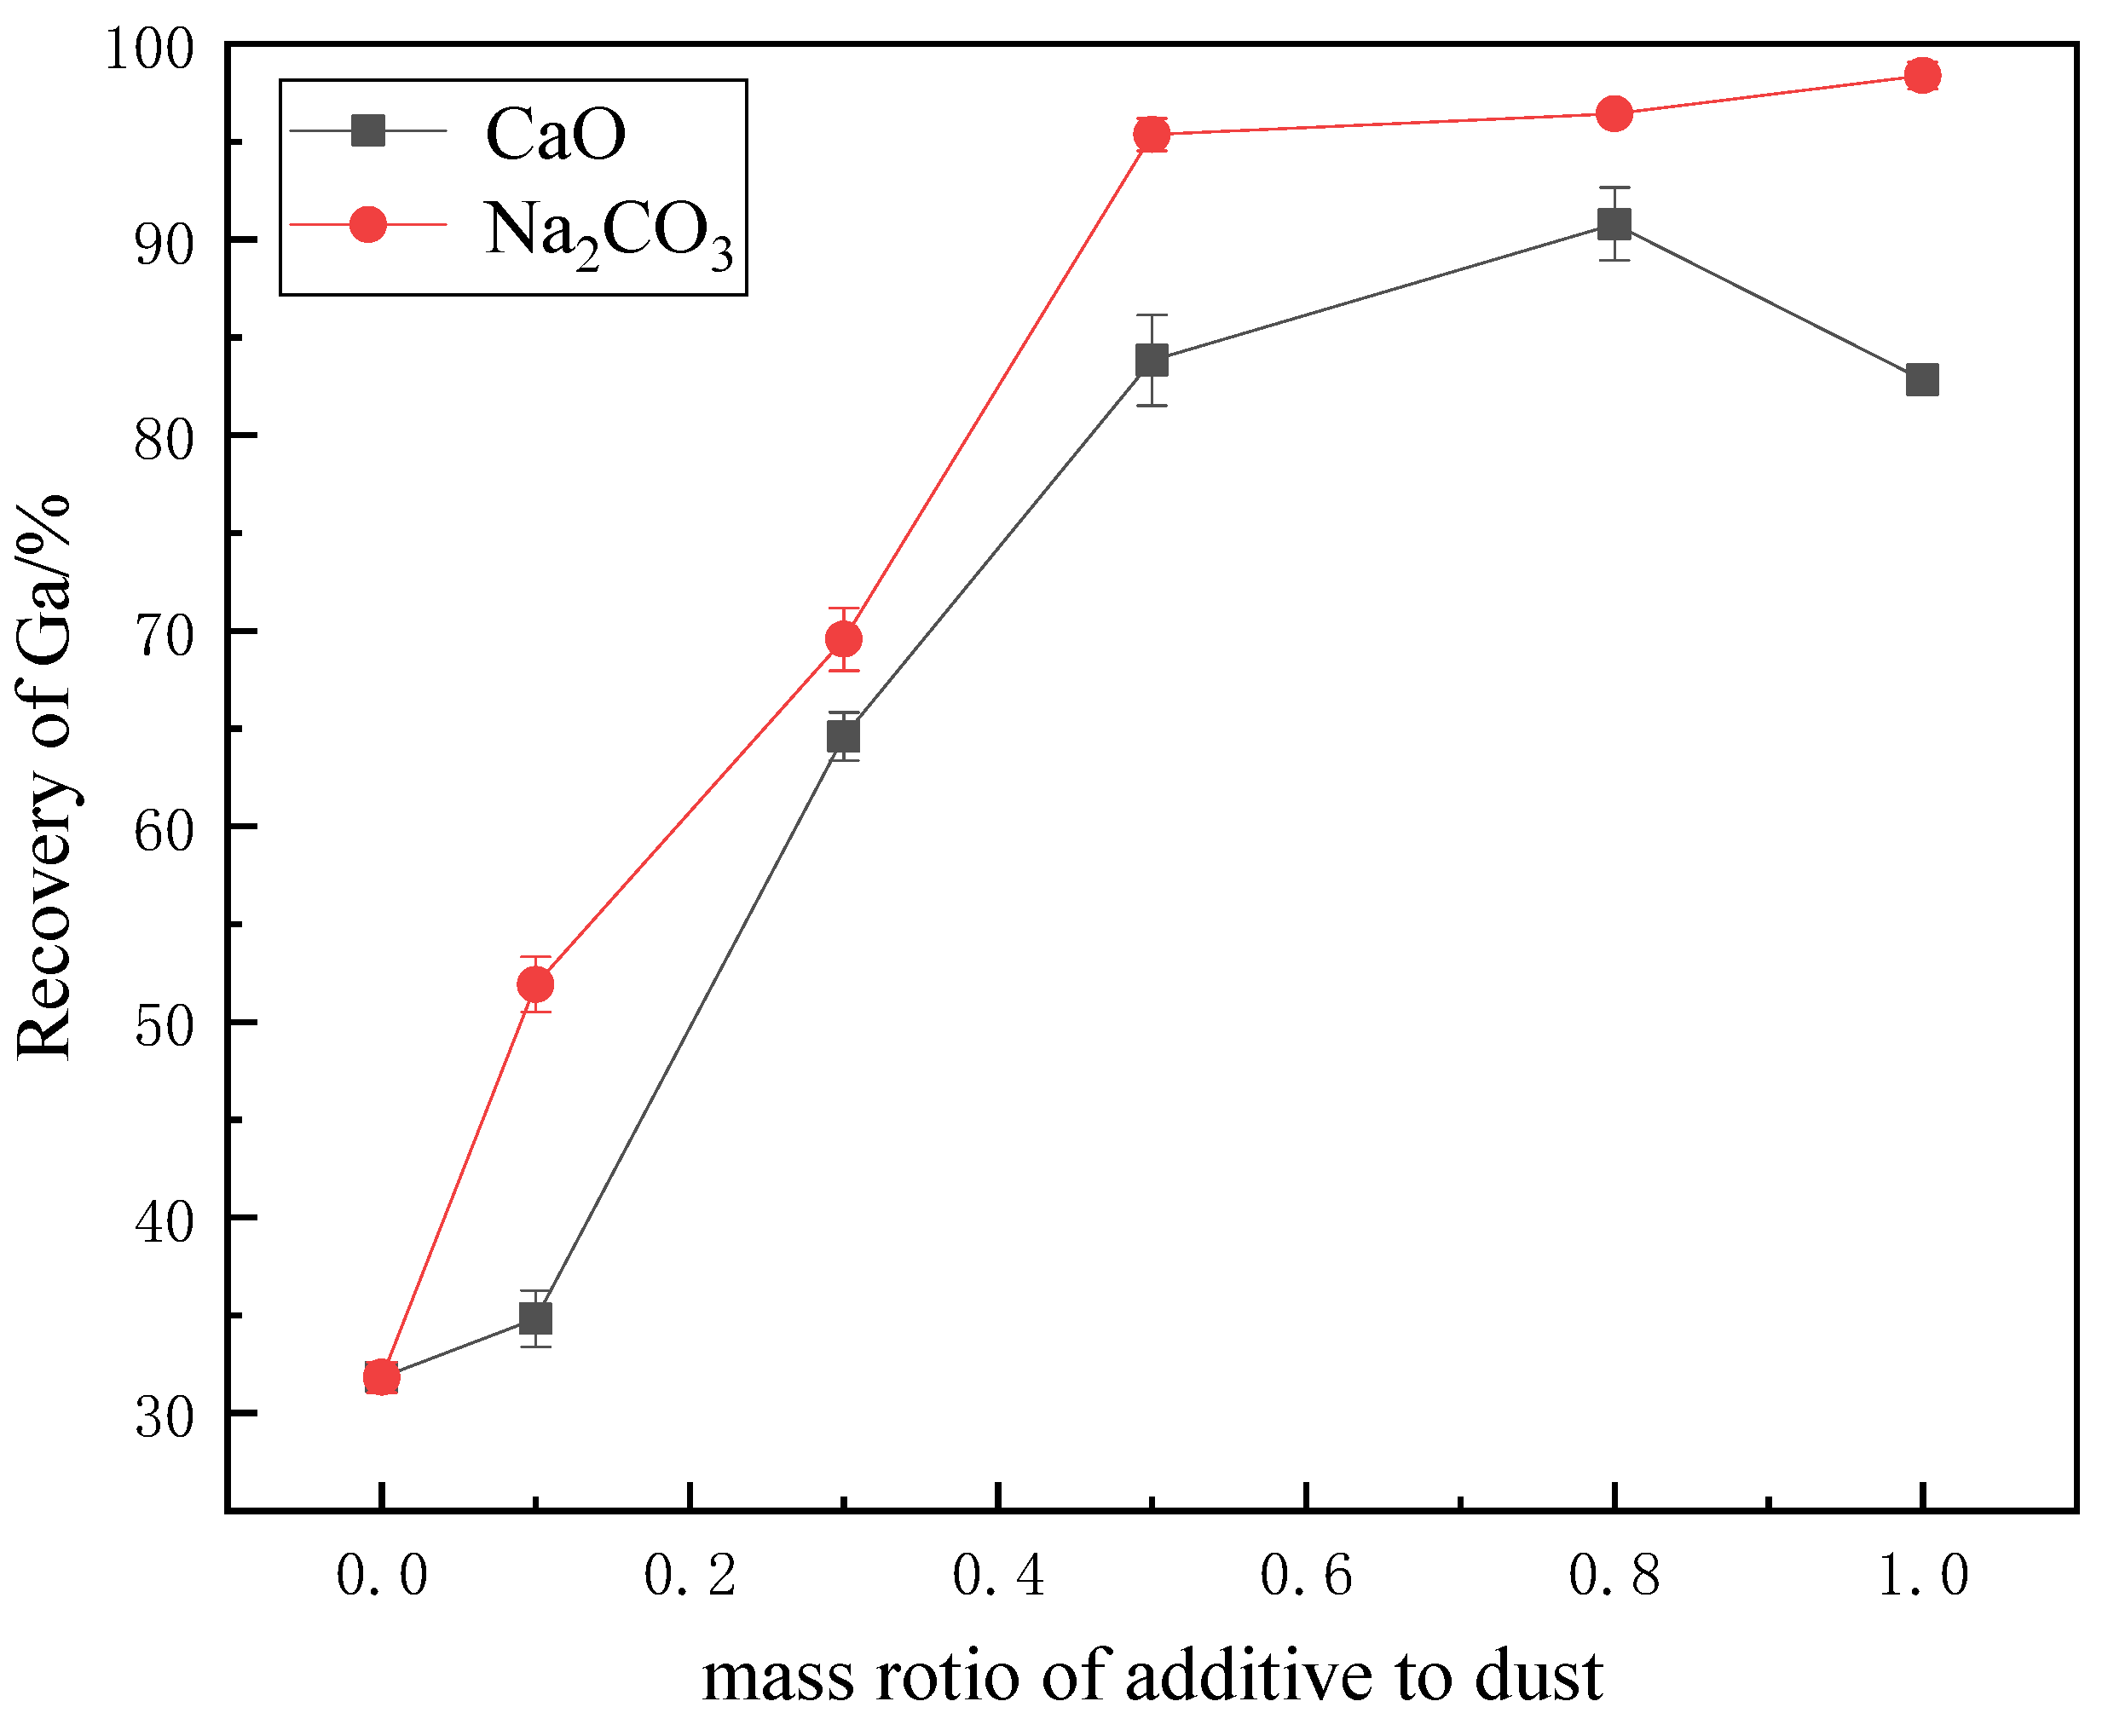
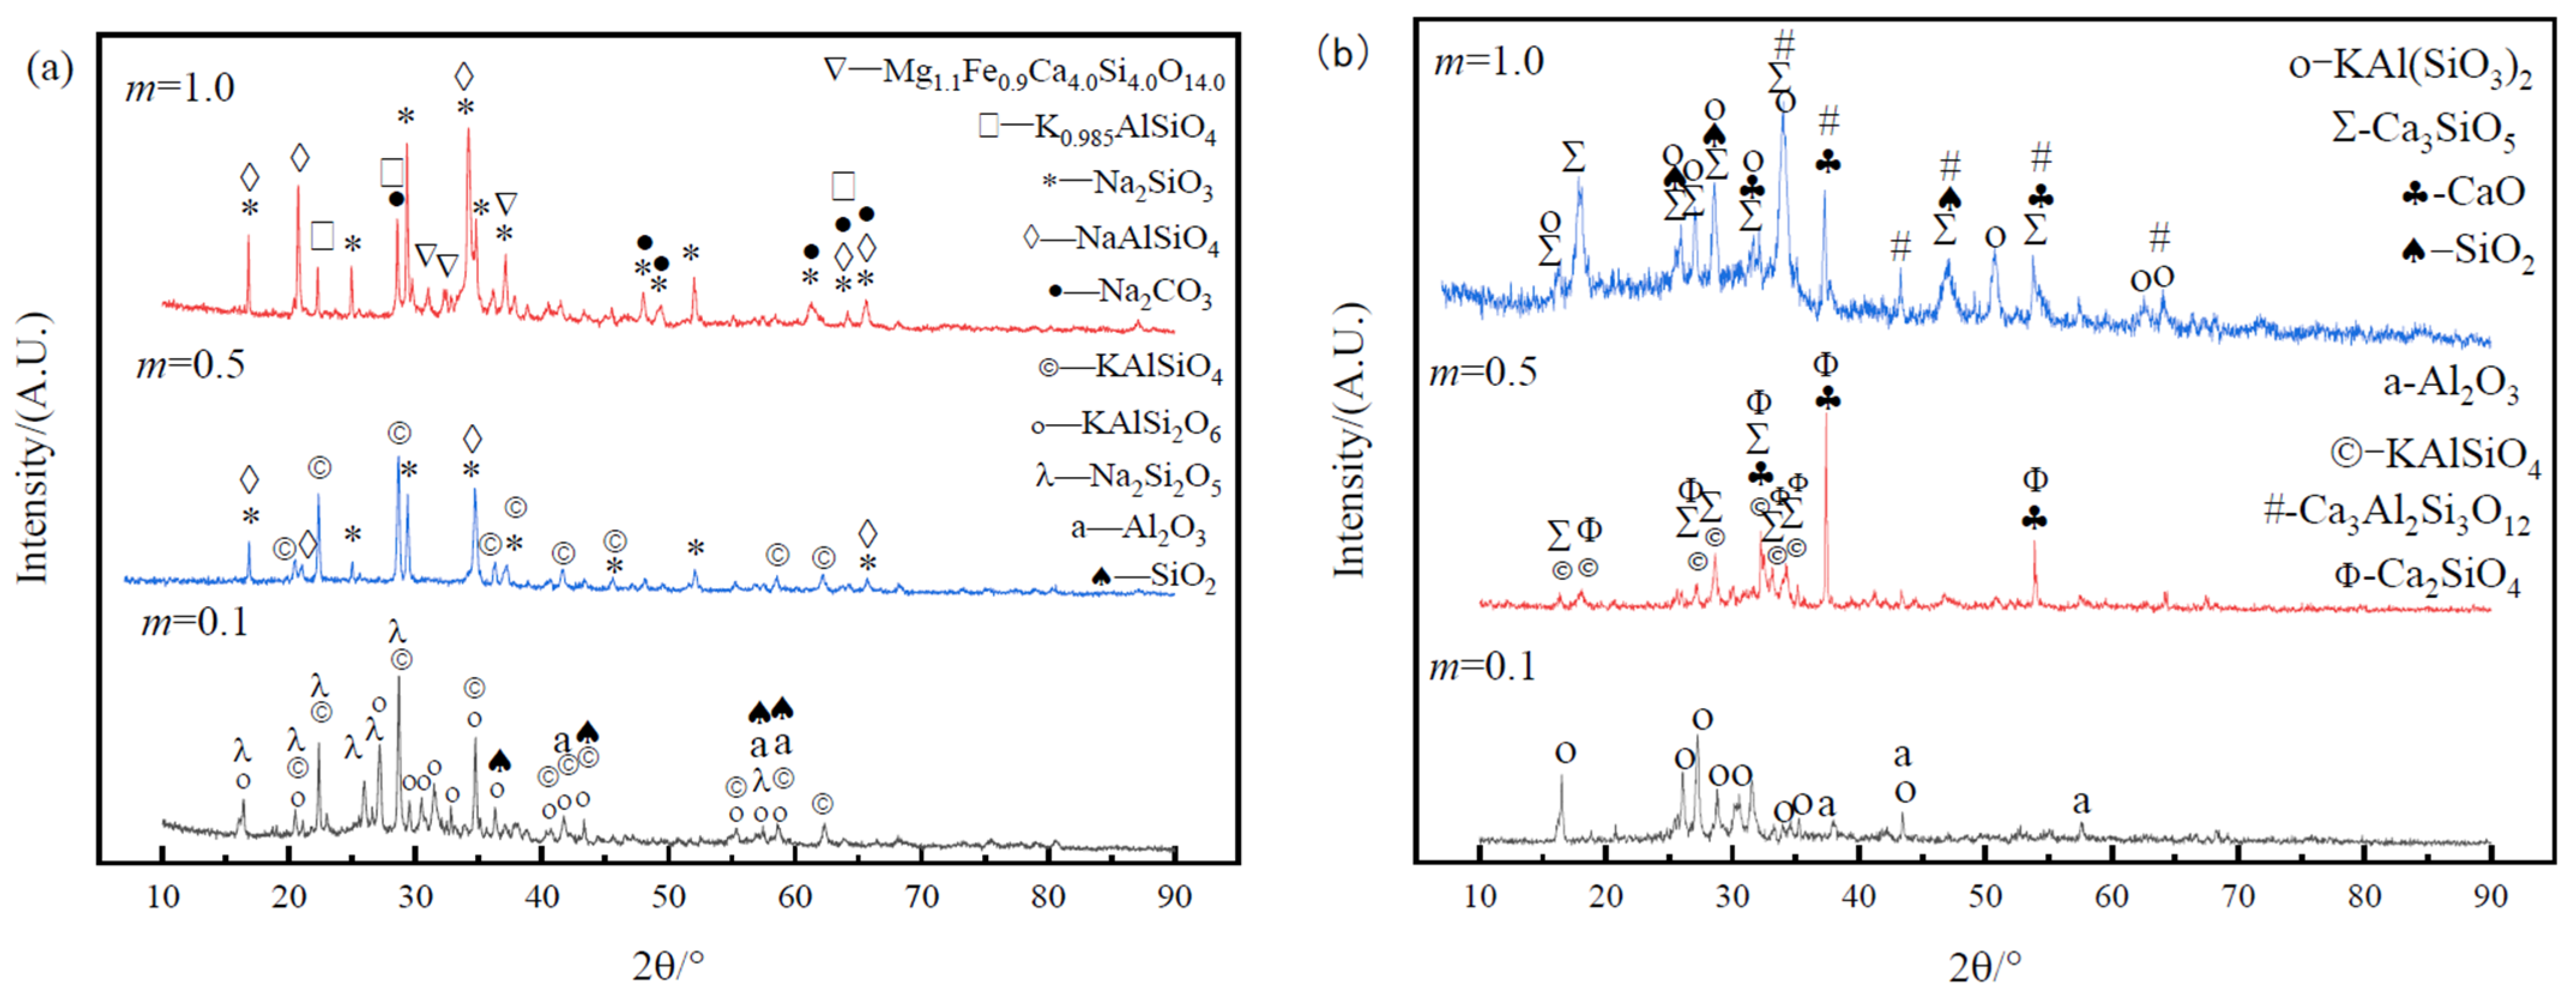
3.1.2. Additive Dosage
3.1.3. Roasting Time
3.2. Effect of Acid Leaching
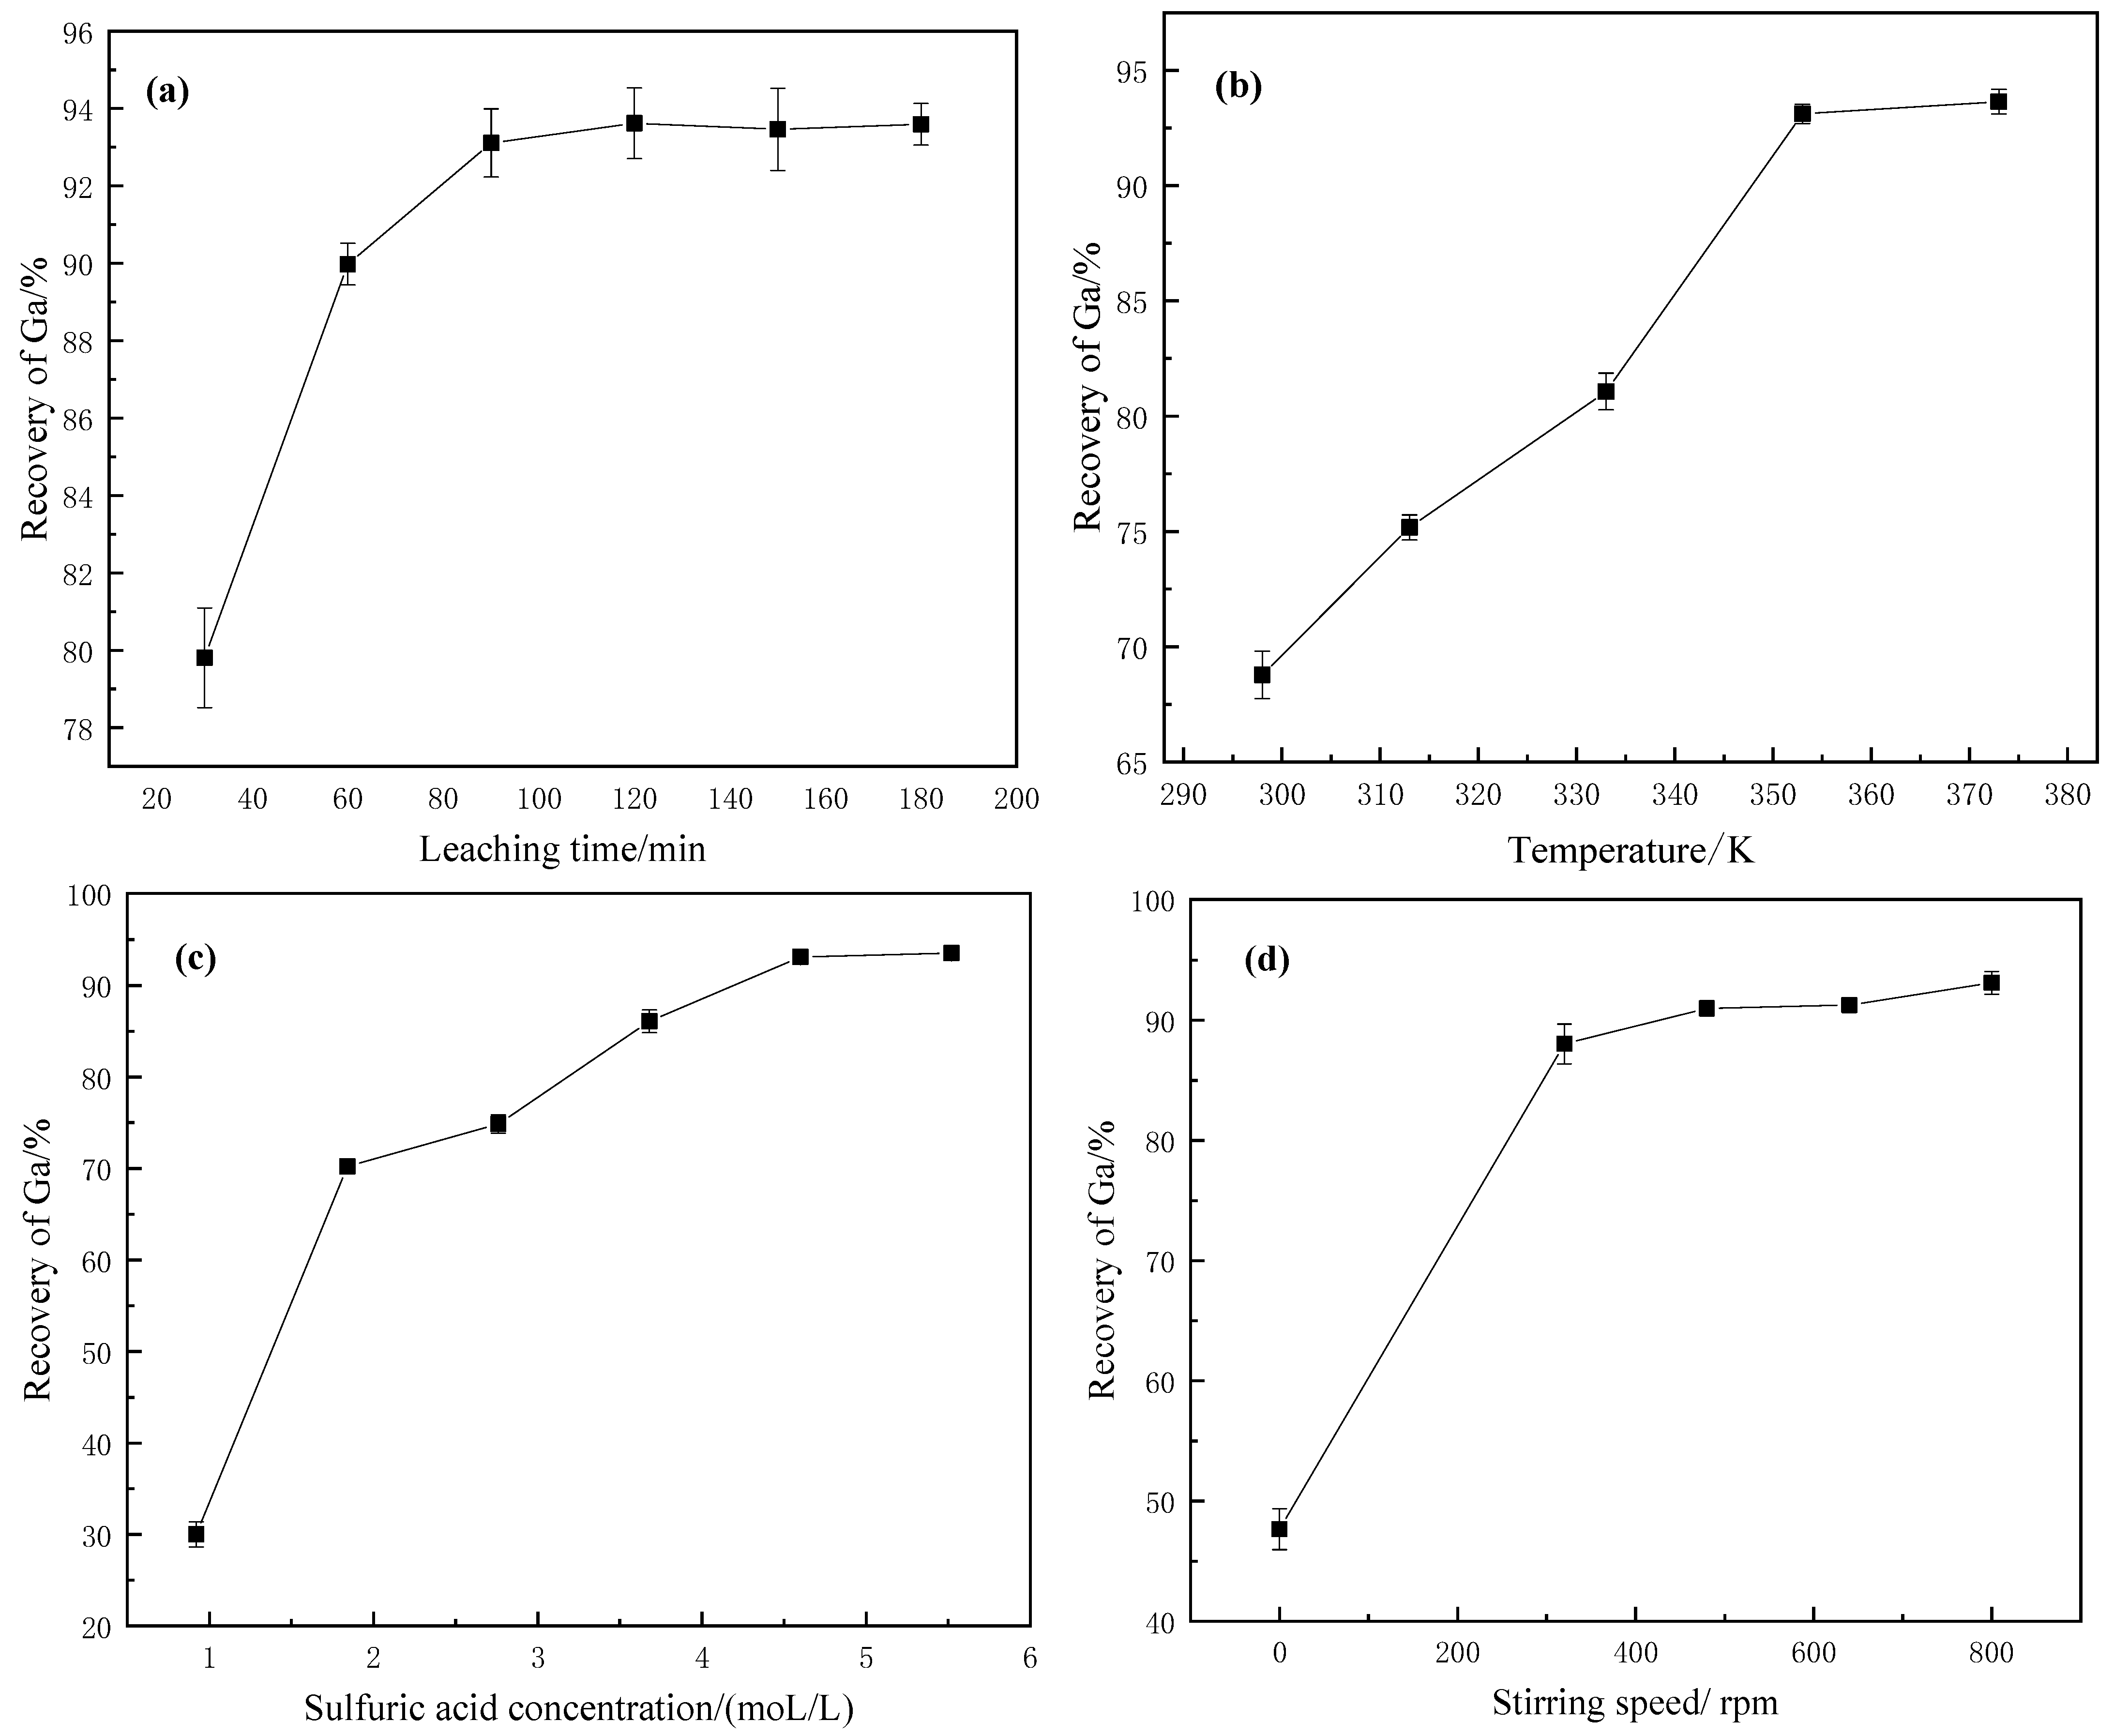
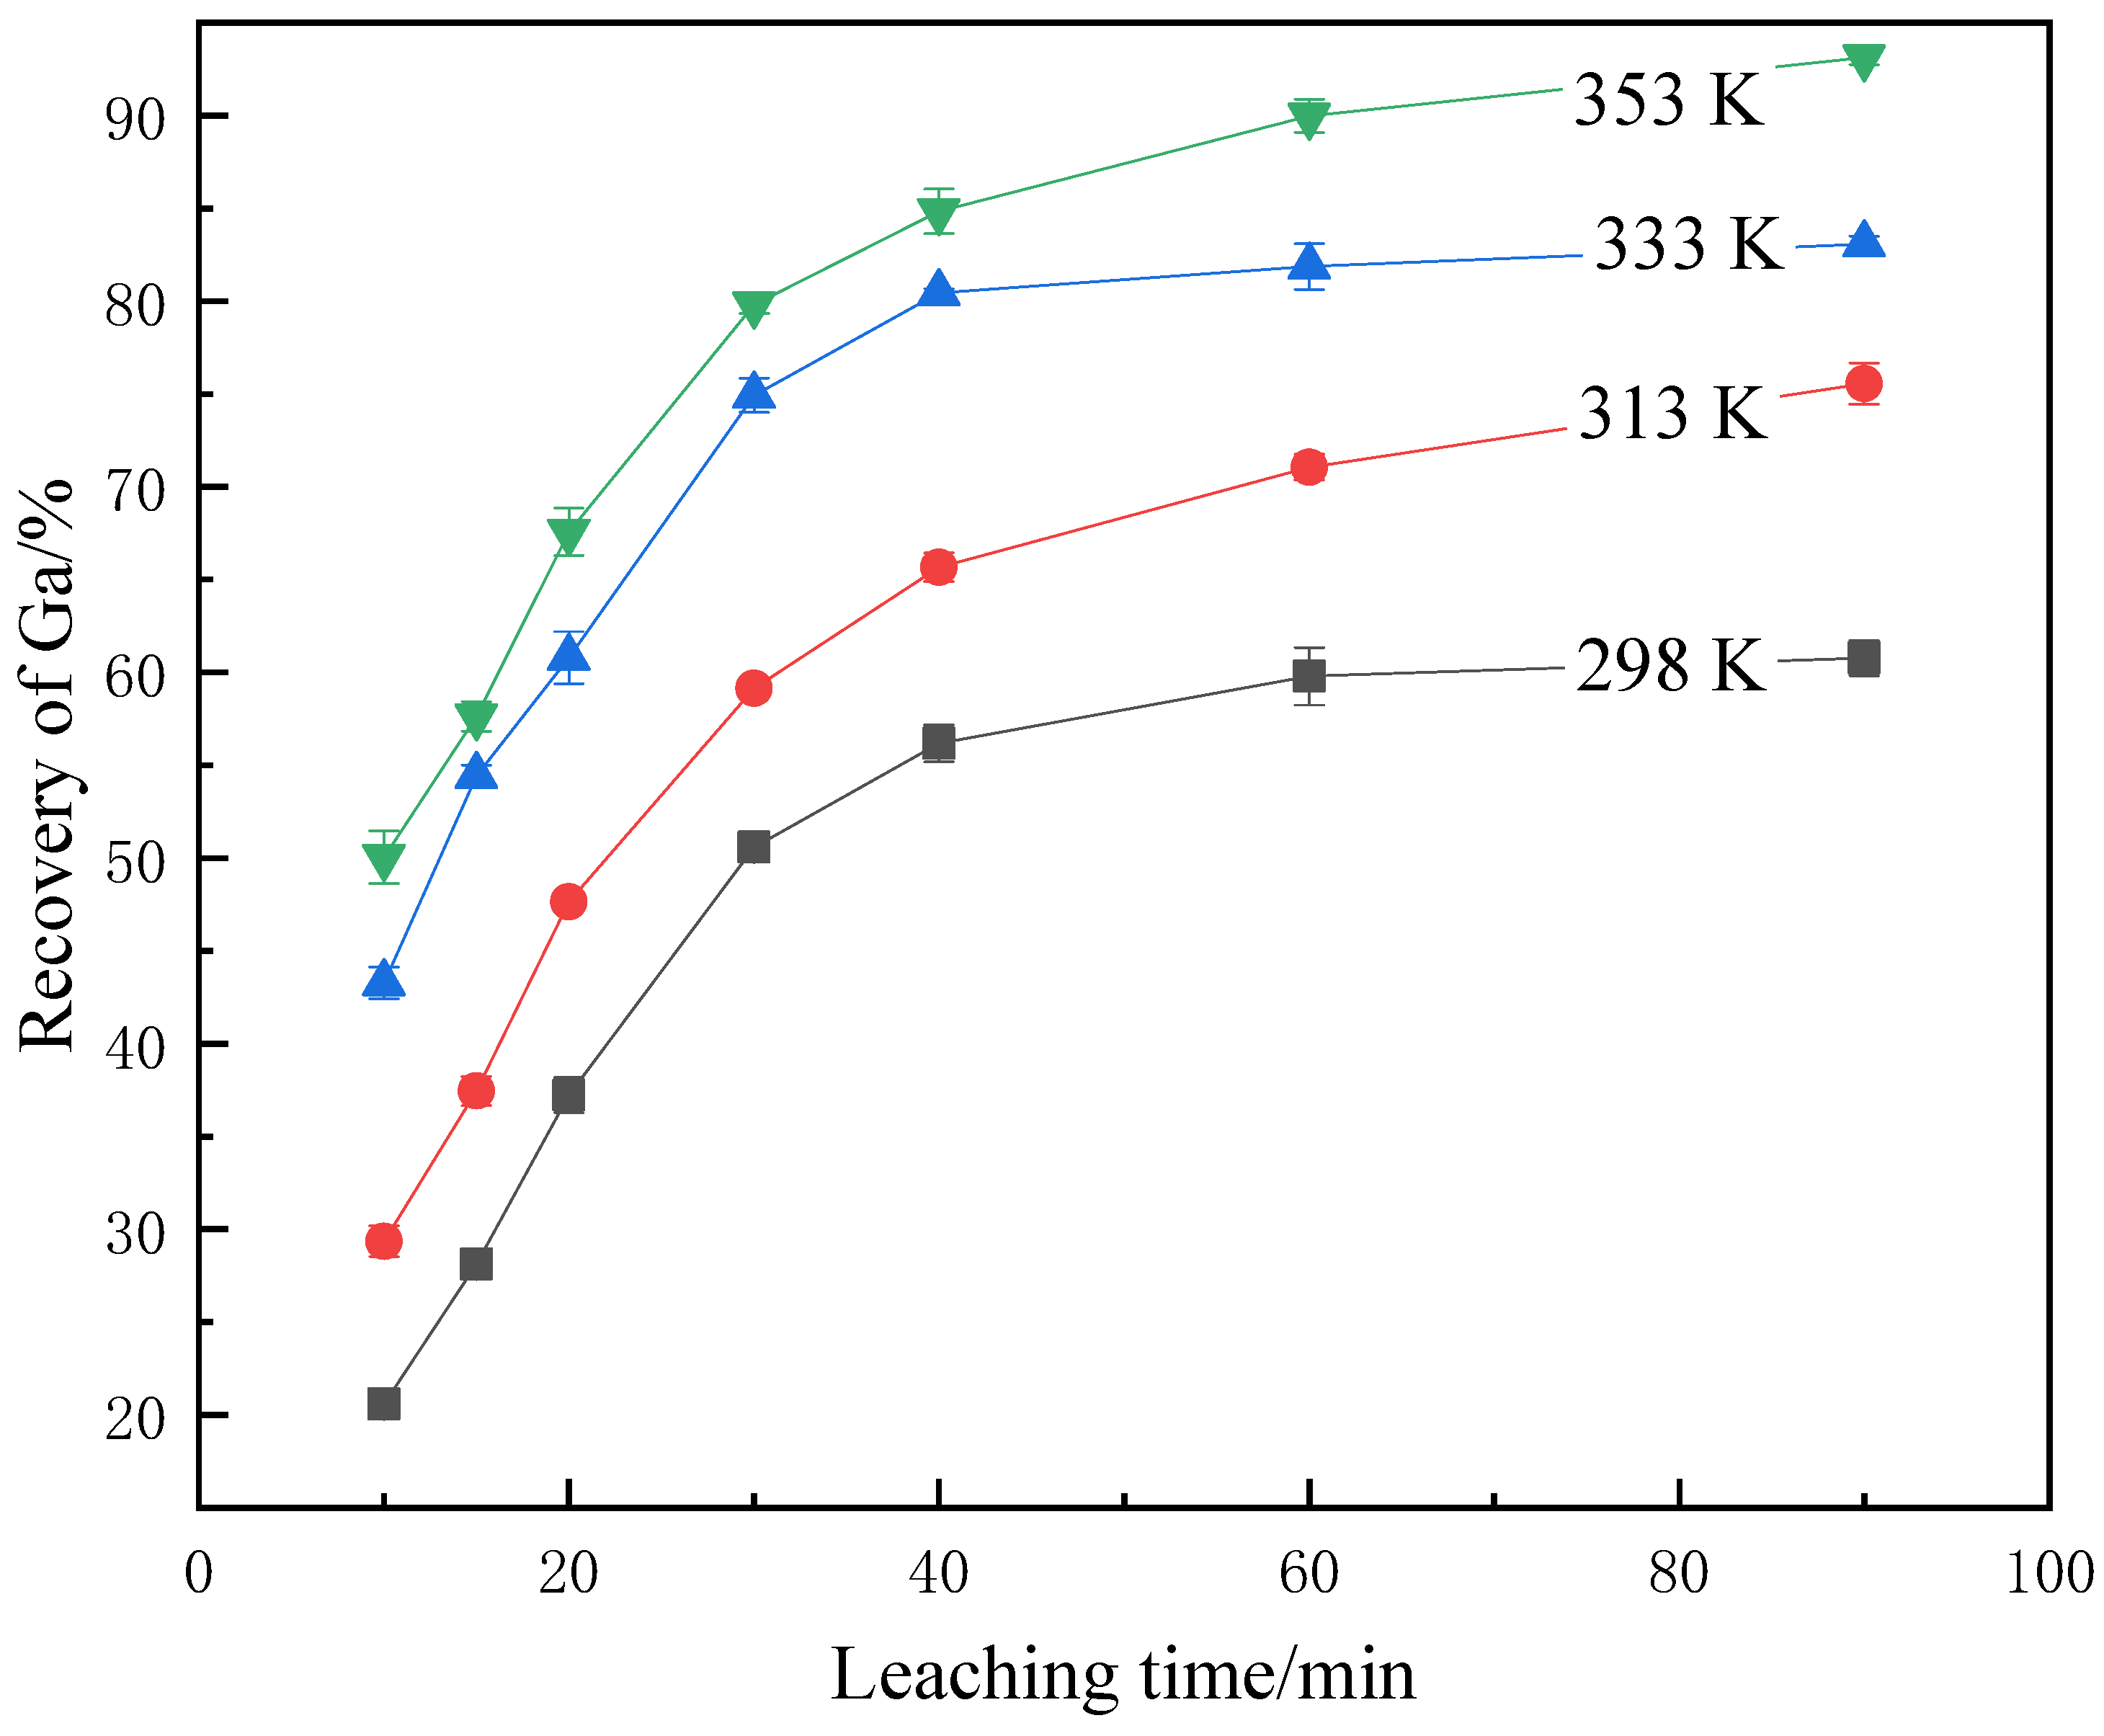
3.2.1. Leaching Parameters
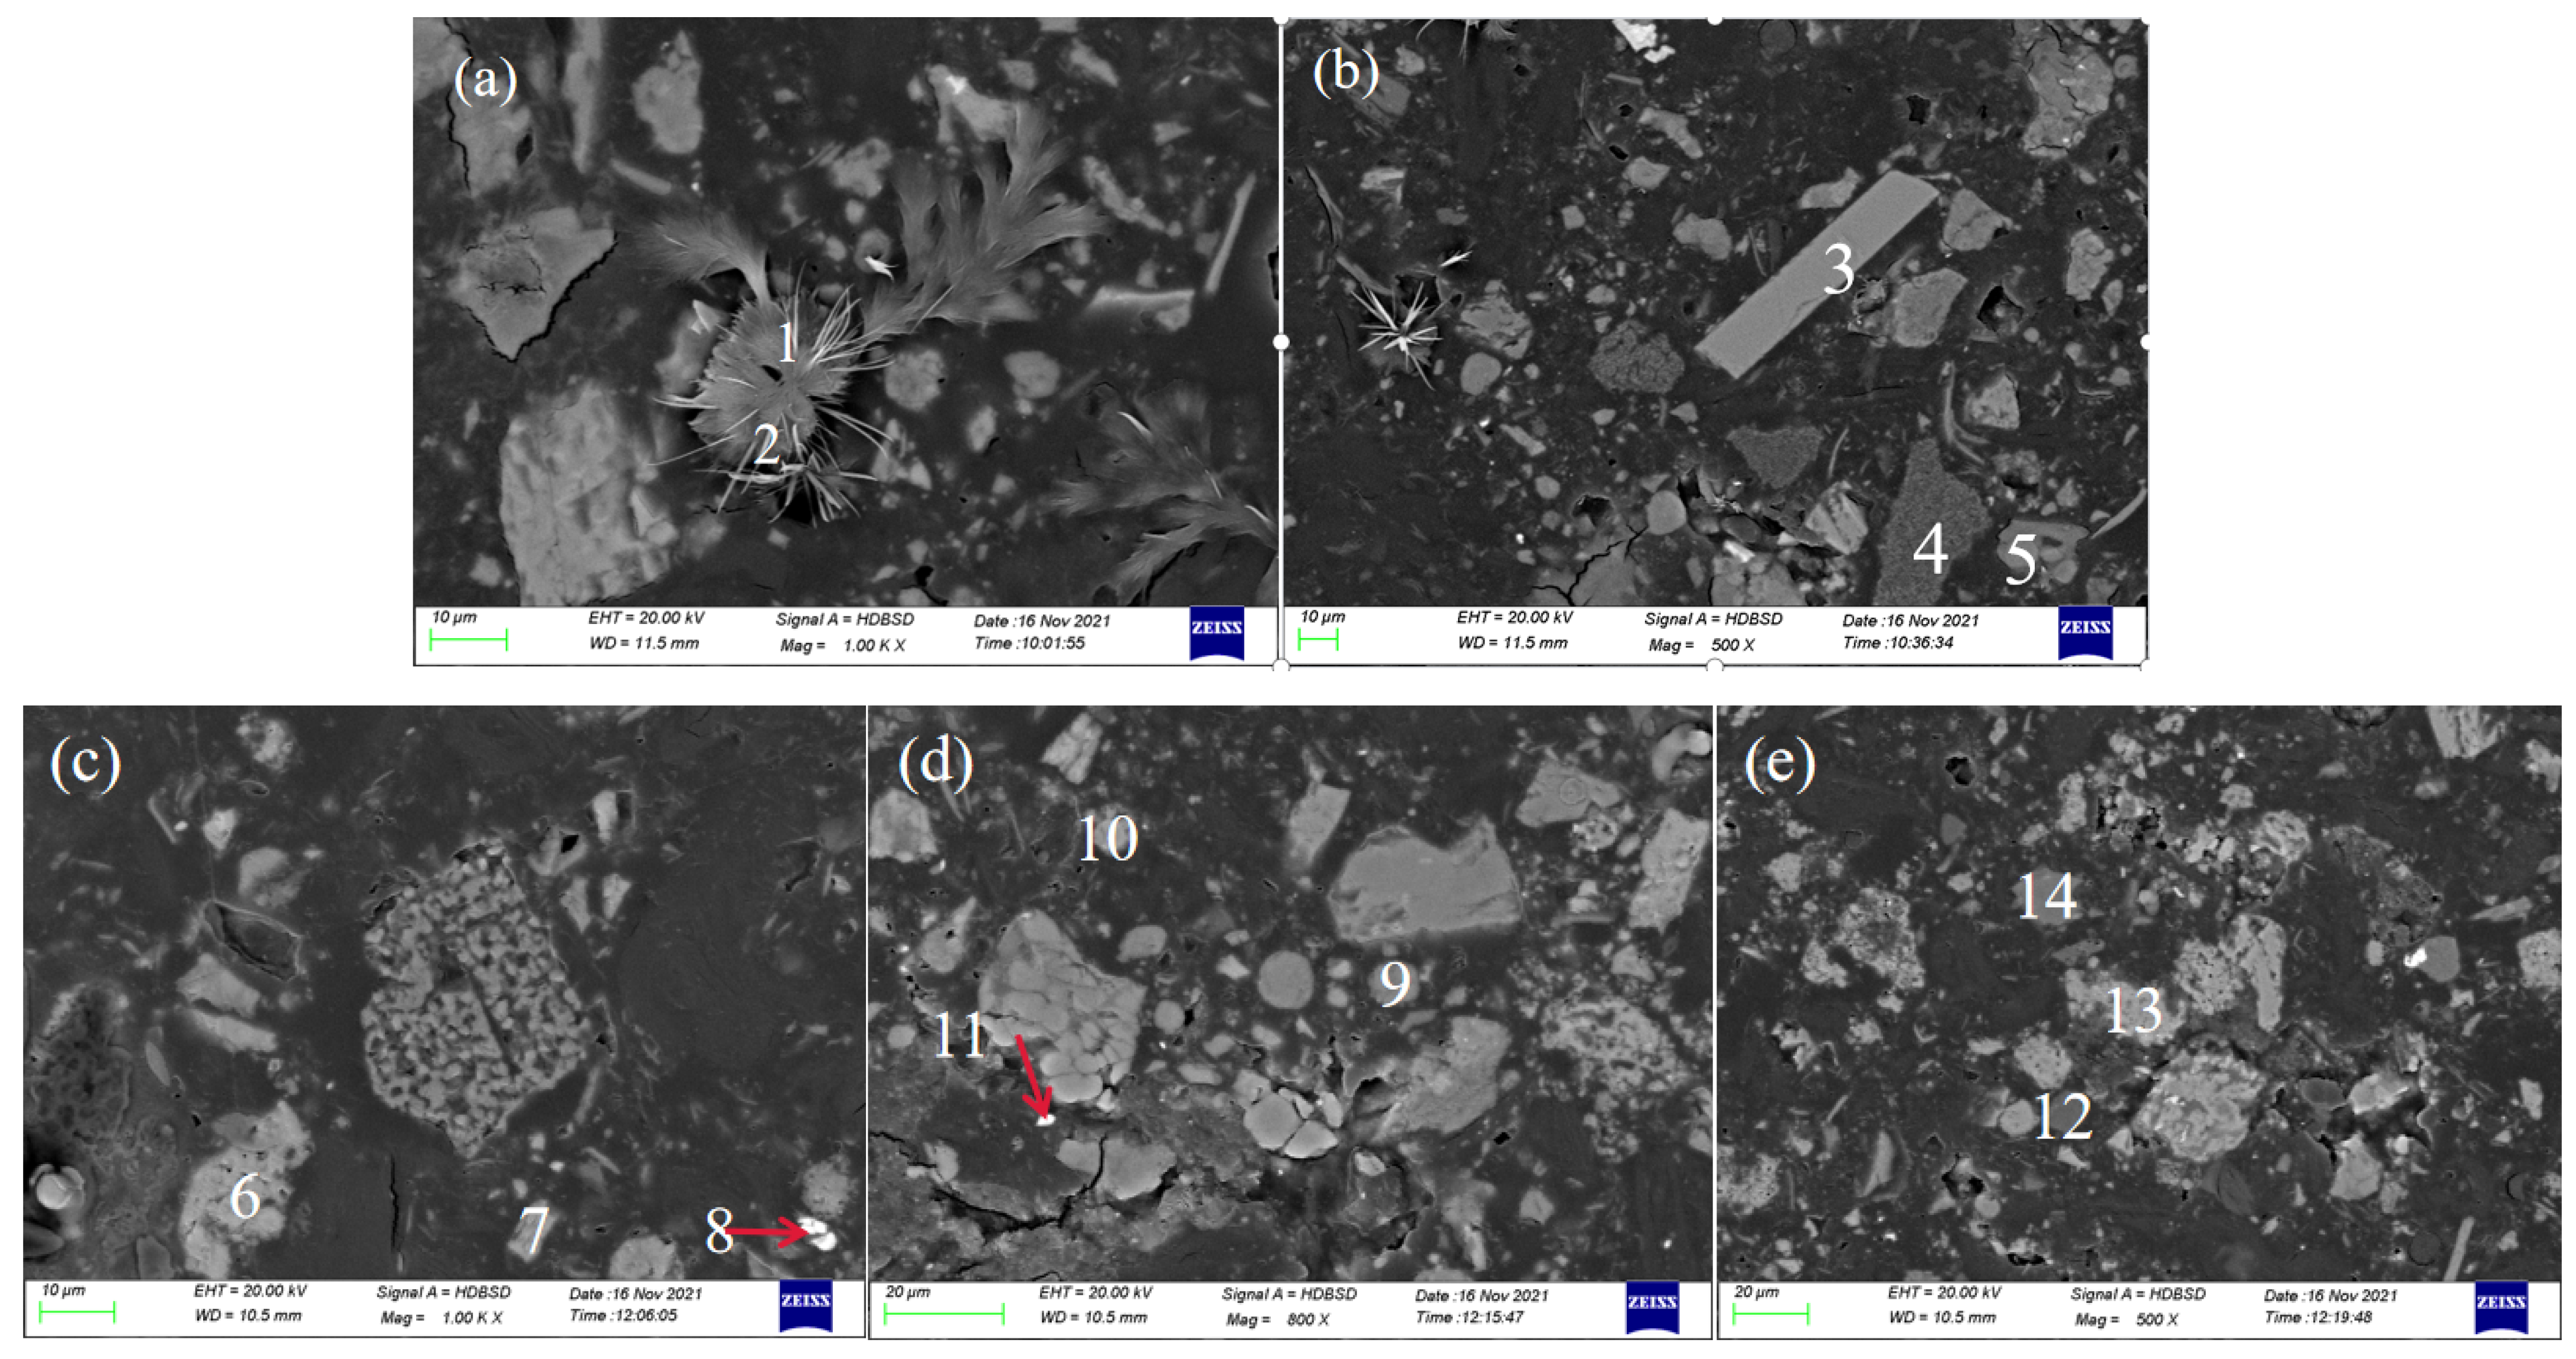
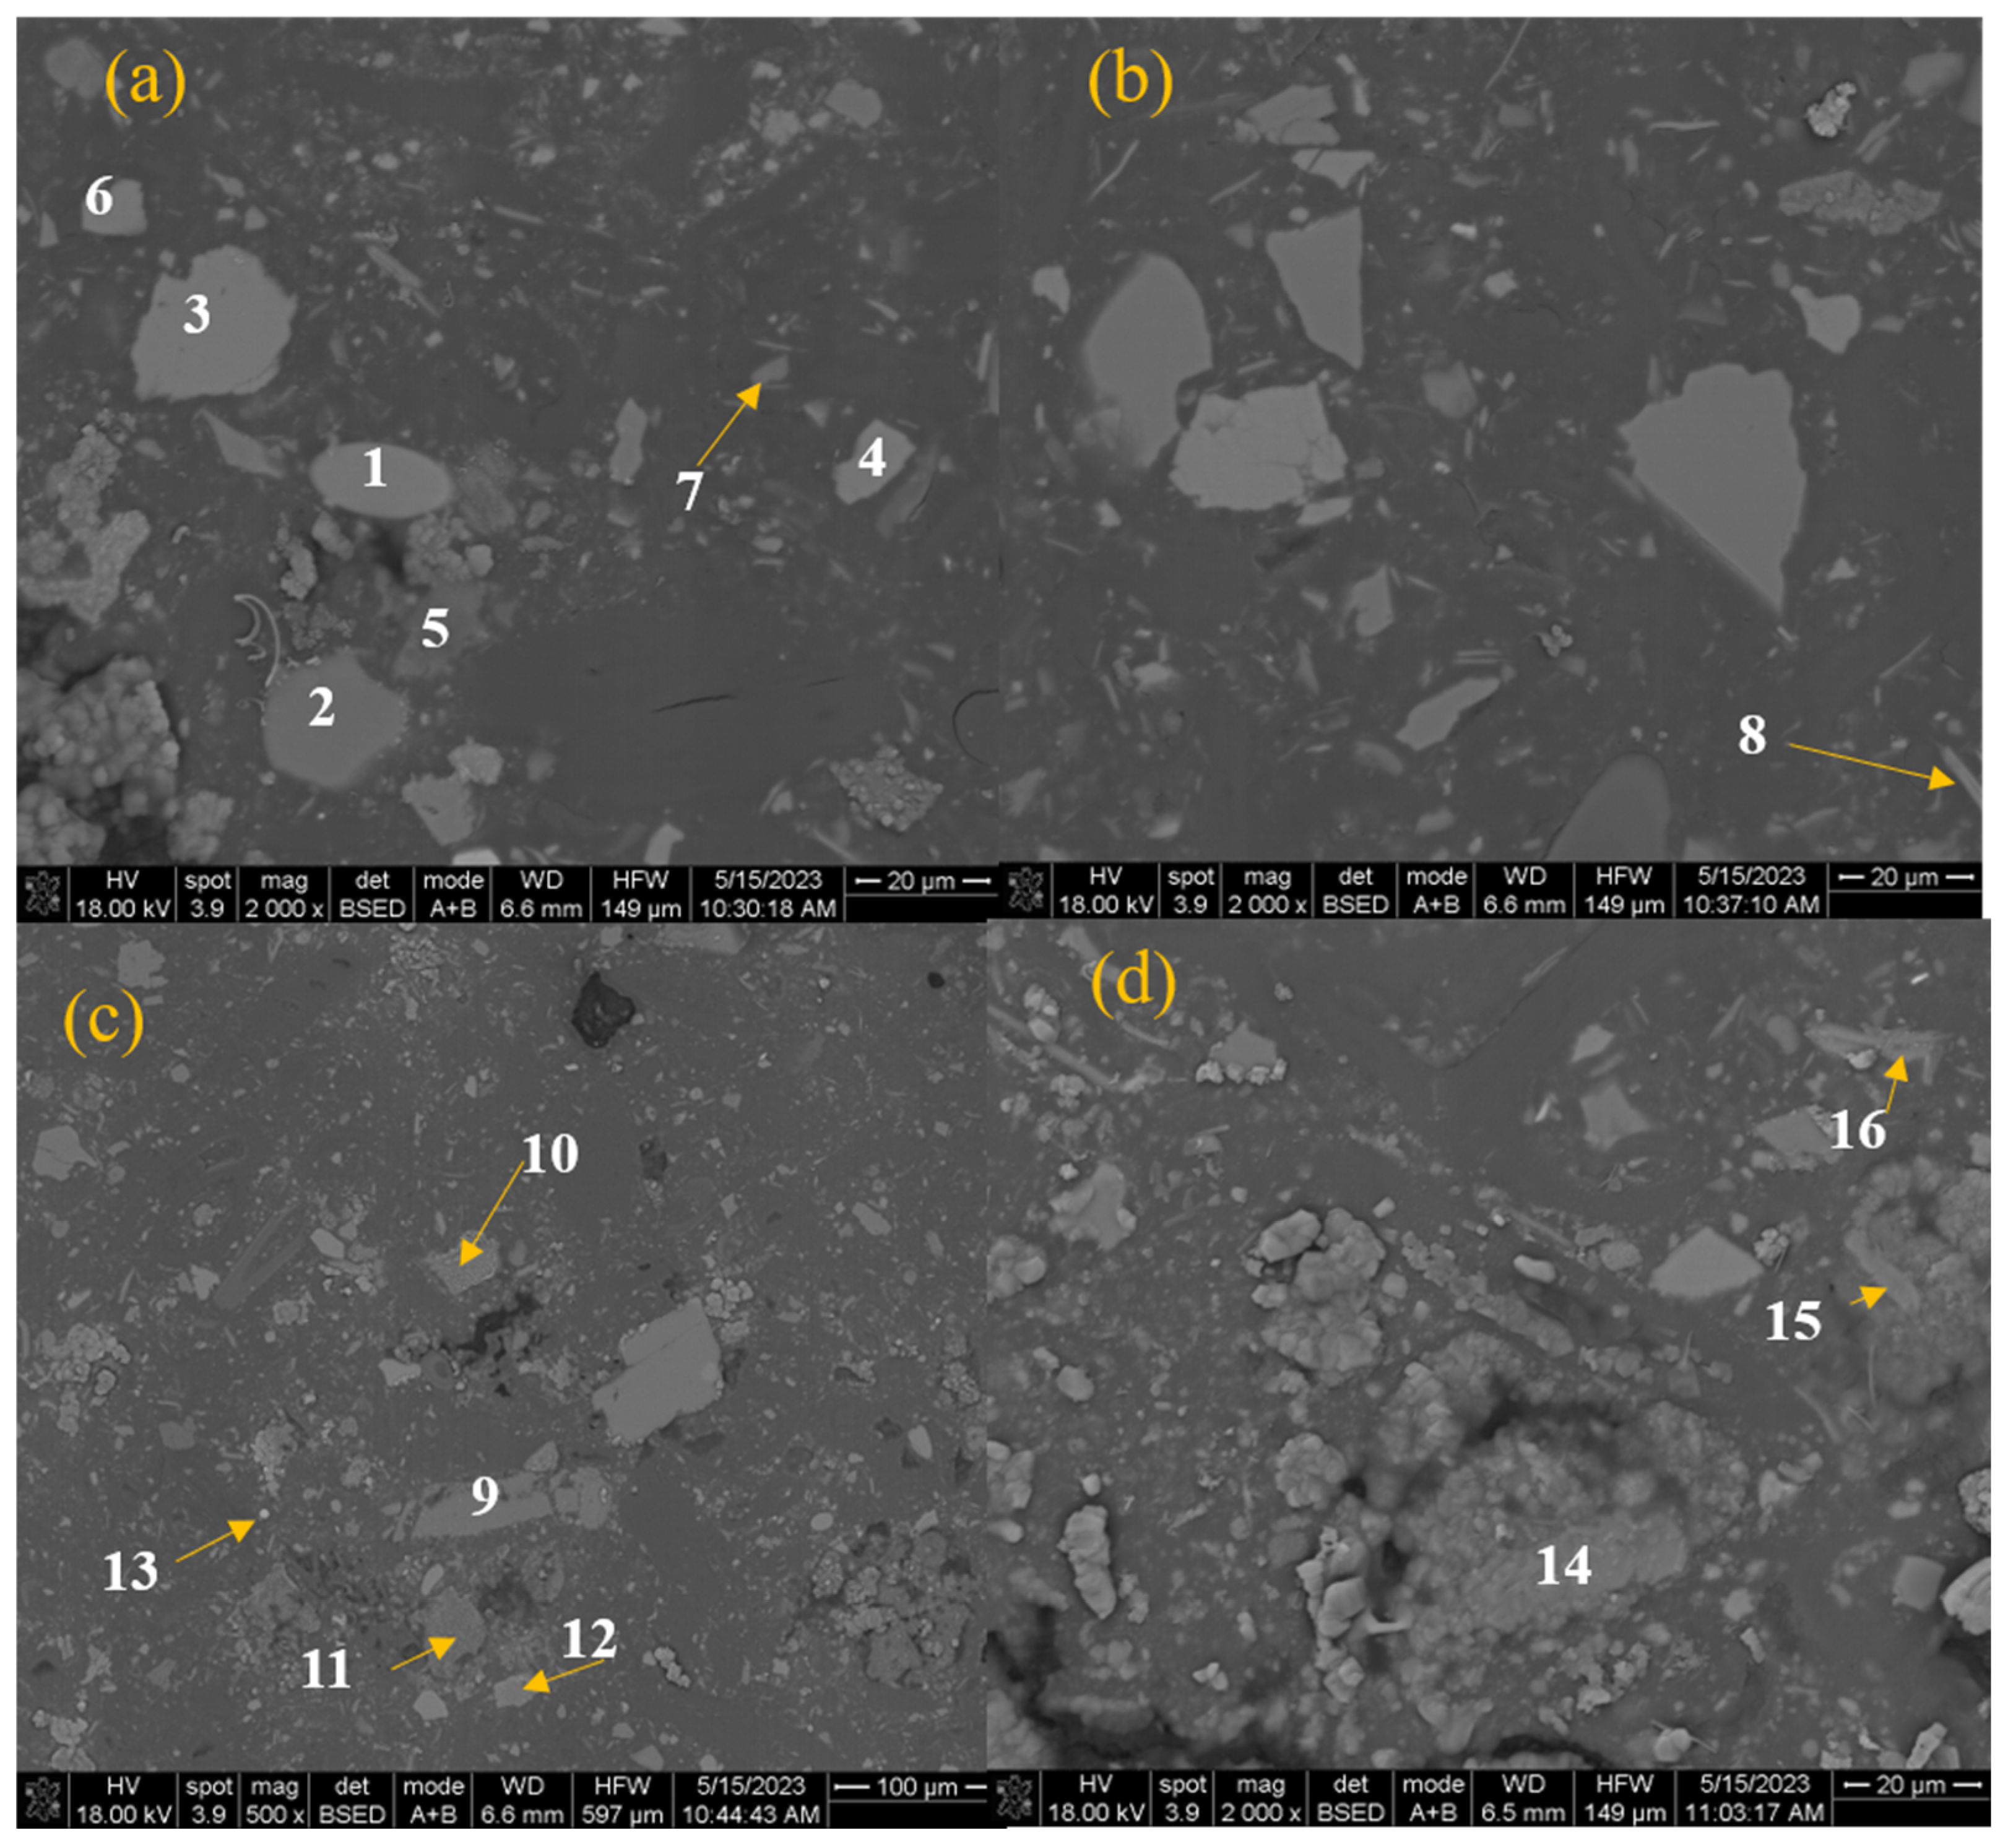
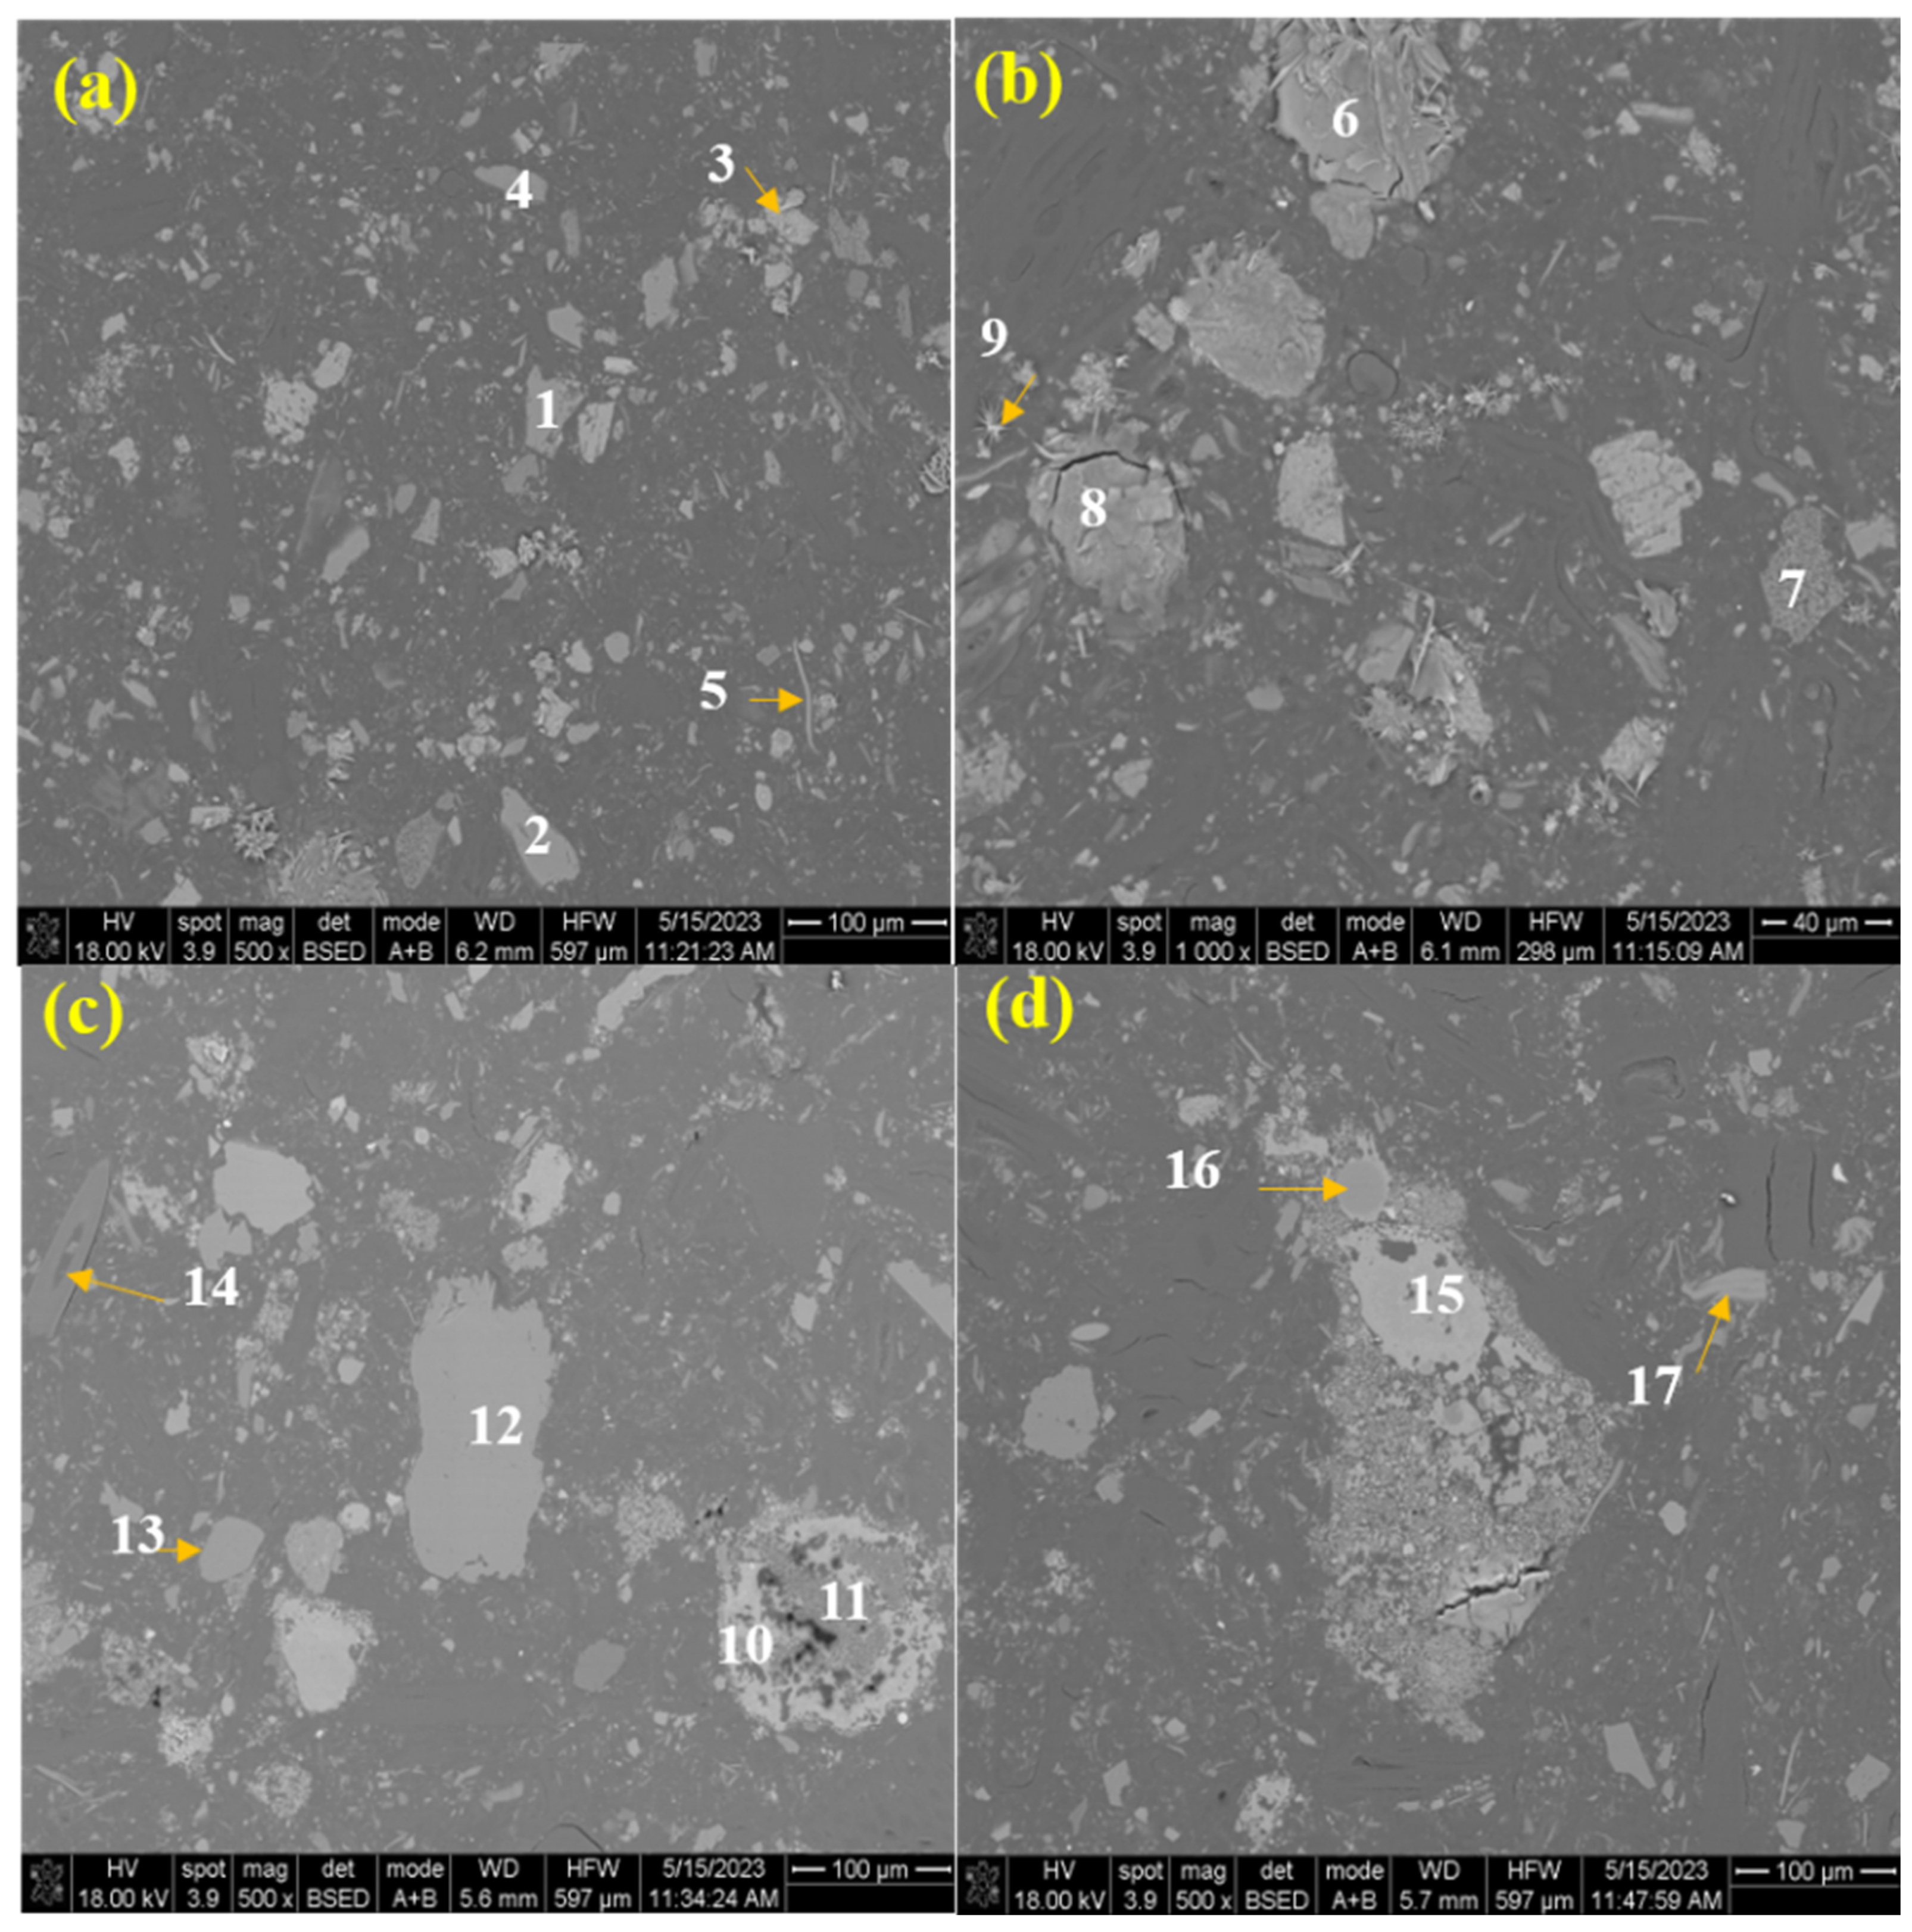
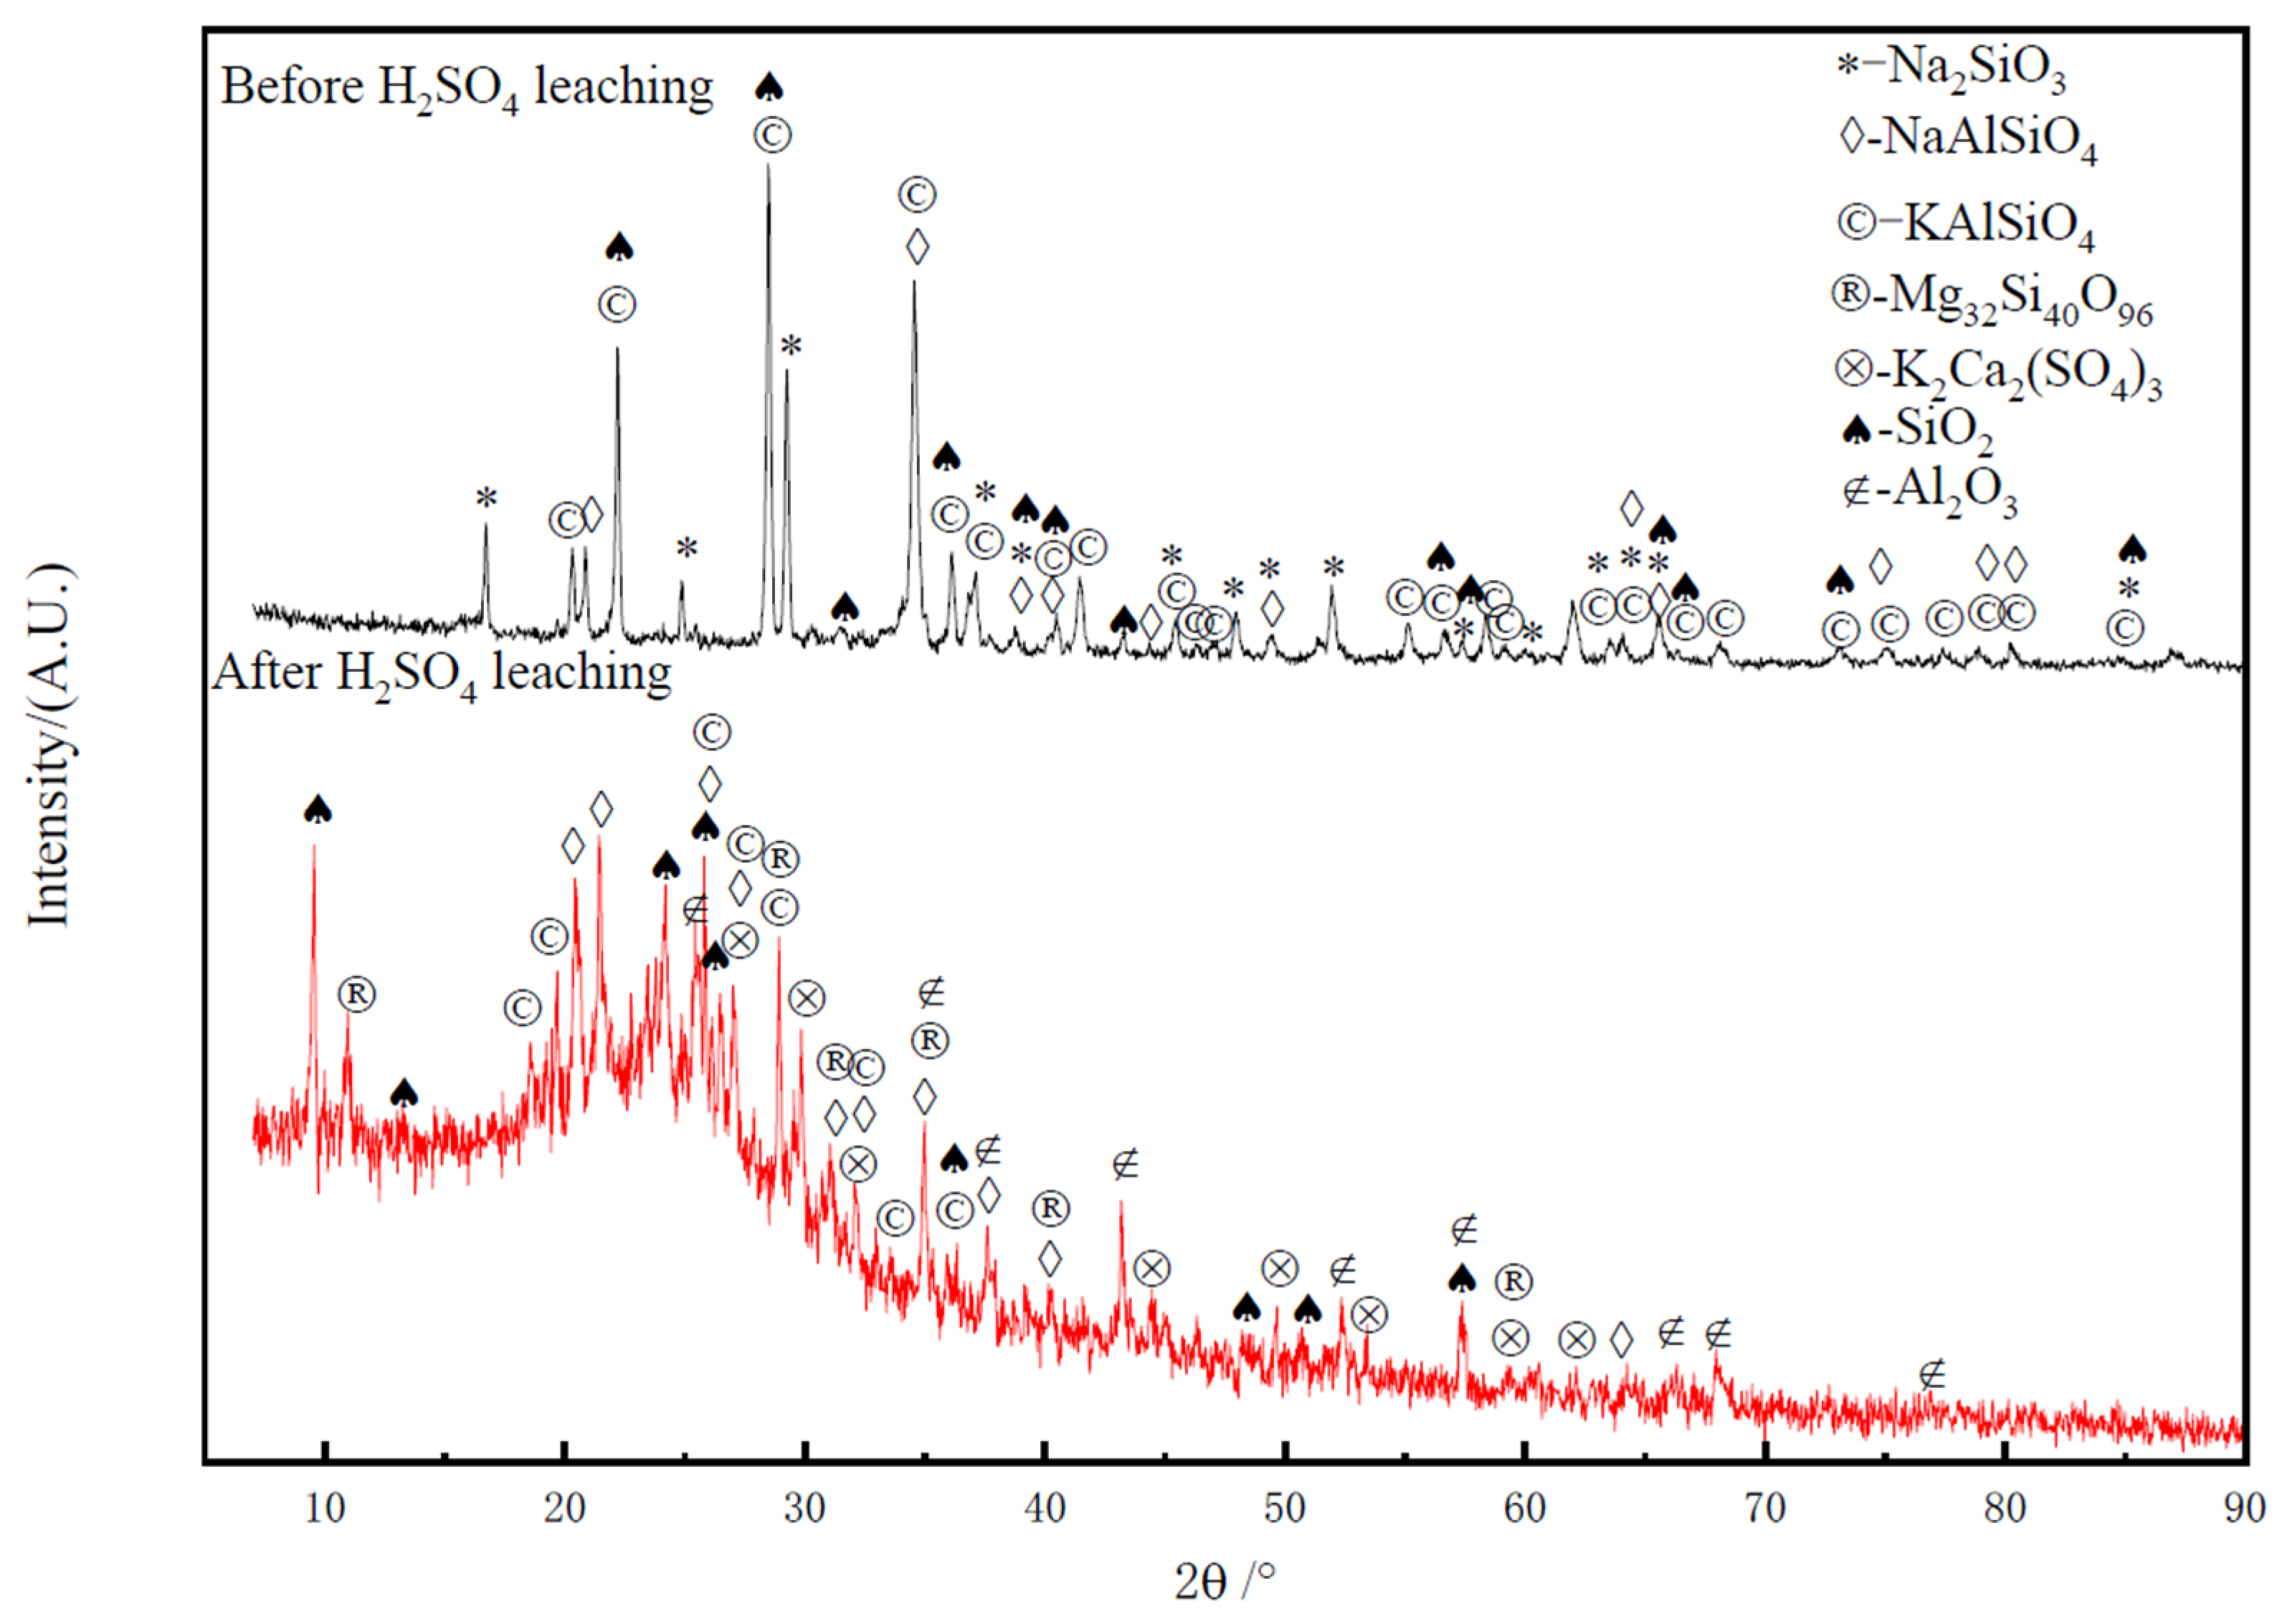
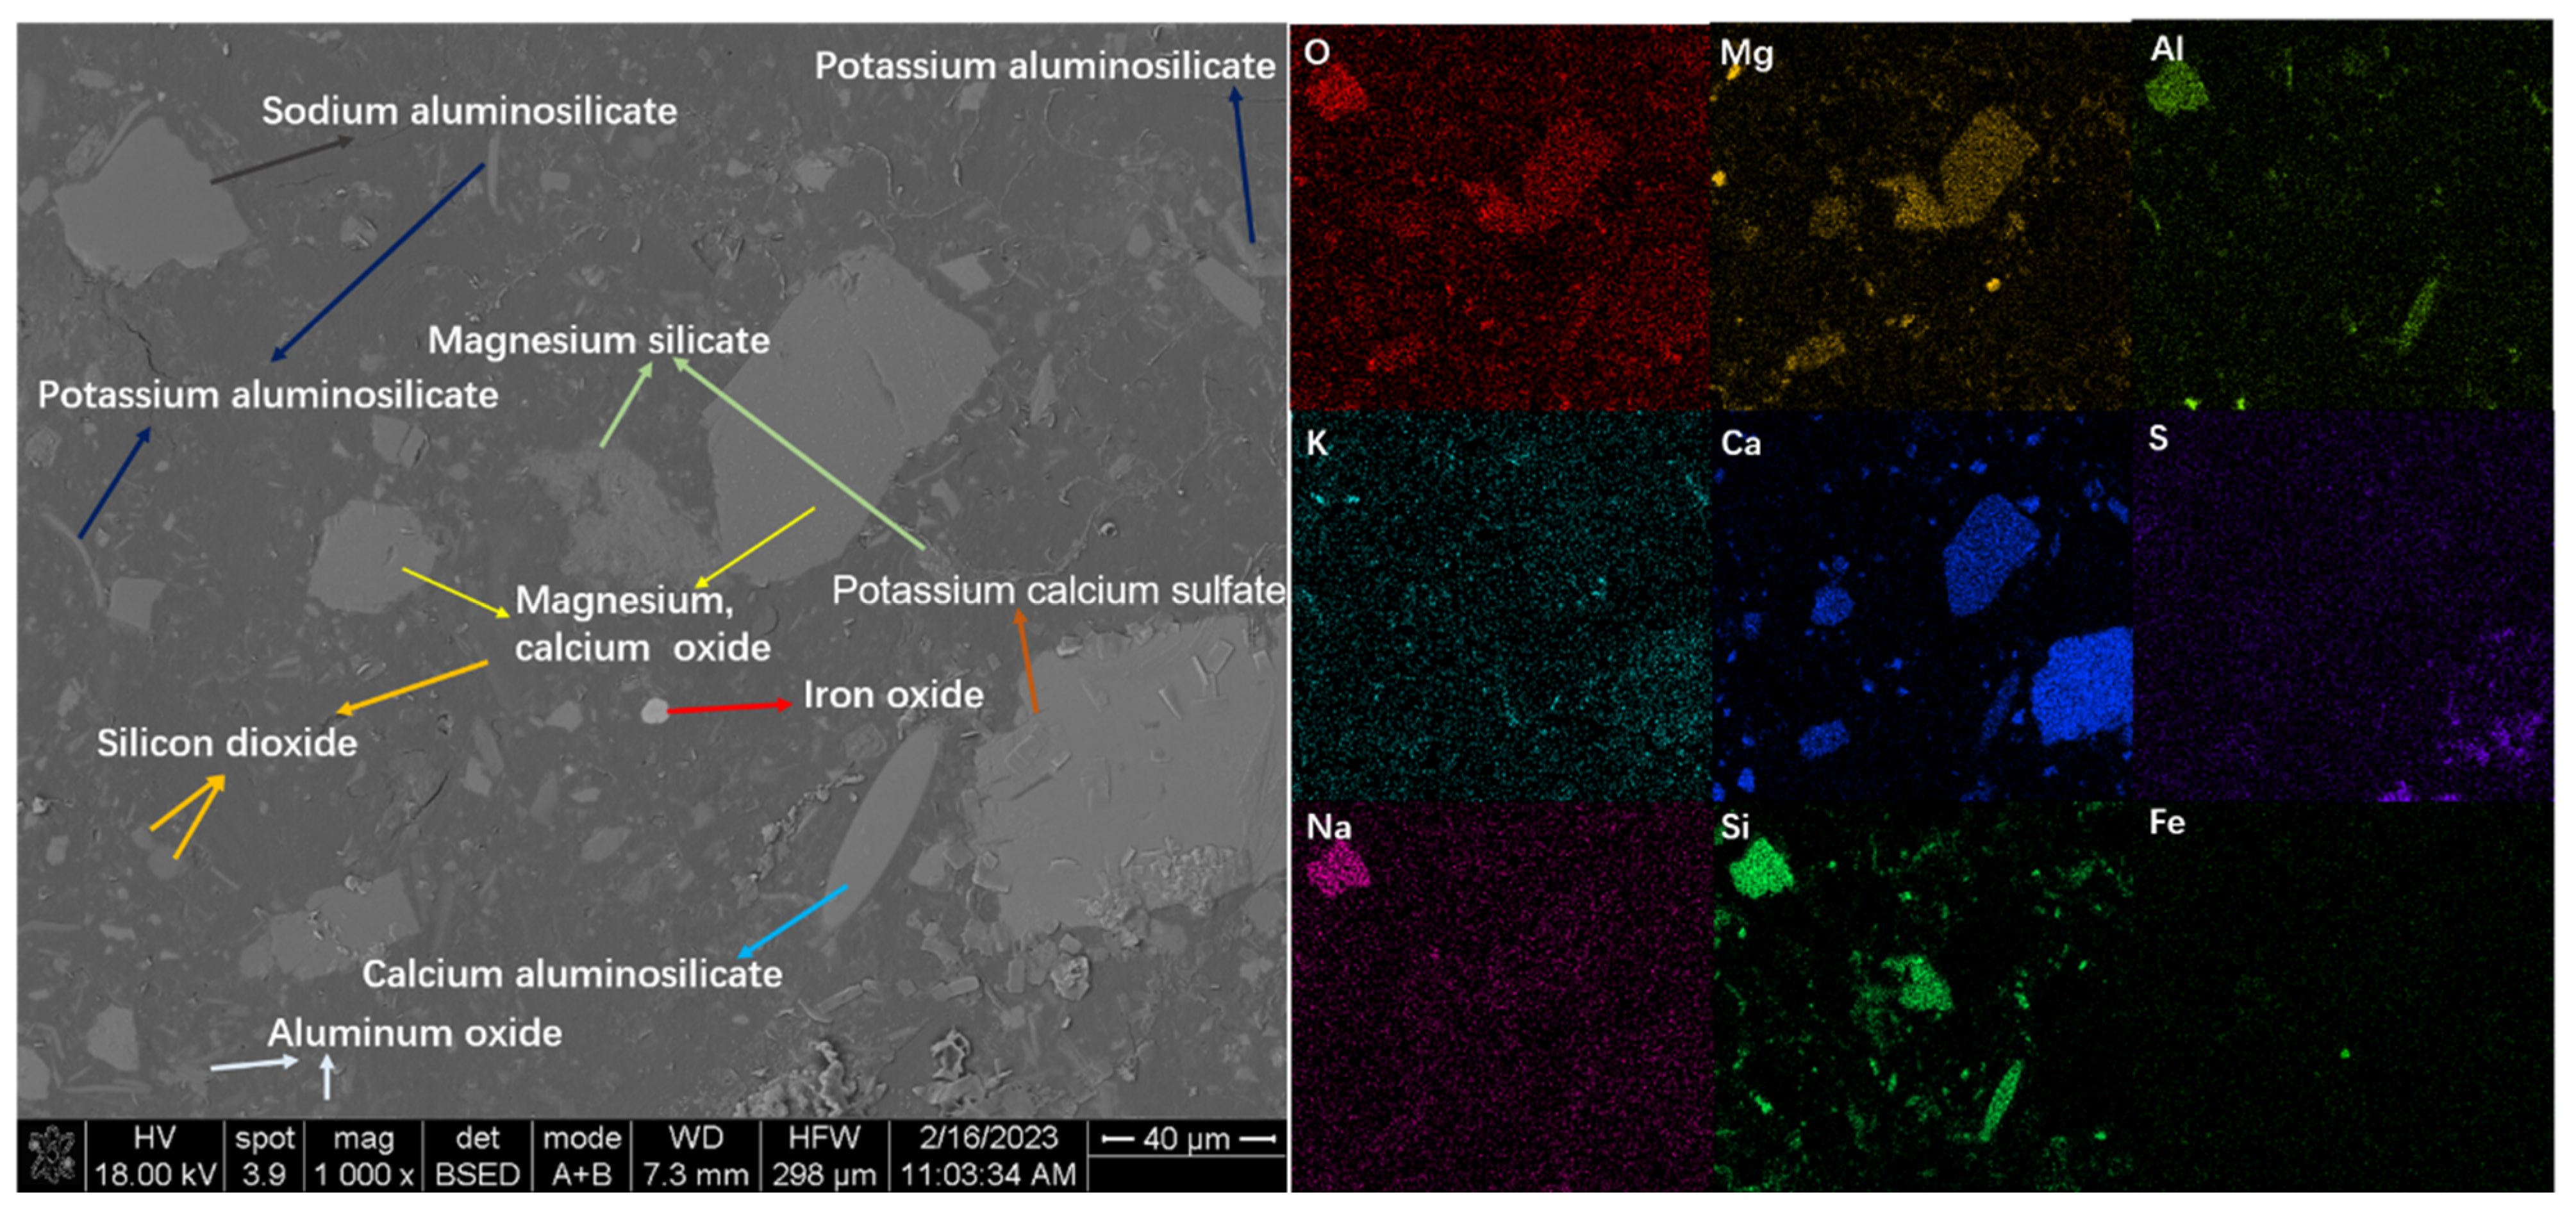
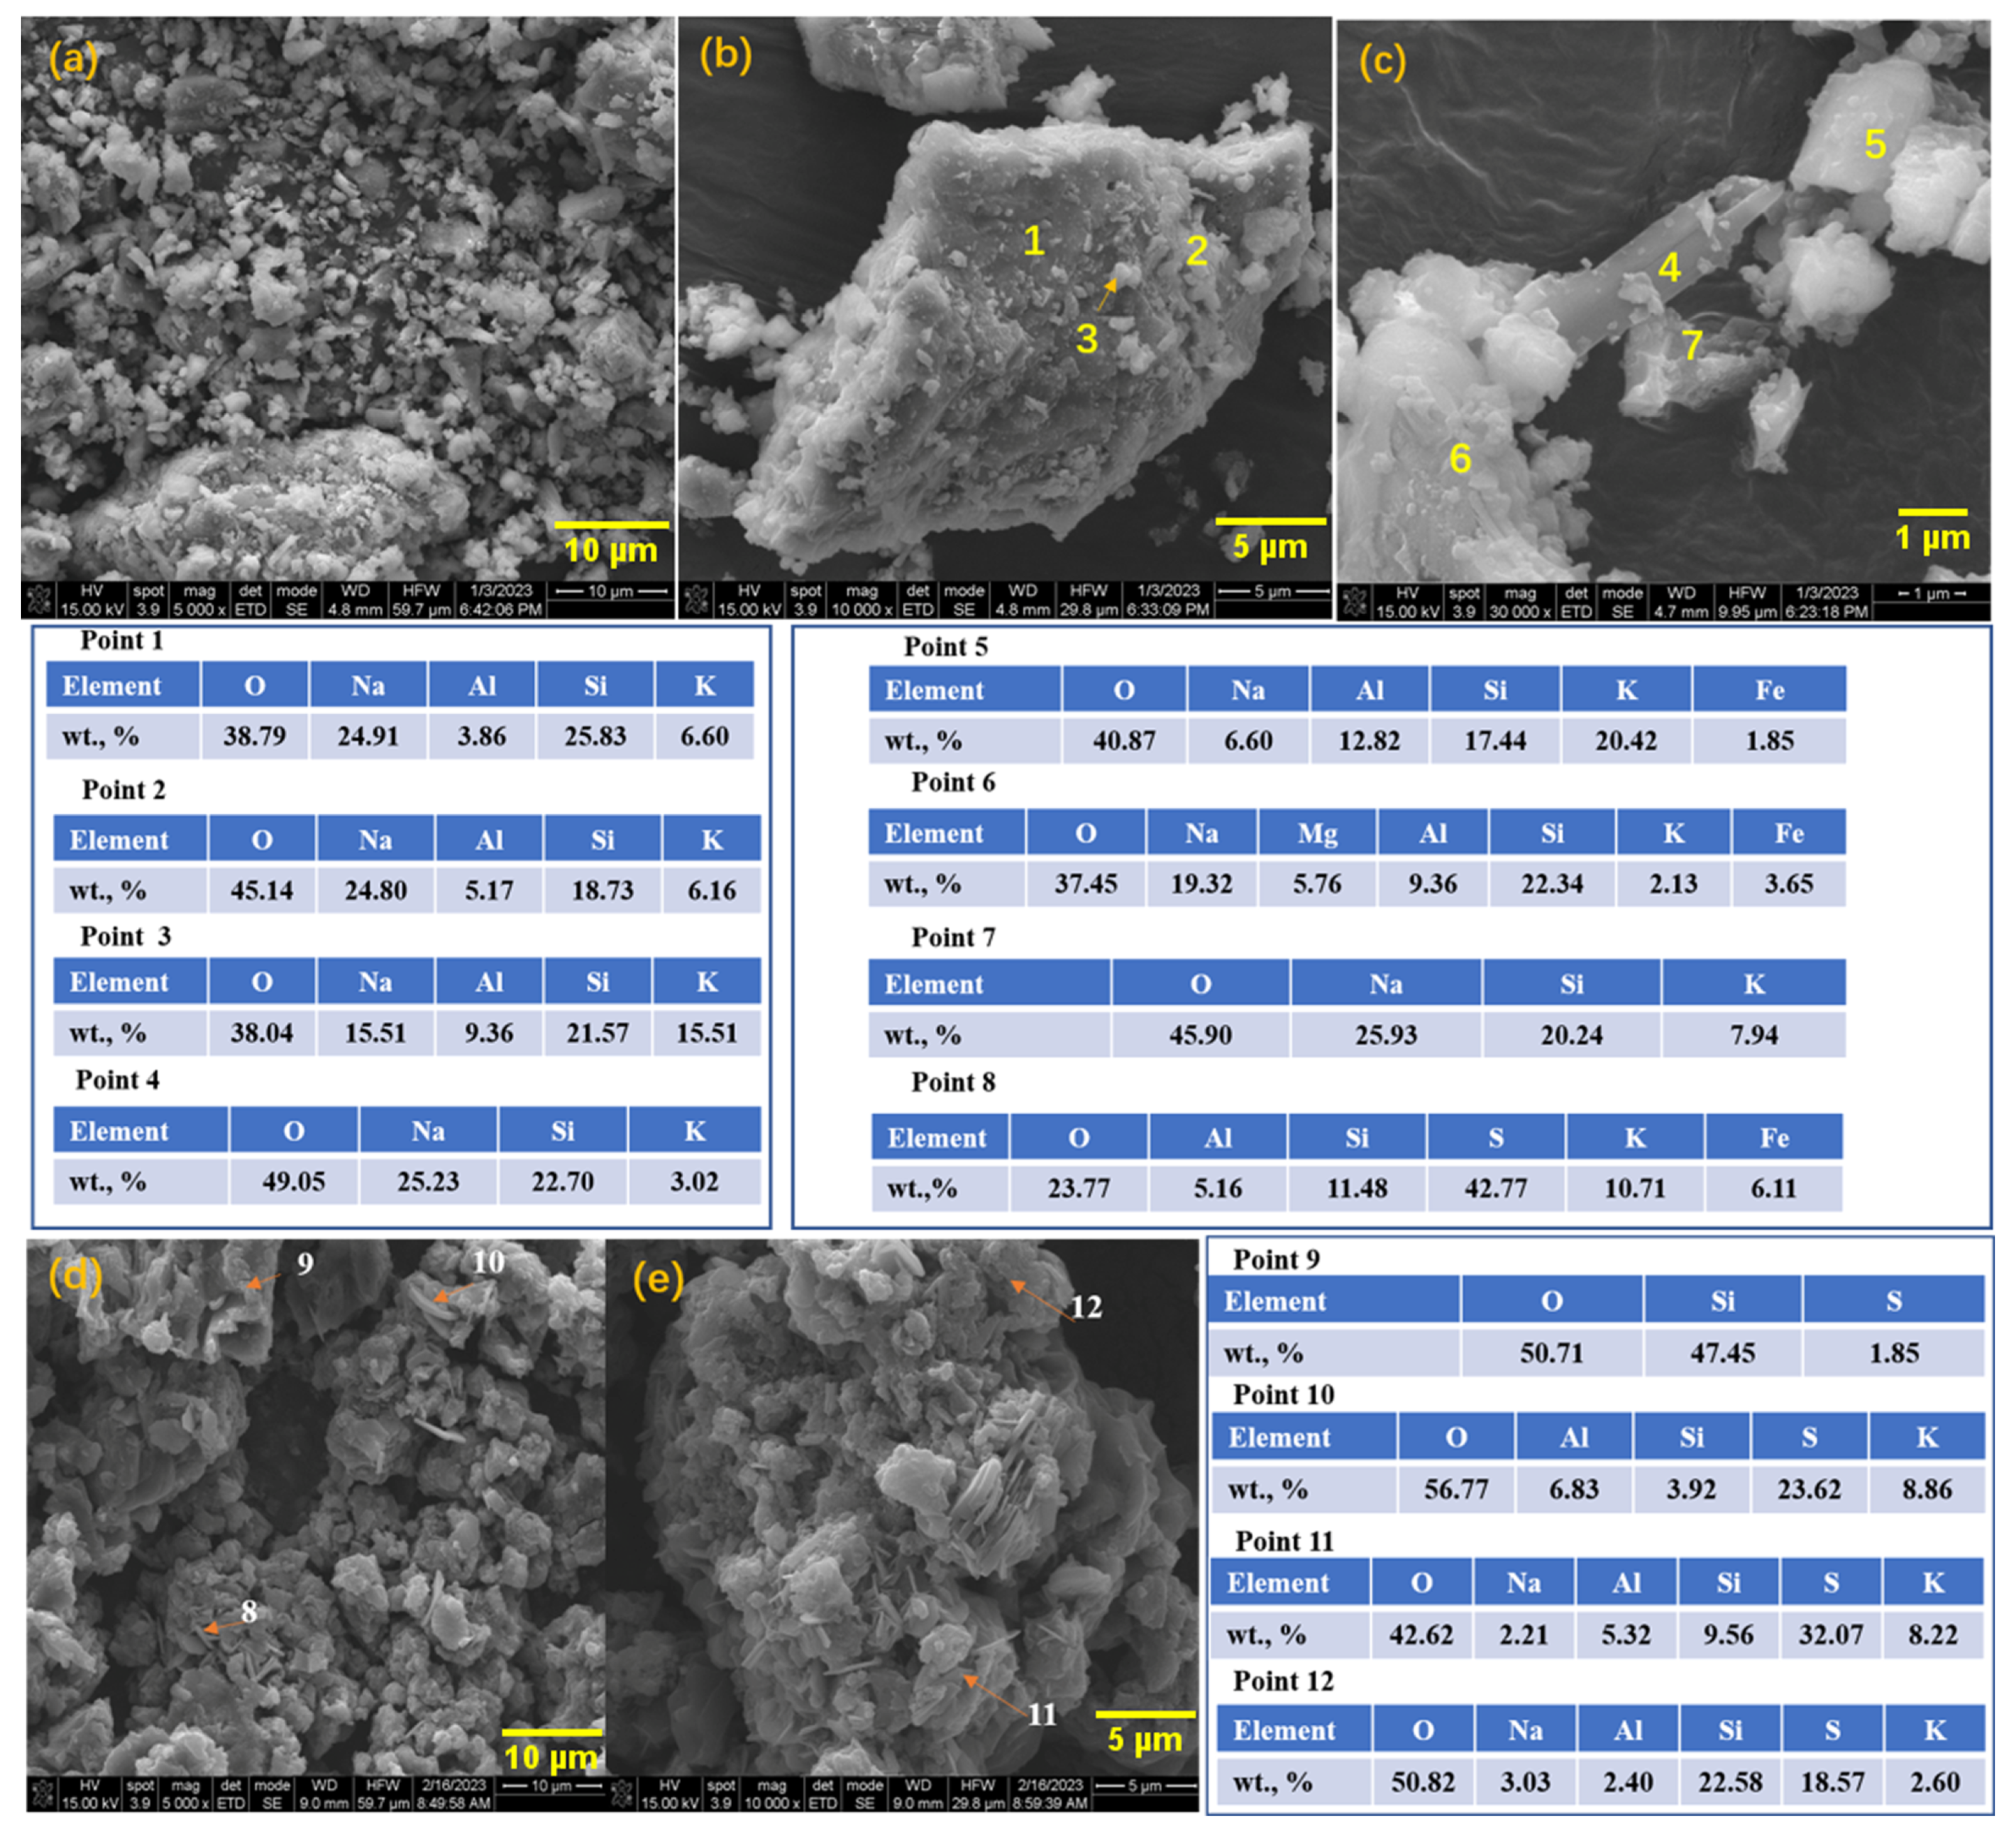
3.2.2. Characterization of Samples before and after Leaching
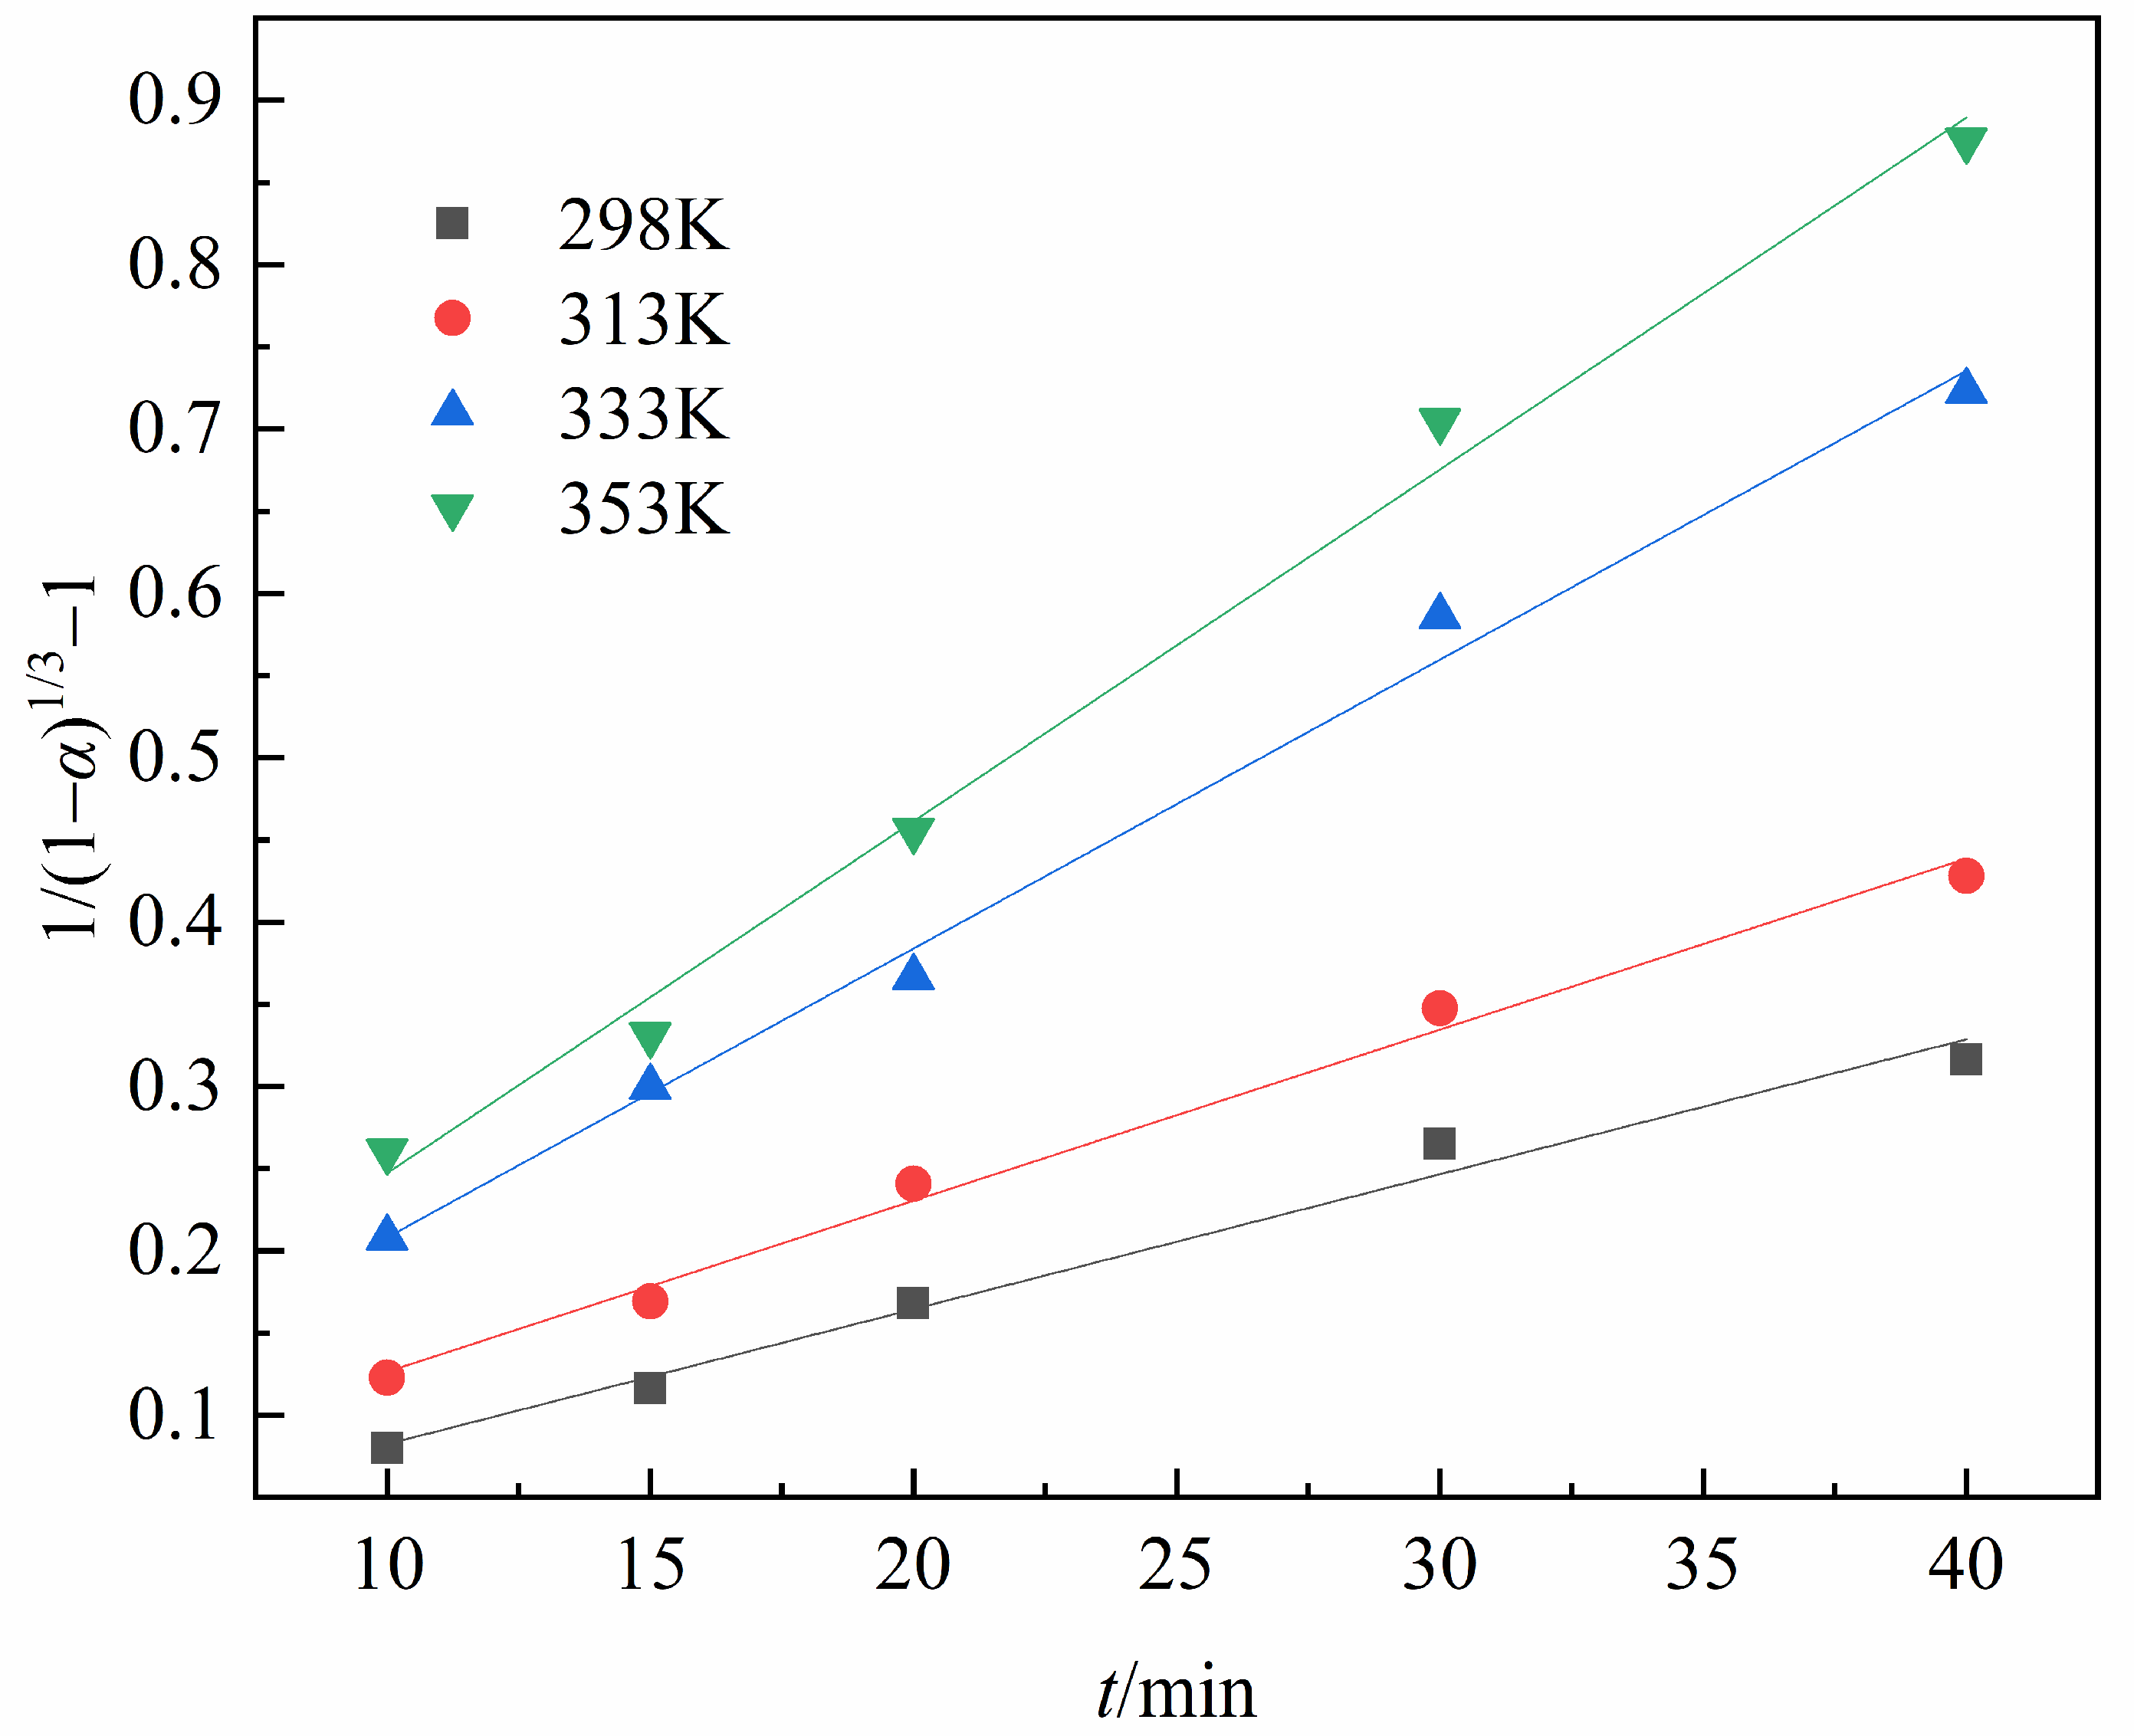
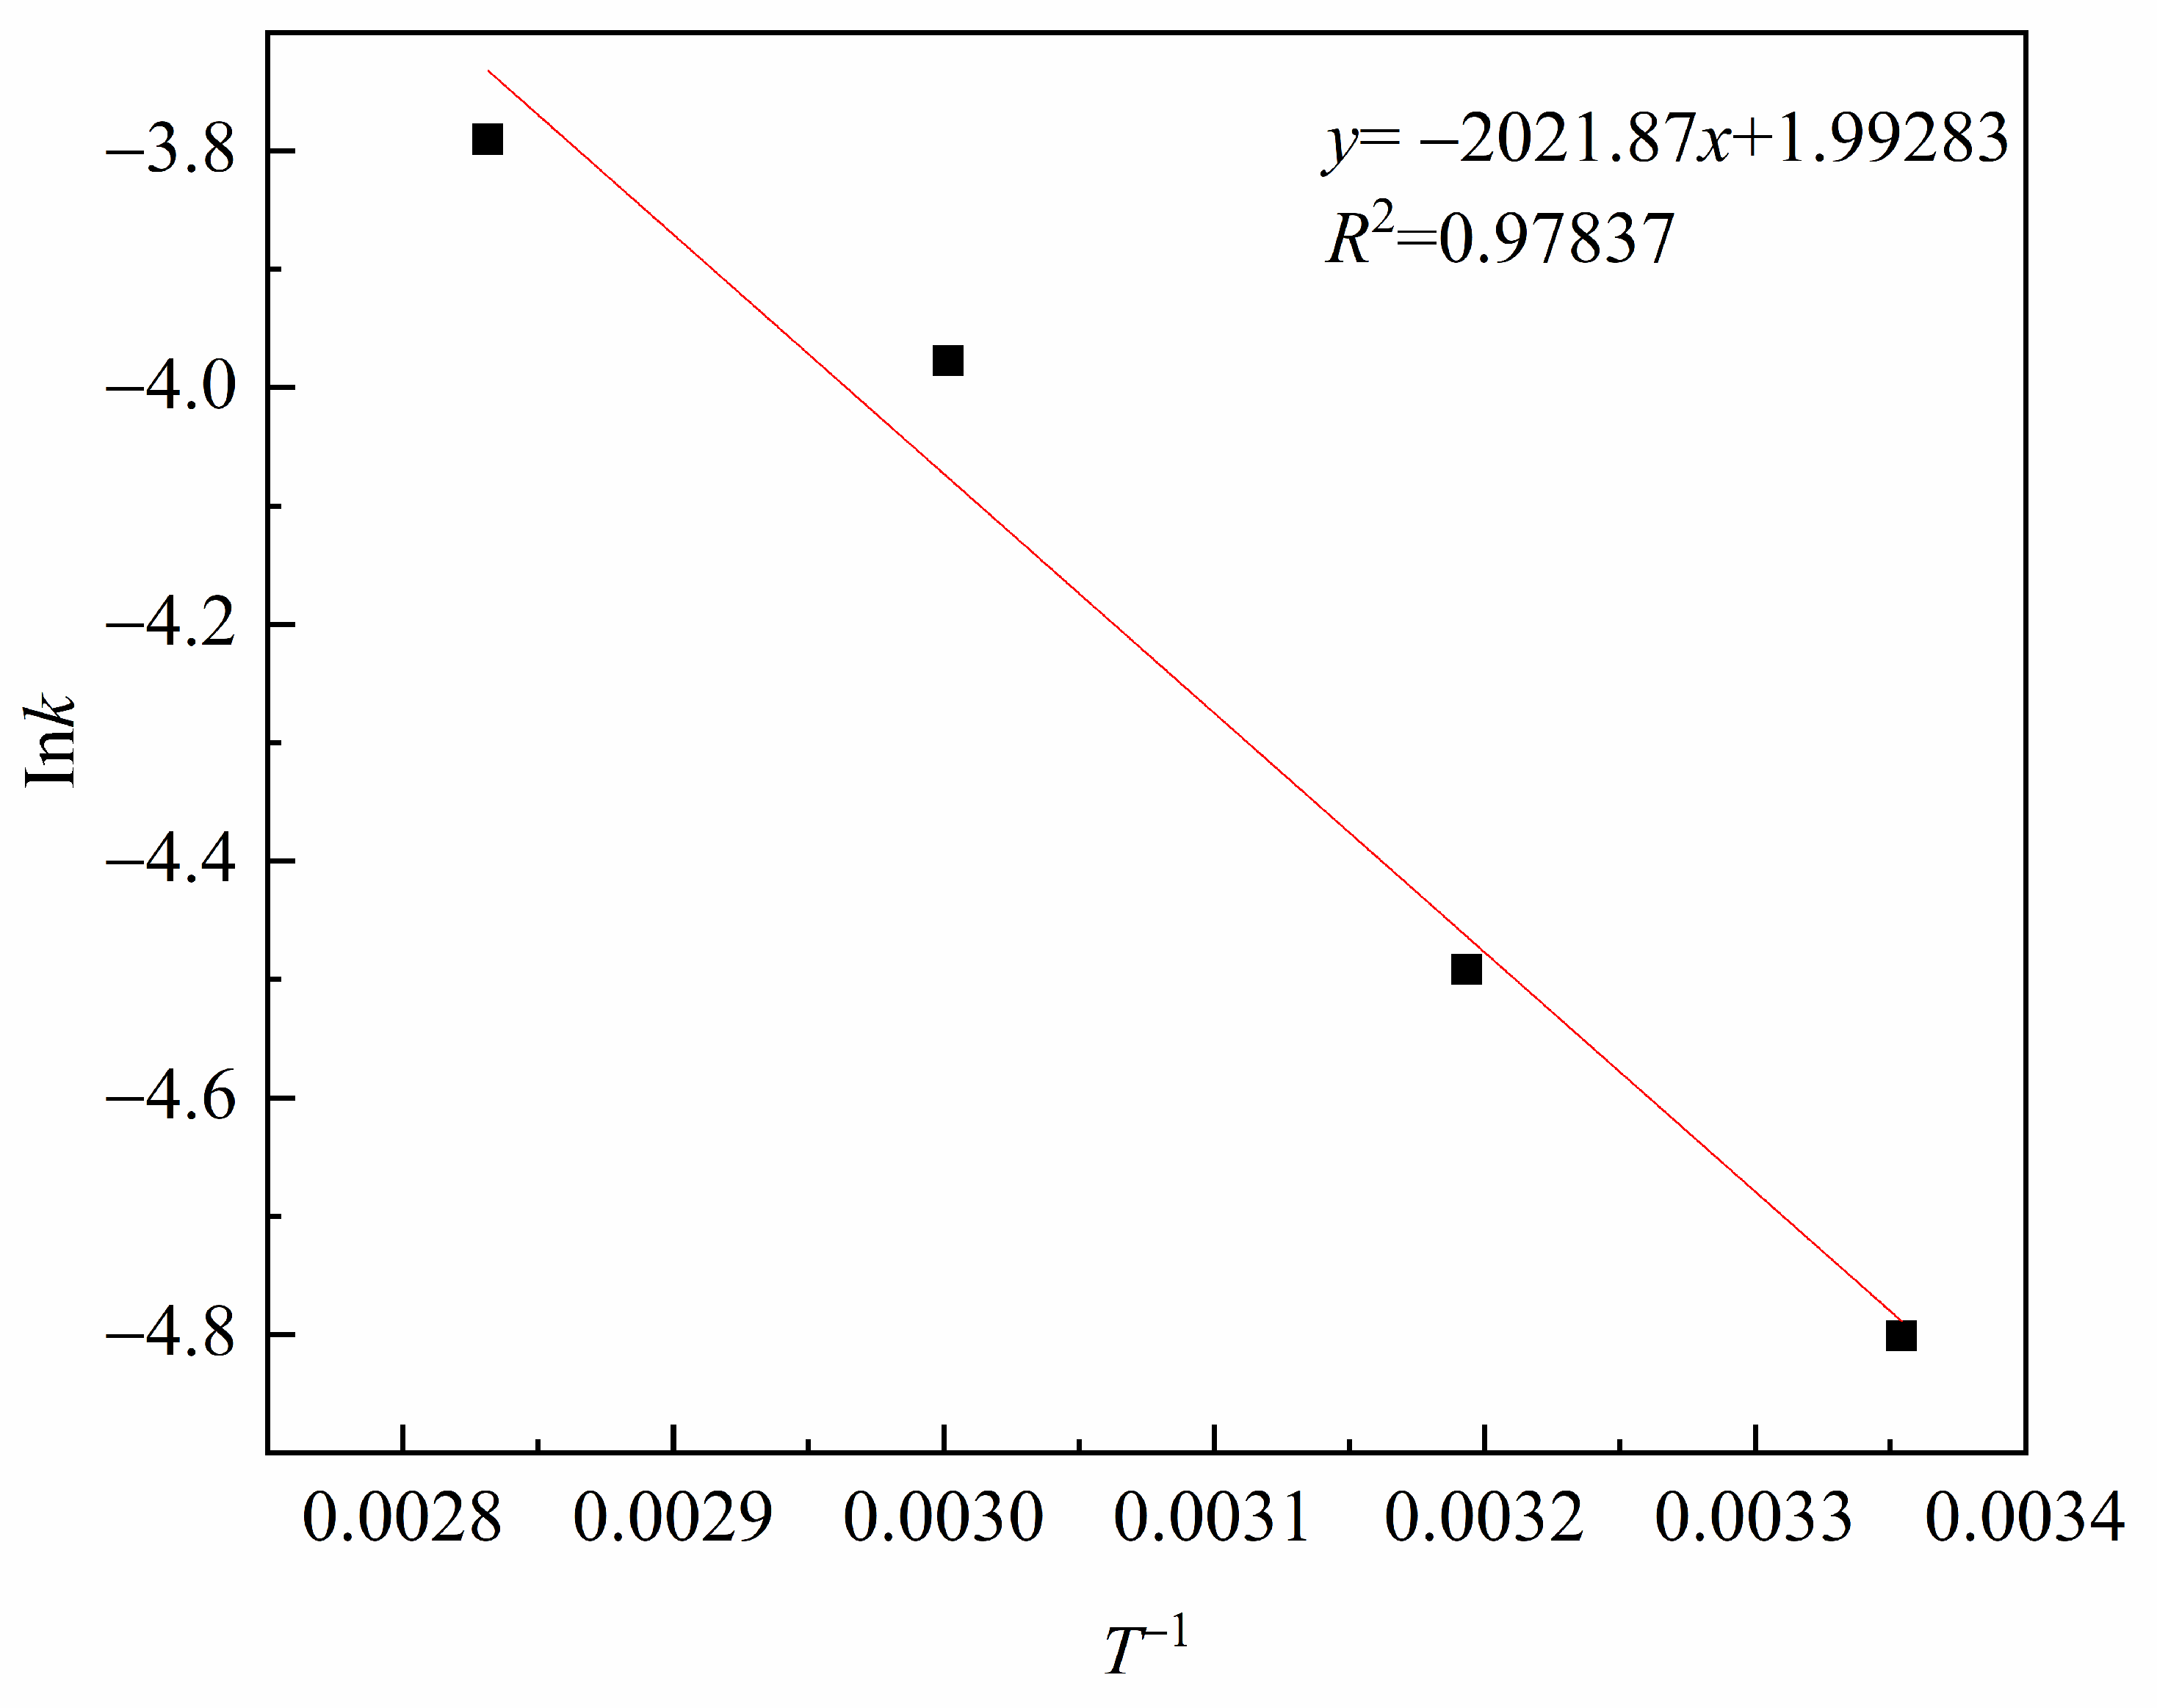
3.2.3. Leaching Kinetics
4. Conclusions
Author Contributions
Funding
Data Availability Statement
Acknowledgments
Conflicts of Interest
References
- Tang, S.Y.; Tabor, C.; Kalantar-Zadeh, K.; Dickey, M.D. Gallium liquid metal: The devil’s elixir. Annu. Rev. Mater. Res. 2021, 51, 381–408. [Google Scholar] [CrossRef]
- Harvey, A.; Backes, C.; Gholamvand, Z.; Hanlon, D.; Mcateer, D.; Nerl, H.; Mcguire, E.; Seral-Ascaso, A.; Ramasse, Q.; Mcevoy, N.; et al. Preparation of gallium sulfide nanosheets by liquid exfoliation and their application as hydrogen evolution catalysts. Chem. Mater. 2015, 27, 3483–3493. [Google Scholar] [CrossRef]
- Chelvanathan, P.; Hossain, M.I.; Amin, N. Performance analysis of copper–indium–gallium–diselenide (CIGS) solar cells with various buffer layers by SCAPS. Curr. Appl. Phys. 2010, 10, S387–S391. [Google Scholar] [CrossRef]
- Hedayati, M.; Olyaee, S.; Ghorashi, S.M.B. The effect of adsorbent layer thickness and gallium concentration on the efficiency of a dual-junction copper indium gallium diselenide solar cell. J. Electron. Mater. 2020, 49, 1454–1461. [Google Scholar] [CrossRef]
- Nishinaka, K.; Terakado, O.; Tani, H.; Hirasawa, M. Pyrometallurgical recovery of gallium from GaN semiconductor through chlorination process utilizing ammonium chloride. Mater. Trans. 2017, 58, 688–691. [Google Scholar] [CrossRef]
- Sigel, A.; Sigel, H.; Freisinger, E.; Sigel, R.K.O. (Eds.) Metallo-Drugs: Development and Action of Anticancer Agents; De Gruyter: Berlin, Germany, 2018; ISBN 9783110470734. [Google Scholar]
- Lee, B.F.; Chiu, N.T.; Chang, J.K.; Liu, G.C.; Yu, H.S. Technetium-99m(V)-DMSA and gallium-67 in the assessment of bone and joint infection. J. Nucl. Med. 1998, 39, 2128–2131. [Google Scholar]
- Zhao, C.; Qin, S.; Yang, Y.; Li, Y.; Lin, M. Concentration of gallium in the permo-carboniferous coals of China. Energy Explor. Exploit. 2009, 27, 333–343. [Google Scholar] [CrossRef]
- Naumov, A.V. Status and prospects of world gallium production and the gallium market. Metallurgist 2013, 57, 367–371. [Google Scholar] [CrossRef]
- Redlinger, M.; Eggert, R.; Woodhouse, M. Evaluating the availability of gallium, indium, and tellurium from recycled photovoltaic modules. Sol. Energy Mater. Sol. Cells 2015, 138, 58–71. [Google Scholar] [CrossRef]
- Xu, K.; Deng, T.; Liu, J.; Peng, W. Study on the recovery of gallium from phosphorus flue dust by leaching with spent sulfuric acid solution and precipitation. Hydrometallurgy 2007, 86, 172–177. [Google Scholar] [CrossRef]
- Lu, F.; Xiao, T.; Lin, J.; Li, A.; Long, Q.; Huang, F.; Xiao, L.; Li, X.; Wang, J.; Xiao, Q.; et al. Recovery of gallium from Bayer red mud through acidic-leaching-ion-exchange process under normal atmospheric pressure. Hydrometallurgy 2018, 175, 124–132. [Google Scholar] [CrossRef]
- Xue, B.; Wei, B.; Ruan, L.; Li, F.; Jiang, Y.; Tian, W.; Su, B.; Zhou, L. The influencing factor study on the extraction of gallium from red mud. Hydrometallurgy 2019, 186, 91–97. [Google Scholar] [CrossRef]
- Huang, J.; Wang, Y.; Zhou, G.; Gu, Y. Exploring a promising technology for the extraction of gallium from coal fly ash. Int. J. Coal Prep. Util. 2022, 42, 1712–1723. [Google Scholar] [CrossRef]
- Huang, J.; Wang, Y.; Zhou, G.; Gu, Y. Investigation on the effect of roasting and leaching parameters on recovery of gallium from solid waste coal fly ash. Metals 2019, 9, 1251. [Google Scholar] [CrossRef]
- Zhou, J.; Zhu, N.; Liu, H.; Wu, P.; Zhang, X.; Zhong, Z. Recovery of gallium from waste light emitting diodes by oxalic acidic leaching. Resour. Conserv. Recycl. 2019, 146, 366–372. [Google Scholar] [CrossRef]
- Chen, W.-S.; Hsu, L.-L.; Wang, L.-P. Recycling the GaN waste from LED industry by pressurized leaching method. Metals 2018, 8, 861. [Google Scholar] [CrossRef]
- Ji, W.; Xie, K.; Huang, H.; Chen, H. Recovery of gallium from yellow phosphorus flue dust by vacuum carbothermal reduction. J. Clean. Prod. 2021, 284, 124706. [Google Scholar] [CrossRef]
- Ji, W.; Xie, K.; Yan, S. Separation and recovery of heavy metals zinc and lead from phosphorus flue dust by vacuum metallurgy. J. Environ. Manag. 2021, 294, 113001. [Google Scholar] [CrossRef]
- Liu, F.; Liu, Z.; Li, Y.; Wilson, B.P.; Lundström, M. Recovery and separation of gallium (III) and germanium (IV) from zinc refinery residues: Part I: Leaching and iron (III) removal. Hydrometallurgy 2017, 169, 564–570. [Google Scholar] [CrossRef]
- Rao, S.; Liu, Z.; Wang, D.; Cao, H.; Zhu, W.; Zhang, K.; Tao, J. Hydrometallurgical process for recovery of Zn, Pb, Ga and Ge from Zn refinery residues. Trans. Nonferrous Met. Soc. China 2021, 31, 555–564. [Google Scholar] [CrossRef]
- Zhai, X.J.; Lv, Z.J. (Eds.) Gallium Metallurgy; Metallurgical Industry Press: Beijing, China, 2010; ISBN 978-7-5024-5200-1. [Google Scholar]
- Ding, W.; Bao, S.; Zhang, Y.; Xiao, J. Mechanism and kinetics study on ultrasound assisted leaching of gallium and zinc from corundum flue dust. Miner. Eng. 2022, 183, 107624. [Google Scholar] [CrossRef]
- Wen, K.; Jiang, F.; Zhou, X.; Sun, Z. Recovery of gallium from corundum flue dust by two-stage alkali leaching, carbonation, acid leaching and solvent extraction process. Metals 2018, 8, 545. [Google Scholar] [CrossRef]
- Wen, K.; Jiang, F.; Zhou, X.; Sun, Z. Leaching of gallium from corundum flue dust using mixed acid solution. Trans. Nonferrous Met. Soc. China 2018, 28, 1862–1868. [Google Scholar] [CrossRef]
- Lu, A.L.; Jia, Y.H. Research on comprehensive utilization of bauxite in China. Conserv. Util. Miner. Resour. 2010, 30, 49–51. (In Chinese) [Google Scholar] [CrossRef]
- Chang, Y.W.; Zhang, J.H.; Hui, X.J.; Liang, Y. Study on efficient extraction of gallium from brown corundum soot. Chin. J. Process. Eng. 2023, 23, 460–471. [Google Scholar] [CrossRef]
- Dickinson, C.F.; Heal, G.R. Solid-liquid diffusion-controlled rate equations. Thermochim. Acta 1999, 340–341, 89–103. [Google Scholar] [CrossRef]


| SiO2 | K2O | Al2O3 | SO3 | Fe2O3 | MgO | MnO | P2O5 | Na2O | TiO2 | PbO | F |
| 40.82 | 17.7 | 23.39 | 3.085 | 3.542 | 0.870 | 0.757 | 0.712 | 0.533 | 0.491 | 0.415 | 0.345 |
| ZnO | CaO | CuO | Ga2O3 | Cl | Cr2O3 | SnO2 | ZrO2 | Rb2O | As2O3 | SrO | Bi2O |
| 0.153 | 0.150 | 0.147 | 0.114 | 0.084 | 0.032 | 0.028 | 0.027 | 0.026 | 0.022 | 0.012 | 0.012 |
| V2O5 | ThO2 | Nb2O5 | NiO | GeO2 | La2O3 | Y2O3 | Co2O4 | LOI | C | N | |
| 0.007 | 0.006 | 0.005 | 0.004 | 0.004 | 0.004 | 0.003 | 0.002 | 5.940 | 0.350 | 0.081 |
| Point | Element/wt.% | ||||||||
|---|---|---|---|---|---|---|---|---|---|
| O | Si | K | Al | Fe | Ti | Mn | Ca | S | |
| 1 | 29.59 | 30.03 | 18.19 | 15.08 | 5.80 | 1.31 | - | - | - |
| 2 | 33.45 | 26.13 | 17.62 | 18.81 | 2.13 | 1.01 | 0.85 | - | - |
| 3 | 8.33 | 89.50 | 1.45 | - | - | - | - | 0.72 | - |
| 4 | 42.64 | - | - | 57.36 | - | - | - | - | - |
| 5 | 45.03 | 1.82 | 17.83 | - | - | - | - | 15.81 | 19.50 |
| 6 | 36.95 | 1.15 | 0.54 | 56.15 | 1.17 | 0.75 | - | 3.28 | - |
| 7 | 50.06 | 1.67 | 17.24 | - | - | - | - | 13.05 | 17.98 |
| 8 | 46.44 | 8.70 | 15.75 | 4.41 | - | - | - | 10.68 | 14.02 |
| 9 | 28.43 | 0.78 | 0.51 | 12.59 | 55.80 | 0.55 | 1.33 | - | - |
| 10 | 26.98 | 1.28 | 0.34 | 1.55 | 69.86 | - | - | - | - |
| Point | O | Na | Mg | C | Si | K | Al | Fe | Ti | Ca | Zn |
|---|---|---|---|---|---|---|---|---|---|---|---|
| 1 | 50.5 | 41.7 | - | - | 4.2 | 1.8 | 1.8 | - | - | - | - |
| 2 | 48.1 | 26.6 | - | 25.3 | - | - | - | - | - | - | - |
| 3 | 34.2 | 1.1 | - | - | 33.4 | - | 9.0 | - | - | 20.1 | 2.2 |
| 4 | 32.1 | - | 66.6 | - | 0.3 | - | - | 1.0 | - | - | - |
| 5 | 36.8 | 17.7 | - | - | 22.6 | 5.3 | 14.3 | 2.8 | 0.5 | - | - |
| 6 | 35.4 | 2.4 | - | - | 23.2 | 22.8 | 14.8 | 1.4 | - | - | - |
| 7 | 36.9 | - | - | - | 25.5 | - | 15.3 | - | - | 22.3 | - |
| 8 | 20.2 | - | 4.6 | - | 5.7 | - | 3.3 | 66.2 | - | - | - |
| 9 | 38.9 | 12.8 | - | - | 21.8 | 5.5 | 17.6 | 3.4 | - | - | - |
| 10 | 37.1 | - | - | - | 15 | 10.7 | 37.2 | - | - | - | - |
| 11 | 46.3 | 9.5 | 12.3 | - | - | - | - | 1.2 | - | 30.7 | - |
| 12 | 38.9 | - | 61.1 | - | - | - | - | - | - | - | - |
| 13 | 31 | 3.9 | - | - | 27.5 | 23.3 | 14.3 | - | - | - | - |
| 14 | 43.8 | 1.1 | - | - | 54.6 | 0.5 | - | - | - | - | - |
| Point | O | Na | Mg | Si | K | Al | Fe | Ti | Ca | S |
|---|---|---|---|---|---|---|---|---|---|---|
| 1 | 38.67 | - | - | 33.23 | - | 8.15 | - | - | 19.95 | - |
| 2 | 42.23 | - | - | 57.77 | - | - | - | - | - | - |
| 3 | 46.28 | - | - | - | - | - | - | - | 53.72 | - |
| 4 | 44.65 | - | - | - | - | - | - | - | 55.35 | - |
| 5 | 49.04 | - | 2.79 | 16.75 | 2.10 | 4.57 | 1.53 | - | - | 23.22 |
| 6 | 45.69 | - | - | - | - | - | - | - | 54.31 | - |
| 7 | 45.96 | - | 0.99 | 53.04 | - | - | - | - | - | - |
| 8 | 35.60 | - | 1.14 | 28.91 | 10.87 | 17.86 | 4.73 | 0.90 | - | - |
| 9 | 42.98 | 1.23 | - | 51.06 | 1.03 | - | - | - | - | 3.69 |
| 10 | 39.96 | - | 29.95 | 30.09 | - | - | - | - | - | - |
| 11 | 41.54 | 12.00 | 1.37 | 8.99 | 2.48 | 2.55 | - | - | - | 31.07 |
| 12 | 43.13 | - | 4.30 | 32.48 | -- | - | - | - | 14.29 | 5.80 |
| 13 | 23.67 | - | - | 9.21 | - | 6.20 | 60.93 | - | - | - |
| 14 | 31.14 | - | - | 2.05 | - | 66.82 | - | - | - | - |
| 15 | 38.77 | - | - | 2.28 | - | 54.89 | 1.87 | - | - | 2.20 |
| 16 | 38.88 | - | 4.01 | 21.64 | 10.00 | 14.43 | 3.65 | - | 0.90 | 6.48 |
| Point | O | Na | Mg | Si | K | Al | Fe | Ti | Ca | S | P | Mn | C |
|---|---|---|---|---|---|---|---|---|---|---|---|---|---|
| 1 | 47.32 | - | 17.94 | - | - | - | - | - | 34.74 | - | - | - | - |
| 2 | 44.46 | - | - | 55.54 | - | - | - | - | - | - | - | - | - |
| 3 | 41.70 | 19.42 | - | 15.31 | 11.06 | 6.08 | 1.71 | 0.59 | - | - | 4.12 | - | - |
| 4 | 41.26 | - | 20.21 | 38.53 | - | - | - | - | - | - | - | - | - |
| 5 | 35.58 | - | 16.99 | 25.84 | 10.56 | 9.34 | 2.71 | - | - | - | - | - | - |
| 6 | 40.07 | 31.59 | - | 22.94 | 5.41 | - | - | - | - | - | - | - | - |
| 7 | 30.31 | - | 68.14 | - | - | - | 1.55 | - | - | - | - | - | - |
| 8 | 38.04 | 21.27 | - | 34.72 | 4.35 | - | - | 1.62 | - | - | - | - | - |
| 9 | 42.99 | 21.71 | - | 1.04 | 0.60 | - | - | - | - | 3.27 | - | - | 30.39 |
| 10 | 28.56 | - | - | 32.24 | 25.81 | 8.70 | 2.06 | - | 1.24 | - | - | 1.39 | - |
| 11 | 33.89 | - | - | 25.62 | 28.31 | 12.19 | - | - | - | - | - | - | - |
| 12 | 46.95 | - | 18.03 | - | - | - | - | - | 35.02 | - | - | - | - |
| 13 | 36.39 | - | 30.60 | 30.96 | - | - | 2.05 | - | - | - | - | - | - |
| 14 | 48.37 | - | - | 51.63 | - | - | - | - | - | - | - | - | - |
| 15 | 30.47 | - | 0.60 | 28.30 | 27.67 | 9.81 | 2.04 | - | 1.12 | - | - | - | - |
| 16 | 33.50 | - | 1.88 | 6.81 | 4.45 | 50.03 | 1.41 | 0.80 | - | - | - | 1.12 | - |
| 17 | 34.40 | - | 0.76 | 29.42 | 11.08 | 18.63 | 4.57 | 1.13 | - | - | - | - | - |
| Temperature/K | Correlation Coefficient (R2) | ||
|---|---|---|---|
| k1t = 1 − 2α/3 − (1 − α)2/3 | k2t = 1 − (1 − α)1/3 | k3t = 1/(1 − α)1/3 − 1 | |
| 298 | 0.96335 | 0.99182 | 0.99683 |
| 313 | 0.98612 | 0.9834 | 0.99712 |
| 333 | 0.99562 | 0.97385 | 0.99768 |
| 353 | 0.99676 | 0.96936 | 0.9979 |
Disclaimer/Publisher’s Note: The statements, opinions and data contained in all publications are solely those of the individual author(s) and contributor(s) and not of MDPI and/or the editor(s). MDPI and/or the editor(s) disclaim responsibility for any injury to people or property resulting from any ideas, methods, instructions or products referred to in the content. |
© 2023 by the authors. Licensee MDPI, Basel, Switzerland. This article is an open access article distributed under the terms and conditions of the Creative Commons Attribution (CC BY) license (https://creativecommons.org/licenses/by/4.0/).
Share and Cite
Zhang, J.; Chang, Y.; Gao, C.; Hui, X.; Jokilaakso, A. Extraction of Gallium from Brown Corundum Dust by Roasting—Acid Leaching Process. Minerals 2023, 13, 900. https://doi.org/10.3390/min13070900
Zhang J, Chang Y, Gao C, Hui X, Jokilaakso A. Extraction of Gallium from Brown Corundum Dust by Roasting—Acid Leaching Process. Minerals. 2023; 13(7):900. https://doi.org/10.3390/min13070900
Chicago/Turabian StyleZhang, Juhua, Yuwei Chang, Cong Gao, Xujie Hui, and Ari Jokilaakso. 2023. "Extraction of Gallium from Brown Corundum Dust by Roasting—Acid Leaching Process" Minerals 13, no. 7: 900. https://doi.org/10.3390/min13070900
APA StyleZhang, J., Chang, Y., Gao, C., Hui, X., & Jokilaakso, A. (2023). Extraction of Gallium from Brown Corundum Dust by Roasting—Acid Leaching Process. Minerals, 13(7), 900. https://doi.org/10.3390/min13070900