Article

Three-Dimensional Inversion of Long-Offset Transient Electromagnetic Method over Topography

1
School of Geophysics and Geomatics, China University of Geosciences, Wuhan 430074, China
2
State Key Laboratory of Geological Processes and Mineral Resources, China University of Geosciences, Wuhan 430074, China
3
Université Grenoble Alpes, University Savoie Mont-Blanc, CNRS, UMR CNRS 5204, EDYTEM, 73370 Le Bourget du Lac, France
*
Author to whom correspondence should be addressed.
Minerals 2023, 13(7), 908; https://doi.org/10.3390/min13070908
Submission received: 18 June 2023 / Revised: 2 July 2023 / Accepted: 3 July 2023 / Published: 5 July 2023

Abstract

:
The long-offset transient electromagnetic method (LOTEM) is widely employed in geophysical exploration, including environmental investigation, mineral exploration, and geothermal resource exploration. However, most interpretations of LOTEM data assume a flat Earth, and the commonly used one-dimensional (1D) interpretation encounters significant challenges in achieving reliable geological interpretations when topography is ignored. To address these challenges, this study presents an effective three-dimensional (3D) LOTEM inversion method. In this study, we discretize the simulation domain using unstructured tetrahedra to accurately simulate complex geological structures. The finite-element time-domain (FETD) method is utilized to calculate the LOTEM forward responses, and the limited-memory BFGS (L-BFGS) optimization method is employed for 3D LOTEM inversion. To avoid explicit calculation of sensitivity, we obtain the product of the transposed sensitivity matrix and the vector through adjoint forward modeling. Several synthetic models are used to verify the developed program, and the influence of topography on LOTEM inversion is examined. The numerical results demonstrate that topography can significantly impact the inversion result, potentially leading to incorrect geological interpretations. Finally, the developed inversion algorithm is applied to a realistic ore model from Voisey’s Bay, Labrador, Canada. The 3D inversion successfully reconstructs the spatial distribution of the ore body, further confirming the effectiveness of the developed algorithm.

1. Introduction

The long-offset transient electromagnetic method (LOTEM) is an important extension of geophysical exploration methods. It was initially developed for hydrocarbon exploration and crustal research [1], and has been widely used in environmental investigations [2], oil and gas exploration [3,4,5], mineral and geothermal resource exploration [6,7,8,9,10,11], and deep crustal research [12]. LOTEM can conduct depth measurements by transmitting a single impulse signal from the transmitter. In theory, this method exhibits higher working efficiency and can overcome problems associated with typical electromagnetic noise [12]. The typical 3D LOTEM survey configuration is shown in Figure 1. As a crucial technology for deep mineral resource exploration, LOTEM commonly uses a long grounded-wire source as the transmitter, while recording the horizontal electric field and the time derivative of the vertical magnetic field at the receivers [1]. Some previous studies have shown that the magnetic field component of LOTEM exhibits higher sensitivity for conductive anomalies, while the electric field component plays a crucial role in identifying resistive anomalies. Therefore, we can enhance the comprehensiveness of electrical structural interpretation by recording information on electric and magnetic fields simultaneously for LOTEM data [13,14]. With the development of high-power transmission systems and high-precision measuring instruments, the detection of weak signals no longer presents a technological bottleneck for the application of the LOTEM method [15,16,17]. However, the precise interpretation of LOTEM data still faces some challenges such as the influence of complex topography and geological structure. Particularly in mountainous regions with substantial topographic variations and intricate geoelectric structures, the 1D inversion method cannot obtain reliable information of the underground electrical structural distribution [18]. Therefore, the development of 3D forward modeling and inversion algorithms with topography will be of great significance for the accurate interpretation of LOTEM data.
The development of transient electromagnetic (TEM) 3D forward modeling and inversion algorithms has promoted numerical investigations and practical applications of the LOTEM method [19,20,21,22,23]. Various numerical methods have been successfully employed in the 3D LOTEM forward modeling. These methods include the finite difference method (FD) [24], the integral equation method (IE) [25], the finite volume method (FV) [26], and the finite element method (FE) [27]. In a LOTEM survey, the 1D inversion is still the most commonly used method for data interpretation due to its advantage of fast processing and quantitative interpretation [14,28,29]. However, some scholars have been aware of the topographic effects when using the 1D inversion method for LOTEM data processing [30]. Therefore, the study into how topography affects the LOTEM signal has become a focal point in the field of LOTEM research [18,25,31,32]. Particularly for 2D and 3D LOTEM inversion, we expect to obtain a more accurate geological interpretation by considering the influence of topography. Previous studies have promoted the development of the LOTEM method. The cases included using Fourier transform to extract frequency-domain information of LOTEM data from the Yurihara oil and gas field in northeast Japan and applying 2.5D finite element inversion to obtain the electrical structures in the shallow subsurface [33]; Adopting the frequency-time domain transformation method to achieve 3D LOTEM inversion [34]. Perhaps the topography in their study area is relatively flat and has relatively little impact on LOTEM data. Therefore, topographic factors were not strictly considered in their research. Certainly, some researchers in their studies have gradually recognized the importance of topographic effects in LOTEM inversion. For example, some scholars analyzed LOTEM data from the Merapi Volcano region in Indonesia, where they considered topographic effects and successfully identified the resistivity properties of the volcanic structure, subsequently yielding valuable new insights into the geological environments of the region [2]. Furthermore, the 2D joint inversion of semi-airborne controlled source electromagnetic (semi-AEM) and LOTEM data over topography was also applied to perform geological interpretation in eastern Thuringia, Germany [32]. However, 3D LOTEM inversion algorithms are currently in the exploratory and developmental stages. Most of these algorithms rely on regular hexahedral grids, which may present significant challenges when interpreting transient electromagnetic data in complex topographic areas. Fortunately, notable advancements have been made in the development of 3D forward modeling and inversion algorithms for transient electromagnetic methods, which are based on the unstructured vector finite element method (FEM) and implicit time stepping. These algorithms offer distinct advantages in accommodating topography and complex geological structures, thereby enabling more accurate interpretation of LOTEM data in complex geological environments.
In the present study, we utilize the FETD method with an unstructured tetrahedral mesh for LOTEM inversion. First, we introduce the algorithms for both the forward modeling and inversion theory. Then, we test the code to synthetic examples to check its validity and discuss the topographic effects on the inversion results. Finally, we apply our inversion code to test a realistic ore body model built from a field survey, which is located at Voisey’s Bay, Labrador, Canada.

2. Methods

2.1. Forward Modeling

We always assume that the subsurface media is isotropic and often do not consider the dispersive media in low-frequency geophysical applications [35,36,37,38]. We can start from Maxwell’s equations with the quasistatic approximation, and the 3D forward modeling involves solving the time-domain curl-curl equation for the electric field E r , t shown as follows [39]:
× 1 μ 0 × E r , t + σ E r , t t + J s r , t t = 0 .      
where J s r , t represents the current density of the electric transmitting source at time t and position r ; σ denotes the conductivity; and μ 0 stands for the free space magnetic permeability. We utilize the vector finite element method with an unstructured tetrahedral mesh for domain discretization, and the electric field within each tetrahedral element can be approximated as [40]:
E e r , t = i = 1 6 N i e r E i e t .
where E i e t denotes the electric field on the i th edge of the e th element, and N i e r represents the vector interpolation basis function. By applying the Galerkin method, we can derive the related equation for the forward modeling of LOTEM as follows:
M E t t + K E t + S = 0 ,
where M represents the mass matrix; K denotes the stiffness matrix; and S stands for the source term [40]. For each element Ω e , these matrices can be expressed as:
K e i , j = 1 μ 0 Ω e × N i e r · × N j e r d v ,
M e i , j = σ e Ω e N i e r · N j e r d v ,
S e i = Ω e N i e r s · J s r s , t t d v .
In order to solve Equation (3), an approximation of the time derivative term is required. To achieve this, we utilize an unconditionally stable second-order backward-Euler algorithm to approximate the time derivatives of the electric field and current density. This approach guarantees the stability of the 3D LOTEM forward modeling process [23,39]. The equations are as follows:
E t n t 1 t n 1 + 2 k n 1 + k n E t n 1 + k n E t n 1 + k n 2 1 + k n E t n 2 ,
J s r s , t n t 1 t n 1 + 2 k n 1 + k n J s r s , t n 1 + k n J s r s , t n 1 + k n 2 1 + k n J s r s , t n 2 .
where t n , t n 1 , and t n 2 represent the n th, n 1 th, and n 2 th time channels, respectively; t n = k n t n 1 , where t denotes the size of the time step. Substituting Equations (7) and (8) into Equation (3), we obtain:
1 + 2 k n 1 + k n M + Δ t n K E t n = M 1 + k n E t n 1 k n 2 1 + k n E t n 2 Δ t n S t n ,
Δ t n S t n = N r s · p · 1 + 2 k n 1 + k n I t n 1 + k n I t n 1 + k n 2 1 + k n I t n 2 d l .
where I t represents the amplitude of the current at time t ; p denotes the direction of the current; and d l represents the length of the electric dipole. We discretize the LOTEM source by using the edges of tetrahedral elements, where the long grounded-wire is discretized into a series of electric dipoles. The term S only has values on edges that are associated with the LOTEM source.
In this study, the transmitting waveform is a step-off waveform. Therefore, in order to obtain the initial electric field, we need to solve a direct current (DC) resistivity forward problem:
· σ φ = I δ r r 0 .
where I represents the amplitude of the current; and r 0 denotes the position of the point current source. Equation (11) can be solved using a node-based FE method based on the tetrahedral mesh [41], and can be written as:
K D C φ = S D C .
where K D C is the coefficient matrix for DC forward modeling; φ is a column vector about the electric potential; and S D C is the source term. Finally, the initial field E t 0 for LOTEM can be obtained using the interpolation operator Q D C :
E t 0 = E D C = φ = Q D C φ .
For DC and LOTEM forward modeling, it is assumed that the electric potential and the tangential component of the electric field are zero on the boundary Γ of the modeling domain [39]. We have:
φ | Γ = 0 ,   n × E | Γ = 0 .
By assembling Equation (9) for all time channels, we can obtain the complete matrix equation:
B n = 1 + 2 k n 1 + k n M + Δ t n K ,
C n = 1 + k n M ,
D n = k n 2 1 + k n M ,
B 1 C 2 B 2 D 3 C 3 B 3 D 4 C 4 B 4 D n C n B n E 1 E 2 E 3 E 4 E n = Δ t 1 S t 1 + 3 2 M E t 0 Δ t 2 S t 2 1 2 M E t 0 Δ t 3 S t 3 Δ t 4 S t 4 Δ t n S t n .
where n is the number of time channels in forward modeling. In this study, we use the direct solver MKL PARDISO [42] to solve the linear equation system for DC and LOTEM problems. According to Equation (18), it is evident that the LOTEM forward modeling adopts a recursive approach. We can initiate the process from the first time channel. In cases where the time step Δ t remains constant, the coefficient matrix on the left-hand side of the equation remains unchanged. This allows us to perform the matrix decomposition only once and subsequently reuse the decomposition results, significantly enhancing computational efficiency. However, if the time step Δ t is altered, we will need to conduct the matrix decomposition again.

2.2. Inverse Problem

For our inversion problem, the objective functional can be written as follows [43]:
ϕ m = ϕ d m + λ ϕ m m = W d d o b s d p r e 2 2 + λ W m m m r e f 2 2 .
where ϕ d m and ϕ m m are the data misfit functional and model regularization terms, respectively; λ is the regularization parameter; m is the model vector, N m is the number of unknown model parameters; m r e f is the a prior model; d o b s and d p r e are the vector of observed data (or synthetic data) and predicted data, respectively; W d is the data weighting matrix based on the observed data error; and W m is the roughness matrix. In most cases, we usually use only one transmitter source for LOTEM exploration, so the size of the observed and predicted data is N = N c × N d , where N c and N d are the number of observation time channels and receivers, respectively.
We employ the L-BFGS optimization method to minimize Equation (19), which has been extensively utilized in geophysical inversion with remarkable performance [20,41,44]. The L-BFGS algorithm approximates the inverse of the Hessian matrix by leveraging the gradient information of the objective functional. To compute the gradient of the objective functional, we differentiate Equation (19) with respect to the model parameter m .
g m = 2 J T r + 2 λ W m T W m m m r e f .
where J is sensitivity matrix with the size of N c × N m ; r = W d T W d d o b s d p r e . Obviously, directly storing the sensitivity matrix poses challenges. Nevertheless, we can employ adjoint forward modeling to calculate the product of the transposed sensitivity matrix and the vector, thereby obtaining J T r . This approach effectively minimizes computational workload and memory requirements.
For the calculation of J T r , the forward equation can be written as follows:
A E = b .
Taking the derivative of Equation (21) with respect to the model parameter m , we have:
E m = A 1 b m A m E = A 1 G ,
Therefore, the sensitivity matrix of the observed data can be written as:
J = d p r e m = Q E m .
where the interpolation operator Q can be written as Q = Q t Q d , Q d is the interpolation operator that interpolates the electric field to the receivers, and Q t is the interpolation operator that interpolates the predicted data from the forward time channel to the actual observed time channel. Substituting Equations (22) and (23) into Equation (20), we obtain:
g m = 2 G T A T Q T r + 2 λ W m T W m m m r e f .
Subsequently, we can obtain the adjoint forward modeling equation:
A T u = Q T r .
Once the vector u is obtained through backward recursion for all computational time channels, it can be substituted into Equation (24) to obtain J T r , which allows us to calculate the gradient of the objective functional. It is worth noting that when computing the matrix G , A m E can be analytically calculated. As for the calculation of b m , it is known from Equation (18) that S t n is independent of the parameter vector m , thus S t n m = 0 . Therefore, we only need to deal with M E t 0 . We have:
M E t 0 m = M m E t 0 + M E t 0 m .
where M m E t 0 can be obtained through analytical calculation, and M E t 0 m can be obtained by solving the DC adjoint forward modeling [41].
For the tetrahedral unstructured mesh, the roughness matrix for the model regularization can be expressed as [23]:
W m i , j = V i V i j V m a x k = 1 N V i k / r i j i j j = 1 N W m i , j i = j 0 e l s e .
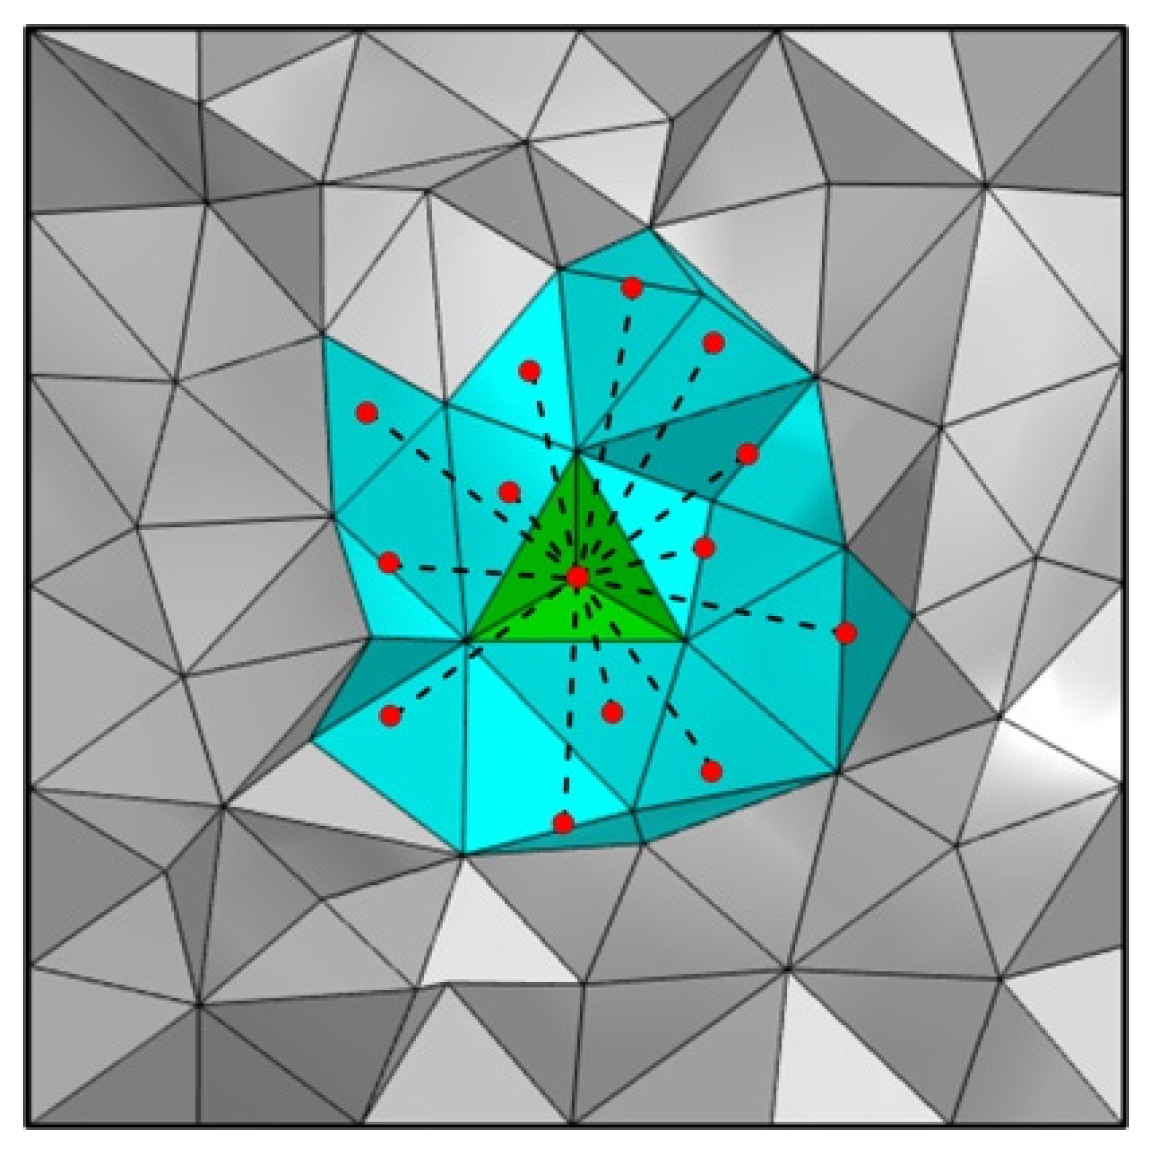
where N is the number of nearby elements; V i is the volume of the i th inversion element; V i j is the volume of the j th nearby element corresponding to the i th inversion element; V m a x is the maximum volume among all inversion elements; k = 1 N V i k is the total volume of nearby elements corresponding to the i th inversion element; r i j is the Euclidean distance from the j th nearby element to the i th inversion element (refer to Figure 2).
In order to obtain physically meaningful model parameters, we can begin by estimating the range of conductivity parameters in the inversion area using additional geological information. Subsequently, we apply a logarithmic transformation to the model parameters and establish upper and lower boundaries for the physical parameters. For the k th inversion element, the constrained parameter m k can be written as [46]:
m k = ln ln m k a k / ln b k m k .                   a k < m k < b k ,
where m k is the model parameter of the k th inversion element. a k and b k are the lower and upper bound values, respectively. The gradient of objective functional can be rewritten as:
g m = g m m m = g m · m · ln b m · ln m b / ln b a .
By introducing a new model parameter vector m , the constrained optimization problem based on parameter constraints is transformed into an unconstrained optimization problem. The updated model parameters by the L-BFGS optimization algorithm can be expressed as:
m = e x p ln a + ln b e x p m 1 + e x p m .

3. Synthetic Examples

We design two synthetic examples to test the effectiveness of the developed 3D inversion algorithm for LOTEM. To obtain more detailed electrical structural information, we use synthetic data E x and d H z / d t for 3D LOTEM inversion [13,14]. We also introduce 5% Gaussian noise to the synthetic data. Since we use the weighting matrix W d , which is based on the observed data error, there are no additional weighting parameters or matrices introduced between E x and d H z / d t [32]. In this study, the initial regularization parameter for inversion is set to 1.0. We can obtain the updated regularization parameter by using λ = q · g d m / g m m when the RMS decreases slowly, where g d m is the gradient of ϕ d m , g m m is the gradient of ϕ m m , · denotes the Euclidean norm, and we define the coefficient as q = 0.2 based on our experience. The lower and upper bound values of conductivity are set to 0.0001 S/m and 10 S/m, respectively. And the transmitting waveform used in the synthetic examples is a step-off waveform with a current of 1 A. All synthetic examples are performed on a Linux workstation with Intel (R) Xeon (R) W-2295 CPU @ 3.00 GHz and 128 GB memory.
R M S = i = 1 N d o b s i d p r e i 2 / ε i 2 N .
where ε i is the noise standard deviation of ith data. In general, the inversion process can be terminated when the RMS decreases to 1.0 or g d m still decreases slowly after several iterations.

3.1. Flat Earth Model

The figure displayed in Figure 3 represents the flat Earth model. In this model, the air resistivity is 108 Ω∙m, while the background’s resistivity is 100 Ω∙m. Additionally, there is a conductive anomaly with a resistivity of 10 Ω∙m. The anomaly is situated at a depth of z = 200 m and has dimensions of 400 m × 200 m × 200 m. The grounded-wire transmitter, which measures 600 m in length, is positioned at coordinates (0 m, −1500 m, 0 m). A total of 121 receivers are distributed at intervals of 100 m. For the forward model, there are a total of 496,607 tetrahedral elements. Our observations encompass a time range from 0.1 ms to 1 s. Throughout this period, we calculate the impulse response d H z / d t and the electric field E x for 31 time channels.
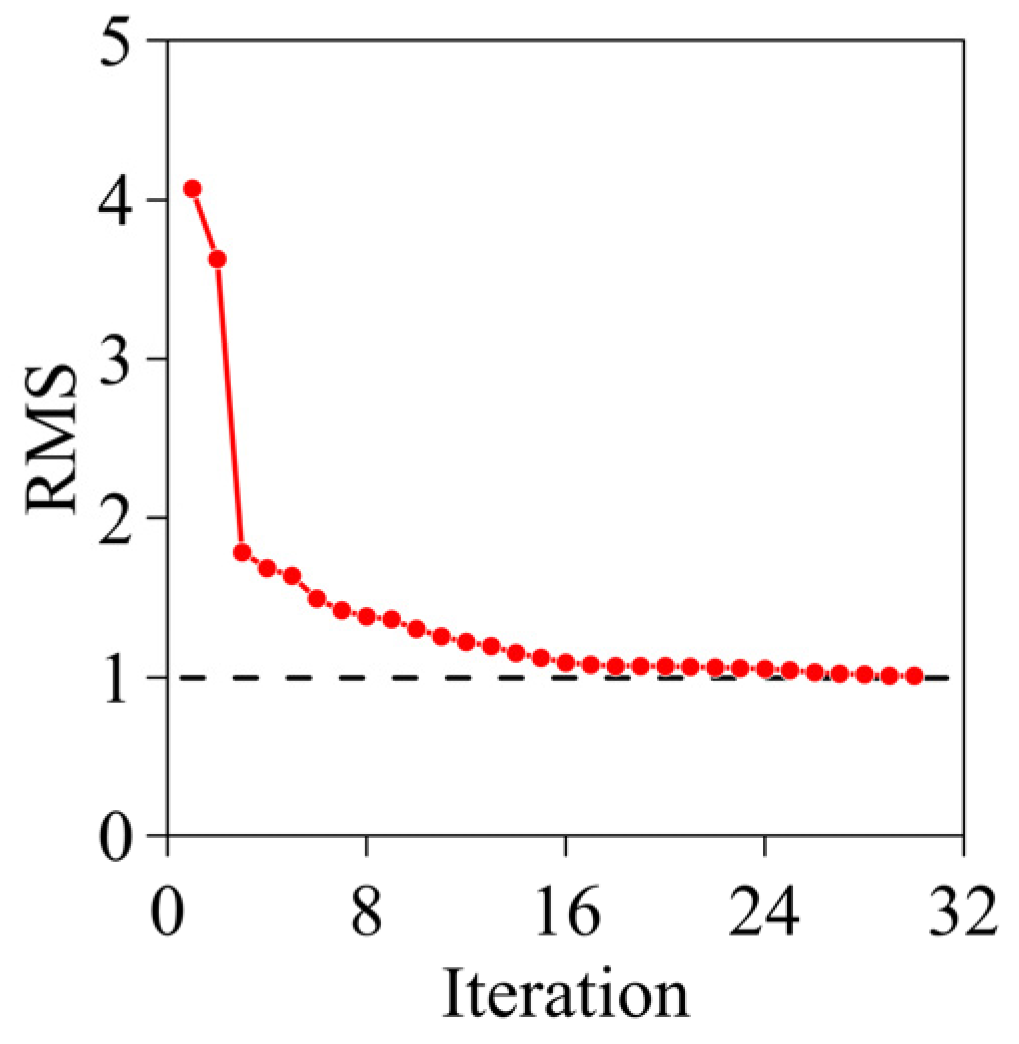
Synthetic data are employed for 3D inversion, and the initial resistivity is set to 100 Ω∙m. The discretization of the inversion model consists of 490,371 tetrahedral elements. To assess the accuracy of the forward algorithm, we utilize the forward response of the initial model and place a receiver at coordinates (0 m, 0 m, 0 m). Figure 4 showcases the finite element (FE) solutions alongside the 1D semi-analytical solutions of the impulse response d H z / d t and electric field E x . It is evident that the FE solutions align well with the 1D semi-analytical solutions, with all relative errors of the FE solutions falling below 5%. This demonstrates the accuracy of the forward modeling code for 3D inversion. Subsequently, the impulse response d H z / d t and electric field E x are utilized for the inversion process. After 30 iterations (as depicted in Figure 5), the inversion process is concluded. The total inversion time amounts to 14.9 h, while the memory requirement reaches 16.8 GB.
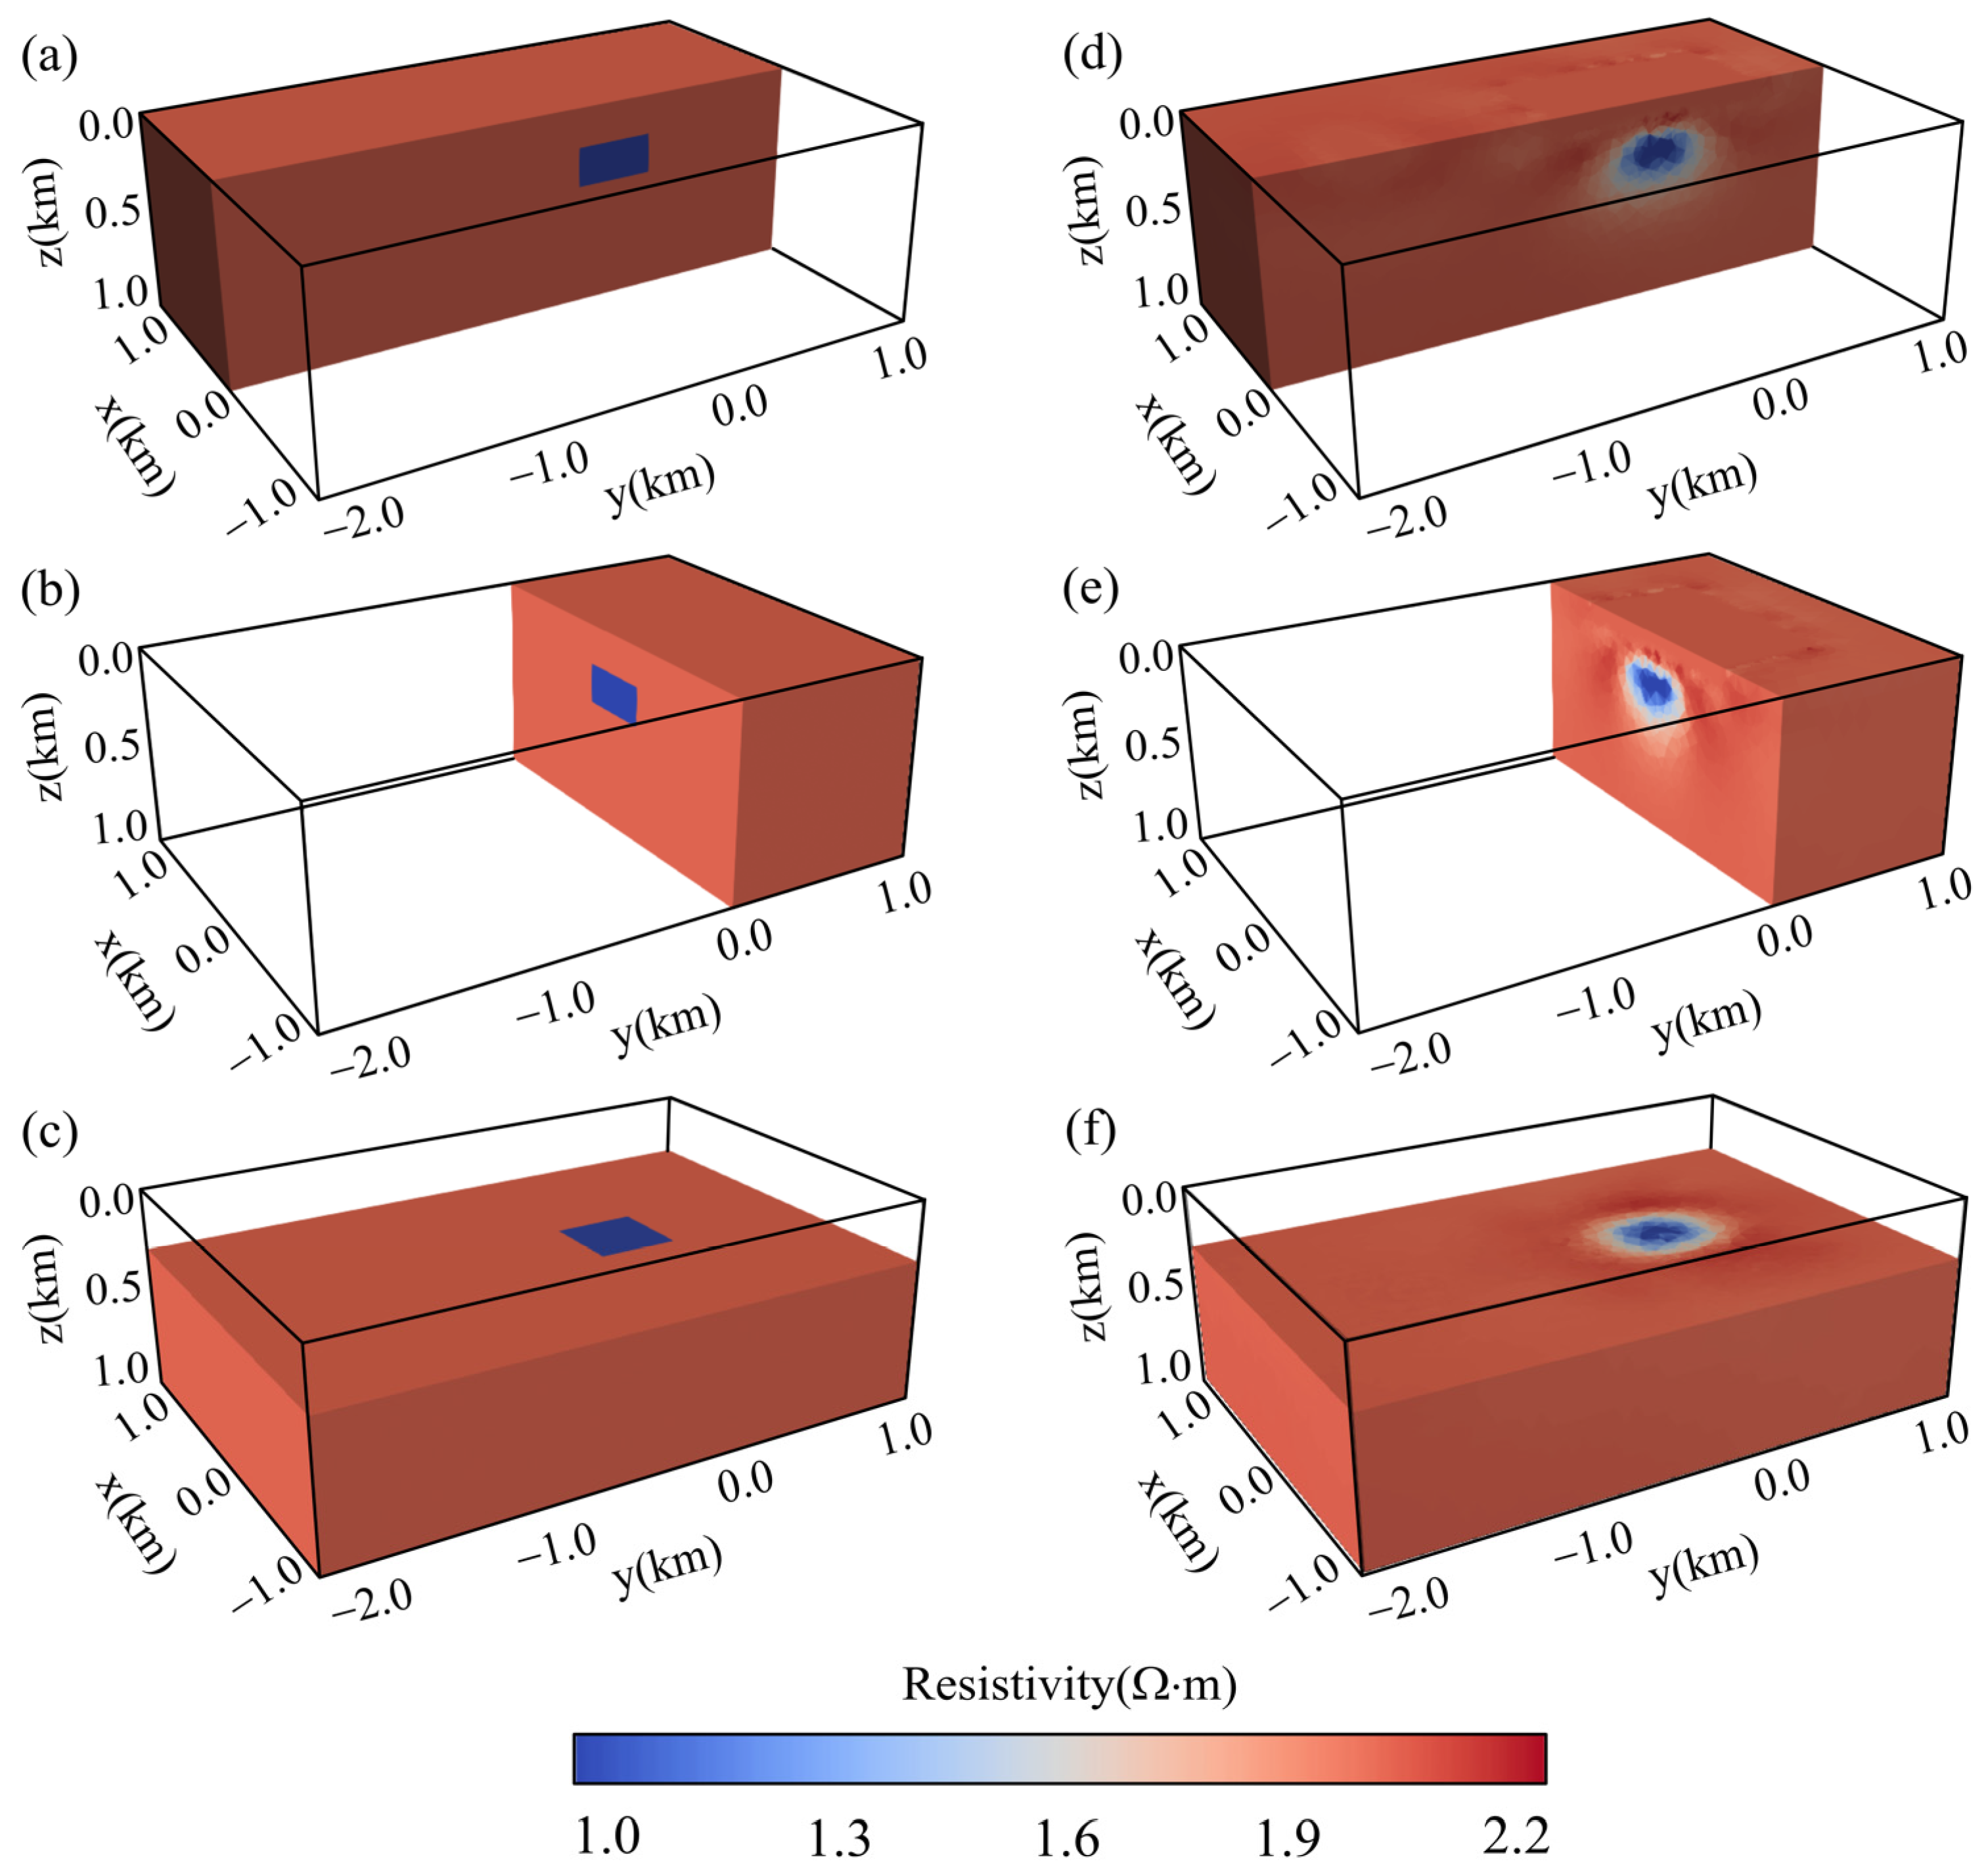
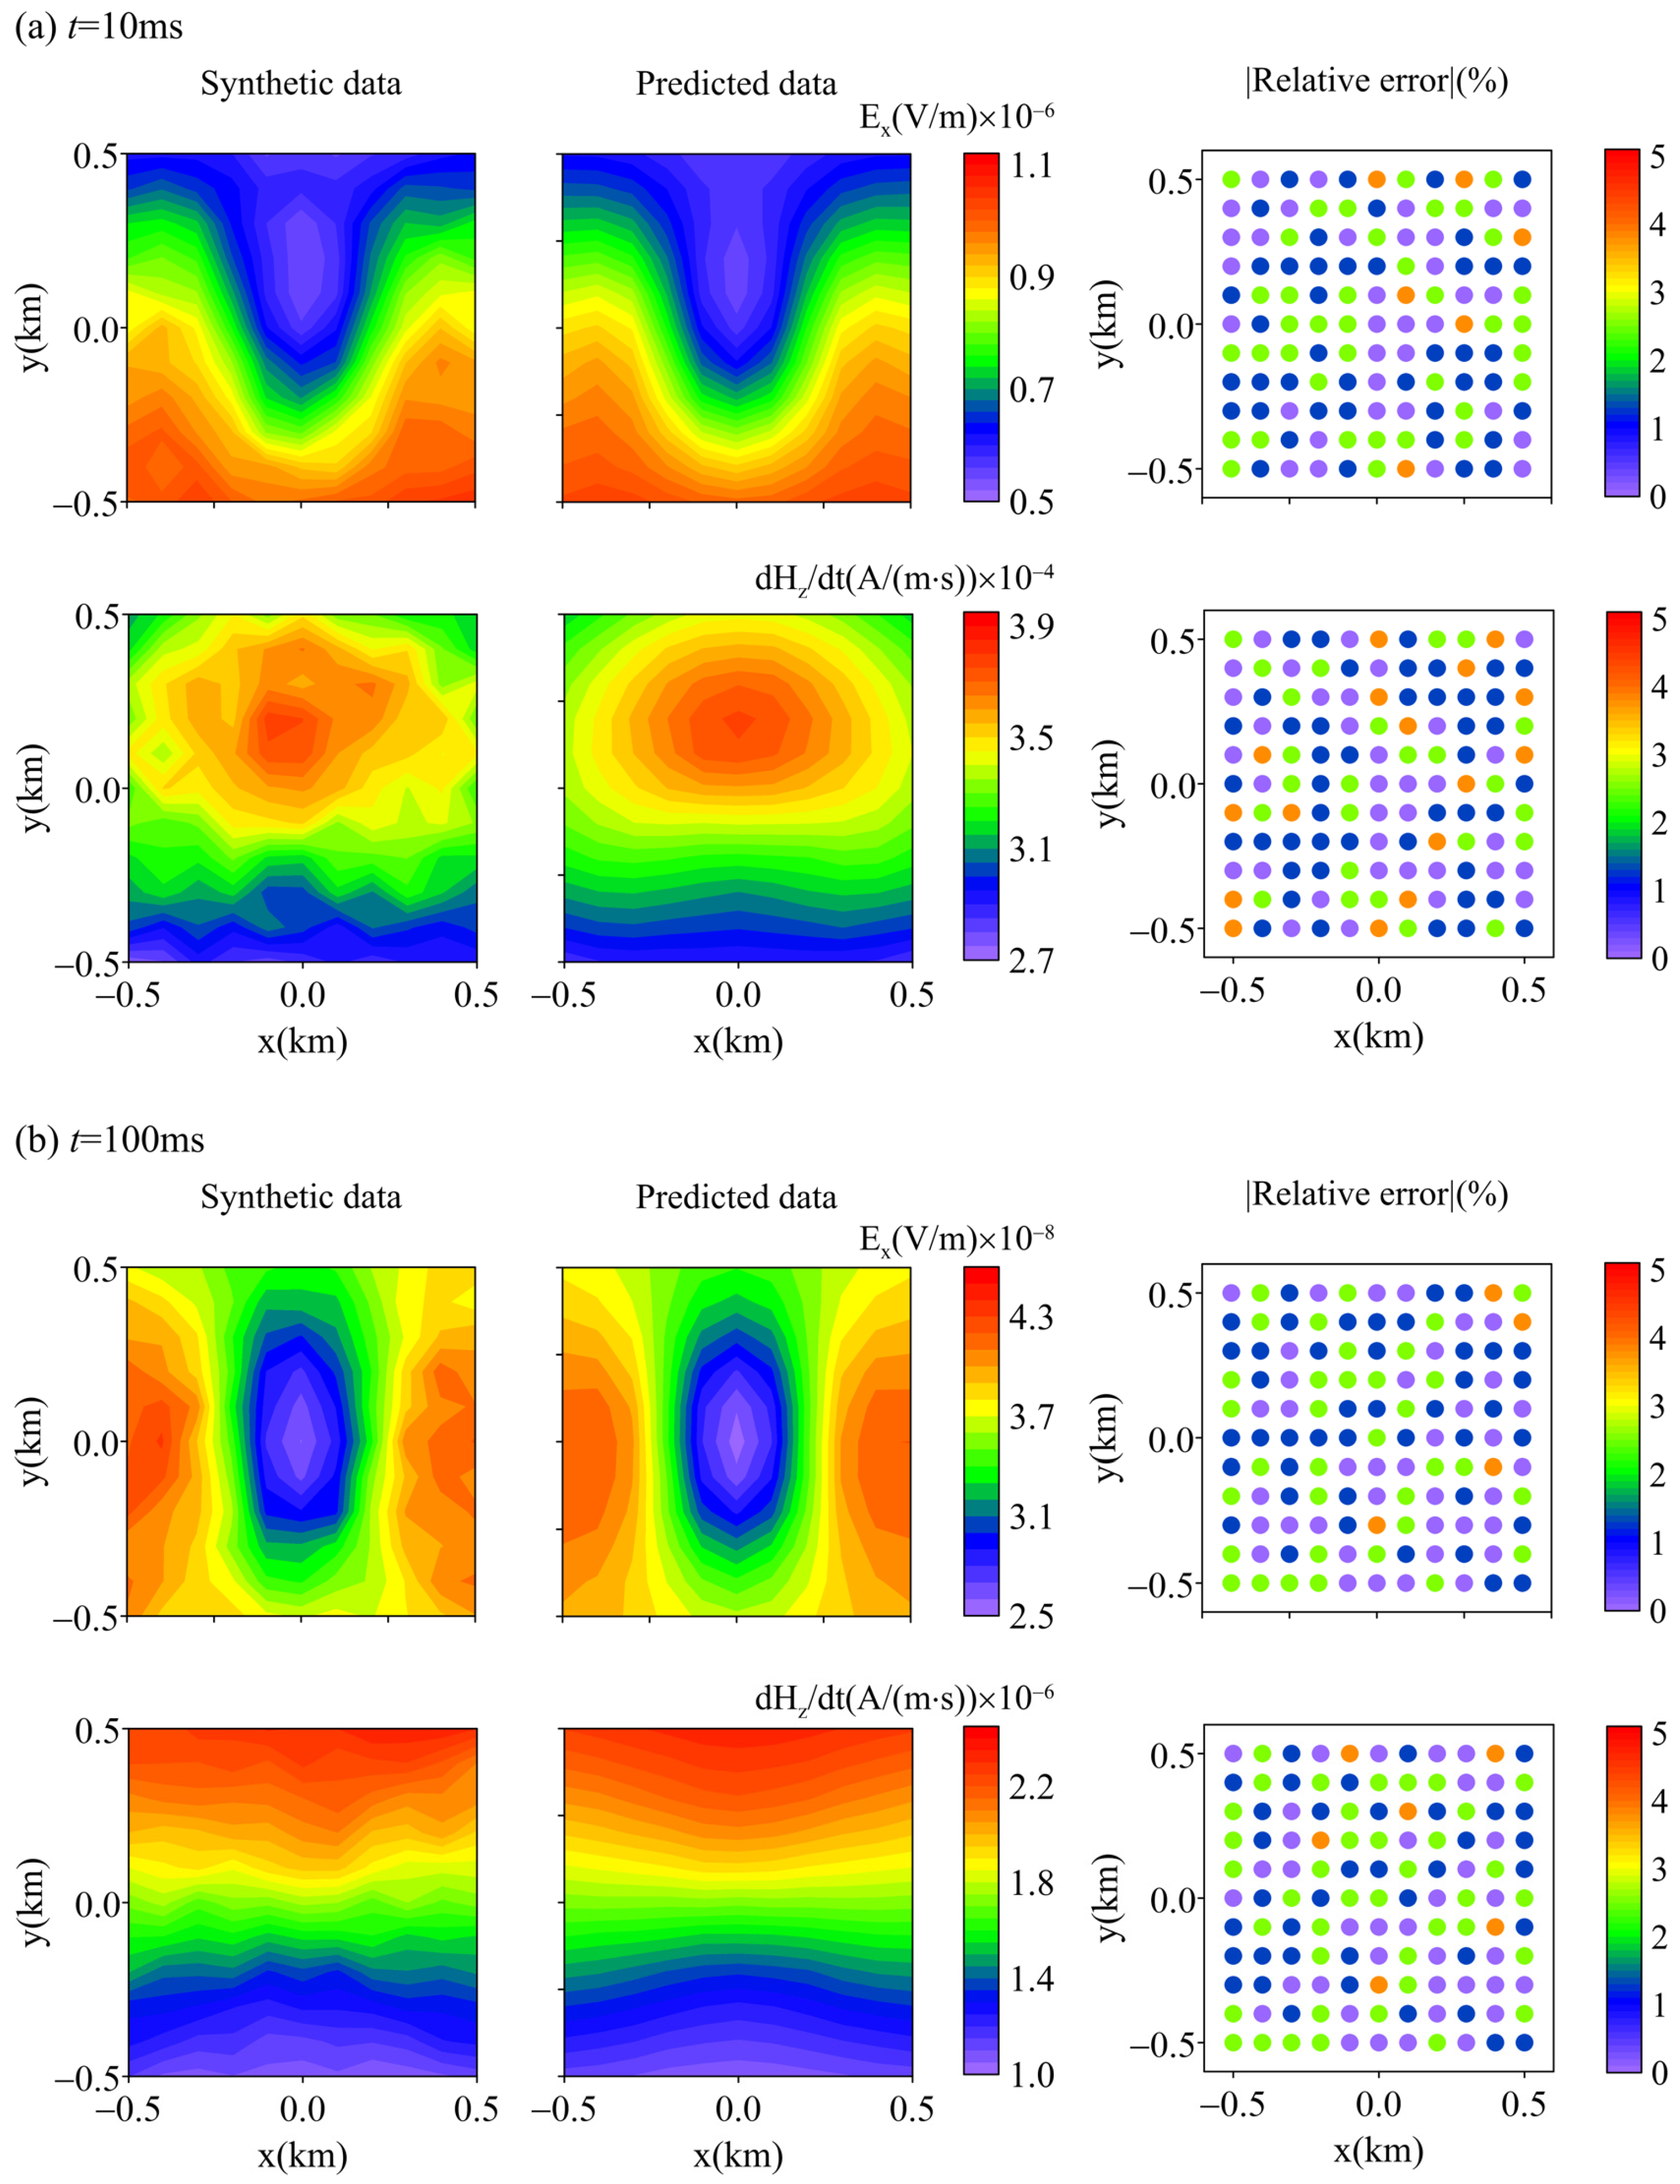
The synthetic model and the corresponding recovered model are illustrated in Figure 6, clearly demonstrating the accurate retrieval of the anomaly’s position and resistivity. Figure 7 displays the synthetic data, predicted data, and relative errors at 10 ms and 100 ms. The agreement between the predicted and synthetic data validates the correctness of our inversion code. These results affirm that our code is reliable and can be applied to more realistic and complex synthetic models for further testing.

3.2. Synthetic Model with Topography

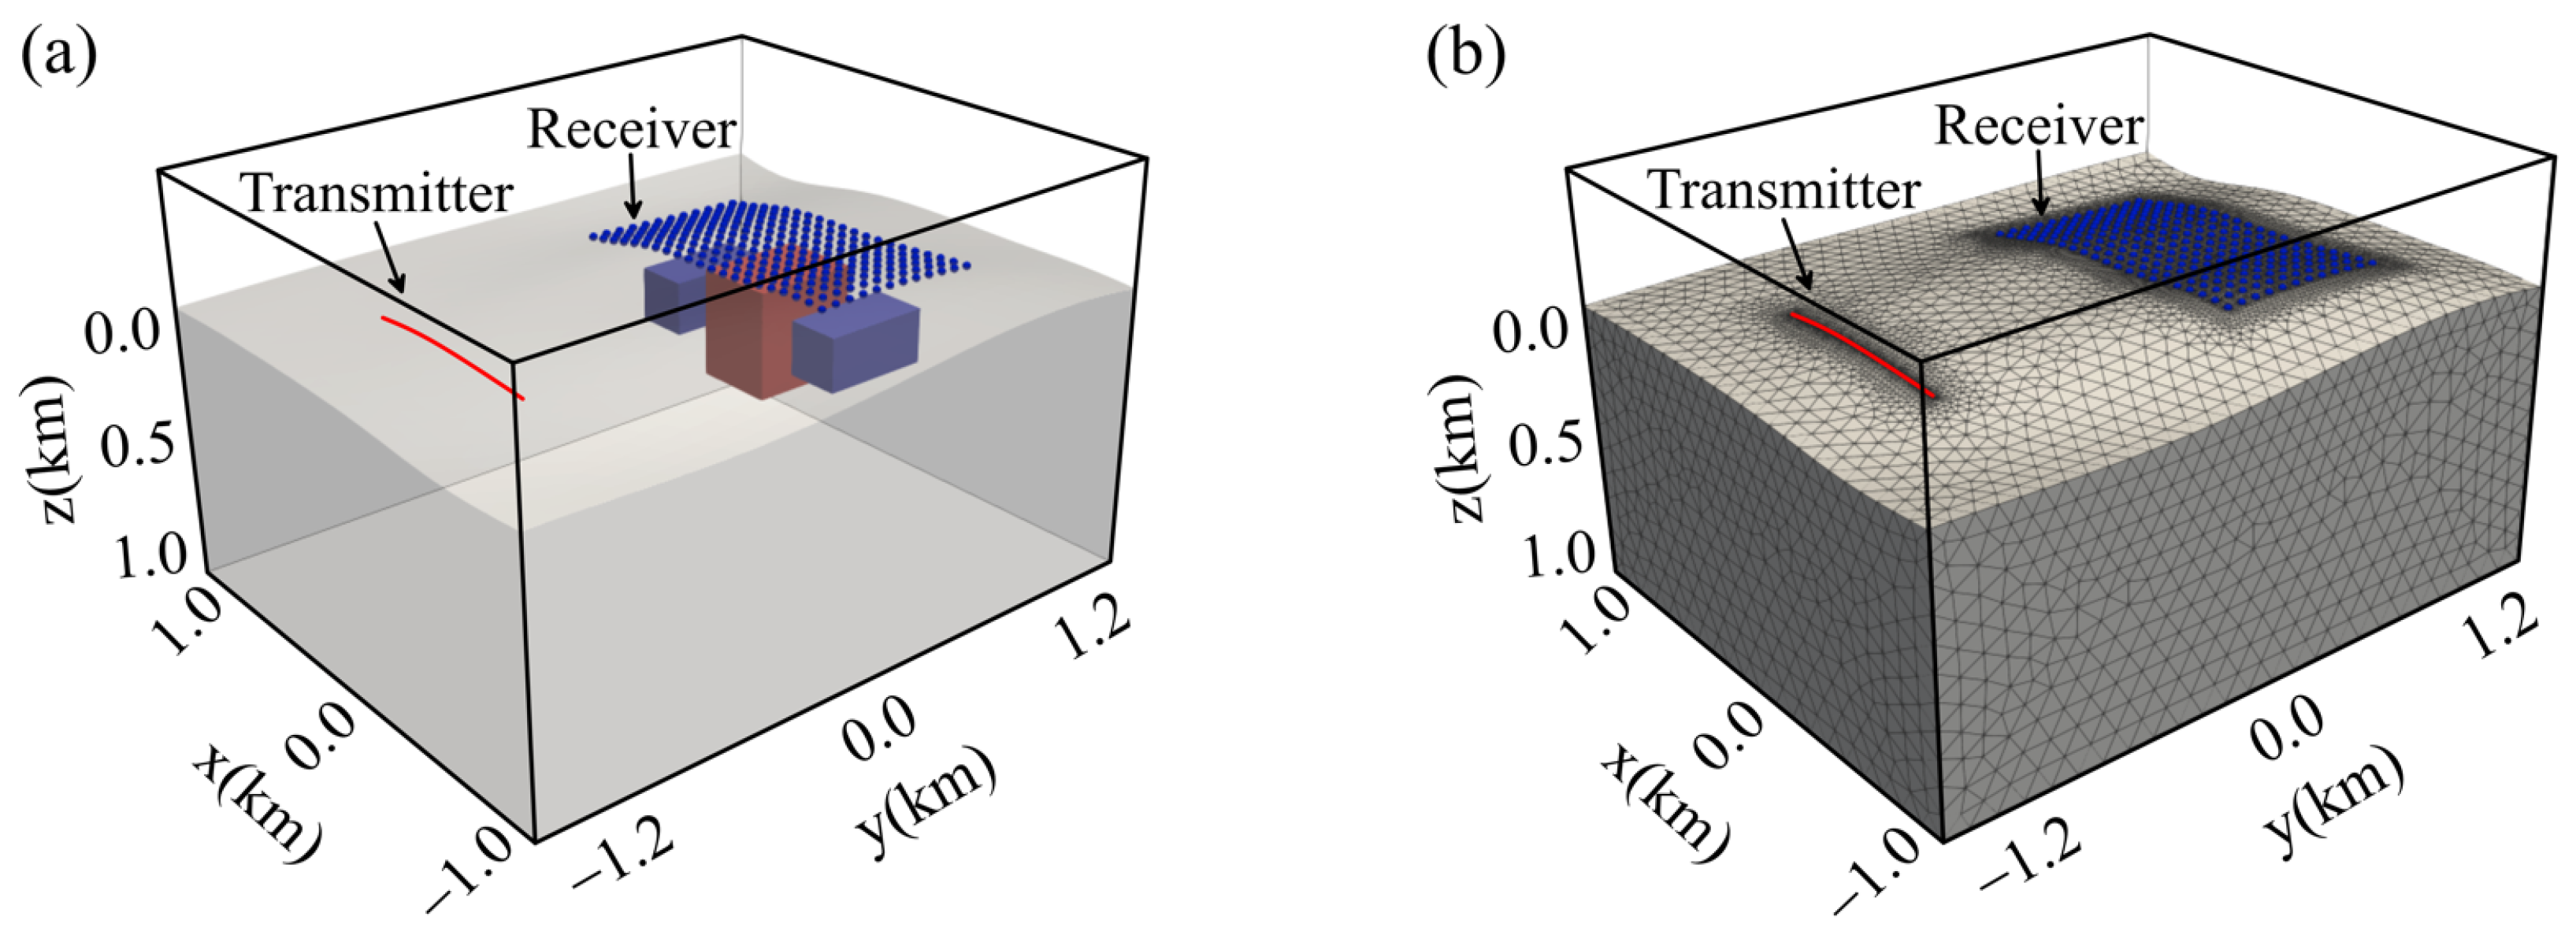
To investigate the influence of topography on the results of LOTEM inversion, we developed a synthetic model incorporating topographic features (Figure 8). In this model, the air resistivity is set to 108 Ω∙m, while the background’s resistivity is 100 Ω∙m. We introduced three embedded anomalies within the model. Both conductive anomalies situated on either side have a resistivity of 10 Ω∙m. and share the same dimensions of 400 m × 200 m × 200 m. The top depths of these anomalies are z = 200 m and z = 150 m, respectively. The third anomaly positioned in the middle has a resistivity of 1000 Ω∙m and a top depth of z = 50 m. It is characterized by dimensions of 400 m × 300 m × 400 m. The highest and lowest elevations of the topography are observed at z = −132 m and z = −1 m, respectively. For the experiment, we utilized a grounded-wire transmitter, which spans a length of 800 m and is positioned at (0 m, −800 m, 0 m). The observation area is centered at (0 m, 500 m, −85 m) and consists of 252 receivers spaced 60 m apart. In the forward modeling process, the total number of tetrahedral elements employed is 661,242. We have collected observed time data ranging from 0.1 ms to 1 s, computing the impulse response d H z / d t and the electric field E x for 31 different time channels.
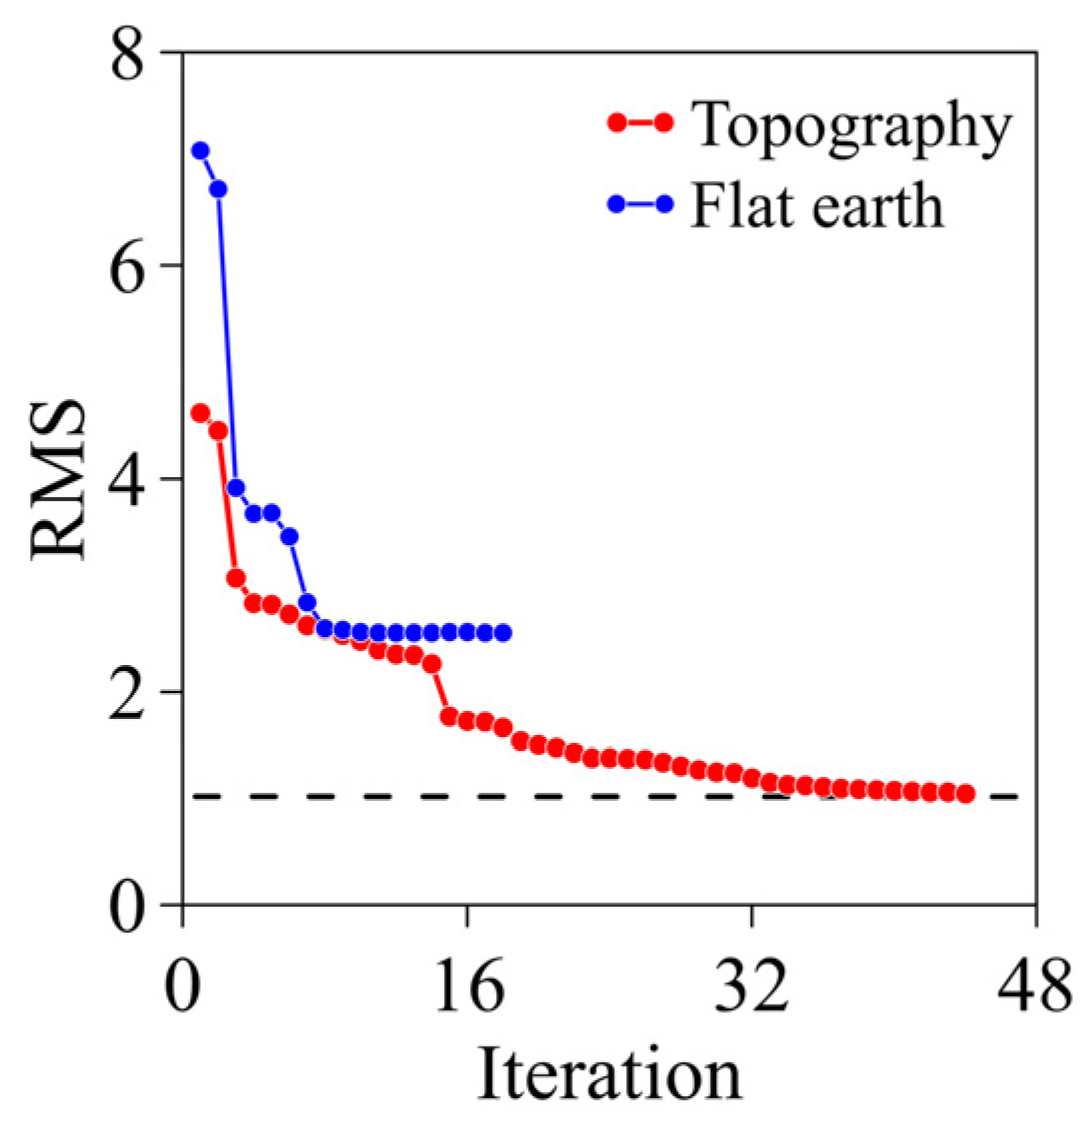
Synthetic data are used for 3D inversion of this model study. For this inversion, the initial resistivity is set to 100 Ω∙m. To analyze topographic effects on LOTEM inversion, we design two inversion models. The topographic model and the flat earth model are discretized into 654,959 tetrahedral elements and 624,853 tetrahedral elements, respectively. The inversion process of topographic model is terminated after 44 iterations (the red line in Figure 9), the total inversion time is 24.1 h and the memory requirement is 20.8 GB. The inversion process of the flat earth model is terminated after 18 iterations (the blue line in Figure 9), the total inversion time is 30.4 h and the memory requirement is 20.1 GB.
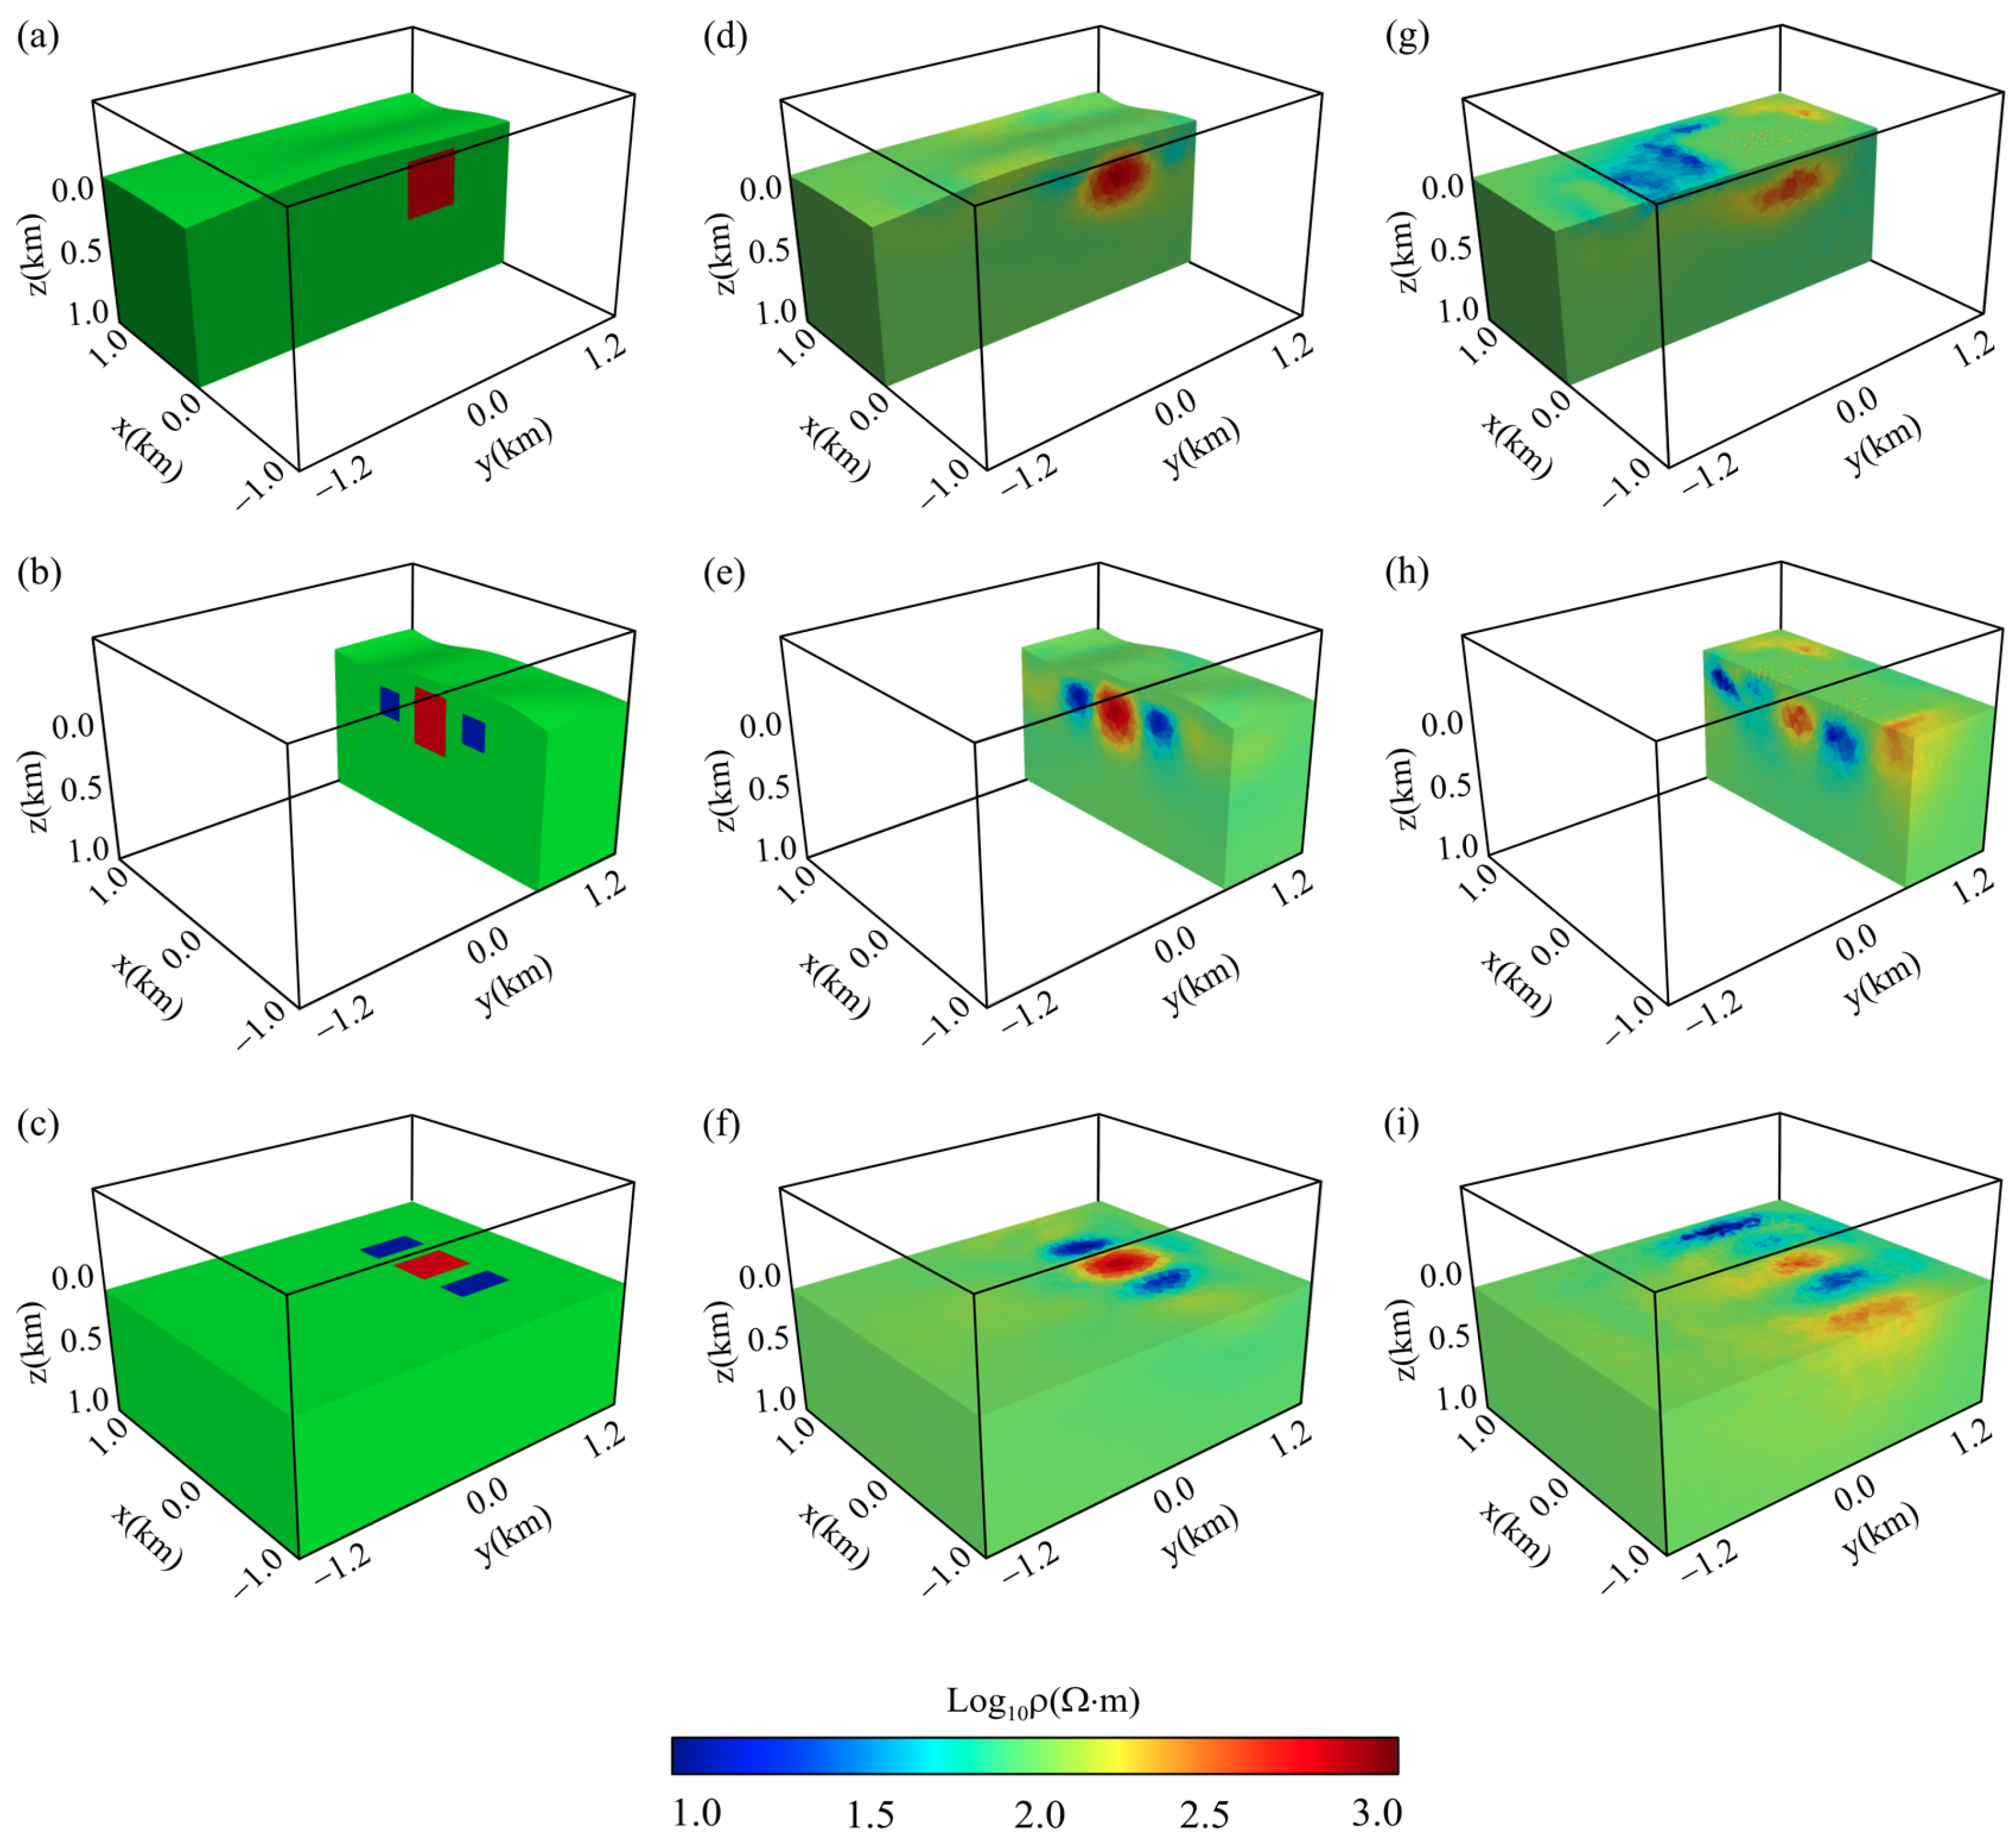
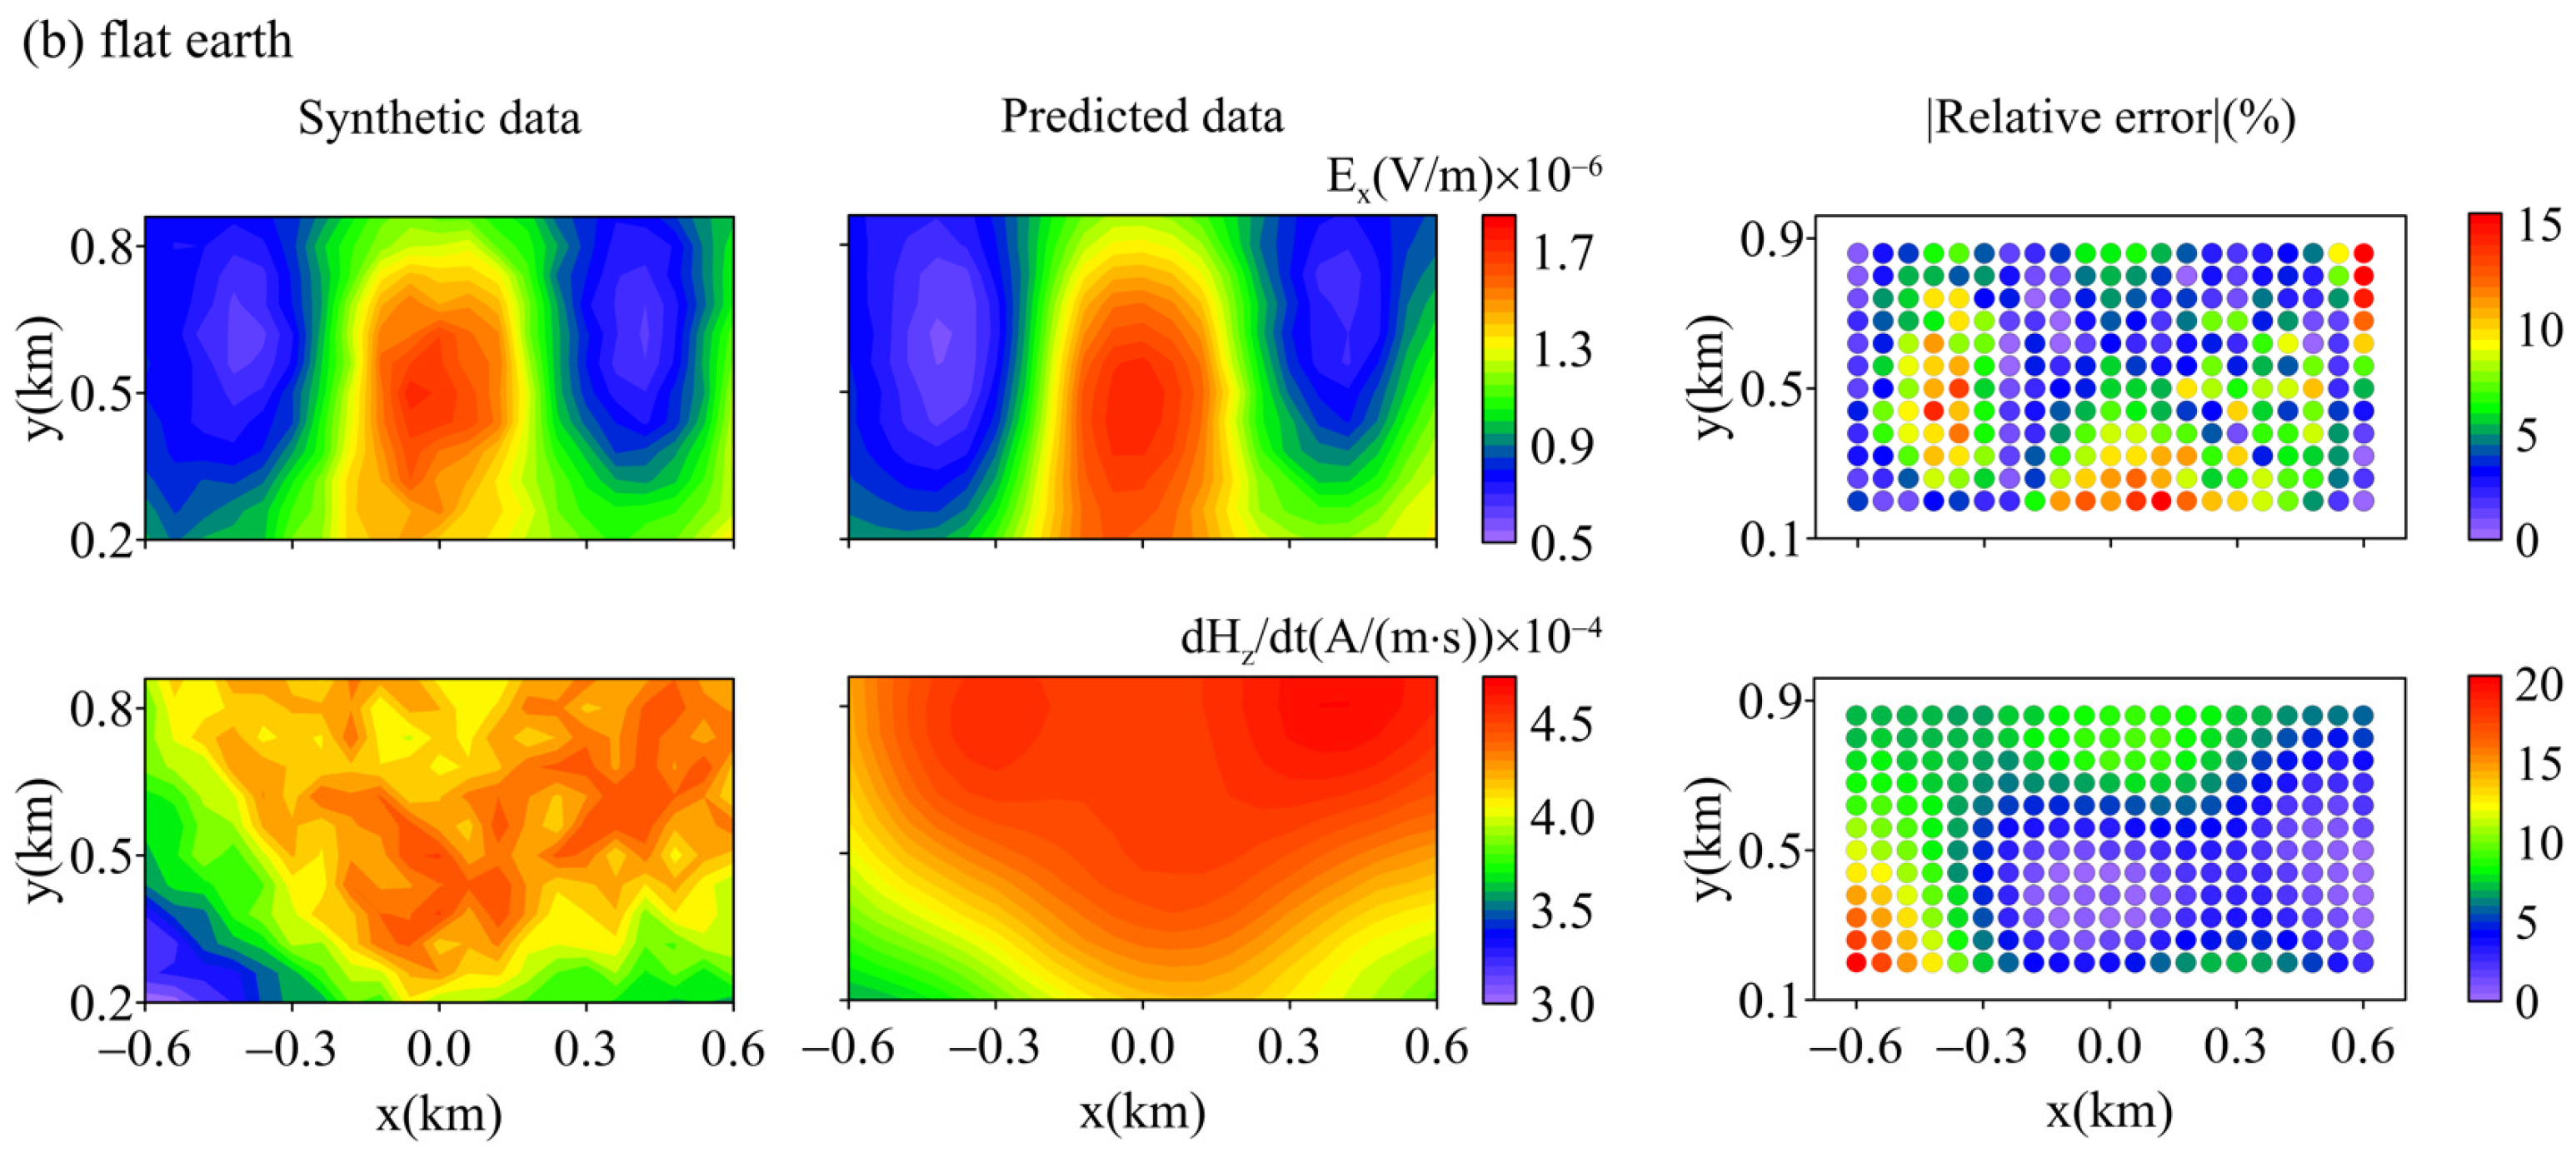
The true model (see Figure 10a–c), the recovered topographic model (see Figure 10d–f) and the recovered flat earth model (see Figure 10g–i) are shown in Figure 10. From Figure 10d–f, it can be seen that the position and resistivity of anomalies are accurately recovered for the topographic model. However, there are many redundant structures in the inversion results of the flat earth model (see Figure 10g–i), which will pose substantial challenges for geological interpretation. The data results at 10 ms are shown in Figure 11. It can be seen that the predicted and synthetic data match well for the topographic model (Figure 11a). Form Figure 11b, the predicted and synthetic data match poorly for the flat earth model. This is due to an inability of the inversion code to find a viable reconstructed model that enhances the agreement between the predicted and observed data. Additionally, the generation of an unreasonable recovered model necessitates more line searches within each inversion iteration for L-BFGS, thereby prolonging the inversion process for the flat earth model. The aforementioned analysis highlights the influence of topography on the reliability of 3D inversion outcomes. When interpreting LOTEM data, it is imperative not to overlook the presence of topography.

4. Application to a Realistic Mineral Deposit Model

In this section, we utilized our inversion code to conduct tests on the realistic ore body model built from the drilling information at Voisey’s Bay, Labrador, Canada. Based on the drilling data, the mining area contains a complex ore body measuring 400 m × 300 m × 115 m, with an overburden thickness of approximately 20 m [47]. The resistivity of the ore body is 0.01 Ω∙m, while the background’s resistivity is 1000 Ω∙m. Figure 12 depicts the shape of the ore body and presents a 3D topographic model [27,38,48]. Given the contrast between the resistivity of the ore body and the background, we often opt for more efficient and intuitive methods to identify the ore body [48]. Consequently, we have reassigned the resistivity values for the ore body and background, setting them to 10 Ω∙m and 100 Ω∙m, respectively. In the survey configuration, the grounded-wire transmitter spans a length of 400 m and is positioned at coordinates (6,243,165 m, 554,750 m, −168 m). There are 150 receivers spaced at 50 m intervals, with 15 survey lines oriented in the north direction and 10 receivers on each line. The observation area encompasses a range of 555,350 m to 556,050 m for the easting coordinate and 6,242,865 m to 6,243,315 m for the northing coordinate. Regarding the forward model, the total number of tetrahedral elements is 1,103,924. The observed time spans from 0.01 ms to 100 ms, and we calculate the impulse response d H z / d t and the electric field E x for 31 time channels.
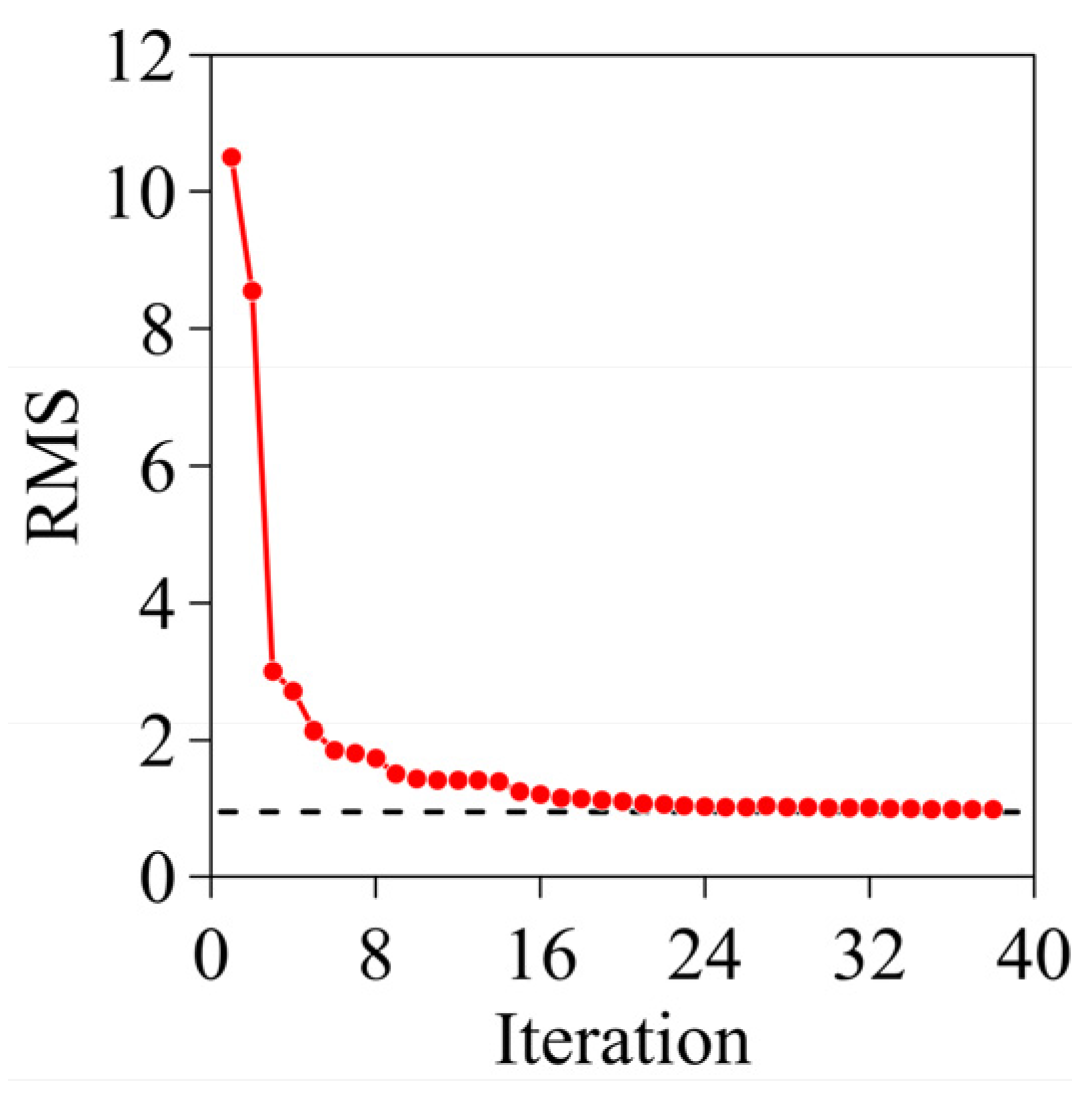
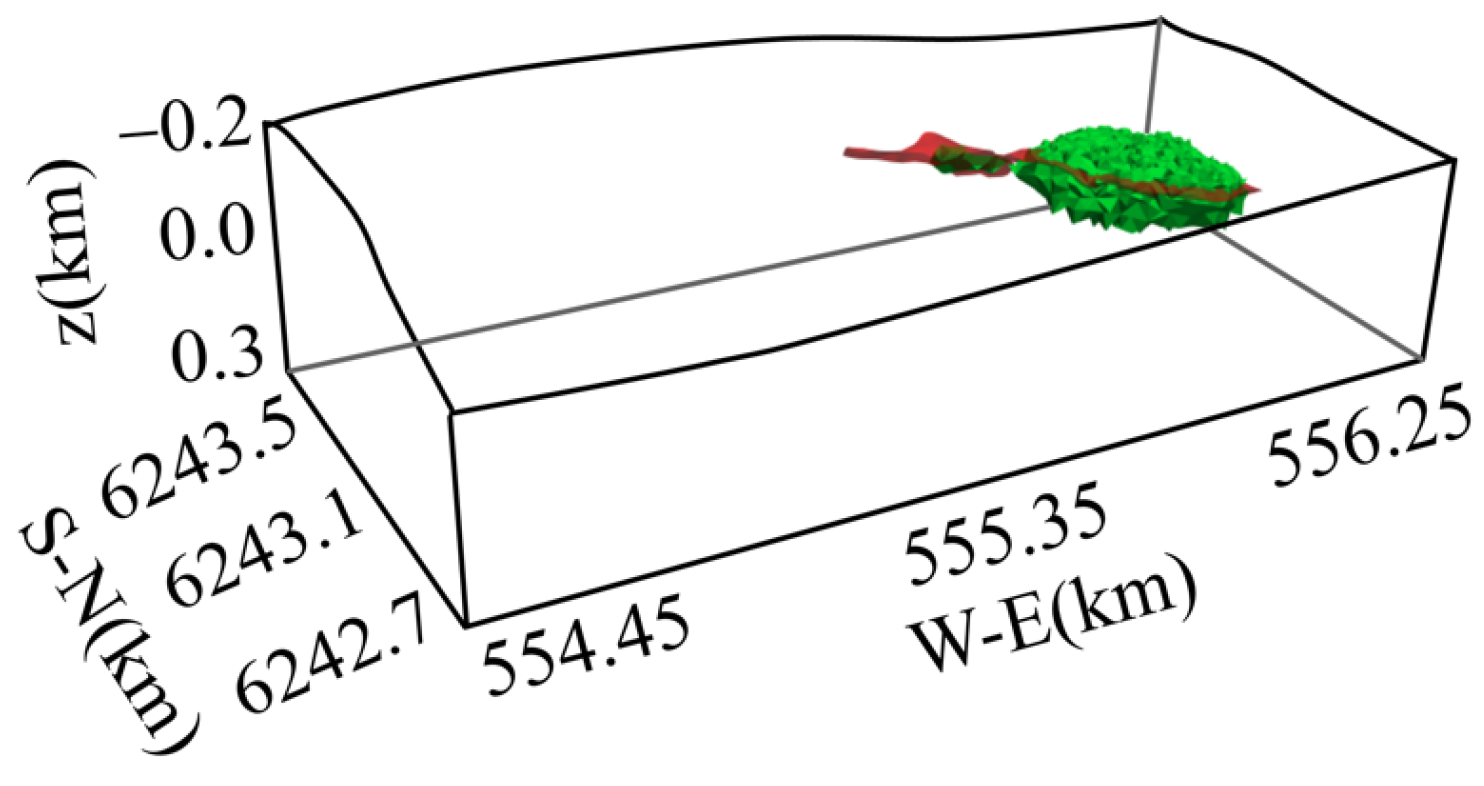
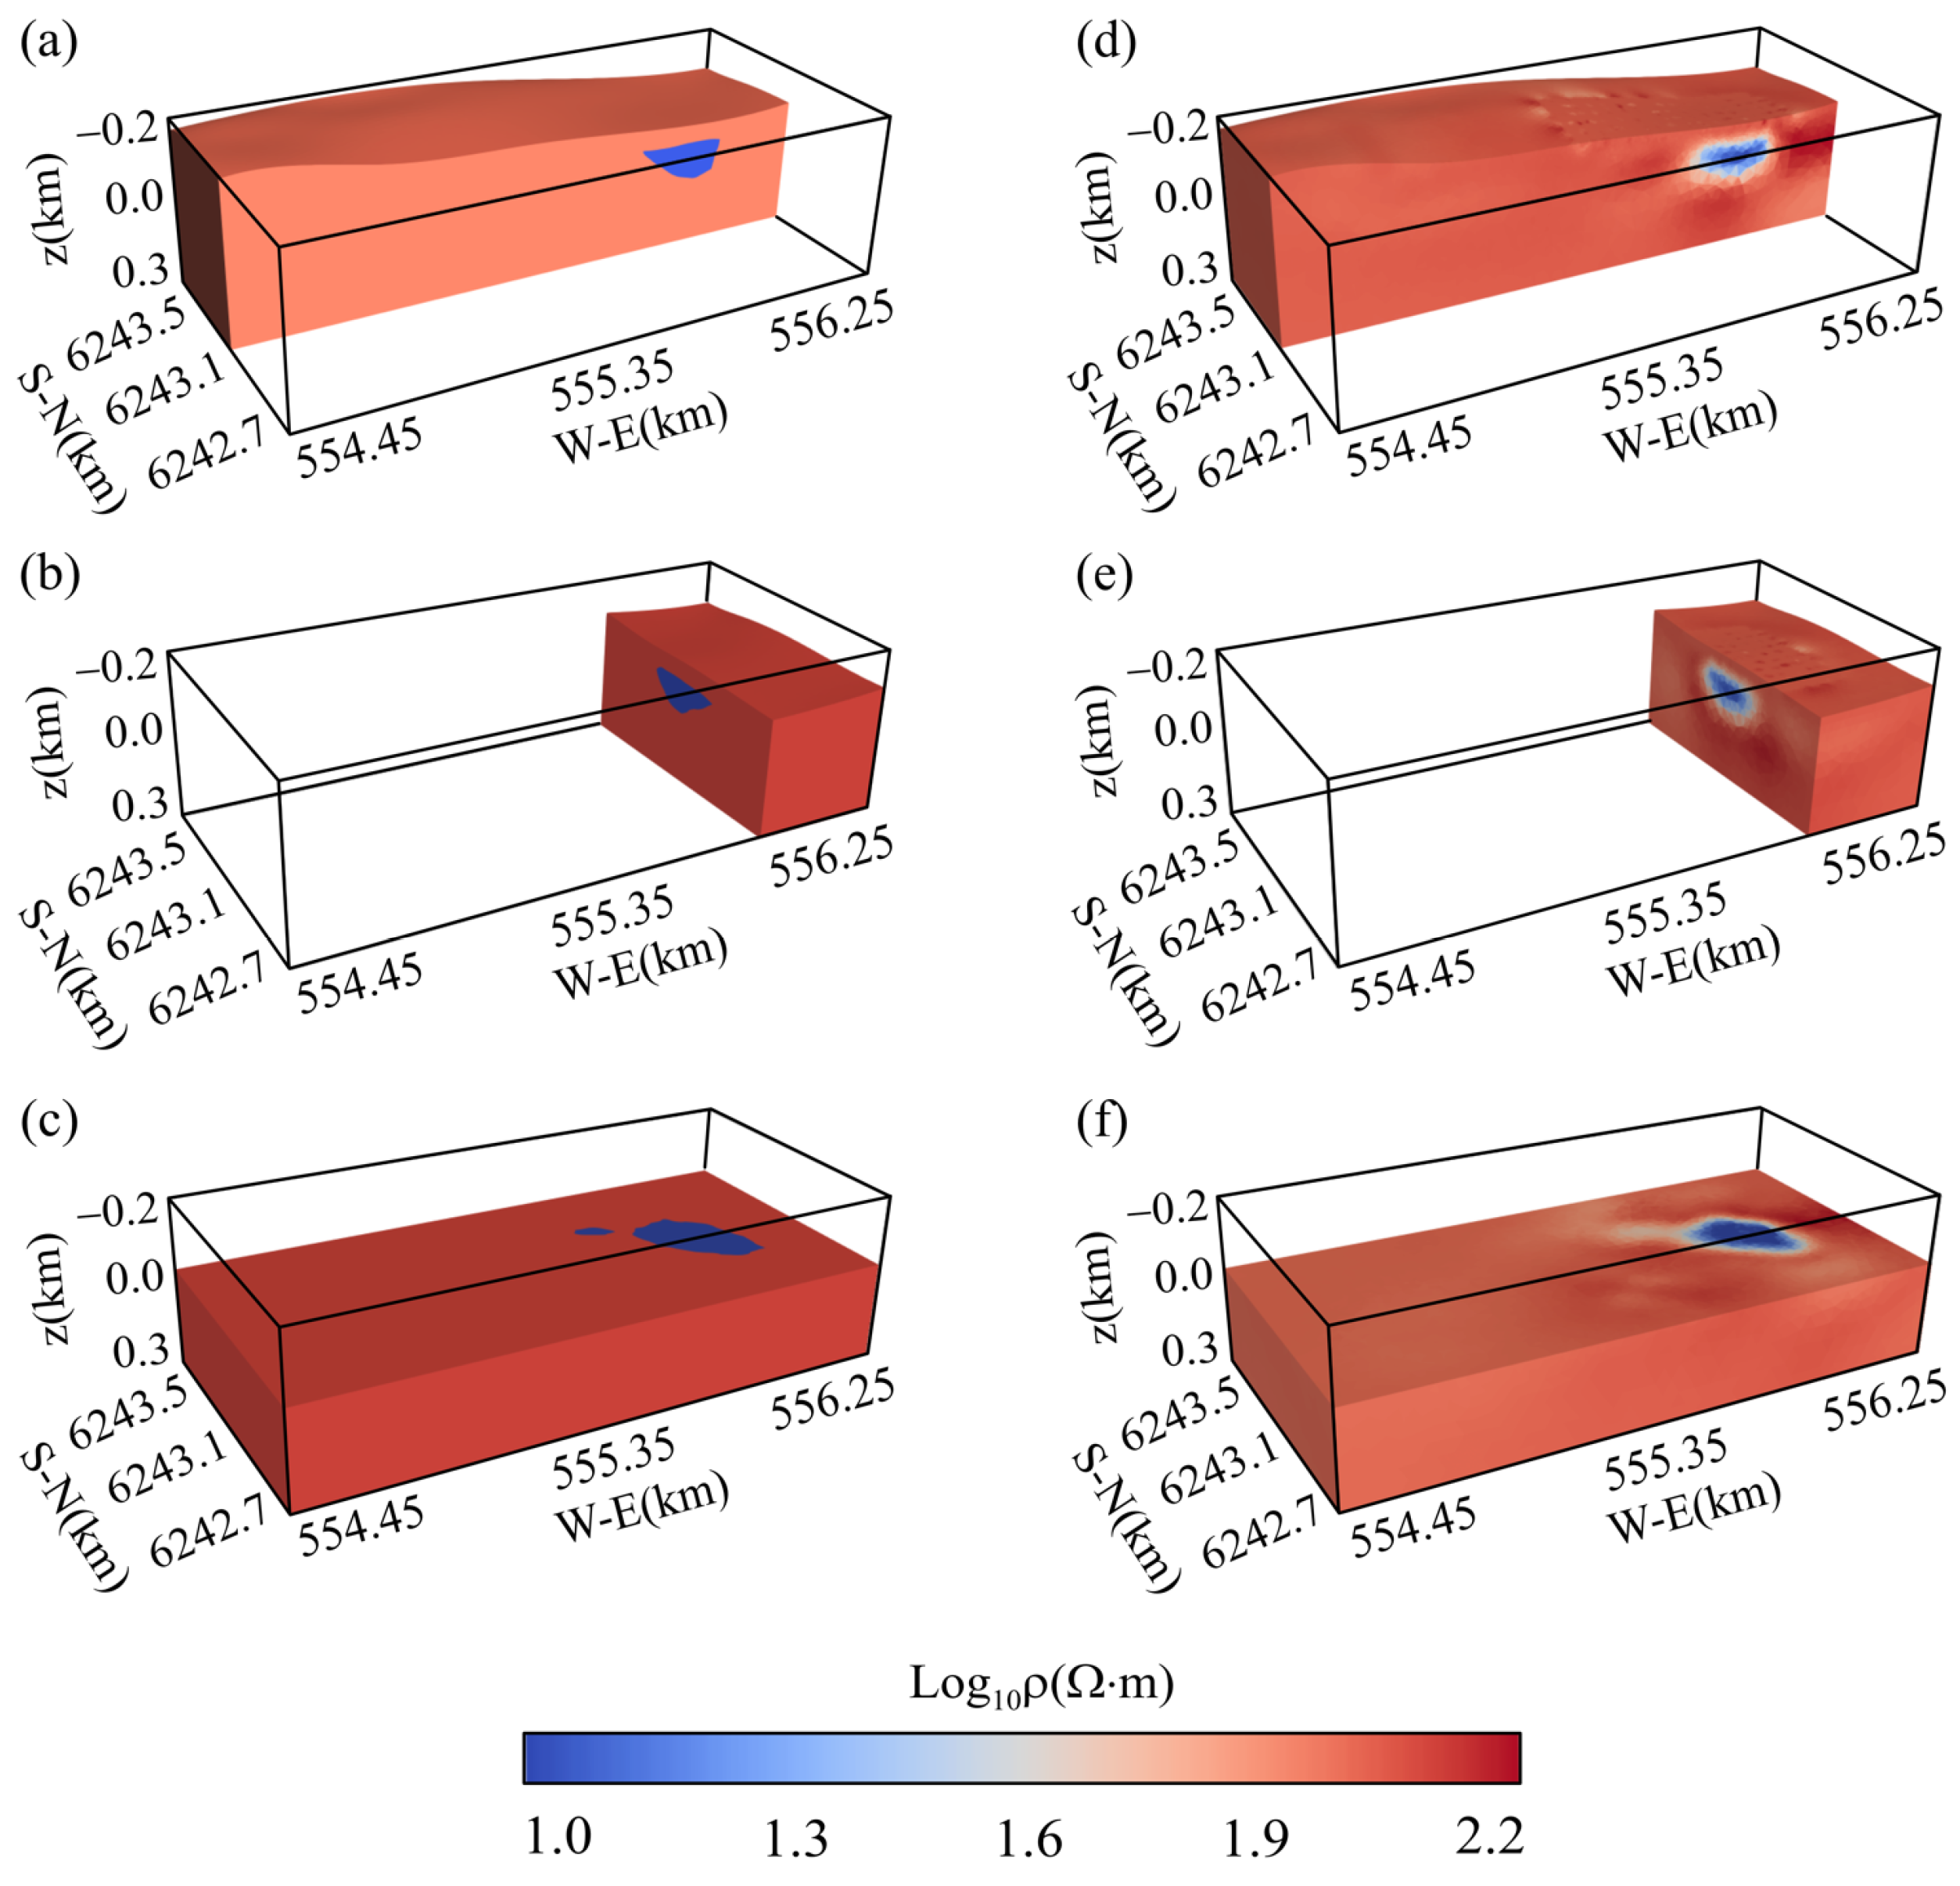
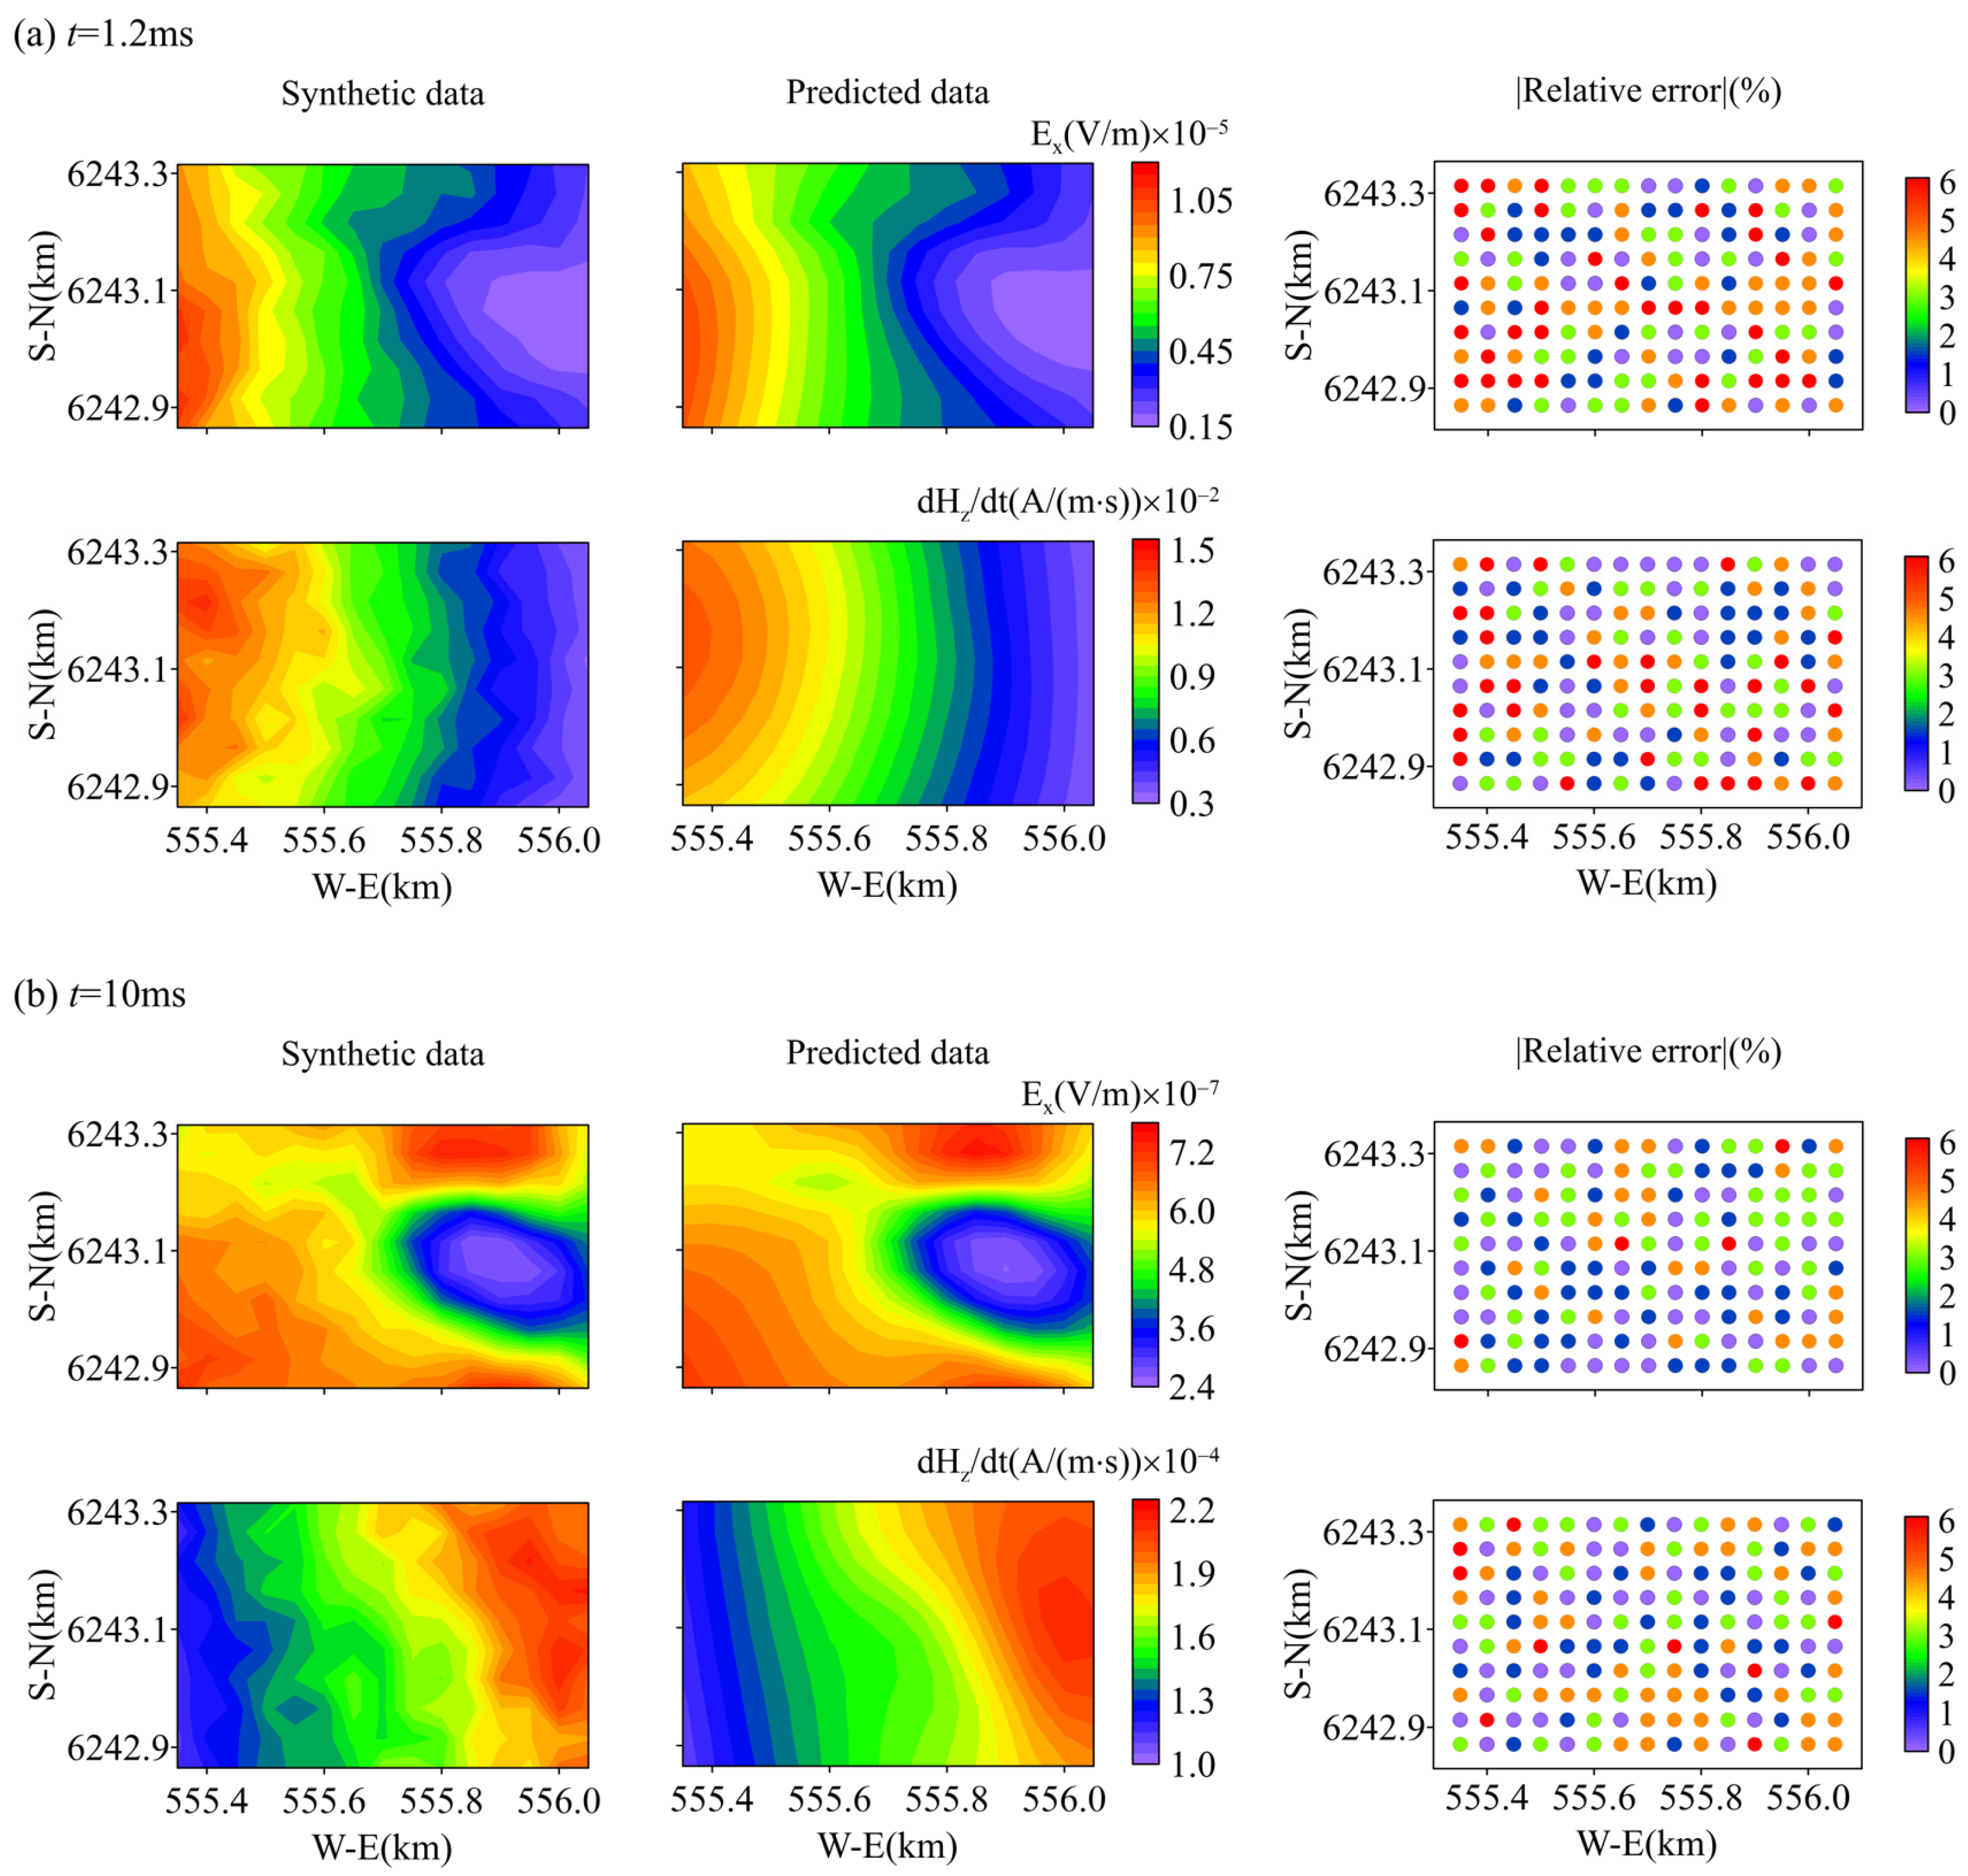
For this inversion, the initial resistivity is set to 100 Ω∙m, and the inversion model is discretized into 792,155 tetrahedral elements. The inversion process concludes after 39 iterations (Figure 13), with a total inversion time of 21.3 h and a memory requirement of 23.7 GB. Figure 14 illustrates the spatial distribution of the mineral deposit in the recovered model, while Figure 15 displays tomograms comparing the mineral deposit model and the recovered model. It is evident that the ore body has been effectively recovered, although the tail end of the deposit remains unrecovered. The incomplete recovery of the tail end can be attributed to its small electrical structure, as the sparse distribution of receivers limits the resolution capability for that particular region. Therefore, deploying receivers with an appropriate density is necessary to ensure effective coverage in geophysical exploration. Figure 16 presents the observed data, predicted data, and relative errors at 1.2 ms and 10 ms. The predicted and synthetic data exhibit a good match. The comprehensive study demonstrates that the inversion code utilized in this paper exhibits promising potential for further applications in the 3D inversion interpretation of LOTEM data.

5. Conclusions

Our findings indicate that topography plays a crucial role in the inversion results. The presence of topography introduces changes in the shape and spatial arrangement of the long grounded-wire source, as well as the configuration of the receivers. Consequently, assuming a flat Earth leads to numerous redundant structures in the inversion results, making subsequent geological interpretation challenging. However, incorporating topography significantly improves the inversion results. Therefore, our LOTEM inversion code can be used for interpreting LOTEM field data, enabling its application in geological exploration, environmental monitoring, and related domains. Subsequently, we successfully applied the 3D inversion code to recover the electrical structure of a large-scale ore deposit model in Voisey’s Bay, Labrador, Canada, although the sparse distribution of receivers limits the resolution capability for that particular region. Therefore, deploying receivers with an appropriate density is necessary to ensure effective coverage in geophysical exploration. In future LOTEM exploration research, we suggest that the topographic effects should be considered in the interpretation of LOTEM field data. We are confident that our inversion algorithm will produce a more reasonable explanation for the field data.

Author Contributions

Conceptualization, X.W., H.C. and X.H.; methodology, X.W. and H.C.; software, X.W.; validation, H.C. and L.L.; formal analysis, L.L. and X.W.; resources, X.H., A.R. and H.C.; writing—original draft preparation, X.W.; writing—review and editing, H.C. and A.R.; supervision, X.H. and H.C. All authors have read and agreed to the published version of the manuscript.

Funding

This research was funded by National Natural Science Foundation of China, grant number 41974089 and 42274085.

Data Availability Statement

The data used to support the findings of this study are available from the corresponding author upon request.

Acknowledgments

We thank Farquharson for providing the mineral deposit model.

Conflicts of Interest

The authors declare no conflict of interest.

References

  1. Strack, K.M. Exploration with Deep Transient Electromagnetics; Elsevier: Amsterdam, The Netherlands, 1992. [Google Scholar]
  2. Commer, M.; Helwig, S.L.; Hördt, A.; Scholl, C.; Tezkan, B. New results on the resistivity structure of Merapi Volcano (Indonesia), derived from three-dimensional restricted inversion of long-offset transient electromagnetic data. Geophys. J. Int. 2006, 167, 1172–1187. [Google Scholar] [CrossRef] [Green Version]
  3. Vozoff, K.; Moss, D.; LeBrocq, K.; McAllister, K. LOTEM electric field measurements for mapping resistive horizons in petroleum exploration. Explor. Geophys. 1985, 16, 309–312. [Google Scholar] [CrossRef]
  4. Xie, X.; Lei, Z.; Yan, L.; Hu, W. Remaining oil detection with time-lapse long offset & window transient electromagnetic sounding. Oil Geophys. Prospect. 2016, 51, 605–612. [Google Scholar]
  5. Yan, L.J.; Chen, X.X.; Tang, H.; Xie, X.B.; Zhou, L.; Hu, W.B.; Wang, Z.X. Continuous TDEM for monitoring shale hydraulic fracturing. Appl. Geophys. 2018, 15, 26–34. [Google Scholar] [CrossRef]
  6. Keller, G.V.; Pritchard, J.I.; Jacobson, J.J.; Harthill, N. Megasource time-domain electromagnetic sounding methods. Geophysics 1984, 49, 993–1009. [Google Scholar] [CrossRef]
  7. Stephan, A.; Schniggenfittig, H.; Strack, K.M. Long-offset transient em sounding north of the rhine-ruhr coal district, germany1. Geophys. Prospect. 1991, 39, 505–525. [Google Scholar] [CrossRef]
  8. Müller, M.; Hördt, A.; Neubauer, F. Internal structure of Mount Merapi, Indonesia, derived from long-offset transient electromagnetic data. J. Geophys. Res. Solid Earth 2002, 107, ECV 2-1–ECV 2-14. [Google Scholar] [CrossRef]
  9. Haroon, A.; Adrian, J.; Bergers, R.; Gurk, M.; Tezkan, B.; Mammadov, A.; Novruzov, A. Joint inversion of long-offset and central-loop transient electromagnetic data: Application to a mud volcano exploration in Perekishkul, Azerbaijan. Geophys. Prospect. 2015, 63, 478–494. [Google Scholar] [CrossRef]
  10. Zhou, N.N.; Xue, G.Q.; Li, H.; Lei, K.X.; Chen, W.Y. Comparison of transient electromagnetic fields excited by single-and double-line grounded-wire sources on land. Geophys. J. Int. 2022, 229, 1856–1869. [Google Scholar] [CrossRef]
  11. Zhou, N.N.; Xue, G.Q.; Li, H.; Chen, W.Y.; Lei, K.X. Electromagnetic characteristics of the magmatic Ni-Cu sulfide deposits in the orogenic belt: A case study from Kalatongke deposits in the Central Asian orogenic belt. Econ. Geol. 2022, 117, 1779–1789. [Google Scholar] [CrossRef]
  12. Strack, K.; Lüschen, E.; Kötz, A. Long-offset transient electromagnetic (LOTEM) depth soundings applied to crustal studies in the Black Forest and Swabian Alb, Federal Republic of Germany. Geophysics 1990, 55, 834–842. [Google Scholar] [CrossRef]
  13. Hördt, A.; Druskin, V.L.; Knizhnerman, L.A.; Strack, K.M. Interpretation of 3-D effects in long-offset transient electromagnetic (LOTEM) soundings in the Münsterland area/Germany. Geophysics 1992, 57, 1127–1137. [Google Scholar] [CrossRef]
  14. Hördt, A.; Jödicke, H.; Strack, K.M.; Vozoff, K.; Wolfgram, P. Inversion of long-offset TEM soundings near the borehole Münsterland 1, Germany, and comparison with MT measurements. Geophys. J. Int. 1992, 108, 930–940. [Google Scholar] [CrossRef] [Green Version]
  15. Di, Q.Y.; Fang, G.Y.; Zhang, Y.M. Research of the surface electromagnetic prospecting (SEP) system. Chin. J. Geophys. 2013, 56, 3629–3639. [Google Scholar]
  16. Lü, Q.; Zhang, X.; Tang, J.; Jin, S.; Liang, L.; Niu, J.; Wang, X.; Lin, P.; Yao, C.; Gao, W. Review on advancement in technology and equipment of geophysical exploration for metallic deposits in China. Chin. J. Geophys. 2019, 62, 3629–3664. [Google Scholar]
  17. Stolz, R.; Schiffler, M.; Becken, M.; Thiede, A.; Schneider, M.; Chubak, G.; Marsden, P.; Bergshjorth, A.B.; Schaefer, M.; Terblanche, O. SQUIDs for magnetic and electromagnetic methods in mineral exploration. Miner. Econ. 2022, 35, 467–494. [Google Scholar] [CrossRef]
  18. Hördt, A.; Müller, M. Understanding LOTEM data from mountainous terrain. Geophysics 2000, 65, 1113–1123. [Google Scholar] [CrossRef]
  19. Wang, T.; Hohmann, G.W. A finite-difference, time-domain solution for three-dimensional electromagnetic modeling. Geophysics 1993, 58, 797–809. [Google Scholar] [CrossRef] [Green Version]
  20. Haber, E.; Oldenburg, D.W.; Shekhtman, R. Inversion of time domain three-dimensional electromagnetic data. Geophys. J. Int. 2007, 171, 550–564. [Google Scholar] [CrossRef] [Green Version]
  21. Oldenburg, D.W.; Haber, E.; Shekhtman, R. Three dimensional inversion of multisource time domain electromagnetic data. Geophysics 2013, 78, E47–E57. [Google Scholar] [CrossRef] [Green Version]
  22. Yang, D.; Oldenburg, D.W.; Haber, E. 3-D inversion of airborne electromagnetic data parallelized and accelerated by local mesh and adaptive soundings. Geophys. J. Int. 2014, 196, 1492–1507. [Google Scholar] [CrossRef] [Green Version]
  23. Cai, H.; Liu, M.; Zhou, J.; Li, J.; Hu, X. Effective 3D-transient electromagnetic inversion using finite-element method with a parallel direct solver. Geophysics 2022, 87, E377–E392. [Google Scholar] [CrossRef]
  24. Commer, M.; Newman, G. A parallel finite-difference approach for 3D transient electromagnetic modeling with galvanic sources. Geophysics 2004, 69, 1192–1202. [Google Scholar] [CrossRef] [Green Version]
  25. Tang, X.G.; Hu, W.B.; Yan, L.J. Topographic effects on long offset transient electromagnetic response. Appl. Geophys. 2011, 8, 277–284. [Google Scholar] [CrossRef]
  26. Liu, Y.; Yogeshwar, P.; Hu, X.; Peng, R.; Tezkan, B.; Mörbe, W.; Li, J. Effects of electrical anisotropy on long-offset transient electromagnetic data. Geophys. J. Int. 2020, 222, 1074–1089. [Google Scholar] [CrossRef]
  27. Li, J.; Hu, X.; Cai, H.; Liu, Y. A finite-element time-domain forward-modelling algorithm for transient electromagnetics excited by grounded-wire sources. Geophys. Prospect. 2020, 68, 1379–1398. [Google Scholar] [CrossRef]
  28. Khan, M.Y.; Xue, G.Q.; Chen, W.Y.; Zhong, H.S. Analysis of long-offset transient electromagnetic (LOTEM) data in time, frequency, and pseudo-seismic domain. J. Environ. Eng. Geophys. 2018, 23, 15–32. [Google Scholar] [CrossRef]
  29. Carter, S.; Xie, X.; Zhou, L.; Yan, L. Hybrid Monte Carlo 1-D joint inversion of LOTEM and MT. J. Appl. Geophys. 2021, 194, 104424. [Google Scholar] [CrossRef]
  30. Scholl, C. The Influence of Multidimensional Structures on the Interpretation of Lotem Data with One-Dimensional Models and the Application to Data from Israel. Ph.D. Thesis, Universität Zu Köln, Cologne, Germany, 2005. [Google Scholar]
  31. Sudha, K.; Tezkan, B.; Israil, M.; Rai, J. Combined electrical and electromagnetic imaging of hot fluids within fractured rock in rugged Himalayan terrain. J. Appl. Geophys. 2011, 74, 205–214. [Google Scholar] [CrossRef]
  32. Cai, J.; Yogeshwar, P.; Mörbe, W.; Smirnova, M.; Haroon, A.; Becken, M.; Tezkan, B. 2-D joint inversion of semi-airborne CSEM and LOTEM data in eastern Thuringia, Germany. Geophys. J. Int. 2022, 229, 1475–1489. [Google Scholar] [CrossRef]
  33. Mitsuhata, Y.; Uchida, T.; Amano, H. 2.5-D inversion of frequency-domain electromagnetic data generated by a grounded-wire source. Geophysics 2002, 67, 1753–1768. [Google Scholar] [CrossRef]
  34. Sasaki, Y.; Yi, M.J.; Choi, J.; Son, J.S. Frequency and time domain three-dimensional inversion of electromagnetic data for a grounded-wire source. J. Appl. Geophys. 2015, 112, 106–114. [Google Scholar] [CrossRef]
  35. Revil, A.; Woodruff, W.; Torres-Verdín, C.; Prasad, M. Complex conductivity tensor of anisotropic hydrocarbon-bearing shales and mudrocks. Geophysics 2013, 78, D403–D418. [Google Scholar] [CrossRef] [Green Version]
  36. Woodruff, W.F.; Revil, A.; Torres-Verdín, C. Laboratory determination of the complex conductivity tensor of unconventional anisotropic shales. Geophysics 2014, 79, E183–E200. [Google Scholar] [CrossRef]
  37. Cai, H.; Hu, X.; Xiong, B.; Zhdanov, M.S. Finite-element time-domain modeling of electromagnetic data in general dispersive medium using adaptive Padé series. Comput. Geosci. 2017, 109, 194–205. [Google Scholar] [CrossRef]
  38. Jahandari, H.; Farquharson, C.G. A finite-volume solution to the geophysical electromagnetic forward problem using unstructured grids. Geophysics 2014, 79, E287–E302. [Google Scholar] [CrossRef]
  39. Um, E.S.; Harris, J.M.; Alumbaugh, D.L. 3D time-domain simulation of electromagnetic diffusion phenomena: A finite-element electric-field approach. Geophysics 2010, 75, F115–F126. [Google Scholar] [CrossRef]
  40. Jin, J.M. The Finite Element Method in Electromagnetics; John Wiley & Sons: Hoboken, NJ, USA, 2014. [Google Scholar]
  41. Liu, Y.; Yin, C.; Qiu, C.; Hui, Z.; Zhang, B.; Ren, X.; Weng, A. 3-D inversion of transient EM data with topography using unstructured tetrahedral grids. Geophys. J. Int. 2019, 217, 301–318. [Google Scholar] [CrossRef]
  42. Bollhöfer, M.; Eftekhari, A.; Scheidegger, S.; Schenk, O. Large-scale sparse inverse covariance matrix estimation. SIAM J. Sci. Comput. 2019, 41, A380–A401. [Google Scholar] [CrossRef]
  43. Tikhonov, A.N.; Arsenin, V.Y. Soulutions of Ill-Posed Problems. SIAM Rev. 1977, 21, 266. [Google Scholar]
  44. Cao, X.Y.; Yin, C.C.; Zhang, B.; Huang, X.; Liu, Y.H.; Cai, J. 3D magnetotelluric inversions with unstructured finite-element and limited-memory quasi-Newton methods. Appl. Geophys. 2018, 15, 556–565. [Google Scholar] [CrossRef]
  45. Key, K. MARE2DEM: A 2-D inversion code for controlled-source electromagnetic and magnetotelluric data. Geophys. J. Int. 2016, 207, 571–588. [Google Scholar] [CrossRef] [Green Version]
  46. Commer, M.; Newman, G.A. New advances in three-dimensional controlled-source electromagnetic inversion. Geophys. J. Int. 2008, 172, 513–535. [Google Scholar] [CrossRef]
  47. Balch, S.; Crebs, T.; King, A.; Verbiski, M. Geophysics of the Voisey’s Bay Ni-Cu-Co deposits. In SEG Technical Program Expanded Abstracts 1998; Society of Exploration Geophysicists: Houston, TX, USA, 1998; pp. 784–787. [Google Scholar]
  48. Li, J.; Lu, X.; Farquharson, C.G.; Hu, X. A finite-element time-domain forward solver for electromagnetic methods with complex-shaped loop sources. Geophysics 2018, 83, E117–E132. [Google Scholar] [CrossRef]
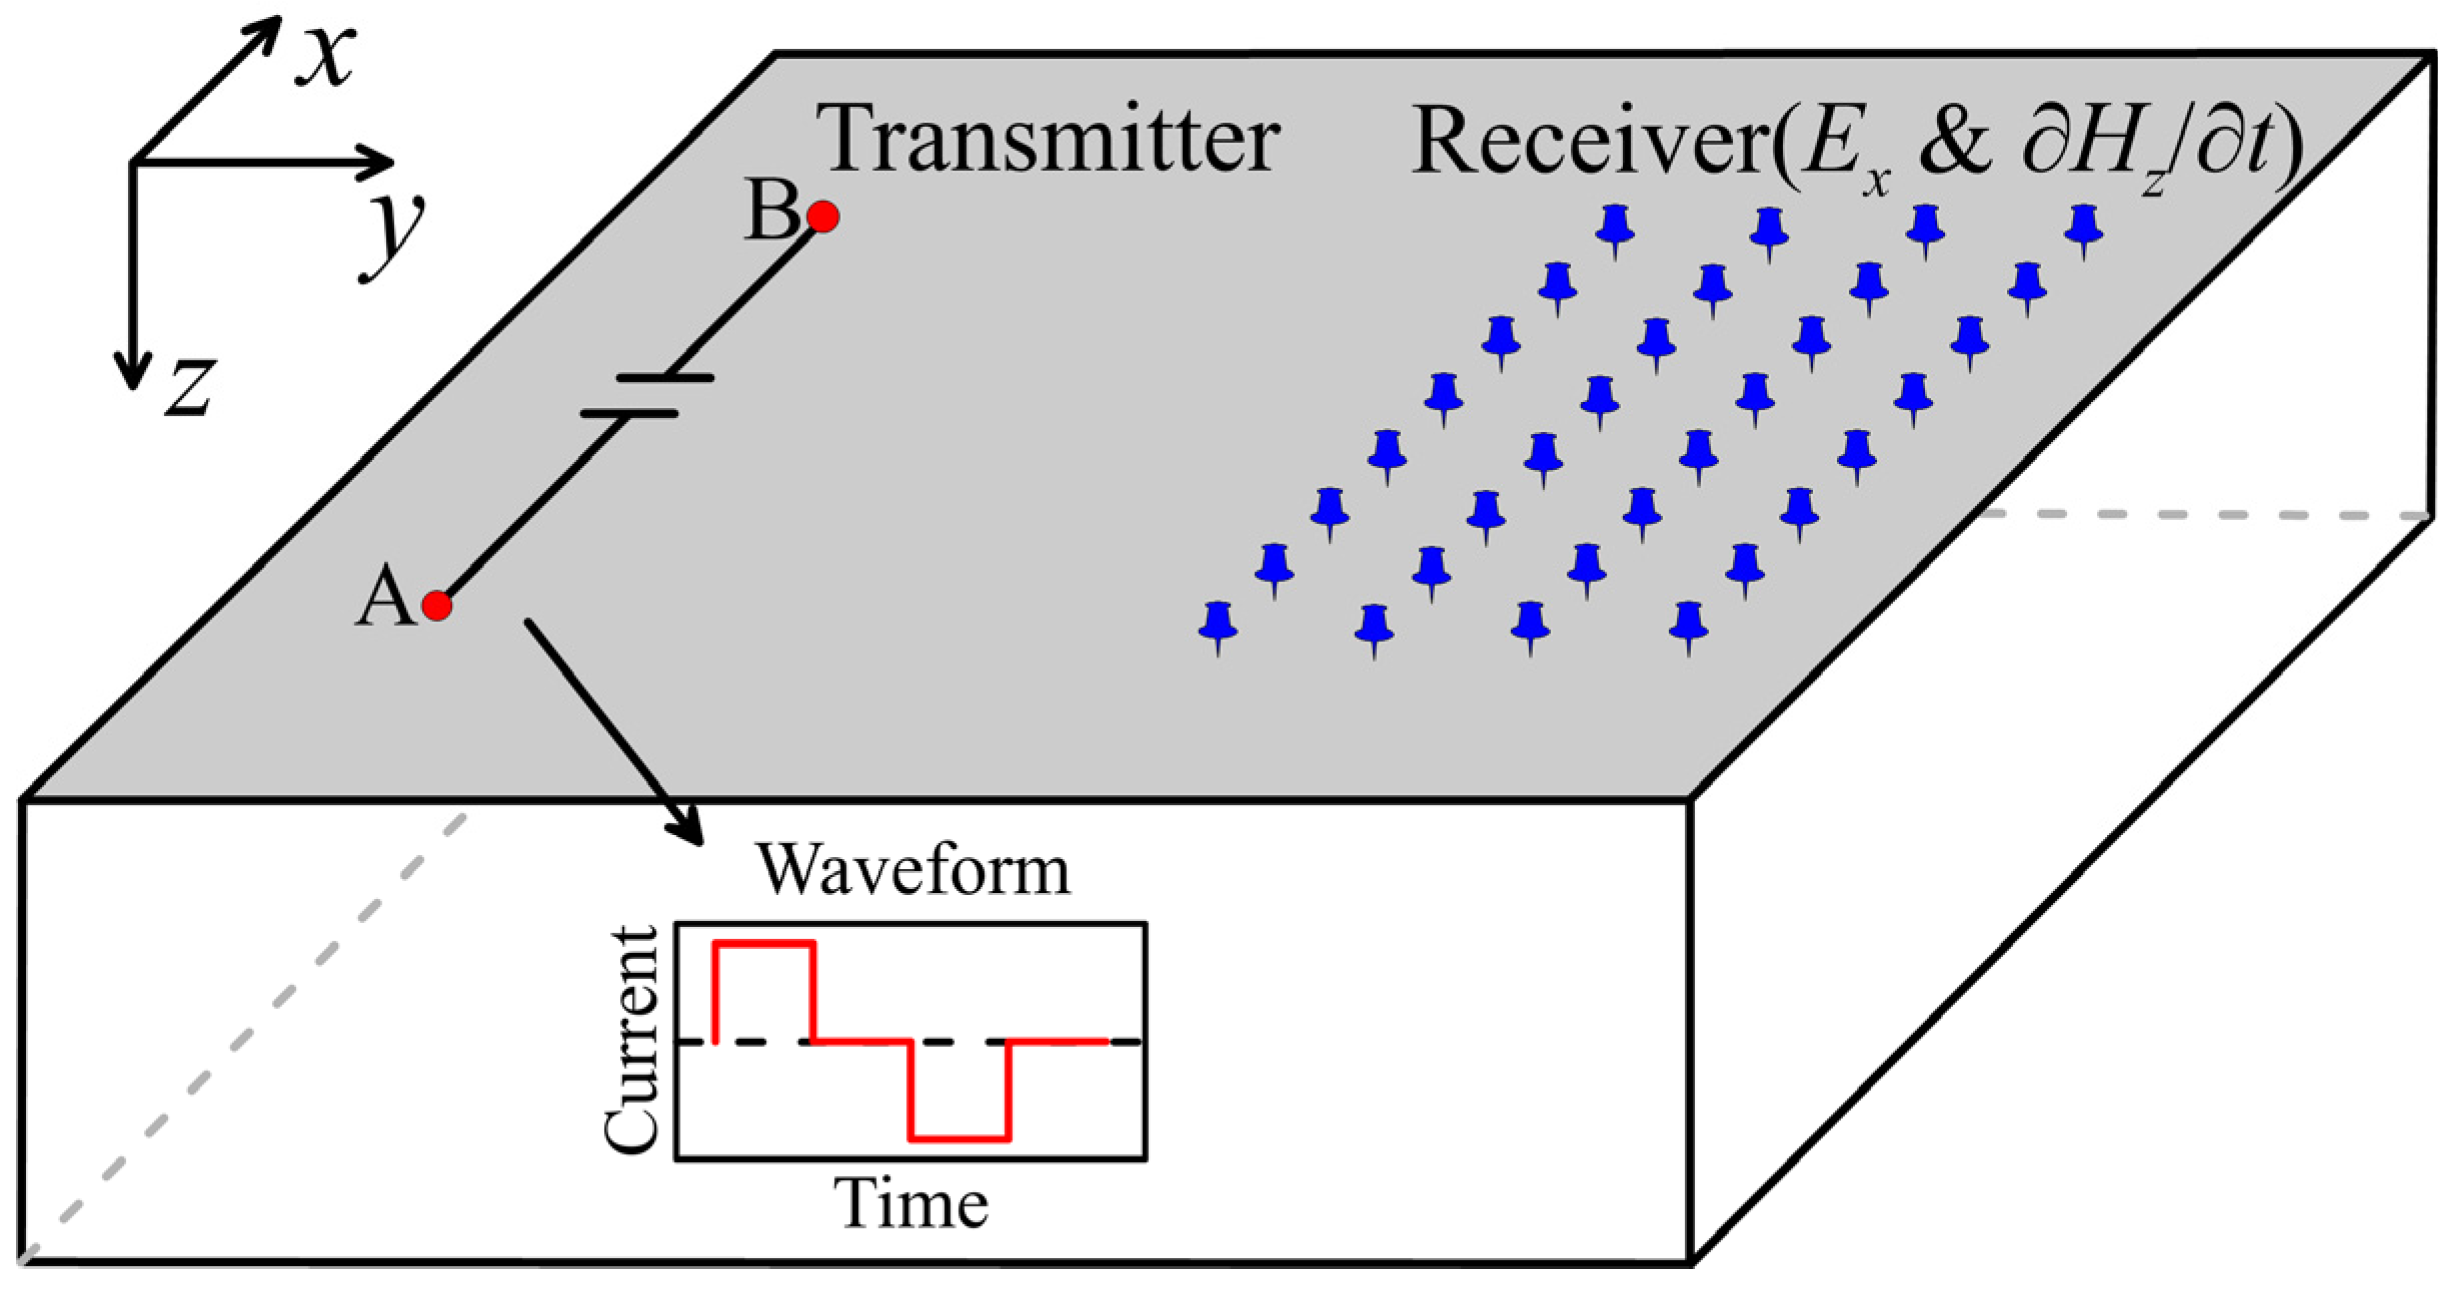
Figure 1. A typical LOTEM exploration system. The transmitter is a long grounded-wire (indicated by AB). A transmitter-current waveform with a 50% duty cycle is used for LOTEM signal excitation. The receivers (indicated by the blue symbols) usually record the impulse response d H z / d t and the electric field E x .
Minerals 13 00908 g001
Figure 2. Calculation of the Roughness Matrix involves the core element, represented by the green tetrahedron. The blue elements symbolize the neighboring elements of the current inversion element. The red dots indicate the centroids of the tetrahedron elements, while the black dashed lines illustrate the distances from the neighboring elements to the current inversion element [45].
Minerals 13 00908 g002
Figure 3. Synthetic model. (a) A conductive anomaly is buried in a homogeneous half space; (b) Model discretization. The red line represents a grounded-wire transmitter, the blue points represent the receivers.
Minerals 13 00908 g003
Figure 4. Accuracy verification for the homogeneous half space. (a) is E x ; (b) is d H z / d t ; (c) is relative error.
Minerals 13 00908 g004
Figure 5. Convergence plot for synthetic model inversion. The black dashed line indicates the threshold of RMS (RMS = 1).
Minerals 13 00908 g005
Figure 6. Tomograms of the synthetic model and the recovered model. (ac) Tomograms of the synthetic model; (df) tomograms of the recovered model.
Minerals 13 00908 g006
Figure 7. Data fitting between synthetic data and predicted data. (a) 10 ms; (b) 100 ms. The columns from left to right represent the synthetic observed data, the predicated data and the relative errors, respectively.
Minerals 13 00908 g007
Figure 8. Synthetic model. (a) The locations of the source, receivers and three anomalies; (b) tetrahedral discretization of the model. The red line represents a long grounded-wire transmitter, and the blue points represent the receivers.
Minerals 13 00908 g008
Figure 9. Convergence plot for topographic model inversion. The black dashed line indicates the threshold of RMS (RMS = 1).
Minerals 13 00908 g009
Figure 10. Tomograms of the synthetic model and the recovered model. (ac) Tomograms of the synthetic model; (df) tomograms of the recovered topographic model; (gi) tomograms of the recovered flat earth model.
Minerals 13 00908 g010
Figure 11. Data fitting between synthetic data and predicted data at 10 ms. (a) Topography; (b) Flat earth. The columns from left to right represent the synthetic observed data, the predicated data and the relative errors, respectively.
Minerals 13 00908 g011aMinerals 13 00908 g011b
Figure 12. Mineral deposit model. (a) The locations of the source, receivers and ore body; (b) discretization of the mineral deposit model. The red line represents a long grounded-wire transmitter, and the blue points represent the receivers.
Minerals 13 00908 g012
Figure 13. Convergence plot for the LOTEM inversion of a practical ore deposit model. The black dashed line indicates the threshold of RMS (RMS = 1).
Minerals 13 00908 g013
Figure 14. The distribution of the mineral deposit. The red zone represents the true ore body model, and the green zone represents the recovered model with resistivity ranging from 10 Ω∙m to 30 Ω∙m.
Minerals 13 00908 g014
Figure 15. Tomograms of the realistic mineral deposit model and the recovered model from 3D inversion of LOTEM data. (ac) Tomograms of the mineral deposit model; (df) tomograms of the recovered model.
Minerals 13 00908 g015
Figure 16. Data fitting between observed data and predicted data. (a) 1.2 ms; (b) 10 ms. The columns from left to right represent the synthetic observed data, the predicated data and the relative errors, respectively.
Minerals 13 00908 g016
Disclaimer/Publisher’s Note: The statements, opinions and data contained in all publications are solely those of the individual author(s) and contributor(s) and not of MDPI and/or the editor(s). MDPI and/or the editor(s) disclaim responsibility for any injury to people or property resulting from any ideas, methods, instructions or products referred to in the content.