

Coupling Mechanism of the Concealed Rock Body and Metallogenic Structure of the Sarakan Gold Deposit in Laos Investigated Using Magnetic and Electrical Methods

Abstract
:1. Introduction
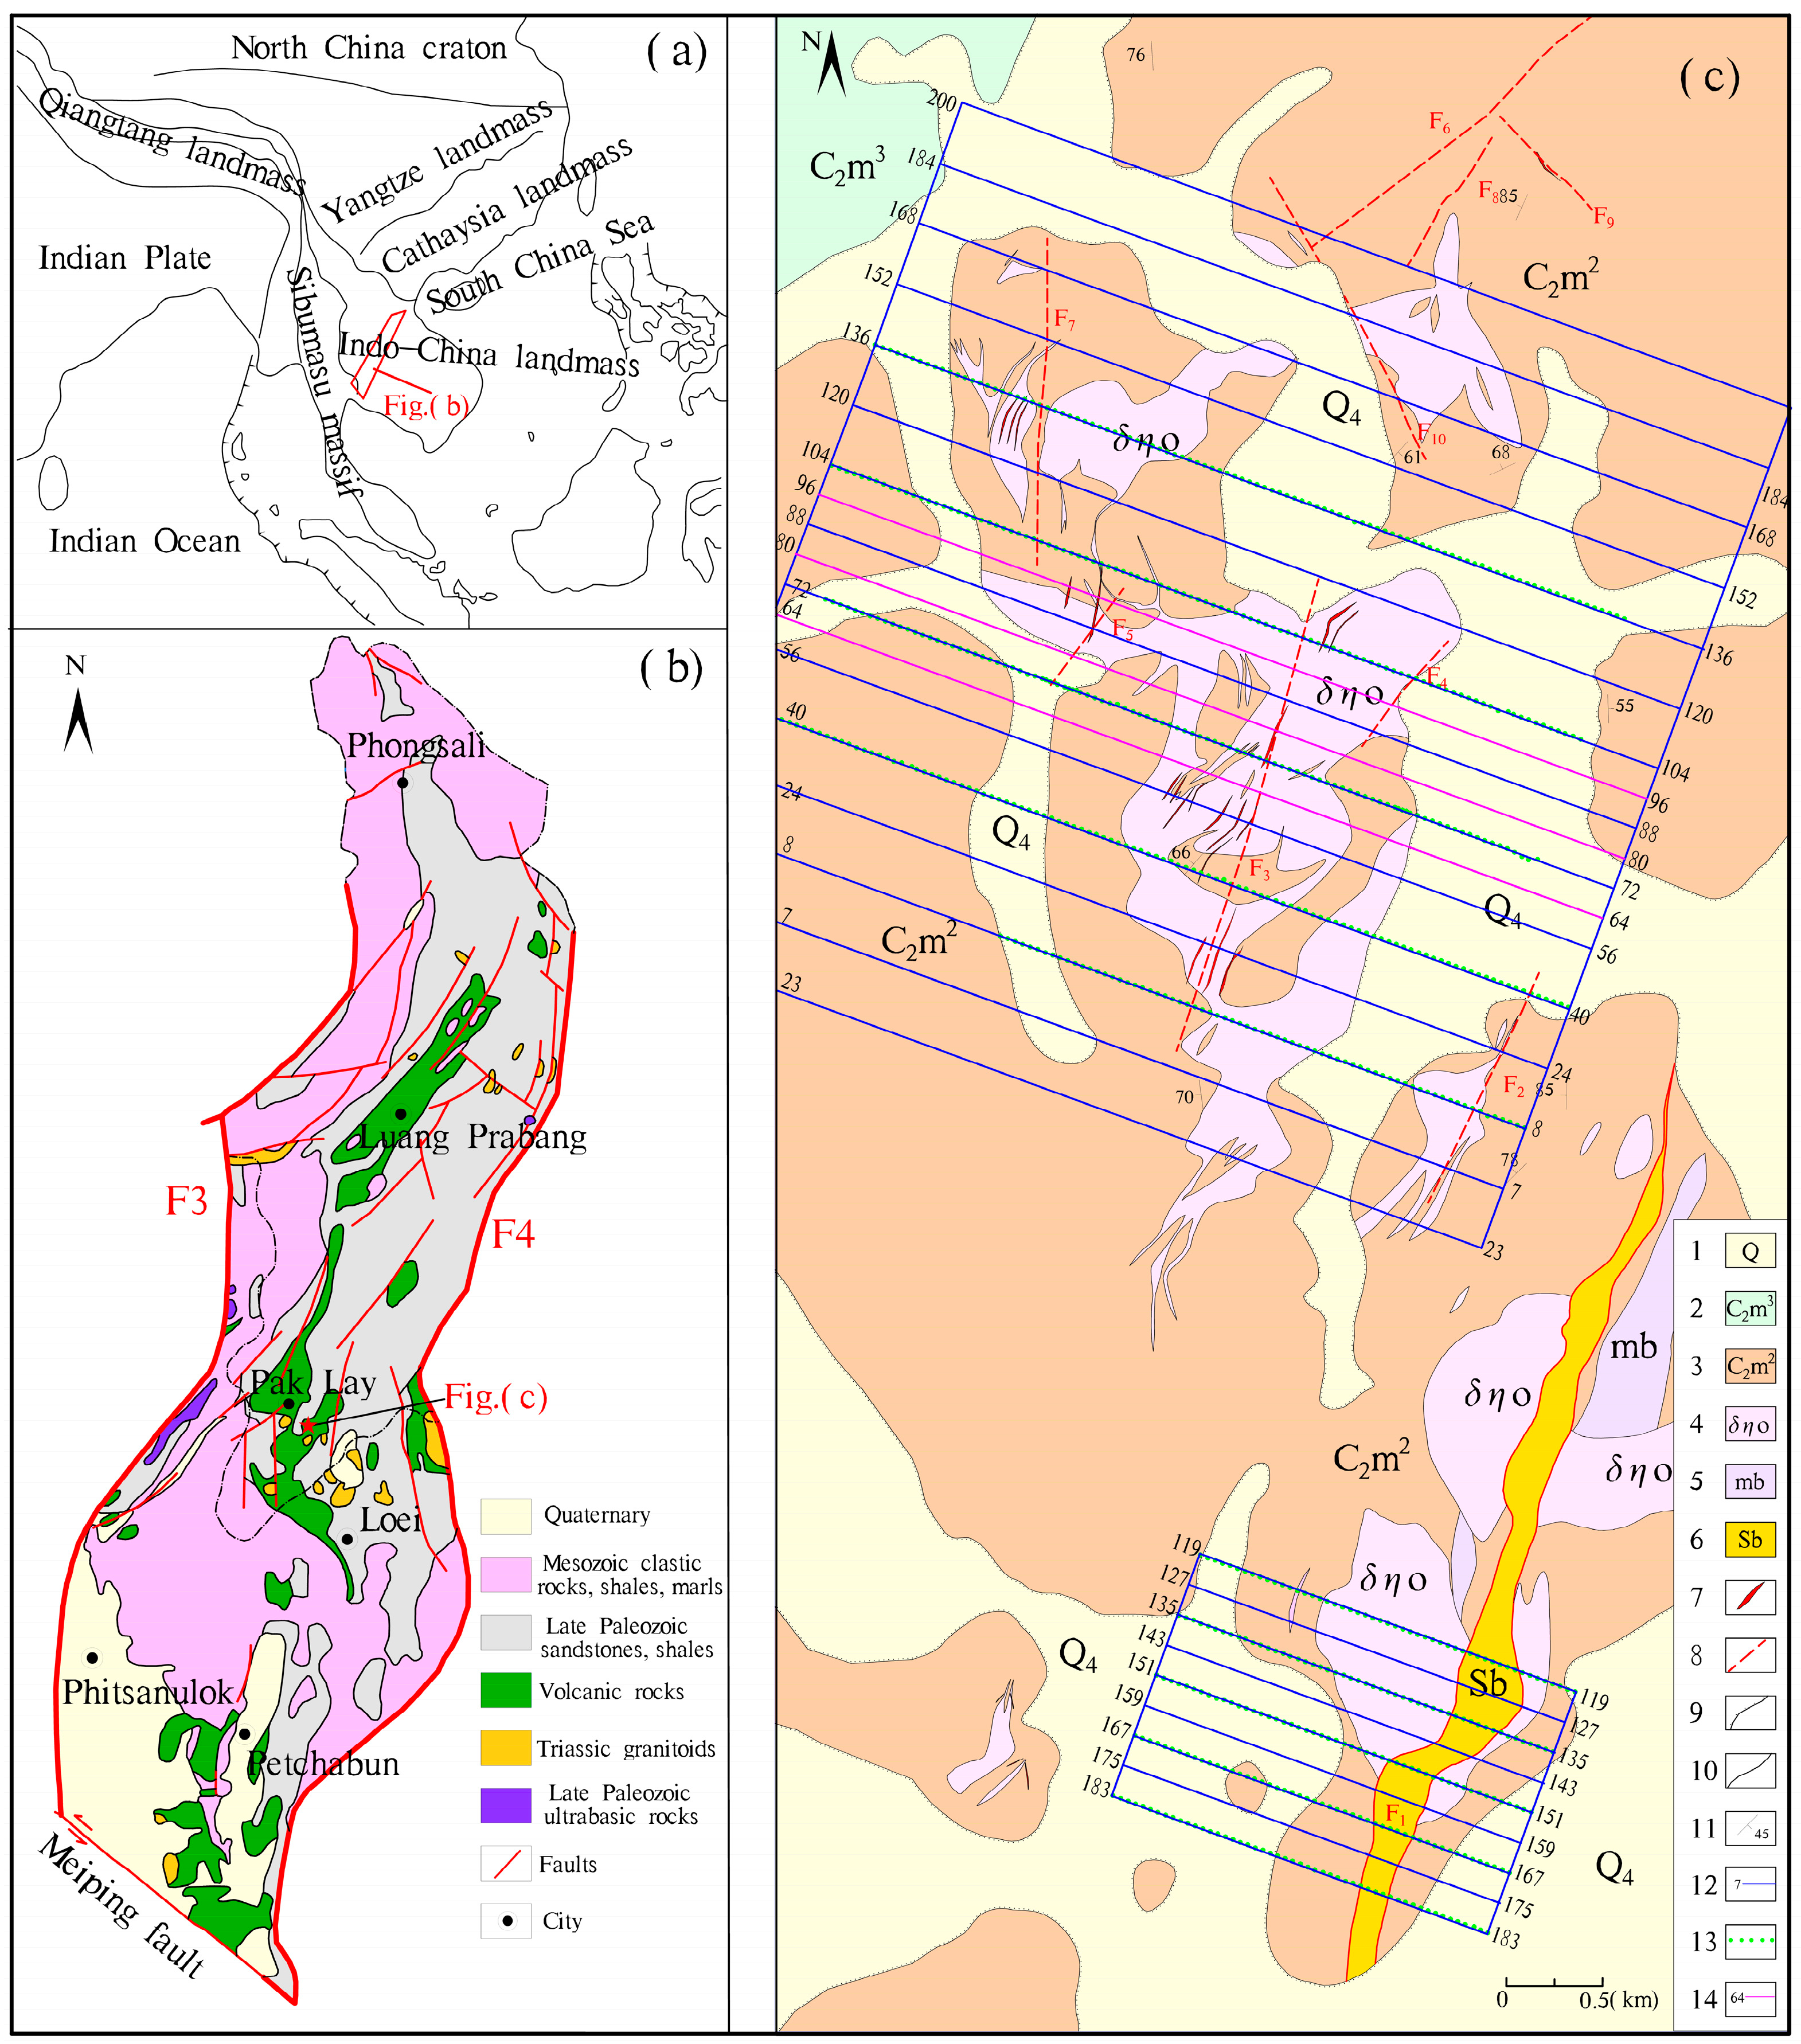
2. Regional Geology
3. Geological and Geophysical Characteristics of the Deposit
3.1. Geological Characteristics of the Deposit
3.2. Geophysical Characteristics
4. Geophysical Survey
4.1. High-Precision Magnetic Measurement
4.2. IP Measurement
- (1)
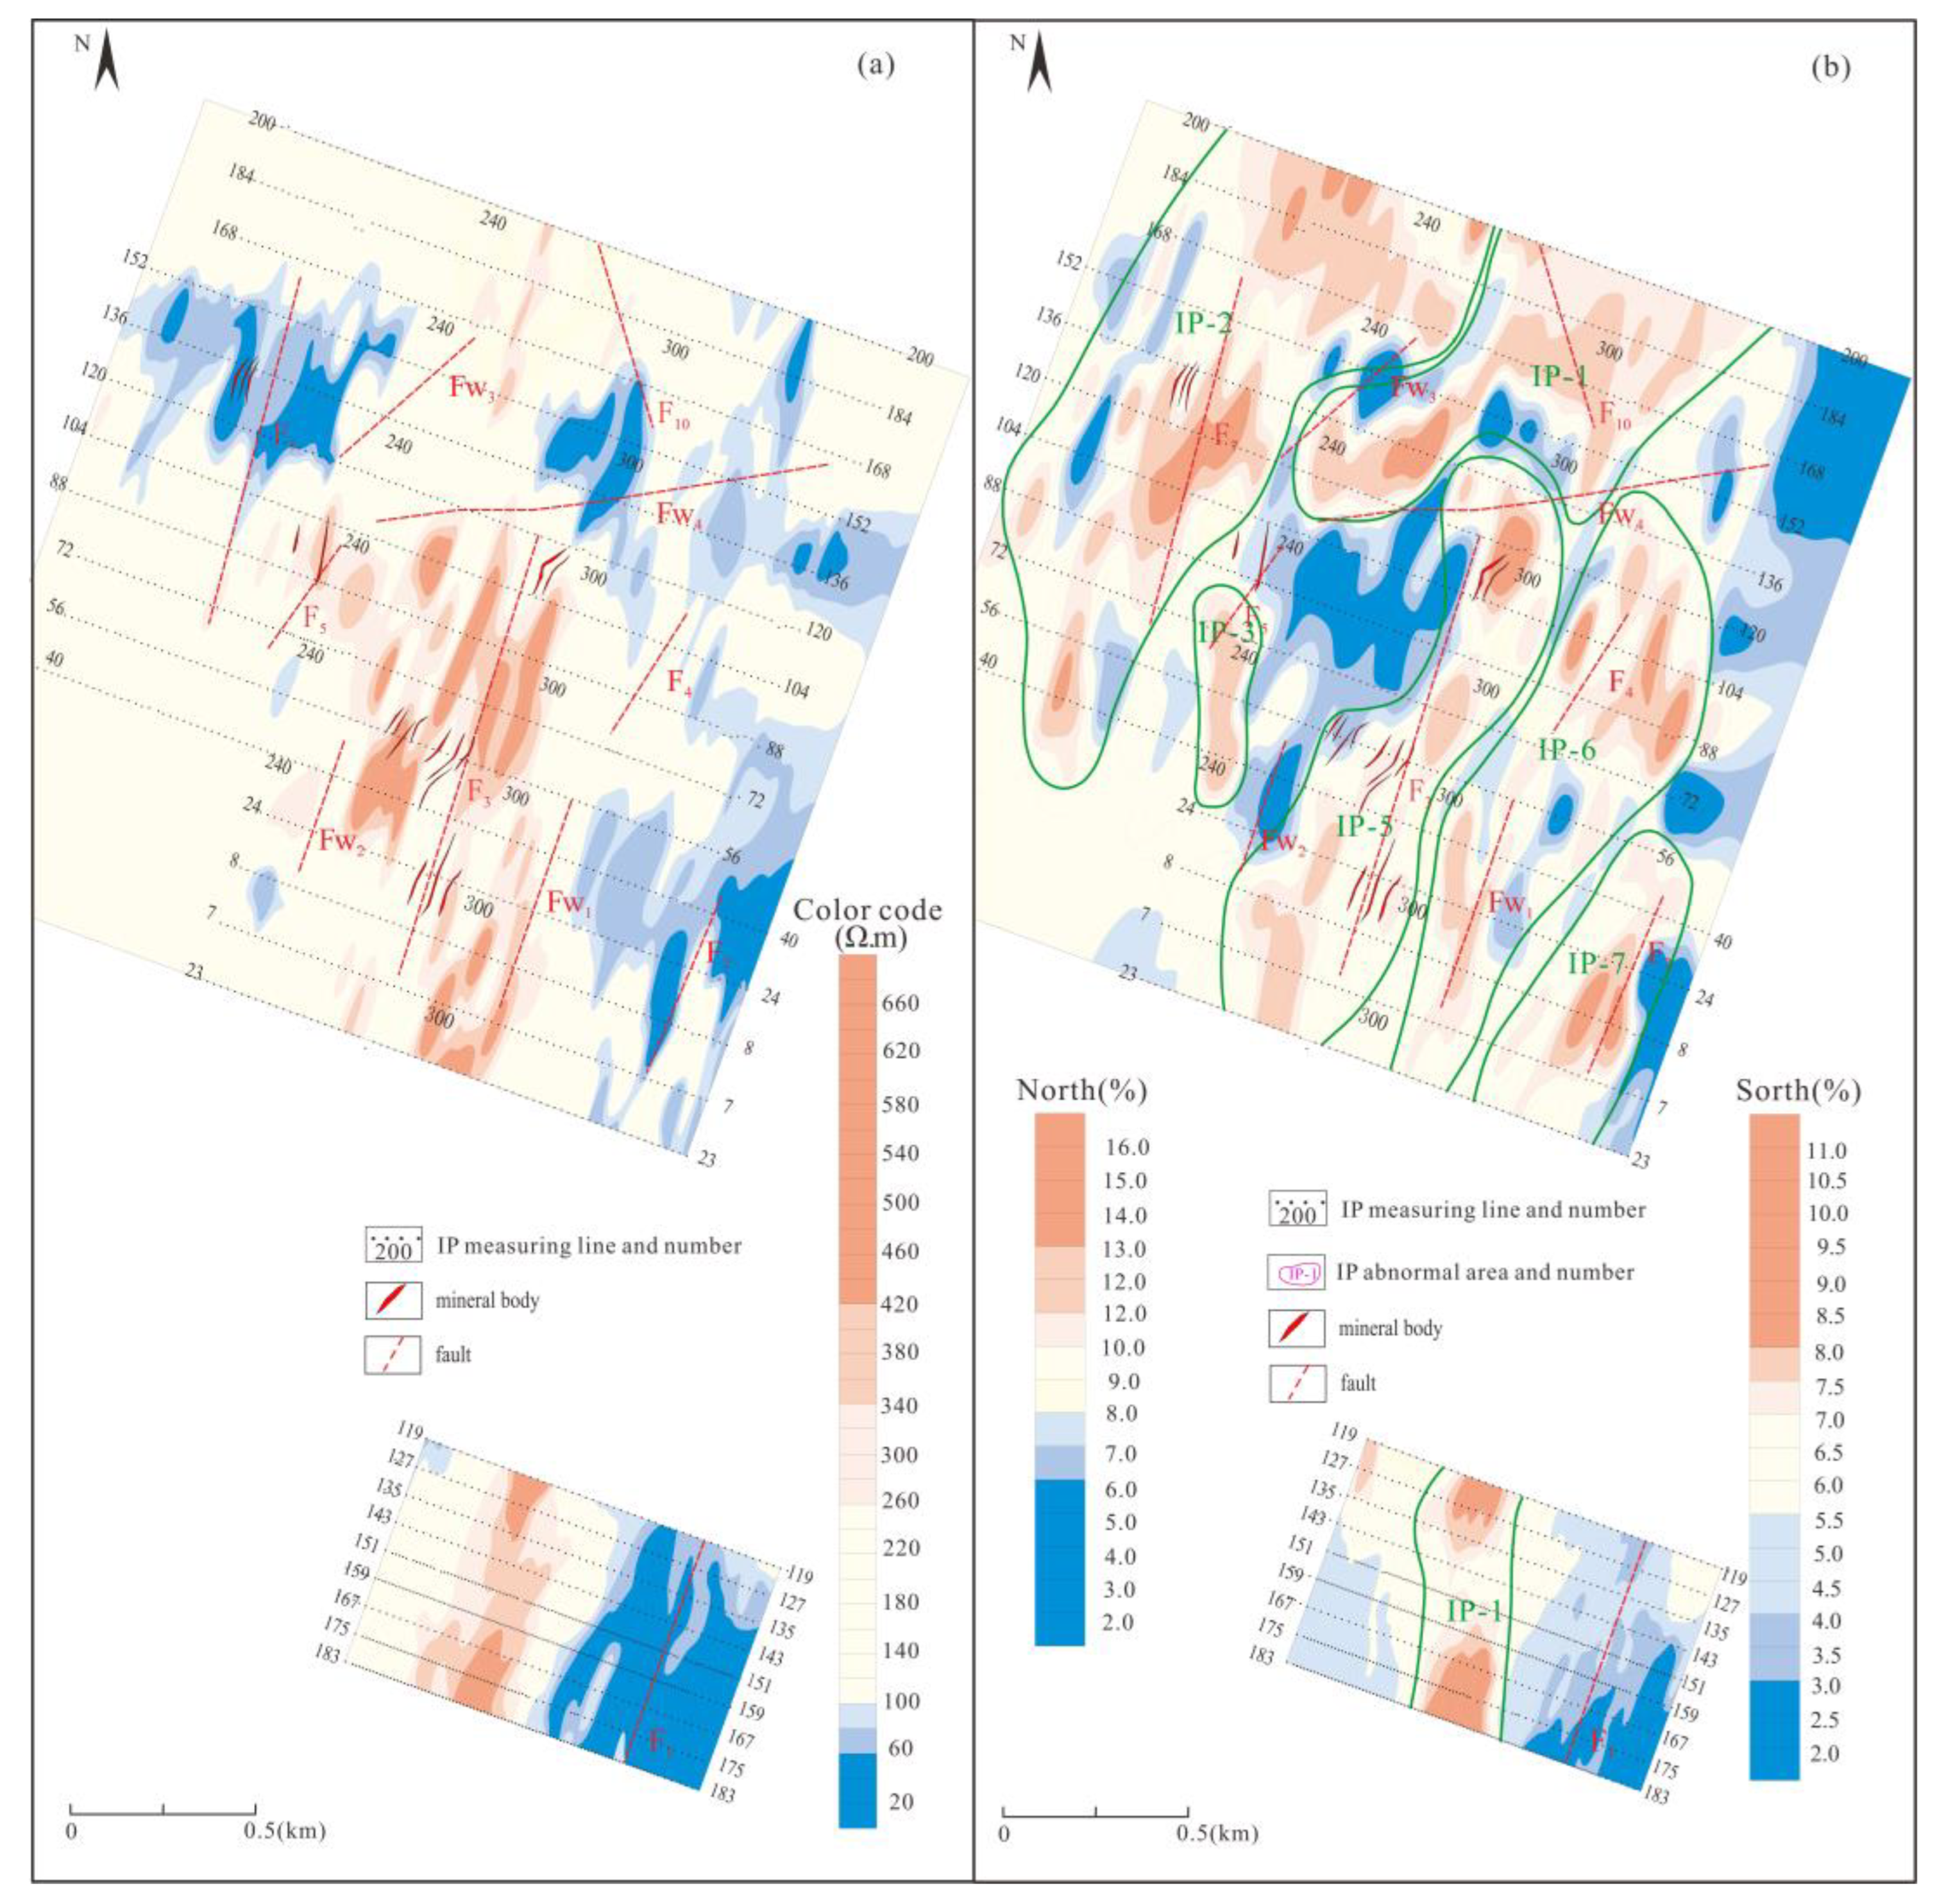
- The IP-3 anomaly was located in the south-central part of the north mining area and overlapped with the positive magnetic anomaly section on the west side of the C-3 magnetic anomaly. The anomaly was oval in shape on the plane, spreading in the north–south direction, with a length of about 550 m, a width of 100 m, an area of about 0.05 km2, and the highest anomaly value of 13.9%. The northern part of the anomaly was reflected as a medium–high-resistance area, and the apparent resistivity value was about 320 Ω·m. The IP anomaly was located in the north and south stopes of the mine, with orebodies numbered Au4-1, Au4-2, and Au4-3. The abnormal trend is consistent with the known orebodies. The local high magnetic anomaly was assumed to be caused by the known orebodies and slag. Combined with the geological metallogenic conditions, it is speculated that the IP-3 anomaly was caused by the part of the known orebodies extending southward, and the geological body (mineralized body) causing the anomaly was buried 90~180 m deep.
- (2)
- The IP-5 anomaly was located in the southern part of the north mining area, overlapping with the central part of the C-3 magnetic anomaly. The anomaly was strip-shaped and bead-shaped on the plane, in the NNE–SSW direction, consistent with the known orebody group. The anomaly was longer than 1600 m and 200–400 m-wide. The anomaly was not closed to the southwest, with an area of about 0.45 km2. The anomaly had four lenticular high-value areas, with a peak height of 16.9%, generally 10~13%. The three high-value abnormal areas of the apparent charging rate to the south of the anomaly area were located in the positive magnetic anomaly, and the high-value abnormal area of the apparent charging rate in the north was located in the negative magnetic anomaly. At the same time, the anomaly was reflected as a high-resistance area on the apparent resistivity value plan as a whole, and the peak apparent resistivity was about 660 Ω·m.
- (3)
- The IP-6 anomaly was located in the central and eastern parts and overlapped with the eastern part of the C-3 magnetic anomaly. The anomaly was generally elongated on the plane, composed of multiple vein-like and lens-like small anomalies, the direction was NE–SW, and the intensity of the anomaly in the north was greater than that in the south. The anomaly was about 1300 m-long, 200 m-wide, and 0.2 km2 in area, with high strength and a peak value of 16.7%. The northeast of the abnormal area was a medium-resistance area, and the southwest was a medium- and high-resistance area, and the corresponding apparent resistivity value was about 240–600 Ω·m. At the same time, the high-value anomaly area of this anomaly showed a significant positive magnetic anomaly. Combined with the characteristics of the known orebodies with medium and high resistance and a strong magnetic field, it is speculated that the anomaly was caused by shallow metal sulfides.
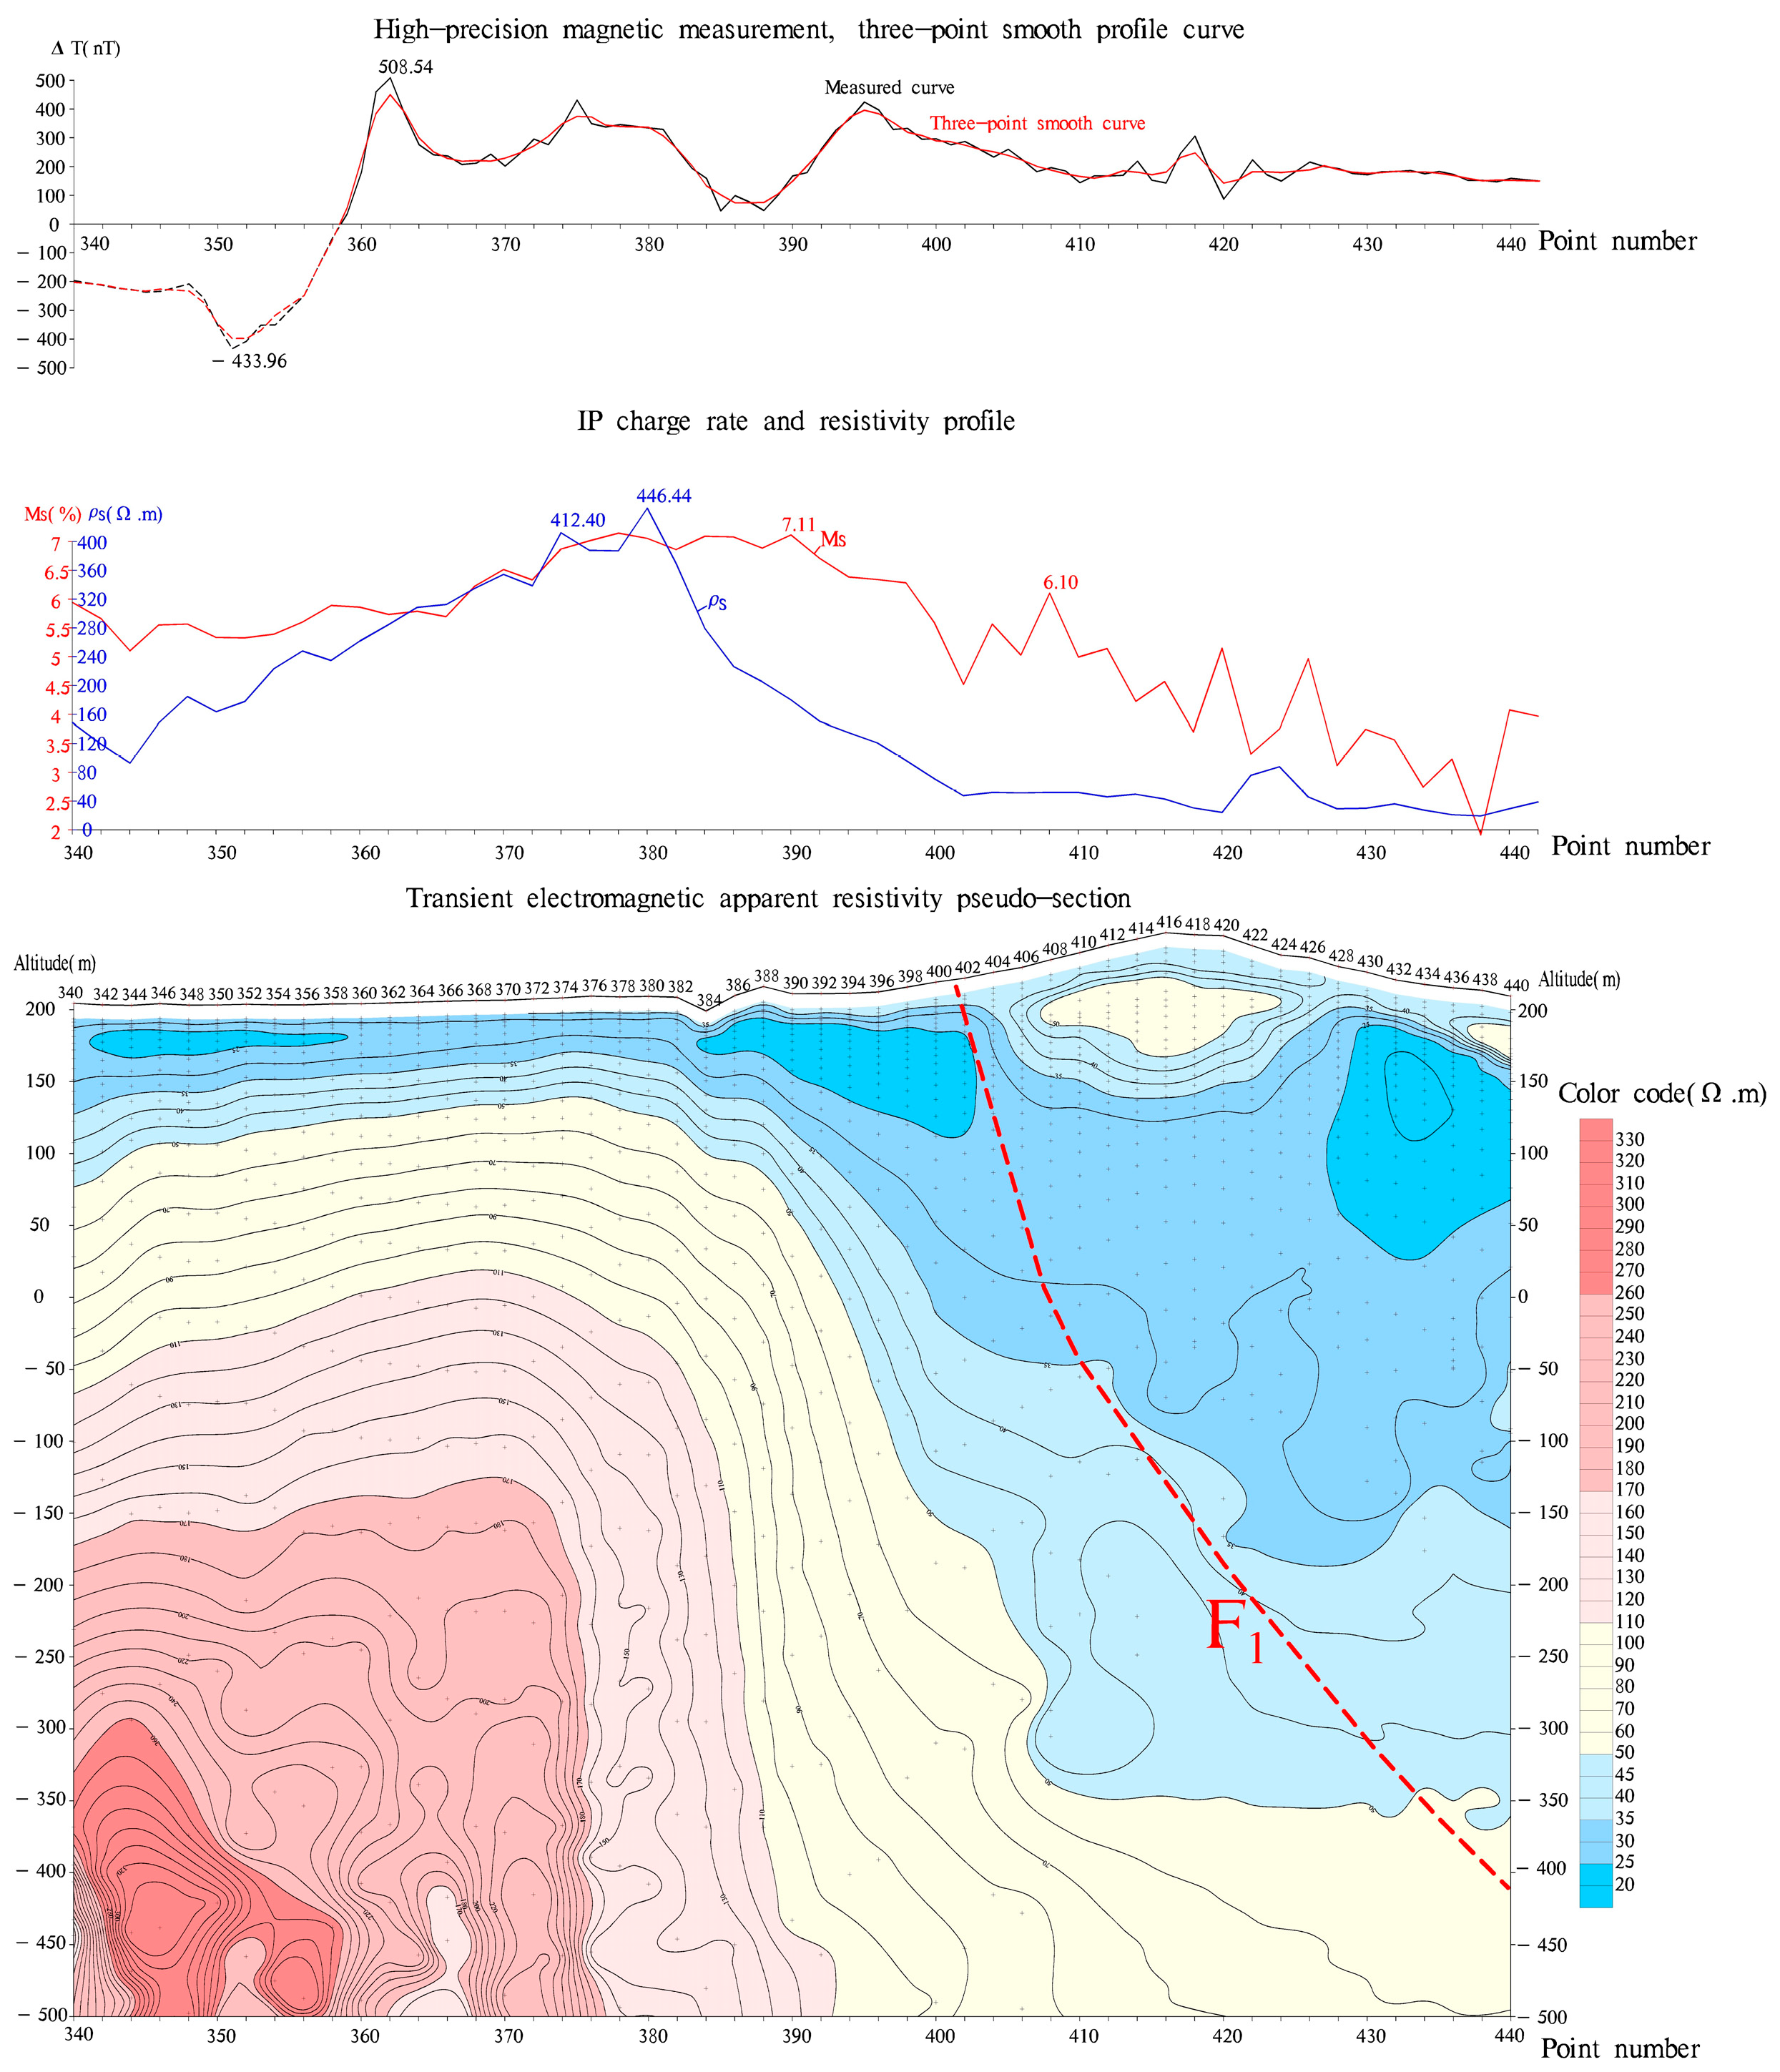
4.3. Transient Electromagnetic Measurement
5. Results and Discussion
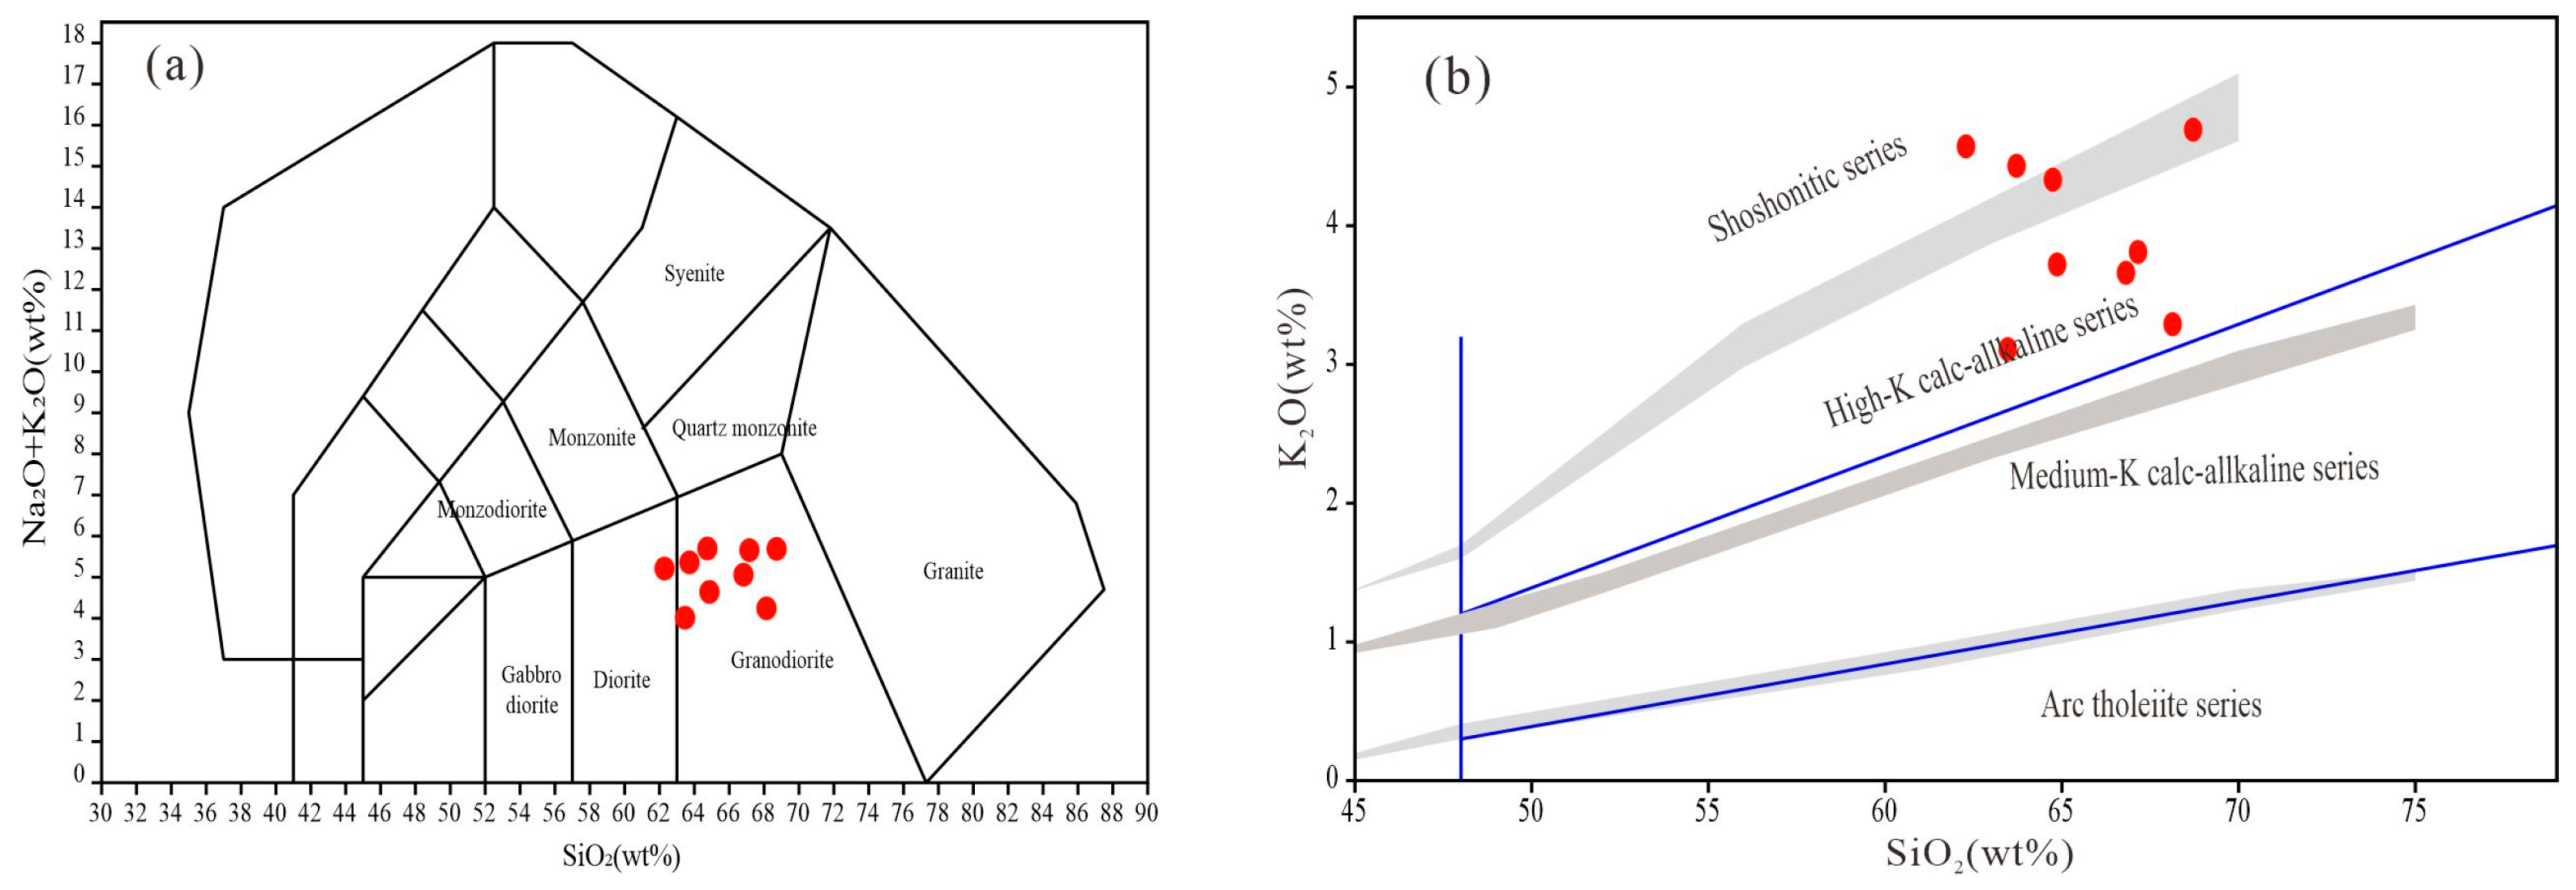
5.1. Magmatic Rocks
5.2. Metallotectonics
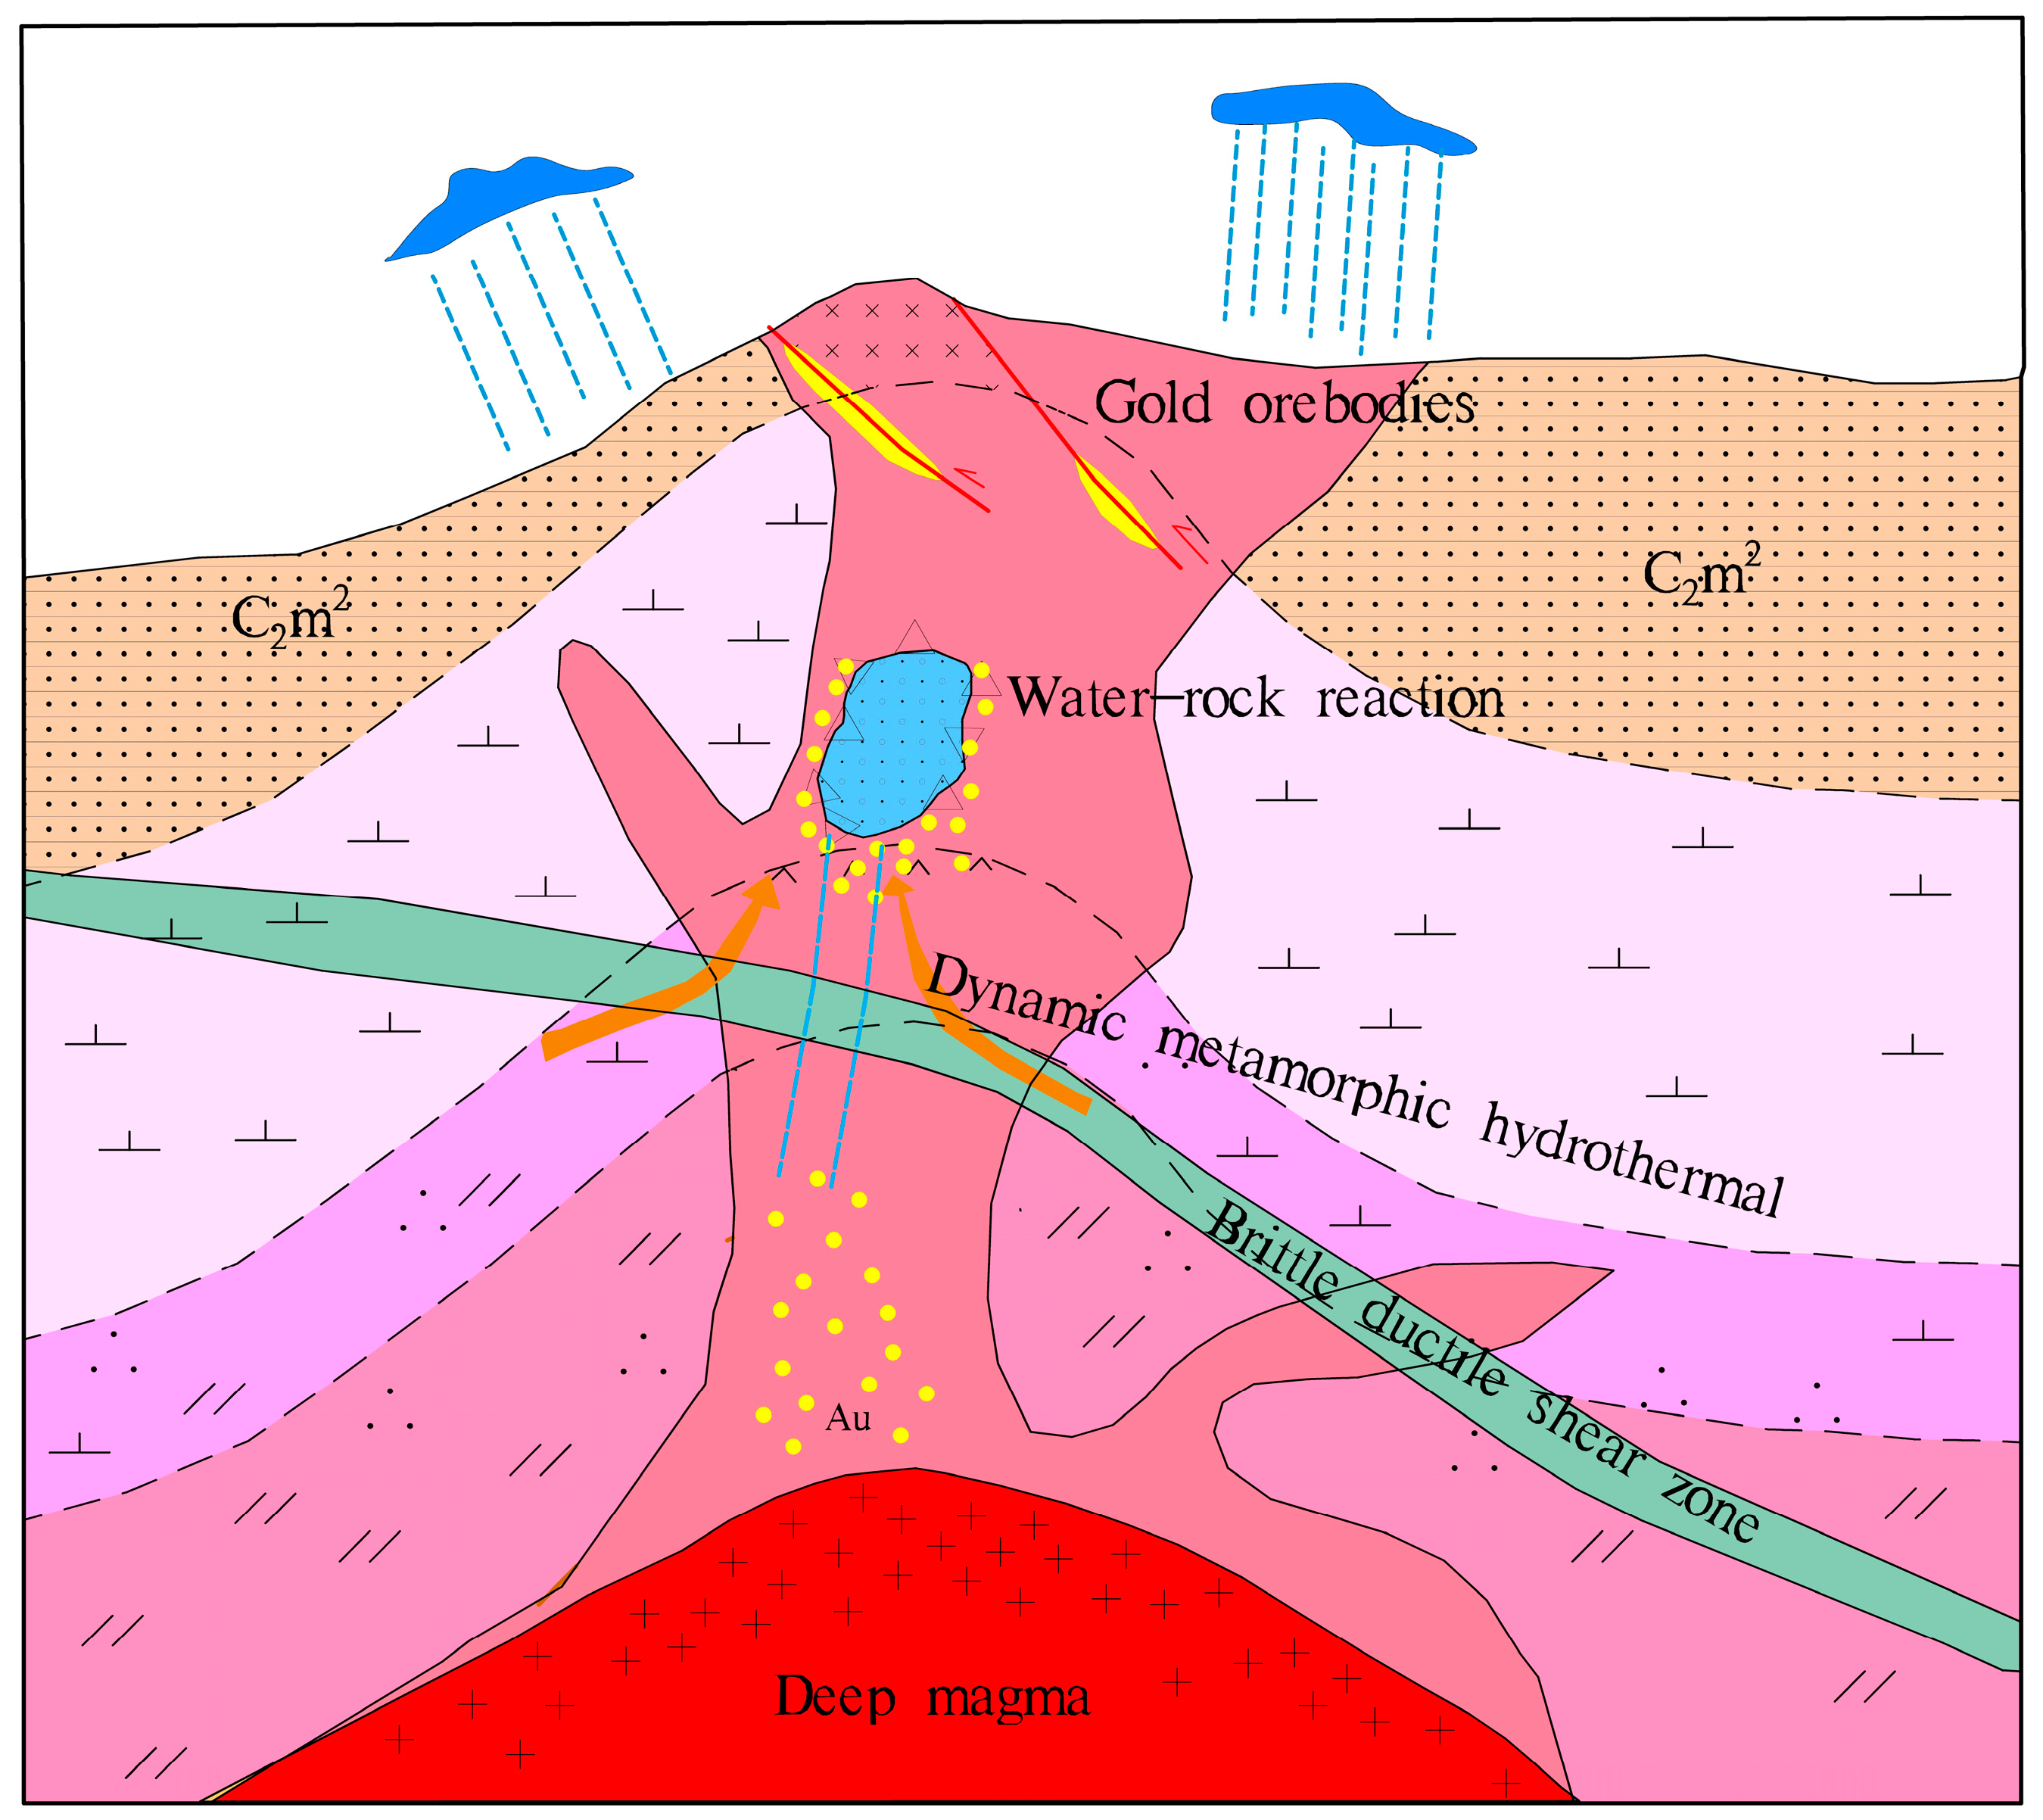
5.3. Mineralization Model of the Sarakan Deposit
6. Conclusions
- (1)
- The genetic type of the Sarakan Gold Deposit in Laos was found to be mainly the quartz (magnetite)-pyrite vein-type, which occurred in the brittle–ductile shear structure near the contact zone between the magmatic rock and the surrounding rock. It is closely related to the Indosinian felsic magmatic intrusive body and is obviously controlled by the fault structure.
- (2)
- Through the use of magnetic, electrical, and geological methods, the relationship between the tectonic framework and the metallogenic structure in the study area was determined, and the geophysical prospecting criteria in this area were found to be high-magnetic, high-polarization, and medium–high-resistivity geophysical anomaly areas. The NE-trending fault zone in the study area was the ore-guiding and ore-hosting structure. The intersection of these faults provided the primary metallogenic space and trap conditions. The ore deposits were highly altered and concentrated in terms of mineralization. It is obvious that the structure is an important indicator when searching for such deposits.
- (3)
- When comparing trenching, drilling, and other geological survey data with the results of geophysical anomalies, the results were found to be highly consistent. The reliability of the results of the magnetic and electrical methods was verified, which indicates that they are useful for exploring the relationship between mineralization, magmatic rock masses, and the structure.
- (4)
- The geophysical anomaly characteristics and prospecting experience in the study area can provide guidance and effective geophysical exploration methods for finding similar deposits in the Luang Prabang–Loei island arc.
Author Contributions
Funding
Data Availability Statement
Acknowledgments
Conflicts of Interest
References
- Alfouzan, F.; Zhou, B.; Bakkour, K.; Alyousif, M. Detecting near-surface buried targets by a geophysical cluster of electromagnetic, magnetic and resistivity scanners. J. Appl. Geophys. 2016, 134, 55–63. [Google Scholar] [CrossRef]
- Guo, X.; Gao, J.; Zhang, D.; Li, J.; Xiang, A.; Li, C.; Wang, S.; Jiao, T.; Ren, C. Genesis of the Erdaohe skarn Pb-Zn-Ag deposit in the Great Hinggan Range, NE China: Evidence from geology, fluid inclusions, and H–O–S isotope systematics. Ore Geol. Rev. 2022, 140, 104414. [Google Scholar] [CrossRef]
- Xie, F.; Tang, J.; Chen, Y.; Lang, X. Apatite and zircon geochemistry of Jurassic porphyries in the Xiongcun district, southern Gangdese porphyry copper belt: Implications for petrogenesis and mineralization. Ore Geol. Rev. 2018, 96, 98–114. [Google Scholar] [CrossRef] [Green Version]
- Zhang, Y.; Liu, K.; Wang, Y.; Zhang, D.; Mo, X.; Deng, Y.; Yu, T.; Zhao, Z. Geological Significance of Late Permian Magmatic Rocks in the Middle Section of the Ailaoshan Orogenic Belt, SW China: Constraints from Petrology, Geochemistry and Geochronology. Minerals 2022, 12, 652. [Google Scholar] [CrossRef]
- Cheng, M.; Yang, D.; Luo, Q. Interpreting Surface Large-Loop Time-Domain Electromagnetic Data for Deep Mineral Exploration Using 3D Forward Modeling and Inversion. Minerals 2023, 13, 34. [Google Scholar] [CrossRef]
- Lv, H.; Xu, L.; Yang, B.; Su, P.; Xu, H.; Wang, H.; Yao, C.; Su, P. Mineralization Based on CSAMT and SIP Sounding Data: A Case Study on the Hadamengou Gold Deposit in Inner Mongolia. Minerals 2022, 12, 1404. [Google Scholar] [CrossRef]
- Han, S.; Wang, S.; Tang, Z.; Tan, K.; Duan, X.; He, H.; Feng, Z.; Xie, Y. Integrated geophysical exploration of the coupling of a concealed rock body and metallogenic structures—Ag-Pb-Zn mining area case study in Jilinbaolige, Inner Mongolia, China. J. Appl. Geophys. 2020, 178, 104048. [Google Scholar] [CrossRef]
- Gan, J.; Li, H.; He, Z.; Gan, Y.; Mu, J.; Liu, H.; Wang, L. Application and Significance of Geological, Geochemical, and Geophysical Methods in the Nanpo Gold Field in Laos. Minerals 2022, 12, 96. [Google Scholar] [CrossRef]
- He, J. Combined Application of Wide-Field Electromagnetic Method and Flow Field Fitting Method for High-Resolution Exploration: A Case Study of the Anjialing No. 1 Coal Mine. Engineering 2018, 4, 667–675. [Google Scholar] [CrossRef]
- Li, J.; Wang, Y.; Zhu, C.; Xue, X.; Qian, K.; Xie, X.; Wang, Y. Hydrogeochemical processes controlling the mobilization and enrichment of fluoride in groundwater of the North China Plain. Sci. Total Environ. 2020, 730, 138877. [Google Scholar] [CrossRef]
- Olajide-Kayode, J.O.; Mustapha, S.O.; Olatunji, A.S.; Okunlola, O.A. Assessment of gold mineralisation in Osu–Amuta–Itagunmodi areas, Southwestern Nigeria. Arab. J. Geosci. 2020, 13, 573. [Google Scholar] [CrossRef]
- Sono, P.; Nthaba, B.; Shemang, E.M.; Kgosidintsi, B.; Seane, T. An integrated use of induced polarization and electrical resistivity imaging methods to delineate zones of potential gold mineralization in the Phitshane Molopo area, Southeast Botswana. J. Afr. Earth Sci. 2020, 174, 104060. [Google Scholar] [CrossRef]
- Wilson, C.J.L.; Moore, D.H.; Vollgger, S.A.; Madeley, H.E. Structural evolution of the orogenic gold deposits in central Victoria, Australia: The role of regional stress change and the tectonic regime. Ore Geol. Rev. 2020, 120, 103390. [Google Scholar] [CrossRef]
- Zeng, Q.; Di, Q.; Liu, T.; Li, G.; Yu, C.; Shen, P.; Liu, H.; Ye, J. Explorations of gold and lead-zinc deposits using a magnetotelluric method: Case studies in the Tianshan-Xingmeng Orogenic Belt of Northern China. Ore Geol. Rev. 2020, 117, 103283. [Google Scholar] [CrossRef]
- Liu, S.; Guo, L.; Ding, J.; Hou, L.; Xu, S.; Shi, M.; Liang, H.; Nie, F.; Cui, X. Evolution of Ore-Forming Fluids and Gold Deposition of the Sanakham Lode Gold Deposit, SW Laos: Constrains from Fluid Inclusions Study. Minerals 2022, 12, 259. [Google Scholar] [CrossRef]
- Kwan, K.; Müller, D. Mount Milligan alkalic porphyry Au–Cu deposit, British Columbia, Canada, and its AEM and AIP signatures: Implications for mineral exploration in covered terrains. J. Appl. Geophys. 2020, 180, 104131. [Google Scholar] [CrossRef]
- Shi, M.; Lin, F.; Fan, W.; Deng, Q.; Cong, F.; Tran, M.; Zhu, H.; Wang, H. Zircon U–Pb ages and geochemistry of granitoids in the Truong Son terrane, Vietnam: Tectonic and metallogenic implications. J. Asian Earth Sci. 2015, 101, 101–120. [Google Scholar] [CrossRef]
- Zaw, K.; Meffre, S.; Lai, C.; Burrett, C.; Santosh, M.; Graham, I.; Manaka, T.; Salam, A.; Kamvong, T.; Cromie, P. Tectonics and metallogeny of mainland Southeast Asia—A review and contribution. Gondwana Res. 2014, 26, 5–30. [Google Scholar]
- Qian, X.; Feng, Q.; Wang, Y.; Chonglakmani, C.; Monjai, D. Geochronological and geochemical constraints on the mafic rocks along the Luang Prabang zone: Carboniferous back-arc setting in northwest Laos. Lithos 2016, 245, 60–75. [Google Scholar] [CrossRef]
- Chen, H.; Chen, Y.; Baker, M. Isotopic geochemistry of the Sawayaerdun orogenic-type gold deposit, Tianshan, northwest China: Implications for ore genesis and mineral exploration. Chem. Geol. 2012, 310–311, 1–11. [Google Scholar] [CrossRef]
- Goldfarb, R.J.; Taylor, R.D.; Collins, G.S.; Goryachev, N.A.; Orlandini, O.F. Phanerozoic continental growth and gold metallogeny of Asia. Gondwana Res. 2014, 25, 48–102. [Google Scholar] [CrossRef]
- Huo, F.; Wang, X.; Wen, H.; Xu, W.; Huang, H.; Jiang, H.; Li, Y.; Li, B. Genetic mechanism and pore evolution in high quality dolomite reservoirs of the Changxing-Feixianguan Formation in the northeastern Sichuan Basin, China. J. Petrol. Sci. Eng. 2020, 194, 107511. [Google Scholar] [CrossRef]
- Shifeng, W.; Yasi, M.; Chao, W.; Peisheng, Y. Paleotethyan evolution of the Indochina Block as deduced from granites in northern Laos. Gondwana Res. 2016, 38, 183–196. [Google Scholar]
- Sun, T.; Chen, F.; Zhong, L.; Liu, W.; Wang, Y. GIS-based mineral prospectivity mapping using machine learning methods: A case study from Tongling ore district, eastern China. Ore Geol. Rev. 2019, 109, 26–49. [Google Scholar] [CrossRef]
- Yang, X.; Zaw, K.; Bin Ghani, A. Preface for the special issue “Magmatism, tectonic evolution and metallogenesis in SE Asia and the adjacent region”. Ore Geol. Rev. 2021, 129, 103890. [Google Scholar] [CrossRef]
- Shi, M.; Khin, Z.; Liu, S.; Xu, B.; Meffre, S.; Cong, F.; Nie, F.; Peng, Z.; Wu, Z. Geochronology and petrogenesis of Carboniferous and Triassic volcanic rocks in NW Laos: Implications for the tectonic evolution of the Loei Fold Belt. J. Asian Earth Sci. 2021, 208, 104661. [Google Scholar] [CrossRef]
- Wang, Y.; Yang, T.; Zhang, Y.; Qian, X.; Gan, C.; Wang, Y.; Wang, Y.; Senebouttalath, V. Late Paleozoic back-arc basin in the Indochina block: Constraints from the mafic rocks in the Nan and Luang Prabang tectonic zones, Southeast Asia. J. Asian Earth Sci. 2020, 195, 104333. [Google Scholar] [CrossRef]
- Hou, L.; Liu, S.; Guo, L.; Xiong, F.; Li, C.; Shi, M.; Zhang, Q.; Xu, S.; Wu, S. Geology, Geochronology, and Hf Isotopic Composition of the Pha Lek Fe Deposit, Northern Laos: Implications for Early Permian Subduction-Related Skarn Fe Mineralization in the Truong Son Belt. J. Earth Sci.-China 2019, 30, 109–120. [Google Scholar] [CrossRef]
- Guo, L.; Hou, L.; Liu, S.; Nie, F. Rare Earth Elements Geochemistry and C–O Isotope Characteristics of Hydrothermal Calcites: Implications for Fluid-Rock Reaction and Ore-Forming Processes in the Phapon Gold Deposit, NW Laos. Minerals 2018, 8, 438. [Google Scholar] [CrossRef] [Green Version]
- Yang, W.; Qian, X.; Feng, Q.; Shen, S.; Chonglakmani, C. Zircon U-Pb geochronological evidence for the evolution of the Nan-Uttaradit suture in northern Thailand. J. Earth Sci.-China 2016, 27, 378–390. [Google Scholar] [CrossRef]
- Zhao, T.; Qian, X.; Feng, Q. Geochemistry, zircon U-Pb age and Hf isotopic constraints on the petrogenesis of the Silurian rhyolites in the Loei fold belt and their tectonic implications. J. Earth Sci.-China 2016, 27, 391–402. [Google Scholar] [CrossRef]
- Zhang, Z.; Shu, Q.; Wu, C.; Zaw, K.; Cromie, P.; von Dollen, M.; Xu, J.; Li, X. The endogenetic metallogeny of northern Laos and its relation to the intermediate-felsic magmatism at different stages of the Paleotethyan tectonics: A review and synthesis. Ore Geol. Rev. 2020, 123, 103582. [Google Scholar] [CrossRef]
- Bounliyong, P.; Itaya, T.; Arribas, A.; Watanabe, Y.; Wong, H.; Echigo, T. K–Ar geochronology of orogenic gold mineralization in the Vangtat gold belt, southeastern Laos: Effect of excess argon in hydrothermal quartz. Resour. Geol. 2021, 71, 161–175. [Google Scholar] [CrossRef]
- Li, H.; Gan, J.; He, Z.; Gan, Y.; Wang, B.; Li, Y.; Jiang, W. Petrogenesis and Geodynamic Significance of the Early Triassic Nanpo Adakitic Pluton of the Luang Prabang-Loei Tectonic Belt (Northwestern Laos) in the East Tethys Domain: Constraints from Zircon U-Pb-Hf Isotope Analyses and Whole-Rock Geochemistry. Minerals 2023, 13, 821. [Google Scholar] [CrossRef]
- Long, Y.; Zhang, D.; Huang, D.; Yang, X.; Chen, S.; Bayless, R.C. Age, composition and tectonic implications of late Ordovician-early Silurian igneous rocks of the Loel Volcanic Belt, NW Laos. Int. Geol. Rev. 2019, 61, 1940–1956. [Google Scholar] [CrossRef]
- Zou, H.; Han, R.; Liu, M.; Cromie, P.; Zaw, K.; Fang, W.; Huang, J.; Ren, T.; Wu, J. Geological, geophysical, and geochemical characteristics of the Ban Kiouchep Cu–Pb–Ag deposit and its exploration significance in Northern Laos. Ore Geol. Rev. 2020, 124, 103603. [Google Scholar] [CrossRef]
- Li, Y.; Hou, Z.; Li, M.; Wang, C.; Liu, X.; Li, S. Soil Geochemical Characteristics and Significance of the Shalakan Gold Deposit in Laos. Mod. Min. 2021, 37, 16–21. (In Chinese) [Google Scholar]
- Middlemost, E.A.K. Naming materials in the magma/igneous rock system. Earth-Sci. Rev. 1994, 37, 215–224. [Google Scholar] [CrossRef]
- Peccerillo, A.; Taylor, S.R. Geochemistry of eocene calc-alkaline volcanic rocks from the Kastamonu area, Northern Turkey. Contrib. Mineral. Petr. 1976, 58, 63–81. [Google Scholar] [CrossRef]
- Li, Y. Geological Characteristics and Genesis of Sanakham Gold Deposit in Vientiane Province, Laos. Master’s Thesis, Chengdu University of Technology, Chengdu, China, 2022. (In Chinese). [Google Scholar]


| Lithology | Number | κ (4π × 10−6 SI) | Jr (10−3 A/m) | Remarks | ||||||
|---|---|---|---|---|---|---|---|---|---|---|
| Minimum | Maximum | Average Value | Deviation | Minimum | Maximum | Average Value | Deviation | |||
| Argillaceous slate | 32 | 4.4 | 2747.0 | 401.8 | 736.7 | 7.2 | 124.4 | 44.8 | 30.6 | Surface (specimen) |
| Marble | 8 | 5.7 | 2300.2 | 618.5 | 983.4 | 2.9 | 89.4 | 25.9 | 30.8 | |
| Diorite | 32 | 2.6 | 505.2 | 95.4 | 100.6 | 9.7 | 910.1 | 126.6 | 184.6 | |
| Pyrrhotite-bearing diorite | 33 | 236.6 | 2849.9 | 1204.0 | 695.4 | 40.0 | 4396.4 | 565.6 | 863.2 | |
| Limonite | 31 | 8.1 | 16,528.5 | 1192.6 | 3095.0 | 24.3 | 612.8 | 214.2 | 123.6 | |
| Limestone | 32 | 0.1 | 4.6 | 1.4 | 1.2 | Drilling (susceptibility meter) | ||||
| Metamorphic siltstone | 36 | 1.0 | 52.8 | 19.6 | 13.0 | |||||
| Sandy slate | 32 | 3.5 | 51.2 | 23.1 | 12.1 | |||||
| Argillaceous slate | 32 | 1.2 | 214.9 | 48.8 | 54.1 | |||||
| Lithology | Number | M (%) | ρ (Ω·m) | Remarks | ||||||
|---|---|---|---|---|---|---|---|---|---|---|
| Minimum | Maximum | Average Value | Deviation | Minimum | Maximum | Average Value | Deviation | |||
| Carbonaceous mudstone | 33 | 0.87 | 1.63 | 1.25 | 0.17 | 38.21 | 62.47 | 49.31 | 6.50 | Surface (specimen) |
| Carbonaceous slate | 31 | 1.04 | 2.37 | 1.64 | 0.32 | 78.48 | 833.46 | 270.38 | 162.20 | |
| Limestone | 31 | 1.07 | 2.67 | 1.87 | 0.45 | 162.07 | 15,668.47 | 5825.45 | 4828.42 | |
| Diorite | 45 | 2.06 | 3.83 | 2.95 | 0.38 | 955.11 | 4791.88 | 2750.92 | 1056.51 | |
| Limonite | 35 | 6.28 | 11.74 | 8.69 | 0.99 | 2130.77 | 26,823.74 | 7546.41 | 5304.80 | |
| Sandy slate | 32 | 0.16 | 2.99 | 1.53 | 0.74 | 1029.10 | 10,516.58 | 5581.23 | 2590.85 | Drilling (IP instrument) |
| Metamorphic siltstone | 37 | 0.24 | 3.64 | 1.76 | 0.94 | 4659.94 | 144,539.9 | 49,060.72 | 41,925.02 | |
| Argillaceous slate | 32 | 0.33 | 3.78 | 1.84 | 0.97 | 2072.29 | 32,497.32 | 15,204.00 | 9832.29 | |
| Pyrrhotite-bearing diorite | 20 | 4.023 | 15.05 | 7.78 | 3.67 | 11,961.7 | 76,119.5 | 32,108.6 | 19,686.2 | |
| Number | HQ2 | HQ2 | HQ3 | HQ4 | HQ5 | HQ6 | HQ7 | HQ8 | HQ9 |
|---|---|---|---|---|---|---|---|---|---|
| SiO2 | 63.71 | 62.28 | 67.15 | 63.46 | 68.71 | 66.81 | 64.86 | 68.13 | 64.74 |
| TiO2 | 0.48 | 0.71 | 0.53 | 0.41 | 0.51 | 0.26 | 0.24 | 0.33 | 0.56 |
| Al2O3 | 11.56 | 11.16 | 12.25 | 11.52 | 12.14 | 11.68 | 10.43 | 10.47 | 11.14 |
| Fe2O3 | 9.43 | 5.11 | 5.94 | 12.10 | 6.50 | 9.66 | 12.05 | 9.44 | 8.21 |
| FeO | 0.85 | 0.57 | 0.71 | 0.52 | 0.54 | 0.97 | 0.39 | 0.38 | 0.87 |
| MnO | 0.05 | 0.06 | 0.04 | 0.05 | 0.06 | 0.07 | 0.03 | 0.02 | 0.04 |
| MgO | 0.91 | 1.43 | 0.94 | 0.76 | 1.00 | 0.47 | 0.48 | 0.55 | 1.44 |
| CaO | 1.18 | 0.40 | 0.85 | 0.83 | 0.55 | 0.44 | 0.34 | 0.28 | 2.55 |
| Na2O | 0.89 | 0.60 | 1.81 | 0.86 | 0.96 | 1.36 | 0.88 | 0.91 | 1.33 |
| K2O | 4.43 | 4.57 | 3.81 | 3.11 | 4.69 | 3.66 | 3.72 | 3.29 | 4.33 |
| P2O5 | 0.12 | 0.04 | 0.07 | 0.09 | 0.04 | 0.10 | 0.14 | 0.10 | 0.10 |
| SO2 | 0.38 | 0.06 | 0.13 | 0.07 | 0.05 | 0.13 | 0.25 | 1.03 | 2.19 |
| LOI | 4.82 | 7.99 | 4.18 | 5.86 | 4.15 | 4.26 | 5.83 | 5.00 | 2.48 |
| DI | 73.68 | 79.52 | 79.93 | 69.66 | 80.11 | 76.85 | 74.19 | 76.97 | 72.52 |
| SI | 5.71 | 11.95 | 7.31 | 4.6 | 7.52 | 3.03 | 2.87 | 3.86 | 9.18 |
| A/NK | 1.85 | 1.88 | 1.72 | 2.41 | 1.82 | 1.88 | 1.91 | 1.95 | 1.62 |
| A/CNK | 1.51 | 1.72 | 1.47 | 1.92 | 1.62 | 1.77 | 1.8 | 1.87 | 1.31 |
| AR | 2.43 | 2.62 | 1.76 | 1.95 | 2.61 | 2.41 | 2.44 | 2.29 | 2.41 |
| σ | 1.29 | 1.23 | 1.26 | 0.72 | 1.21 | 1.02 | 0.92 | 0.78 | 1.43 |
Disclaimer/Publisher’s Note: The statements, opinions and data contained in all publications are solely those of the individual author(s) and contributor(s) and not of MDPI and/or the editor(s). MDPI and/or the editor(s) disclaim responsibility for any injury to people or property resulting from any ideas, methods, instructions or products referred to in the content. |
© 2023 by the authors. Licensee MDPI, Basel, Switzerland. This article is an open access article distributed under the terms and conditions of the Creative Commons Attribution (CC BY) license (https://creativecommons.org/licenses/by/4.0/).
Share and Cite
Li, H.; Gan, J.; Gan, Y.; Wang, B.; Li, Y.; Jiang, W. Coupling Mechanism of the Concealed Rock Body and Metallogenic Structure of the Sarakan Gold Deposit in Laos Investigated Using Magnetic and Electrical Methods. Minerals 2023, 13, 912. https://doi.org/10.3390/min13070912
Li H, Gan J, Gan Y, Wang B, Li Y, Jiang W. Coupling Mechanism of the Concealed Rock Body and Metallogenic Structure of the Sarakan Gold Deposit in Laos Investigated Using Magnetic and Electrical Methods. Minerals. 2023; 13(7):912. https://doi.org/10.3390/min13070912
Chicago/Turabian StyleLi, Hui, Jie Gan, Yu Gan, Bin Wang, Yong Li, and Wei Jiang. 2023. "Coupling Mechanism of the Concealed Rock Body and Metallogenic Structure of the Sarakan Gold Deposit in Laos Investigated Using Magnetic and Electrical Methods" Minerals 13, no. 7: 912. https://doi.org/10.3390/min13070912