Article

Energy Efficiency of Microwave-Induced Heating of Crushed Rocks/Ores

Norman B. Keevil Institute of Mining Engineering, University of British Columbia, Vancouver, BC V6T1Z4, Canada
*
Author to whom correspondence should be addressed.
Minerals 2023, 13(7), 924; https://doi.org/10.3390/min13070924
Submission received: 13 June 2023 / Revised: 30 June 2023 / Accepted: 7 July 2023 / Published: 9 July 2023
(This article belongs to the Section Mineral Processing and Extractive Metallurgy)

Abstract

:
The interaction between electromagnetic waves and heat transfer phenomena due to microwave treatment is of utmost importance for an energy-efficient microwave-integrated grinding circuit. In this study, the effect of microwave irradiations on the heat absorptions of crushed particles is carried out by developing a numerical model. Crushed particles are simulated as diced-shaped geometries with different sitting arrangements but similar size distributions. The energy efficiency of the microwave treatment process is studied by introducing temperature-dependent dielectric properties and accounting for the convective heat loss from the particle boundaries to the surrounding environment. The simulations are quantitatively validated with the experimental results for heat over microwave efficiency. Heat absorption of larger particles is found to be significantly higher, and the arrangement of particles exerts a negligible effect on overall energy absorption. It is also found that ores with a larger average diameter can yield higher energy efficiencies, and the maximum absorption can be achieved by placing the particles at certain distances from the waveguide of the microwave.

1. Introduction

Global energy transition is reshaping the production of minerals and metals needed for low-carbon energy technologies. Currently, the mining industry has pledged to more sustainable development, which requires the deployment of a wide range of energy-efficient processes. The industry demands around 10% of global energy [1]. Between 30%–70% of this energy is used to liberate the tightly locked precious minerals [2,3]. Klein et al. quoted that the energy efficiency of the conventional comminution methods typically ranges from 0.1% to 2% [4]. Much of the energy consumed for breaking chemical bonds and creating new surfaces by comminution is dissipated as heat, vibrations, and noise [5]. The science of mineral liberation has considerably advanced over the past few decades, but not all such advances have been applied in mines. Potential drivers for change, and, in many cases, a prohibitive factor, have been the energy efficiencies of these advancements. A particularly attractive process involves the application of heating and quenching, otherwise referred to thermally assisted liberation (TAL), which has long been recognized as a solution for reducing grinding resistance and improving mineral recovery [6,7]. This process leads to ore body strength reduction and improves the downstream liberation of valuable minerals. Other benefits of thermal liberation include increased mill capacity, improved liberation and product size control, and reduced mill wear [6,8]. However, the economics of conventional thermal liberation techniques is a significant drawback of the process despite its favourable effect on grindability and strength reduction (see Koleini and Barani [9] and the references therein). More recent developments in thermal liberation include rapid and targeted heating of minerals by microwave irradiation. The use of microwave energy for enhanced heating has been proposed more recently as an alternative technique with promising economics compared to conventional thermal liberation techniques.
Over the past few decades, the concept of microwave treatment of rocks has motivated a significant number of studies with the principal goal of improving the efficiency of excavation and comminution processes. The pioneering studies by Ford and Pei [10], Chen et al. [11], and Walkiewicz [3] are recognized for their significant contribution to understanding the potential application of microwave irradiations on minerals. Chen et al. [11] investigated the interactions of 40 mineral types with a microwave’s electromagnetic field and classified them into two primary categories. The first category comprised transparent or reflective minerals to microwave energy (e.g., silicate, carbonates, sulphates, and some oxides) with insignificant heat generation and no alterations in mineral properties. The absorbent minerals (e.g., most sulfides, arsenides, sulfosalts, and some oxides) were classified as the second group, as they could be either thermally stable or reactive when exposed to microwave energy. Materials with large tangent losses are heated more rapidly when subjected to microwave energy. Ionic conduction and dipolar rotation are two significant factors influencing energy absorption and the electric field in a microwave [12]. Materials with inhomogeneous dielectric properties absorb heat unevenly. This phenomenon generates amplified thermal stresses at grain boundaries that can be sufficient for creating microcracks and hence improving grindability. Multiple studies have highlighted the potential role of microwave energy on comminution and emphasized the unfavourable economics of the process [13].
Walkiewicz et al. [14] exposed batches of iron ores to 3 kW of microwave energy and heated the samples to average maximum temperatures of up to 940 °C. Results for the standard grindability tests on microwave-treated samples led to 10%–24% deduction in the Work Index of the iron ores. Despite improving grindability, the process was reported not to be efficient only based on energy factors. It was concluded that a decrease in comminution costs was not due only to reductions in required grinding energy but also due to less wear of the mill, less recycled ores, and increased throughputs due to changes that can be applied to the grinding circuits. For all these factors, Walkiewicz et al. [14] reported that microwave energy could yield decent economic returns in recovering valuable minerals. Their work was extended some years later by Tavares and King [15], who reported the effect of low-power microwave irradiations (with power inputs of up to 1.2 kW) on the strength of iron, titanium, and taconite ores and compared the results with those of the conventional treatments. Results showed very little difference in terms of fracture energy and damage for the microwave-treated and conventionally treated samples. It was also observed that microwave pretreatment results in a greater shift in the top of the breakage function compared to conventionally treated samples while having no effect on fine production. Kingman et al. [16] studied the effect of microwave irradiations and different exposure times on grindability and formation of intergranular fractures of massive Norwegian ilmenite ore. The microwave-treated samples were reported to produce considerably higher-grade concentrates and to improve mineral recovery compared to non-treated samples. The results indicated a reduction of up to 90% in the Work Index and concluded that the recovery of the valuable ore could be influenced by over-exposure to microwave energy (i.e., high-power and short-exposure treatments were reported as most effective). The study on microwave treatment has also been extended by Kingman et al. [17] and Wang et al. [18] to include the effects of mineralogy, grain size, and degree of dissemination on the heating behaviours and degrees of grindability of ores. Kingman et al. [17] quoted that a consistent mineralogy comprising of a coarse absorber in a transparent gangue material yielded the highest reductions in terms of grinding energy following microwave treatment. In the same way, the poorest results could be attributed to ores with highly disseminated and fine-grained minerals.
The application of numerical methods is of particular interest to microwave-assisted rock breakage due to their versatility in simulating coupled electromagnetic-thermal-mechanical processes. Jones et al. [19] used a two-dimensional finite difference thermo-mechanical model to study the effect of energy density and grain size in a two-mineral ore sample that comprised an absorbent pyrite phase contained in a transparent calcite matrix. The liberation of irregular absorbent grains with lower sphericities was easier due to the generation of higher shear stresses outside their boundaries. Smaller absorbent minerals were also reported to require higher microwave power dosages to sufficiently raise the temperature for imposing damage to the ore body. This research was later extended by Jones et al. [20] to investigate the effect of continuous and pulsed microwave energy delivery on strength reduction in the samples (see also [8]). For a given input microwave energy, shorter exposure times were reported to result in more significant strength reductions in two-mineral calcite/pyrite systems. Ali and Bradshaw [21,22] used a bonded-particle model (BPM) to study the effects of mineralogy, power density, exposure time, and the shape of the absorbent phase on the development of failures in a two-phase ore body. A complete exposition of the recent contributions to the application of numerical methods in microwave heating of rocks is undoubtedly beyond the scope of this study. Interested readers can refer to [9,23,24,25,26] for more comprehensive accounts of these investigations. In most of these studies, the contribution of the electromagnetic field in the cavity was either neglected or accounted for by imposing constant electric and magnetic boundary conditions [27,28]. Ahmadihosseini et al. [24] also reported that using the time-harmonic form of Maxwell’s equation [29,30,31] could lead to unrealistic energy absorption estimates.
Using numerical methods to predict the responses of crushed rocks and ores from microwave irradiations is scarce in the literature. Of particular interest to the work reported here is the study conducted by Ali and Bradshaw [32] to determine the thermal damage and breakage of two-phase mineral particles using a 2D bonded-particle model. The simulations were carried out by exerting a pre-assumed volumetric heat source for the absorbent minerals and defining tensile and shear strengths for the material. Aiming to fill the present knowledge gap for predicting the microwave response of mineral ores, a validated finite element model is developed in this article. The main goal of this work was to predict the heat absorptions and temperature distributions of particles with random sitting arrangements in an electromagnetic field. The bi-directional coupling of the electromagnetic and heat transfer processes was considered by introducing temperature-dependent dielectric properties. The effect of convective heat loss, particle size distribution (PSD), and the distance to the waveguide on the efficiency of the process were studied in detail.

2. Methodology

2.1. Materials and Methods

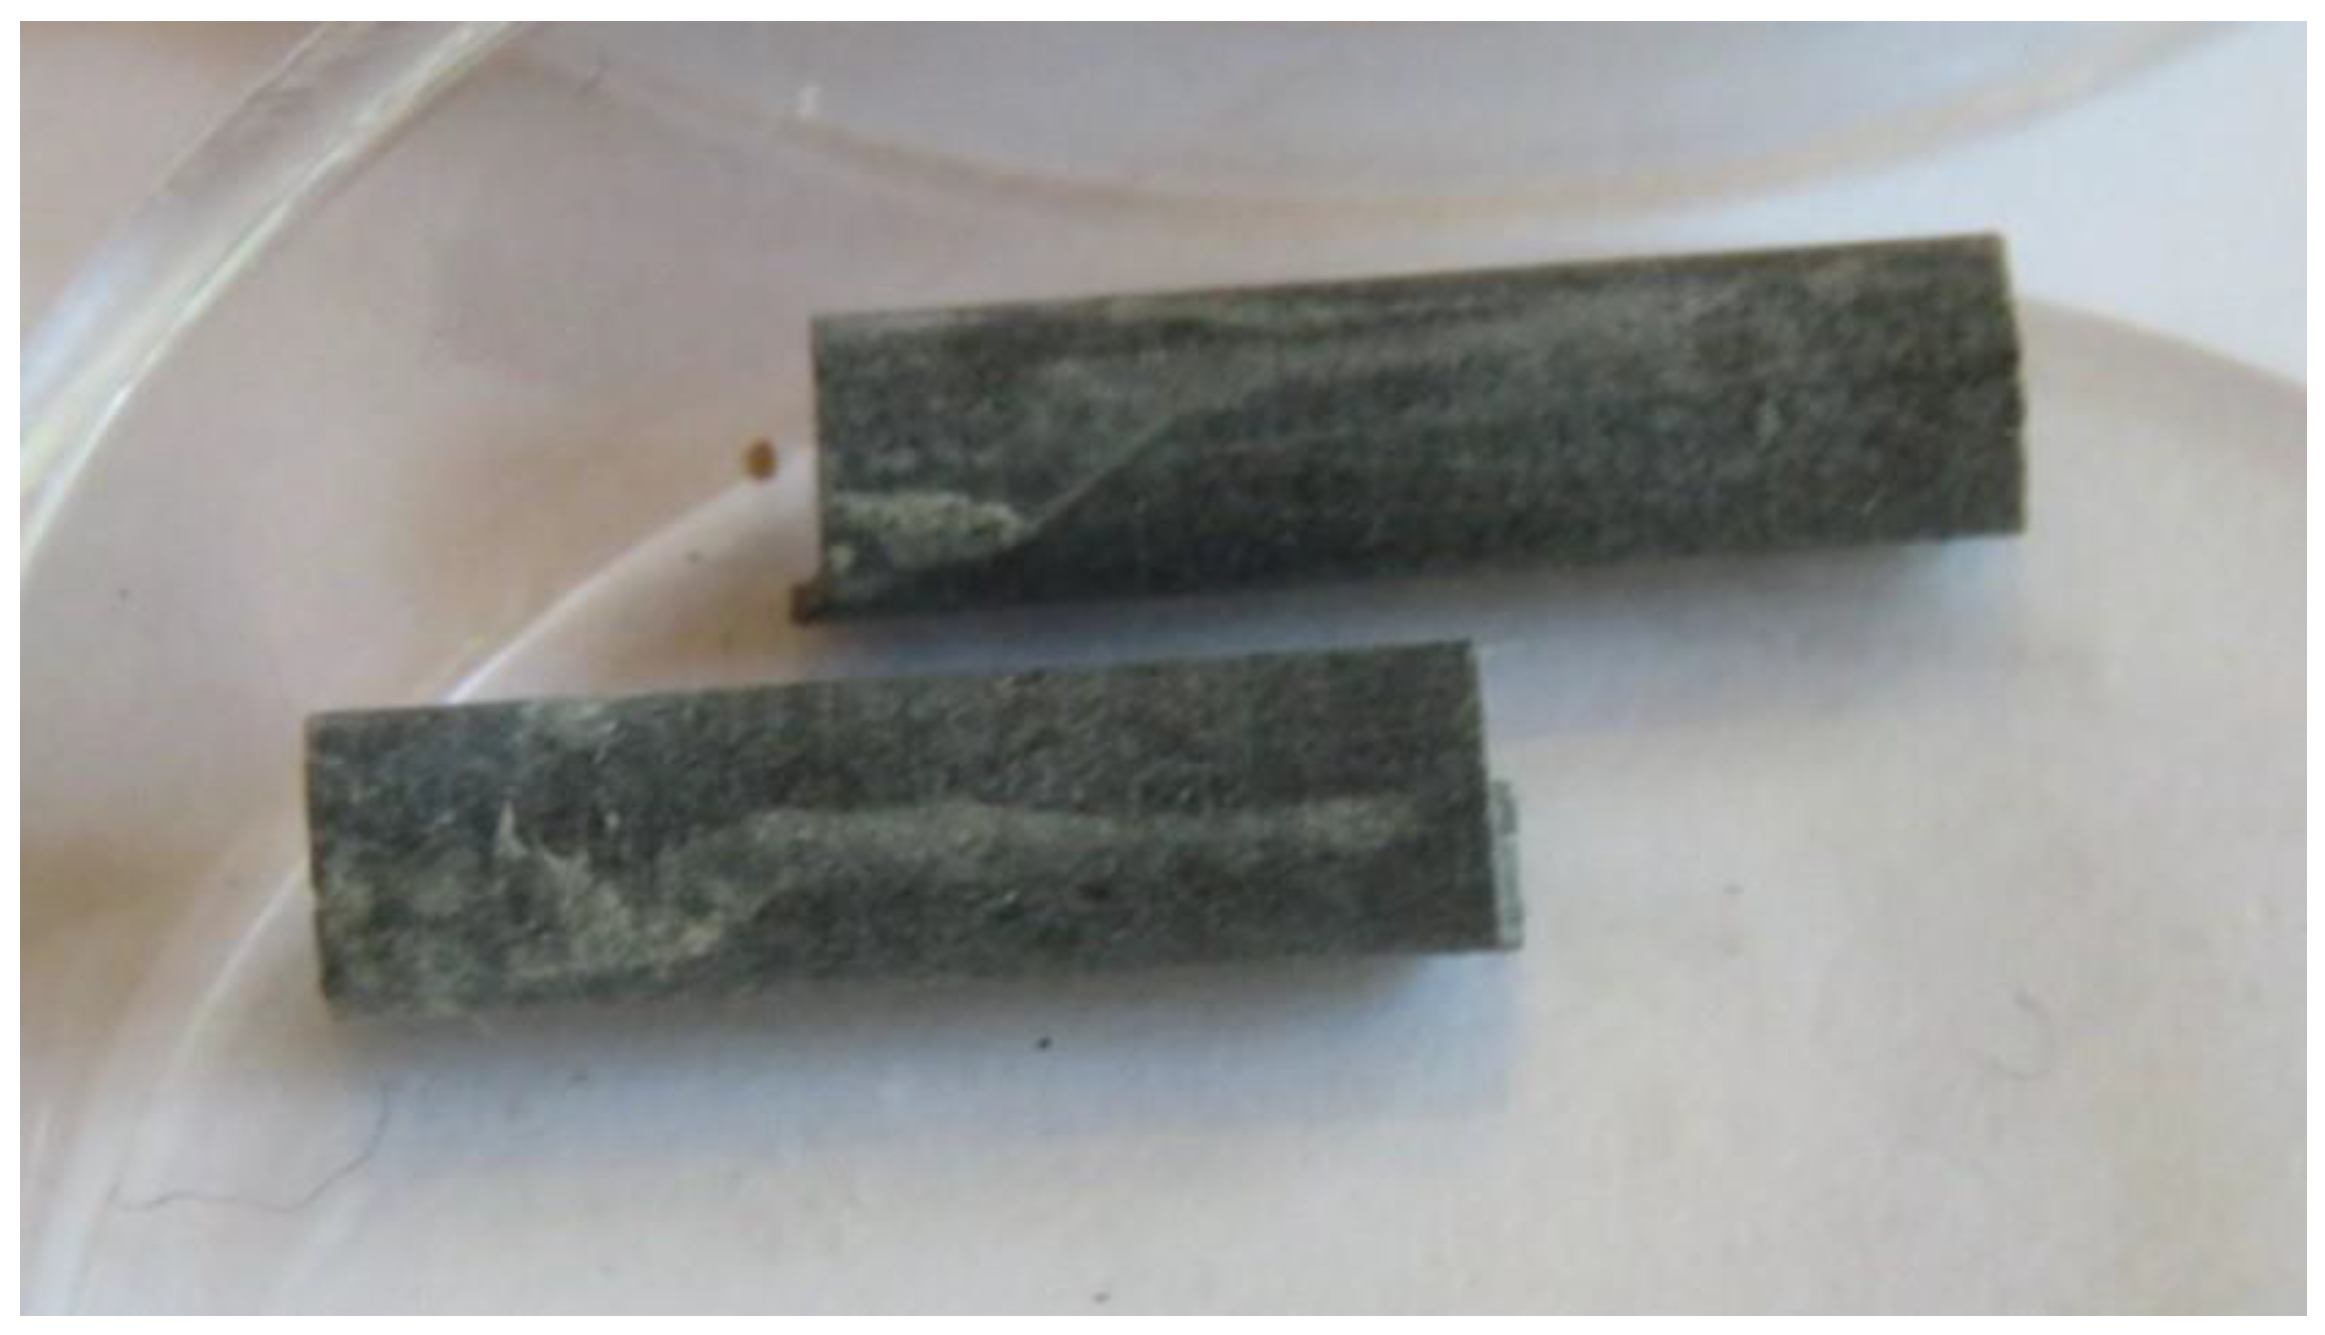
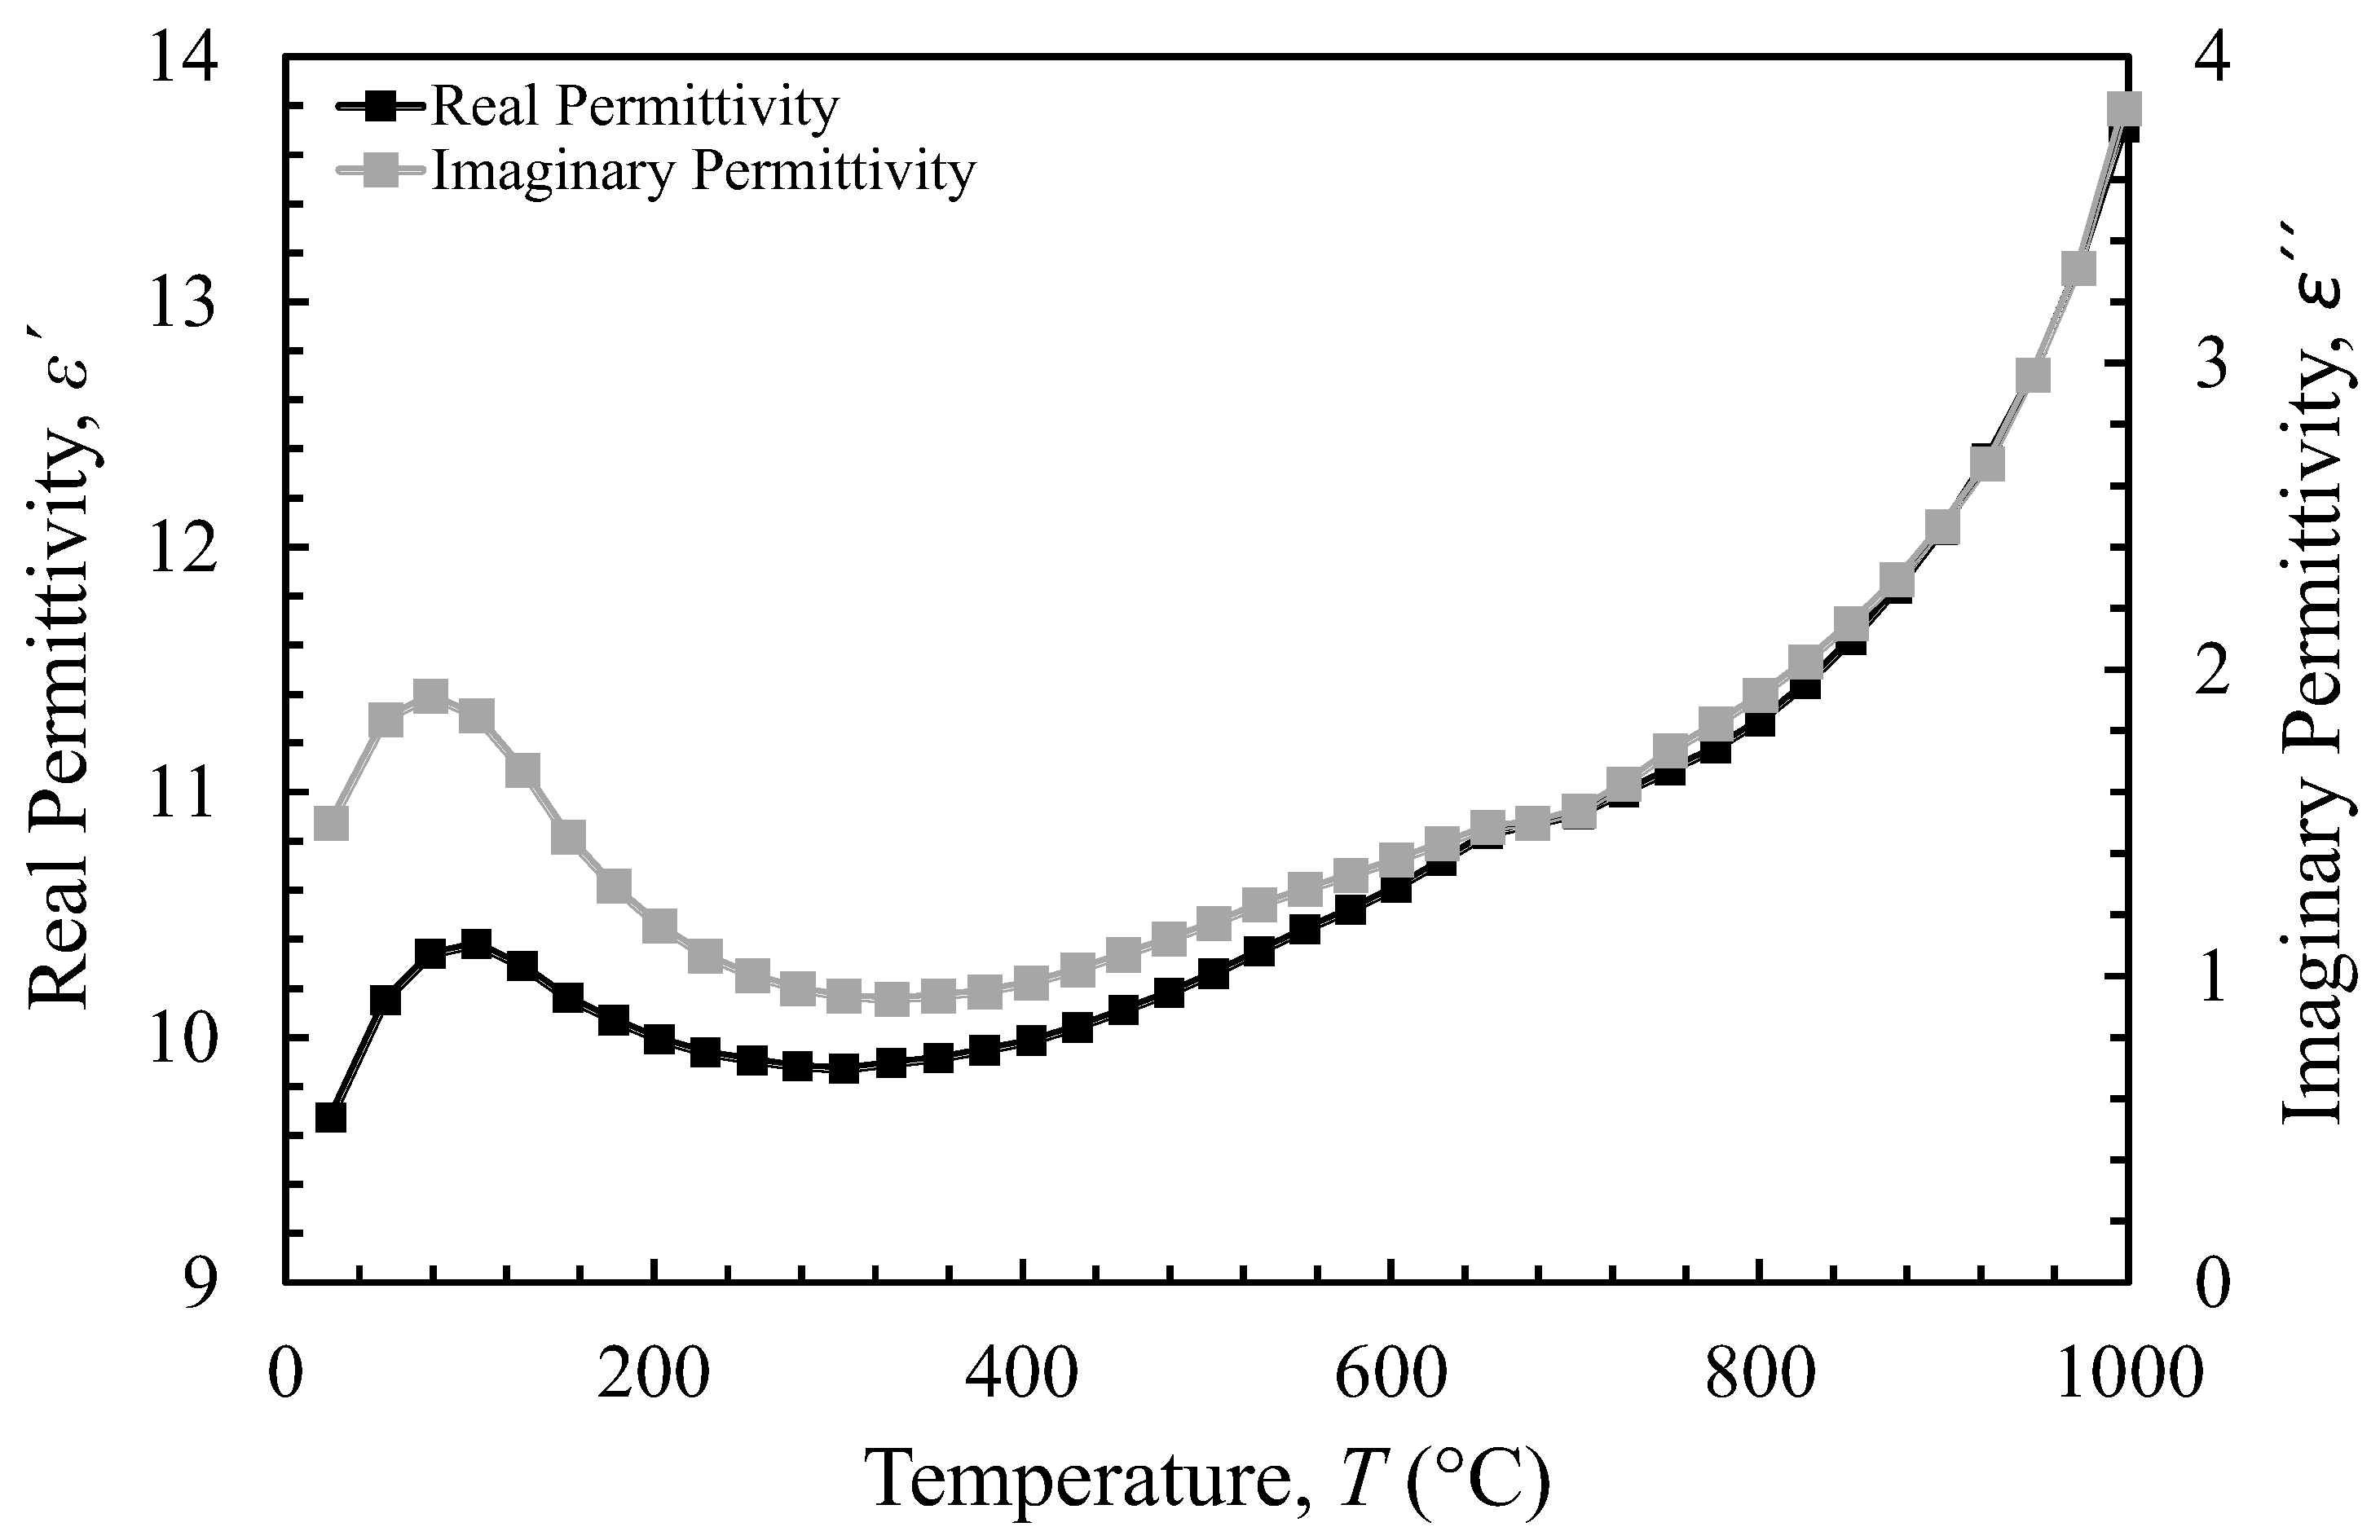
2.1.1. Material Properties

The basalt samples used throughout this study were obtained by crushing a 0.4 × 0.4 × 0.4 m3 block sourced from Chifeng, China. Representative samples were analyzed by X-ray Diffraction (XRD) to determine the mineral compositions of the rocks and their relative abundances. The XRD data were collected using a Bruker D8 Discover diffractometer, with Co Kα source ( λ = 1.5418   ). The measurements were conducted with a step size of 0.01°, covering a 2θ range of 10 to 70° at 0.5 s per step. Results showed that this rock contained considerable proportions of Plagioclase (45.11%), Diopside (17.66%), Olivine (12.15%), Hypersthene (10.33%), and small amounts of Orthoclase (7.39%), Ilmenite (4.52%), Magnetite (1.86%), and Apatite (1.02%) (see also [33,34]). The block was cored and transferred to a laboratory-scale jaw crusher (Sturtevant 2 × 6 Style “F”) feeder. The maximum discharged product size of the crusher was set at 40 mm by adjusting the opening of the crusher chamber. Cores were squeezed between the stationary and moving jaw dies of the crusher until the desired particle size was achieved. Products larger than 31.5 mm and smaller than 6.7 mm were removed from the discharged mass, and the remaining was sieved in a standard Gilson Testing Screen Shaker to determine its overall particle size distribution. Four samples, each weighing 500 g, were prepared with distributions similar to the crusher discharge product (the weight of each size fraction of the samples was less than 5 wt.% of the size fraction for the crusher product). The average particle diameter (d50) of these samples was approximately 17 mm. Table 1 lists the size factions and their weights for each of the samples.
The temperature-dependent dielectric properties of the ore were also measured in the frequency range of 397–2986 MHz up to 1000 °C in a 10 sccm flow of high-purity argon (with oxygen content of approximately 10 ppm). Two tiny test samples were core drilled and cut into 12 mm long cylinders using water as a lubricant (see Figure 1). Samples were subsequently oven-dried for 2 h at 140 °C and cooled down to room temperature. The cavity perturbation method was employed to obtain real and imaginary parts of the relative permittivity of the material at room temperature and then in 25 °C steps up to 1000 °C [35,36]. Figure 2 shows the change in dielectric properties ( ε and ε ) of the material over the entire temperature range at 2.45 GHz microwave frequency. The specifications of the sample before and after the experiment are listed in Table 2. It must be noted that the mass losses of the material at the end of the test were less than 1% and occurred at temperatures higher than 650 °C. This temperature was far beyond the temperature range of the microwave tests carried out in this study.

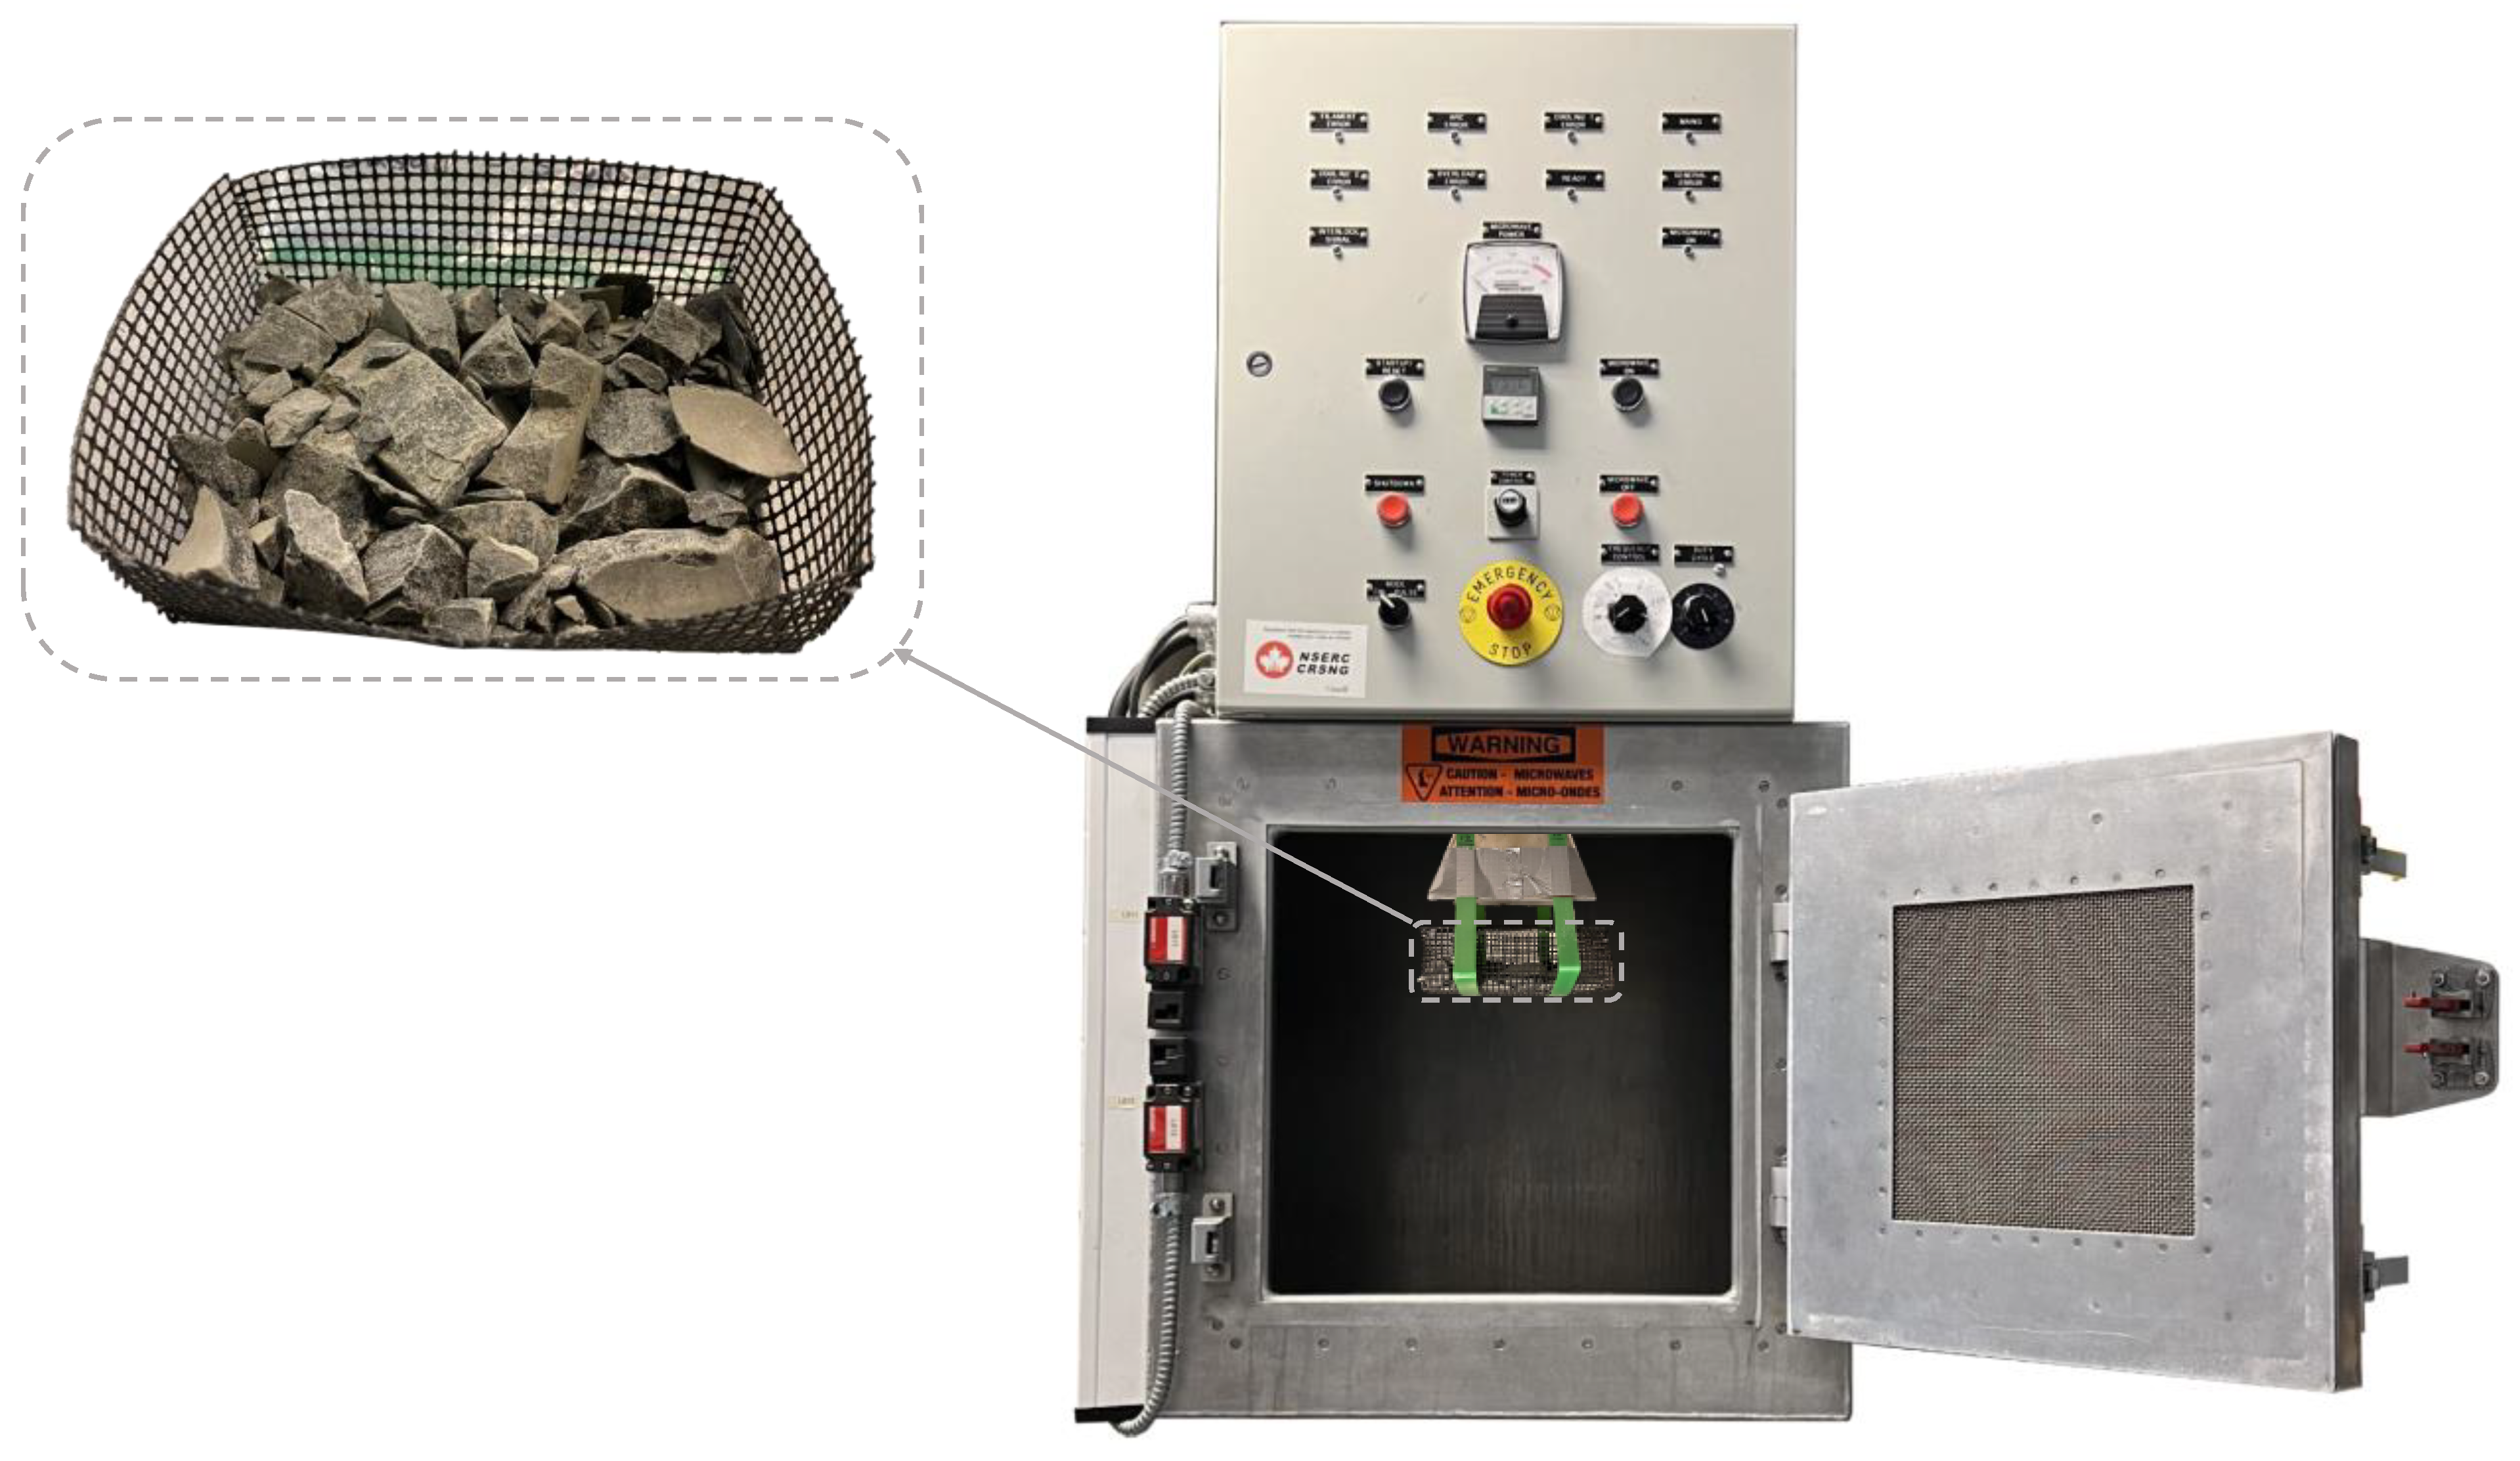
2.1.2. Microwave Treatment

The microwave system used in this research was an industrial cavity that operated at 2.45 GHz frequency. The microwave energy is directed from the magnetron through a metallic waveguide attached to an antenna on top of the cavity. This system was capable of operating at power levels ranging from 0 to 15 kW and had the optional feature of alternating between single-mode and multi-mode outputs by manually switching the antenna. A microwave-transparent container was used to hold the particles at a certain distance from the waveguide. In this experiment, the distance from the bottom of the container to the waveguide was kept fixed at 85 mm, and the samples were exposed to 15 kW microwave power for 5.2 s. The experiment setup is shown in Figure 3.
The energy absorption of the samples due to microwave irradiation was measured by a calorimeter. The samples were transferred to a calorimeter filled with water until thermal equilibrium between ore and the water was reached. It took between 7–10 s after the treatment to take the sample out of the oven, take a thermal image, and transfer it to the calorimeter. This duration hereinafter is referred to as the handling time. The heat over microwave efficiency (HOME) of the system [37] is then calculated using the following ratio:
HOME   ( % ) = Absorbed   Energy Input   Energy × 100

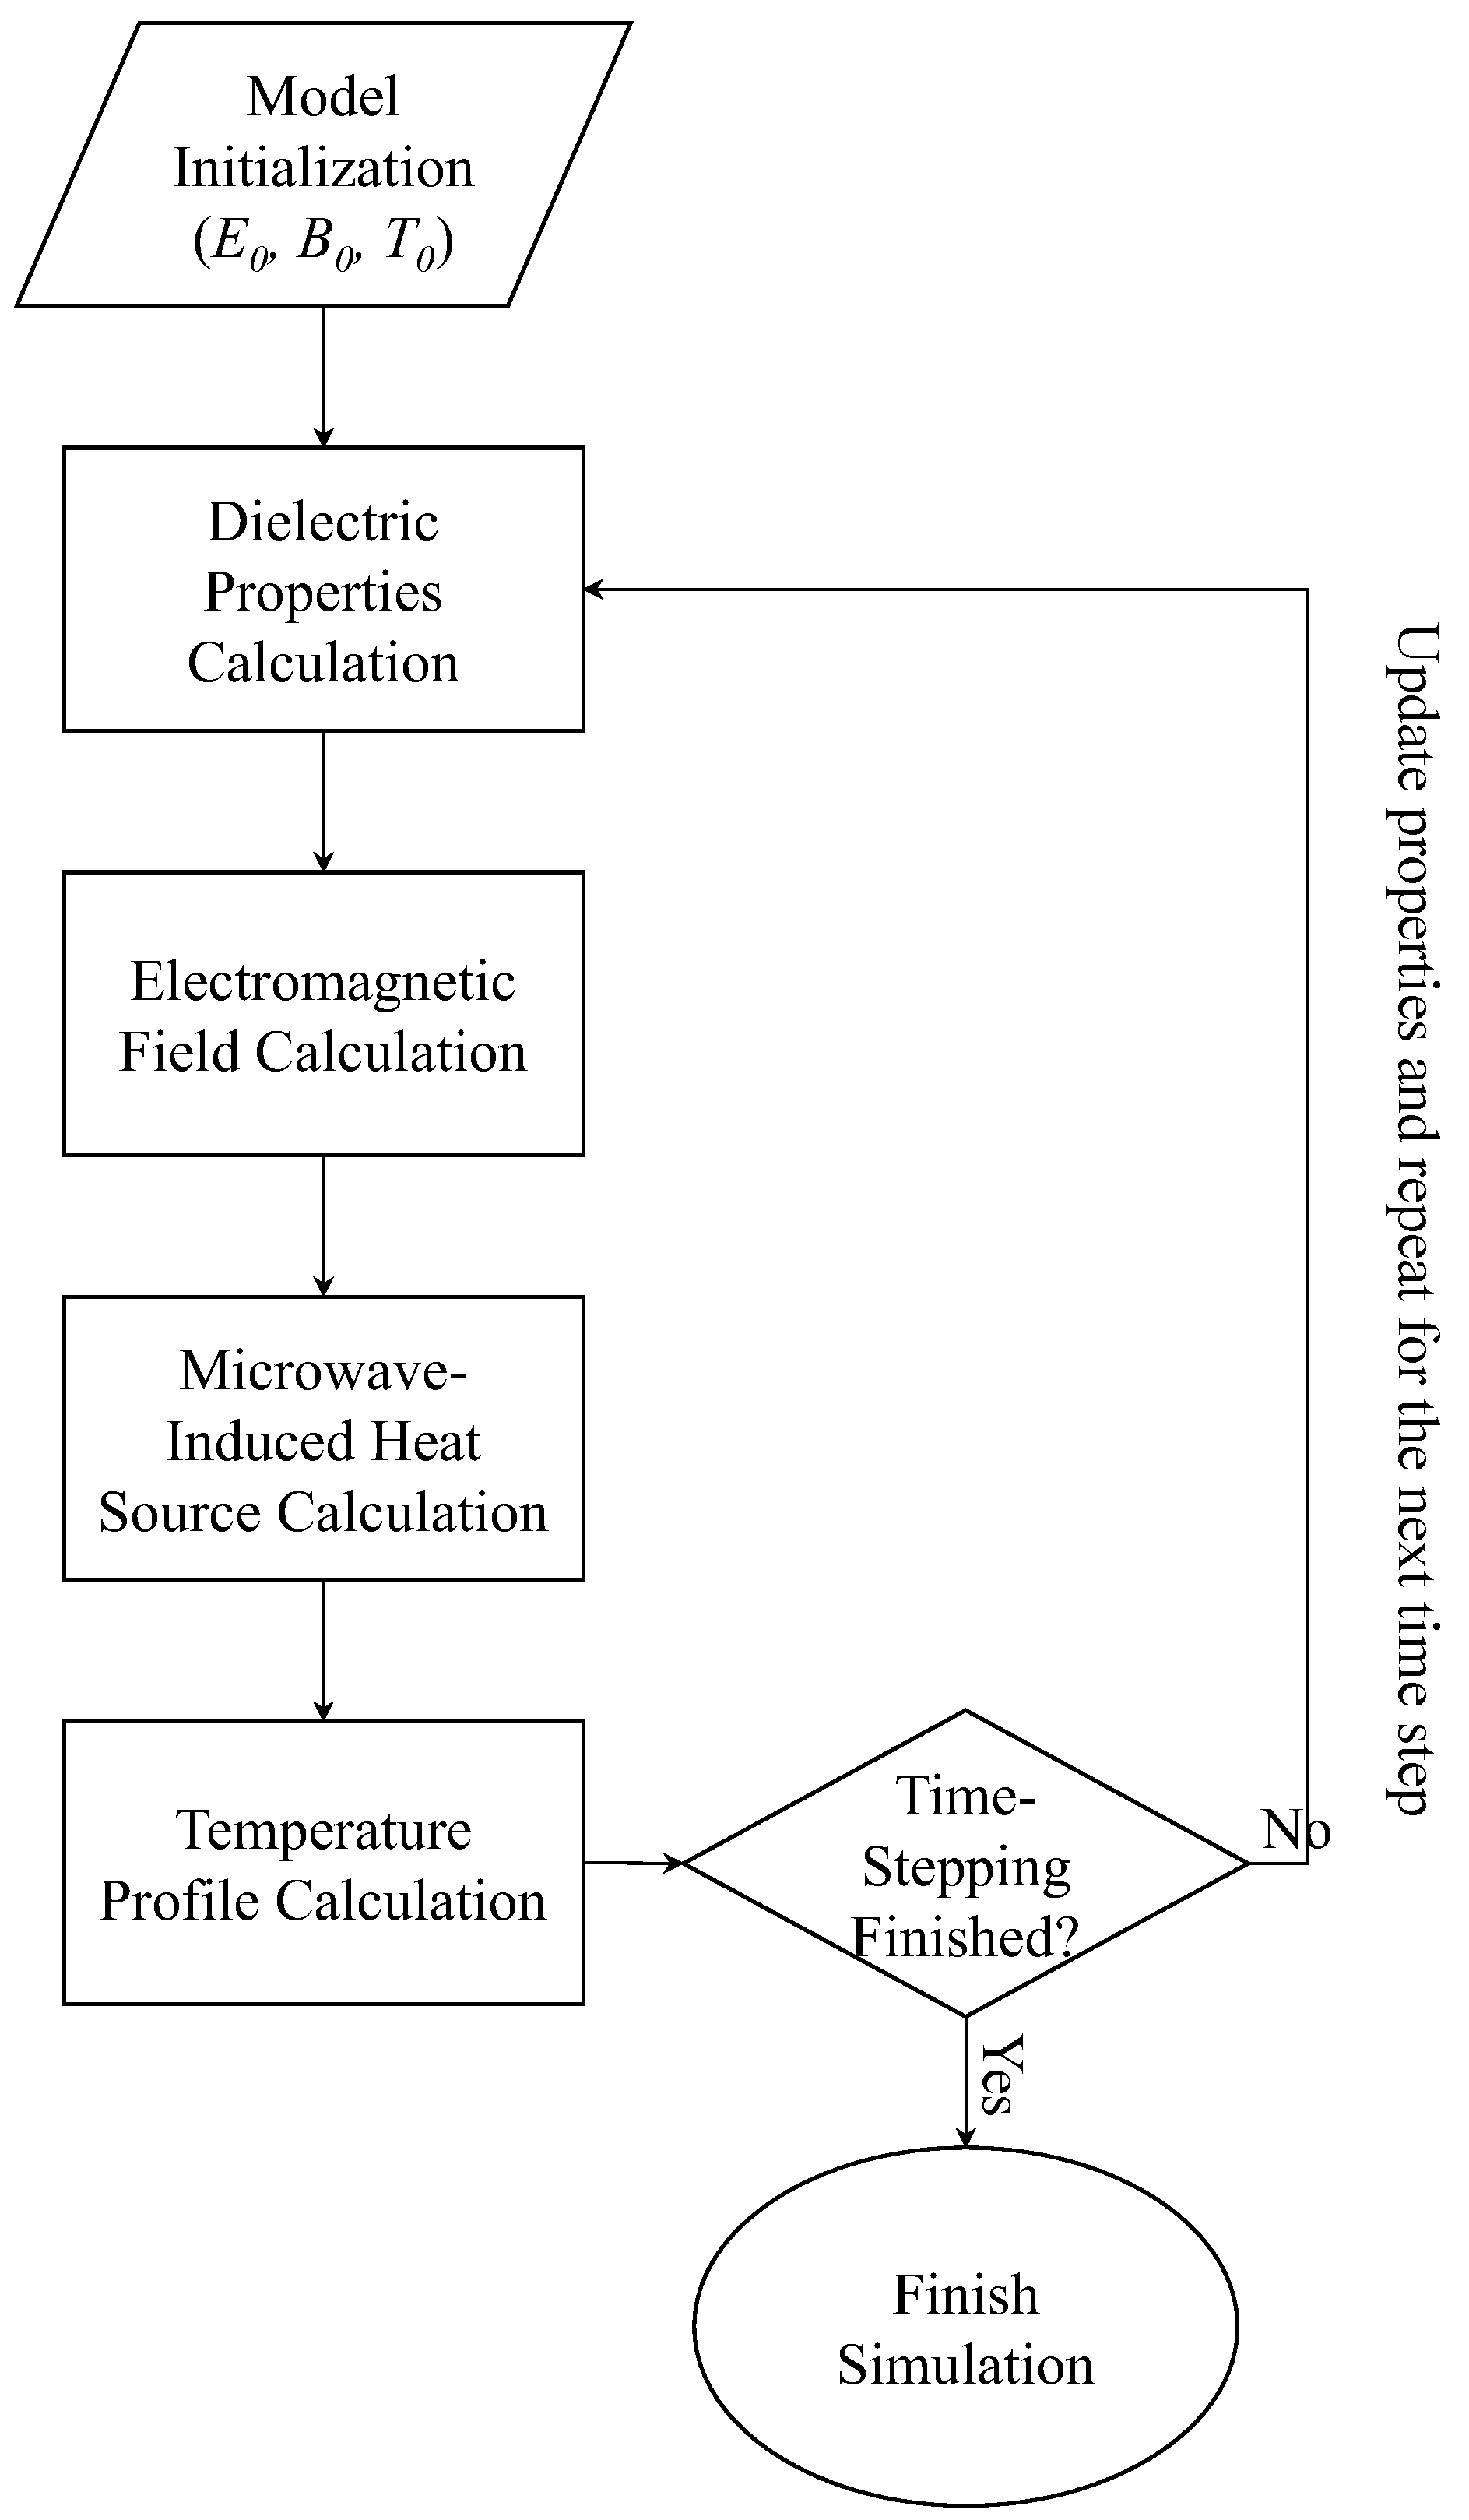
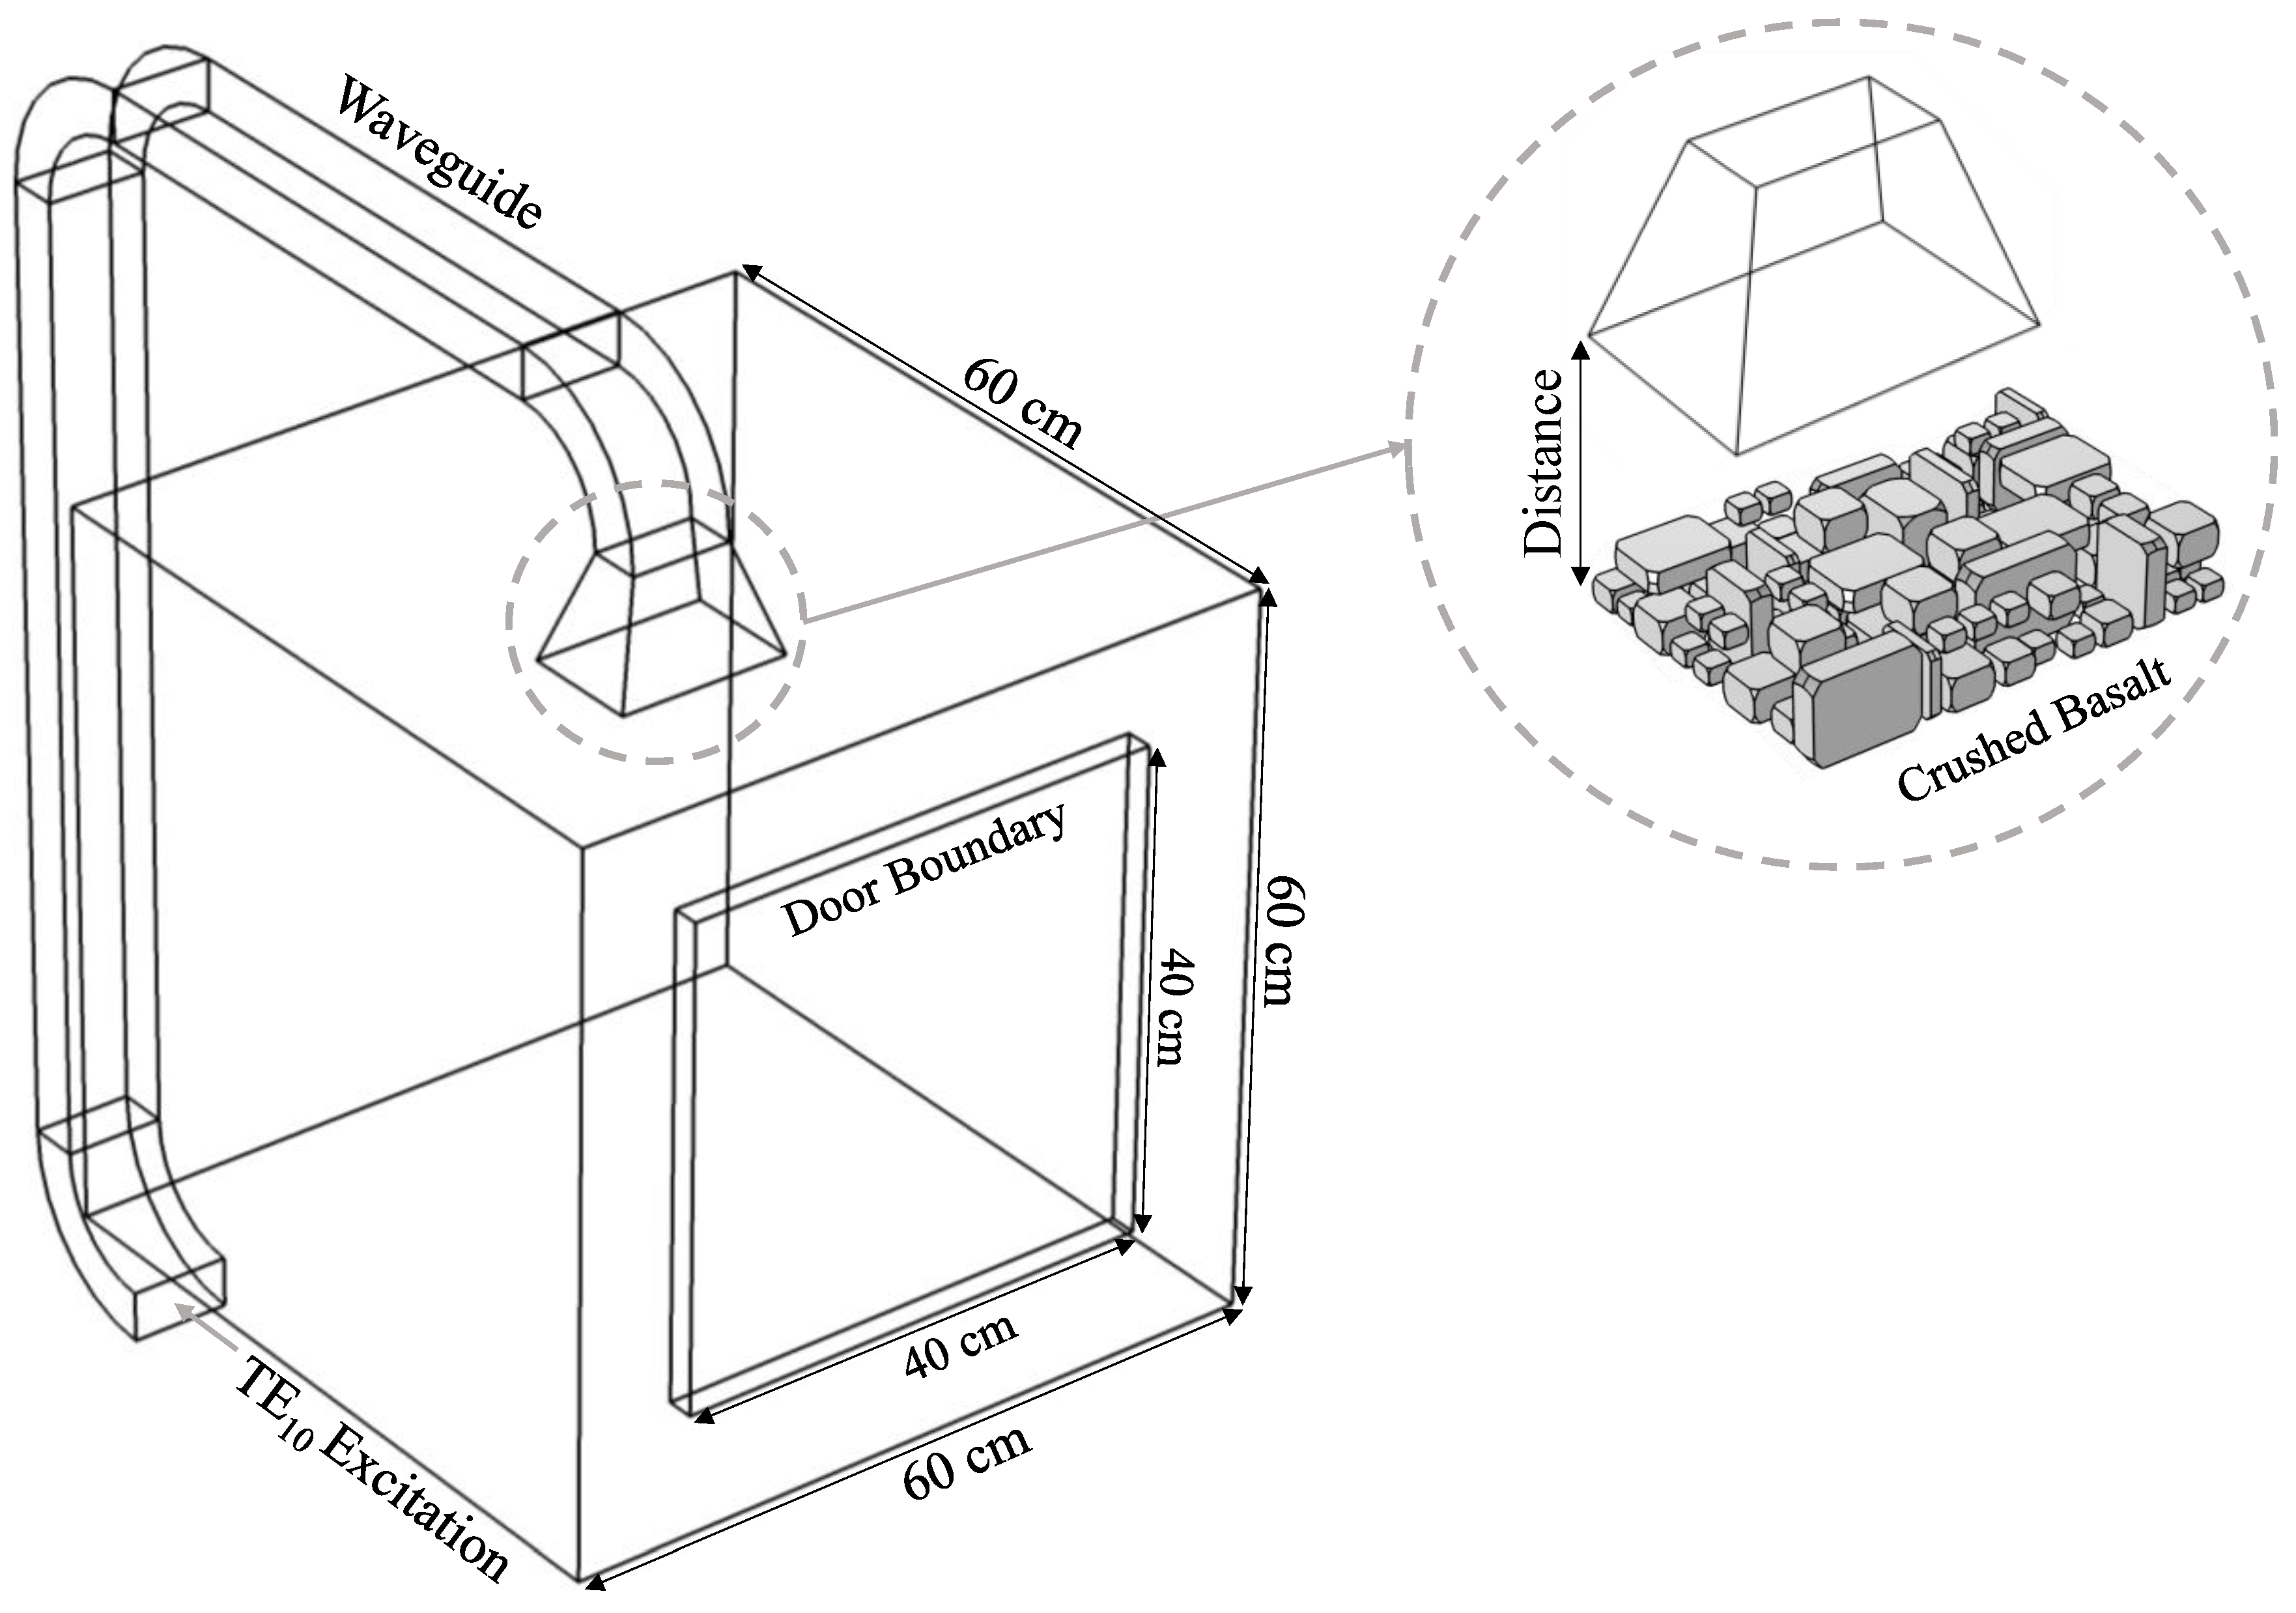
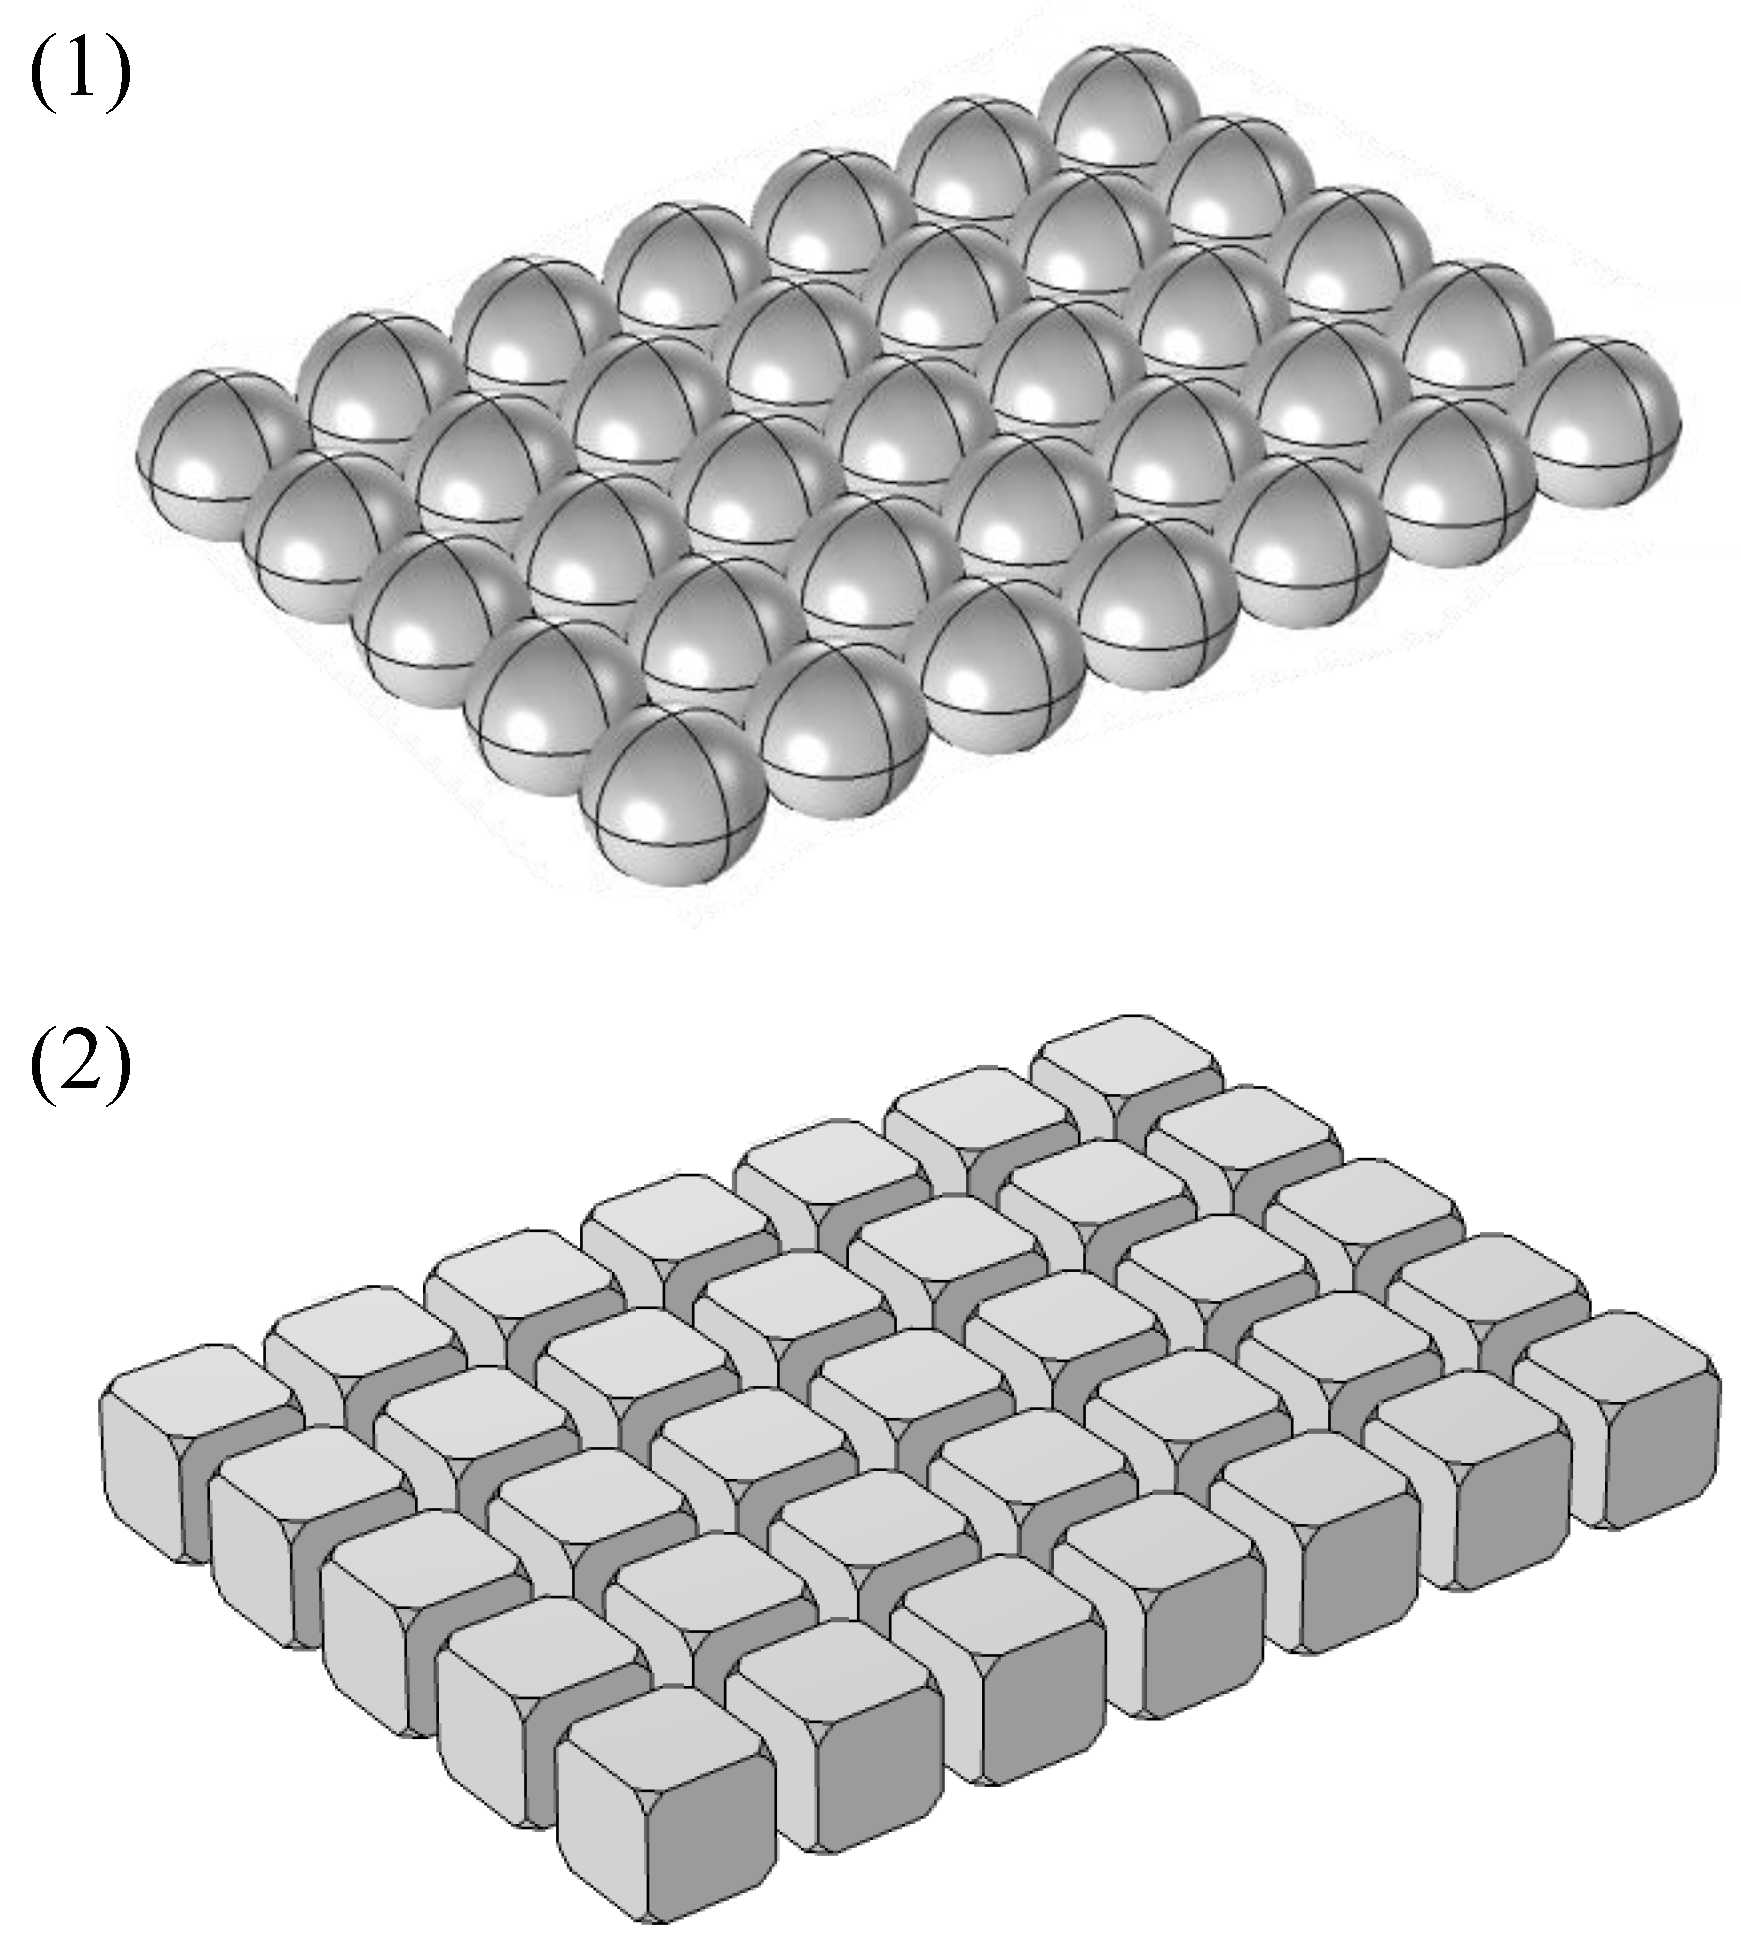
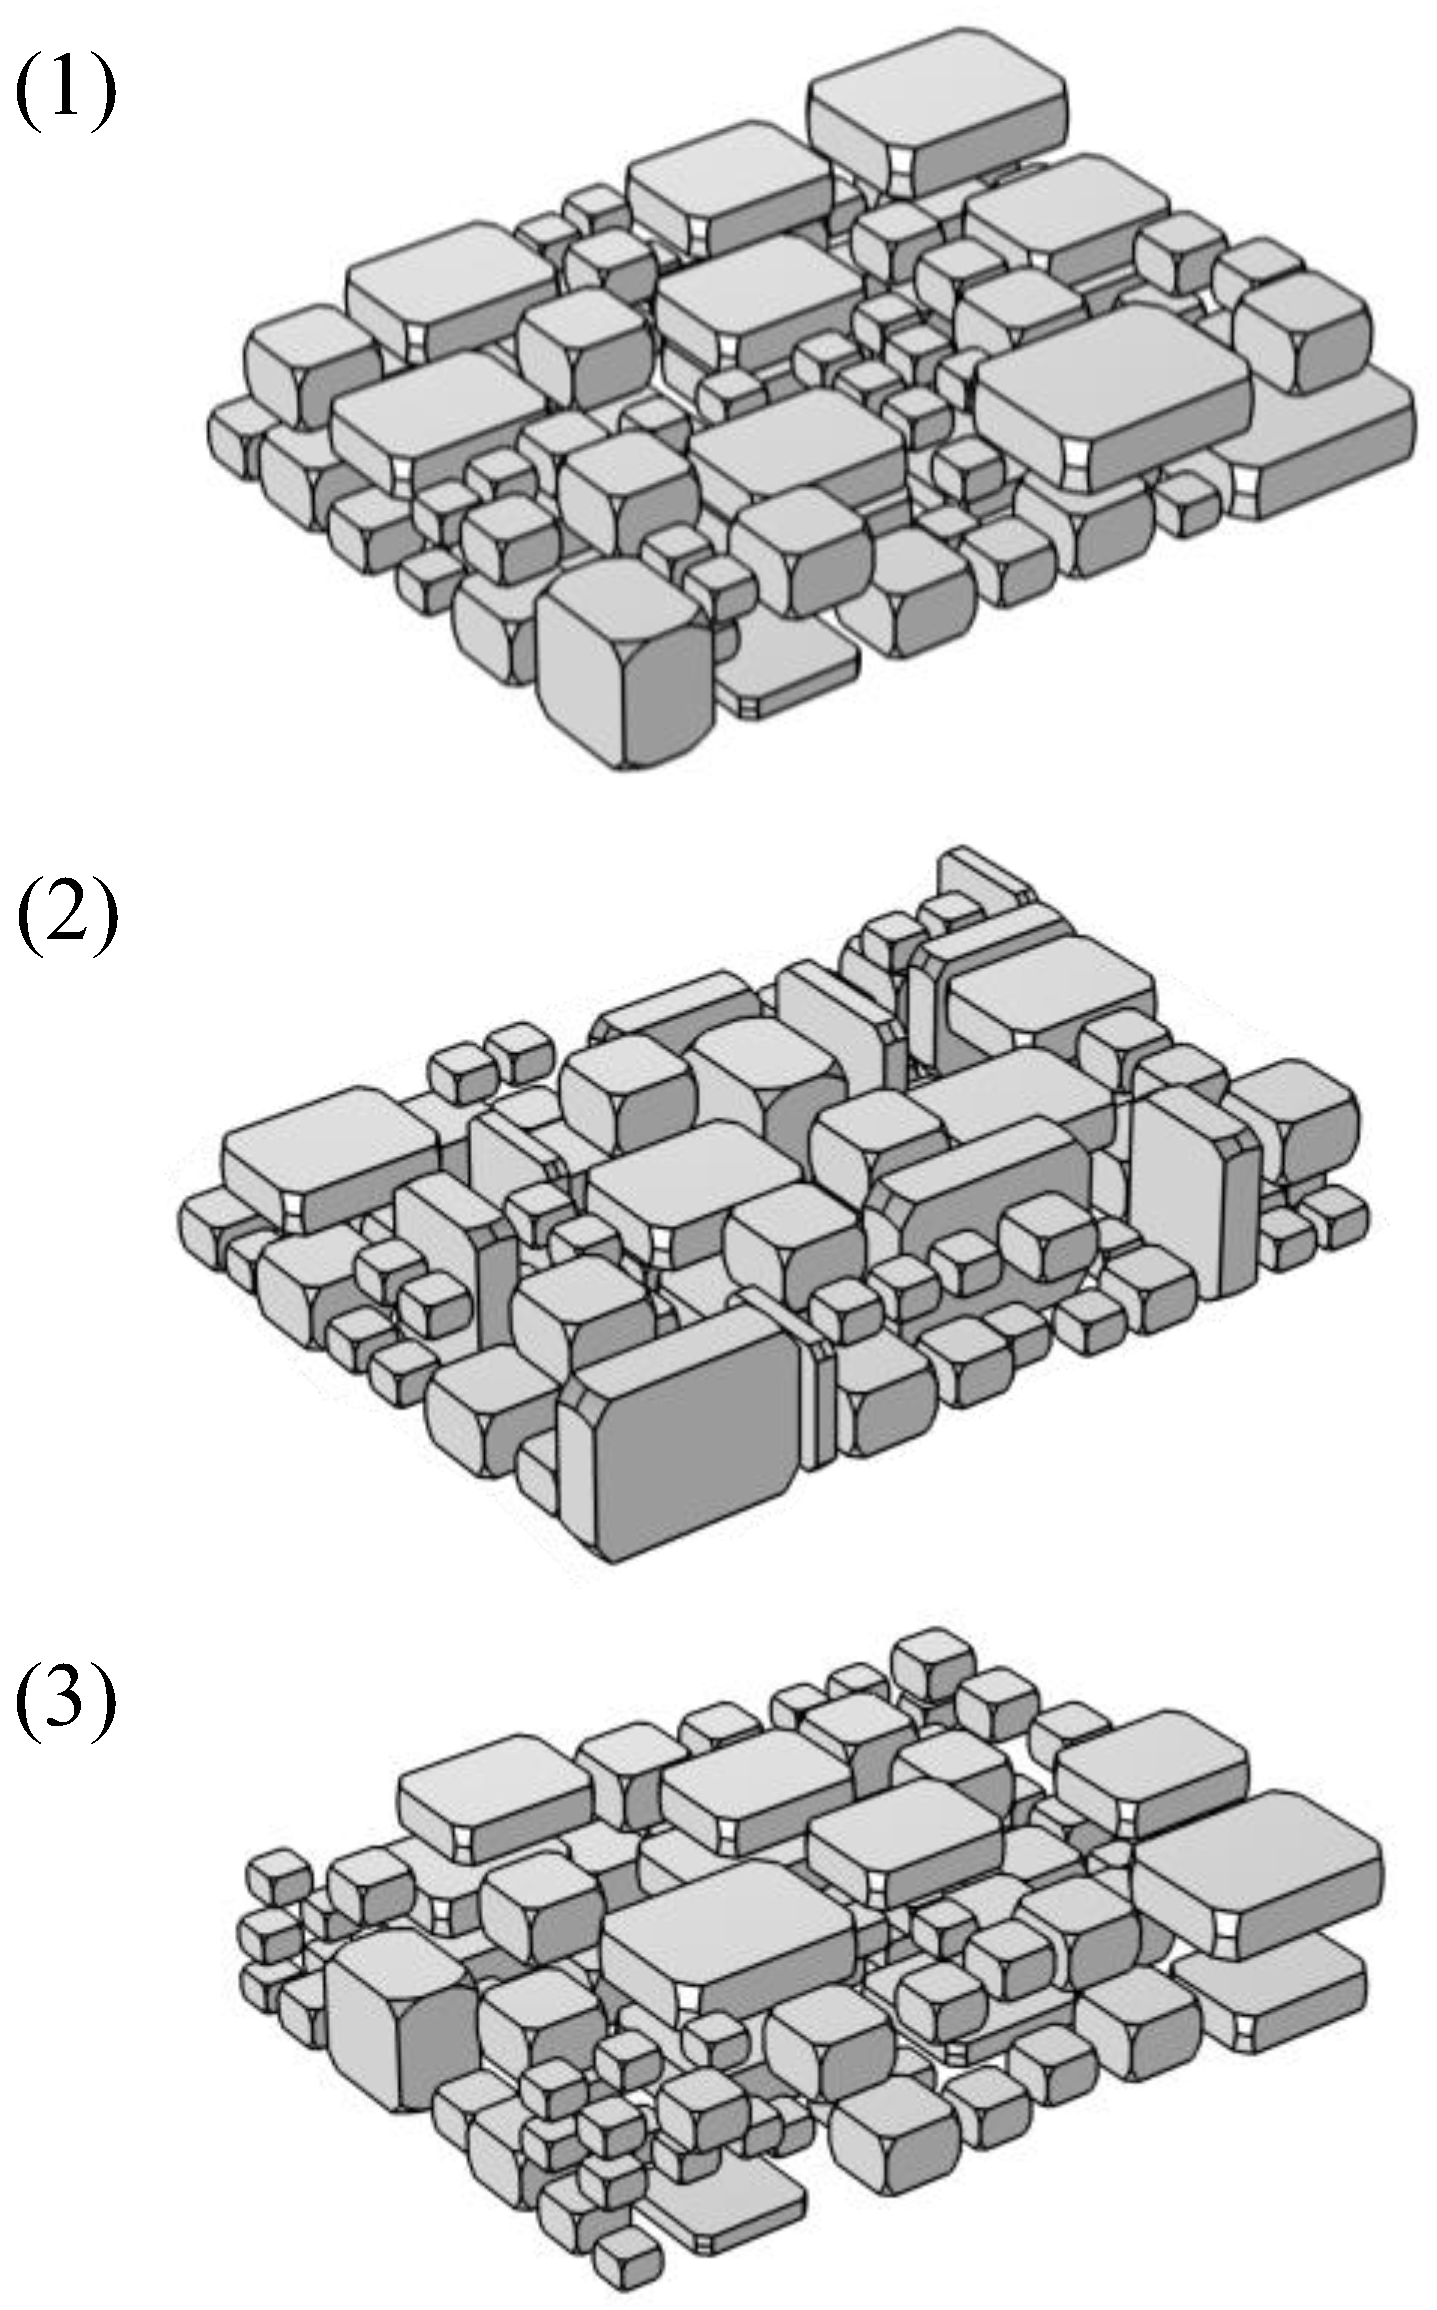
2.2. Numerical Modelling

The numerical solution of Maxwell’s equations along with energy conservation equations were carried out to predict the complex microwave heating behaviour of the crushed samples. Finite elements (FE) method was employed to solve the coupled equations of electromagnetics and heat transfer. In this study, the following fundamental assumptions were made:
  • The domain was source-free;
  • The initial electric field and magnetic flux density were set to zero (E0 and B0);
  • The initial temperature of the samples and cavity before microwave exposure ( T 0 ) was set to 293.15 K (20 °C);
  • The rock/ore was isotropic and homogeneous;
  • The time-harmonic Maxwell’s equations were solved owing to the periodicity of the electromagnetic field (TE10 excitation mode);
  • The waveguide and cavity surfaces were considered perfect electric conductors;
  • Heat dissipation to the encompassing domain was considered by incorporating convective heat transfer boundary conditions.
Solving energy conservation equations was carried out to predict the temperature distributions and the absorbed heats within the microwave-treated rock/ore samples. The governing differential equation for heat transfer in solids could be written as [38]:
ρ C p T t + . ( k T ) = Q
in which ρ is the density of the material, Cp is the heat capacity, k is the thermal conductivity, T is the temperature, Q is the heat source, and t is the time. Faraday’s Law, Maxwell–Ampere Law, and Gauss’s Laws (for the electric and magnetic fields), also known as Maxwell’s equations, were solved simultaneously to predict the electromagnetic field distribution in the domain. These equations could be solved simultaneously to calculate the induced electromagnetic heat source of the heat transfer equation. Equations (3)–(6) represent the mathematical form of Maxwell’s equations [39]:
× E = B t
× B = ε 0 μ 0 E t + μ 0 J
. E = ρ * ε 0
. B = 0
where E is the electric field, B is the magnetic flux density, μ 0 ( = 4 π × 10 7 H / m ) is the free space permeability, ε 0 ( = 8.854 × 10 12 F / m 1 36 π × 10 9 F / m ) is the free space permittivity, J is the electric current density, and ρ *   is the electric charge density. Equations (3)–(6) could be employed to derive a single time-harmonic formulation to predict the electromagnetic field distribution in the cavity:
× ( μ r 1 × E ) k 0 2 ( ε r i σ ω ε 0 ) E = 0
In this equation, μ r is the relative permeability, ε r is the relative permittivity, σ is the electric conductivity, ω is the angular frequency, and k 0 is the free space wavenumber defined as:
k 0 = ( ω 2 ε 0 μ 0 ) 1 / 2
The relative permeability and permittivity of the material can be obtained from the following relations:
μ r = μ μ 0
ε r = ε ε 0
In these equations, μ is the complex permeability of the material, and ε is its complex permittivity. The complex permittivity of the material controls its overall behaviour in the presence of an electromagnetic field. The real part of permittivity ( ε ) dictates how the electric field gets polarized and energy is stored, whereas the imaginary part ( ε ) contributes to energy dissipation through damping the incoming waves. The complex form of permeability and permittivity can be written as:
μ = μ i μ
ε = ε i ε
where μ and ε are the real parts, μ and ε are the imaginary parts of the complex permeability and permittivity, respectively. Equations (7)–(12) can be utilized to calculate the heat source in Equation (2):
Q = ω ε 0 ε r E ¯ 2 + ω μ 0 μ r H ¯ 2
In Equation (13), E ¯ is the electric field intensity, and H ¯ is the magnetic field intensity.
The present study offers a two-way active coupling between the “Electromagnetic” and “Heat Transfer” components of the model. The frequency domain solution was developed for Maxwell’s equations, which is a common practice in FE simulations. The electromagnetic field was calculated for 2.45 GHz frequency, and the results of this study were used to calculate the transient temperature distribution within the particles. The temperature dependency of the dielectric properties ensured an active coupling between electromagnetic waves and heat transfer domains. The heat source in the heat transfer equation was determined through the frequency domain solution of Maxwell’s equations using the dielectric properties at a specific temperature. The temperature profile of each particle was then derived from the solution of the heat transfer equation. Any change in the temperature yielded a change in dielectric properties. Consequently, the new dielectric properties were utilized to update the solution of Maxwell’s equations. The numerical solution procedure is reflected in the flowchart presented in Figure 4.
An accurate—and computationally reasonable—reproduction of the conditions in the experiments is of utmost importance in predicting the electromagnetic response of the treated materials. COMSOL Multiphysics was used here to build a numerical model of microwave treatment of basalt particulate samples in a cavity. The enclosing boundaries of the cavity were replicated with a cube of dimensions equal to 60 × 60 × 60 cm3. A boundary of 40 × 40 × 2.25 cm3 size was incorporated into the model to represent the effects of the oven door on microwave heating. The antenna located at the top of the cavity was also added to the geometry as a horn-shaped surface. The antenna was connected to the generator outside the cavity through the waveguide geometry with a rectangular cross-sectional area of 4.4 × 8.6 cm2. The overall schematic of the numerical model geometry is depicted in Figure 5.
The close domain of the cavity was assumed to be filled with air. The relative permeability and permittivity of the air were set to unity ( μ r ,   a i r = ε r ,   a i r = 1 ). The boundaries of the cavity and the waveguide were considered metallic and, hence, perfect reflectors of the microwaves. The experiments and simulations were conducted on basalt samples, with the properties presented in Table 3.
The importance of maintaining an active coupling between the electromagnetic and thermal aspects of microwave heating problems dictated utilizing temperature-dependent dielectric properties in the numerical model’s development. The dielectric properties of basalt followed the experimental measurements given in Figure 2.
The electric and magnetic fields were initially zero, and a perfect electric conductor boundary condition was imposed on the closing boundaries of the microwave cavity and waveguide. The electromagnetic waves were also introduced to the model by considering a port boundary condition (operating at TE10 mode) at the entrance of the waveguide (see Figure 5). Sufficient details should be introduced to the numerical model to be representative of the test conditions. Over-simplifying the geometry can lead to unrealistic estimates, and over-complication makes the computational cost unaffordable. Various geometries were examined to find the fitting representation for the samples tested in the laboratory. For instance, Figure 6 shows the identical spherical and dice-shaped particles, equalling the d50 of the samples tested in the oven, which were selected as a representing geometry. The predicted heat absorption for spherical and dice-shaped particles resulted in 41% and 27% errors, respectively, as compared with the experimental measurements. Consequently, using an array of identical and same-sized samples, regardless of the shape, will not lead to an adequate reflection on the microwave treatment of the mineral ore samples.
The importance of particle size distribution and its correlation with energy distribution is reflected in different theories. Due to the complex definition of the size of an arbitrarily shaped particle, screens are employed to sieve the particles to the desired particle size distributions in processing applications [41]. The assembly of simulated particles comprised various dice-shaped particles randomly arranged to fit the particle size distribution of the samples tested in the laboratory (Figure 7). The randomness of the actual crushed samples could be reflected by introducing different dimension ratios and fraction sizes for the dice-shaped particles. Figure 8 compares the particle size distribution of the numerical model with the crushed particles tested in the laboratory.
Two different heat loss mechanisms were exercised by imposing convective heat transfer boundary conditions. For the first case, all the particles were cooled using an average convective heat transfer coefficient ( h )—equal to 300 W/m2K, as suggested by Shadi et al. [42]—on all the interior and external surfaces. In the second case, two distinct heat transfer coefficients were assigned for the interior and exterior boundaries, accounting for different convective heat transfers on those surfaces. The interior and exterior boundaries’ heat transfer coefficients were considered equal to 20 W/m2K and 350–450 W/m2K, respectively [43]. Heat loss through radiation was not triggered and hence was neglected due to relatively low surface temperatures (see also [24]).
The discretization of the domain was enforced by implementing tetrahedral elements. Numerical models with minimum element sizes ranging from 0.17 mm to 0.88 mm were developed, and various electromagnetic and heat transfer physics parameters were examined to ensure the mesh independency of the numerical solution. Table 4 presents the microwave-induced resistive loss from the crushed basalt particles. The simulated resistive loss values show less than a 2% difference in the 0.22–0.34 mm minimum mesh size range. Therefore, elements with a minimum mesh size of 0.22 mm were selected to conduct further numerical simulations. Using finer meshes can lead to amplified numerical errors (e.g., truncation errors).

3. Results and Discussion

Heat-induction and thermal stress generations in absorbent materials are the results of resistive losses due to the presences of electromagnetic fields. Several parameters can influence the distribution of electromagnetic fields, including the dielectric properties of the materials, their sizes, shapes, and placements with respect to the waveguide. Figure 9 shows the numerical results for microwave treatment of basalt particulate samples by applying a 300 W/m2K convective heat loss coefficient. Three sets of randomly placed particle assemblies with a distribution similar to the experiments (as in Table 1) were modelled and studied under similar microwave treatment conditions. The haphazard arrangement of the particles was ensured to integrate the randomness of particle placements in the numerical modelling. Variations in HOME with time, as shown in Figure 9, signifies the importance of using temperature-dependent dielectric properties. The effect of dielectric heating outweighs the heat loss in the samples during the first 2 s of microwave treatment. The heat absorption is decreased, as the exposure to microwaves is continued and then carried over during handling time when the treatment is stopped.
As explained in Section 2.1.2, it can take 7–10 s after microwave exposure to transfer the samples to the calorimeter and measure the absorbed heat. The post-exposure handing time range, together with the experimental error, introduce the experimental possibility of occurrence window, marked with the green box in Figure 9. The simulation results for three random arrangements of particles predict a matching behaviour with less than a 9% difference. The simulation results indicate that HOME varies between 37%–45% in the post-exposure handling time for different arrangements of particles. For instance, the numerically predicted HOME values—after 8 s of handling time—are 44%, 43.6%, and 40.2% for arrangements 1, 2, and 3, respectively, which lie perfectly in the 40.45%–44.15% experimentally measured HOME. Figure 9 distinctively exhibits that the numerical estimate for HOME lies in the experimental range, demonstrating the quantitative validity of the developed numerical model.
The averaged heat loss method adopted by Shadi et al. [42] works well on smooth surfaces. Although an averaged heat loss on all particle surfaces offers an accurate prediction of the heat absorption of basalt particulate samples (Figure 9), the actual physical phenomenon occurs in an entirely different manner, and the resulting heat transfer coefficient varies with the cooling fan flow inside the cavity. Furthermore, the exposed surfaces of the particles can be grouped based on the nature of the heat loss they experience. Interior surfaces undergo a considerably lower heat loss compared to their outer surfaces. The exterior surfaces encounter a convective heat transfer to the surrounding environment, as the airflow gets highly turbulent, with numerous vortexes forming due to the uneven and bumpy surface of the assembly of particulate samples. Therefore, the heat transfer coefficient due to heat loss on the interior surfaces is set to a nominal value comparable to natural convection. Considering the texture differences mentioned earlier, the convective heat loss coefficient for the exterior surfaces of the samples is assumed to be higher than the nominal values for flat surfaces, similar to the slab-shaped samples studied by Shadi et al. [42].
Figure 10 and Figure 11 present the numerical results for the samples treated in microwave by applying 350 and 450 W/m2K convective heat loss coefficients on the exterior surfaces of the particles [43]. Similar microwave-exposure behaviours between all three random arrangements can be observed in both cases. The simulation results show that using a convective heat loss coefficient of 350 W/m2K yields a relatively higher HOME compared to the experimental range (Figure 10). The simulation results indicate that HOME varies between 45%–51% in the post-exposure handling time for different arrangements of particles. The closest numerically predicted HOME to the experimental values—i.e., after 10 s of handling time—is 46.94%, 45.43%, and 45.48% for arrangements 1, 2, and 3, respectively, showing 3%–7% error with respect to the experimental measurements. However, increasing the convective heat loss value on external surfaces to 450 W/m2K results in a more realistic and hence quantitatively valid numerical model. After 10 s of handling time, the numerical simulation results showed 43.69%, 42.18%, and 43.05% HOME for arrangements 1, 2, and 3, respectively, which fits impeccably into the experimental range (Figure 11).
Figure 12 compares the temperature distribution of basalt particulate samples right after microwave treatment with the numerical results. The numerical temperature profile was captured assuming 3 s of post-exposure handling time. A similar temperature pattern can be observed in both experimental and numerical results. The maximum temperature measured by the thermal image is 252.7 °C, compared to 259 °C predicted from the numerical model. The similarity was predictable, as heat absorption was used as a quantitative metric to validate the numerical model. The comparison between the experimental and numerical temperature distributions reveals that both profiles show that the temperature rises in larger particles are more evident than in relatively smaller particles. Furthermore, the simulation results show that the particles in the bottom layer experience higher temperature rises, corroborated by the thermal camera temperature measurements. The numerical model reasonably predicts the locations of thermal hotspots, which qualitatively verifies the validity of the simulation results.
Microwave heating can be affected by several parameters, especially sample placement with respect to the waveguide. The optimum distance from the waveguide to treat the samples in a microwave cavity changes with material dielectric properties and geometrical variations [42]. A numerical model validated by experimental measurements can be utilized to predict the best placement for microwave heating of basalt particulate samples. Figure 13 depicts HOME variation in 45–105 mm distances from the waveguide. The simulation results for all the arrangements indicate that 45 mm distance offers relatively better microwave heating than other distances. The average HOME value of arrangements 1, 2, and 3 equals 87.41% at 45 mm distance from the waveguide.
A thought-provoking insight of the numerical modelling results is the effect of particle sizes on microwave-induced heating. Figure 14 shows the temperature rise and microwave-induced heat dosage in various particle sizes after microwave exposure for the three arrangements with a similar particle size distribution. The results highlight the increasing effect of particle sizes on the average heat absorption due to microwave treatment. The random placement of the particles in the generated arrangements have not affected the overall trend in microwave-induced heating. For example, the amount of heat absorbed increased by 32%, 73%, and 34% in arrangements 1, 2, and 3, respectively, when size fractions range changed from [−26.5 +19] to [−31.5 +26.5].
The average temperature rise in particles displays a similar behaviour, growing continuously with the particle size increases. The increasing trend is followed by all three randomly generated arrangements of particles. For instance, the largest particles in arrangements 1, 2, and 3 experience average temperature rises of 181.3, 193.2, and 156.7 °C, respectively. Also, the best microwave heating results are observed in the largest size class of particles in arrangement 2, heated up to an average temperature of 193.23 °C by absorbing 42.86 kWh/t of microwave energy.
Figure 9, Figure 10 and Figure 11 demonstrated that the random rearrangement of the particles yields a similar overall microwave heat absorption in the assembly of particles. However, the particle size and its location in the electromagnetic field govern the extent of microwave heating of that single particle. For instance, one size class increase from [−26.5 +19] to [−31.5 +26.5] results in an intensive HOME increase in particles of arrangement 2. This phenomenon reveals that the larger particles in this arrangement are placed in locations of higher electromagnetic field intensity, increasing their temperature by almost 200 °C. This is a relatively high temperature rise, having in mind that the particles were exposed to microwave energy for only 5.2 s. Furthermore, it can be concluded from the results of Figure 14 that the larger the particle sizes the higher the microwave heat absorption achieved, regardless of the arrangement of the particle. In other words, in microwave treatment of particulate samples, the effect of particle size increase outweighs the benefits of particle placement in the focal points of the electromagnetic field.

4. Conclusions

The primary goal of the present study was to provide an amenable numerical model to predict the heating behaviours of particulate samples under microwave exposure. Microwave treatment of crushed basalt samples was simulated using a finite element model, with an intention to predict the heat absorptions and temperature distributions in the particles. Dice-shaped lumps of different sizes were used to replicate the shapes and particle size distributions of the samples tested in the laboratory. The developed numerical tool was employed to study microwave exposure to a 15-kW power level for 5.2 s. The bi-directional coupling of the electromagnetics and heat transfer processes was ensured by accounting for the temperature dependency of dielectric properties.
The heat loss to the surrounding environment in the model was carried out in two different ways. The first approach assumed an averaged constant convective heat loss coefficient on all particle surfaces. The simulation results yielded 37%–45% HOME values. The alternative approach conducted the simulations by assuming a variable convective heat loss coefficient on the interior and exterior boundaries of particles. The exterior boundaries were cooled down with 350 W/m2K and 450 W/m2K heat transfer coefficients, and 45–47% and 42%–44% HOME values were achieved, respectively. The numerical simulations were quantitatively validated based on experimental investigations on heat over microwave efficiency. The experimental measurements on basalt particulate samples with comparable particle size distributions resulted in 40.45%–44.15% HOME values. Both approaches used for heat loss calculations yielded satisfactory results. The implementation of either approach depends on various parameters, including the geometrical aspect ratios of the particles. The value of the effective heat transfer coefficient can vary significantly and should be selected based on several factors, including the extent of fan airflow over the particles and flow regime characterization.
The temperature distribution of the particles predicted from the numerical model was compared to the thermal camera snapshots of the treated basalt samples immediately after microwave exposure. The simulation results also qualitatively matched the actual behaviours of the materials in the experiments. Both numerical and experimental temperature profiles highlighted better heat absorption values of larger particles. The maximum temperature rises were reported at 252.7 °C and 259 °C for the experiments and numerical simulations.
The fully validated numerical model was employed to do further investigations on microwave exposure of particulate samples, aiming to understand the conditions under which a microwave treatment could be carried out at a higher efficiency. Microwave treatment of particulate samples was simulated at various distances from the waveguide to maximize the HOME value. The particles showed the best microwave heat absorption at 45 mm distance, corresponding to absorbing 87.41% forward microwave energy. Furthermore, the effect of particle sizes on microwave heat absorption was studied. The particles in larger size fractions demonstrated better absorptions on an average basis. The particles in the size range of 26.5–31.5 mm absorbed 42.86 kWh/t of energy, raising their temperatures to an average of 193.23 °C.The numerical results indicated that the randomly arranged particles showed consistent microwave heat absorption values. Although the position of each particle affected its HOME value, the randomness of the arrangements eliminated the particle positioning effect at equal distances from the waveguide. On the other hand, particles with larger d50 values exhibited higher HOME values. Consequently, the best microwave treatment scenario for particulate samples should involve placing the particles of higher d50 values at the optimum distances from the waveguide.

Author Contributions

A.S.: Conceptualization, Formal Analysis, Methodology, Investigation, Software, Validation, Visualization, Writing—Original Draft, Writing—Review and Editing. P.S.: Formal Analysis, Methodology, Investigation, Validation, Writing—Original Draft, Writing—Review and Editing. M.R.: Validation, Writing—Original Draft, Writing—Review and Editing. S.A.G.-M.: Supervision, Conceptualization, Methodology, Visualization, Project administration, Funding acquisition, Investigation, Validation, Formal Analysis, Writing—Original Draft, Writing—Review and Editing. All authors have read and agreed to the published version of the manuscript.

Funding

We would like to express our gratitude to the Natural Sciences and Engineering Research Council of Canada (NSERC) for their financial assistance, as well as to our industrial collaborators DeBeers, Metso, and Argex Titanium Inc. We also appreciate the valuable assistance and contributions provided by the staff, engineers, and geologists from these companies.

Conflicts of Interest

The authors declare no conflict of interest.

References

  1. Lin, B.; Zhu, R. How does market-oriented reform influence the rebound effect of China’s mining industry? Econ. Anal. Policy 2022, 74, 34–44. [Google Scholar] [CrossRef]
  2. Nadolski, S.; Klein, B.; Kumar, A.; Davaanyam, Z. An energy benchmarking model for mineral comminution. Miner. Eng. 2014, 65, 178–186. [Google Scholar] [CrossRef]
  3. Walkiewicz, J.; Kazonich, G.; McGill, S. Microwave heating characteristics of selected minerals and compounds. Miner. Metall. Process. 1988, 5, 39–42. [Google Scholar]
  4. Klein, B.; Wang, C.; Nadolski, S. Energy-Efficient Comminution: Best Practices and Future Research Needs. In Energy Efficiency in the Minerals Industry: Best Practices and Research Directions; Awuah-Offei, K., Ed.; Springer International Publishing: Cham, Switzerland, 2018; pp. 197–211. [Google Scholar]
  5. Rumpf, H. Physical aspects of comminution and new formulation of a law of comminution. Powder Technol. 1973, 7, 145–159. [Google Scholar] [CrossRef]
  6. Fitzgibbon, K.; Veasey, T. Thermally assisted liberation—A review. Miner. Eng. 1990, 3, 181–185. [Google Scholar] [CrossRef]
  7. Pocock, J.; Veasey, T.; Tavares, L.; King, R. The effect of heating and quenching on grinding characteristics of quartzite. Powder Technol. 1998, 95, 137–142. [Google Scholar] [CrossRef]
  8. Whittles, D.; Kingman, S.; Reddish, D. Application of numerical modelling for prediction of the influence of power density on microwave-assisted breakage. Int. J. Miner. Process. 2003, 68, 71–91. [Google Scholar] [CrossRef]
  9. Koleini, S.J.; Barani, K. Microwave Heating Applications in Mineral Processing; InTech: London, UK, 2012. [Google Scholar]
  10. Ford, J.; Pei, D. High temperature chemical processing via microwave absorption. J. Microw. Power 1967, 2, 61–64. [Google Scholar] [CrossRef]
  11. Chen, T.; Dutrizac, J.; Haque, K.; Wyslouzil, W.; Kashyap, S. The relative transparency of minerals to microwave radiation. Can. Metall. Q. 1984, 23, 349–351. [Google Scholar] [CrossRef]
  12. Haque, K.E. Microwave energy for mineral treatment processes—A brief review. Int. J. Miner. Process. 1999, 57, 1–24. [Google Scholar] [CrossRef]
  13. Kingman, S.W.; Jackson, K.; Bradshaw, S.; Rowson, N.; Greenwood, R. An investigation into the influence of microwave treatment on mineral ore comminution. Powder Technol. 2004, 146, 176–184. [Google Scholar] [CrossRef]
  14. Walkiewicz, J.W.; Clark, A.E.; McGill, S.L. Microwave-assisted grinding. IEEE Trans. Ind. Appl. 1991, 27, 239–243. [Google Scholar] [CrossRef]
  15. Tavares, L.; King, R. Effect of Microwave-Induced Damage on Single-Particle Comminution of Ores; Society of Mining Engineers of AIME: Englewood, CO, USA, 1996. [Google Scholar]
  16. Kingman, S.; Corfield, G.; Rowson, N. Effects of microwave radiation upon the mineralogy and magnetic processing of a massive Norwegian ilmenite ore. Magn. Electr. Sep. 1999, 9, 131–148. [Google Scholar] [CrossRef]
  17. Kingman, S.W.; Vorster, W.; Rowson, N. The influence of mineralogy on microwave assisted grinding. Miner. Eng. 2000, 13, 313–327. [Google Scholar] [CrossRef]
  18. Wang, Y.; Forssberg, E.; Svensson, M. Microwave assisted comminution and liberation of minerals. In Mineral Processing on the Verge of the 21st Century; Routledge: London, UK, 2000; pp. 3–9. [Google Scholar]
  19. Jones, D.A.; Kingman, S.; Whittles, D.; Lowndes, I. Understanding microwave assisted breakage. Miner. Eng. 2005, 18, 659–669. [Google Scholar] [CrossRef]
  20. Jones, D.; Kingman, S.; Whittles, D.; Lowndes, I. The influence of microwave energy delivery method on strength reduction in ore samples. Chem. Eng. Process. Process Intensif. 2007, 46, 291–299. [Google Scholar] [CrossRef]
  21. Ali, A.; Bradshaw, S. Bonded-particle modelling of microwave-induced damage in ore particles. Miner. Eng. 2010, 23, 780–790. [Google Scholar] [CrossRef]
  22. Ali, A.; Bradshaw, S. Quantifying damage around grain boundaries in microwave treated ores. Chem. Eng. Process. Process Intensif. 2009, 48, 1566–1573. [Google Scholar] [CrossRef]
  23. Wei, W.; Shao, Z.; Zhang, Y.; Qiao, R.; Gao, J. Fundamentals and applications of microwave energy in rock and concrete processing–A review. Appl. Therm. Eng. 2019, 157, 113751. [Google Scholar] [CrossRef]
  24. Ahmadihosseini, A.; Shadi, A.; Rabiei, M.; Samea, P.; Hassani, F.; Sasmito, A.P. Computational study of microwave heating for rock fragmentation; model development and validation. Int. J. Therm. Sci. 2022, 181, 107746. [Google Scholar] [CrossRef]
  25. Ahmed, H.M.; Ahmadihosseini, A.; Hassani, F.; Hefni, M.A.; Ahmed, H.M.; Saleem, H.A.; Moustafa, E.B.; Sasmito, A.P. Numerical and experimental analyses of rock failure mechanisms due to microwave treatment. J. Rock Mech. Geotech. Eng. 2023, in press. [CrossRef]
  26. Deyab, S.M.; Ahmadihosseini, A.; Rafezi, H.; Hassani, F.; Sasmito, A.P. Investigating Microwave Treatment of Rocks Based on Fracture Mechanics Analysis in Mode I Fracture Toughness Test. Rock Mech. Rock Eng. 2023, 56, 5275–5291. [Google Scholar] [CrossRef]
  27. Toifl, M.; Hartlieb, P.; Meisels, R.; Antretter, T.; Kuchar, F. Numerical study of the influence of irradiation parameters on the microwave-induced stresses in granite. Miner. Eng. 2017, 103, 78–92. [Google Scholar] [CrossRef]
  28. Toifl, M.; Meisels, R.; Hartlieb, P.; Kuchar, F.; Antretter, T. 3D numerical study on microwave induced stresses in inhomogeneous hard rocks. Miner. Eng. 2016, 90, 29–42. [Google Scholar] [CrossRef]
  29. Xue, Y.; Zheng, C.; Dang, F.; Ma, Z.; Gao, J. Numerical simulation of damage and permeability evolution mechanism of coal seam under microwave radiation. Therm. Sci. 2019, 23 Pt A, 1355–1361. [Google Scholar] [CrossRef] [Green Version]
  30. Zhu, J.; Yi, L.; Yang, Z.; Duan, M. Three-dimensional numerical simulation on the thermal response of oil shale subjected to microwave heating. Chem. Eng. J. 2021, 407, 127197. [Google Scholar] [CrossRef]
  31. Xu, T.; He, L.; Zheng, Y.; Zou, X.; Badrkhani, V.; Schillinger, D. Experimental and numerical investigations of microwave-induced damage and fracture formation in rock. J. Therm. Stress. 2020, 44, 513–528. [Google Scholar] [CrossRef]
  32. Ali, A.; Bradshaw, S. Confined particle bed breakage of microwave treated and untreated ores. Miner. Eng. 2011, 24, 1625–1630. [Google Scholar] [CrossRef]
  33. Rabiei, M.; Samea, P.; Shadi, A.; Ghoreishi-Madiseh, S. A Discrete Element Analysis for General Failure Behavior of Basalt. Int. J. Rock Mech. Min. Sci. 2022, 167, 105394. [Google Scholar] [CrossRef]
  34. Lu, G.-M.; Li, Y.-H.; Hassani, F.; Zhang, X. The influence of microwave irradiation on thermal properties of main rock-forming minerals. Appl. Therm. Eng. 2017, 112, 1523–1532. [Google Scholar] [CrossRef]
  35. Hutcheon, R.; de Jong, M.; Adams, F. A system for rapid measurements of RF and microwave properties up to 1400 °C. Part 1: Theoritical development of the cavity frequency-shift data analysis equations. J. Microw. Power Electromagn. Energy 1992, 27, 87–92. [Google Scholar] [CrossRef]
  36. Hutcheon, R.; de Jong, M.; Adams, F. A System for Rapid Measurements of RF and Microwave Properties Up to 1400 °C. Part 2: Description of Apparatus, Data Collection Techniques and Measurements on Selected Materials. J. Microw. Power Electromagn. Energy 1992, 27, 93–102. [Google Scholar] [CrossRef]
  37. Hassani, F.; Shadi, A.; Rafezi, H.; Sasmito, A.P.; Ghoreishi-Madiseh, S.A. Energy analysis of the effectiveness of microwave-assisted fragmentation. Miner. Eng. 2020, 159, 106642. [Google Scholar] [CrossRef]
  38. Ãzisik, M.N. Heat Conduction; John Wiley & Sons: Hoboken, NJ, USA, 1993. [Google Scholar]
  39. Hayt, W.H.; Buck, J.A. Engineering Electromagnetics; McGraw-Hill: New York, NY, USA, 1981; Volume 6. [Google Scholar]
  40. Motlagh, P.N. Physical and Mechanical Properties of Rocks Exposed to Microwave Irradiation: Potential Application to Tunnel Boring; McGill University: Montreal, QC, Canada, 2015. [Google Scholar]
  41. Gupta, A.; Yan, D.S. Mineral Processing Design and Operations: An Introduction; Elsevier: Amsterdam, The Netherlands, 2016. [Google Scholar]
  42. Shadi, A.; Ahmadihosseini, A.; Rabiei, M.; Samea, P.; Hassani, F.; Sasmito, A.P.; Ghoreishi-Madiseh, S.A. Numerical and experimental analysis of fully coupled electromagnetic and thermal phenomena in microwave heating of rocks. Miner. Eng. 2022, 178, 107406. [Google Scholar] [CrossRef]
  43. Gunn, D. Transfer of heat or mass to particles in fixed and fluidised beds. Int. J. Heat Mass Transf. 1978, 21, 467–476. [Google Scholar] [CrossRef]
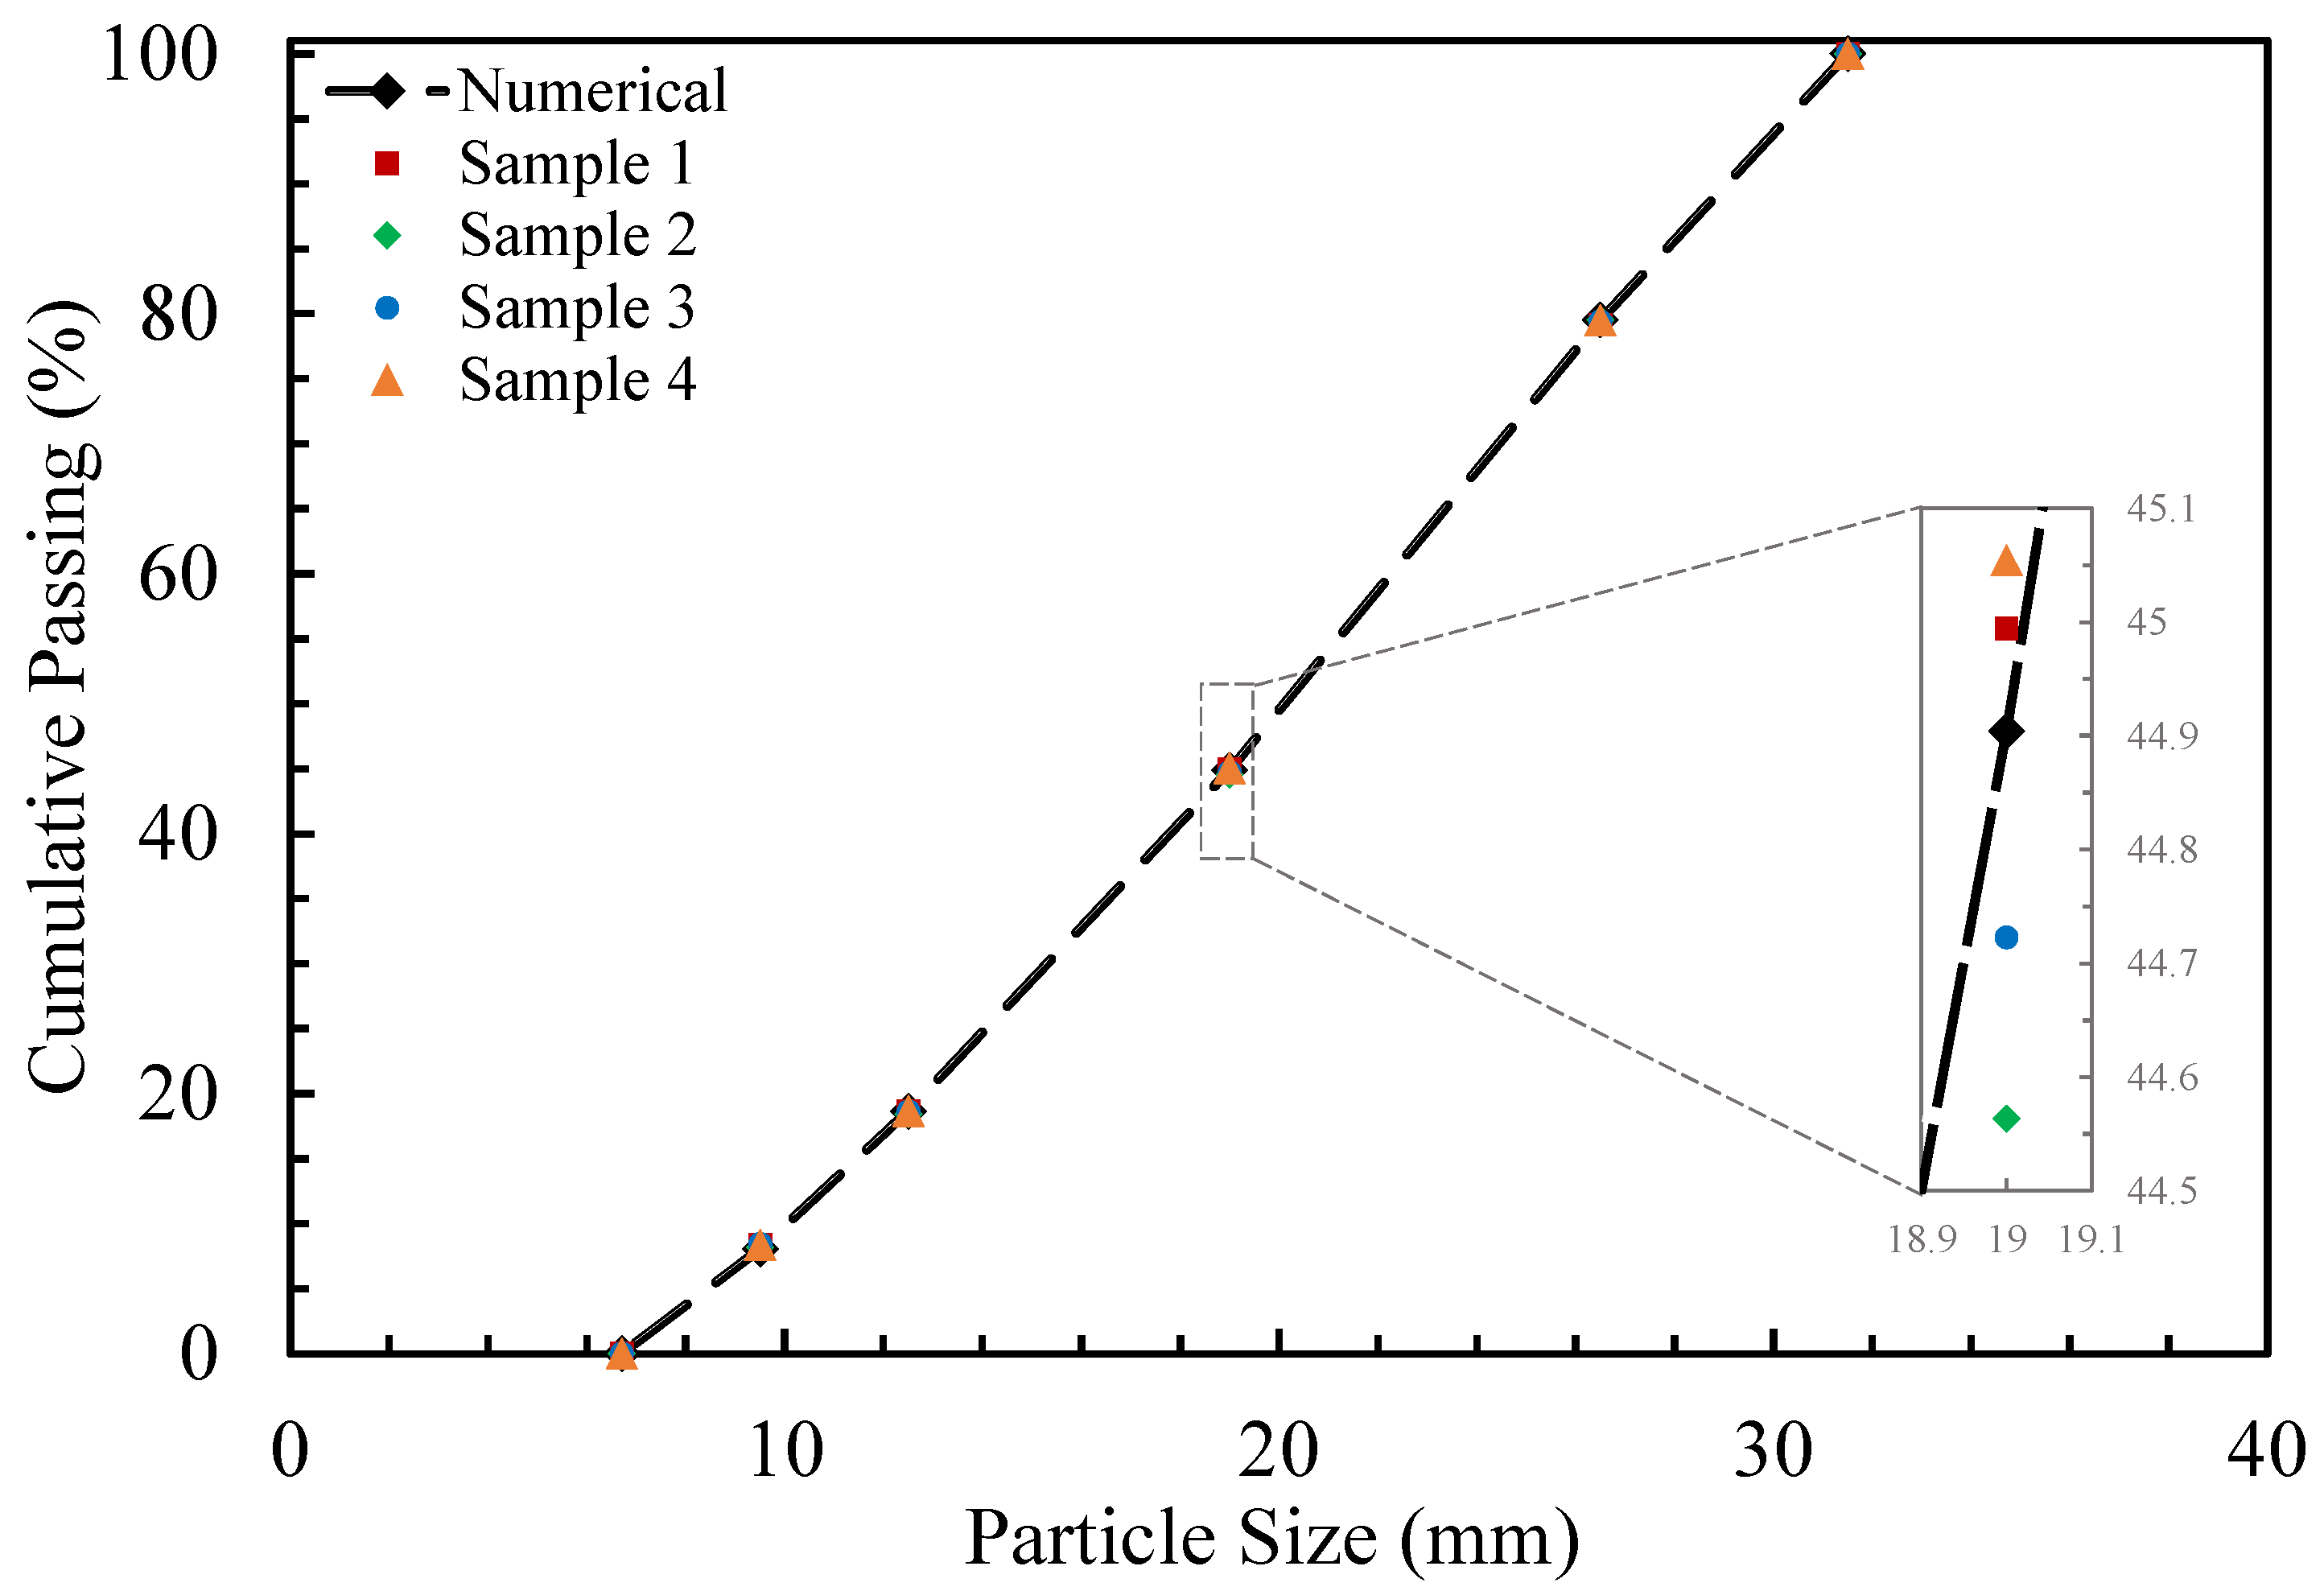
Figure 1. Samples used for dielectric properties measurements.
Minerals 13 00924 g001
Figure 2. Temperature-dependent dielectric properties of basalt at microwave frequency of 2.45 GHz.
Minerals 13 00924 g002
Figure 3. The microwave system used in this study and the position of the sample in the cavity.
Minerals 13 00924 g003
Figure 4. The flowchart of the numerical solution.
Minerals 13 00924 g004
Figure 5. The schematic of the experimental geometry reconstruction in the numerical simulations.
Minerals 13 00924 g005
Figure 6. (1) Spherical and (2) dice-shaped geometries used in numerical modelling.
Minerals 13 00924 g006
Figure 7. Random arrangements (Arrangement (13)) of simulated assembly of particles with the same particle size distribution.
Minerals 13 00924 g007
Figure 8. Particle size distribution of the simulated assembly vs. the crushed particles tested in the laboratory.
Minerals 13 00924 g008
Figure 9. Numerical results by considering an average convective heat loss coefficient of 300 W/m2K on all surfaces of the particles.
Minerals 13 00924 g009
Figure 10. Numerical results by considering a convective heat loss coefficient of 350 W/m2K specified on the exterior surfaces of the samples.
Minerals 13 00924 g010
Figure 11. Numerical results by considering a convective heat loss coefficient of 450 W/m2K specified on the exterior surfaces of the samples.
Minerals 13 00924 g011
Figure 12. Comparison between the temperature profile measured by thermal imaging camera and the results from numerical simulations.
Minerals 13 00924 g012
Figure 13. Numerical HOME values at various distances from the waveguide.
Minerals 13 00924 g013
Figure 14. Absorbed heat and temperature rise variation for different size classes of particles.
Minerals 13 00924 g014
Table 1. Weight proportion for each size fraction.
Size Fraction (mm)Weight (wt.%)
Sample 1Sample 2Sample 3Sample 4
−31.5 +26.520.8220.4520.5820.49
−26.5 +19.034.1934.9934.7034.45
−19.0 +12.526.3626.1226.0926.40
−12.5 +9.510.2610.2610.1910.30
−9.5 +6.78.378.188.448.36
Table 2. Specifications of the samples tested for dielectric properties before and after measurements.
Diameter (mm)Length
(mm)
Mass
(g)
Room Temperature Density (g/cc)
Initial values3.23 ± 0.0512.69 ± 0.100.299 ± 0.0022.88 ± 0.10
Final values3.23 ± 0.0512.66 ± 0.100.296 ± 0.0022.85 ± 0.10
Table 3. Thermal and electromagnetic properties of basalt [40].
PropertyValue
Thermal conductivity, k [W/m °C]1.59
Density, ρ [kg/m3]2870
Heat capacity, C p [J/kg °C]798
Relative permeability, μ r [1]1
Electrical conductivity, σ [S/m]0.00005
Table 4. Resistive loss values for different element sizes.
Mesh Size (mm)Resistive Loss (W)
0.888850.3
0.5311,325.3
0.3410,785.2
0.2510,908.9
0.2211,015.7
0.1710,503.4
Disclaimer/Publisher’s Note: The statements, opinions and data contained in all publications are solely those of the individual author(s) and contributor(s) and not of MDPI and/or the editor(s). MDPI and/or the editor(s) disclaim responsibility for any injury to people or property resulting from any ideas, methods, instructions or products referred to in the content.

