Article

Trace Element Characteristics of Pyrite and Arsenopyrite from the Golden Ridge Gold Deposit, New Brunswick, Canada: Implications for Ore Genesis

1
Department of Earth Sciences, University of New Brunswick, Fredericton, NB E3B 5A3, Canada
2
Geological Surveys Branch, New Brunswick Department of Natural Resources and Energy Development, Fredericton, NB E3B 5H1, Canada
*
Author to whom correspondence should be addressed.
Minerals 2023, 13(7), 954; https://doi.org/10.3390/min13070954
Submission received: 14 April 2023 / Revised: 5 July 2023 / Accepted: 14 July 2023 / Published: 17 July 2023

Abstract

:
The Golden Ridge gold deposit is located in southwestern New Brunswick, in the Canadian Appalachians. Gold mineralization is consistently associated with acicular arsenopyrite, and to a lesser degree with pyrite, disseminated in host rocks, sulphide veinlets, quartz-carbonate veins, and the breccia matrix. According to petrographic-based textural differences, four types of pyrite and two types of arsenopyrite are recognized with associated assemblages. Based on SEM-BSE imaging and LA-ICP-MS spot analyses of the different types of pyrites and arsenopyrites, “invisible gold” (solid solution in the crystal lattice of pyrite and arsenopyrite or <100 nm nanoparticles) and micrometer-size inclusions were identified as the main forms of Au. Four syn-gold mineralization pulses of fluid are suggested. The initial hydrothermal fluid, which generated low-grade pyrite (Py-I) enriched in Sb, Pb, Cu, Co, Ni, and Bi, was followed by a second pulse of fluid enriched in arsenic and gold, generating coprecipitated Py-II and Asp-I. The third and fourth pulses were enriched in both arsenic and gold and precipitated Py-III, then coprecipitated Py-IV and Asp-II, which constitute the most important Au depositional episodes. The repeated occurrence of growth zones with Au enrichment in the arsenian pyrites (Py-II, Py-III, and Py-IV) indicate surface growth during metal deposition and disequilibrium crystallization processes.

1. Introduction

The Golden Ridge gold deposit, formerly known as Poplar Mountain, was initially discovered in the 1990s when a series of Au-Ag-As-Hg-Sb-enriched till geochemistry samples collected by the New Brunswick Department of Natural Resources and Energy was further investigated given their anomalous contents [1]. Gold mineralization is principally associated with arsenopyrite and to a lesser degree with pyrite, stibnite, and sphalerite [2]. As no visible gold has been observed, it is thought that gold is contained in arsenopyrite as an ionic substitution or as submicron-sized inclusions [3]. This submicroscopic or “invisible” gold has been identified in a broad range of different geological environments [4,5,6,7,8,9,10,11], and its presence is regarded as economically negative as it impacts the recovery of Au from a mineral processing perspective [12,13,14,15,16,17,18,19]. The classification of the Golden Ridge mineralization is still debated. It has been regarded as a low sulphidation epithermal deposit, based on the presence of quartz-cemented breccia, locally cockscomb textures, with a Au-As-Sb association and the low contents of Cu [20]. Nonetheless, it was later argued that considering the proximity of the Early Devonian Pokiok Batholith and available geochronological data indicating mineralization was coeval with the age of the batholith, the ore-forming fluid had originated from a granitic intrusion. Moreover, due to the presence of a deep-seated granitic intrusion below the Middle Ordovician Poplar Mountain volcanic complex indicated by regional magnetic data and the CO2-rich composition of the ore-forming fluid, mineralization was considered to be mesothermal granite intrusion-related [3,21].
At Golden Ridge, both arsenopyrite and pyrite are the main auriferous phases forming the quartz-sericite assemblage [1,2,3] and therefore can provide insights related to the ore-forming processes, including information about the evolution in gold deposition. However, mineral chemistry studies of these sulphides and their trace elements have not been previously documented at Golden Ridge, and the relationship between Au and other trace elements is still poorly understood. Therefore, in this contribution, geochemical vectors to gold mineralization are ascertained by evaluating the bulk rock chemistry of sericitized host rocks from low-grade to high-grade drill core samples. The paragenetic sequence of the mineralization, mineralogical texture of pyrite and arsenopyrite, and their in situ chemical composition via LA-ICP-MS spot analyses are comprehensively investigated in order to determine the mineralization process and their implications on the mechanism of gold saturation. This study complements the earlier studies of Chi and Watters [2] and Chi et al. [3] who focused on detailed petrographic work based on field and drill core observations followed by geochemical analysis of the different rock units, U-Pb and 40Ar-39Ar geochronology that attempted to constrain the age of the mineralization, and fluid inclusion and carbon and oxygen isotope analyses to characterize the mineralizing fluids. The significance of this study, which includes drill core material not studied previously, is the analysis of new bulk geochemical data and trace element compositions of arsenopyrite and pyrite that will enhance and reevaluate the paragenetic relationship between gold mineralization and sulphides to better understand this mineralizing system.

2. Geological Background

The Canadian Appalachians are a section of the Appalachian-Caledonian accretionary orogen, comprising an assemblage of microcontinental terranes sequentially accreted to Laurentia as a result of the closure of the Iapetus and Rheic oceans [22,23,24]. At first, the Canadian Appalachians were divided into ‘tectonostratigraphic zones’, i.e., Humber, Dunnage, Gander, Avalon, and Meguma, and subzones separated by major crustal-scale faults [25,26]; these initial subdivisions changed as a better understanding was obtained regarding the geological evolution of these zones that encompassed distinct tectonic elements and were separated by major faults [27,28,29]. Currently, the Humber zone refers to the remnants of Laurentia’s Appalachian margin during the Cambrian and Ordovician, and the Dunnage zone groups the remaining fragments of several continental and oceanic arc terranes in the Iapetus Ocean that were subsequently accreted to Laurentia [30]. The Gander, Avalon, and Meguma zones represent peri-Gondwanan (Ganderia, Avalonia, and Meguma) provenance microcontinents also accreted to Laurentia [31,32,33,34]. This sequential accretion of terranes and microcontinents caused multiple collisional events between the Late Cambrian and Late Carboniferous: The Taconic, Penobscot, Salinic, Acadian, Neoacadian, and Alleghanian orogenic cycles [24]. The microcontinent of Ganderia is composed of volcanic terranes that separated from, and were later re-attached to, Ganderia itself during the Penobscot and Salinic orogenic cycles [35]; in the New Brunswick segment of the Appalachians, Ganderia consists of seven terranes: Brookville, New River, Annidale, St. Croix, Miramichi, Elmtree, and Popelogan [36]. The Caledonia terrane represents a segment of Avalonia in southern New Brunswick [37,38,39].
The Poplar Mountain Volcanic Complex includes the Golden Ridge area (Figure 1), in New Brunswick, and is exposed within the southwestern end of the highly deformed sedimentary and volcanic rocks of the Miramichi terrane, which extends from Bathurst in the northeast to Woodstock in the southwest of New Brunswick and consists of the Woodstock Group (Late Cambrian to Early Ordovician) and the conformably overlying Meductic Group (Early Ordovician to Middle Ordovician) [2,3,40,41]. The Cambro-Ordovician Woodstock Group includes quartz-rich sedimentary strata, such as greenschist grade quartzose sandstone and shale, whereas the Ordovician Meductic Group contains felsic, intermediate, and mafic metavolcanic rocks in the lower section and clastic metasedimentary rocks in the upper section [36,40,41,42]. The Miramichi terrane is flanked to the northwest by the Matapedia Basin marked by the Woodstock Fault, and bounded by the Meductic Fault to the southeast, which separates it from the Canterbury Basin. The Matapedia Basin consists of carbonate rocks of the Matapedia Group and clastic sedimentary rocks of the Perham Group [43,44,45,46]. The Canterbury basin is composed of marine clastic and carbonate rocks of the Silurian Perham Group and the overlying Devonian Tobique Group, consisting of shallow marine clastic and volcanic rocks [47]. Several Middle Ordovician and Late Silurian to Middle Devonian age plutons intrude the Miramichi terrane, including the Middle Ordovician Benton Granite [48,49] and the Early to Middle Devonian Pokiok Batholith [50,51].
Both orogenic gold deposits and intrusion-related gold deposits have been identified in southern New Brunswick [21,52,53]. The closest major epithermal deposits to New Brunswick are the Hope Brook deposit and the Au high-sulphidation prospects in the Burin Peninsula both in Newfoundland [54]. At the Golden Ridge (Poplar Mountain) deposit, gold mineralization is hosted in the Poplar Mountain Volcanic Complex (PMVC), proximal to the Woodstock Fault, at the southwest end of the Miramichi Terrane. The PVMC is composed of three principal units: A porphyritic rhyodacite and similar rhyodacitic volcaniclastic rocks, and a mafic volcanic unit [55] (Figure 2). The porphyritic rhyodacite consists of 10% to 30% phenocrysts, primarily plagioclase and K-feldspar, and rarely quartz. The unit is characterized by porphyritic rocks, locally brecciated, containing fragments of porphyritic rhyodacite within a matrix of the same rock type. The rhyodacitic volcaniclastic unit contains heterolithic and monolithic volcanic breccias (Figure 3a), as well as ash tuffs and flows. Local dissemination of ultrafine black pyrobitumen occurs within the breccias (Figure 3c), and locally, a glassy matrix that has also been altered to an assemblage of chlorite and sericite also occurs. The mafic volcanic unit contains dark green to grey massive homogenous basalt and an intercalated subunit of plagioclase crystal tuff and chert. The mafic unit is divided into fine-grained basaltic rocks containing pyroxene, plagioclase, chlorite, titanite, and minor quartz, with occasional mm-size plagioclase phenocrysts, and a very fine-grained unit with amygdules filled with calcite [3]. The mafic unit stratigraphically overlies the felsic units, with the porphyritic rhyodacite interpreted to be a subvolcanic intrusion localized at the center of a volcanic dome and surrounded by rhyodacitic volcaniclastic rocks [2]. The volcanic and subvolcanic rocks exhibit brittle deformation in the form of fracturing and brecciation and generally lack any obvious foliation, present only locally as a preferential orientation of sericite in the deepest section of some drill holes. Extensive fracturing occurs in the porphyritic rocks, which are cut by minor brittle faults, locally filled with mineralized quartz veins and bordered by mineralized quartz-cemented breccia (Figure 3b). Chi et al. [3] performed U-Pb geochronology on zircons recovered from a sample of the porphyritic rhyodacite and obtained two populations clustering around 459 Ma and 390 Ma, defined by 16 grains and 2 grains, respectively.

3. Ore Deposit Geology

Gold mineralization occurs in several zones within the porphyritic rhyodacite and the mafic volcanic unit, predominantly associated with acicular arsenopyrite, occurring both in the phenocrysts and in the groundmass of the porphyritic rhyodacite, and less so with pyrite, which occurs disseminated in host rocks, sulphide veinlets, quartz-carbonate veins, and the breccia matrix [2,3]. There is no evident control of mineralization by individual faults nor structural boundaries between mineralized and non-mineralized areas, although high-density brittle fracturing constitutes a common feature in mineralized zones in combination with quartz-carbonate-sericite veins and quartz-cemented breccias [3]. The NW- and E–W-trending faults reported in the area were identified with the use of ground magnetic data. Subsequent detailed mapping identified subsidiary fractures and slickensides on the fault planes that indicated sinistral strike-slip movements along the NW- and NNW-trending faults and dextral strike-slip movements along the E–W-striking faults [1,3]. Chi and Watters [2] interpreted the orientation of these faults and the movement senses as an indication of being conjugate and related to NW–SE oriented shortening.
There are two main phases of alteration. The first consists of a chlorite–carbonate–quartz (chloritization) assemblage, with local illite and pyrite; the second consists of sericite–carbonate–quartz (sericitization), with minor illite and pyrite [55]. The chlorite–carbonate–quartz alteration occurs in the three principal bedrock units and is best preserved in non-mineralized zones, where chlorite preferentially replaces phenocrysts of hornblende and pyroxene, although it is locally present as cement in some hydrothermal breccias within the porphyritic rhyodacite surrounding the mineralized zones [2]. In mineralized zones, sericite-carbonate-quartz, i.e., sericitization, replaces chlorite-carbonate-quartz, with sericite replacing feldspar phenocrysts, and locally, the rock matrix groundmass with increasing alteration intensity [3].
The orientation of veins and veinlets is highly variable at both the outcrop and drill core scales. The first group consists of black-colored, millimeter- to centimeter-wide veinlets composed of fine-grained iron oxide, carbonate, albite, and quartz-cut chloritized areas. This first group is cut by dark-gray centimeter- to tens-of-centimeter-wide veins composed of microcrystalline quartz that are cut by later quartz-carbonate-sericite veins. Furthermore, many mutually crosscutting veins and veinlets of quartz–carbonate–sericite ± illite ± sulphides in the mineralization zones in the porphyritic rhyodacite overprint the chloritization and the earliest veining stages and, therefore, to a large extent are contemporaneous with sericitization and disseminated sulphide mineralization (Figure 3d) [2,3]. Chi et al. [3] performed 40Ar/39Ar geochronology on sericite, related to gold mineralization, and defined a plateau age of 411 ± 3.7 Ma, which falls within the age of the sequentially assembled and spatially related Pokiok Batholith (402–415 Ma) [50]. The different mineralizing events at the nearby Lake George mine, located along the eastern margin of the Pokiok Batholith, spanned a 4-million-year period, between 417 and 413 Ma. This period includes 40Ar/39Ar geochronology of hydrothermal muscovite from the sericitic alteration envelopes surrounding gold-bearing quartz–carbonate veins that yielded a 40Ar/39Ar plateau segment date of 414.1 ± 1.3 Ma [56]. As part of this contribution, in situ 40Ar/39Ar geochronology on illites from the sericitized porphyritic rocks was undertaken. However, considering the very fine grain sizes of the illite, it was extremely challenging to obtain a representative age, and most analyses produced imprecise data. One age based on a single spot analysis yielded an age of 390.1 ± 8.1 Ma.
The sulphides include arsenopyrite and the dominant sulphide phase, in addition to pyrite, and to a lesser extent, stibnite and sphalerite. No visible gold was found in hand samples, the drill core, or thin sections. The non-metallic minerals are primarily sericite, quartz, and ankerite, with minor illite. The stronger the sericitization, the more enriched the gold mineralization, and the abundance of both arsenopyrite and pyrite increases. The paragenetic relationships in the Golden Ridge deposit have been studied considering physico-chemical conditions, host rock type, and the minerals observed [2,3]. In these evaluations, it was indicated that mineralization is epigenetic. This is consistent with the observations made during this study, although a more detailed sulphide paragenesis is described here. Pre-gold mineralization pyrite (Figure 4a–d) is associated with chloritization of the country rock and occurs as fine-grained (~50–150 μm), anhedral to subhedral grains. Four types of pyrites in the syn-gold stage, Py-I, Py-II, Py-III, and Py-IV, and two types of arsenopyrites, Asp-I and Asp-II, are defined at the Golden Ridge gold deposit. The pyrite (Py-I) represents an early disseminated alteration mineral assemblage that includes pyrite (Py-I), sericite, carbonate, and quartz. It primarily occurs as highly fractured anhedral to subhedral grains (Figure 4e,h,i) with a diameter of several hundred microns to a few micrometers; it has a randomly oriented and inhomogeneous sieve texture infilled with silicates. Py-II occurs as subhedral grains (Figure 4e,g) with a minor sieve texture around the core, with diameters of several hundred microns to one micrometer, and as growth zones of Py-I with variable widths, in areas where small amounts of arsenopyrite occur. Both Py-I and Py-II are concentrated in areas with moderate sericite-ankerite-quartz alteration. Py-III is mid-size (300–800 μm) subhedral grains (Figure 4h–j) with increased microporosity, compared to Py-II, with minute inclusions of gangue minerals and arsenopyrite, also present as overgrowths and fillings in fractures. It is primarily related to quartz-carbonate-sericite veins, disseminated in both the fragments and matrix of breccias in intensely sericitized rocks and is commonly overgrown or rimmed by arsenopyrite. Py-IV (Figure 4k,l) is found in late mm-thick quartz-sericite-sulphide veinlets as aggregates with irregular boundaries and/or agglomerates, occasionally mantled by arsenopyrite or partially to completely replaced by it.
Arsenopyrite commonly occurs as small (200–400 μm) acicular or rhomb-shaped grains (Figure 4e–l), disseminated or dispersed in the host rocks, as inclusions within pyrite, and as intergrown aggregates. Arsenopyrite (Asp-I) is disseminated in host rocks (Figure 4f,g), quartz-carbonate-sericite veins, and breccias, typically acicular and rhomb-shaped. Arsenopyrite (Asp-II) is primarily restricted to late mm-thick sulfide quartz-sericite veinlets with acicular and granular shapes, or partially and locally replacing pyrite (Py-IV) (Figure 4k,l). Py-I is linked to an initial stage of arsenopyrite (Asp-I), sphalerite, and stibnite deposition, in addition to disseminated pyrite (Py-II) as individual grains or as growth/rims in Py-I. Py-III precipitated within veins and in hydrothermal breccias cemented by quartz and carbonates, along with the main stage of arsenopyrite (Asp-I) deposition. Py-IV is found in late, mm-thick quartz-sericite-sulphide (pyrite-arsenopyrite) veinlets that are commonly cut by quartz-carbonate veins that postdate ore deposition (Figure 5).

4. Materials and Methods

4.1. Sample Selection and Bulk Analytical Methods

Samples were collected from a halved NQ drill core kept by the New Brunswick Department of Natural Resources and Energy Development at its Sussex, New Brunswick facility. Rock samples were generally selected to better examine areas of interest based on rock alteration, texture, and mineralogy. The bulk compositions of 44 rock samples were evaluated after crushing, splitting to 100 g, then pulping with a soft iron swing mill. Twenty-six elements (Au, Ag, As, Cd, Cu, Mn, Mo, Ni, Pb, Zn, Ba, Bi, Ca, Cs, Fe, Ga, Ge, Hg, K, Na, Sb, S, Se, Te, Tl, and W) were determined at Actlabs by instrumental neutron activation analysis (INAA) [57] and with aqua regia digestion followed by ICP-MS analysis. Precision and accuracy were determined using several certified reference materials: Sulphide ore mill tailings (RTS-3a; CANMET-MMSL), two gold ores (DS-1 and MA-2c; CANMET-MMSL), diorite gneiss (SY-4; CANMET-MMSL), and zinc-tin-copper-lead ore (MP-1b; CANMET-MMSL).

4.2. Laser Ablation-Inductively Coupled Plasma-Mass Spectrometry

Eleven polished thin sections were analyzed using a laser ablation–inductively coupled plasma–mass spectrometer (LA-ICP-MS) at the University of New Brunswick using a Resonetics S-155-LR 193 nm Excimer LA-ICP-MS with an Agilent 7700x quadrupole ICP-MS. Pyrite was analyzed with the beam size set to 33 μm with a laser repetition rate of 3 Hz. On-sample energy (fluence) was calibrated to 3 J/cm2. A 30 s gas background was collected between every ablation. This ensured that backgrounds were calculated with enough time for signals to settle after sample “washout”. A total of 18 isotopes were monitored in pyrite (29Si, 34S, 55Mn, 56Fe, 59Co, 60Ni, 63Cu, 66Zn, 75As, 78Se, 107Ag, 121Sb, 125Te, 197Au, 201Hg, 205Tl, 208Pb, and 209Bi) from which element concentrations were calculated. Arsenopyrite was analyzed with a beam size of 24 μm with a laser repetition rate of 3 Hz. On-sample energy (fluence) was calibrated to 3 J/cm2. A 30 s gas background was collected between every ablation. The isotopes 27Al, 29Si, 34S, 55Mn, 56Fe, 57Fe 59Co, 60Ni, 63Cu, 66Zn, 75As, 95Mo, 105Pd, 107Ag, 118Sn, 121Sb, 182W, 125Te, 197Au, 201Hg, 205Tl, 208Pb, and 209Bi were monitored in arsenopyrites from which element concentrations were calculated. Data deconvolution was undertaken using the Iolite 2.5 Trace Element Data Reduction Scheme [58], and spikes in the data were automatically filtered using the default 2σ outlier rejection in the Iolite internally standardized trace-element data reduction scheme. Although precautions were taken when selecting the places to be ablated, the presence of nano-inclusions at depth within the analyzed grains is inevitable and the LA-ICP-MS technique cannot always resolve chemically distinct exsolution phases in the subsurface, particularly those at the nanometer scale. Calibration and data reduction for the LA-ICP-MS spot analysis were performed using standards MASS-1 and NIST610.
Pyrite and arsenopyrite trace element mapping was performed by ablating sets of parallel lines across the samples [59]. A beam size between 13 and 24 μm was used depending on the grain size, trying to obtain the desired sensitivity of elements of interest and spatial resolution. The path separation between lines was set to be identical to the laser beam diameter. The laser was fired at a 10 Hz repetition rate and energy set to produce a fluence at the sample of ~1.5 J/cm2. Raster lines of standards MASS-1 and NIST610 were analyzed in order to correct for instrument drift during the offline data reduction. Images were compiled and processed using Iolite 2.5, using the Fe CPS elemental map as a guide to masking the non-pyrite material [60,61]. To produce the quantitative 2D concentration maps from these intensity rasters, an Fe value of 46 wt.% was used as the internal standard. Concentration scales for each map are internally standardized and reported in absolute ppm.

4.3. Statistical Methods

Data with values below detection limits were imputed using the detection limit divided by the square root of two [62]. There were no above-detection limit values, so no sensitivity analysis was conducted. Correlation analysis, calculating the Pearson Product correlation coefficient (r), was conducted by applying a centered log-ratio (clr) transformation to the dataset in order to account for the sensitivity of the data set to peculiarities that induce incorrect correlations [63]. Principal Component Analysis (PCA) was used to simplify the interpretation of the geochemical data [64,65] and conducted on the clr-transformed data [66]. All analyses were conducted using both Minitab® (version 20.2) and CoDaPack (v2.03.01).

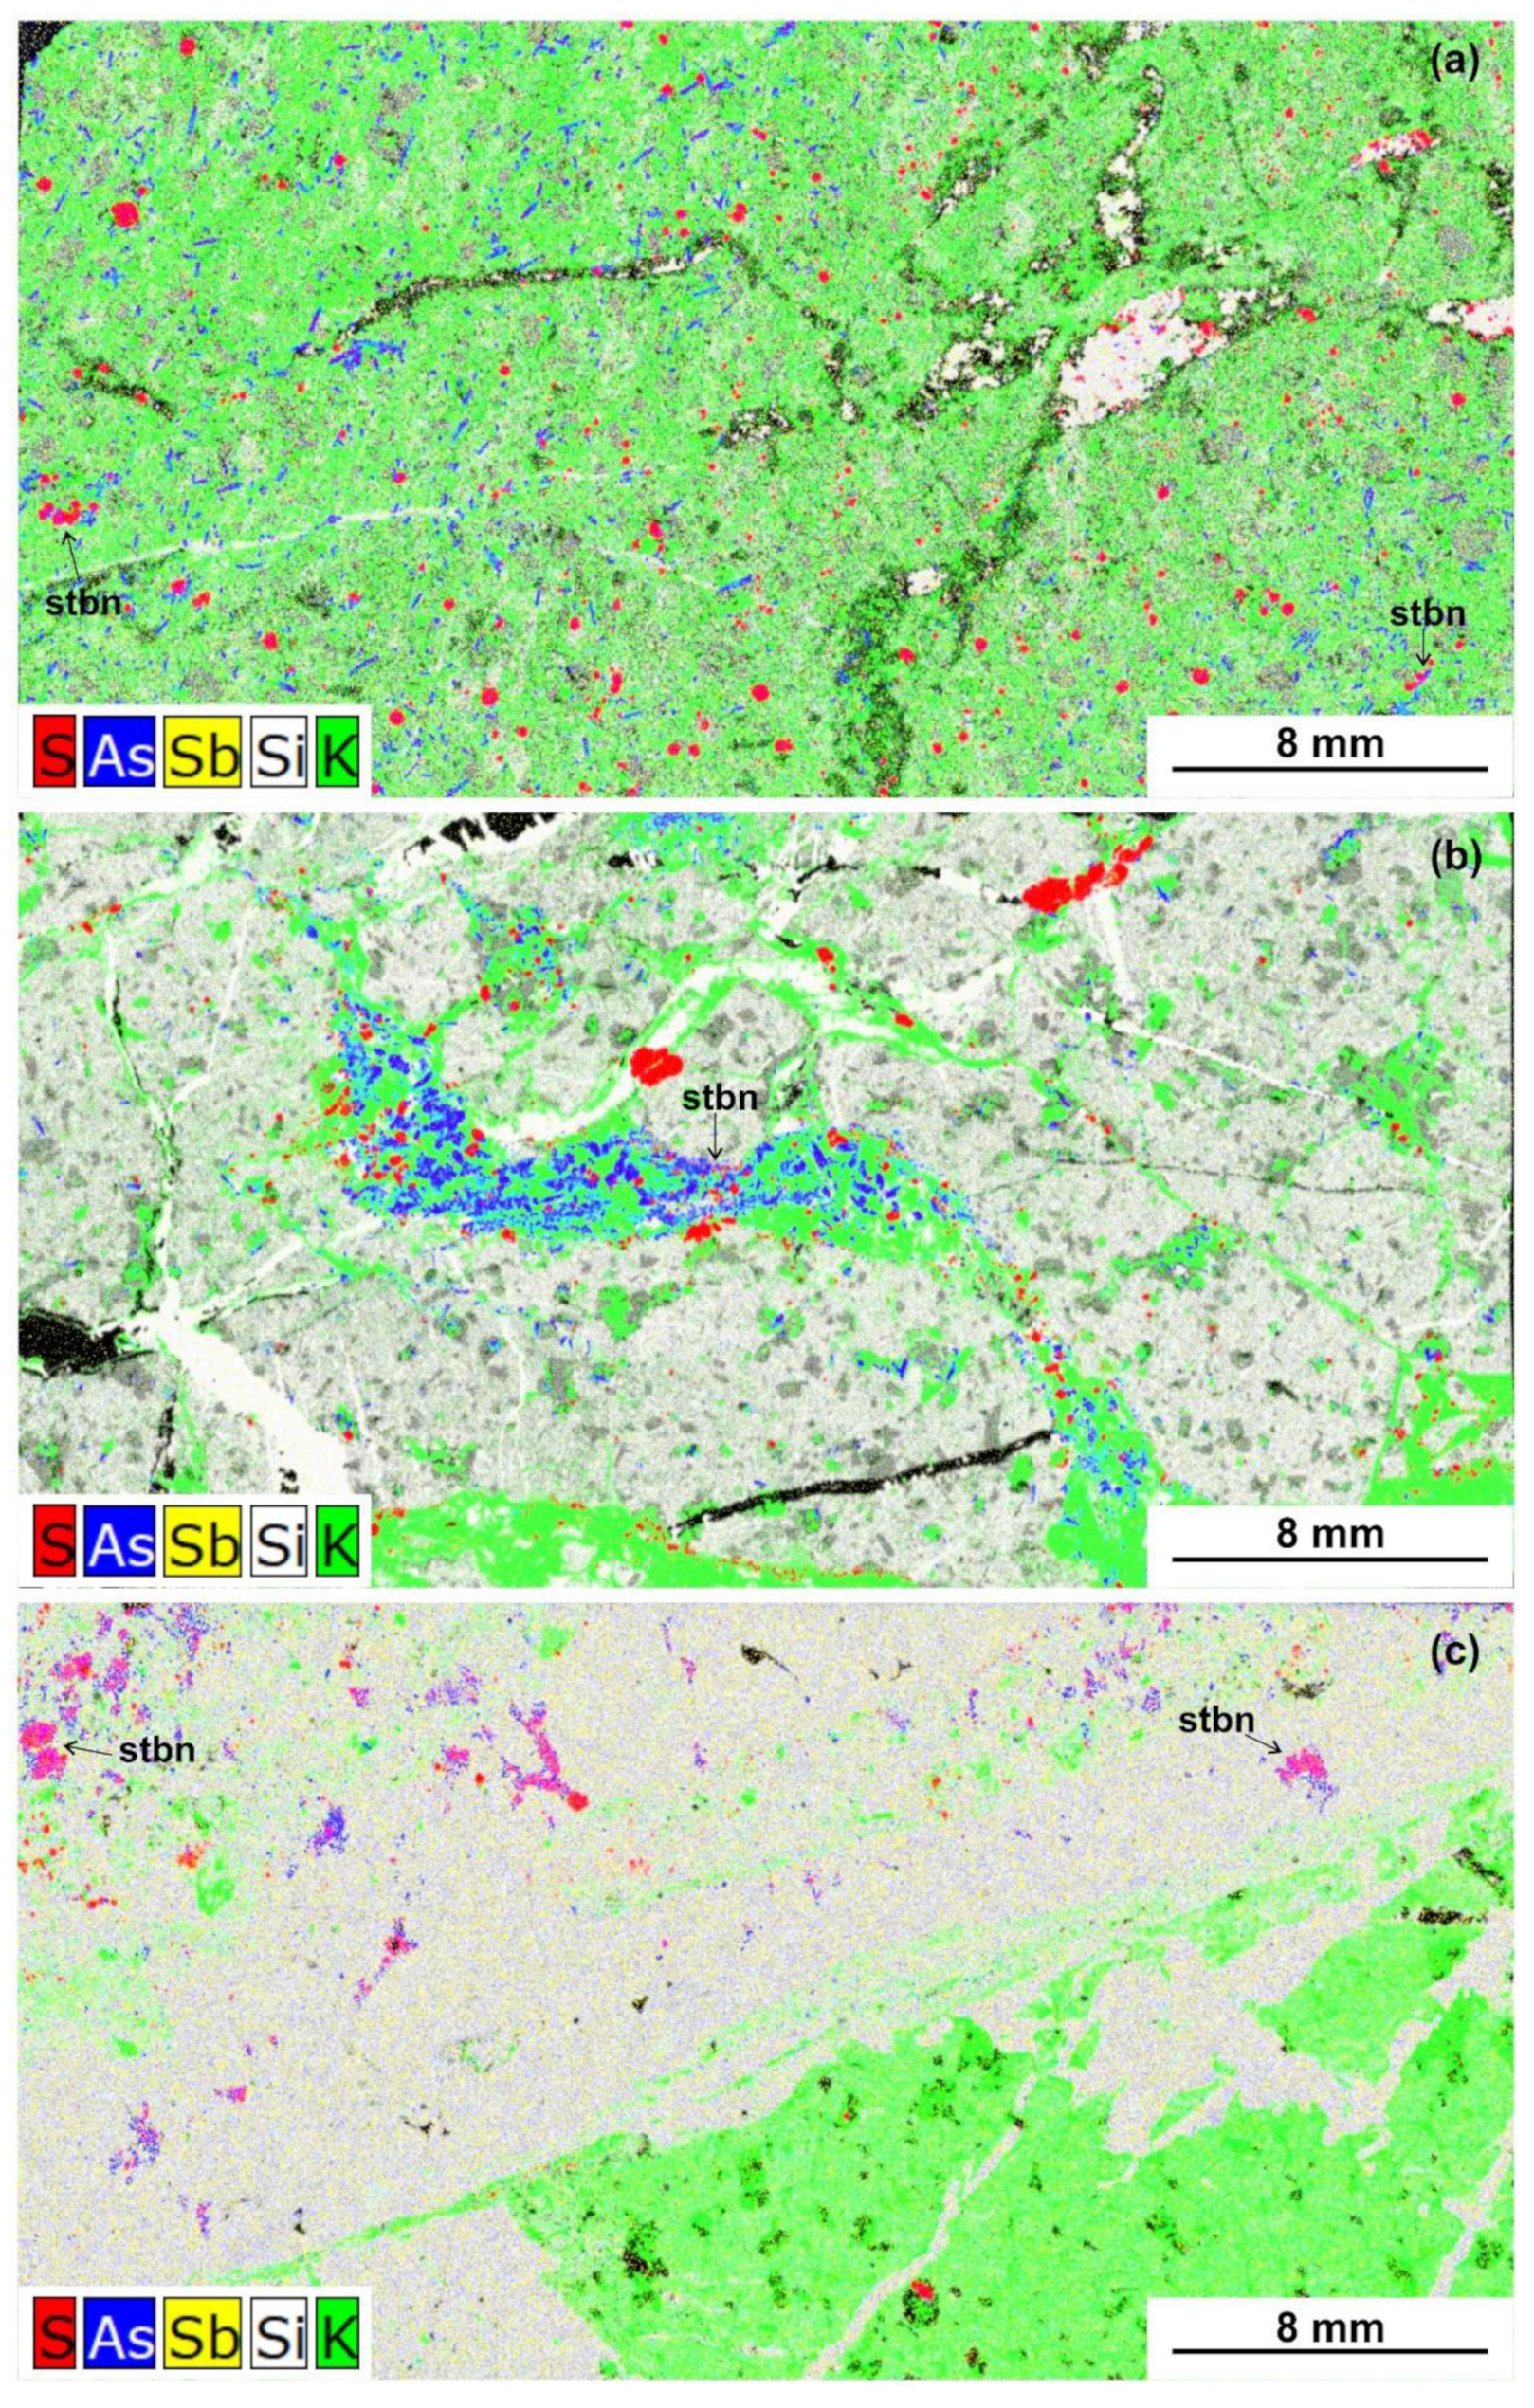
4.4. Micro-X-ray Fluorescence (μ-XRF) Elemental Mapping and BSE Imaging

Selected polished thin sections were scanned by μ-XRF at the University of New Brunswick (UNB) using a Bruker M4 Tornado with a Rh X-ray tube, operating at 30 to 40 kV and 400 μA. The raster multi-element maps were produced by static X-ray spot sizes of 20 μm with 30 μm spacing [67].
Back-scattered electron (BSE) images were collected at the UNB Microscopy and Microanalysis Facility with a JEOL JSM-6400 Scanning Electron Microscope equipped with an EDAX Genesis 4000 Energy Dispersive X-ray (EDS) analyzer using an accelerating voltage of 15 kV and a beam current of 1.5 nA, with a working distance of 14 mm. Images were acquired using a Digiscan II controlled by Gatan Digital Micrograph software. Samples were coated with carbon for conductivity using an Edwards E306A evaporation coater.

5. Results

5.1. Bulk-Rock Geochemical Analyses

Table 1 contains a summary of the bulk geochemical results (Appendix A, Table A1). The median Au concentration is 2.47 ppm, with 10.2 ppm being the maximum value. Arsenic concentrations are particularly high with the minimum value being 86 ppm. The potassium content is less than 0.5 wt.%, whereas Na ranges from below 0.1 wt.% to almost 5 wt.%. The median Ca content is less than 2 wt.%, though one sample contains almost 6 wt.%. Bismuth, Cs, and Se are below 3 ppm, and Sb, with a median of 31.1 ppm, yielded one outlier of 1720 ppm. The majority of the concentrations for Cu, Ni, Pb, and Zn are below 100 ppm. For over 95% of the Ag, Cd, Mo, Ba, Ga, Ge, Hg, Te, and Tl analyses, their concentrations are below the detection limit for each element, and therefore their statistical parameters are not reported. Gold is positively correlated with As and S, and significantly negatively correlated with Cu, Bi, Cs, and Na (α = 0.01); these correlations are an indication of the linear relationship between Au and each element based on the average behavior of the elements in the sample (Figure 6a).
A PCA was used to visualize the variability and facilitate the interpretation of the element concentrations within the samples (Figure 6b,c). The dataset develops three main components with eigenvalues larger than 1. Principal component 1 (PC1) accounts for 32.3% of the total variance while principal component 2 (PC2) accounts for 30% of the total variance, and principal component 3 (PC3) contains approximately 10% of the variance. Both Au and As contribute robustly to these three axes.

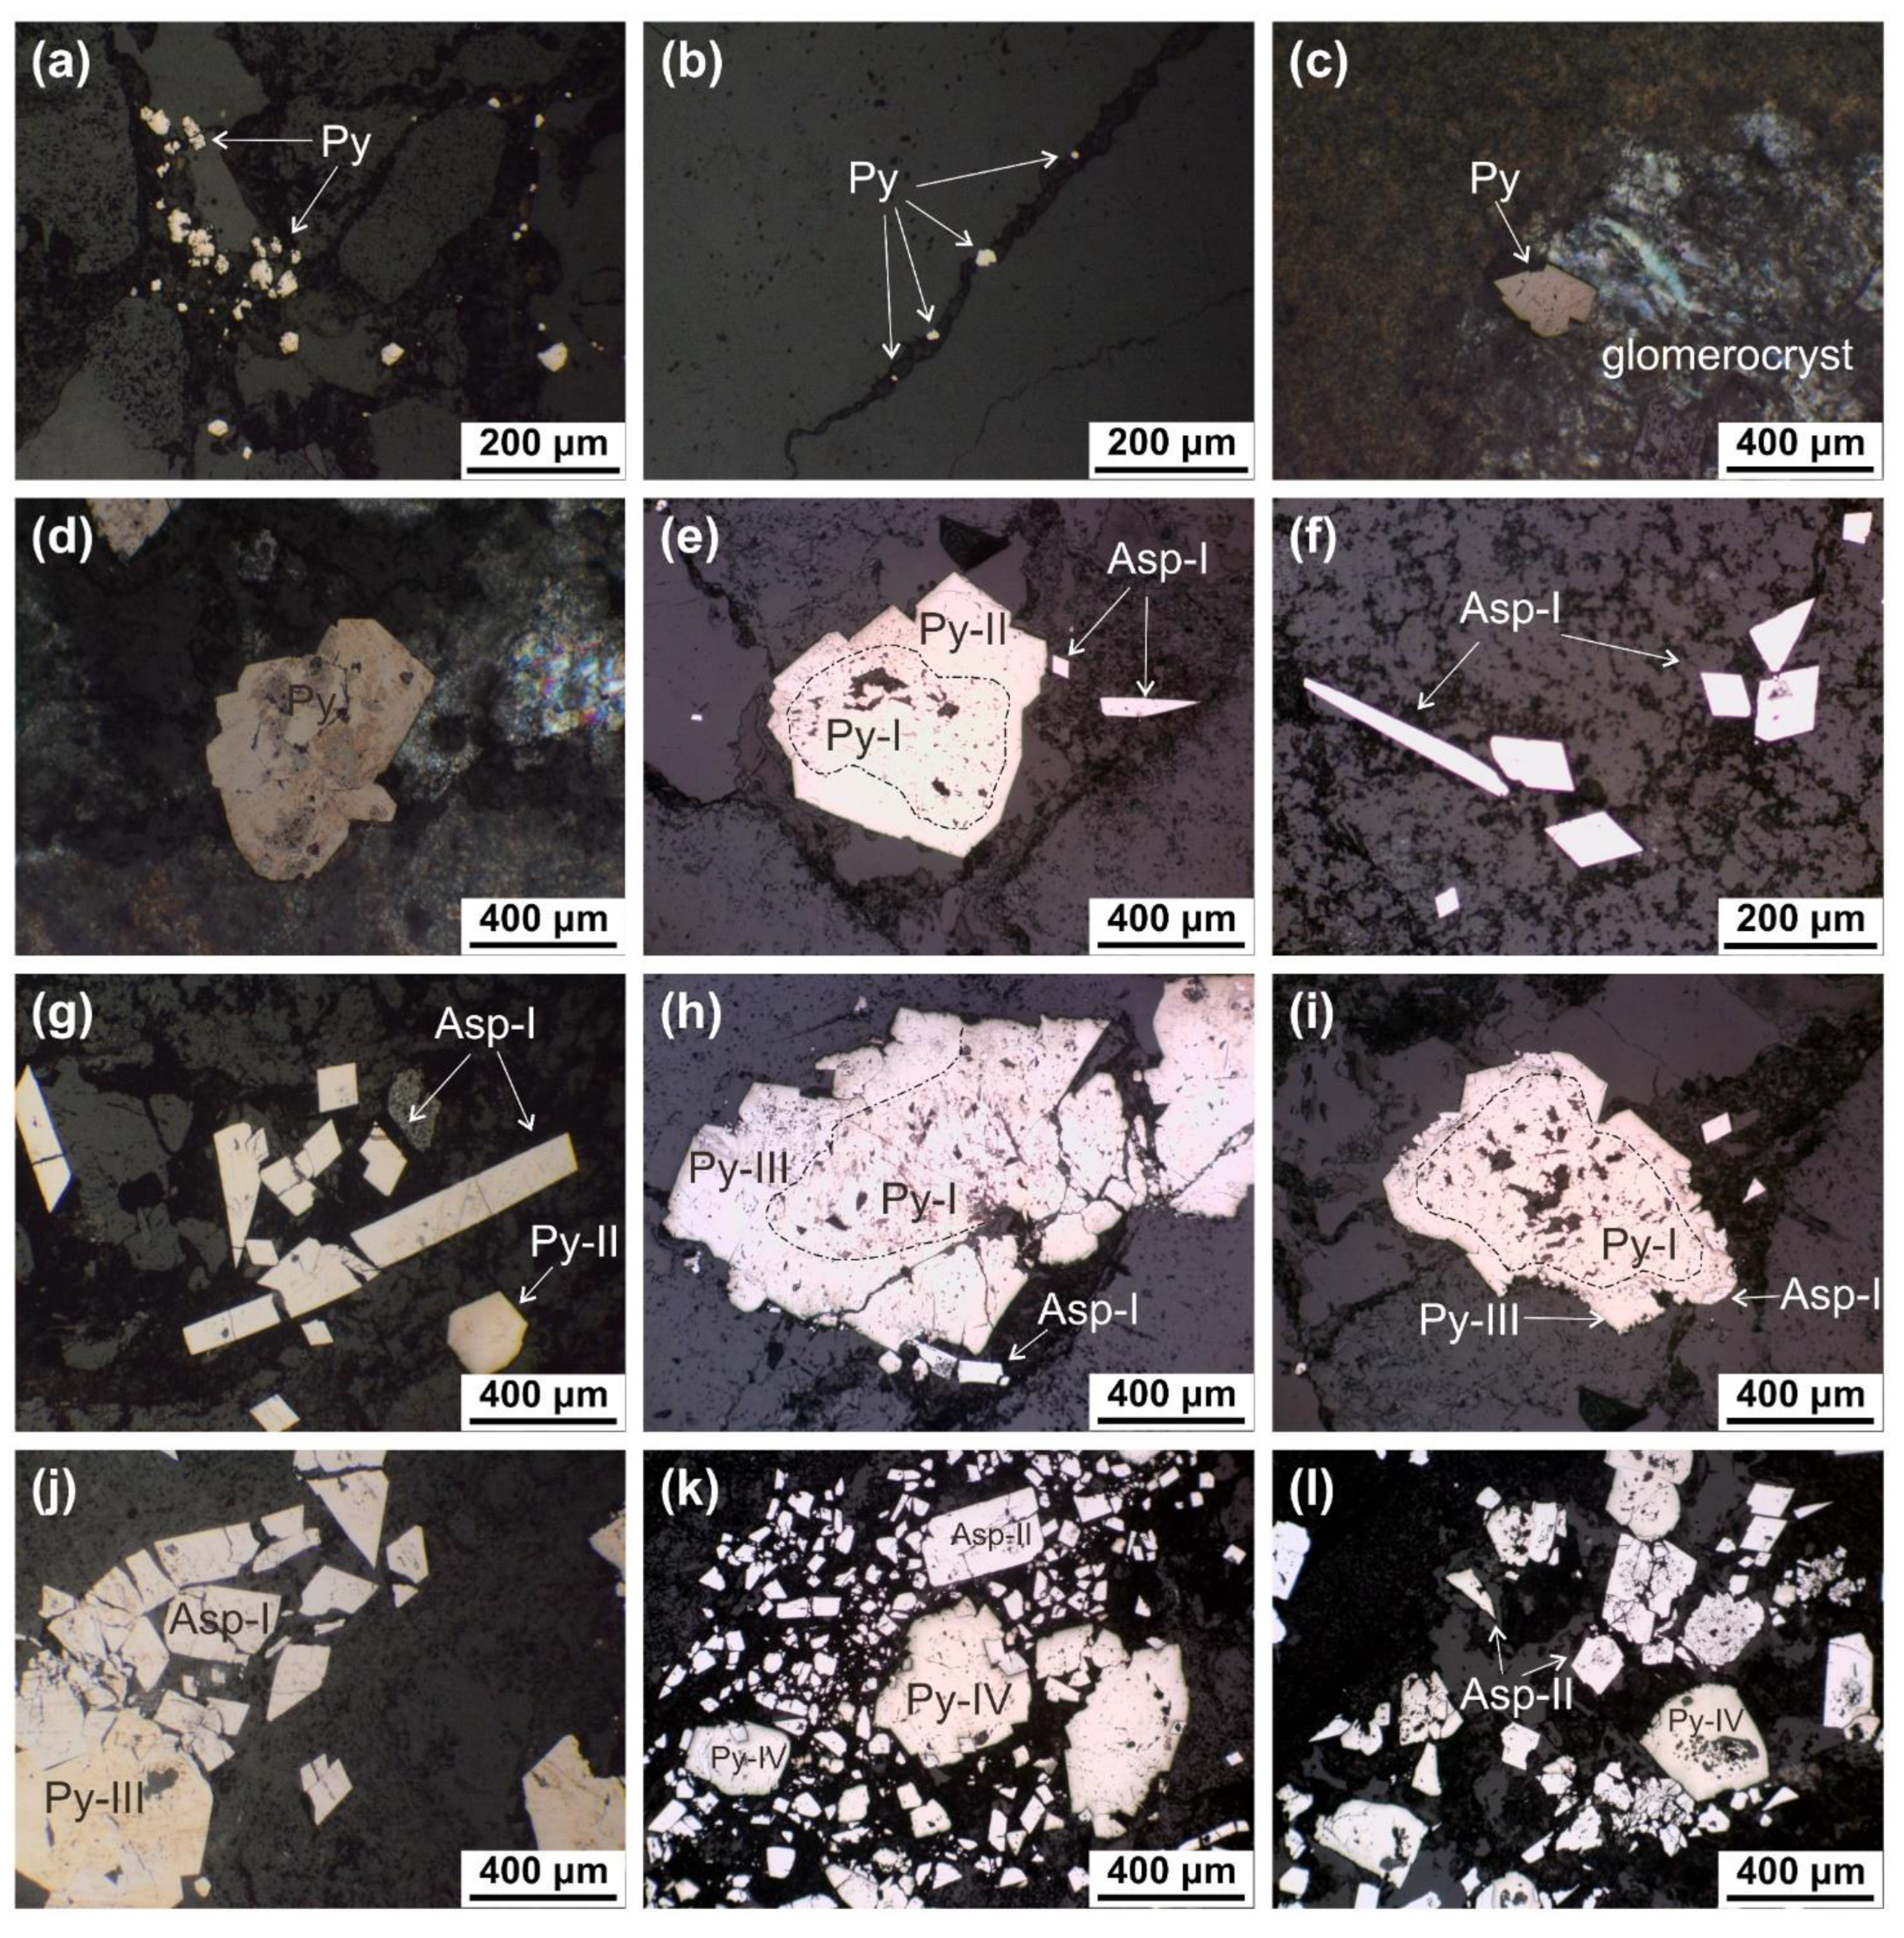
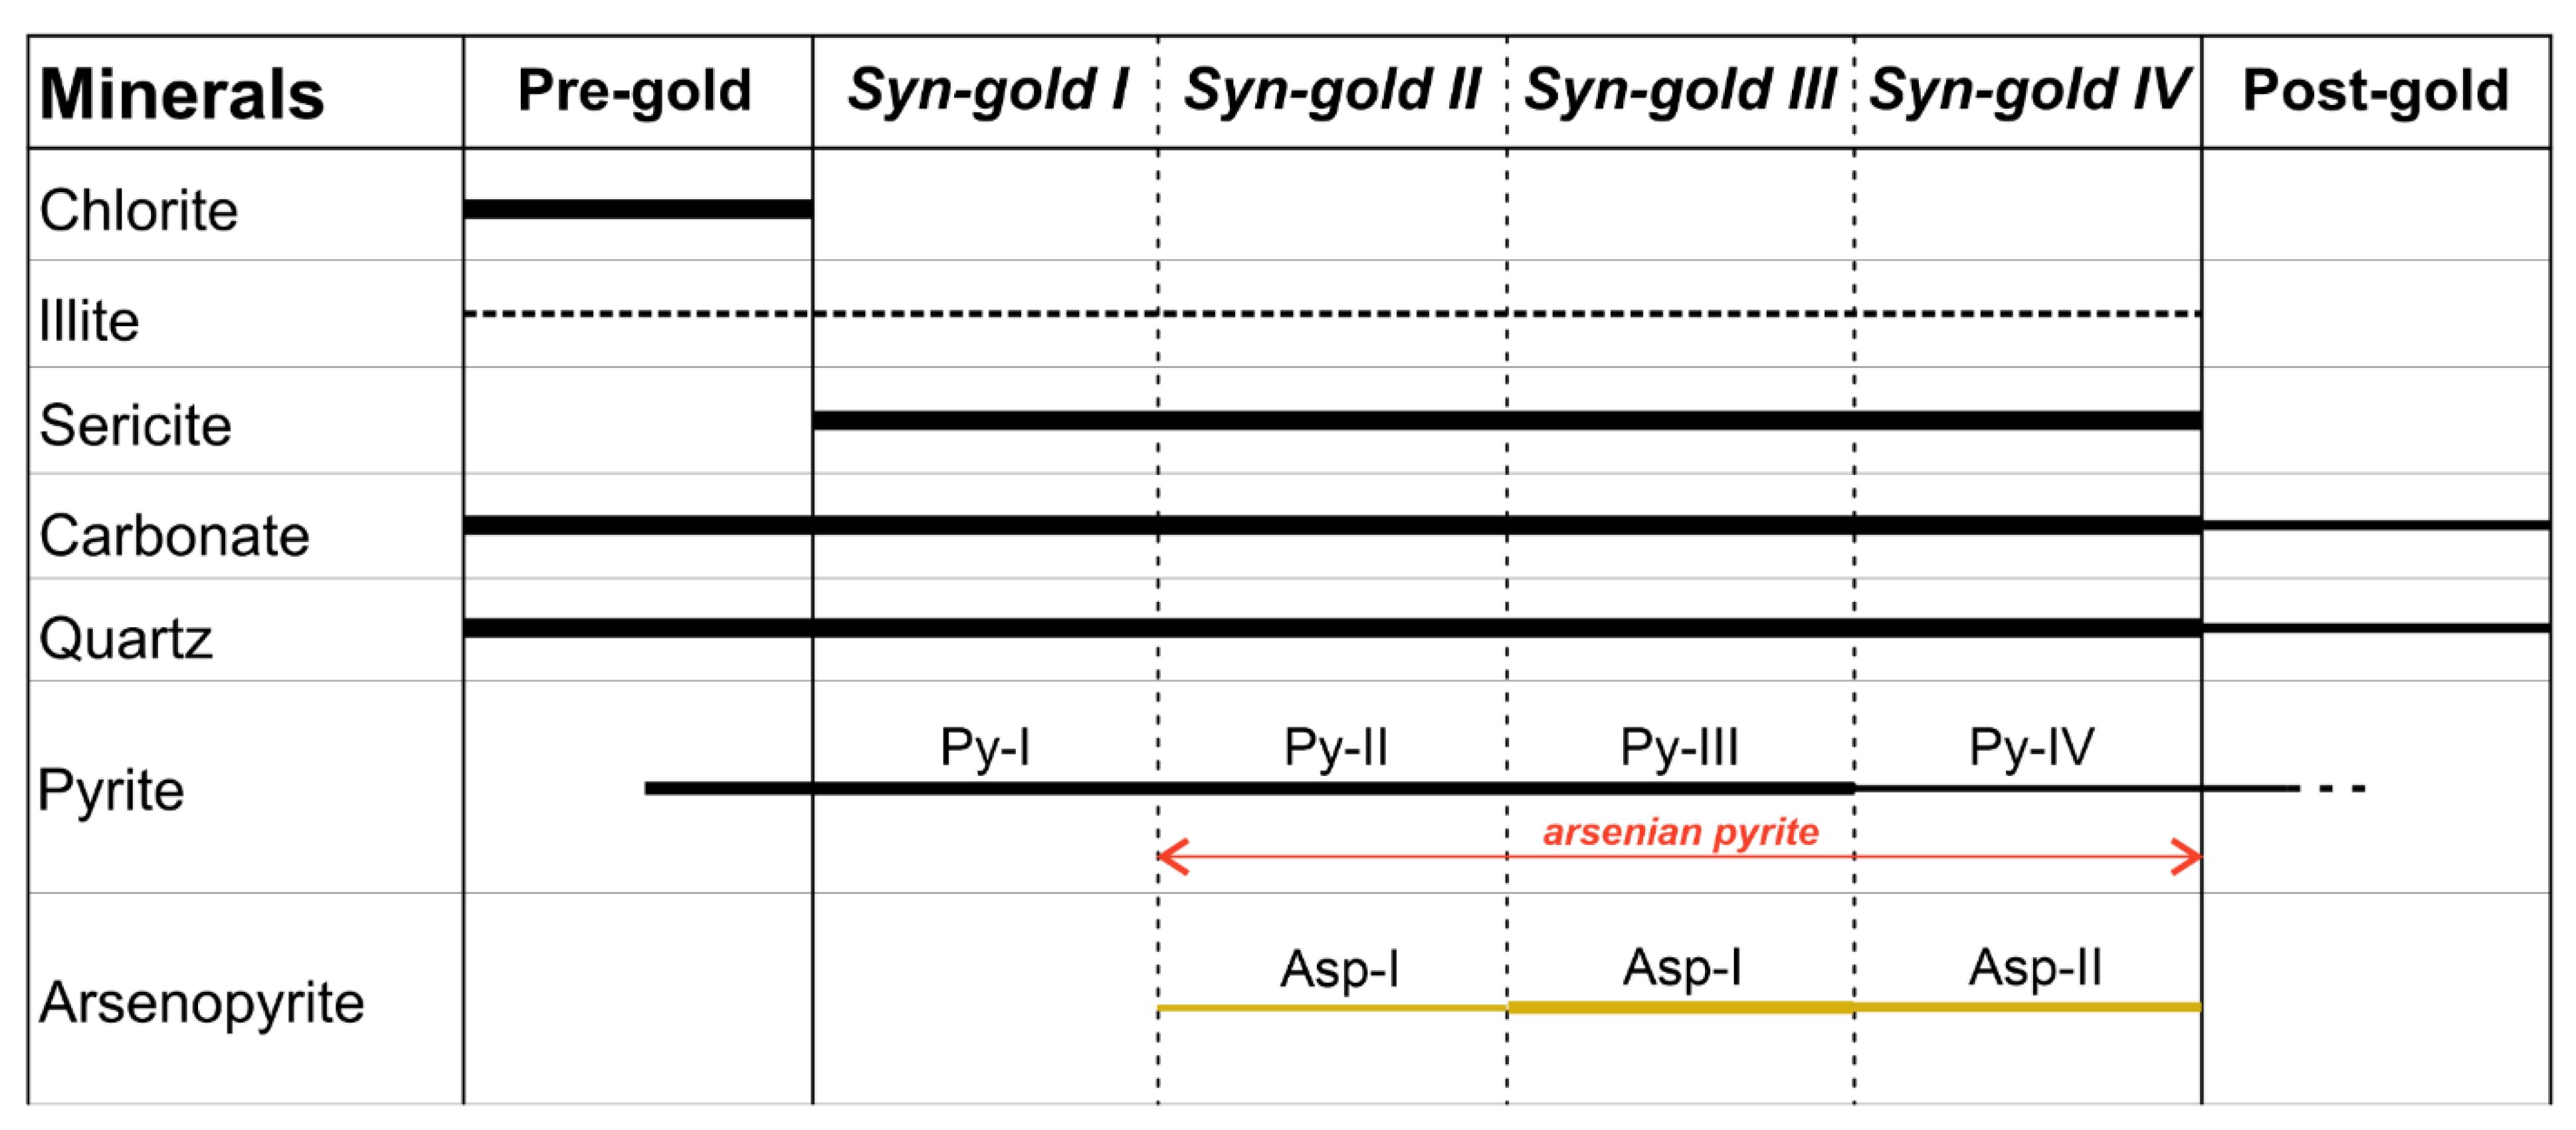
5.2. Trace Element Content of Pyrite

The concentrations for the isotopes 55Mn, 66Zn, 78Se, 125Te, 201Hg, and 205Tl were below their detection limits and therefore were not computed. The spots analyses (Table 2) indicate that the gold content in Py-I varies from 0.16 ppm to 5.87 ppm with an average value of 2.32 ppm, much lower than in Py-II, with concentration from 3.18 ppm to 55.73 ppm, with an average value of 14.96 ppm. In contrast to the gold content of pyrite in rocks with weak to moderate sericitization (Py-I and Py-II), the dominant pyrite (Py-III), occupying quartz-carbonate-sericite veins and disseminated in intensely sericitized breccia fragments and matrix, is more enriched in gold with an average of 34.70 ppm. Py-IV grains are found in late sulphide veinlets and have the highest gold values ranging from 36.32 ppm to 210.8 ppm, with an average value of 105.1 ppm. This increase in gold content from Py-I to Py-IV is directly correlated with an increase in As with average values of 2195.3 ppm in Py-I, 14,269.6 ppm in Py-II, 27,021.9 in Py-III, and 43,384.8 ppm in Py-IV. Furthermore, Co, Ni, Cu, Ag, Pb, and Bi have different variability, and in general terms, have higher average values in Py-I; the variation of these elements in the different pyrite types is marked by high standard deviation values, a clear indication that the distribution of these elements in individual pyrite is heterogeneous. Minor amounts of stibnite occur in quartz-carbonate veins, where most pyrite corresponds to the Py-III type; however, the antimony concentration is higher in Py-I. Zn was only measurable in a few spots of Py-I and below the detection limit in all other pyrite types; sphalerite, nonetheless, appears in the matrix or as inclusions of Py-I, Py-II, and Py-III.

5.3. Trace Element Content of Arsenopyrite

The concentrations for the isotopes 55Mn, 66Zn, 95Mo, 105Pd, 118Sn, 125Te, 201Hg, and 205Tl were below their detection limits and therefore were not computed. The spots analyses (Table 3) indicate that arsenopyrite contains more gold than pyrite; the different types of arsenopyrite show contrasting gold concentrations, with mean gold values of 43.5 ppm and 131.3 ppm for Asp-I and Asp-II, respectively. The arsenopyrite (Asp-II) grains have approximately three times more gold than Asp-I. Furthermore, Co, Ni, Ag, and Bi display similar average values between Asp-I and Asp-II, although with important variability within the individual grains as evident from the minimum, maximum, and standard deviation values. Antimony concentrations show a higher average value of 1015.2 ppm for Asp-I and a lower average value of 394.6 ppm for Asp-II. Mn, Zn, Mo, Pd, Sn, Te, Hg, and Tl were not measurable in any arsenopyrites.

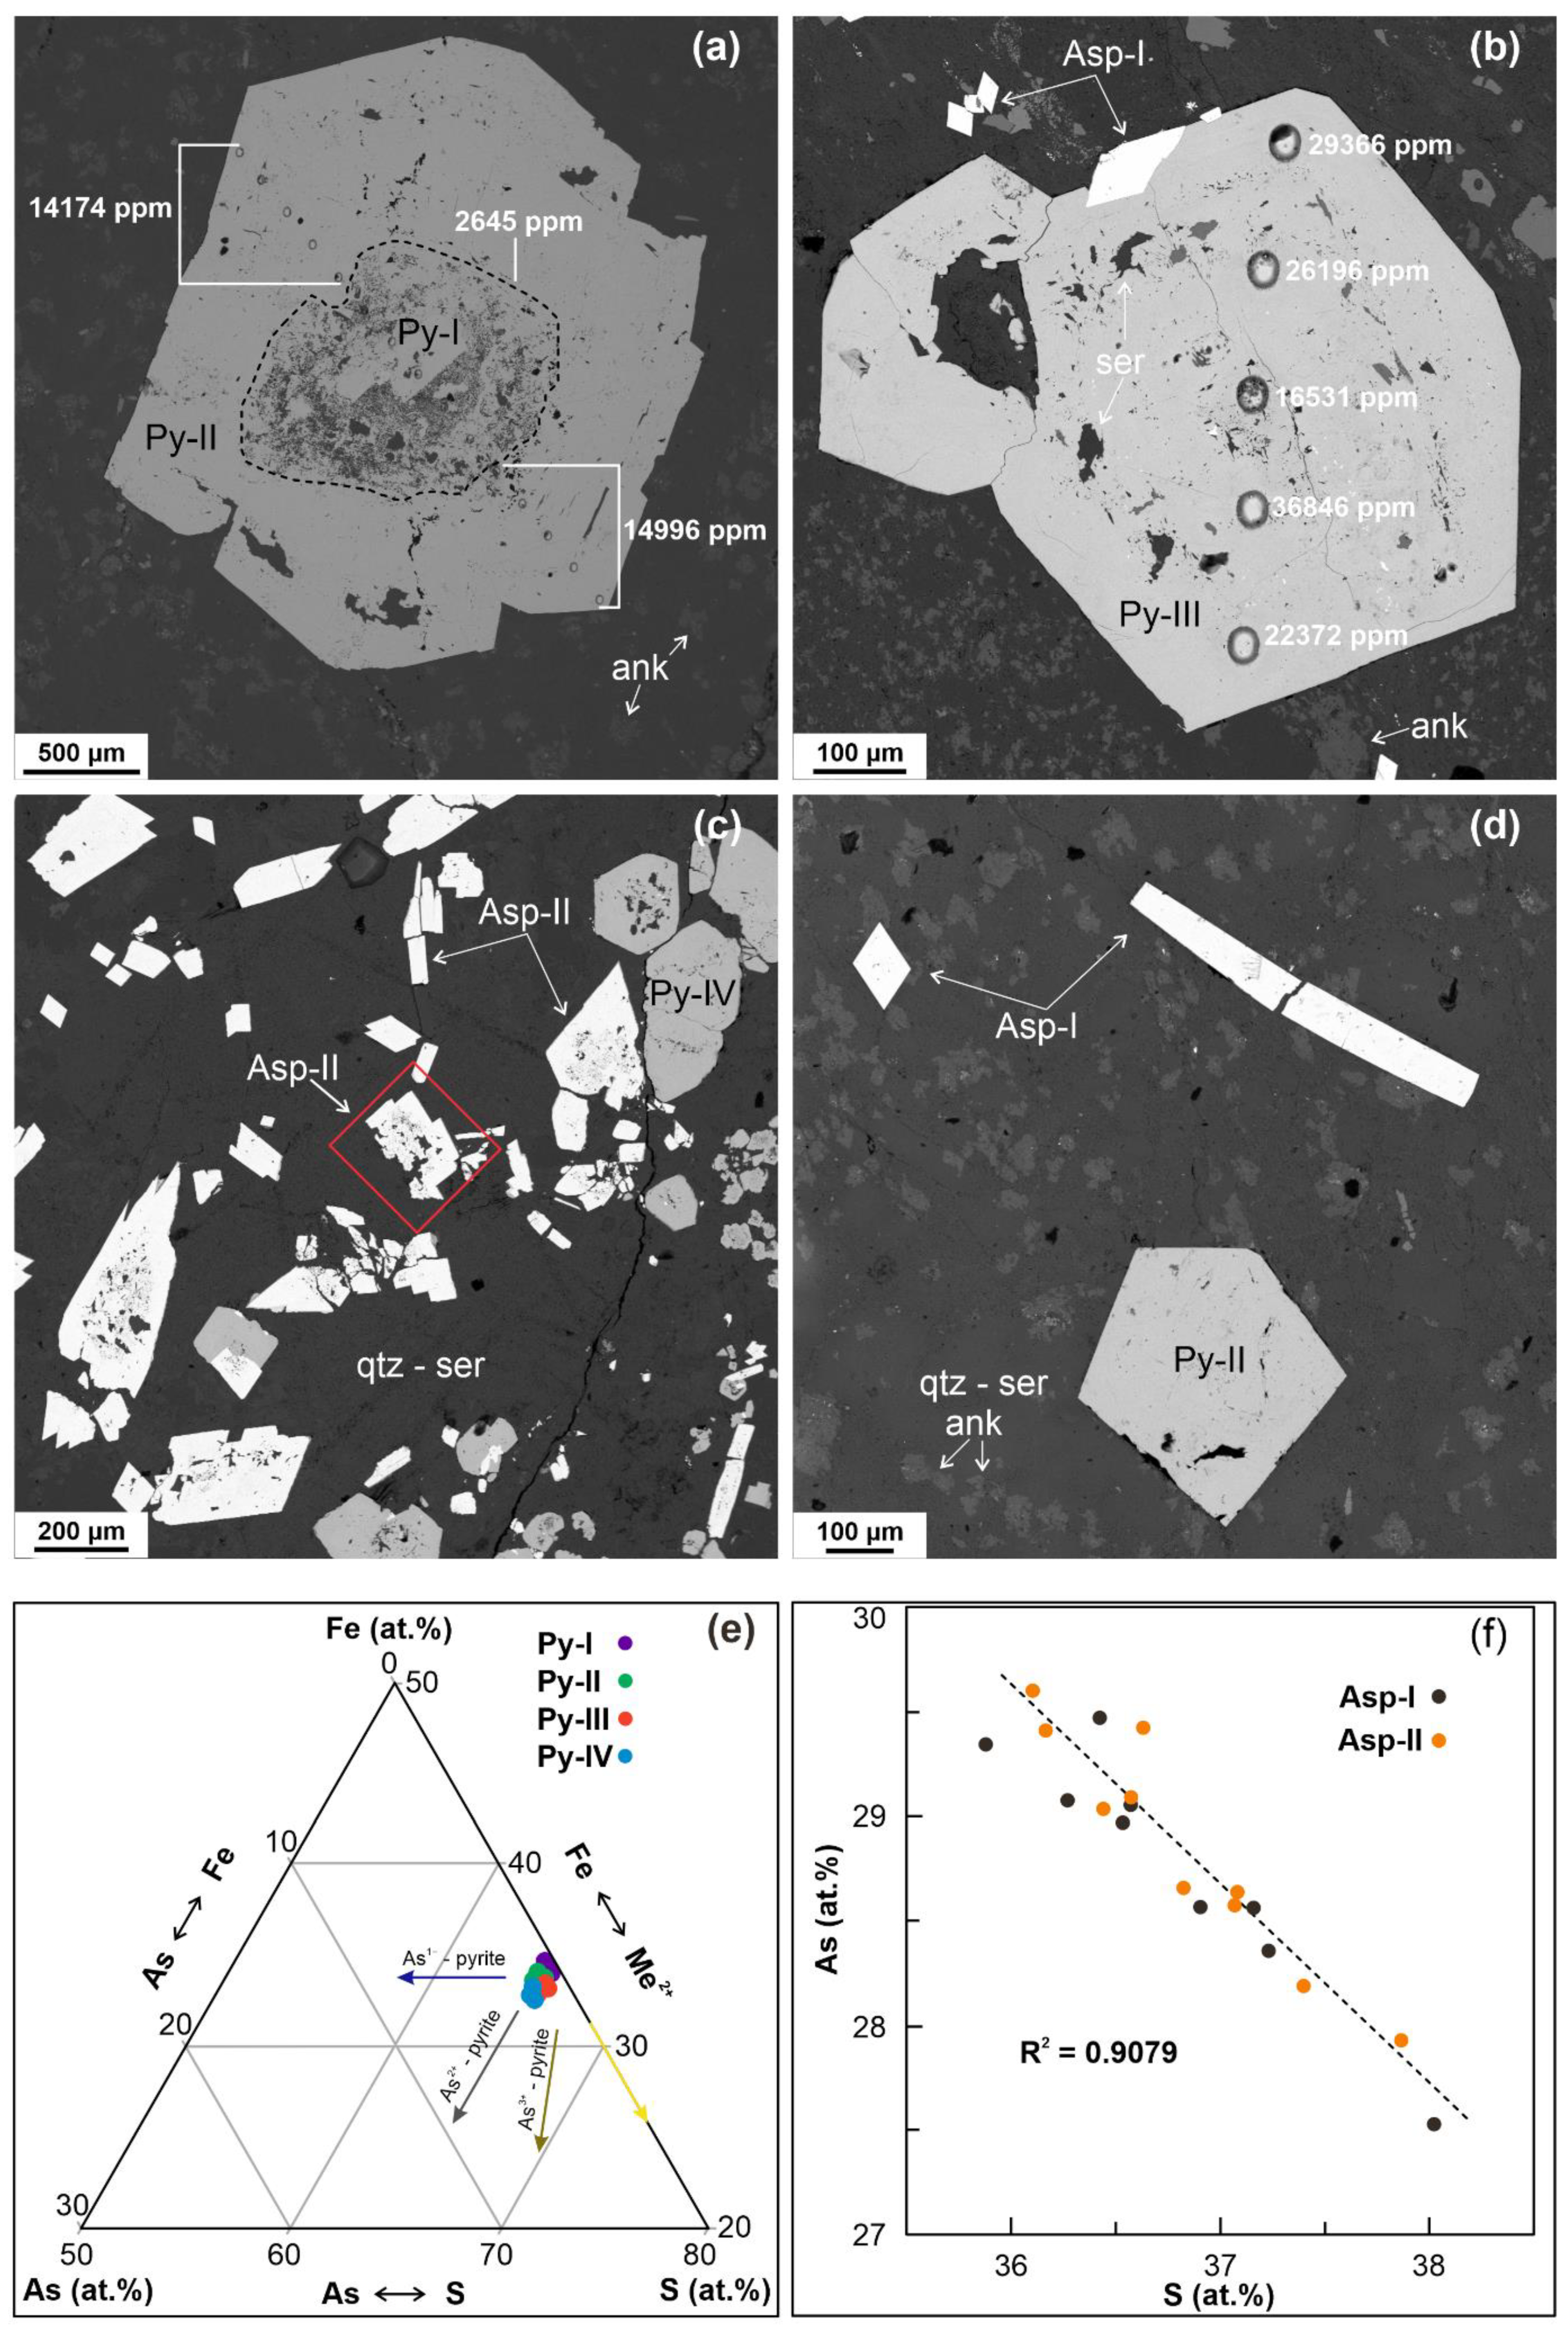
5.4. SEM-EDS Compositions of Pyrite and Arsenopyrite

SEM-EDS analyses showed that S and Fe concentrations of Py-I range from 65.02 to 66.16 at.% and from 33.45 to 34.79 at.%, respectively. In the case of Py-II, they range from 65.26 to 65.72 at.% for S and from 33.58 to 33.97 at.% for Fe. Analyses for Py-III and Py-IV indicated S and Fe concentrations in the ranges of 65.45–66.14 at.% and 32.95–33.57 at.%, and 65.05–65.34 at.% and 33.22–33.53 at.%, respectively. The average values of As for Py-I, Py-II, Py-III, and Py-IV are 0.15 at.%, 0.75 at.%, 0.92 at.%, and 1.46 at.%, respectively. The S/Fe ratios for Py-I to Py-IV are 1.87–1.96, 1.92–1.96, 1.95–2.01, and 1.94–1.96, respectively. SEM-EDS analyses reveal that arsenopyrite is systematically As deficient, ranging from 27.52 to 29.47 at.% and from 27.93 to 29.60 at.% for Asp-I and Asp-II, respectively. The Fe contents are almost uniform, and the As/S atomic ratio varies between 0.72 and 0.82, representing a characteristic compositional parameter (Appendix C, Table A4).

6. Discussion

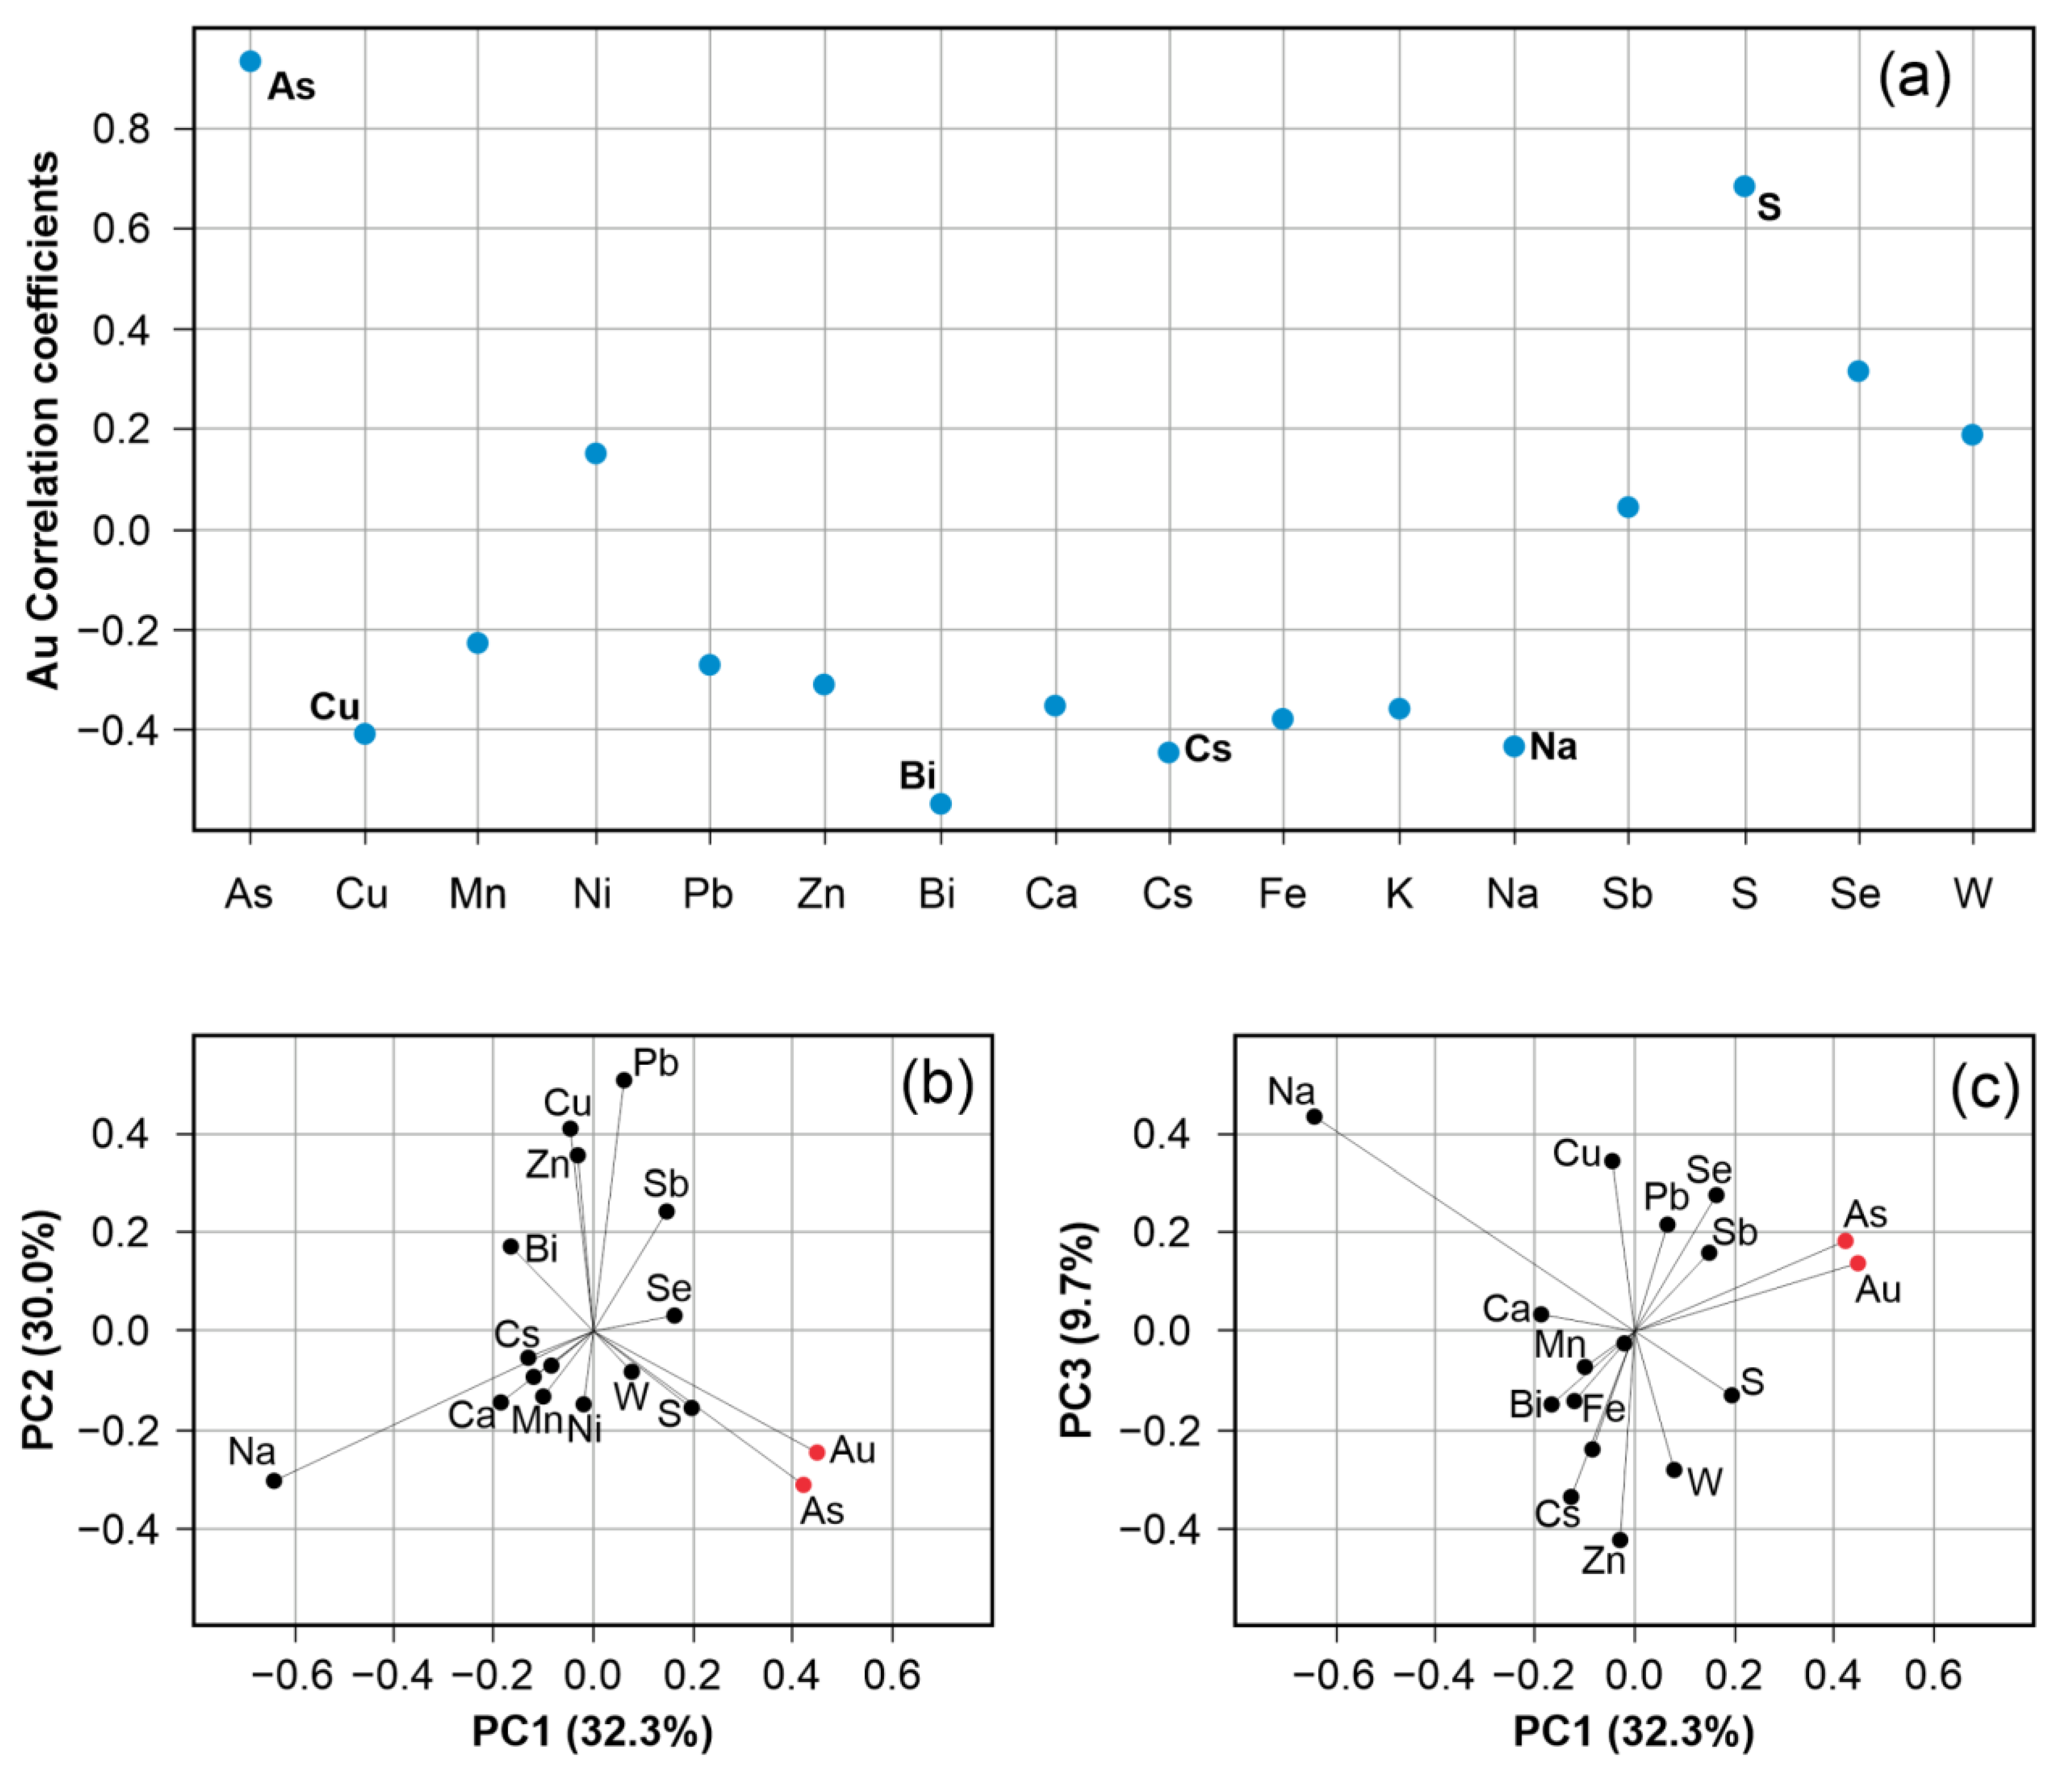
6.1. Element Association from Geochemical Data

The lithogeochemical results reported here are similar to those reported by Chi et al. [3] for sericitized porphyritic rhyodacite samples, where the intensity of alteration is directly correlated to the abundance of arsenopyrite and pyrite, and therefore to the Au and As concentrations. The significant negative correlation of Au with Na relates to the moderate depletion in Na2O; the subsequent enrichment in K2O with an increasing degree of sericitization is not reflected by the correlation analysis (Figure 6a). However, petrographic evidence and micro-X-ray fluorescence (μ-XRF) elemental mapping illustrate the strong relation between the presence of arsenopyrite and pyrite in sericitized rocks with K and Sb (Figure 7); the disseminated style constitutes the most important mineralization for both arsenopyrite and pyrite (Figure 7a), followed by quartz-sericite veins (Figure 7b,c). Stibnite is present as a minor constituent, although common in the quartz-sericite-arsenopyrite-pyrite mineral assemblage. A weak positive correlation between Au and As with Ni, Se, W, and Sb exists, whereas a negative correlation persists between Au and Zn, Cu, Pb, and Bi (Figure 6a). Silver and Hg are generally lower than their detection limit, regardless of the Au contents.
Petrological observations made in the field and in the drill core showed that Au in the Golden Ridge deposit is positively related to the presence of arsenopyrite, pyrite, stibnite, and sphalerite [2,3]. Despite this, it is not clear why Zn is not showing a statistical correlation with Au, as expected due to the presence of sphalerite. One reason might be that samples with low Au grades were part of the statistical analyses, and the presence of sphalerite was insufficient to display a positive correlation between Zn and Au. Another reason might lie in the Au distribution coefficient between solid and fluid phases for sphalerite, approximately two orders of magnitude lower than pyrite [68]. Tungsten has a weak positive correlation with Au, although no tungsten-bearing mineral has been identified at Golden Ridge. In the case of Te, the values below the detection limit suggest the absence of precious metal tellurides.
In accordance with the biplots illustrated in Figure 6b,c, both Gold (Au) and Arsenic (As) demonstrate prominent positive loadings in the first principal component (PC1). Furthermore, Antimony (Sb), Selenium (Se), Sulfur (S), Tungsten (W), and Lead (Pb) also present positive loadings, albeit to a lesser extent. It is critical to note the interpretative relevance of the length of links between two elements in clr-based biplots. Shorter links in this context denote a reduced log-ratio variance between the pair of elements, thereby suggesting a closer association between the mentioned elements. Consequently, such an observation provides an analytical basis for the assertion of a closer relationship between the two elements in question [66,69].

6.2. Correlation of Trace Metals in Sulphides

The concentrations of arsenic and gold in common sulphide minerals (e.g., pyrite) are positively correlated, as both gold and arsenic can replace iron and sulfur in the crystal lattice of pyrite [7]. Furthermore, it has been demonstrated that the maximum gold concentration is strongly correlated with the arsenic content, from which a solubility limit can be estimated [70]. In Figure 8a, Au and As display a positive correlation and there is also an increase in arsenic from Py-I to Py-IV. If pyrite with arsenic contents above 1 wt. % is considered arsenian pyrite [11,71], then Py-II to Py-IV can be classified as arsenian pyrites. All pyrite data points plot below the Au solubility limit (Figure 8a), an indication that gold occurs as structurally bound (invisible-refractory) gold in the arsenian pyrite structure [70,72,73,74] and exhibits a somewhat wedge-shaped-like distribution, a common feature of Au-bearing arsenian pyrite from hydrothermal ore deposits [70,75]. Py-I contains more Sb, Cu, Pb, and Ag than pyrites Py-II to Py-IV (Figure 8b–e); this suggests that Py-I originated from a different hydrothermal fluid than the one (or ones) from which pyrites Py-II to Py-IV originated. The hydrothermal fluid responsible for Py-II, Py-III, and Py-IV contains less Sb, Cu, Pb, and Ag and defines multiple pulses of hydrothermal fluids associated with the ore-forming process. Most pyrites, except for the Py-I type, have high Au/Ag ratios and plot above the Au-Ag = 1 ratio line. The Co and Ni content in pyrite shows a broad range of variability, with Py-I having the higher Co (401.7 ppm) and Ni (61.3 ppm) mean values, whereas the mean values for Py-II, Py-III, and Py-IV are lower and fairly similar. At Golden Ridge, most Co/Ni ratios in all generations of pyrite and arsenopyrite range between 1 and 10 (Figure 8f and Figure 9d), reflecting a consistent hydrothermal fluid composition for these metals [76,77,78,79].
The LA-ICP-MS data show higher values of Au in arsenopyrite (Figure 9a), only comparable to Py-III and Py-IV (Figure 8a, and indicating the incorporation of refractory Au (nanoparticles and/or lattice-bound) with a preferred enrichment of Au in arsenopyrite. Antimony is relatively enriched in both pyrite (Figure 8c) and arsenopyrite (Figure 9a), coinciding with the precipitation of stibnite and pointing towards relatively high Sb in the ore-bearing fluid. Arsenopyrites (Asp-II) have higher concentrations of Cu, Pb, and Ag than arsenopyrites (Asp-I) (Figure 9b,c), although in similar ranges to Py-II, Py-III, and Py-IV.
The textural characteristics and the mineral compositions suggest at least four pulses of fluid involved in the generation of pyrite during the gold mineralizing event at Golden Ridge. The first fluid was enriched in Sb, Pb, Cu, Co, Ni, and Bi. The second pulse of hydrothermal fluid was enriched in arsenic and was responsible for the formation of Py-II and arsenopyrite (Asp-I); the third and fourth pulses were enriched in both arsenic and gold and constituted the most important Au deposition stages. The LA-ICP-MS mapping results illustrate higher amounts of Co, Ni, Cu, Ag, Sb, Pb, and Bi in Py-I than Py-II. The maps also reveal oscillatory zoning of Au, As, and Cu in Py-II; Co and Ni tend to enrich in the rim (Figure 10). Although enriched in Au and As, Py-III and Py-IV are commonly low in most other trace elements: Ag, Sb, Pb, and Bi (Figure 11 and Figure 12). Both Py-III and Py-IV exhibit Au and Cu zonation. The patterns of the counts (Figure 10k, Figure 11k and Figure 12k) for the pyrite grains are relatively smooth for As and their parallel trend with Au reaffirms their described correlation. However, Au shows spiky patterns indicating the presence of a significant amount of micron-sized inclusions. Compared to pyrite, arsenopyrite (Figure 13 and Figure 14; see Appendix D for a rhomb arsenopyrite LA-ICP-MS map) is more enriched in gold, also showing gold zonation, with richer rims than cores, and both Asp-I and Asp-II also show local spikes in the gold patterns (Figure 13k and Figure 14k).
The As zoning in pyrite is observed in BSE imagery where the brighter areas contain more arsenic, and pyrites are increasingly brighter compared to Py-I to Py-IV (Figure 15a–c,e). SEM-EDS analyses of pyrite indicated S/Fe ratios in the range of 1.87–2.01 with an increase in the As concentration along with a decrease in Fe (Figure 15e), a well-documented incorporation mechanism of Au into a solid solution [70,80]. Both As and Au enrichment in arsenian pyrite at a low temperature is most likely the result of a refinement process within a prolongated or multi-episodic fluid flow also accompanied by a decrease in pyrite volume due to structural distortion and evident in a decrease in the size of the pyrite grains [72,79,81]. The addition of arsenic to pyrite will change both the incorporation mechanisms of gold into the structure and the surficial characteristics that will enhance adsorption [70,72,80]. In arsenopyrite, arsenic and sulphur show a strong negative correlation regardless of the arsenopyrite type (Figure 15f), with a variable As/S ratio ranging from 0.72 to 0.82. The high Au contents in this low arsenic arsenopyrite (Appendix C, Table A4) are related to its non-stoichiometry [82], i.e., As concentrations between 27.52 and 29.60 at.%, compared to 33 at.% as the stoichiometric value [83]. These variations, a common feature in arsenopyrite, lead to disorder in the host lattice and allow the incorporation of gold [84]. The low content of arsenic from the arsenopyrite suggests a low-temperature and non-equilibrium pyrite-association formation [85,86]. The average values of the total trace element concentrations for arsenopyrites obtained via LA-ICP-MS are 1235 ppm (range: 307–3818 ppm) and 634 ppm (range: 81–1500) for Asp-I and Asp-II, respectively. These data show that Au and Sb are the main trace elements in arsenopyrites. LA-ICP-MS analysis also indicated the presence of a sulphide mineral phase containing higher amounts of S-Sb-Cu-Pb and anomalous Te, Tl, and Bi. See Appendix C (Table A5).

6.3. The Nature of “Invisible” Au

The average Au and As content in Py-I is 2.32 ppm and 2195.3 ppm, respectively. Py-I grains constitute the sieve textured core of low As content grains that are later mantled by As-richer zones (Py-II), narrow inclusion-rich (primarily arsenopyrite, Asp-I) corona-like texture (Py-III), and finally, pyrite grains with overgrowth zones partially or completed replaced by arsenopyrite (Asp-II). This concentration of trace elements in later growth zones, a common occurrence in pyrites from epithermal environments, accounts for surface interface-controlled growth during metal deposition [87,88] and indicates a disequilibrium crystallization process [89,90]. It is also observed that the amount of Au in the arsenian pyrites Py-II, Py-III, and Py-IV, in general, increases with decreasing sizes of the pyrite grains, a common feature in both Carlin-type and epithermal deposits [72,91,92].
The As content for pyrite grains Py-II, Py-III, and Py-IV ranges from approximately 700 ppm As to almost 6 wt.% of As. Py-I is interpreted to have formed before the introduction of high-As fluid to the system, whereas Py-II, Py-III, and Py-IV formed together with arsenopyrite. Invisible gold occurs in an elemental form as nanoparticles of Au(0) or as alloys with other trace elements, such as Bi, Te, and Ag, and as a chemically bound form. Nonetheless, the nature and redox state of the chemically bound form varies from Au3+ to Au1- [84]. The different element correlations and the LA-ICP-MS data indicate “invisible gold” as the main form of Au present (solid solution in the crystal lattice of pyrite and arsenopyrite or submicron- to nanoparticles and micron-sized inclusions) as native gold and Au compounds (e.g., tellurides) have not yet been identified.
The distribution and size of gold particles in sulphide-sulphate solutions are ultimately controlled by the degree of supersaturation, fluid pH, sulphur concentration, and temperature (cooling favoring metal precipitation) [73]. The miscibility of fluid solutions is supported by high temperatures which leads to cooling as a destabilizing factor for Au dissolved in solid solution in the mineral lattice. Fluid-assisted recrystallization can also induce the breakdown of chemically bound Au that is later adsorbed on the surface of slow-growing crystals [93,94].
The vast majority of processes used to explain the high contents of gold in arsenian pyrite consider adsorption (surface interface) to be an important factor that derives from the inhomogeneous composition of high-Au and high-As pyrite [90,95]. The disequilibrium composition of the surface, in this case of Py-I, leads to deviations of the mineral composition from its equilibrium as nucleation and adsorption occurred during the input of an As-rich hydrothermal solution [71]. This process resulted in gold concentrations in places where gold could adsorb onto the surface of a growing crystal. Although it is observed that gold concentrations increase with increasing arsenic in different gold deposit types and it is believed that arsenic possesses a natural Au scavenging effect that results in the enrichment of invisible gold in both pyrite and arsenopyrite [7,8,72,80], the role of arsenic in gold incorporation in growing pyrite and arsenopyrite remains controversial. It is feasible that the preferential enrichment of gold in arsenopyrites (Asp-I and Asp-II) and pyrites (Py-II, Py-III, and Py-IV) is derived from primary coprecipitation and therefore the resulting absence of native gold as fracture fill or overgrowths in arsenopyrite.
Figure 15. SEM-Back-scattered electron (BSE) images of pyrite and arsenopyrite crystallites from the Golden Ridge gold deposit. (a) Pyrite grains with arsenic increasing from the center (Py-I) towards the rim (Py-II). Values are for As in ppm from LA-ICP-MS spot analysis; (b) pyrite grain enriched in arsenic with silicate and fine arsenopyrite inclusions concentrated around the center; note the arsenopyrite overgrowth on pyrite. Values are for As in ppm from LA-ICP-MS spot analysis; (c) arsenopyrite (Asp-II) and pyrite (Py-IV) in quartz-sericite mm-thick veinlet at the late stage of the mineralizing pulse; (d) disseminated rhomb and acicular arsenopyrite and pyrite in sericitized rock; (e) composition of pyrite from ore deposits on As-Fe-S ternary. Four different trends show substitutions of (i) As for S (As1--pyrite; purple arrow); (ii) As2+ for Fe (As2+-pyrite; grey arrow); (iii) As3+ for Fe (As3+-pyrite; olive arrow); and (iv) divalent metals Me2+ for Fe (yellow arrow). After Deditius et al. [72] and Qian et al. [96]; (f) relationship between sulfur and arsenic concentrations in arsenopyrite (Asp-I and Asp-II). Qtz: Quartz, ank: Ankerite, ser: Sericite.
Minerals 13 00954 g015

6.4. The Golden Ridge Gold Deposit

Chi et al. [3] identified that sericitization, the mineralization-associated alteration, is accompanied by the addition of K, Rb, Cs, Ca, Sr, Ba, As, Sb, W, C, and S to the system. Most of these elements have the tendency to be concentrated in the top or contact zones of related intrusions and are known as granophile elements. However, many of these elements also form part of the general suite defined for epithermal deposits: Ag, As, Bi, Cu, Hg, Mo, Pb, Sb, Se, Sn, Te, Tl, W, and Zn [97]. Results from the INAA analysis on sericitized samples (Figure 6a) indicated that only As and S are significantly positively (α = 0.01 confidence level) correlated, whereas Cu, Bi, Cs, and Na are significantly negatively correlated (α = 0.01 confidence level). Furthermore, the PCA analyses (Figure 6b,c) showed that Au has a positive relationship with As and to a lesser degree with S, W, and Sb; a negative relationship is indicated for Bi, Zn, Cu, and Pb. These results do not show the common metal signature enriched in Bi-Te-W linked to intrusion-related gold systems, with the close association of Au with Bi, W, Mo, and Te [98,99,100]. Our data show a metal assemblage association of Au with As and Sb, and low concentrations of base metals, a feature common to both intrusion-related [101] and some epithermal systems [102,103,104]. A study carried out in gold and antimony deposits of southern New Brunswick using portable X-Ray Fluorescence Spectroscopy (pXRF) analysis [65] indicated that intrusion-related gold deposits occur in quartz-carbonate veins with sericitization being the main alteration type and S, As, and Sb as the gold pathfinder elements and arsenopyrite, pyrrhotite, and antimony-bearing minerals as the mineral phases associated with gold mineralization. Nonetheless, at Golden Ridge, a strong S-As-Sb association also occurs, a feature common as different deposit types can share a genetic link or be formed in a transitional environment [54]. Intrusion-related gold ores are enriched in Bi and Te and correlate with Au [52], a feature not seen at Golden Ridge.
The trace element content variations in the different pyrite and arsenopyrite grains suggest changes from an early fluid enriched in Sb, Ag, Cu, Pb, Co, and Ni (Figure 8a–f and Figure 9a–d) to later pulses of As- and Au-enriched fluids; there is also certain variability within the different pyrite generations that indicates that the fluid changed spatially at Golden Ridge. The strong correlation between Au and As and Au+1 in solid solution as data plots below the gold solubility defined by Reicht et al. [70] and is consistent with studies performed on epithermal deposits [72,105,106]. The pyrites (Py-II) from the Golden Ridge gold deposit have As concentrations (mean = 14,269.55 ppm; Table 1) that are consistent with the global average (14,310 ppm) for low-sulphidation epithermal gold deposits [107]. LA-ICP-MS data indicate that neither pyrite nor arsenopyrite has either high Co and (or) high Ni, i.e., magmatic origin, but instead exhibit intermediate Co/Ni ratios and therefore suggest a hydrothermal origin [108]. The trace element changes between the different pyrite types suggest disequilibrium processes during rapid saturation, a common feature in many epithermal deposits [72,109,110,111]. Intrusion-related gold systems spread through a broad range of mineralization styles, always relative to intrusive centers, and therefore, can include common patterns described for other deposit types. In the case of intrusion-related distal deposits, these deposits include auriferous, mesothermal to epithermal quartz-sulphide veins, hydrothermal breccias and base-metal veins enriched in Ag ± Au, and Carlin-style deposits [101].
The solubility limit for a solid solution of Au as a function of As presented in Figure 8a is defined for a temperature range between 150° and 250 °C [70]. Fluid inclusion studies carried out on Golden Ridge [3,55] indicated the existence of two hydrothermal events, the first related to the chlorite–quartz–calcite alteration (Th = 116 °C–159 °C) and the second related to the sericite–quartz–ankerite alteration (Th = 220 °C–280 °C). This range of homogenization temperatures falls in the range of Th from fluid inclusions defined for typical epithermal deposits, i.e., approximately 150° to 300 °C [97]. The results of C and O isotopic analysis [3] determined for calcite associated with chloritization and ankerite associated with sericitization showed that fluids in equilibrium with calcite (δ13CPDB = −8.0 to −4.3‰; δ18OSMOW = −2.1 to 3.3‰) exhibit values that account for meteoric water input, whereas fluids in equilibrium with ankerite (δ13CPDB = −8.3 to −6.8‰; δ18OSMOW = 6.4 to 8.3‰) display magmatic affinity values [112,113]. These characteristics are in line with epithermal deposits, known to be associated with magmatism that results in meteoric water circulation; therefore, the isotopic composition of the mineralizing solutions would show a magmatic water component, particularly in low-sulphidation deposits where the mixing of fluids of magmatic origin and meteoric water occurs [102,114,115,116,117].
The earlier fluid inclusion study [3,55] related to the mineralizing event indicated salinities of 2.3–10.6 wt.% NaCl equivalent, CO2 as the dominant volatile species, and fluid pressures in the range from 770 to 1240 bars, equivalent to lithostatic depths of approximately 3–5 km. These results seem to be within the range of those from studies of fluid inclusions from epithermal deposits with generally < 3.5 wt.% NaCl equivalent [102], and others with a range between 0.1 and approximately 7.5 wt.% NaCl equivalent for precious metal deposits [97,118]. There is a relationship between precious metal ore with lower salinities in contrast to base-metal ores with relatively higher salinities (up to 23 wt.% equivalent values have been reported) in epithermal deposits [119,120] that also relates to a decrease in salinities and base-metal mineralization as the hydrothermal system evolves [121]. This feature is evident at Golden Ridge where the studied paragenetic stages indicated a decrease in base metals in Py-II, Py-III, and Py-IV compared to the initial stage Py-I (Figure 8c–e). Although uncommon, some hydrothermal systems in epithermal environments with near-neutral pH and deeply sourced fluids have been reported to be gas-rich, dominated by CO2 [122,123,124,125]. The reason for these CO2-dominated fluids at Golden Ridge is the interaction of oxidizing fluids with sediments and shales proximal to the Poplar Mountain Volcanic Complex. Most epithermal deposits form at shallow crustal levels [102,103,104], distinct from the > 3 km depth indicated by those fluid pressures from Golden Ridge. Regardless, epithermal activity can take place deeper than that generally described for this type of deposit in which the water–rock interaction or contributions from deep-seated magma chambers are the mechanisms promoting alteration and metal deposition [118,126]; the absence of boiling evidence, i.e., development of lattice textures, adularia, and crustiform-colloform banding [127] at Golden Ridge supports this hypothesis.
The fracturing and brecciation enhanced the penetration of meteoric waters that, along with the conversion of ferrous iron to pyrite in the chloritized areas, allowed the remobilization of gold as bisulphide complexes by these convecting meteoric waters percolating through this brittle environment [128,129]. The most important ligand at temperatures up to 350 °C is HS- with Au(HS)2- being the dominant complex at low temperatures, with the stability constant reaching maxima at 250 °C, reducing conditions and pH near to neutral [130,131]. Additionally, further transportation can take place in response to a sudden decrease in temperature, when a saturated gold-bearing fluid may allow gold to remain in suspension, resulting in this negatively charged colloidal gold adsorbing onto minerals with a positive surface charge, such as arsenian pyrite and arsenopyrite [80,132,133,134,135].

7. Conclusions

At Golden Ridge, gold mineralization was focused within a brittle part of a Middle Ordovician rhyolitic dome, along the faulted margin of ductile graphitic metasedimentary rocks; the wall-rock alteration assemblage includes illite, chlorite, albite, pyrite, quartz, and calcite, reflecting an almost neutral-pH composition of the mineralizing fluid, but with low salt contents. The porphyritic rhyodacite unit exhibits the local development of brittle quartz-cemented breccia, dilatant siliceous veins and veinlets with cockscomb textures, and minor amounts of carbonate with stibnite and sphalerite. The gold mineralization is closely associated with elevated sulphide contents (>3–4%), primarily arsenopyrite and lesser pyrite. To the knowledge of the authors, no diagnostic features of low-sulphidation epithermal systems (i.e., adularia, bladed calcite, and colloform-crustiform textures) have been identified at Golden Ridge, indicating that fluid boiling was not the mechanism of precipitation. Both the bulk rock data and the LA-ICP-MS spot analyses of pyrite and arsenopyrite show a strong correlation between gold and arsenic, and indicated that Py-II, Py-III, and Py-IV are arsenian pyrites. SEM-BSE imaging also indicated “invisible gold” as the main form of Au present in the deposit, in solid solution in the crystal lattice of pyrite and arsenopyrite, <100 nm nanoparticles, and micron-size inclusions. The detailed textural characteristics studied and their compositions suggest the existence of at least four syn-gold mineralization episodes, as separate fluid pulses: The first fluid was enriched in Sb, Pb, Cu, Co, Ni, and Bi, followed by a second pulse of hydrothermal fluid enriched in arsenic and gold, with lesser contents of Sb, Pb, Cu, Co, Ni, and Bi. The third and fourth pulses are enriched in both arsenic and gold and constitute the most important Au deposition stages. The repeated occurrences of growth zones with Au enrichment in the pyrites at Golden Ridge reflect surface adsorption during growth with gold deposition, i.e., a disequilibrium crystallization process. All of these characteristics better describe Golden Ridge as an evolving distal epithermal deposit in which a deep-seated intrusion provided the ore-forming fluid (magmatic component) episodically mixing with meteoric waters and then dominated by meteoric fluids that percolated through brittle domains along the major Woodstock Fault.

Author Contributions

Conceptualization and writing—original draft preparation, A.C.-V. and M.M.; methodology, A.C.-V. and D.R.L.; software, A.C.-V.; validation, A.C.-V., M.M. and D.R.L.; formal analysis, A.C.-V. and M.M.; investigation, A.C.-V. and M.M.; writing—review and editing, D.R.L. and K.G.T.; visualization, A.C.-V.; supervision, D.R.L.; project administration, D.R.L. and K.G.T.; funding acquisition, K.G.T. All authors have read and agreed to the published version of the manuscript.

Funding

This work was funded by the Province of New Brunswick through the Geological Surveys Branch of the Department of Natural Resources and Energy Development.

Data Availability Statement

All data generated or analyzed during this study are included in this published article.

Acknowledgments

The authors thank Brandon Boucher and Christopher McFarlane from the Department of Earth Sciences at the University of New Brunswick for guiding the LA-ICP-MS analysis. We would also like to thank Steven R. Cogswell and Douglas C. Hall from the Microscopy and Microanalysis Facility at the University of New Brunswick for assisting the SEM-EDS analysis. We acknowledge the anonymous reviewers for their meticulous and constructive reviews of the manuscript.

Conflicts of Interest

The authors declare no conflict of interest and warrant the manuscript represents original work that is not being considered for publication, in whole or in part, in another journal, book, conference proceedings, or government publication with a substantial circulation.

Appendix A. Multi-Method Analysis Compositions of Rocks from Golden Ridge

Table A1. Major and trace elements abundances of sericitized porphyritic rhyodacite from the Golden Ridge deposit.
AuAgAsCdCuMnMoNiPbZnBaBiCaCsFeGaGeHgKNaSbSSeTeTlW
Sampleppbppmppmppmppmppmppmppmppmppmppmppm%ppm%ppmppmppm%%ppm%ppmppmppmppm
GR-MM-015380<0.27430<0.57292<2426115<1001.361.022.533.291<0.1<10.350.1372.3040.3<0.1<0.126
GR-MM-0247400.410,000<0.530453<2677161<1002.022.42.034.511<0.1<10.330.4170.82.4830.3<0.10.16
GR-MM-03482<0.2464<0.57337<231470<1001.112.162.193.261<0.1<10.242.6110.71.4210.2<0.1<0.19
GR-MM-0432600.34540<0.539413<2133986<1002.522.9815.071<0.1<10.262.7442.83.4240.8<0.1<0.14
GR-MM-0539<0.286<0.58407<211140<1002.321.852.412.26<1<0.1<10.410.2115.60.103<0.1<0.10.15
GR-MM-06345<0.2382613181<2<1361210<1001.061.111.081.2<1<0.1<10.170.0427.10.762<0.1<0.1<0.16
GR-MM-072030<0.28490<0.53792<24425<1001.0641.824.77<1<0.1<10.320.1424.12.8920.4<0.10.1<4
GR-MM-084410<0.257500.513738<262675<1000.911.781.93.12<0.1<10.451.1331.41.686<0.1<0.1<0.120
GR-MM-0926600.2196074294<22261240<1000.920.942.055.662<0.1<10.340.116.84.9690.3<0.1<0.1<4
GR-MM-10774<0.26735.4939<2265837<1000.580.040.421.15<1<0.1<10.080.0449.90.9470.3<0.1<0.16
GR-MM-112750<0.24770<0.57420<210677<1001.782.521.033.452<0.1<10.342.55201.3810.5<0.1<0.1<4
GR-MM-125390<0.25860<0.54455<241152<1001.521.761.082.87<1<0.1<10.310.123.61.5210.3<0.1<0.110
GR-MM-1342709.963201.51160602<223500343<1002.162.020.962.66<1<0.1<10.260.0917201.0142.9<0.1<0.18
GR-MM-145570<0.27000<0.59579<221958<1002.123.12.245.721<0.1<10.331.7336.53.1871<0.1<0.113
GR-MM-1589<0.2145<0.511155<2<12144<1001.131.141.31.8<1<0.1<10.162.0712.80.1670.1<0.1<0.1<4
GR-MM-16723<0.21860<0.52467<22833<1000.532.060.563.891<0.1<10.160.078.80.456<0.1<0.1<0.1<4
GR-MM-1757<0.2150<0.59341<2<1874<1000.471.281.273.661<0.1<10.194.912.60.078<0.1<0.1<0.1<4
GR-MM-181940<0.24650<0.57557<28549<1000.521.960.812.7<1<0.1<10.221.9218.51.4330.1<0.10.19
GR-MM-199050.21700<0.523340<223235<1000.411.491.912.341<0.1<10.310.1238.41.1830.4<0.10.116
GR-MM-20680<0.28390.93358<2<1534<1000.30.221.631.461<0.1<10.330.0613.50.434<0.1<0.1<0.111
GR-MM-211550<0.23890<0.55312<231356<1000.461.552.693.171<0.1<10.340.0924.31.835<0.1<0.1<0.122
GR-MM-22435<0.21090<0.510246412255<1000.50.931.481.98<1<0.1<10.250.3223.51.387<0.1<0.10.47
GR-MM-231660<0.24260<0.54429<23941<1000.311.521.42.26<1<0.1<10.270.0829.81.1730.5<0.1<0.115
GR-MM-242860<0.28000<0.511388<222472<1000.421.821.743.45<1<0.1<10.30.1535.22.0870.6<0.1<0.16
GR-MM-253260<0.25640<0.55495<251469<1000.293.022.033.26<1<0.1<10.30.35360.9920.7<0.1<0.113
GR-MM-263590<0.25520<0.59556<262265<1000.461.721.183.25<1<0.1<10.320.1635.21.3460.4<0.1<0.17
GR-MM-274800<0.217400<0.54522<2<1934<1000.41.51.734.47<1<0.1<10.340.236.82.5080.7<0.1<0.127
GR-MM-282620<0.24770<0.54247<2<1434<1000.420.731.412.04<1<0.1<10.270.08241.2910.2<0.1<0.111
GR-MM-292580<0.24100<0.56740<2314113<1000.322.461.882.76<1<0.1<10.330.8427.91.0640.3<0.1<0.114
GR-MM-303880<0.25810<0.53533<242716<1000.332.222.153.552<0.1<10.430.7434.11.4960.7<0.1<0.112
GR-MM-312390<0.24490<0.53506<24947<1000.372.071.93.751<0.1<10.370.81222.1930.6<0.1<0.16
GR-MM-321930<0.23600<0.515852<234444<1000.365.712.012.19<1<0.1<10.370.1640.80.8830.4<0.1<0.115
GR-MM-332200<0.231500.75556<2816204<1000.343.191.612.2<1<0.1<10.240.0930.80.9780.4<0.1<0.117
GR-MM-344840.37741.321139<2<170143<1000.390.80.290.61<1<0.1<10.090.0246.90.2730.2<0.1<0.15
GR-MM-3510,200<0.213,900<0.57539<221357<1000.262.041.123.741<0.110.321.5337.32.3010.7<0.1<0.125
GR-MM-3655<0.2105<0.53382<22537<1000.372.471.552.721<0.1<10.22.556.40.145<0.1<0.1<0.1<4
GR-MM-371320<0.21570<0.52264<2<1531<1000.280.780.641.55<1<0.1<10.290.0662.50.8090.4<0.1<0.19
GR-MM-382440<0.23750<0.59512<282356<1000.522.351.223.381<0.1<10.370.17321.6270.6<0.1<0.111
GR-MM-392860<0.25950<0.55323<25867<1000.321.071.92.511<0.1<10.370.1629.91.4510.1<0.1<0.128
GR-MM-40199<0.2607<0.53357<2<1762<1000.242.360.522.281<0.1<10.261.978.30.713<0.1<0.1<0.1<4
GR-MM-412960<0.27920<0.58790<26756<1000.311.691.113.3<1<0.1<10.341.135.11.6990.1<0.1<0.115
GR-MM-423470<0.26310<0.514614<231066<1000.481.881.413.31<1<0.1<10.271.1132.81.7170.4<0.1<0.118
GR-MM-432620<0.24700<0.56495<241085<1000.272.191.752.47<1<0.1<10.280.94371.1220.2<0.1<0.120
GR-MM-442500<0.26350<0.512837<231659<1000.262.041.233.29<1<0.1<10.380.1341.81.3370.4<0.1<0.16

Appendix B. LA-ICP-MS Trace Element Data

Table A2. LA-ICP-MS spot analysis data of Py-I, Py-II, Py-III, and Py-IV.
StageSampleCoNiCuAsAgSbAuPbBi
Py-IGr-1070-43-10.30.868.02365.20.17.45.27.00.3
Py-IGr-1070-43-2698.8128.9142.8455.85.2166.51.71638.722.0
Py-IGr-1070-43-397.99.3202.951.21.67.70.291.81.0
Py-IGr-1070-43-4509.1247.2482.31194.39.9435.62.51149.921.4
Py-IGr-1070-43-5204.07.2132.51074.93.7183.91.5530.119.9
Py-IGr-1070-43-634.612.165.97651.51.8102.45.9342.67.1
Py-IGr-1070-43-7841.8126.0125.1321.55.0102.20.84117.316.8
Py-IGr-1070-38-6239.719.7361.31153.411.7181.82.01053.513.5
Py-IGr-1070-38-7812.268.5358.64861.636.3583.71.32029.734.2
Py-IGr-1070-38-8253.819.7664.92328.355.3527.02.0138.44.6
Py-IGr-1070-38-9398.932.6946.42835.911.6116.81.32004.524.4
Py-IGr-1070-38-10729.864.0256.82049.438.6562.83.41926.925.4
Py-IIGr-1070-38-117.86.788.115,133.40.00.229.40.40.0
Py-IIGr-1070-38-216.48.19.112,436.10.56.43.25.30.1
Py-IIGr-1070-38-30.20.118.216,584.10.00.35.90.50.0
Py-IIGr-1070-38-40.00.110.017,125.40.11.47.61.50.2
Py-IIGr-1070-38-591.510.4214.16001.89.2162.48.1970.18.6
Py-IIGr-1070-38-11124.519.691.522,396.70.49.615.125.51.8
Py-IIGr-1070-38-1231.116.217.619,252.60.12.123.32.20.2
Py-IIGr-1070-38-135.32.624.611,608.05.325.04.220.31.0
Py-IIGr-1070-38-140.50.728.311,612.31.015.64.821.10.6
Py-IIGr-1070-38-1565.125.938.013,705.00.01.420.80.80.1
Py-IIGR990295-10.00.124.314,128.30.732.411.358.80.6
Py-IIGR990295-20.10.133.520,987.80.423.118.342.40.5
Py-IIGR990295-30.36.28.8689.60.314.54.221.20.0
Py-IIGR990295-40.16.314.91939.61.474.56.7125.10.9
Py-IIGR990295-50.60.271.721,329.31.069.820.7108.31.5
Py-IIGR990295-65.31.193.423,382.71.373.455.7125.31.6
Py-IIIGr-10-55-61-10.00.12.84083.20.12.11.114.90.0
Py-IIIGr-10-55-61-20.20.135.026,430.00.711.813.133.10.1
Py-IIIGr-10-55-61-315.63.690.835,543.04.151.422.4131.10.6
Py-IIIGr-10-55-61-48.81.983.240,146.15.661.983.2229.51.2
Py-IIIGr-10-55-61-50.20.112.19401.20.02.52.24.20.0
Py-IIIGr-10-55-61-6186.039.692.529,366.60.17.042.84.21.1
Py-IIIGr-10-55-61-7115.720.430.026,196.60.228.243.519.20.3
Py-IIIGr-10-55-61-892.74.060.716,531.01.535.924.2118.612.8
Py-IIIGr-10-55-61-9163.333.573.136,846.60.13.678.35.00.2
Py-IIIGr-10-55-61-101.40.358.322,372.40.29.432.07.41.0
Py-IIIGr-1070-34-82.11.2218.139,604.51.648.61.435.10.8
Py-IIIGr-1070-34-96.82.3174.040,443.40.111.01.76.40.4
Py-IIIGr-1070-34-103.71.0125.136,642.60.210.07.011.50.1
Py-IIIGr-1070-34-117.30.785.124,583.71.143.13.351.10.6
Py-IIIGr-1070-34-1242.212.457.124,516.90.812.544.416.70.3
Py-IIIGr-1070-34-144.616.728.312,577.90.01.920.51.20.0
Py-IIIGr-1070-34-256.823.769.845,753.70.237.340.642.80.4
Py-IIIGr-1070-34-3175.922.3153.040,740.91.458.167.761.41.9
Py-IIIGr-1070-34-460.826.486.230,434.80.117.751.513.00.5
Py-IIIGr-1070-34-521.18.081.717,952.30.00.234.00.20.0
Py-IIIGr-1070-34-652.215.976.820,107.00.629.491.019.20.3
Py-IIIGr-1070-34-70.40.434.714,207.31.139.057.536.60.8
Py-IVGr-10-55-68-120.83.3103.828,196.10.02.136.32.40.3
Py-IVGr-10-55-68-29.91.8294.957,065.71.117.141.127.41.5
Py-IVGr-10-55-68-348.08.593.745,269.80.617.8104.531.71.0
Py-IVGr-10-55-68-543.49.8249.745,865.44.0129.3210.8214.67.0
Py-IVGr-10-55-68-639.83.5212.841,399.44.180.3178.6103.23.6
Py-IVGr-10-55-68-78.01.2149.742,512.61.023.159.434.21.2
Table A3. LA-ICP-MS spot analysis data of Asp-I and Asp-II.
StageSampleCoNiCuAgSbWAuPbBi
Asp-IAsp_GR0414-16.35-113.83.82.60.1820.01.020.12.30.1
Asp-IAsp_GR0414-16.35-223.77.411.20.1573.00.628.53.50.1
Asp-IAsp_GR0414-16.35-36.12.49.80.1889.00.418.84.20.3
Asp-IAsp_GR0414-16.35-421.86.827.00.2176.00.866.58.90.3
Asp-IAsp_GR0414-16.35-551.816.717.90.0155.80.063.31.30.0
Asp-IAsp_GR0414-16.35-646.713.526.00.3201.06.180.08.90.5
Asp-IAsp_GR1057-140-20-14.81.43.30.0508.00.040.78.31.0
Asp-IAsp_GR1057-140-20-217.93.99.60.11280.08.022.36.83.7
Asp-IAsp_GR1057-140-20-342.510.627.30.3277.00.644.39.21.9
Asp-IAsp_GR1057-140-20-459.012.022.70.0331.00.124.02.91.0
Asp-IAsp_GR1057-140-20-540.28.07.30.01478.00.019.81.03.2
Asp-IAsp_GR1057-140-20-613.62.42.10.02370.02.64.92.52.9
Asp-IAsp_GR0417-12.40-10.30.20.30.02620.00.08.40.30.7
Asp-IAsp_GR0417-12.40-21.60.32.00.12880.00.01.55.01.6
Asp-IAsp_GR0417-12.40-38.60.913.70.0437.00.073.20.30.3
Asp-IAsp_GR0417-12.40-433.75.010.90.1423.00.067.52.20.5
Asp-IAsp_GR0417-12.40-548.38.510.10.0200.00.0111.00.20.0
Asp-IAsp_GR0417-12.40-624.83.215.70.0226.00.1166.00.30.0
Asp-IAsp_GR0417-12.40-72.00.39.80.01730.00.037.60.21.1
Asp-IAsp_GR0417-12.40-83.30.80.80.02730.00.06.30.51.6
Asp-IAsp_GR0417-12.40-95.81.00.60.03800.00.08.90.41.4
Asp-IIAsp_GR1055-68.00-144.64.414.30.00.10.017.90.10.0
Asp-IIAsp_GR1055-68.00-22.10.5155.01.9152.00.0259.038.30.9
Asp-IIAsp_GR1055-68.00-318.42.786.00.517.30.088.914.70.2
Asp-IIAsp_GR1055-68.00-41.50.269.91.950.84.469.255.51.7
Asp-IIAsp_GR1055-68.00-51.50.145.91.952.76.362.667.31.1
Asp-IIAsp_GR1055-68.00-60.30.178.70.03.33.497.22.50.1
Asp-IIAsp_GR1055-68.00-70.10.168.60.519.43.670.822.20.4
Asp-IIAsp_GR1055-68.00-80.10.055.71.444.15.569.542.31.3
Asp-IIAsp_GR9902-95.6-11.00.57.40.01263.00.0228.00.30.6
Asp-IIAsp_GR9902-95.6-25.81.919.60.2648.00.0334.08.10.8
Asp-IIAsp_GR9902-95.6-39.02.315.40.1567.00.0232.07.80.5
Asp-IIAsp_GR9902-95.6-46.01.620.90.11050.00.04.29.71.8
Asp-IIAsp_GR9902-95.6-5320.090.635.61.2519.00.25.752.92.5
Asp-IIAsp_GR9902-95.6-61.90.614.00.2535.00.0135.112.71.2
Asp-IIAsp_GR9902-95.6-710.54.517.20.2997.00.1295.010.71.1

Appendix C. Complementary SEM-EDS and LA-ICP-MS Analyses Data

Table A4. SEM-EDS compositions of pyrite and arsenopyrite from Golden Ridge.
wt.% at.%
StageAsSFeTotalAsSFeS/Fe
Py-I0.3651.6047.3999.350.2065.3534.461.90
Py-I0.3651.3347.8399.520.2065.0234.791.87
Py-I0.2451.6847.2999.210.1365.4734.401.90
Py-I0.1852.3146.4798.960.1066.1633.751.96
Py-II1.3951.6946.6299.700.7565.3933.861.93
Py-II1.2851.8246.1299.220.6965.7233.581.96
Py-II1.4751.6546.6399.750.8065.3433.871.93
Py-II1.4251.7246.89100.030.7765.2633.971.92
Py-III1.8151.4545.9699.220.9965.4533.571.95
Py-III1.6952.3145.3999.390.9166.1432.952.01
Py-III1.5852.0245.8099.400.8665.8533.291.98
Py-IV3.1650.8345.2199.201.7365.0533.221.96
Py-IV2.5151.2245.4499.171.3765.3433.291.96
Py-IV2.3050.6345.3498.271.2765.2033.531.94
wt.% at.%
AsSFeTotalAsSFeAs/S
Asp-I41.9622.4037.27101.6329.0736.2734.650.80
Asp-I41.2022.7837.12101.1028.5636.9134.520.77
Asp-I40.1523.7437.46101.3427.5238.0234.450.72
Asp-I41.0023.0437.08101.1228.3637.2334.410.76
Asp-I42.0522.6537.06101.7529.0636.5734.370.79
Asp-I41.4223.0737.06101.5528.5637.1634.280.77
Asp-I41.7822.5637.09101.4428.9636.5434.500.79
Asp-I42.1922.3236.38100.8929.4736.4334.100.81
Asp-I42.2422.1137.30101.6429.3535.8934.770.82
Asp-II42.2522.0636.49100.7929.6036.1134.300.82
Asp-II41.1322.7836.70100.6128.6437.0834.280.77
Asp-II40.5223.5136.99101.0327.9337.8734.210.74
Asp-II41.7122.4236.97101.1029.0336.4534.520.80
Asp-II41.6422.4136.65100.6929.0836.5734.350.80
Asp-II40.8123.1737.14101.1128.1937.4034.410.75
Asp-II42.0922.1636.72100.9829.4136.1734.420.81
Asp-II40.8622.4836.68100.0128.6636.8334.510.78
Asp-II41.1322.8536.87100.8528.5737.0734.360.77
Asp-II42.1422.4636.25100.8629.4236.6433.950.80
Table A5. LA-ICP-MS spot analysis data of unknown sulphide phase.
SampleSCuZnPdAgSnSbTeWAuTlPbBi
GR1164A-unknown-1468,298192,4711214.611110.39260,85734.456.60.011.73665,040272
GR1164A-unknown-2469,133177,0531425.75670.20277,90723.3139.00.011.09719,082239
GR1164A-unknown-3640,517300,3271408.40910.48420,67466.00.200.001.551,120,807349
GR1164A-unknown-4462,110184,2131116.261200.51295,27214.2108.00.012.22726,98940
GR1164A-unknown-5580,348272,319577.71950.67404,48568.42.50.003.471,056,271199
GR1164A-unknown-6589,776270,29510510.001010.20407,271115.00.00.002.291,002,284276
GR1164A-unknown-7710,725307,7881307.602501.90513,06234.00.20.004.101,299,01863
GR1164A-unknown-8610,371285,6471319.102510.35477,01719.40.10.002.701,139,270115
GR1164A-unknown-9596,101258,696829.302150.44438,63822.50.00.002.93998,72757
GR1164A-unknown-10571,239235,948577.491800.32386,34528.817.70.003.33872,97856
GR1164A-unknown-11495,823205,861747.171430.34314,09119.683.50.003.35736,43044

Appendix D. Complementary LA-ICP-MS Map

Figure A1. Trace element LA-ICP-MS map of an Asp-II grain (GR1070:34.00m). (a) Reflected-light photomicrograph of the arsenopyrite grain; (bj) distributions of Au, As, Co, Ni, Cu, Ag, Sb, Pb, and Bi, respectively; (k) LA-ICP-MS counts for a laser burn across the pyrite grain (representative time-resolved profile) showing distribution of Au, As, Co, Ni, Cu, Ag, Sb, Pb, and Bi.
Minerals 13 00954 g0a1

References

  1. Hilchey, A.; Webster, P. Technical Report on Mineral Resource Estimate for Portage Minerals Inc. and Freewest Resources Canada Inc: Mercator Geological Services; Golden Ridge Property: York County, NB, Canada, 2011; p. 81. [Google Scholar]
  2. Chi, G.; Watters, S.E. Preliminary Geological and Petrographic Study of the Poplar Mountain Au Occurrence, Southwestern New Brunswick; Current Research 2002-D6; Geological Survey of Canada: Ottawa, ON, Canada, 2002; p. 11. [CrossRef]
  3. Chi, G.; Watters, S.; Davis, W.J.; Ni, P.; Castonguay, S.; Hoy, D. Geologic, Geochemical, and Geochronological Constraints on the Genesis of Gold Mineralization at Poplar Mountain, Western New Brunswick, Canada. Explor. Min. Geol. 2008, 17, 101–130. [Google Scholar] [CrossRef]
  4. Adams, M.D. Overview of the Gold Mining Industry and Major Gold Deposits. In Gold Ore Processing, 2nd ed.; Adams, M.D., Ed.; Elsevier: Amsterdam, The Netherlands, 2016; pp. 25–30. [Google Scholar] [CrossRef]
  5. Aleksandrova, T.N.; Talovina, I.V.; Duryagina, A.M. Gold–sulphide deposits of the Russian Arctic zone: Mineralogical features and prospects of ore benefication. Geochemistry 2020, 80, 125510. [Google Scholar] [CrossRef]
  6. Cathelineau, M.; Boiron, M.-C.; Holliger, P.; Marion, P.; Denis, M. Gold in Arsenopyrites: Crystal Chemistry, Location and State, Physical and Chemical Conditions of Deposition. In The Geology of Gold Deposits: The Perspective in 1988; Keays, R.R., Ramsay, W.R.H., Groves, D.I., Eds.; Society of Economic Geologists: Littleton, CO, USA, 1989; pp. 328–341. [Google Scholar] [CrossRef]
  7. Cook, N.; Chryssoulis, S.L. Concentrations of invisible gold in the common sulfides. Can. Mineral. 1990, 28, 1–16. [Google Scholar]
  8. Fleet, M.E.; Chryssoulis, S.L.; MacLean, P.J.; Davidson, R.; Weisener, C.G. Arsenian pyrite from gold deposits; Au and As distribution investigated by SIMS and EMP, and color staining and surface oxidation by XPS and LIMS. Can. Mineral. 1993, 31, 1–17. [Google Scholar]
  9. Genkin, A.D.; Bortnikov, N.S.; Cabri, L.J.; Wagner, F.E.; Stanley, C.J.; Safonov, Y.G.; McMahon, G.; Friedl, J.; Kerzin, A.L.; Gamyanin, G.N. A multidisciplinary study of invisible gold in arsenopyrite from four mesothermal gold deposits in Siberia, Russian Federation. Econ. Geol. 1998, 93, 463–487. [Google Scholar] [CrossRef]
  10. Majumdar, S.; Singh, S.; Sahoo, P.R.; Venkatesh, A.S. Trace-element systematics of pyrite and its implications for refractory gold mineralisation within the carbonaceous metasedimentary units of Palaeoproterozoic South Purulia shear zone, eastern India. J. Earth Syst. Sci. 2019, 128, 233. [Google Scholar] [CrossRef] [Green Version]
  11. Wells, J.D.; Mullens, T.E. Gold-Bearing Arsenian Pyrite Determined by Microprobe Analysis, Cortez and Carlin Gold mines, Nevada. Econ. Geol. 1973, 68, 187–201. [Google Scholar] [CrossRef]
  12. Asamoah, R.K.; Zanin, M.; Gascooke, J.; Skinner, W.; Addai-Mensah, J. Refractory gold ores and concentrates part 1: Mineralogical and physico-chemical characteristics. Miner. Process. Extr. Metall. 2021, 130, 240–252. [Google Scholar] [CrossRef]
  13. Fraser, K.S.; Walton, R.H.; Wells, J.A. Processing of refractory gold ores. Miner. Eng. 1991, 4, 1029–1041. [Google Scholar] [CrossRef]
  14. Iglesias, N.; Carranza, F. Refractory gold-bearing ores: A review of treatment methods and recent advances in biotechnological techniques. Hydrometallurgy 1994, 34, 383–395. [Google Scholar] [CrossRef]
  15. Rabieh, A.; Albijanic, B.; Eksteen, J.J. A review of the effects of grinding media and chemical conditions on the flotation of pyrite in refractory gold operations. Miner. Eng. 2016, 94, 21–28. [Google Scholar] [CrossRef]
  16. Vaughan, J.P.; Kyin, A. Refractory gold ores in Archaean greenstones, Western Australia: Mineralogy, gold paragenesis, metallurgical characterization and classification. Mineral. Mag. 2004, 68, 255–277. [Google Scholar] [CrossRef]
  17. Yang, S.; Blum, N.; Rahders, E.; Zhang, Z. The nature of invisible gold in sulfides from the Xiangxi Au-Sb-W ore deposit in northwestern Hunan, People’s Republic of China. Can. Mineral. 1998, 36, 1361–1372. [Google Scholar]
  18. Abraitis, P.K.; Pattrick, R.A.D.; Vaughan, D.J. Variations in the compositional, textural and electrical properties of natural pyrite: A review. Int. J. Miner. Process. 2004, 74, 41–59. [Google Scholar] [CrossRef]
  19. Harris, D.C. The Mineralogy of gold and its relevance to gold recoveries. Miner. Deposita 1990, 25, S3–S7. [Google Scholar] [CrossRef]
  20. Abolins, U. National Instrument 43–101 Technical Report for First Narrow Resources: Abex Geological Services; Golden Ridge Property: York County, NB, Canada, 2003. [Google Scholar]
  21. McLeod, M.J.; Hoy, D.; Thorne, K.G. History, Tectonic Setting, and Models for Instrusion-Related Gold Deposits in Southwestern New Brunswick, Canada: Examples from the Clarence Stream Area. Explor. Min. Geol. 2008, 17, 1–12. [Google Scholar] [CrossRef]
  22. Hatcher, R.D. The Appalachian orogen: A brief summary. In From Rodinia to Pangea: The Lithotectonic Record of the Appalachian Region; Tollo, R.P., Bartholomew, M.J., Hibbard, J.P., Karabinos, P.M., Eds.; Geological Society of America: Boulder, CO, USA, 2010; Volume 206, pp. 1–19. [Google Scholar] [CrossRef]
  23. Van Staal, C.R. Pre-Carboniferous tectonic evolution and metallogeny of the Canadian Appalachians. In Mineral Deposits of Canada: A Synthesis of Major Deposit-Types, District Metallogeny, the Evolution of Geological Provinces, and Exploration Methods; Goodfellow, W.D., Ed.; Geological Association of Canada: St. John’s, NL, Canada, 2007; Volume 5, pp. 793–818. [Google Scholar]
  24. van Staal, C.R.; Barr, S.M. Lithospheric architecture and tectonic evolution of the Canadian Appalachians. In Tectonic Styles in Canada: The Lithoprobe Perspective; Percival, J.A., Cook, F.A., Clowes, R.M., Eds.; Geological Association of Canada: St. John’s, NL, Canada, 2012; pp. 41–95. [Google Scholar]
  25. Williams, H. Appalachian Orogen in Canada. Can. J. Earth Sci. 1979, 16, 792–807. [Google Scholar] [CrossRef]
  26. Williams, H. Temporal and spatial divisions. In Geology of the Appalachian-Caledonian Orogen in Canada and Greenland; Williams, H., Ed.; Geological Survey of Canada: Ottawa, ON, Canada, 1995; pp. 21–44. [Google Scholar]
  27. van Staal, C.R.; Sullivan, R.W.; Whalen, J.B. Provenance of tectonic history of the Gander Zone in the Caledonian/Appalachian Orogen: Implications for the origin and assembly of Avalon. In Avalonian and Related Peri-Gondwanan Terranes of the Circum-North Atlantic; Nance, R.D., Thompson, M.D., Eds.; Geological Society of America: Boulder, CO, USA, 1996; Volume 304, pp. 347–367. [Google Scholar] [CrossRef]
  28. van Staal, C.R.; Dewey, J.F.; Niocaill, C.M.; McKerrow, W.S. The Cambrian-Silurian tectonic evolution of the northern Appalachians and British Caledonides: History of a complex, west and southwest Pacific-type segment of Iapetus. Geol. Soc. Lond. Spec. Publ. 1998, 143, 197–242. [Google Scholar] [CrossRef]
  29. van Staal, C.R.; Whalen, J.B.; Valverde-Vaquero, P.; Zagorevski, A.; Rogers, N. Pre-Carboniferous, episodic accretion-related, orogenesis along the Laurentian margin of the northern Appalachians. Geol. Soc. Lond. Spec. Publ. 2009, 327, 271–316. [Google Scholar] [CrossRef]
  30. Waldron, J.W.F.; McCausland, P.J.A.; Barr, S.M.; Schofield, D.I.; Reusch, D.; Wu, L. Terrane history of the Iapetus Ocean as preserved in the northern Appalachians and western Caledonides. Earth-Sci. Rev. 2022, 233, 104163. [Google Scholar] [CrossRef]
  31. Ludman, A.; McFarlane, C.; Whittaker, A.T.H. Age, chemistry, and tectonic setting of Miramichi terrane (Early Paleozoic) volcanic rocks, eastern and east-central Maine, USA. Atl. Geosci. 2021, 57, 239–273. [Google Scholar] [CrossRef]
  32. Romer, R.L.; Kroner, U. Paleozoic gold in the Appalachians and Variscides. Ore Geol. Rev. 2018, 92, 475–505. [Google Scholar] [CrossRef]
  33. Waldron, J.W.F.; Barr, S.M.; Park, A.F.; White, C.E.; Hibbard, J. Late Paleozoic strike-slip faults in Maritime Canada and their role in the reconfiguration of the northern Appalachian orogen. Tectonics 2015, 34, 1661–1684. [Google Scholar] [CrossRef]
  34. Waldron, J.W.F.; Schofield, D.I.; Murphy, J.B. Diachronous Paleozoic accretion of peri-Gondwanan terranes at the Laurentian margin. In Fifty Years of the Wilson Cycle Concept in Plate Tectonics; Wilson, R.W., Houseman, G.A., McCaffrey, K.J.W., Doré, A.G., Buiter, S.J.H., Eds.; Geological Society of London: London, UK, 2019; Volume 470, pp. 289–309. [Google Scholar] [CrossRef]
  35. van Staal, C.R.; Hatcher, R.D., Jr. Global setting of Ordovician orogenesis. In The Ordovician Earth System; Finney, S.C., Berry, W.B.N., Eds.; Geological Society of America: Boulder, CO, USA, 2010; Volume 466, pp. 1–11. [Google Scholar] [CrossRef] [Green Version]
  36. Fyffe, L.R.; Johnson, S.C.; Staal, C.R. van A Review of Proterozoic to Early Paleozoic Lithotectonic Terranes in New Brunswick, Canada and their Tectonic Evolution during Penobscot, Taconic, Salinic and Acadian Orogenesis. Atl. Geosci. 2011, 47, 211–248. [Google Scholar] [CrossRef] [Green Version]
  37. Barr, S.M.; White, C.E. Field Relations, Petrology and Structure of Neoproterozoic Rocks in the Caledonian Highlands, Southern New Brunswick; Geological Survey of Canada Bulletin: Ottawa, ON, Canada, 1999; p. 101.
  38. Barr, S.M.; White, C.E. Contrasts in late Precambrian-early Paleozoic tectonothermal history between Avalon composite terrane sensu stricto and other possible peri-Gondwanan terranes in southern New Brunswick and Cape Breton Island, Canada. In Avalonian and Related peri-Gondwanan Terranes of the Circum-North Atlantic; Nance, R.D., Thompson, M.D., Eds.; Geological Society of America: Boulder, CO, USA, 1996; Volume 304, pp. 95–108. [Google Scholar] [CrossRef]
  39. Barr, S.M.; Johnson, S.C.; Dunning, G.R.; White, C.E.; Park, A.F.; Wälle, M.; Langille, A. New Cryogenian, Neoproterozoic, and middle Paleozoic U–Pb zircon ages from the Caledonia terrane, southern New Brunswick, Canada: Better constrained but more complex volcanic stratigraphy. Atl. Geosci. 2020, 56, 163–187. [Google Scholar] [CrossRef]
  40. Fyffe, L.R. Stratigraphy and geochemistry of Ordovician volcanic rocks of the Eel River area, west-central New Brunswick. Atl. Geosci. 2001, 37, 81–102. [Google Scholar] [CrossRef] [Green Version]
  41. Fyffe, L.R.; van Staal, C.R.; Wilson, R.A.; Johnson, S.C. An overview of Early Paleozoic arc systems in New Brunswick, Canada, and eastern Maine, USA. Atl. Geosci. 2023, 59, 01–028. [Google Scholar] [CrossRef]
  42. McClenaghan, S.H.; Lentz, D.R.; Fyffe, L.R. Chemostratigraphy of Volcanic Rocks Hosting Massive Sulfide Clasts Within the Meductic Group, West-Central New Brunswick. Explor. Min. Geol. 2006, 15, 241–261. [Google Scholar] [CrossRef]
  43. Bourque, P.-A.; Malo, M.; Kirkwood, D. Paleogeography and tectono-sedimentary history at the margin of Laurentia during Silurian to earliest Devonian time: The Gaspé Belt, Québec. GSA Bull. 2000, 112, 4–20. [Google Scholar] [CrossRef]
  44. Fyffe, L.R.; Fricker, A. Tectonostratigraphic terrane analysis of New Brunswick. Atl. Geosci. 1987, 23, 113–122. [Google Scholar] [CrossRef] [Green Version]
  45. Malo, M. Stratigraphy of the Aroostook–Percé Anticlinorium in the Gaspé Peninsula, Quebec. Can. J. Earth Sci. 1988, 25, 893–908. [Google Scholar] [CrossRef]
  46. Malo, M. Late Silurian–Early Devonian tectono-sedimentary history of the Gaspé Belt in the Gaspé Peninsula: From a transtensional Salinic basin to an Acadian foreland basin. Bull. Can. Pet. Geol. 2001, 49, 202–216. [Google Scholar] [CrossRef]
  47. Rast, N.; Lutes, G.G.; St. Peter, C. The Geology and Deformation History of the Southern Part of the Matapedia Zone and Its Relationship to the Miramichi Zone and Canterbury Basin. In The Geology of Northeastern Maine and Neighboring New Brunswick; New England Intercollegiate Geological Excursion Conference Trips: Presque Isle, ME, USA, 1980; pp. 191–201. [Google Scholar]
  48. Whalen, J.B.; Jenner, G.A.; Longstaffe, F.J.; Hegner, E. Nature and evolution of the eastern margin of lapetus: Geochemical and isotopic constraints from Siluro-Devonian granitoid plutons in the New Brunswick Appalachians. Can. J. Earth Sci. 1996, 33, 140–155. [Google Scholar] [CrossRef]
  49. Whalen, J.B.; Rogers, N.; van Staal, C.R.; Longstaffe, F.J.; Jenner, G.A.; Winchester, J.A. Geochemical and isotopic (Nd, O) data from Ordovician felsic plutonic and volcanic rocks of the Miramichi Highlands: Petrogenetic and metallogenic implications for the Bathurst Mining Camp. Can. J. Earth Sci. 1998, 35, 237–252. [Google Scholar] [CrossRef]
  50. Bevier, M.L.; Whalen, J.B. Tectonic significance of Silurian magmatism in the Canadian Appalachians. Geology 1990, 18, 411–414. [Google Scholar] [CrossRef]
  51. Caron, A. Geology of the Pokiok Batholith Aureole, with Emphasis on the Lake George Mine, York Country, New Brunswick; Geoscience Report 94–2; New Brunswick Department of Natural Resources and Energy: Fredericton, NB, Canada, 1996; p. 91.
  52. Hart, C. Reduced intrusion-related gold deposits. In Mineral Deposits of Canada: A Synthesis of Major Deposit Types, District Metallogeny, the Evolution of Geological Provinces, and Exploration Methods; Goodfellow, W.D., Ed.; Geological Association of Canada: St. John’s, NL, Canada, 2007; pp. 95–112. [Google Scholar]
  53. Thorne, K.G.; Lentz, D.R.; Hoy, D.; Fyffe, L.R.; Cabri, L.J. Characteristics of mineralization at the main zone of the Clarence Stream gold deposit, southwestern New Brunswick, Canada: Evidence for an intrusion-related gold system in the northern Appalachian Orogen. Explor. Min. Geol. 2008, 17, 13–49. [Google Scholar] [CrossRef]
  54. Taylor, B.E. Epithermal gold deposits. In Mineral Deposits of Canada: A Synthesis of Major Deposit Types, District Metallogeny, the Evolution of Geological Provinces, and Exploration Methods; Goodfellow, W.D., Ed.; Geological Association of Canada: St. John’s, NL, Canada, 2007; pp. 113–139. [Google Scholar]
  55. Chi, G. Fluid Compositions and Temperature-Pressure Conditions of Intrusion-Related Gold Systems in Southwestern New Brunswick—A Fluid-Inclusion Study; Current research 2002-E13; Geological Survey of Canada: Ottawa, ON, Canada, 2002.
  56. Lentz, C.; Thorne, K.; McFarlane, C.R.M.; Archibald, D.A. U-Pb, Ar-Ar, and Re-Os Geochronological Constraints on Multiple Magmatic–Hydrothermal Episodes at the Lake George Mine, Central New Brunswick. Minerals 2020, 10, 566. [Google Scholar] [CrossRef]
  57. Hoffman, E.L. Instrumental neutron activation in geoanalysis. J. Geochem. Explor. 1992, 44, 297–319. [Google Scholar] [CrossRef]
  58. Paton, C.; Hellstrom, J.; Paul, B.; Woodhead, J.; Hergt, J. Iolite: Freeware for the visualisation and processing of mass spectrometric data. J. Anal. At. Spectrom. 2011, 26, 2508–2518. [Google Scholar] [CrossRef]
  59. Ulrich, T.; Kamber, B.S.; Jugo, P.J.; Tinkham, D.K. Imaging element-distribution patterns in minerals by Laser Ablation—Inductively Coupled Plasma—Mass Spectrometry (LA–ICP–MS). Can. Mineral. 2009, 47, 1001–1012. [Google Scholar] [CrossRef]
  60. Paul, B.; Paton, C.; Norris, A.; Woodhead, J.; Hellstrom, J.; Hergt, J.; Greig, A. CellSpace: A module for creating spatially registered laser ablation images within the Iolite freeware environment. J. Anal. At. Spectrom. 2012, 27, 700–706. [Google Scholar] [CrossRef]
  61. Woodhead, J.D.; Hellstrom, J.; Hergt, J.M.; Greig, A.; Maas, R. Isotopic and Elemental Imaging of Geological Materials by Laser Ablation Inductively Coupled Plasma-Mass Spectrometry. Geostand. Geoanal. Res. 2007, 31, 331–343. [Google Scholar] [CrossRef]
  62. Croghan, C.W.; Egeghy, P.P. Methods of Dealing with Values below the Limit of Detection Using SAS.; United States Environmental Protection Agency: St. Petersburg, FL, USA, 2003.
  63. Reimann, C.; Filzmoser, P.; Hron, K.; Kynčlová, P.; Garrett, R.G. A new method for correlation analysis of compositional (environmental) data—a worked example. Sci. Total Environ. 2017, 607, 965–971. [Google Scholar] [CrossRef] [PubMed]
  64. Grunsky, E.C.; Caritat, P. de State-of-the-art analysis of geochemical data for mineral exploration. Geochem. Explor. Environ. Anal. 2019, 20, 217–232. [Google Scholar] [CrossRef]
  65. Heidarian, H.; Lentz, D.R.; Thorne, K.; Rogers, N. Application of portable X-ray and micro-X-ray fluorescence spectrometry to characterize alteration and mineralization within various gold deposits hosted in southern New Brunswick, Canada. J. Geochem. Explor. 2021, 229, 106847. [Google Scholar] [CrossRef]
  66. Grunsky, E.C. The interpretation of geochemical survey data. Geochem. Explor. Environ. Anal. 2010, 10, 27–74. [Google Scholar] [CrossRef]
  67. Flude, S.; Haschke, M.; Storey, M. Application of benchtop micro-XRF to geological materials. Mineral. Mag. 2017, 81, 923–948. [Google Scholar] [CrossRef] [Green Version]
  68. Lipko, S.; Tauson, V.; Bychinskii, V. Gold Partitioning in a Model Multiphase Mineral-Hydrothermal Fluid System: Distribution Coefficients, Speciation and Segregation. Minerals 2020, 10, 890. [Google Scholar] [CrossRef]
  69. Levitan, D.M.; Zipper, C.E.; Donovan, P.; Schreiber, M.E.; Seal, R.R.; Engle, M.A.; Chermak, J.A.; Bodnar, R.J.; Johnson, D.K.; Aylor, J.G. Statistical analysis of soil geochemical data to identify pathfinders associated with mineral deposits: An example from the Coles Hill uranium deposit, Virginia, USA. J. Geochem. Explor. 2015, 154, 238–251. [Google Scholar] [CrossRef]
  70. Reich, M.; Kesler, S.E.; Utsunomiya, S.; Palenik, C.S.; Chryssoulis, S.L.; Ewing, R.C. Solubility of gold in arsenian pyrite. Geochim. Cosmochim. Acta 2005, 69, 2781–2796. [Google Scholar] [CrossRef]
  71. Stepanov, A.S.; Large, R.R.; Kiseeva, E.S.; Danyushevsky, L.V.; Goemann, K.; Meffre, S.; Zhukova, I.; Belousov, I.A. Phase relations of arsenian pyrite and arsenopyrite. Ore Geol. Rev. 2021, 136, 104285. [Google Scholar] [CrossRef]
  72. Deditius, A.P.; Reich, M.; Kesler, S.E.; Utsunomiya, S.; Chryssoulis, S.L.; Walshe, J.; Ewing, R.C. The coupled geochemistry of Au and As in pyrite from hydrothermal ore deposits. Geochim. Cosmochim. Acta 2014, 140, 644–670. [Google Scholar] [CrossRef] [Green Version]
  73. Pokrovski, G.S.; Kokh, M.A.; Proux, O.; Hazemann, J.-L.; Bazarkina, E.F.; Testemale, D.; Escoda, C.; Boiron, M.-C.; Blanchard, M.; Aigouy, T.; et al. The nature and partitioning of invisible gold in the pyrite-fluid system. Ore Geol. Rev. 2019, 109, 545–563. [Google Scholar] [CrossRef]
  74. Zhao, H.-X.; Frimmel, H.E.; Jiang, S.-Y.; Dai, B.-Z. LA-ICP-MS trace element analysis of pyrite from the Xiaoqinling gold district, China: Implications for ore genesis. Ore Geol. Rev. 2011, 43, 142–153. [Google Scholar] [CrossRef]
  75. Sung, Y.-H.; Brugger, J.; Ciobanu, C.L.; Pring, A.; Skinner, W.; Nugus, M. Invisible gold in arsenian pyrite and arsenopyrite from a multistage Archaean gold deposit: Sunrise Dam, Eastern Goldfields Province, Western Australia. Miner. Deposita 2009, 44, 765–791. [Google Scholar] [CrossRef]
  76. Bajwah, Z.U.; Seccombe, P.K.; Offler, R. Trace element distribution, Co:Ni ratios and genesis of the big cadia iron-copper deposit, new south wales, australia. Miner. Deposita 1987, 22, 292–300. [Google Scholar] [CrossRef]
  77. Bralia, A.; Sabatini, G.; Troja, F. A revaluation of the Co/Ni ratio in pyrite as geochemical tool in ore genesis problems: Evidences from southern tuscany pyritic deposits. Miner. Deposita 1979, 14, 353–374. [Google Scholar] [CrossRef]
  78. Loftus-Hills, G.; Solomon, M. Cobalt, nickel and selenium in sulphides as indicators of ore genesis. Miner. Deposita 1967, 2, 228–242. [Google Scholar] [CrossRef]
  79. Thomas, H.V.; Large, R.R.; Bull, S.W.; Maslennikov, V.; Berry, R.F.; Fraser, R.; Froud, S.; Moye, R. Pyrite and Pyrrhotite Textures and Composition in Sediments, Laminated Quartz Veins, and Reefs at Bendigo Gold Mine, Australia: Insights for Ore Genesis. Econ. Geol. 2011, 106, 1–31. [Google Scholar] [CrossRef]
  80. Fleet, M.E.; Mumin, A.H. Gold-bearing arsenian pyrite and marcasite and arsenopyrite from Carlin Trend gold deposits and laboratory synthesis. Am. Mineral. 1997, 82, 182–193. [Google Scholar] [CrossRef]
  81. Xing, Y.; Brugger, J.; Tomkins, A.; Shvarov, Y. Arsenic evolution as a tool for understanding formation of pyritic gold ores. Geology 2019, 47, 335–338. [Google Scholar] [CrossRef]
  82. Tauson, V.; Lipko, S.; Kravtsova, R.; Smagunov, N.; Belozerova, O.; Voronova, I. Distribution of “Invisible” Noble Metals between Pyrite and Arsenopyrite Exemplified by Minerals Coexisting in Orogenic Au Deposits of North-Eastern Russia. Minerals 2019, 9, 660. [Google Scholar] [CrossRef] [Green Version]
  83. Tang, Q.; Di, P.; Yu, M.; Bao, J.; Zhao, Y.; Liu, D.; Wang, Y. Mineralogy and Geochemistry of Pyrite and Arsenopyrite from the Zaozigou Gold Deposit in West Qinling Orogenic Belt, Central China: Implications for Ore Genesis. Resour. Geol. 2019, 69, 314–332. [Google Scholar] [CrossRef]
  84. Cabri, L.J.; Newville, M.; Gordon, R.A.; Crozier, E.D.; Sutton, S.R.; McMahon, G.; Jiang, D.-T. Chemical speciation of gold in arsenopyrite. Can. Mineral. 2000, 38, 1265–1281. [Google Scholar] [CrossRef] [Green Version]
  85. Sharp, Z.D.; Essene, E.J.; Kelly, W.C. A re-examination of the arsenopyrite geothermometer; pressure considerations and applications to natural assemblages. Can. Mineral. 1985, 23, 517–534. [Google Scholar]
  86. Kretschmar, U.; Scott, S.D. Phase relations involving arsenopyrite in the system Fe-As-S and their application. Can. Mineral. 1976, 14, 364–386. [Google Scholar]
  87. Chouinard, A.; Paquette, J.; Williams-Jones, A.E. Crystallographic controls on Trace-Element incorporation in auriferous pyrite from the Pascua Epithermal High-Sulfidation Deposit, Chile–Argentina. Can. Mineral. 2005, 43, 951–963. [Google Scholar] [CrossRef] [Green Version]
  88. Deditius, A.P.; Utsunomiya, S.; Ewig, R.C.; Chryssoulis, S.L.; Venter, D.; Kesler, S.E. Decoupled geochemical behavior of As and Cu in hydrothermal systems. Geology 2009, 37, 707–710. [Google Scholar] [CrossRef]
  89. Tiller, W.A.; Ahn, K.-S. Interface field effects on solute redistribution during crystallization. J. Cryst. Growth 1980, 49, 483–501. [Google Scholar] [CrossRef]
  90. Watson, E.B. Surface enrichment and trace-element uptake during crystal growth. Geochim. Cosmochim. Acta 1996, 60, 5013–5020. [Google Scholar] [CrossRef]
  91. Deditius, A.P.; Utsunomiya, S.; Renock, D.; Ewing, R.C.; Ramana, C.V.; Becker, U.; Kesler, S.E. A proposed new type of arsenian pyrite: Composition, nanostructure and geological significance. Geochim. Cosmochim. Acta 2008, 72, 2919–2933. [Google Scholar] [CrossRef]
  92. Simon, G.; Kesler, S.E.; Chryssoulis, S. Geochemistry and textures of gold-bearing arsenian pyrite, Twin Creeks, Nevada; implications for deposition of gold in carlin-type deposits. Econ. Geol. 1999, 94, 405–421. [Google Scholar] [CrossRef]
  93. Cook, N.J.; Ciobanu, C.L.; Mao, J. Textural control on gold distribution in As-free pyrite from the Dongping, Huangtuliang and Hougou gold deposits, North China Craton (Hebei Province, China). Chem. Geol. 2009, 264, 101–121. [Google Scholar] [CrossRef]
  94. Large, R.R.; Danyushevsky, L.; Hollit, C.; Maslennikov, V.; Meffre, S.; Gilbert, S.; Bull, S.; Scott, R.; Emsbo, P.; Thomas, H.; et al. Gold and Trace Element Zonation in Pyrite Using a Laser Imaging Technique: Implications for the Timing of Gold in Orogenic and Carlin-Style Sediment-Hosted Deposits. Econ. Geol. 2009, 104, 635–668. [Google Scholar] [CrossRef]
  95. Watson, E.B. A conceptual model for near-surface kinetic controls on the trace-element and stable isotope composition of abiogenic calcite crystals. Geochim. Cosmochim. Acta 2004, 68, 1473–1488. [Google Scholar] [CrossRef]
  96. Qian, G.; Brugger, J.; Testemale, D.; Skinner, W.; Pring, A. Formation of As(II)-pyrite during experimental replacement of magnetite under hydrothermal conditions. Geochim. Cosmochim. Acta 2013, 100, 1–10. [Google Scholar] [CrossRef]
  97. Simmons, S.F.; White, N.C.; John, D.A. Geological Characteristics of Epithermal Precious and Base Metal Deposits. In One Hundredth Anniversary Volume; Hedenquist, J.W., Thompson, J.F.H., Goldfarb, R.J., Richards, J.P., Eds.; Society of Economic Geologists: Littleton, CO, USA, 2005; pp. 485–522. [Google Scholar] [CrossRef]
  98. Lang, J.R.; Baker, T.; Hart, C.; Mortensen, J.K. An exploration model for Intrusion-Related Gold Systems. SEG Discov. 2000, 40, 1–15. [Google Scholar] [CrossRef]
  99. Sillitoe, R.H. Intrusion-related gold deposits. In Gold Metallogeny and Exploration; Foster, R.P., Ed.; Springer: Boston, MA, USA, 1991; pp. 165–209. [Google Scholar] [CrossRef]
  100. Thompson, J.F.H.; Sillitoe, R.H.; Baker, T.; Lang, J.R.; Mortensen, J.K. Intrusion-related gold deposits associated with tungsten-tin provinces. Miner. Deposita 1999, 34, 323–334. [Google Scholar] [CrossRef]
  101. Lang, J.R.; Baker, T. Intrusion-related gold systems: The present level of understanding. Miner. Deposita 2001, 36, 477–489. [Google Scholar] [CrossRef]
  102. Cooke, D.R.; Simmons, S.F. Characteristics and Genesis of Epithermal Gold Deposits. In Gold in 2000; Hagemann, S.G., Brown, P.E., Eds.; Society of Economic Geologists: Littleton, CO, USA, 2000; Volume 13, pp. 221–244. [Google Scholar] [CrossRef]
  103. Hedenquist, J.W.; Arribas, R.A.; Gonzalez-Urien, E. Exploration for Epithermal Gold Deposits. In Gold in 2000; Hagemann, S.G., Brown, P.E., Eds.; Society of Economic Geologists: Littleton, CO, USA, 2000; Volume 13, pp. 245–278. [Google Scholar] [CrossRef]
  104. White, N.; Hedenquist, J.W. Epithermal Gold Deposits: Styles, Characteristics and Exploration. SEG Discov. 1995, 23, 1–13. [Google Scholar] [CrossRef]
  105. Deditius, A.P.; Utsunomiya, S.; Reich, M.; Kesler, S.E.; Ewing, R.C.; Hough, R.; Walshe, J. Trace metal nanoparticles in pyrite. Ore Geol. Rev. 2011, 42, 32–46. [Google Scholar] [CrossRef]
  106. Pals, D.W.; Spry, P.G.; Chryssoulis, S. Invisible Gold and Tellurium in Arsenic-Rich Pyrite from the Emperor Gold Deposit, Fiji: Implications for Gold Distribution and Deposition. Econ. Geol. 2003, 98, 479–493. [Google Scholar] [CrossRef]
  107. Babedi, L.; von der Heyden, B.P.; Tadie, M.; Mayne, M. Trace elements in pyrite from five different gold ore deposit classes: A review and meta-analysis. Geol. Soc. Lond. Spec. Publ. 2022, 516, 47–83. [Google Scholar] [CrossRef]
  108. Zhang, P.; Huang, X.-W.; Cui, B.; Wang, B.-C.; Yin, Y.-F.; Wang, J.-R. Re-Os isotopic and trace element compositions of pyrite and origin of the Cretaceous Jinchang porphyry Cu-Au deposit, Heilongjiang Province, NE China. J. Asian Earth Sci. 2016, 129, 67–80. [Google Scholar] [CrossRef]
  109. Kadel-Harder, I.M.; Spry, P.G.; Layton-Matthews, D.; Voinot, A.; von der Handt, A.; McCombs, A.L. Paragenetic relationships between low- and high-grade gold mineralization in the Cripple Creek Au-Te deposit, Colorado: Trace element studies of pyrite. Ore Geol. Rev. 2020, 127, 103847. [Google Scholar] [CrossRef]
  110. Keith, M.; Smith, D.J.; Jenkin, G.R.T.; Holwell, D.A.; Dye, M.D. A review of Te and Se systematics in hydrothermal pyrite from precious metal deposits: Insights into ore-forming processes. Ore Geol. Rev. 2018, 96, 269–282. [Google Scholar] [CrossRef]
  111. Keith, M.; Smith, D.J.; Doyle, K.; Holwell, D.A.; Jenkin, G.R.T.; Barry, T.L.; Becker, J.; Rampe, J. Pyrite chemistry: A new window into Au-Te ore-forming processes in alkaline epithermal districts, Cripple Creek, Colorado. Geochim. Cosmochim. Acta 2020, 274, 172–191. [Google Scholar] [CrossRef]
  112. Sheppard, S.M.F. Characterization and isotopic variations in natural waters. Rev. Mineral. Geochem. 1986, 16, 165–183. [Google Scholar]
  113. Taylor, B.E. Magmatic volatiles: Isotopic variation of C, H, and S. In Stable Isotopes in High Temperature Geological Processes; Mineralogical Society of America: Chantilly, VA, USA, 1986; pp. 185–226. [Google Scholar] [CrossRef]
  114. Henley, R.W.; Ellis, A.J. Geothermal systems ancient and modern: A geochemical review. Earth-Sci. Rev. 1983, 19, 1–50. [Google Scholar] [CrossRef]
  115. Pat Shanks, W.C. Stable Isotope Geochemistry of Mineral Deposits. In Treatise on Geochemistry, 2nd ed.; Holland, H.D., Turekian, K.K., Eds.; Elsevier: Oxford, UK, 2014; pp. 59–85. [Google Scholar] [CrossRef]
  116. Sawkins, F.J.; O’Neil, J.R.; Thompson, J.M. Fluid inclusion and geochemical studies of vein gold deposits, Baguio District, Philippines. Econ. Geol. 1979, 74, 1420–1434. [Google Scholar] [CrossRef]
  117. Williams-Jones, A.E.; Heinrich, C.A. 100th Anniversary Special Paper: Vapor Transport of Metals and the Formation of Magmatic-Hydrothermal Ore Deposits. Econ. Geol. 2005, 100, 1287–1312. [Google Scholar] [CrossRef]
  118. Albinson, T.; Norman, D.I.; Cole, D.; Chomiak, B. Controls on Formation of Low-Sulfidation Epithermal Deposits in Mexico: Constraints from Fluid Inclusion and Stable Isotope Data. In New Mines and Discoveries in Mexico and Central America; Albinson, T., Nelson, C.E., Eds.; Society of Economic Geologists: Littleton, CO, USA, 2001; Volume 8, pp. 1–32. [Google Scholar] [CrossRef]
  119. Henley, R.W. The Geothermal Framework of Epithermal Deposits. In Geology and Geochemistry of Epithermal Systems; Berger, B.R., Bethke, P.M., Eds.; Society of Economic Geologists: Littleton, CO, USA, 1985; Volume 2, pp. 1–24. [Google Scholar] [CrossRef]
  120. Simmons, S.F. Hydrologic implications of alteration and fluid inclusion studies in the Fresnillo District, Mexico; evidence for a brine reservoir and a descending water table during the formation of hydrothermal Ag-Pb-Zn orebodies. Econ. Geol. 1991, 86, 1579–1601. [Google Scholar] [CrossRef]
  121. Camprubí, A.; Cardellach, E.; Canals, À.; Lucchini, R. The La Guitarra Ag-Au Low-Sulfidation Epithermal Deposit, Temascaltepec District, Mexico: Fluid Inclusion and Stable Isotope Data. In New Mines and Discoveries in Mexico and Central America; Albinson, T., Nelson, C.E., Eds.; Society of Economic Geologists: Littleton, CO, USA, 2001; Volume 8, pp. 133–158. [Google Scholar] [CrossRef]
  122. Einaudi, M.T.; Hedenquist, J.W.; Inan, E.E. Sulfidation State of Fluids in Active and Extinct Hydrothermal Systems: Transitions from Porphyry to Epithermal Environments. In Volcanic, Geothermal, and Ore-Forming Fluids: Rulers and Witnesses of Processes within the Earth; Simmons, S.F., Graham, I., Eds.; Society of Economic Geologists: Littleton, CO, USA, 2003; Volume 10, pp. 285–314. [Google Scholar] [CrossRef]
  123. Giggenbach, W.F. Magma Degassing and Mineral Deposition in Hydrothermal Systems along Convergent Plate Boundaries*. In Volcanic, Geothermal, and Ore-Forming Fluids: Rulers and Witnesses of Processes within the Earth; Simmons, S.F., Graham, I., Eds.; Society of Economic Geologists: Littleton, CO, USA, 2003; Volume 10, pp. 1–18. [Google Scholar] [CrossRef]
  124. Sillitoe, R.H.; Hedenquist, J.W. Linkages between Volcanotectonic Settings, Ore-Fluid Compositions, and Epithermal Precious Metal Deposits. In Volcanic, Geothermal, and Ore-Forming Fluids: Rulers and Witnesses of Processes within the Earth; Simmons, S.F., Graham, I., Eds.; Society of Economic Geologists: Littleton, CO, USA, 2003; Volume 10, pp. 315–343. [Google Scholar] [CrossRef]
  125. Hedenquist, J.W.; Henley, R.W. The importance of CO2 on freezing point measurements of fluid inclusions; evidence from active geothermal systems and implications for epithermal ore deposition. Econ. Geol. 1985, 80, 1379–1406. [Google Scholar] [CrossRef]
  126. Lira, R.; Poklepovic, M.F.; Dorais, M.J.; Millone, H.A.; Gomez, G.M. Fluid–rock interaction at the roots of an Eopaleozoic epithermal system, Sierra Norte de Córdoba, Argentina: Paragenesis, thermometry and fluid sources. J. S. Am. Earth Sci. 2009, 28, 263–276. [Google Scholar] [CrossRef]
  127. Simmons, S.F.; Tutolo, B.M.; Barker, S.L.L.; Goldfarb, R.J.; Robert, F. Hydrothermal Gold Deposition in Epithermal, Carlin, and Orogenic Deposits. In Geology of the World’s Major Gold Deposits and Provinces; Sillitoe, R.H., Goldfarb, R.J., Robert, F., Simmons, S.F., Eds.; Society of Economic Geologists: Littleton, CO, USA, 2020; Volume 23, pp. 823–845. [Google Scholar] [CrossRef]
  128. Benning, L.G.; Seward, T.M. Hydrosulphide complexing of Au (I) in hydrothermal solutions from 150–400 °C and 500–1500 bar. Geochim. Cosmochim. Acta 1996, 60, 1849–1871. [Google Scholar] [CrossRef]
  129. Gammons, C.H.; Williams-Jones, A.E. Chemical mobility of gold in the porphyry-epithermal environment. Econ. Geol. 1997, 92, 45–59. [Google Scholar] [CrossRef]
  130. Stefánsson, A.; Seward, T.M. Gold(I) complexing in aqueous sulphide solutions to 500 °C at 500 bar. Geochim. Cosmochim. Acta 2004, 68, 4121–4143. [Google Scholar] [CrossRef]
  131. Williams-Jones, A.E.; Bowell, R.J.; Migdisov, A.A. Gold in Solution. Elements 2009, 5, 281–287. [Google Scholar] [CrossRef]
  132. Herrington, R.J.; Wilkinson, J.J. Colloidal gold and silica in mesothermal vein systems. Geology 1993, 21, 539–542. [Google Scholar] [CrossRef]
  133. Saunders, J.A. Colloidal transport of gold and silica in epithermal precious-metal systems: Evidence from the Sleeper deposit, Nevada. Geology 1990, 18, 757–760. [Google Scholar] [CrossRef]
  134. Hough, R.M.; Noble, R.R.P.; Reich, M. Natural gold nanoparticles. Ore Geol. Rev. 2011, 42, 55–61. [Google Scholar] [CrossRef]
  135. Wagner, F.E.; Marion, P.H.; Regnard, J.R. Moessbauer Study of the Chemical State of Gold in Gold Ores. In Proceedings of the Gold 100: Proceedings of the International Conference on Gold, Johannesburg, South Africa, 15–17 September 1986; Fivaz, C.E., King, R.P., Eds.; South African Institute of Mining and Metallurgy: Johannesburg, South Africa, 1986; Volume 2, pp. 435–443. [Google Scholar]
Figure 1. Regional geological map of southwestern New Brunswick, showing the location of the Poplar Mountain volcanic complex (PMVC). Modified from Chi and Watters [2] and Chi et al. [3].
Minerals 13 00954 g001
Figure 2. Local geologic map of the Golden Ridge area (Poplar Mountain). Modified from Chi et al. [3] and Hilchey and Webster [1].
Minerals 13 00954 g002
Figure 3. (a) Heterolithic brecciated and altered rhyodacitic volcaniclastic unit. The fragments are locally altered to chlorite-illite-carbonate (beige) and others are silicified (dark grey). A later quartz-carbonate vein crosscuts the breccia and a set of sulphide veinlets, locally oxidized, crosscut the breccia fragments (sample from drillhole GR1164A, 0.723 g/t Au). (b) Pyrite-arsenopyrite aggregates in quartz-cemented breccia cutting the sericite-illite altered porphyritic rhyodacite (sample from drill hole GR1168, 0.905 g/t Au). (c) Brecciated quartz-feldspar porphyritic rhyodacite with sericite-illite altered fragments and disseminated ultrafine pyrobitumen (black). Pyrite-arsenopyrite in mm thick veinlets crosscut fragments (sample from drillhole GR1168, 4.740 g/t Au). (d) Sericite-illite altered porphyritic rhyodacite with fractures filled by thin quartz-carbonate-sericite-sulphide veinlets (sample from GR1053, 4.410 g/t Au). Py: Pyrite; Asp: Arsenopyrite.
Minerals 13 00954 g003
Figure 4. Plane-polarized reflected light photomicrographs of different types of pyrite and arsenopyrite. (a) Disseminated pyrite grains in chloritized porphyritic rhyodacite phenocrysts and groundmass. GR1164A—96.8 m (b) Pyrite grains along a fracture in a phenocryst. GR1164A—95.10 m (c) Pyrite grain in feldspar glomerocryst in porphyritic rhyodacite. GR1168—34.38 m (d) Pyrite grain in the matrix of chloritized brecciated felsic volcanic rock. GR1060—60.20 m (e) Py-I porous core with an overgrowth of Py-II and Asp-I in the surroundings. GR1170—38.00 m (f,g) Euhedral to subhedral arsenopyrites (Asp-I) in sericitized felsic volcanic and porphyritic rocks. GR9902—95.00 m (h,i) Py-I core with abundant silicate inclusions and pores with an overgrowth of Py-III and Asp-I as inclusions and overgrowths. GR1057—140.20 m (j) Disseminated Py-III with coarse-grained Asp-I in matrix of porphyritic rhyodacite. GR0411—111.95 m (k,l) Py-IV locally or totally replaced by arsenopyrite (Asp-II) in mm-thick veinlets (Asp-I, Asp-II, Py-IV). GR1055—68.05 m. Py: Pyrite; Asp: Arsenopyrite.
Minerals 13 00954 g004
Figure 5. Paragenetic mineral sequence for the Golden Ridge gold deposit. Modified from Chi and Watters [2]. The relative abundance of each mineral is represented by increasing line thickness.
Minerals 13 00954 g005
Figure 6. (a) Pearson Product correlation coefficients between Au and selected elements for 44 samples. Labeled points are significant at the α = 0.01 confidence level. (b,c) Biplots of principal component analysis (PCA) for As, Cu, Mn, Ni, Pb, Zn, Bi, Ca, Cs, Fe, K, Na, Sb, S, Se, and W. Loading plots show the vector representation between the elements and the components. The percentages of variance for components 1, 2, and 3 are shown.
Minerals 13 00954 g006
Figure 7. Polished thin section μXRF-EDS elemental mapping showing distribution for S (pyrite), As (arsenopyrite), Sb (antimony), Si (quartz), and K (sericitization). (a) GR1057-140 (2.75 g/t Au); acicular arsenopyrite and pyrite disseminated in sericitized micro-porphyritic rhyodacite. Minor stibnite (stbn) occurs in close association with pyrite and arsenopyrite. (b) GR9902-96 (10.2 g/t Au); acicular and rhomb-shaped grains of arsenopyrite with pyrite and local stibnite (stbn) in quartz-sericite vein in highly silicified porphyritic rhyodacite. (c) GR1164A-99 (4.27 g/t Au); local stibnite (stbn), pyrite, and arsenopyrite in quartz vein that cuts distinctly sericitized porphyritic rhyodacite.
Minerals 13 00954 g007
Figure 8. Binary plots LA-ICP-MS data of (a) Au vs. As; (b) Sb vs. As; (c) Au vs. Sb; (d) Cu vs. Pb; (e) Au vs. Ag; (f) Co vs. Ni from pyrites of the Golden Ridge gold deposit. All data above the minimum detection limit is shown. The black dashed line marks the gold solubility limit as a function of As concentration from Reich et al. [70] in plot (a) Au vs. As. See Appendix B (Table A2).
Minerals 13 00954 g008
Figure 9. Binary plots LA-ICP-MS data of (a) Au vs. Sb; (b) Cu vs. Pb; (c) Au vs. Ag; (d) Co vs. Ni from arsenopyrites of the Golden Ridge gold deposit. All data above the minimum detection limit are shown. See Appendix B (Table A3).
Minerals 13 00954 g009
Figure 10. Trace element LA-ICP-MS map of diagnostic Py-I in the center surrounded by Py-II (GR1070:38.00m). (a) Reflected-light photomicrograph of the pyrite grain; (bj) distributions of Au, As, Co, Ni, Cu, Ag, Sb, Pb, and Bi, respectively; (k) LA-ICP-MS counts for a laser burn across the pyrite grain (representative time-resolved profile) showing distribution of Au, As, Co, Ni, Cu, Ag, Sb, Pb, and Bi.
Minerals 13 00954 g010
Figure 11. Trace element LA-ICP-MS map of a Py-III grain (GR1070:34.00m). (a) Reflected-light photomicrograph of the pyrite grain; (bj) distributions of Au, As, Co, Ni, Cu, Ag, Sb, Pb, and Bi, respectively; (k) LA-ICP-MS counts for a laser burn across the pyrite grain (representative time-resolved profile) showing distribution of Au, As, Co, Ni, Cu, Ag, Sb, Pb, and Bi.
Minerals 13 00954 g011
Figure 12. Trace element LA-ICP-MS map of a Py-IV grain (GR1055:68.00m). (a) Reflected-light photomicrograph of the pyrite grain; (bj) distributions of Au, As, Co, Ni, Cu, Ag, Sb, Pb, and Bi, respectively; (k) LA-ICP-MS counts for a laser burn across the pyrite grain (representative time-resolved profile) showing distribution of Au, As, Co, Ni, Cu, Ag, Sb, Pb, and Bi.
Minerals 13 00954 g012
Figure 13. Trace element LA-ICP-MS map of an Asp-I grain (GR1070:34.00m). (a) Reflected-light photomicrograph of the arsenopyrite grain; (bj) distributions of Au, As, Co, Ni, Cu, Ag, Sb, Pb, and Bi, respectively; (k) LA-ICP-MS counts for a laser burn across the pyrite grain (representative time-resolved profile) showing distribution of Au, As, Co, Ni, Cu, Ag, Sb, Pb, and Bi.
Minerals 13 00954 g013
Figure 14. Trace element LA-ICP-MS map of an Asp-II grain (GR1070:34.00m). (a) Reflected-light photomicrograph of the arsenopyrite grain; (bj) distributions of Au, As, Co, Ni, Cu, Ag, Sb, Pb, and Bi, respectively; (k) LA-ICP-MS counts for a laser burn across the pyrite grain (representative time-resolved profile) showing distribution of Au, As, Co, Ni, Cu, Ag, Sb, Pb, and Bi.
Minerals 13 00954 g014
Table 1. Summary table for the bulk-rock compositions (in ppm).
Element *Min.Max.MeanMedianStd. Dev.Q. 0.25Q. 0.75DL
Au0.03910.202.4852.4701.9900.7613.3130.005
As8617,400447145153646145060402
Cu211603571744111
Mn39852451441189333.55562
Ni0.71133.53.02.81.754.251
Pb4350099145258262
Zn1612401425927143.25791
Bi0.242.520.760.460.650.32751.060.1
Ca40057,10019,07718,650991212,45023,525100
Cs0.292.691.501.5150.581.101.900.05
Fe610057,20030,07031,35011,26722,60034,750200
K80045002923310081425753400100
Na20049,0007941185010,56897511,150100
Sb6.4172068.231.1255.221.537.00.2
S78049,69014,60713,6359631931017,46510
Se0.072.900.390.300.460.100.500.10
W2.828.010.99.07.35.815.04.0
* The raw data for some elements were reported as below detection limits. The data below the detection limit were imputed using the detection limit divided by the square root of two (Ni, Se, and W). Min: Minimum; Max: Maximum; Std: Standard; Dev.: Deviation; Q. 0.25: First quartile; Q. 0.75: Third quartile; DL: Detection limit.
Table 2. LA-ICP-MS spot analyses data of pyrites. All in parts per million (ppm).
Type *ItemCoNiCuAgSbAsAuPbBi
Py-I
(n = 12)
Minimum0.330.8365.860.127.4351.230.166.960.32
Maximum841.8247.2946.455.3583.77651.55.874117.334.2
Mean401.761.3317.315.1248.12195.32.321252.515.9
Median326.426.2229.87.6174.11621.91.861101.718.4
Std. Dev.308.273.5268.218.1216.42170.81.711187.810.7
Py-II
(n = 16)
Minimum0.010.098.820.010.16689.63.180.350.01
Maximum124.526.0214.19.2162.423,382.755.7970.18.58
Mean22.46.549.11.432.014,269.615.095.61.11
Median2.974.426.40.4615.114,630.89.721.10.55
Std. Dev.38.07.953.52.543.76859.613.56237.42.08
Py-III
(n = 22)
Minimum0.010.102.760.010.224083.21.120.160.01
Maximum186.039.6218.25.661.945,753.791.0229.512.8
Mean48.110.778.60.9123.827,021.934.739.21.06
Median18.43.875.00.2315.126,313.333.017.90.39
Std. Dev.60.812.352.11.4120.111,574.128.255.12.66
Py-IV
(n = 6)
Minimum8.041.2593.70.022.1328,196.136.32.390.27
Maximum48.09.8294.94.1129.357,065.7210.8214.66.98
Mean28.34.7184.11.844.943,384.8105.168.92.43
Median30.33.4181.21.120.443,891.282.032.91.35
Std. Dev.17.63.681.51.849.49,298.174.178.92.50
* The raw data for some elements were reported as below detection limits. The data below the detection limit were imputed using the detection limit divided by the square root of two (Co, Ni, and Pb).
Table 3. LA-ICP-MS spots analyses data of Asp-I and Asp-II. All in parts per million (ppm).
Type *ItemCoNiCuAgSbWAuPbBi
Asp-I
(n = 21)
Minimum0.270.180.330.003155.80.0041.470.20.013
Maximum59.0016.7027.300.3202880.08.000166.09.153.66
Mean22.395.2010.990.0741015.20.97243.503.2941.06
Median17.903.819.800.040540.50.03628.502.310.652
Std. Dev.19.024.848.930.091952.12.12640.723.2471.095
Asp-II
(n = 15)
Minimum0.100.027.400.0020.060.0034.200.050.008
Maximum320.090.60155.01.9412636.300334.067.32.47
Mean28.207.3346.900.67394.61.570131.3230.94
Median2.100.6035.600.22152.00.04188.9012.70.86
Std. Dev.81.5023.0840.000.77437.92.332109.422.30.68
* The raw data for some elements were reported as below detection limits. The data below the detection limit were imputed using the detection limit divided by the square root of two (Ni, Cu, and Pb).
Disclaimer/Publisher’s Note: The statements, opinions and data contained in all publications are solely those of the individual author(s) and contributor(s) and not of MDPI and/or the editor(s). MDPI and/or the editor(s) disclaim responsibility for any injury to people or property resulting from any ideas, methods, instructions or products referred to in the content.

