Article

Insight on the Properties of Pumice Mineral for the Combined Adsorption Distillation of Membrane Reject Water

1
US Pakistan Center for Advanced Studies in Water (USPCASW), Mehran University of Engineering and Technology, Jamshoro 76062, Pakistan
2
Department of Environmental Sciences, Sindh Madressatul Islam University, Karachi 74000, Pakistan
3
National Centre of Excellence in Analytical Chemistry, University of Sindh, Jamshoro 76080, Pakistan
4
Department of Applied Science and Technology, Politecnico di Torino, 10129 Turin, Italy
5
Pakistan Council of Scientific and Industrial Research (PCSIR) Laboratories Complex, Karachi 75280, Pakistan
6
Benazir Bhutto Shaheed University of Technology and Skill Development Khairpur Mirs, Khairpur 66151, Pakistan
*
Authors to whom correspondence should be addressed.
Minerals 2023, 13(9), 1131; https://doi.org/10.3390/min13091131
Submission received: 28 June 2023 / Revised: 16 August 2023 / Accepted: 25 August 2023 / Published: 26 August 2023
(This article belongs to the Section Mineral Processing and Extractive Metallurgy)

Abstract

:
The current study evaluated the use of pumice, a volcanic mineral and common sand, in treating reverse osmosis membrane reject water (ROR) using a novel combined adsorption distillation (CAD) method. The CAD method is developed to separate the dissolved solids through adsorption distillation, i.e., leaving the vaporized distillate as freshwater and concentrated brine. The adsorption potential of pumice and sand was investigated at different adsorbent doses, i.e., 2, 5, and 10 g, and consecutive CAD adsorbent backwashing cycles. The improved results were achieved at a 10 g pumice dose. However, its adsorption efficiency declined in longer CAD cycles, i.e., due to the separated deposition of solids. After backwashing, the adsorbed and accumulated salts were slightly removed, and pumice adsorption capacity was maintained for up to 20 cycles of CAD. The properties of the pumice, i.e., before and after five CAD cycles and after backwashing, were characterized with scanning electron microscopic (SEM), elemental disruptive spectroscopy (EDS), and X-ray diffraction (XRD), which revealed that the porous structure of the pumice was completely accumulated with deposits of ionic salts, which were slightly washed away after backwashing, but accumulation remained continued in post-CAD cycles. The explored method revealed a high potential of pumice in water filtration.

1. Introduction

In recent years, studies on low-cost natural mineral adsorbents have intensified, and various minerals have been explored for the removal of heavy metals, i.e., silica, kaolinite, iron oxide, zeolite, clay minerals, quartz, and pumice [1,2,3,4,5,6]. Using pumice as a low and cost-effective adsorbent for metal removal is a fact. Pumice is a lightweight igneous volcanic rock with a surface area ranging from 2 to 54 m2/g, and it is the highest natural porous material with 90% porosity [7,8]. Pumice mainly consists of 70% silicate, which makes it highly porous and negatively charged, thus attracting heavy metals that are positively charged. Meanwhile, pumice has a high surface area, pores, and vascular cavities, making it easy for water to permeate into its crystalline structure, and metals are trapped on the surface and within its pours [9]. Pumice stone has been used as an adsorbent to remove heavy metals [9,10,11].
The sand mineral is also considered a very important adsorbent because of its high surface area with structural and pH-dependent charges developing on its surface [12]. Sand is widely used as an economical adsorbent compared to other adsorbents or materials [13,14]. Sand has effectively treated water and wastewater in sand filters and fluidized bed reactors [12,13,15].
The reverse osmosis (RO) method is commonly used to purify water with high levels of salt, but it produces a large volume (38%) of rejected water with high levels of total dissolved salts (TDS) and other contaminants, such as toxic metals and organic pollutants [16,17,18]. The RO-rejected water (ROR) can be an environmental issue, i.e., because of the high TDS load of metals and organic and inorganic compounds [19,20,21]. While RO technology is often used in industries like textiles, chemicals, and food production to obtain clean water, it is costly and can have negative impacts on the environment due to the high volume of rejected water that is often released into bodies of water without further treatment, leading to increased TDS, metals, and other contaminants and resulting in the contamination of water bodies [22,23].
In addition, other technologies for water desalination, such as conventional distillation, membrane technology, and electrodialysis, require high capital and operating costs [24,25,26]. Distillation technology has currently received great attention for the treatment of rejected water. Distillation of rejected water typically removes most dissolved salts and toxic metals. In addition, the boiling process kills biological contaminants and organic compounds that boil at temperatures greater than the boiling point of water. In addition, some pesticides and herbicides can be effectively removed from the water via distillation [27,28]. Organic compounds that boil at temperatures lower than the boiling point of water (e.g., benzene and toluene) will be vaporized as volatiles from the water [29]. All treatment methods have limitations, and often a combination of treatment processes is required to treat the water effectively [30]. An effective and feasible treatment solution is needed to overcome such issues by considering technological refinement, minimum capital cost, and negligible environmental impacts.
The current study revealed a new method of combined adsorption distillation (CAD), shown in the scheme in Figure 1, through which adsorbent media could be introduced inside the distillation unit for improved separation and adsorptive accumulation of dissolved solids, i.e., from the evaporated vapors. A conventional distillator has the drawback of salt accumulation and choking on the body, heating parts, and further salt carryover along with the distillate vapors [31,32,33]. The CAD method could resolve this issue by providing a settling media for adhering and accumulating the separated dissolved solids and facilitating distillation. However, selecting the adsorption media could be tricky because it needs to be thermally conductive to mediate the distillation process along with separated solid adsorption and accumulation, in addition to being porous and functionally active.
Therefore, the properties and potential of volcanic minerals of pumice were investigated for the newly developed method of CAD. Initially, the ROR of groundwater was characterized by physicochemical parameters such as pH, TDS, and selected metals. A lab-scale distillation set-up was configured (shown in Figure 1) to perform the CAD of the ROR at consecutive cycles. For comparison, the adsorbent media of the sand were also studied in the same manner. The morphological and structural changes of the pumice were investigated using different characterization techniques, i.e., scanning electron microscopic (SEM), elemental disruptive spectroscopy (EDS), and X-ray diffraction (XRD). Overall results revealed a new area of research and development in treating ROR and adsorption-supported distillation methods.

2. Materials and Methodology

2.1. Materials

Pumice rocks and sand were purchased locally. The pumice rocks were ground and sieved to a size of 2–3 mm, while the sand particles varied from 0.25 to 1 mm. Both pumice and sand were rinsed and dried before being used for distillation as adsorbent media. The ROR water was arranged from the Al-Rahim Textile Industry Pvt. Ltd., Karachi, Pakistan, where RO membrane filtration is performed to purify the groundwater of TDS around 1820 mg/L to below 50 mg/L. The production of ROR was around 5500 mg/L. The lab-scale batch distillation set-up was configured to perform the CAD of ROR at an amount of 500 mL, and its distillation was up to 90% (450 mL drawn from the flask as vapors) and 10% of the separated solids, concentrating in the form of a residue brine solution (50 mL) above the adsorbent media, as shown in Figure 1. The produced 90% distillate and concentrated 10% of the residue brine were separately collected for detailed analysis. As shown in Figure 1, the distillate could be used as fresh water, while the concentrated brine can be further processed via solar drying and solidification for safe disposal. For the current study, the focus was to analyze the pumice properties and CAD method, and, therefore, the analysis and results of the additional step of solar drying are not covered.
Initially, for the comparison of the pumice and sand, 5 cycles of CAD were performed at varied amounts, i.e., 2, 5, and 10 g, i.e., at the bottom of the distillation flask, to analyze and compare the dissolved solid adsorption and accumulation kinetics and stability. The heating temperature to perform distillation remained constant, i.e., at around 100–102 °C.
Further, for comparison, the distillation was performed without adding any adsorbent media at the distillation flask bottom and following similar experimental conditions. The distillation time, TDS concentration of condensed distillate, and residue brine solutions were recorded during and/or after CAD distillation. The TDS concentration was recorded using a portable probe meter HI99301 by Hanna Instrument Inc. The further experiments of CAD cyclic stability and adsorbent behavior after backwashing were only performed using a pumice of 10 g, i.e., based on its improved performance in initial experiments. For the cyclic performance and stability of the pumice, its backwashing was performed after 5, 10, and 15 CAD cycles by agitation and stirring in deionized water at a temperature of 60 °C, which was found optimum in our earlier published work [34,35]. All the CAD experimental analyses were made in triplicates for the reproducibility results; average results were compiled to report along with the error bars.
The adsorbed and accumulated solids on the adsorbent surface were estimated using Equations (1) and (2).
S o l i d   R e t e n t i o n   o n   A d s o r b e n t m g L = T h e o r e t i c a l   s o l i d   s c o n c e n t r a t i o n   i n   b r i n e M e a s u r e d   s o l i d   c o n c e n t r a t i o n   i n   b r i n e S o l i d s   c o n c e n t r a t i o n   i n   c o n d e n s e d   d i s t i l l a t e
T h e o r e t i c a l   s o l i d s   c o n c e n t r a t i o n   i n   b r i n e   m g L = I n i t i a l   V o l u m e   o f   R O R L   *   I n i t i a l   c o n c e n t r a t i o n   o f   d i s s o l v e d   s o l i d s   ( m g L ) F i n a l   V o l u m e   o f   t h e   B r i n e   ( L )

2.2. Adsorbent Characterization

The adsorbent characterization was performed to analyze the morphological, elemental, and structural properties of the pumice, i.e., before and after the CAD experiment and after backwashing and solid desorption. The SEM images were acquired using the SEM 6490 LV JEOL instrument manufactured by JEOL Ltd., Tokyo, Japan. The elemental analysis was performed by the EDS XFlash-4010 instrument manufactured by the Bruker Corporation, Billerica, MA, USA, while the structural changes were observed using the Bruker Advance D8 XRD instrument manufactured by the Bruker Corporation, USA. The BET surface of the pumice was analyzed using the Micromeritics TriStar-II Brunauer–Emmett–Teller (BET) instrument by Micromeritics Instrument Corporation, Norcross, GA, USA.

3. Results and Discussion

3.1. Water Quality of Membrane Reject and Condensed Distillate

The collected ROR from the textile industry and produced condensed distillate after the CAD process were analyzed for different water quality parameters using the standard testing protocols by APHA [36]. The obtained average water results of the initial five cycles for each experimental condition are given in Table 1. The results showed that the dissolved solids of ROR were purified to very low concentrations, i.e., from 5500 to 19, 11, and 63 mg/L, with additions of sand and pumice at 10 g each and without their addition, respectively. The avg. distillation times, i.e., vaporization of 90% (450 mL) of the ROR, were 4.7, 2.9, and 2.75 h in the case of sand and pumice and without their addition, respectively. The distillation with the addition of fine sand grains took a long time to distillate because of hydrophilicity and limited thermal conductivity of around 0.25 W.m−1. K−1 than the pumice (~0.60 W.m−1. K−1) and bare distillation flask made of borosilicate glass (~1.4 W.m−1. K−1) [37,38,39]. The elemental analyses of the main elements showed that sodium concentration (3112 mg/L) was higher in ROR than others, i.e., calcium, magnesium, and chloride, while their traces were also observed in distillate water samples due to ionic carryover along with the distillate vapors. Interestingly, the elemental concentrations in distillate obtained with pumice adsorbent addition were lower than the bare distillation and sand adsorbent-added distillate samples. This suggests improved adsorption and accumulation capacity of the pumice than sand. Further, the digital images of the bare distillation flask and collected salts from its bottom are shown in the Supplementary Materials in Figures S1 and S2, which depict accumulated separated salts on the walls and bottom of the flask. In addition, Figure S3 in the Supplementary Materials compares the sand and pumice adsorbents before and after the CAD process, suggesting a high change in the pumice and sand characteristics (details in later sections).

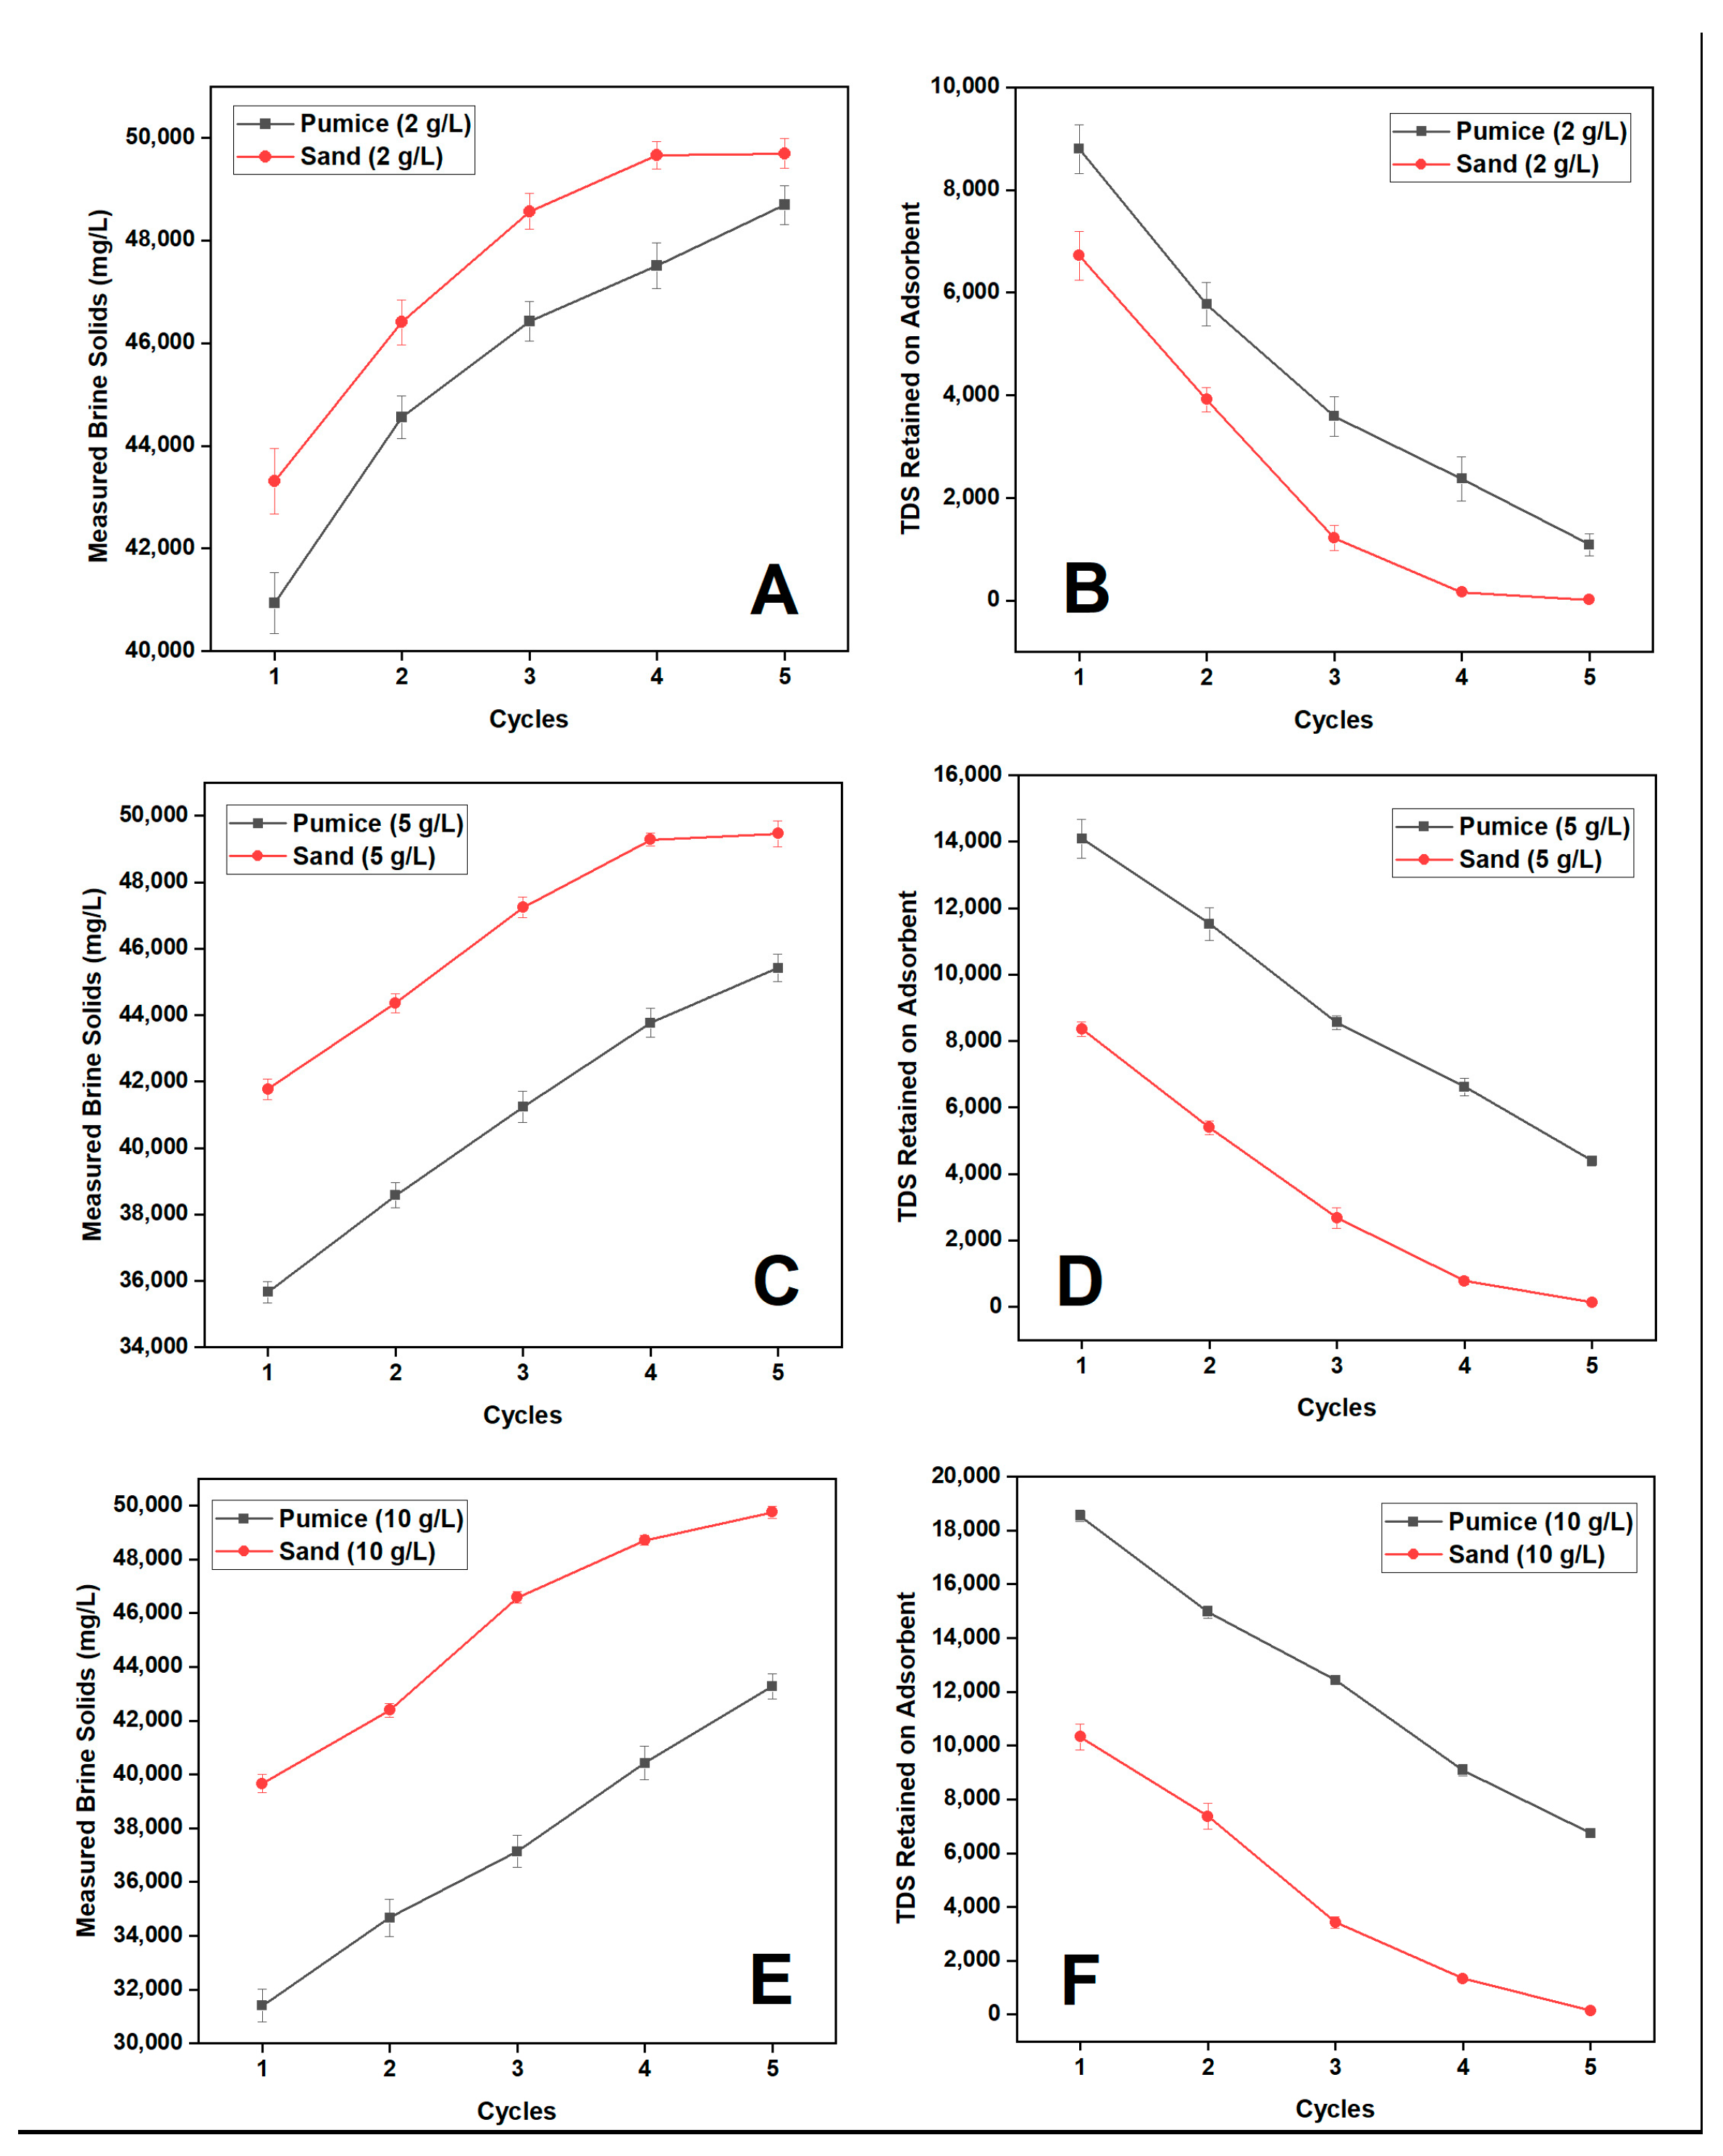
3.2. Effect of Mineral Adsorbent Dosage on CAD

Figure 2A–F shows the measured concentration of the remaining 10% brine solution and the retained amount of the solids for five cycles of the CAD, with each adsorbent at different dosages of the pumice and sand. The maximum solid retention was recorded at 10 g of pumice, while the least was 2 g/L of the sand. The measured dissolved solid concentrations of brine solutions (Figure 2A,C,E) were around 25% lower for the different pumice doses than the sand. Figure 2B,D,F show the calculated retained solids on the different doses of the pumice and sand, revealing that pumice samples have a higher retention rate of the separated solids (enabled by the distillation process) than the sand, i.e., due to that high porosity and negatively charged surface of the pumice that facilitate the accumulation of the separated solids in the ionic form [40,41]. In the case of the pumice addition of 10 g, the solid retention and accumulation rate were found to be the maximum for consecutive cycles compared to sand. Moreover, the brine dissolved solid concentration increased with each CAD cycle and vice versa; the ionic retention on the adsorbent surfaces decreased for both the pumice and sand.
The obtained results are shown in Figure 2A–F, indicating that pumice adsorbed more salts than sand due to its porous structure and anionic behavior. The results indicated that the solids retained on pumice were much higher than on sand. Overall, after the first CAD cycle, the solid retention on the 10 g pumice was 18,538 mg/L compared to 10 g sand, i.e., 10,328 mg/L. The rate of solid retention declined in both pumice and sand with each cycle, i.e., at the fifth cycle, pumice retained around 6747 mg/L of solids, whereas sand retained only 140 mg/L.
The solid retention on the 10, 5, and 2 g of pumice was 37%, 29%, and 18% after thefirst cycle, which kept decreasing after each cycle. At the fifth cycle, the percentage of the solids retained on the 10, 5, and 2 g of pumice was 13%,9%, and 3%, which suggested that the dose of the pumice significantly affected the solid retention and separation in consecutive cycles. In the sand, the adsorbed solids by 10, 5, and 2 g were 15%, 11%, and 7.5%, and at the fifth cycle of CAD, they drastically reduced to less than 1%. The improved results of solid retention were achieved at a 10 g addition of the pumice; therefore, further backwashing/regeneration and long cyclic stability CAD experiments were performed only at a 10 g pumice addition.

3.3. Pumice Backwashing and Long Cycles of CAD

For the CAD cyclic performance, the pumice was withdrawn from the distillation flask and carefully backwashed and stirred with deionized water at 60 °C, oven-dried, and loaded into the CAD set-up, i.e., after five consecutive cycles of the CAD and until the total twentieth cycle. With each CAD cycle, the distillation performance, i.e., brine dissolved solid concentrations and solid retention on the pumice, was analyzed. The results of the cyclic performance of 10 g pumice are shown in Figure 3.
An increasing trend of solid concentration in brine was observed with each cycle, and at the same time, a decreasing trend of solid retention on the pumice was observed, i.e., due to blockage and solid accumulation on its pores. However, after backwashing, some of the accumulated solids were rinsed and dissolved in the backwash solution, and somehow, the solid retention capacity was improved from 7510 to 16,739 mg/L. However, at the continued cycles, the pumice adsorption capacity kept losing, i.e., it reduced to 6218 mg/L at the tenth cycle and recovered to 14,450 mg/L after the second backwashing. After the 15th CAD, the retained solid concentration was around 10,795 mg/L, which decreased to less than 93 mg/L at the 20th cycle. The adsorption capacity was almost lost at the 20th CAD cycle, i.e., by recording the measured brine concentration as the same as the total dissolved solid load in ROR when reduced to 10% of the brine solution after distillation. The loss in adsorption capacity of pumice was subjected to adherence of salt crystals within pours and the complete blockage of surface/active sites.

3.4. Characterization of Adsorbents

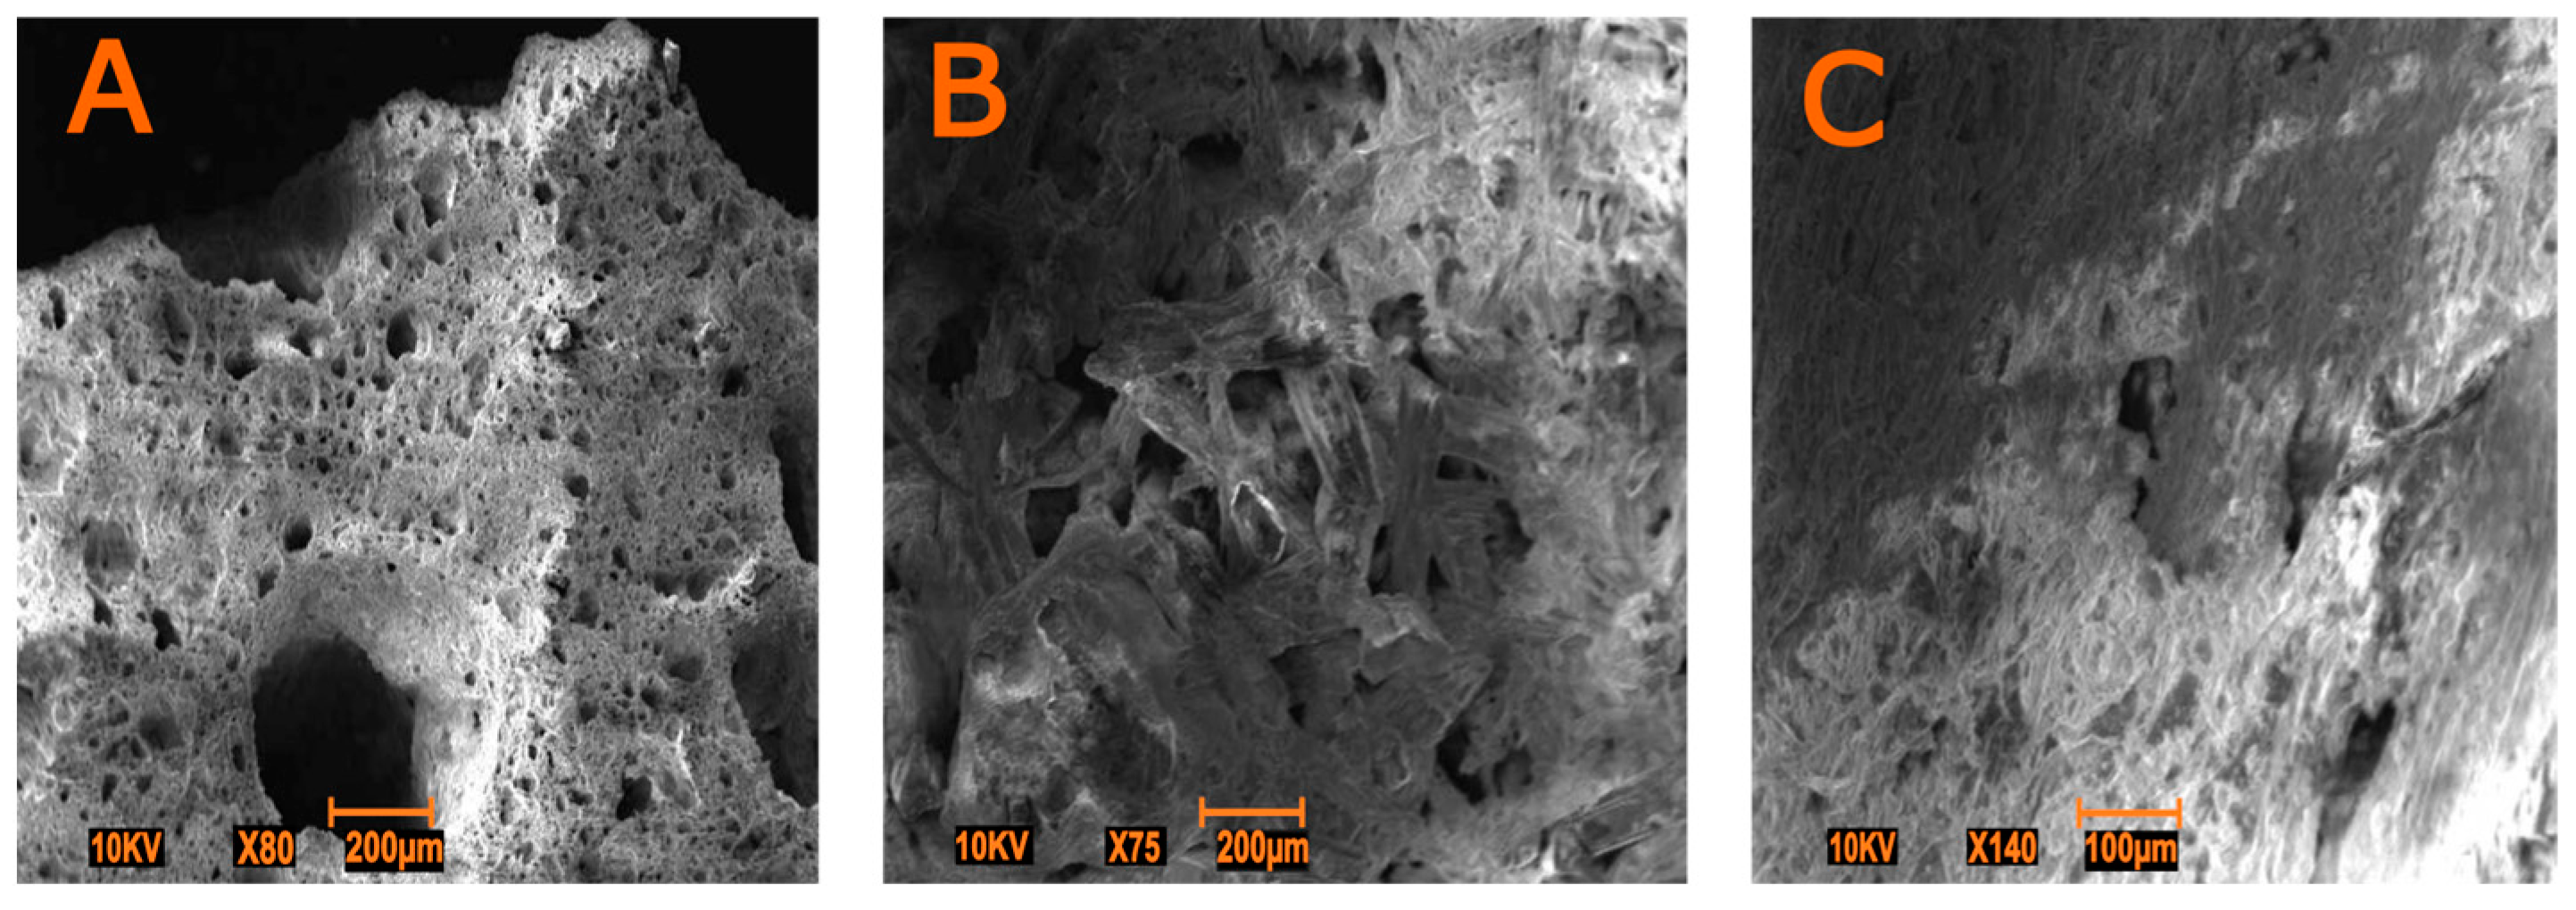
3.4.1. Surface Characteristics and SEM Morphology

The obtained value of the BET-specific surface area of the pumice was around 14.2 m2/g, which was near the previously reported study on pumice [42]. It is reported that the surface area of the pumice mainly depends on the origin of volcanic rock formation, processed particle size, and additional physical or chemical treatment and functionalization [43].
SEM images were acquired to analyze the morphological changes before and after adsorption and cyclic backwashing. Figure 4A–C shows the SEM images of the pristine, after five cycles adsorption and backwashing at 200 µm magnification. The pristine pumice grain in Figure 2A exhibited porous morphology with random vascular macropores and cavities, enabling improved permeability, adsorption, and filtration properties. The pumice porosity and pore sizes are mainly associated with volcanic eruption conditions, originated volcanic gas bubbles nucleation and fragmentation, and cooling mechanisms [44,45]. The SEM image in Figure 4B shows accumulated salt crystals and agglomerates that blocked the pumice surface completely. The accumulated salt crystallization suggested that the pores and cavities of the pumice could have been completely deposited with the salt layers because the pumice salt/solid retention capacity kept losing with each CAD cycle. Interestingly, the SEM image of the pumice after backwashing of the fifth CAD cycle revealed that the accumulated salt layers were somewhat rinsed and removed from the pumice surface, which allowed a partial improvement in solid retention capacity, as observed in Figure 3.

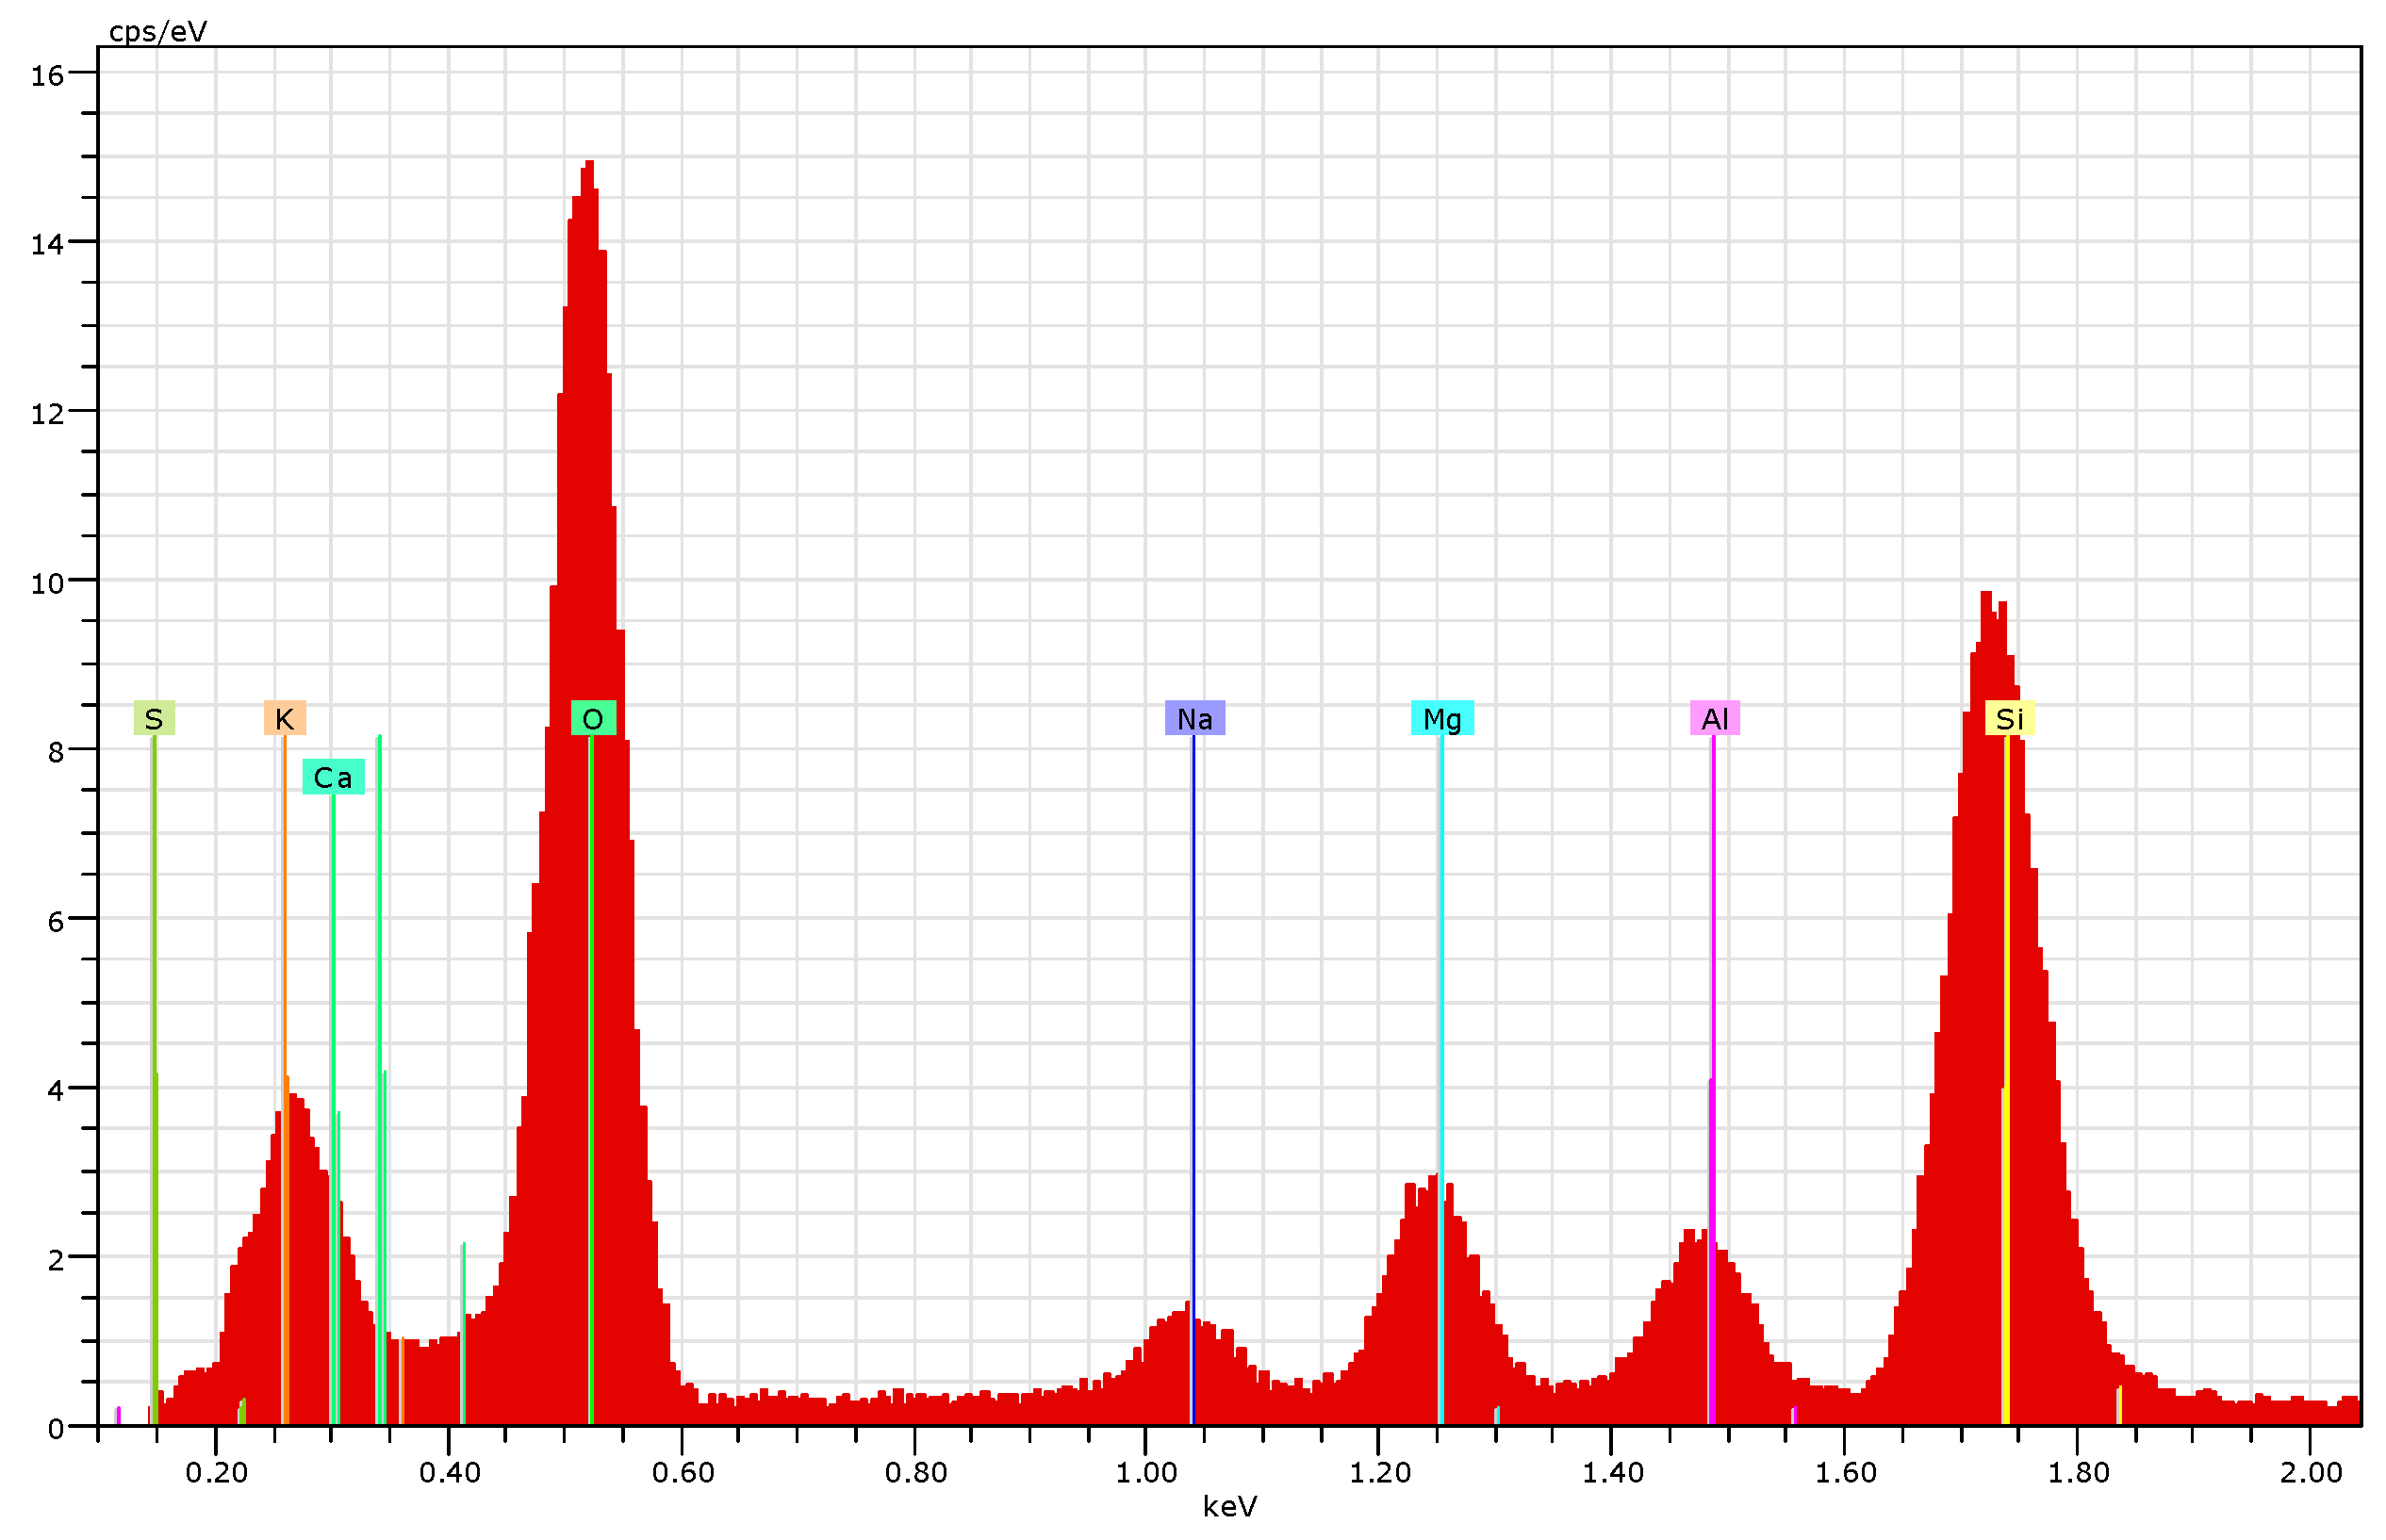
3.4.2. EDS Elemental Analysis

The EDS elemental analysis of pristine pumice and after five cycles of CAD and backwashing was performed to assess the pumice’s elemental changes on the surface. The obtained results are given in Table 2. It is reported that the composition of the pristine pumice has a high amount of SiO2, up to 70%, and Al2O3, up to 15%, and the remaining compounds of Fe2O3, CaO, Na2O, K2O, etc. [40], which happened to be similar for the current pristine pumice analysis, where the silicon and aluminum elements have a high presence in their oxide form and a considerable amount of potassium, sodium, and calcium, and an almost negligible amount of sulfur and chlorine. However, after five CAD cycles, the surface elemental characteristics were completely changed with silicon, aluminum, and potassium content lowering and a significant elemental increase in calcium, sulfur, sodium, chlorine, and magnesium. A high calcium increase could be associated with its transformation into insoluble complex crystals and precipitates formed during distillation with other elements, i.e., sulfur, oxygen, and chlorine. Moreover, the high number of dissolved solids in brine could be composed of sodium and potassium salts due to their high solubility in water. Interestingly, after the backwashing, the increased appearance of silicon and aluminum and the further lowering of the sodium and magnesium revealed the pumice surface and pore reappearance. The presence of calcium was slightly changed after backwashing, suggesting its strong deposition on the pumice surface, i.e., in the form of complex insoluble crystals.
The EDS spectra of the pristine pumice after five CAD cycles and backwashing are shown in Figure 5, Figure 6, and Figure 7, respectively. The elemental dominance of silicon, aluminum, and oxygen can be observed in the pristine pumice EDS spectra, as seen in Figure 5, and at a low-intensity presence of sodium, potassium, calcium, and magnesium. The EDS spectra of pumice after five cycles of CAD are in Figure 6 confirm the spectral changes with decreased intensities of silicon and aluminum, increased intensities of sodium, potassium, calcium, and magnesium, and an additional appearance of chloride and sulfur signals, i.e., an indication of the separated solid/salt deposition and accumulation on the pumice surface. The EDS spectra in Figure 7 show the elemental characteristics of the pumice surface after backwashing, where a significant increase in silicon and aluminum intensities is observed, and a decrease in the sodium intensity was also observed, suggesting that some of the loose and soluble salts/solids could have been washed and rinsed from the pumice surface during backwashing. However, even after backwashing, calcium and magnesium slightly change, signifying their near-to-permanent accumulation and deposition on the pumice surface and negatively affecting its adsorption capacity and surface characteristics. Furthermore, for reference, the elemental maps of each element are added in the Supplementary Materials, Figure S4.

3.4.3. XRD Structural Analysis

The XRD analysis of pristine pumice, after five cycles of CAD and backwashing, was performed to analyze the structural changes and stability of the pumice. Figure 8 shows the XRD patterns for each sample. The XRD pattern of the pristine pumice appeared to be a wider peak between 2θ: 10 and 40°, depicting the amorphous behavior and dominant presence of silicate-based minerals that could have suppressed the crystals peaks of other compounds, i.e., based on aluminum, calcium, sodium, etc. Alike XRD patterns are reported in our previous work with sintered silica and clay filters and by other studies on pumice [40,46,47]. On the contrary, the XRD patterns of the pumice after five CAD cycles show a crystalline behavior with the appearance of slightly sharp peaks of different intensities at 2θ: 11.84, 14.94, 20.96, 23.64, 29.36, 31.96, 33.64, and 45.6°. These XRD patterns were further analyzed using the X’Pert High Score Plus 3.0e (Malvern Panalytical Ltd., Malvern, UK) software, i.e., to assess the information on the compounds and their structures related to the mentioned peaks. The intense peaks at 2θ: 20.96, 29.36° are identified as the salt of magnesium sulfate (MgSO4), while the peaks at 2θ: 11.84, 23.64° are identified as a complex compound salt of calcium, manganese, and oxide. In addition, a few less intense peaks at 2θ: 31.96 and 45.6° are identified as sodium chloride (NaCl), and one smaller peak at 2θ: 14.94° is recognized as a complex salt mineral of potassium and aluminum. After the backwashing, the XRD patterns appeared to be the same as pristine pumice with a significant appearance of MgSO4 and complex salt of calcium, suggesting their near-to-permanent deposition and accumulation on the pumice surface, which was partially removed after backwashing. Moreover, the XRD peaks of the NaCl salt disappeared due to its high solubility and dissolution in the backwashing solution.
The characterization results, i.e., SEM, EDS, and XRD, are correlated with others and confirmed the permanent deposition and accumulation of some of the calcium- and magnesium-based solids on the pumice surface, reducing its adsorption capacity. Moreover, these analyses revealed the consistent appearance and dissolution of some of the soluble salts on the pumice surface, i.e., during the CAD cycles and after backwashing.

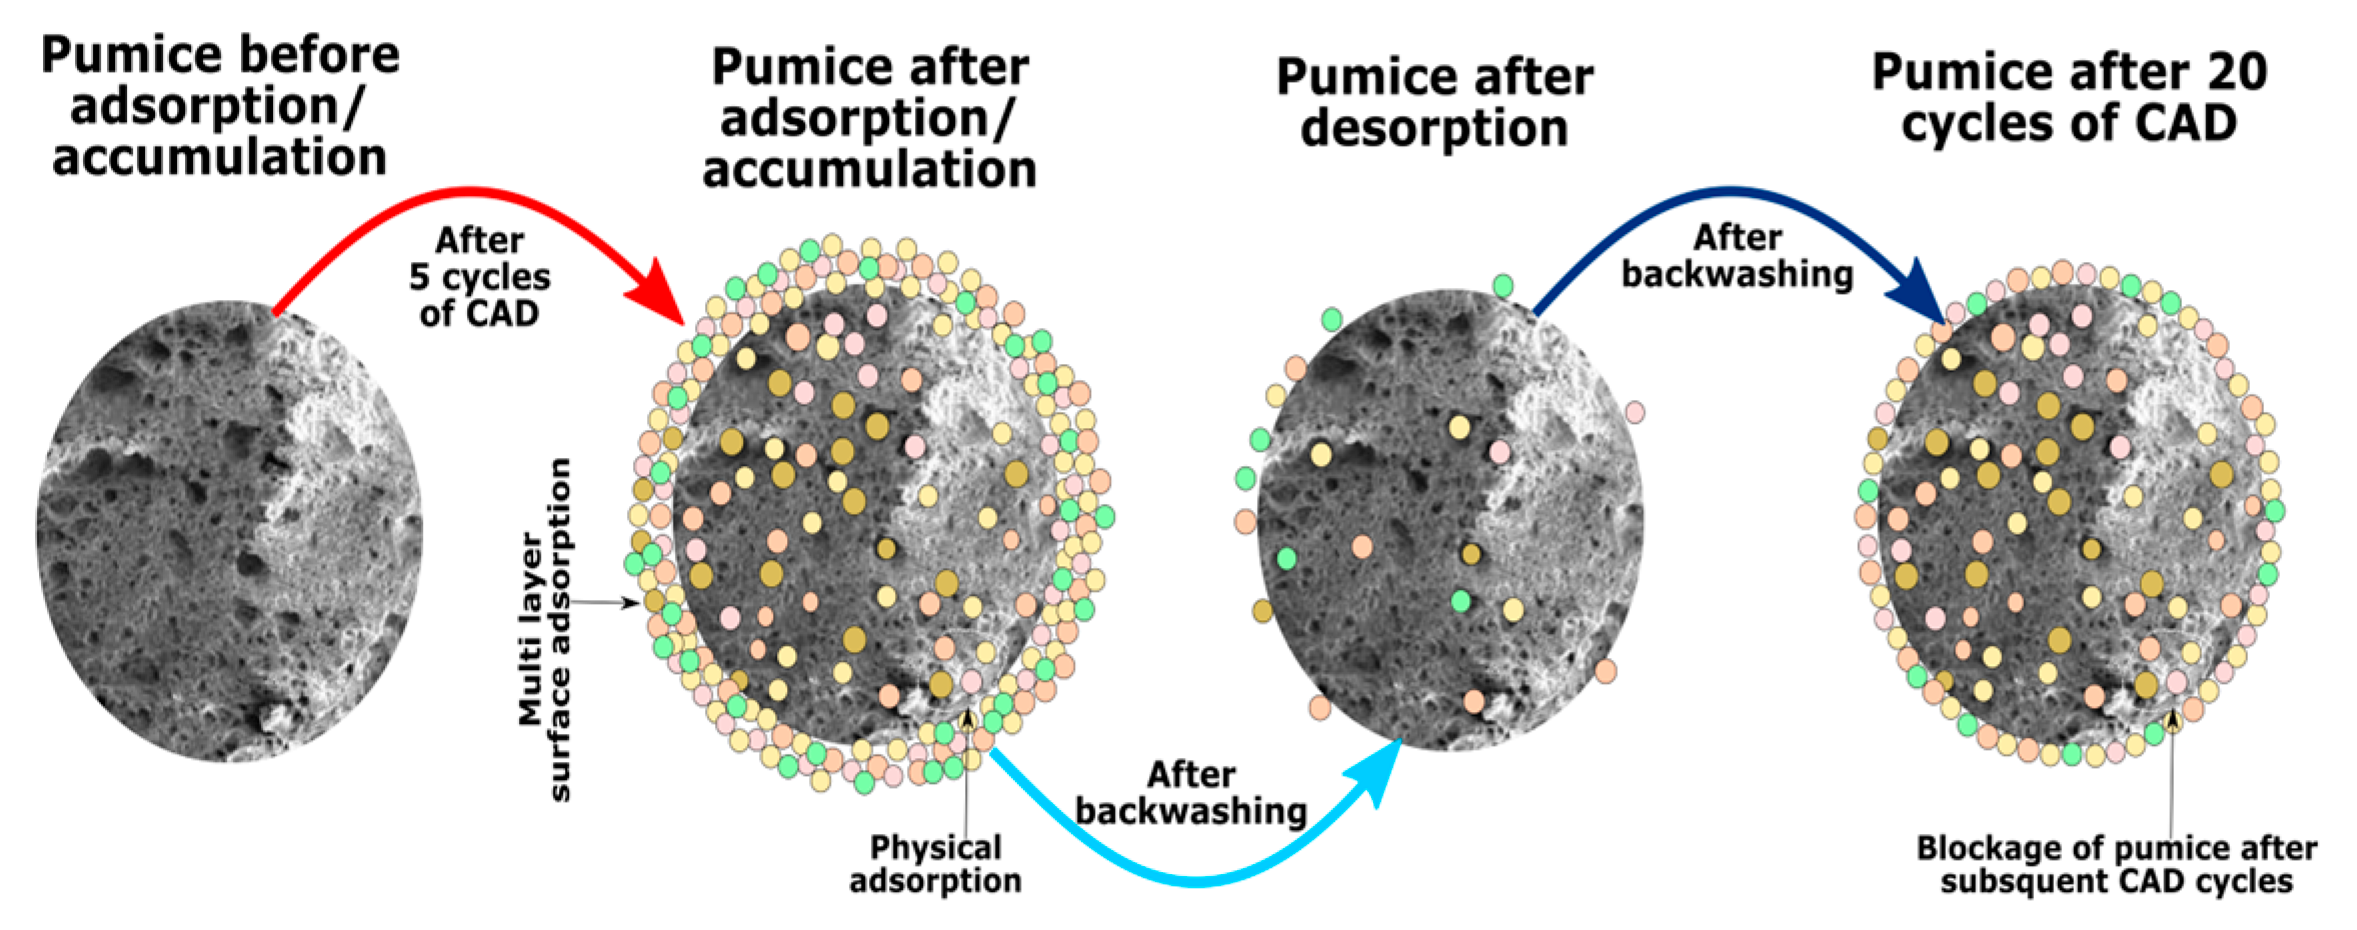
3.5. Mechanism of Pumice Behavior during CAD

Figure 9 shows the summarized mechanisms associated with pumice response during CAD consecutive cycles. The porous and vesicular structure of pumice completely accumulated with solids, i.e., after continuous CAD cycles. As per the characterization results, the salt accumulation could have occurred in the form of ionic adsorption, surface crystallization, transformation into complex compounds, and complete deposition on the pumice surface. Further, these mechanisms could be associated with multilayer solid intercalation on the pumice surface, facilitated by the physical adherence and chemical affinity of the separated ions and salt complexes (during distillation). The results on CAD cyclic performance and pumice characterization revealed simultaneous adsorption and multilayered intercalation of the separated salts/ions on the pumice surface. Initially, the available porous cavities of pumice were filled and saturated with the adsorption of separated salts. Later, these adsorbed layers acted as a base for intercalating the further separated salts/ions. Moreover, some of the physically adhered and soluble salts washed off from the pumice surface during backwashing, but some of the near-to-permanently deposited complex salts of calcium and magnesium remained intact with the pumice surface and kept accumulating in multilayers during continuous CAD cycles, which resulted in the complete blockage of the cavities and pores of the pumice and loss of adsorption capacity. In the future, it would be interesting to research the backwashing and regeneration potential of the pumice in acidic solution and intensive thermal treatments because some of the reported work stated improved performance of the activated carbon- and silica-based adsorbents using such techniques [48,49]. Further, the proposed mechanism could be studied in detail using additional physical and chemical characteristics of the pumice surface before and after CAD experiments and backwashing.

4. Conclusions

The present study validates the potential use of volcanic pumice minerals in a novel method of combined adsorption distillation (CAD). The CAD of the RO membrane reject water (ROR) was performed with different doses of pumice and compared with the addition of sand adsorbent and control distillation (without adding adsorbent). Initially, five cycles of the CAD process resulted in a high solid accumulation/retention and improved cyclic stability of pumice at a dose of 10 g. Further CAD cycles were continued to 20 at a 10 g addition of pumice, and in between, pumice backwashing was performed every five cycles to investigate the cyclic stability of the pumice and separated solid retention on its surface. The cyclic performance tests revealed that the solid accumulation rate of pumice was lost with each subsequent cycle, and partial improvement appeared after backwashing, i.e., with the dissolution and rinsing of some of the physically adhered and soluble salts/solids. The continuous deposition of some of the separated complex solids of calcium and magnesium completely blocked the vesicular pores and cavities of the pumice with a significant loss of its adsorption capacity.
The characterization of the pumice, i.e., before and after CAD and backwashing, was made using the SEM, EDS, and XRD techniques. The SEM images revealed the crystallization and accumulation of salts on the pumice surface and a partial removal of the accumulated salts after backwashing. At the same time, the EDS elemental analysis showed an increase in calcium and magnesium on the pumice surface, i.e., after the CAD process. In addition, the XRD analysis also confirmed the presence of complex salts of calcium oxide, magnesium sulfate, and sodium chloride on the pumice surface, some of which (sodium chloride) washed off during backwashing and some (magnesium sulfate and calcium oxide complex) were partially removed.
The results indicated the potential application of pumice combined with the distillation process to treat the ROR and sustainable handling of the separated solids/salts/ions. Furthermore, the current study facilitated the path to future research on pumice, i.e., in water and wastewater remediation, detailed kinetic and recharge studies using optimized backwashing, and recharge methods for improved results and practical application. In addition, future research on integrating concentrated brine treatment via solar drying and solidification could be considered to make CAD a sustainable method.

Supplementary Materials

The following supporting information can be downloaded at https://www.mdpi.com/article/10.3390/min13091131/s1, Figure S1: Digital image of configured lab-scale combined adsorption distillation (CAD) set-up; Figure S2 Salt accumulation on the distillation flask without using adsorbent; Figure S3: Sand and pumice appearance before and after CAD compared to the control sample; Figure S4: EDS elemental mapping of pumice after five CAD cycles.

Author Contributions

T.A.G. and T.A.Q. conceived the idea, performed the experiments, and were responsible for writeup and manuscript drafting. I.A. and N.M. interpreted the results and improvised the write-up. D.A.K. and S.B. performed the analysis and helped with data collection. T.R. assisted with the technical interpretation and provided access to the research instrument. R.B.M. supervised the experiments and edited the final manuscript. N.C. assisted in the XRD analysis. All authors have read and agreed to the published version of the manuscript.

Funding

This research and lab activity are supported by the supplies funded by the Higher Education Commission (HEC), Pakistan, under the research project Technology Transfer Support Fund (TTSF), Ref. No. 20-TTSF-76/RGM/R&D/HEC/2020, and the Technology Development Fund (TDF) HEC-TDF-03-037.

Data Availability Statement

Data will be made available on request.

Acknowledgments

The authors acknowledge the technical support of Barbara Bonelli, DISAT, Politecnico di Torino, Italy, Afzal Jamali, the Center for Pure and Applied Geology, University of Sindh, Jamshoro, and Irfan Ansari, Al-Rahim Textile Industries, Pakistan.

Conflicts of Interest

The authors declare no conflict of interest.

References

  1. Alshameri, A.; Wei, X.; Wang, H.; Fuguo, Y.; Chen, X.; He, H.; Yan, C.; Xu, F. A review of the role of natural clay minerals as effective adsorbents and an alternative source of minerals. Minerals 2019, 3, 49–64. [Google Scholar] [CrossRef]
  2. Tarasevich, Y.I. Application of natural adsorbents and adsorption-active materials based thereon in the processes of water purification. In Studies in Surface Science and Catalysis; Elsevier: Amsterdam, The Netherlands, 1999; Volume 120, pp. 659–722. [Google Scholar]
  3. Mustapha, S.; Tijani, J.; Ndamitso, M.; Abdulkareem, S.; Shuaib, D.; Mohammed, A.; Sumaila, A. The role of kaolin and kaolin/ZnO nanoadsorbents in adsorption studies for tannery wastewater treatment. Sci. Rep. 2020, 10, 13068. [Google Scholar] [CrossRef]
  4. Zhang, Q.; Lin, B.; Hong, J.; Chang, C.-T. Removal of ammonium and heavy metals by cost-effective zeolite synthesized from waste quartz sand and calcium fluoride sludge. Water Sci. Technol. 2017, 75, 587–597. [Google Scholar] [CrossRef]
  5. Ouyang, D.; Zhuo, Y.; Hu, L.; Zeng, Q.; Hu, Y.; He, Z. Research on the adsorption behavior of heavy metal ions by porous material prepared with silicate tailings. Minerals 2019, 9, 291. [Google Scholar] [CrossRef]
  6. Burham, N.; Sayed, M. Adsorption behavior of Cd2+ and Zn2+ onto natural Egyptian bentonitic clay. Minerals 2016, 6, 129. [Google Scholar] [CrossRef]
  7. Moradi, M.; Soltanian, M.; Pirsaheb, M.; Sharafi, K.; Soltanian, S.; Mozafari, A. The efficiency study of pumice powder to lead removal from the aquatic environment: Isotherms and kinetics of the reaction. J. Maz. Univ. Med. Sci. 2013, 22, 65–75. [Google Scholar]
  8. Soleimani, H.; Mahvi, A.H.; Yaghmaeian, K.; Abbasnia, A.; Sharafi, K.; Alimohammadi, M.; Zamanzadeh, M. Effect of modification by five different acids on pumice stone as natural and low-cost adsorbent for removal of humic acid from aqueous solutions-Application of response surface methodology. J. Mol. Liq. 2019, 290, 111181. [Google Scholar] [CrossRef]
  9. Yavuz, M.; Gode, F.; Pehlivan, E.; Ozmert, S.; Sharma, Y.C. An economic removal of Cu2+ and Cr3+ on the new adsorbents: Pumice and polyacrylonitrile/pumice composite. Chem. Eng. J. 2008, 137, 453–461. [Google Scholar] [CrossRef]
  10. Moraci, N.; Calabrò, P.S. Heavy metals removal and hydraulic performance in zero-valent iron/pumice permeable reactive barriers. J. Environ. Manag. 2010, 91, 2336–2341. [Google Scholar] [CrossRef]
  11. Catalfamo, P.; Arrigo, I.; Primerano, P.; Corigliano, F. Efficiency of a zeolitized pumice waste as a low-cost heavy metals adsorbent. J. Hazard. Mater. 2006, 134, 140–143. [Google Scholar] [CrossRef]
  12. Awan, M.A.; Qazi, I.A.; Khalid, I. Removal of heavy metals through adsorption using sand. J. Environ. Sci. 2003, 15, 413–416. [Google Scholar]
  13. Diels, L.; Spaans, P.; Van Roy, S.; Hooyberghs, L.; Ryngaert, A.; Wouters, H.; Walter, E.; Winters, J.; Macaskie, L.; Finlay, J. Heavy metals removal by sand filters inoculated with metal sorbing and precipitating bacteria. Hydrometallurgy 2003, 71, 235–241. [Google Scholar] [CrossRef]
  14. Abbasi, M.; Safari, E.; Baghdadi, M.; Janmohammadi, M. Enhanced adsorption of heavy metals in groundwater using sand columns enriched with graphene oxide: Lab-scale experiments and process modeling. J. Water Process Eng. 2021, 40, 101961. [Google Scholar] [CrossRef]
  15. Zhou, P.; Huang, J.-C.; Li, A.W.; Wei, S. Heavy metal removal from wastewater in fluidized bed reactor. Water Res. 1999, 33, 1918–1924. [Google Scholar] [CrossRef]
  16. Lee, H.; Jeon, D.; Song, H.; Sim, S.W.; Kim, D.; Yu, J.; Cho, K.H.; Oh, J.E. Recycling of reverse osmosis (RO) reject water as a mixing water of calcium sulfoaluminate (CSA) cement for brick production. Appl. Sci. 2019, 9, 5044. [Google Scholar] [CrossRef]
  17. Greenlee, L.F.; Lawler, D.F.; Freeman, B.D.; Marrot, B.; Moulin, P. Reverse osmosis desalination: Water sources, technology, and today’s challenges. Water Res. 2009, 43, 2317–2348. [Google Scholar] [CrossRef] [PubMed]
  18. Yang, Z.; Zhou, Y.; Feng, Z.; Rui, X.; Zhang, T.; Zhang, Z. A review on reverse osmosis and nanofiltration membranes for water purification. Polymers 2019, 11, 1252. [Google Scholar] [CrossRef] [PubMed]
  19. Panagopoulos, A.; Haralambous, K.-J.; Loizidou, M. Desalination brine disposal methods and treatment technologies-A review. Sci. Total Environ. 2019, 693, 133545. [Google Scholar] [CrossRef]
  20. Leon, F.; Ramos, A.; Vaswani, J.; Mendieta, C.; Brito, S. Climate change mitigation strategy through membranes replacement and determination methodology of carbon footprint in reverse osmosis RO desalination plants for islands and isolated territories. Water 2021, 13, 293. [Google Scholar] [CrossRef]
  21. Valdés, H.; Saavedra, A.; Flores, M.; Vera-Puerto, I.; Aviña, H.; Belmonte, M. Reverse Osmosis Concentrate: Physicochemical Characteristics, Environmental Impact, and Technologies. Membranes 2021, 11, 753. [Google Scholar] [CrossRef]
  22. Rilwani, M.L.; Agbanure, F.E. An assessment of the environmental impact of asphalt production in Nigeria. Anthropologist 2010, 12, 277–287. [Google Scholar] [CrossRef]
  23. Wei, C.; Lao, Y.; Ouyang, R.; Zhang, G.; Huang, G.; Deng, F.; Tan, Q.; Lin, G.; Zhou, H. Evaluation of Different Reverse Osmosis Membranes for Textile Dyeing and Finishing Wastewater Reuse. Membranes 2023, 13, 420. [Google Scholar] [CrossRef] [PubMed]
  24. Camacho, L.M.; Dumée, L.; Zhang, J.; Li, J.-d.; Duke, M.; Gomez, J.; Gray, S. Advances in membrane distillation for water desalination and purification applications. Water 2013, 5, 94–196. [Google Scholar] [CrossRef]
  25. Bazinet, L.; Geoffroy, T.R. Electrodialytic processes: Market overview, membrane phenomena, recent developments and sustainable strategies. Membranes 2020, 10, 221. [Google Scholar] [CrossRef]
  26. Jia, X.; Klemeš, J.J.; Varbanov, P.S.; Wan Alwi, S.R. Analyzing the energy consumption, GHG emission, and cost of seawater desalination in China. Energies 2019, 12, 463. [Google Scholar] [CrossRef]
  27. Charcosset, C. Classical and Recent Developments of Membrane Processes for Desalination and Natural Water Treatment. Membranes 2022, 12, 267. [Google Scholar] [CrossRef]
  28. Plattner, J.; Kazner, C.; Naidu, G.; Wintgens, T.; Vigneswaran, S. Removal of selected pesticides from groundwater by membrane distillation. Environ. Sci. Pollut. Res. 2018, 25, 20336–20347. [Google Scholar] [CrossRef]
  29. Younos, T.; Tulou, K.E. Overview of desalination techniques. J. Contemp. Water Res. Educ. 2005, 132, 3–10. [Google Scholar] [CrossRef]
  30. Weber-Scannell, P.K.; Duffy, L.K.; Weber-Scannell, P.K.; Duffy, L.K. Effects of total dissolved solids on aquatic organisms: A review of literature and recommendation for salmonid species. Am. J. Environ. Sci. 2007, 3, 1–6. [Google Scholar]
  31. Liu, C.; Zhu, L.; Chen, L. Effect of salt and metal accumulation on performance of membrane distillation system and microbial community succession in membrane biofilms. Water Res. 2020, 177, 115805. [Google Scholar] [CrossRef]
  32. Laqbaqbi, M.; Sanmartino, J.A.; Khayet, M.; García-Payo, C.; Chaouch, M. Fouling in membrane distillation, osmotic distillation and osmotic membrane distillation. Appl. Sci. 2017, 7, 334. [Google Scholar] [CrossRef]
  33. Al-Ahmad, M.; Aleem, F.A. Scale formation and fouling problems effect on the performance of MSF and RO desalination plants in Saudi Arabia. Desalination 1993, 93, 287–310. [Google Scholar] [CrossRef]
  34. Gadhi, T.; Mahar, R.; Bukhari, S. Wastewater Treatment and Reuse to Approach Zero Water Discharge in Al-Rahim Textile Industries: Substantial Increase in Water Use Efficiency in Textile Processing; US-Pakistan Center for Advanced Studies in Water, MUET: Jamshoro, Pakistan, 2019. [Google Scholar]
  35. Balal, S.A.; Gadhi, T.A. Treatment of RO membranes reject water using distillation technique. In Proceedings of the International Conference on Energy, Water and Environment—ICEWE-2021, Lahore, Pakistan, 31 March 2021; p. 365. [Google Scholar]
  36. Rice, E.W.; Bridgewater, L. Standard Methods for the Examination of Water and Wastewater; American Public Health Association: Washington, DC, USA, 2012; Volume 10. [Google Scholar]
  37. Hamdhan, I.N.; Clarke, B.G. Determination of thermal conductivity of coarse and fine sand soils. In Proceedings of the Proceedings World Geothermal Congress, Bali Island, Indonesia, 25–30 April 2010. [Google Scholar]
  38. van Manen, S.M.; Wallin, E. Ground temperature profiles and thermal rock properties at Wairakei, New Zealand. Renew. Energy 2012, 43, 313–321. [Google Scholar] [CrossRef]
  39. Ren, S.; Liu, J.; Guo, A.; Zang, W.; Geng, H.; Tao, X.; Du, H. Mechanical properties and thermal conductivity of a temperature resistance hollow glass microspheres/borosilicate glass buoyance material. Mater. Sci. Eng. 2016, 674, 604–614. [Google Scholar] [CrossRef]
  40. Ismail, A.; El-Shafey, O.; Amr, M.; El-Maghraby, M. Pumice characteristics and their utilization on the synthesis of mesoporous minerals and on the removal of heavy metals. Int. Sch. Res. Not. 2014, 2014, 259379. [Google Scholar] [CrossRef] [PubMed]
  41. Mahvi, A.H.; Heibati, B.; Mesdaghinia, A.; Yari, A.R. Fluoride adsorption by pumice from aqueous solutions. E-J. Chem. 2012, 9, 1843–1853. [Google Scholar] [CrossRef]
  42. Guler, U.A.; Sarioglu, M. Removal of tetracycline from wastewater using pumice stone: Equilibrium, kinetic and thermodynamic studies. J. Environ. Health Sci. Eng. 2014, 12, 79. [Google Scholar] [CrossRef]
  43. Indah, S.; Helard, D.; Primasari, B.; Edwin, T.; Putra, R.H. Modification of natural pumice by physical and chemical treatments for removal of zinc ions from aqueous solution. MATEC Web Conf. 2019, 276, 06009. [Google Scholar] [CrossRef]
  44. Klug, C.; Cashman, K.; Bacon, C. Structure and physical characteristics of pumice from the climactic eruption of Mount Mazama (Crater Lake), Oregon. Bull. Volcanol. 2002, 64, 486–501. [Google Scholar]
  45. Fu, W.; Yu, M.; Yang, M.; Yu, H.; Yang, Y.; Qian, S.; Dong, X.; Xia, L. Preparation of Pumice Stone Morphology AgAlO2@ ZnO S-Type Heterojunction Photocatalyst with the Synergistic Effect of Photocatalytic Degradation and Hydrogen Production. Cryst. Growth Des. 2023, 23, 2331–2342. [Google Scholar] [CrossRef]
  46. Latif, A.; Memon, A.M.; Gadhi, T.A.; Bhurt, I.A.; Channa, N.; Mahar, R.B.; Ali, I.; Chiadò, A.; Bonelli, B. Bi2O3 immobilized 3D structured clay filters for solar photocatalytic treatment of wastewater from batch to scaleup reactors. Mater. Chem. Phys. 2022, 276, 125297. [Google Scholar] [CrossRef]
  47. Gadhi, T.A.; Bhurt, I.A.; Qureshi, T.A.; Ali, I.; Latif, A.; Mahar, R.B.; Channa, N.; Bonelli, B. Photocatalytic Denitrification of Nitrate Using Fe-TiO2-Coated Clay Filters. Catalysts 2023, 13, 729. [Google Scholar] [CrossRef]
  48. Patel, H. Review on solvent desorption study from exhausted adsorbent. J. Saudi Chem. Soc. 2021, 25, 101302. [Google Scholar] [CrossRef]
  49. Alsawy, T.; Rashad, E.; El-Qelish, M.; Mohammed, R.H. A comprehensive review on the chemical regeneration of biochar adsorbent for sustainable wastewater treatment. NPJ Clean Water 2022, 5, 29. [Google Scholar] [CrossRef]
Figure 1. Schematic layout of the lab-scale combined adsorption distillation (CAD) method; scheme made by Inkscape software 0.92.
Minerals 13 01131 g001
Figure 2. Five cycle performances of combined adsorption distillation (CAD); (A,C,E) measured dissolved solids in brine at 2, 5, and 10 g doses of pumice and sand, and (B,D,F) retained amount of solids on the pumice and sand surface at different doses.
Minerals 13 01131 g002
Figure 3. Cyclic performance of pumice with plots showing solid concentration in brine and retention on pumice surface.
Minerals 13 01131 g003
Figure 4. SEM images of (A) pristine pumice, (B) pumice after five CAD cycles, and (C) pumice after backwashing.
Minerals 13 01131 g004
Figure 5. EDS spectra of the pristine pumice.
Minerals 13 01131 g005
Figure 6. EDS spectra of the pumice after five CAD cycles.
Minerals 13 01131 g006
Figure 7. EDS spectra of the pumice after backwashing.
Minerals 13 01131 g007
Figure 8. XRD patterns of the pumice before and after CAD and after backwashing.
Minerals 13 01131 g008
Figure 9. Mechanism of solid accumulation and deposition on the pumice surface; scheme made by Inkscape software 0.92.
Minerals 13 01131 g009
Table 1. Water quality analysis of ROR and condensed distillate.
ParameterUnitRORCondensed Distillate with Sand Adsorbent (10 g)Condensed Distillate with Pumice Adsorbent (10 g)Condensed Distillate without Adsorbent
Avg. distillation time 4.7 h2.9 h2.75 h
pH-----8.127.17.37.5
ECµS/cm85324129123
TDSmg/L5500191163
TurbidityNTU0.31000
Sodiummg/L31127.55.412.5
Calciummg/L91252.16.8
Magnesiummg/L1794.21.95.4
Chloridemg/L915.13.47.5
Table 2. Elemental analysis of pumice (10 g concentration) before and after CAD and after backwashing.
ElementsPristine Pumice
%
Pumice after Five Cycles of CAD %Pumice after Backwashing %
Oxygen57.9254.1357.21
Silicon29.5713.0920.67
Sodium2.244.021.68
Aluminum5.431.912.80
Potassium2.971.021.28
Calcium1.4611.3910.38
Magnesium0.412.741.63
Sulfur04.982.27
Chlorine03.850
Disclaimer/Publisher’s Note: The statements, opinions and data contained in all publications are solely those of the individual author(s) and contributor(s) and not of MDPI and/or the editor(s). MDPI and/or the editor(s) disclaim responsibility for any injury to people or property resulting from any ideas, methods, instructions or products referred to in the content.

