
Laboratory Emissivity Spectra of Sulphide-Bearing Samples, New Constraints for the Surface of Mercury: Oldhamite in Mafic Aggregates
 , and
, and
Abstract
:1. Introduction
The hollows were morphologically attributed to degassing processes (e.g., [12,13]); relatively unexpected high S/Si has been measured on Mercury’s surface (e.g., [1,14]); the surface of Mercury has undergone extensive pyroclastic activity (e.g., [15,16,17,18]) which indicates high levels of volatile components in the magma reservoir [19].
2. Methods
2.1. Selection and Preparation of the Samples
2.2. Experimental Setup
2.3. Analytical Approach
3. Results
4. Discussion
5. Conclusions
Author Contributions
Funding
Data Availability Statement
Acknowledgments
Conflicts of Interest
References
- Nittler, L.R.; Starr, R.D.; Weider, S.Z.; McCoy, T.J.; Boynton, W.V.; Ebel, D.S.; Ernst, C.M.; Evans, L.G.; Goldsten, J.O.; Hamara, D.K.; et al. The major-element composition of Mercury’s surface from MESSENGER X-ray spectrometry. Science 2011, 333, 1847–1850. [Google Scholar] [CrossRef] [PubMed]
- Schlemm, C.E.; Starr, R.D.; Ho, G.C.; Bechtold, K.E.; Hamilton, S.A.; Boldt, J.D.; Boynton, W.V.; Bradley, W.; Fraeman, M.E.; Gold, R.E.; et al. The X-Ray Spectrometer on the MESSENGER spacecraft. Space Sci. Rev. 2007, 131, 393–415. [Google Scholar] [CrossRef]
- Goldsten, J.O.; Rhodes, E.A.; Boynton, W.V.; Feldman, W.C.; Lawrence, D.J.; Trombka, J.I.; Smith, D.M.; Evans, L.G.; White, J.; Madden, N.W.; et al. The MESSENGER Gamma-Ray and Neutron Spectrometer. Space Sci. Rev. 2007, 131, 339–391. [Google Scholar] [CrossRef]
- Peplowski, P.N.; Evans, L.G.; Hauck, S.A.; McCoy, T.J.; Boynton, W.V.; Gillis-Davis, J.J.; Ebel, D.S.; Goldsten, J.O.; Hamara, D.K.; Lawrence, D.J.; et al. Radioactive elements on Mercury’s surface from MESSENGER: Implications for the planet’s formation and evolution. Science 2011, 333, 1850–1852. [Google Scholar] [CrossRef] [PubMed]
- McClintock, W.E.; Lankton, M.R. The Mercury atmospheric and surface composition spectrometer for the MESSENGER mission. Space Sci. Rev. 2007, 131, 481–521. [Google Scholar] [CrossRef]
- McClintock, W.E.; Izenberg, N.R.; Holsclaw, G.M.; Blewett, D.T.; Domingue, D.L.; Head, J.W., III; Helbert, J.; McCoy, T.J.; Murchie, S.L.; Robinson, M.S.; et al. Spectroscopic observations of Mercury’s surface reflectance during MESSENGER’s first Mercury flyby. Science 2008, 321, 62–65. [Google Scholar] [CrossRef]
- Hawkins, S.E.; Boldt, J.D.; Darlington, E.H.; Espiritu, R.; Gold, R.E.; Gotwols, B.; Grey, M.P.; Hash, C.D.; Hayes, J.R.; Jaskulek, S.E.; et al. The Mercury Dual Imaging System on the MESSENGER Spacecraft. Space Sci. Rev. 2007, 131, 247–338. Available online: https://link.springer.com/chapter/10.1007/978-0-387-77214-1_9 (accessed on 23 October 2007). [CrossRef]
- Robinson, M.S.; Murchie, S.L.; Blewett, D.T.; Domingue, D.L.; Hawkins, S.E., III; Head, J.W.; Holsclaw, G.M.; McClintock, W.E.; McCoy, T.J.; McNutt, R.L.; et al. Reflectance and color variations on Mercury: Regolith processes and compositional heterogeneity. Science 2008, 321, 66–69. [Google Scholar] [CrossRef]
- Vilas, F.; Domingue, D.L.; Helbert, J.; D’Amore, M.; Maturilli, A.; Klima, R.L.; Stockstill-Cahill, K.R.; Murchie, S.L.; Izenberg, N.R.; Blewett, D.T.; et al. Mineralogical indicators of Mercury’s hollows composition inMESSENGER color observations. Geophys. Res. Lett. 2016, 43, 1450–1456. [Google Scholar] [CrossRef]
- Helbert, J.; Maturilli, A.; D’Amore, M. Visible and near-infrared reflectance spectra of thermally processed synthetic sulfides as a potential analog for the hollow forming materials on Mercury. Earth Planet. Sci. Lett. 2013, 369, 233–238. [Google Scholar] [CrossRef]
- Lucchetti, A.; Pajola, M.; Galluzzi, V.; Giacomini, L.; Carli, C.; Cremonese, G.; Marzo, G.A.; Ferrari, S.; Massironi, M.; Palumbo, P. Mercury hollows as remnants of original bedrock materials and devolatilization processes: A spectral clustering and geomorphological analysis. J. Geophys. Res. Planets 2018, 123, 2365–2379. [Google Scholar] [CrossRef]
- Blewett, D.T.; Chabot, N.L.; Denevi, B.W.; Ernst, C.M.; Head, J.W.; Izenberg, N.R.; Murchie, S.L.; Solomon, S.C.; Nittler, L.R.; McCoy, T.J.; et al. Hollows on Mercury: MESSENGER evidence for geologically recent volatile-related activity. Science 2011, 333, 1856–1859. [Google Scholar] [CrossRef] [PubMed]
- Blewett, D.T.; Vaughan, W.M.; Xiao, Z.; Chabot, N.L.; Denevi, B.W.; Ernst, C.M.; Helbert, J.; D’Amore, M.; Maturilli, A.; Head, J.W.; et al. Mercury’s hollows: Constraints on formation and composition from analysis of geological setting and spectral reflectance. J. Geophys. Res. Planets 2013, 118, 1013–1032. [Google Scholar] [CrossRef]
- Weider, S.Z.; Nittler, L.R.; Starr, R.D.; McCoy, T.J.; Stockstill-Cahill, K.R.; Byrne, P.K.; Denevi, B.W.; Head, J.W.; Solomon, S.C. Chemical heterogeneity on Mercury’s surface revealed by the MESSENGER X-Ray Spectrometer. J. Geophys. Res. 2012, 117, E00L05. [Google Scholar] [CrossRef]
- Head, J.W.; Murchie, S.L.; Prockter, L.M.; Solomon, S.C.; Chapman, C.R.; Strom, R.G.; Watters, T.R.; Blewett, D.T.; Gillis-Davis, J.J.; Fassett, C.I.; et al. Volcanism on Mercury: Evidence from the first MESSENGER flyby for extrusive and explosive activity and the volcanic origin of plains. Earth Planet. Sci. Lett. 2009, 285, 227–242. [Google Scholar] [CrossRef]
- Thomas, R.J.; Rothery, D.A.; Conway, S.J.; Anand, M. Mechanisms of explosive volcanism on Mercury: Implications from its global distribution and morphology. J. Geophys. Res. Planets 2014, 119, 2239–2254. [Google Scholar] [CrossRef]
- Besse, S.; Doressoundiram, A.; Barraud, O.; Griton, L.; Cornet, T.; Crego, C.M.; Varatharajan, I.; Helbert, J. Spectral properties and physical extent of pyroclastic deposits on mercury: Variability within selected deposits and implications for explosive volcanism. J. Geophys. Res Planets 2020, 125, e2018JE005879. [Google Scholar] [CrossRef]
- Galiano, A.; Capaccioni, F.; Filacchione, G.; Carli, C. Spectral identification of pyroclastic deposits on Mercury with MASCS/MESSENGER data. Icarus 2022, 388, 115233. [Google Scholar] [CrossRef]
- Kerber, L.; Head, J.W.; Blewett, D.T.; Solomon, S.C.; Wilson, L.; Murchie, S.L.; Robinson, M.S.; Denevi, B.W.; Domingue, D.L. The global distribution of pyroclastic deposits on Mercury: The view from MESSENGER flybys 1–3. Planet. Spac. Sci. 2011, 59, 1895–1909. [Google Scholar] [CrossRef]
- Namur, O.; Charlie, B.; Holtz, F.; Carter, C.; McCammon, C. Sulfur solubility in reduced mafic silicate melts: Implications for the speciation and distribution of sulfur on Mercury. EPSL 2016, 448, 102–114. [Google Scholar] [CrossRef]
- Varatharajan, I.; Maturilli, A.; Helbert, J.; Alemanno, G.; Hiesinger, H. Spectral behavior of sulfides in simulated daytime surface conditions of Mercury: Supporting past (MESSENGER) and future missions (BepiColombo). Earth Planet. Sci. Lett. 2019, 520, 127–140. [Google Scholar] [CrossRef]
- Barbaro, A.; Zorzi, F.; Lorenzetti, A.; Ferrari, S.; Tubaro, C.; Nestola, F. Thermal expansion of Oldhamite, CaS: Implication for the surface of Mercury. Icarus 2023, 401, 115629. [Google Scholar] [CrossRef]
- Namur, O.; Charlier, B. Silicate mineralogy at the surface of Mercury. Nat. Geosci. 2017, 10, 9–13. [Google Scholar] [CrossRef]
- Stockstill-Cahill, K.R.; McCoy, T.J.; Nittler, L.R.; Weider, S.Z.; Hauck, S.A., II. Magnesium-rich crustalcompositions on Mercury: Implications for magmatism from petrologic modeling. J. Geophys. Res. 2012, 117, E00L15. [Google Scholar] [CrossRef]
- Charlier, B.; Grove, T.L.; Zuber, M.T. Phase equilibria of ultramafic compositions on Mercury and the origin of the compositional dichotomy. Earth Planet. Sci. Lett. 2013, 363, 50–60. [Google Scholar] [CrossRef]
- Vander Kaaden, K.E.; McCubbin, F.M.; Nittler, L.R.; Peplowski, P.N.; Weider, S.Z.; Frank, E.A.; McCoy, T.J. Geochemistry, mineralogy, and petrology of boninitic and komatiitic rocks on the mercurian surface: Insights into the mercurian mantle. Icarus 2017, 285, 155–168. [Google Scholar] [CrossRef]
- Weider, S.Z.; Nittler, L.R.; Starr, R.D.; McCoy, T.J.; Solomon, S.C. Variations in the abundance of iron on Mercury’s surface from MESSENGER x-ray spectrometer observations. Icarus 2014, 235, 170–186. [Google Scholar] [CrossRef]
- Klima, R.L.; Izenberg, N.R.; Holsclaw, G.M.; Helbert, J.; D’Amore, M.; McClintock, W.E.; Solomon, S.C. Visible to near-infrared hyperspectral measurements of mercury: Challenges for deciphering surface mineralogy. In Proceedings of the 6th Workshop on Hyperspectral Image and Signal Processing: Evolution in Remote Sensing (WHISPERS), Lausanne, Switzerland, 24–27 June 2014; pp. 1–4. [Google Scholar] [CrossRef]
- Hamilton, V.E. Thermal infrared (vibrational) spectroscopy of Mg–Fe olivines: A review and applications to determining the composition of planetary surfaces. Geochemistry 2010, 70, 7–33. [Google Scholar] [CrossRef]
- Helbert, J.; Nestola, F.; Ferrari, S.; Maturilli, A.; Massironi, M.; Redhammer, G.J.; Capria, M.T.; Carli, C.; Capaccioni, F.; Bruno, M. Olivine thermal emissivity under extreme temperature ranges: Implication for Mercury surface. Earth Planet. Sci. Lett. 2013, 371–372, 252–257. [Google Scholar] [CrossRef]
- Farmer, V.C. The Infrared Spectra of Minerals; Mineralogical Society of Great Britain and Ireland: London, UK, 1974; pp. 1–540. [Google Scholar]
- Christensen, P.R.; Bandfield, J.L.; Hamilton, V.E.; Howard, D.A.; Lane, M.D.; Piatek, J.L.; Ruff, S.W.; Stefanov, W.L. A thermal emission spectral library of rock-forming minerals. JGR 2000, 105, 9735–9739. [Google Scholar] [CrossRef]
- Nash, D.B.; Salisbury, J.W. Infrared reflectance spectra (2.2–15 mm) of plagioclase feldspars. Geophys. Res. Lett. 1991, 18, 1151–1154. [Google Scholar] [CrossRef]
- Milam, K.A.; McSween, H.Y., Jr.; Christensen, P.R. Plagioclase compositions derived from thermal emis-sion spectra of compositionally complex mixtures: Implications for Martian feldspar mineralogy. J. Geophys. Res. 2007, 112, E10005. [Google Scholar] [CrossRef]
- Reitze, M.P.; Weber, I.; Morlok, A.; Hiesinger, H.; Bauch, K.E.; Stojic, A.N.; Helbert, J. Mid-infrared spectros-copy of crystalline plagioclase feldspar samples with various Al, Si order and implications for remote sensing of Mercury and other terrestrial Solar System objects. Earth Planet. Sci. Lett. 2021, 554, 116697. [Google Scholar] [CrossRef]
- Vander Kaaden, K.E.; McCubbin, F.M. The origin of boninites on Mercury: An experimental study of the northern volcanic plains lavas. Geochim. Et Cosmochim. Acta 2016, 173, 246–263. [Google Scholar] [CrossRef]
- Peplowski, P.N.; Evans, L.G.; Stockstill-Cahill, K.R.; Lawrence, D.J.; Goldsten, J.O.; McCoy, T.J.; Nittler, L.R.; Solomon, S.C.; Sprague, A.L.; Starr, R.D.; et al. Enhanced sodium abundance in Mercury’s north polar region revealed by the MESSENGER Gamma-Ray spectrometer. Icarus 2014, 228, 86–95. [Google Scholar] [CrossRef]
- Capaccioni, F.; Filacchione, G.; Piccioni, G.; Dami, M.; Tommasi, L.; Barbis, A.; Ficai-Veltroni, I. Pre-Launch Calibrations of the Vis-IR Hyperspectral Imager (VIHI) onboard BepiColombo, the ESA Mission to Mercury. In Proceedings of the SPIE; Society of Photo-Optical Instrumentation Engineers (SPIE) Conference Series; SPIE: Bellingham, WA, USA, 2013; Volume 8867, p. 886704. [Google Scholar] [CrossRef]
- Cremonese, G.; Capaccioni, F.; Capria, M.T.; Doressoundiram, A.; Palumbo, P.; Vincendon, M.; Massironi, M.; Debei, S.; Zusi, M.; Altieri, F.; et al. SIMBIO-SYS; scientific cameras and spectrometer for the BepiColombo Mission. Space Sci. Rev. 2020, 216, 75. [Google Scholar] [CrossRef]
- Hiesinger, H.; Helbert, J.; Alemanno, G.; Bauch, K.E.; D’amore, M.; Maturilli, A.; Morlok, A.; Reitze, M.P.; Stangarone, C.; Stojic, A.N.; et al. Studying the Composition and Mineralogy of the Hermean Surface with the Mercury Radiometer and Thermal Infrared Spectrometer (MERTIS) for the BepiColombo Mission: An Update. Space Sci. Rev. 2020, 216, 110. [Google Scholar] [CrossRef]
- Ferrari, S.; Nestola, F.; Massironi, M.; Maturilli, A.; Helbert, J.; Alvaro, M.; Domeneghetti, M.C.; Zorzi, F. In-situ high-temperature emissivity spectra and thermal expansion of C2/c pyroxenes: Implications for the surface of Mercury. Am. Mineral. 2014, 99, 786–792. [Google Scholar] [CrossRef]
- Maturilli, A.; Helbert, J.; St. John, J.M.; Head, J.W., III; Vaughan, W.M.; D’Amore, M.; Gottschalk, M.; Ferrari, S. Komatiites as Mercury surface analogues: Spectral measurements at PEL. Earth Planet. Sci. Lett. 2014, 398, 58–65. [Google Scholar] [CrossRef]
- Carli, C.; Capaccioni, F.; Maturilli, A.; Ammannito, E.; Ferrari, S.; Nestola, F.; Helbert, J.; Massironi, M.; Sgavetti, M.; Serventi, G. Studying basalts spectra in the VNIR and MidIR: What we could learn integrating data from VIHI and MERTIS the spectrometers onboard BepiColombo. In Proceedings of the EGU General Assembly, Vienna, Austria, 22–27 April 2012; p. 6099. [Google Scholar]
- Carli, C.; Serrano, L.M.; Maturilli, A.; Massironi, M.; Capaccioni, F.; Helbert, J. VNIR and TIR spectra of terrestrial komatiites possibly analogues of some hermean terrain compositions. In Proceedings of the 44th Lunar and Planetary Science Conference, The Woodlands, TX, USA, 18–22 March 2013. Abstract 1923. [Google Scholar]
- Maturilli, A.; Helbert, J.; Varatharajan, I.; D’Amore, M. Emissivity Spectra of Mercury Analogues under Mercury Pressure and Temperature Conditions. EPSC 2017, 11, EPSC2017-610. [Google Scholar]
- Ferrari, S.; Maturilli, A.; Carli, C.; D’Amore, M.; Helbert, J.; Nestola, F.; Hiesinger, H. Thermal infrared emissivity of felsic-rich to mafic-rich analogues of hot planetary regoliths. Earth Planet. Sci. Lett. 2020, 534, 116089. [Google Scholar] [CrossRef]
- Secchiari, A.; Montanini, A.; Bosch, D.; Macera, P.; Cluzel, D. The contrasting geochemical message from the New Caledonia gabbronorites: Insights on depletion and contamination processes of the sub-arc mantle in a nascent arc setting. Contrib. Mineral. Petrol. 2018, 173, 66. [Google Scholar] [CrossRef]
- Bruschini, E.; Carli, C.; Buellet, A.-C.; Vincendon, M.; Capaccioni, F.; Ferrari, M.; Vetere, F.; Secchiari, A.; Perugini, D.; Montanini, A. VNIR reflectance spectra of silicate-graphite mixtures: The effect of graphite content and particle size. Icarus 2022, 378, 114950. [Google Scholar] [CrossRef]
- Lyon, R.J.P. Evaluation of Infrared Spectrophotometry for Compositional Analysis of Lunar and Planetary Soils; No. NASA-TN-D1871; National Aeronautics and Space Administration: Washington, DC, USA, 1963. [Google Scholar]
- Salisbury, J.W.; Walter, L.S. Thermal infrared (2.5–13.5 μm) spectroscopic remote sensing of igneous rock types on particulate planetary surfaces. J. Geph. Res. 1989, 94, 9192–9202. [Google Scholar] [CrossRef]
- Cooper, B.L.; Salisbury, J.W.; Killen, R.M.; Potter, A.E. Midinfrared spectral features of rocks and their powders. J. Geophys. Res. 2022, 107, 5017. [Google Scholar] [CrossRef]
- Liu, Y.; Chou, I.-M.; Chen, J.; Wu, N.; Li, W.; Bagas, L.; Ren, M.; Liu, Z.; Mei, S.; Wang, L. Oldhamite: A new link in upper mantle for C–O–S–Ca cycles and an indicator for planetary habitability. Natl. Sci. Rev. 2023, 10, nwad159. [Google Scholar] [CrossRef]
- Carli, C.; Barbaro, A.; Murri, M.; Domeneghetti, M.C.; Langone, A.; Bruschini, E.; Stephant, A.; Alvaro, M.; Stefani, S.; Cuppone, T.; et al. Al Huwaysah 010: The most reduced brachinite, so far. Meteorit. Planet. Sci. 2023, 6, 855–874. [Google Scholar] [CrossRef]
- Tribaudino, M.; Angel, R.J.; Cámara, F.; Nestola, F.; Pasqual, D.; Margiolaki, I. Thermal expansion of plagioclase feldspars. Contrib. Mineral. Petrol. 2010, 160, 899–908. [Google Scholar] [CrossRef]
- D’Amore, M.; Helbert, J.; Maturilli, A.; Varatharajan, I.; Ulmer, B.; Säuberlich, T.; Berlin, R.; Peter, G.; Hiesinger, H.; Martinez, S.; et al. Data Processing of the Mercury Radiometer and Thermal Infrared Imaging Spectrometer (MERTIS) onboard Bepi Colombo. In Infrared Remote Sensing and Instrumentation XXVI; Strojnik, M., Kirk, M.S., Eds.; SPIE: Bellingham, WA, USA, 2018; p. 16. [Google Scholar]


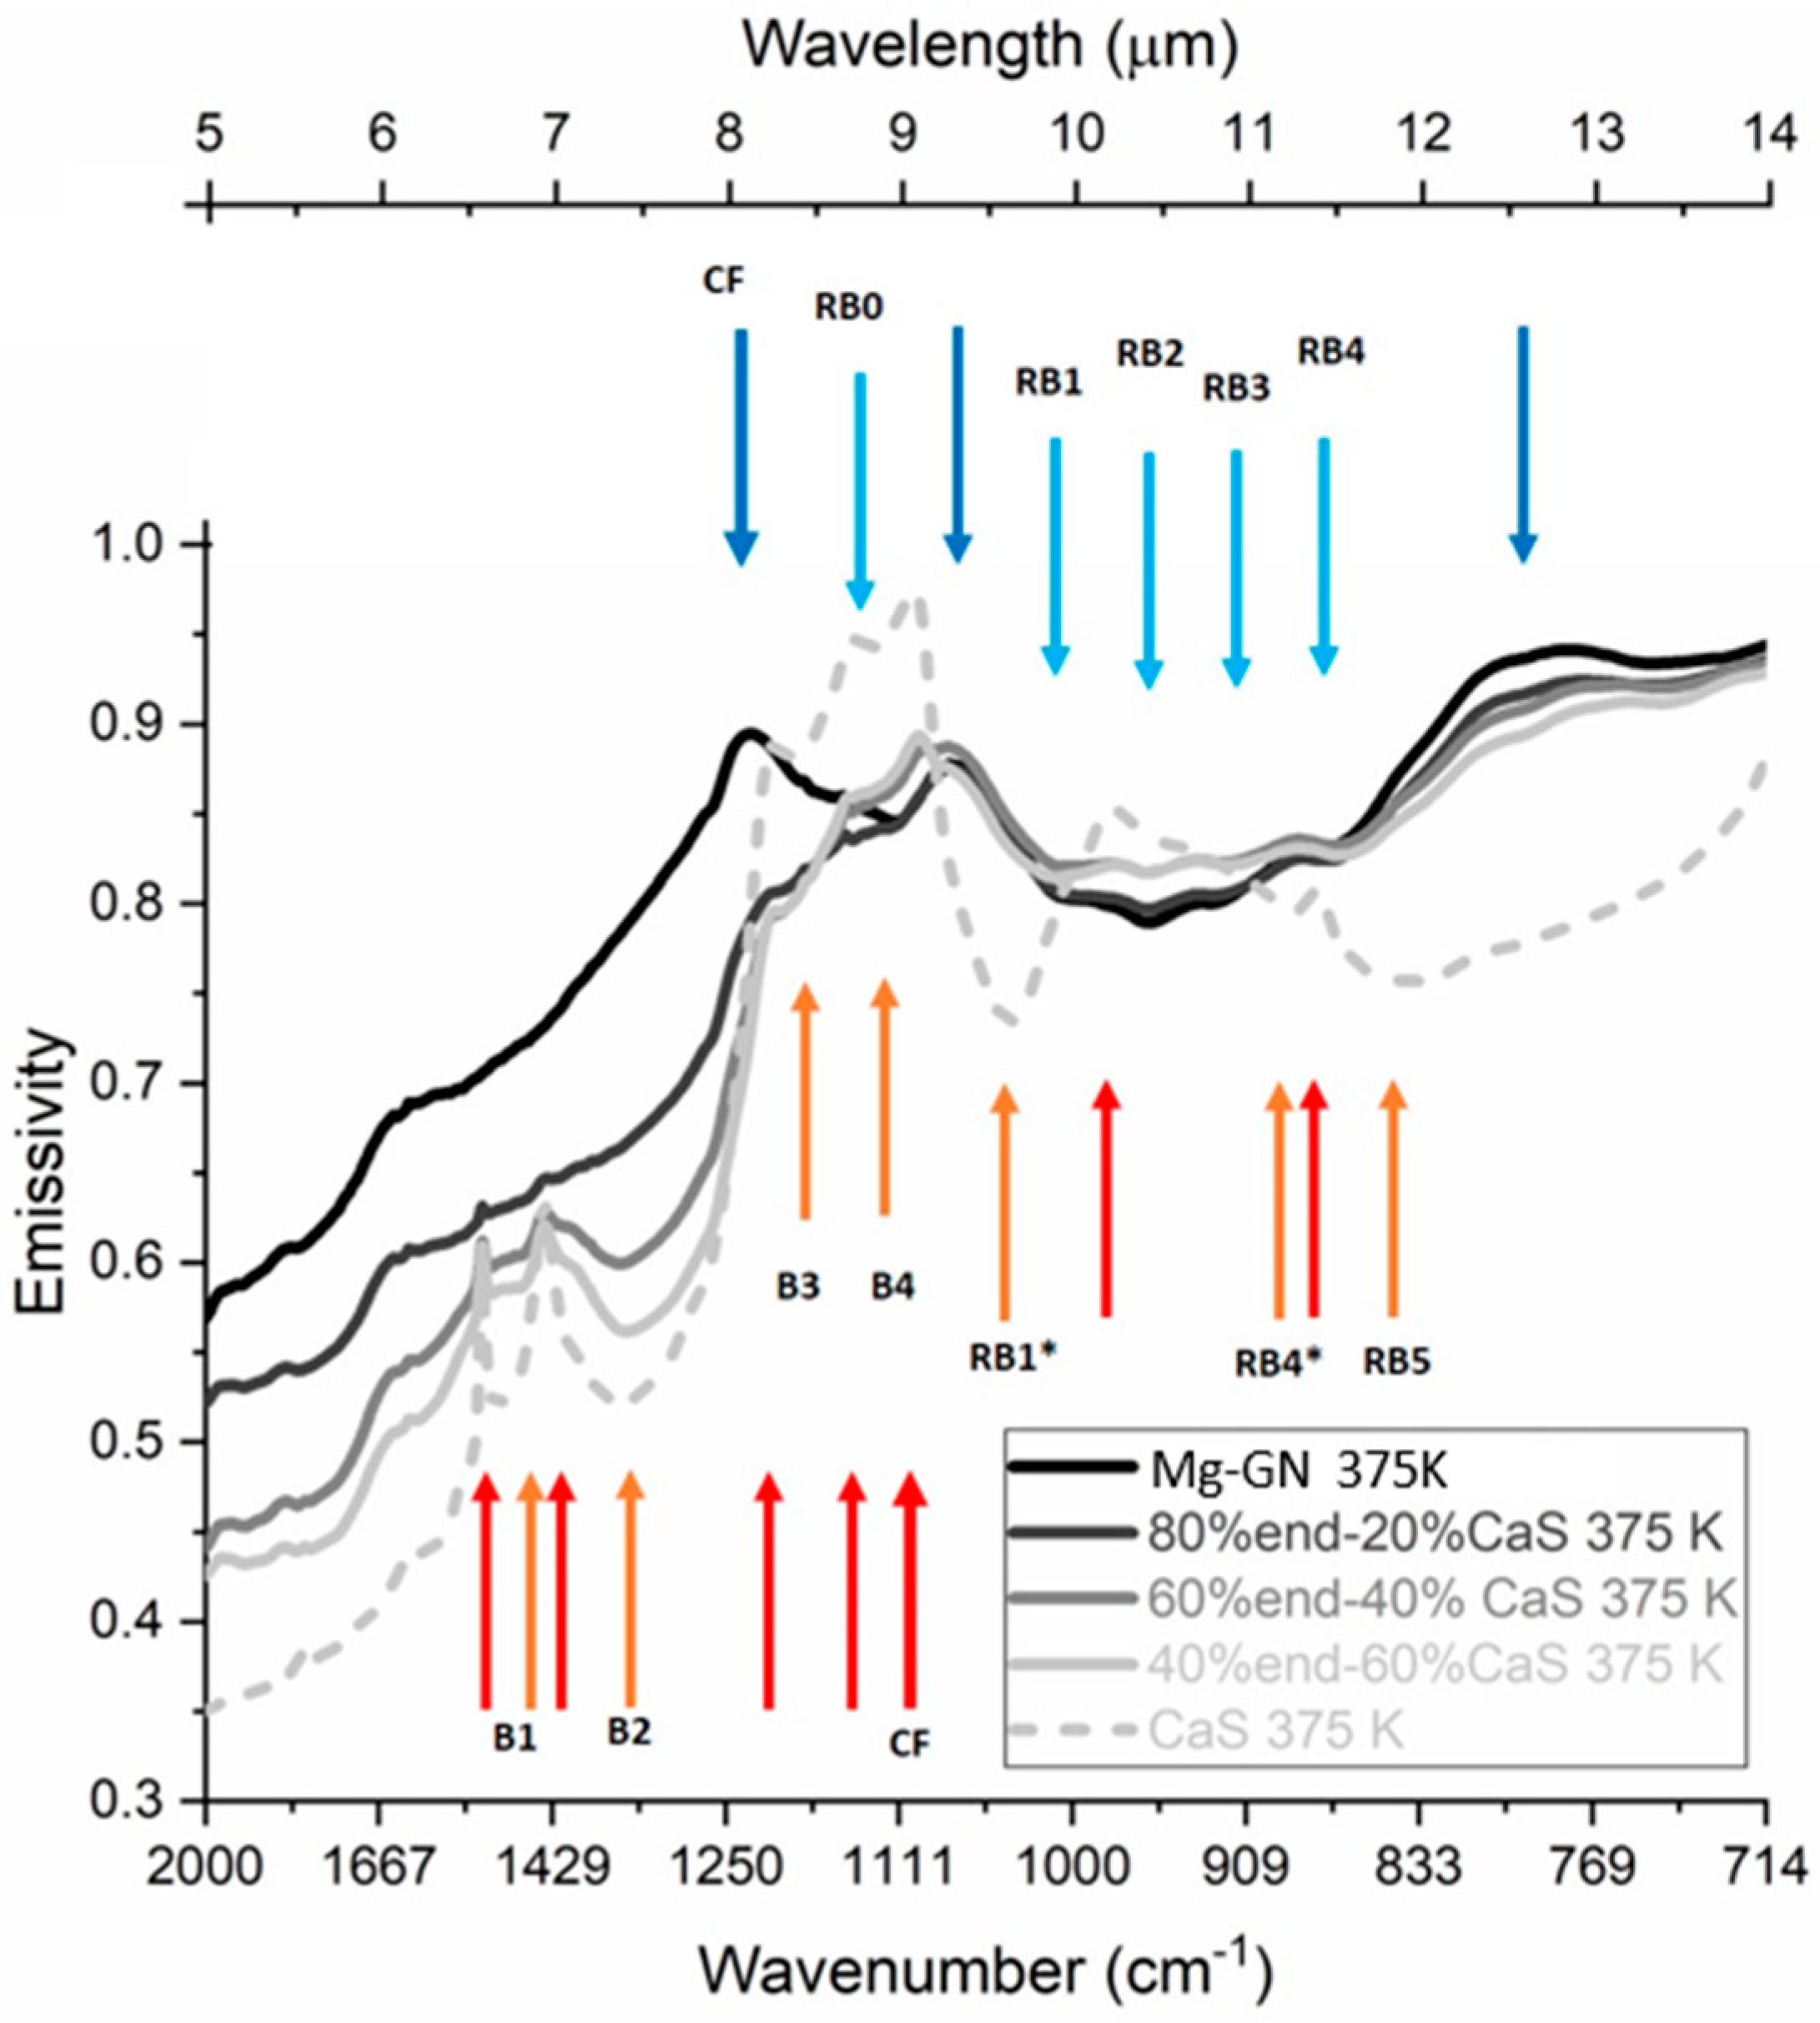
| Sample | CF | RB0 | RB1 | RB2 | RB3 | RB4 | RB1* | RB4* | RB5 | ||
|---|---|---|---|---|---|---|---|---|---|---|---|
| Mg-gabbronorite (Mg-GN) | 1229 | 1113 | 1001 | 959 | 928 | 876 | -- | -- | -- | ||
| 20% CaS | 1076 | -- | 1001 | 959 | 924 | 872 | -- | -- | -- | ||
| 40% CaS | 1078 | -- | 1005 | 959 | 920 | 870 | -- | -- | -- | ||
| 60% CaS | 1097 | -- | 1009 | 959 | 916 | 868 | -- | -- | -- | ||
| CaS | 1099 | -- | -- | -- | -- | -- | 1038 | 885 | 833 | ||
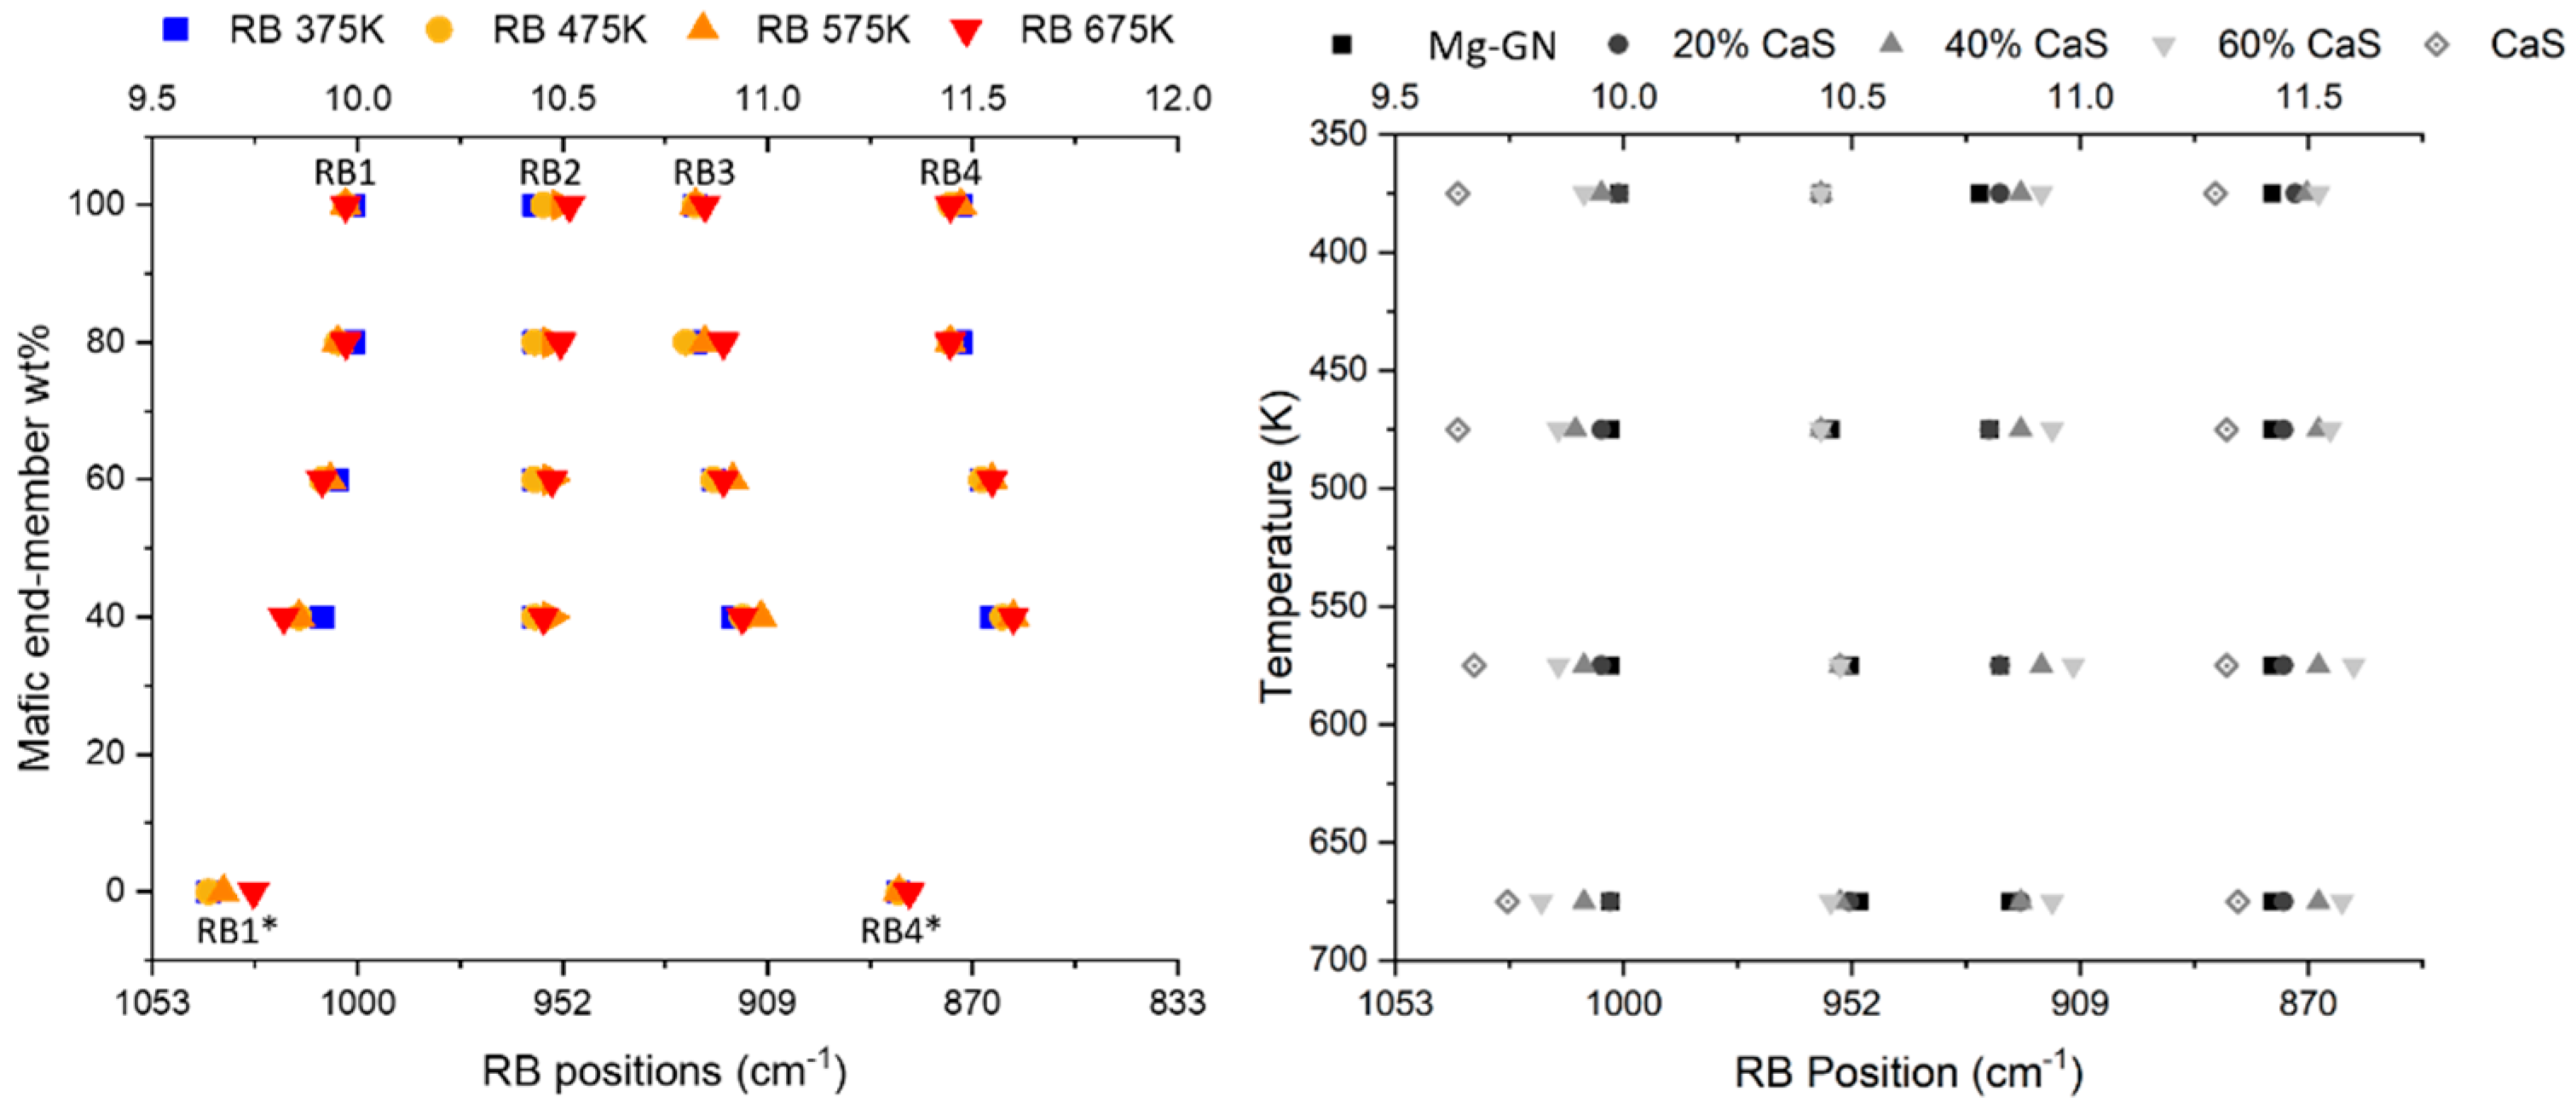
| Sample | Temperature (K) | CF | RB0 | RB1 | RB2 | RB3 | RB4 | RB1* | RB4* | RB5 | |
|---|---|---|---|---|---|---|---|---|---|---|---|
| Mg-gabbronorite (Mg-GN) | 475 | 1230 | 1111 | 1003 | 957 | 926 | 876 | -- | -- | -- | |
| 575 | 1230 | 1107 | 1003 | 953 | 924 | 876 | -- | -- | -- | ||
| 675 | 1230 | 1105 | 1003 | 951 | 922 | 876 | -- | -- | -- | ||
| 20% CaS | 475 | 1074 | -- | 1005 | 959 | 926 | 874 | -- | -- | -- | |
| 575 | 1074 | -- | 1005 | 955 | 924 | 874 | -- | -- | -- | ||
| 675 | 1076 | -- | 1003 | 953 | 920 | 874 | -- | -- | -- | ||
| 40% CaS | 475 | 1092 | -- | 1011 | 959 | 920 | 868 | -- | -- | -- | |
| 575 | 1090 | -- | 1009 | 955 | 916 | 868 | -- | -- | -- | ||
| 675 | 1090 | -- | 1009 | 955 | 920 | 868 | -- | -- | -- | ||
| 60% CaS | 475 | 1095 | -- | 1014 | 959 | 914 | 866 | -- | -- | -- | |
| 575 | 1094 | -- | 1014 | 955 | 910 | 862 | -- | -- | -- | ||
| 675 | 1092 | -- | 1018 | 957 | 914 | 864 | -- | -- | -- | ||
| CaS | 475 | 1099 | -- | -- | -- | -- | -- | 1038 | 883 | 820 | |
| 575 | 1097 | -- | -- | -- | -- | -- | 1034 | 883 | 794 | ||
| 675 | 1085 | -- | -- | -- | -- | -- | 1026 | 881 | 804 | ||
| Sample | Temperature (K) | CF | RB1 | RB2 | RB3 | RB4 | RB1* | RB4* | SCRB1 | SCRB2 | SCRB3 | SCRB4 | SCRB1* | SCRB4* |
|---|---|---|---|---|---|---|---|---|---|---|---|---|---|---|
| Mg-gabbronorite (Mg-GN) | 375 | 0.895 | 0.803 | 0.789 | 0.800 | 0.830 | -- | -- | 0.092 | 0.105 | 0.094 | 0.065 | -- | -- |
| 475 | 0.891 | 0.781 | 0.771 | 0.783 | 0.813 | -- | -- | 0.110 | 0.120 | 0.107 | 0.078 | -- | -- | |
| 575 | 0.889 | 0.763 | 0.750 | 0.759 | 0.786 | -- | -- | 0.126 | 0.139 | 0.130 | 0.103 | -- | -- | |
| 675 | 0.893 | 0.763 | 0.753 | 0.761 | 0.789 | -- | -- | 0.130 | 0.140 | 0.131 | 0.104 | -- | -- | |
| 20% CaS | 375 | 0.875 | 0.805 | 0.797 | 0.805 | 0.824 | -- | -- | 0.071 | 0.078 | 0.071 | 0.051 | -- | -- |
| 475 | 0.843 | 0.794 | 0.794 | 0.806 | 0.827 | -- | -- | 0.049 | 0.049 | 0.036 | 0.016 | -- | -- | |
| 575 | 0.827 | 0.781 | 0.780 | 0.790 | 0.808 | -- | -- | 0.046 | 0.046 | 0.037 | 0.018 | -- | -- | |
| 675 | 0.815 | 0.764 | 0.762 | 0.770 | 0.789 | -- | -- | 0.051 | 0.053 | 0.045 | 0.026 | -- | -- | |
| 40% CaS | 375 | 0.887 | 0.821 | 0.817 | 0.823 | 0.832 | -- | -- | 0.067 | 0.070 | 0.064 | 0.055 | -- | -- |
| 475 | 0.837 | 0.783 | 0.792 | 0.802 | 0.809 | -- | -- | 0.054 | 0.045 | 0.035 | 0.028 | -- | -- | |
| 575 | 0.874 | 0.809 | 0.814 | 0.818 | 0.819 | -- | -- | 0.065 | 0.060 | 0.057 | 0.055 | -- | -- | |
| 675 | 0.850 | 0.790 | 0.801 | 0.808 | 0.814 | -- | -- | 0.060 | 0.050 | 0.043 | 0.037 | -- | -- | |
| 60% CaS | 375 | 0.894 | 0.814 | 0.817 | 0.822 | 0.827 | -- | -- | 0.079 | 0.077 | 0.072 | 0.067 | -- | -- |
| 475 | 0.868 | 0.788 | 0.806 | 0.813 | 0.813 | -- | -- | 0.080 | 0.063 | 0.055 | 0.056 | -- | -- | |
| 575 | 0.869 | 0.777 | 0.794 | 0.794 | 0.788 | -- | -- | 0.091 | 0.075 | 0.074 | 0.081 | -- | -- | |
| 675 | 0.822 | 0.751 | 0.776 | 0.783 | 0.782 | -- | -- | 0.071 | 0.046 | 0.039 | 0.040 | -- | -- | |
| CaS | 375 | 0.975 | -- | -- | -- | -- | 0.734 | 0.796 | -- | -- | -- | -- | 0.241 | 0.179 |
| 475 | 0.974 | -- | -- | -- | -- | 0.685 | 0.764 | -- | -- | -- | -- | 0.289 | 0.210 | |
| 575 | 0.965 | -- | -- | -- | -- | 0.658 | 0.722 | -- | -- | -- | -- | 0.307 | 0.243 | |
| 675 | 0.978 | -- | -- | -- | -- | 0.658 | 0.690 | -- | -- | -- | -- | 0.320 | 0.288 |
| Max B1 (cm−1) | Min B1 (cm−1) | Max B2 (cm−1) | Min B2 (cm−1) | Max B3 (cm−1) | Min B3 (cm−1) | Max B4 (cm−1) | Min B4 (cm−1) | ||
|---|---|---|---|---|---|---|---|---|---|
| 20 %CaS | 375 | 1516 | 1508 | 1435 | 1427 | 1209 | 1200 | 1151 | 1119 |
| 475 | 1514 | 1508 | 1431 | 1421 | 1205 | 1196 | 1136 | 1115 | |
| 575 | 1508 | 1502 | 1431 | -- | 1203 | 1192 | 1126 | 1121 | |
| 675 | 1506 | 1502 | 1427 | -- | 1200 | 1194 | 1130 | 1117 | |
| 40 %CaS | 375 | 1516 | 1504 | 1437 | 1354 | 1209 | 1203 | 1149 | 1121 |
| 475 | 1514 | 1453 | 1435 | 1354 | 1203 | 1196 | 1136 | 1117 | |
| 575 | 1510 | 1493 | 1435 | 1356 | 1198 | 1194 | 1132 | 1117 | |
| 675 | 1508 | 1501 | 1431 | 1379 | 1202 | 1192 | 1130 | 1115 | |
| 60 %CaS | 375 | 1516 | 1504 | 1437 | 1346 | 1207 | 1203 | 1148 | 1136 |
| 475 | 1514 | 1497 | 1435 | 1342 | 1202 | 1198 | 1136 | 1128 | |
| 575 | 1510 | 1483 | 1435 | 1350 | 1200 | 1196 | 1134 | 1124 | |
| 675 | 1510 | 1493 | 1433 | 1358 | 1200 | 1194 | 1132 | 1122 | |
| CaS | 375 | 1516 | 1499 | 1439 | 1354 | 1209 | 1196 | 1144 | 1128 |
| 475 | 1514 | 1489 | 1437 | 1342 | 1205 | 1194 | 1140 | 1124 | |
| 575 | 1512 | 1483 | 1435 | 1340 | 1202 | 1190 | 1136 | 1121 | |
| 675 | 1508 | 1481 | 1431 | 1348 | 1200 | 1178 | 1134 | 1121 |
Disclaimer/Publisher’s Note: The statements, opinions and data contained in all publications are solely those of the individual author(s) and contributor(s) and not of MDPI and/or the editor(s). MDPI and/or the editor(s) disclaim responsibility for any injury to people or property resulting from any ideas, methods, instructions or products referred to in the content. |
© 2024 by the authors. Licensee MDPI, Basel, Switzerland. This article is an open access article distributed under the terms and conditions of the Creative Commons Attribution (CC BY) license (https://creativecommons.org/licenses/by/4.0/).
Share and Cite
Carli, C.; Ferrari, S.; Maturilli, A.; Serventi, G.; Sgavetti, M.; Secchiari, A.; Montanini, A.; Helbert, J. Laboratory Emissivity Spectra of Sulphide-Bearing Samples, New Constraints for the Surface of Mercury: Oldhamite in Mafic Aggregates. Minerals 2024, 14, 62. https://doi.org/10.3390/min14010062
Carli C, Ferrari S, Maturilli A, Serventi G, Sgavetti M, Secchiari A, Montanini A, Helbert J. Laboratory Emissivity Spectra of Sulphide-Bearing Samples, New Constraints for the Surface of Mercury: Oldhamite in Mafic Aggregates. Minerals. 2024; 14(1):62. https://doi.org/10.3390/min14010062
Chicago/Turabian StyleCarli, Cristian, Sabrina Ferrari, Alessandro Maturilli, Giovanna Serventi, Maria Sgavetti, Arianna Secchiari, Alessandra Montanini, and Jörn Helbert. 2024. "Laboratory Emissivity Spectra of Sulphide-Bearing Samples, New Constraints for the Surface of Mercury: Oldhamite in Mafic Aggregates" Minerals 14, no. 1: 62. https://doi.org/10.3390/min14010062