Article

Extraction of Rare Earth and CaF2 from Rare Earth Calcium Thermal Reduction Slag by Using CaO Roasting–Acid Leaching Method

1
Qiandong Rare Earth Group Co., Ltd., Ganzhou 341000, China
2
School of Resources and Environment Engineering, Jiangxi University of Science and Technology, Ganzhou 341000, China
*
Author to whom correspondence should be addressed.
Minerals 2024, 14(10), 1001; https://doi.org/10.3390/min14101001
Submission received: 9 September 2024 / Revised: 29 September 2024 / Accepted: 29 September 2024 / Published: 30 September 2024
(This article belongs to the Special Issue Advances in Pyrometallurgy of Minerals and Ores)

Abstract

:
The rare earth calcium thermal reduction slag (RCS) generated during the production of heavy rare earth metal contains large amounts of rare earth and fluoride compounds. In this study, rare earth elements (REEs) and fluorine in the RCS were recovered by the CaO roasting–hydrochloric acid leaching method. Firstly, the thermodynamic feasibility of converting rare earth fluoride to rare earth oxides through CaO roasting was demonstrated. The influence of roasting conditions and leaching conditions on the leaching rate of the REEs was investigated. Optimal results, a 95.48% leaching rate of the REEs, were obtained under the following conditions: a CaO dosage of 15%, a roasting temperature of 1000 °C, and a roasting duration of 90 min. XRD, SEM, and EDS results revealed that during the calcination process, the REEs present in fluorite (CaF2) in isomorphic form were transformed into acid-soluble rare earth oxides; furthermore, the rare earth metallic in the RCS remained unchanged even after roasting. In the leaching process, rare earth metals and rare earth oxides are efficiently extracted, while CaF2 rarely dissolves. The leaching slag contained 97.31% CaF2 with a F recovery of 96.92%. The kinetics of the rare earth leaching process was analyzed, and the results show that the three-dimensional diffusion control at the phase interface of the kinetic model best fits the process. The calculated apparent activation energy for the leaching rate of REEs is 20.869 kJ/mol. Therefore, efficient comprehensive recovery of rare earth and fluorite from RCS can be achieved by using the CaO roasting–hydrochloric acid leaching method.

1. Introduction

Rare earth metals, prized for their unique physical and chemical properties, are widely used in many industries such as the military, metallurgy, petrochemicals, advanced materials, renewable energy, and aerospace industries [1,2,3,4]. Rare earth metals are predominantly produced through either molten salt electrolysis or calcium thermal reduction methods [5,6,7]. The former is typically employed for the preparation of light rare earth metals, while the latter is tailored for medium and heavy rare earth metals. In the calcium thermal reduction process, fluoride is reduced by calcium metal to rare earth metal under the condition of high temperature and vacuum, and calcium thermal reduction slag (RCS) with calcium fluoride (CaF2) as the main component is produced. For every ton of rare earth metals produced, approximately 2 tons of RCS are generated. RCS contains a concentration of rare earth elements (REEs) between 2% and 13%, which can exist in various states, including metallic, fluoride, and oxide forms [8]. However, the current dearth of effective recycling processes has led to the prevalent practice of RCS storage among companies as a stopgap measure. Amidst the rapid exhaustion of rare earth resources and the growing imperative for environmental stewardship, it is more critical to innovate strategies for the comprehensive utilization of RCS.
Several studies on extracting REEs from RCS have been reported in recent years. Chen et al. proposed a direct acid leaching method to extract REEs from RCS, which achieved only a 65% efficiency due to the insoluble properties of rare earth fluoride in acid [9]. This indicates that a crucial step for efficient REE leaching is the conversion of rare earth fluoride to the more soluble rare earth oxide. To address this, a process of extracting REEs by sodium roasting, fluoride removal by washing, and acid leaching was developed to alter the phase of REEs in RCS. Xia et al. demonstrated that treating RCS with a NaOH roasting–acid leaching method could achieve an impressive REE extraction rate of 92.30% [10]. Liang et al. investigated the effect of additive type (i.e., NaOH, Na2CO3, and Na2SiO3) on the leach of REEs from RCS, and the REEs’ leaching rates were found to be 92.30%, 94.09%, and 99.05%, respectively, under optimal conditions [11,12].
Although the leaching rate of REEs from RCS can be effectively improved by the sodium roasting method, considerable fluoride-containing wastewater was generated after fluoride removal by washing, presenting substantial environmental pollution challenges [13]. Moreover, the mass ratio of additives to RCS is typically around 1:1, which significantly exceeds the theoretical ratio. This overabundance not only increases raw material costs but also complicates the subsequent separation and extraction of the REEs’ leaching solution. Consequently, there is an urgent need to develop cost-effective and environmentally friendly technologies for the comprehensive utilization of RCS. In this study, a CaO roasting–hydrochloric acid leaching approach is proposed for the extraction of REEs and CaF2 from RCS. Thermodynamic calculations were conducted to assess the feasibility of the proposed experimental method. The effects of roasting conditions and leaching conditions on rare earth leaching were studied. This study aims to offer insights into the effective utilization of RCS, considering the dual objectives of minimizing costs and reducing the environmental impact.

2. Materials and Methods

2.1. Materials

The RCS used in this study was obtained from a rare earth smelting plant located in Ganzhou, Jiangxi, China. The chemical analysis results are shown in Table 1 and Table 2. The RCS contains 2.33% rare earth oxides, 36.74% F, 51.01% Ca, 0.085% Al, and 0.021% Fe. The partitioning of REEs in the RCS was determined, with the following compositions: 94.20% Tb4O7, 2.42% Nd2O3, 0.70% Y2O3, 0.63% Dy2O3, and 0.42% Tm2O3. The X-ray diffraction (XRD) patterns in Figure 1 reveal that the main crystalline phases present in the RCS were CaF2, calcium hydroxide (Ca (OH)2), and calcite (CaCO3).
All of the chemicals were purchased from Xilong Scientific Co., Ltd. (Guangdong, China), and they were of analytical grade. Deionized water was used throughout this study.
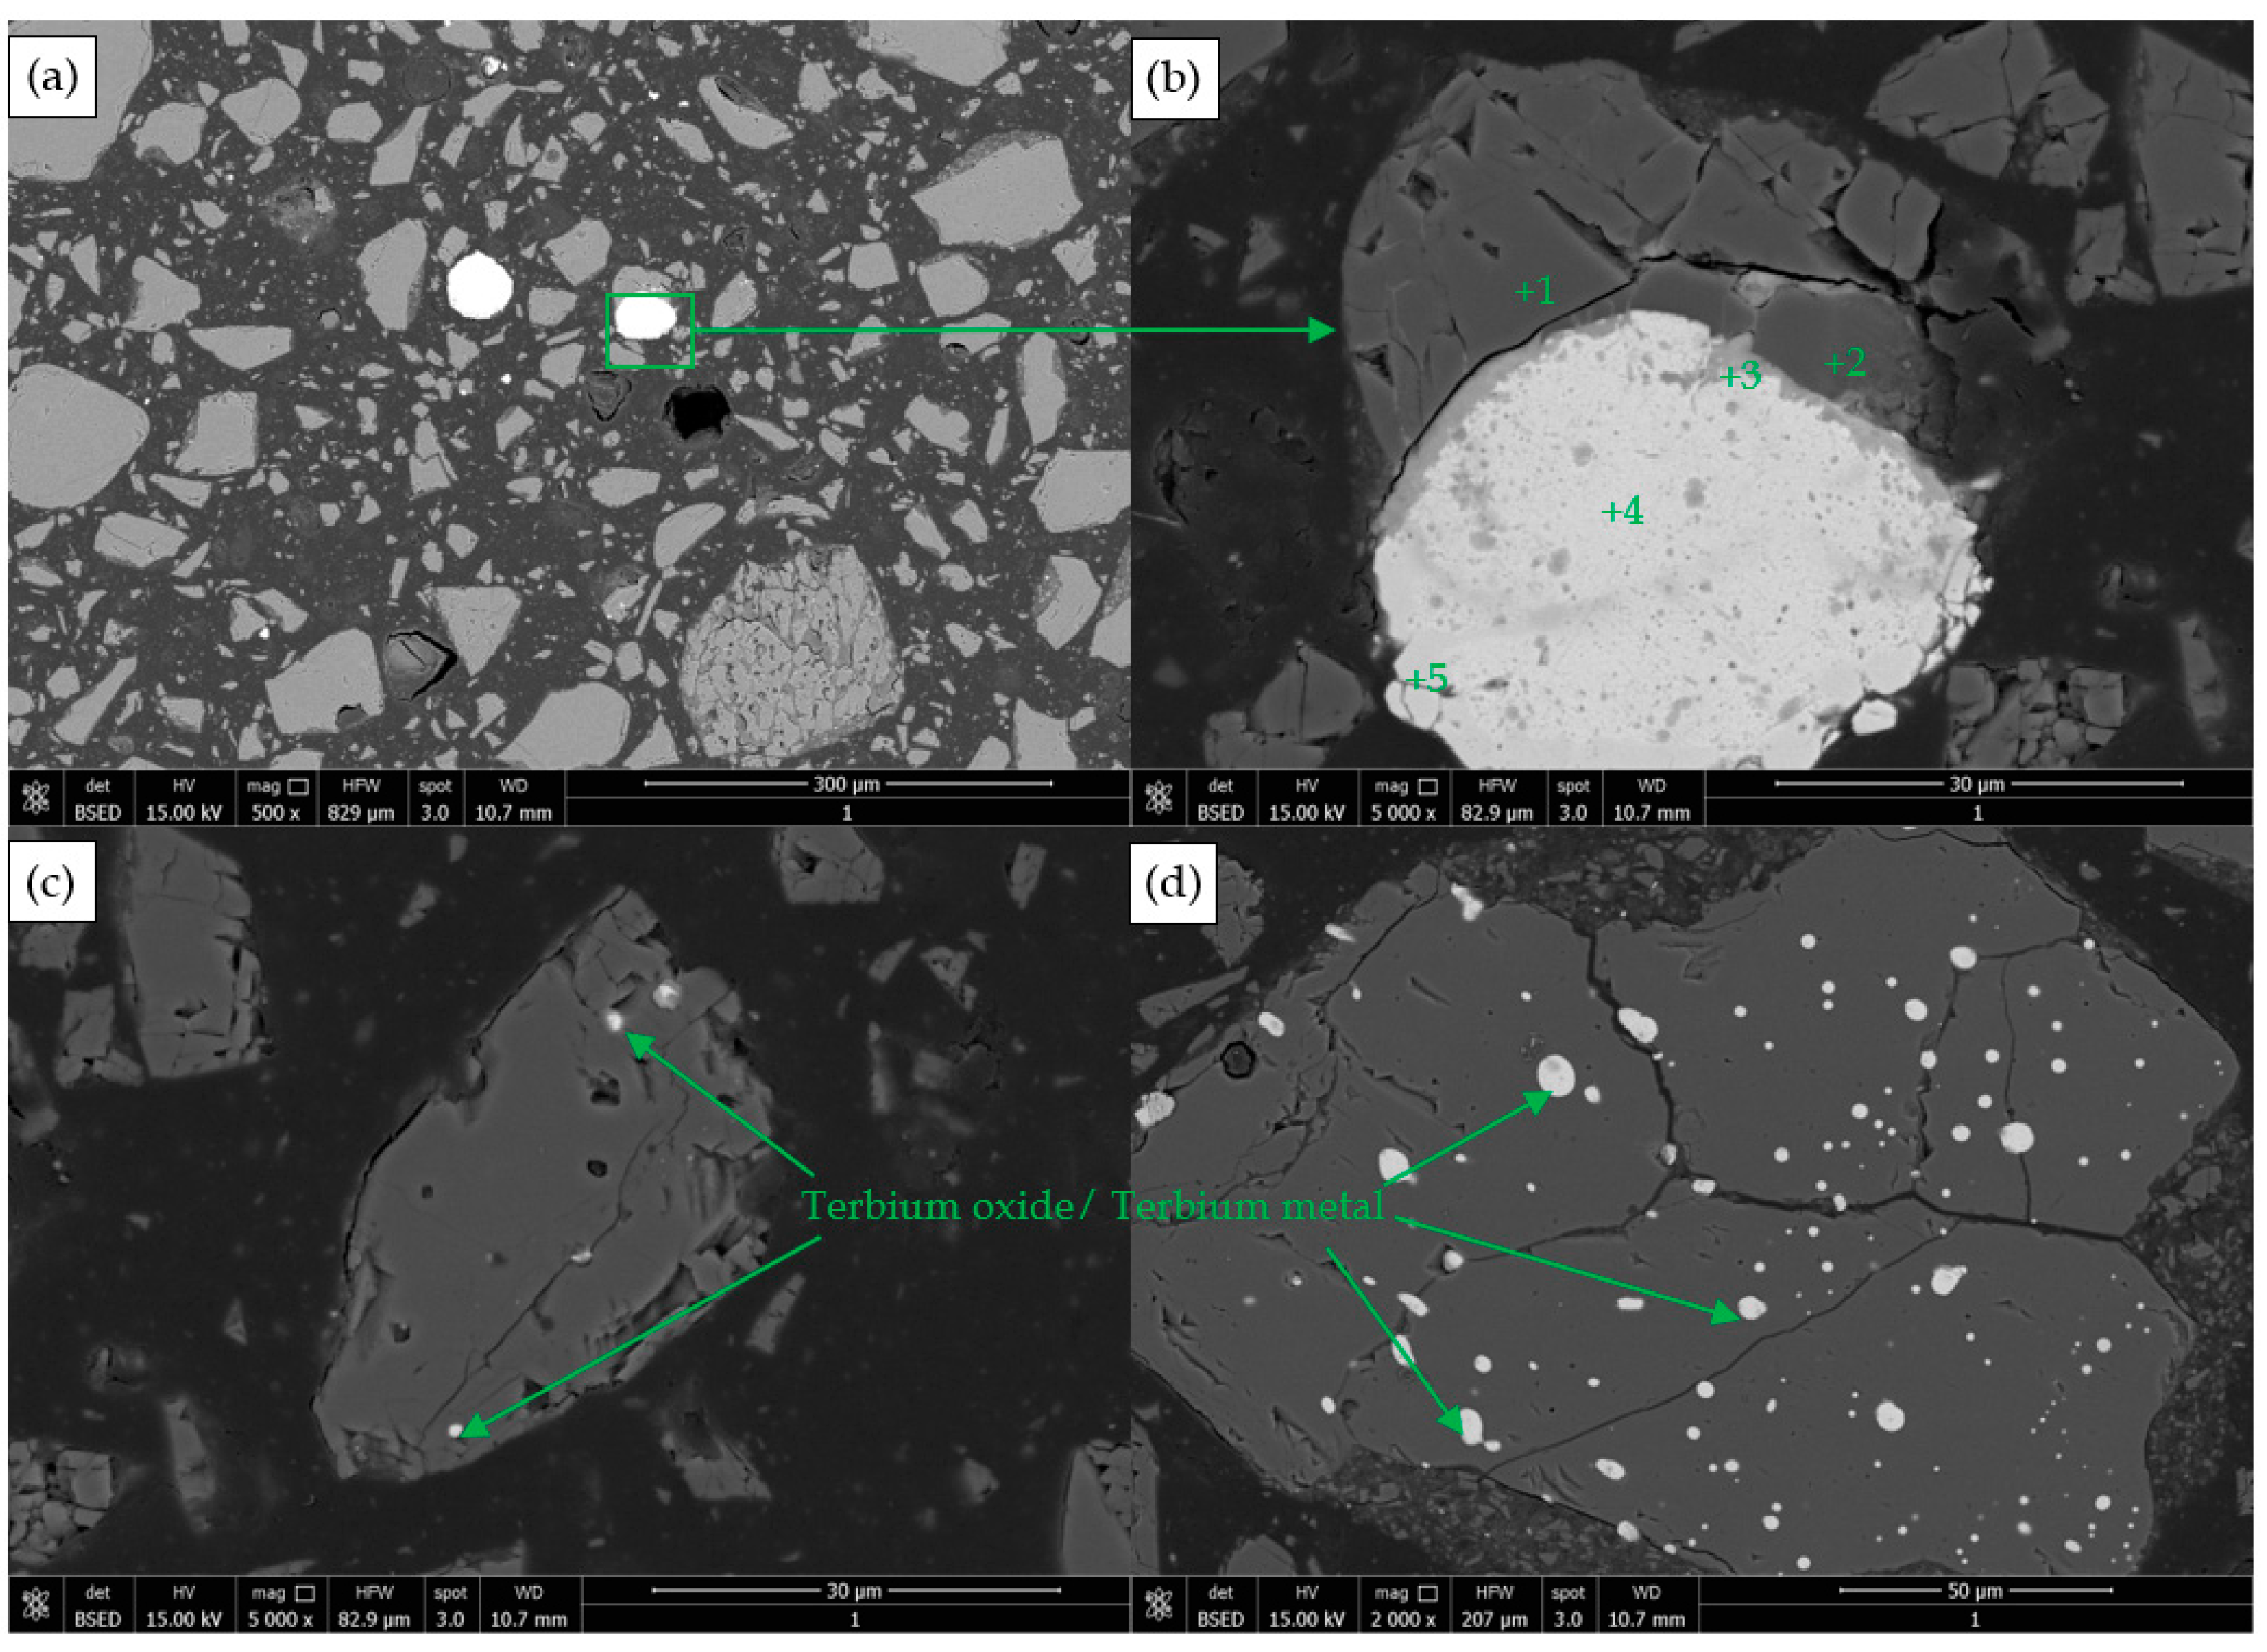
The scanning electron microscopy (SEM) and energy dispersive spectrometry (EDS) analyses of the RCS are shown in Figure 2 and Table 3, respectively. The expressions labeled with +1, +2, +3, +4, and +5 in Figure 2 represent the specific locations and corresponding numbers for the EDS point analyses. Observations reveal that REEs predominantly occur in the RCS as metallic particles and oxides, with a significant portion present in the form of isomorphic substitutions within CaF2. While some rare earth metal particles are approximately 30 μm in size, the majority are micron-sized and are intimately encapsulated by CaF2. This microfine fraction of rare earth metals poses a challenge for physical separation and leaching processes. Additionally, the isomorphic presence of REEs within CaF2 makes them inherently resistant to direct leaching by acids [14].

2.2. Methods

In the roasting experiment, 40 g of the RCS was blended with CaO at weight percentages ranging from 5% to 25% relative to the RCS mass. The mixture was prepared by evenly combining the RCS and CaO, and then transferring it into a corundum crucible with a lid. The crucible was introduced into a muffle furnace(KSL-1400X, Hefei Kejing Materials Technology Co., Ltd., Hefei, China) preheated to a predetermined temperature. Once the set temperature was reached, the crucible remained in the furnace for a specified duration. Post-heating, the crucible was extracted and allowed to cool to room temperature in a controlled environment. The roasted product was subsequently ground, sieved through a 0.074 mm mesh for homogeneity, and stored in sealed containers for subsequent leaching experiments.
During the leaching phase, temperature control was meticulously maintained using a water bath. Once the bath reached the predetermined temperature, hydrochloric acid was added to a 500 cm3 beaker in accordance with the specified solid–liquid ratio. The beaker containing the acid was then immersed in the water bath for a designated period to ensure temperature equilibrium. The roasted product was then incorporated into the beaker, and the resulting slurry was agitated using a mechanical mixer at 400 revolutions per minute (rpm). After a fixed leaching duration, the mixture was subjected to vacuum filtration to separate the leaching solution from the residue. The content of REEs in the leaching solution was determined by EDTA titrimetry [15], and the leaching rate was calculated. The experimental data of each group were measured three times and then averaged.
The typical samples were characterized by XRD (Ulitima Ⅳ, Rigaku Co., Tokyo, Japan) and SEM-EDS (MLA650F, FEI, Hillsboro, OR, USA). The SEM samples required a cold setting, polishing, and gold spraying.

3. Results and Discussion

3.1. Thermodynamics of Roasting

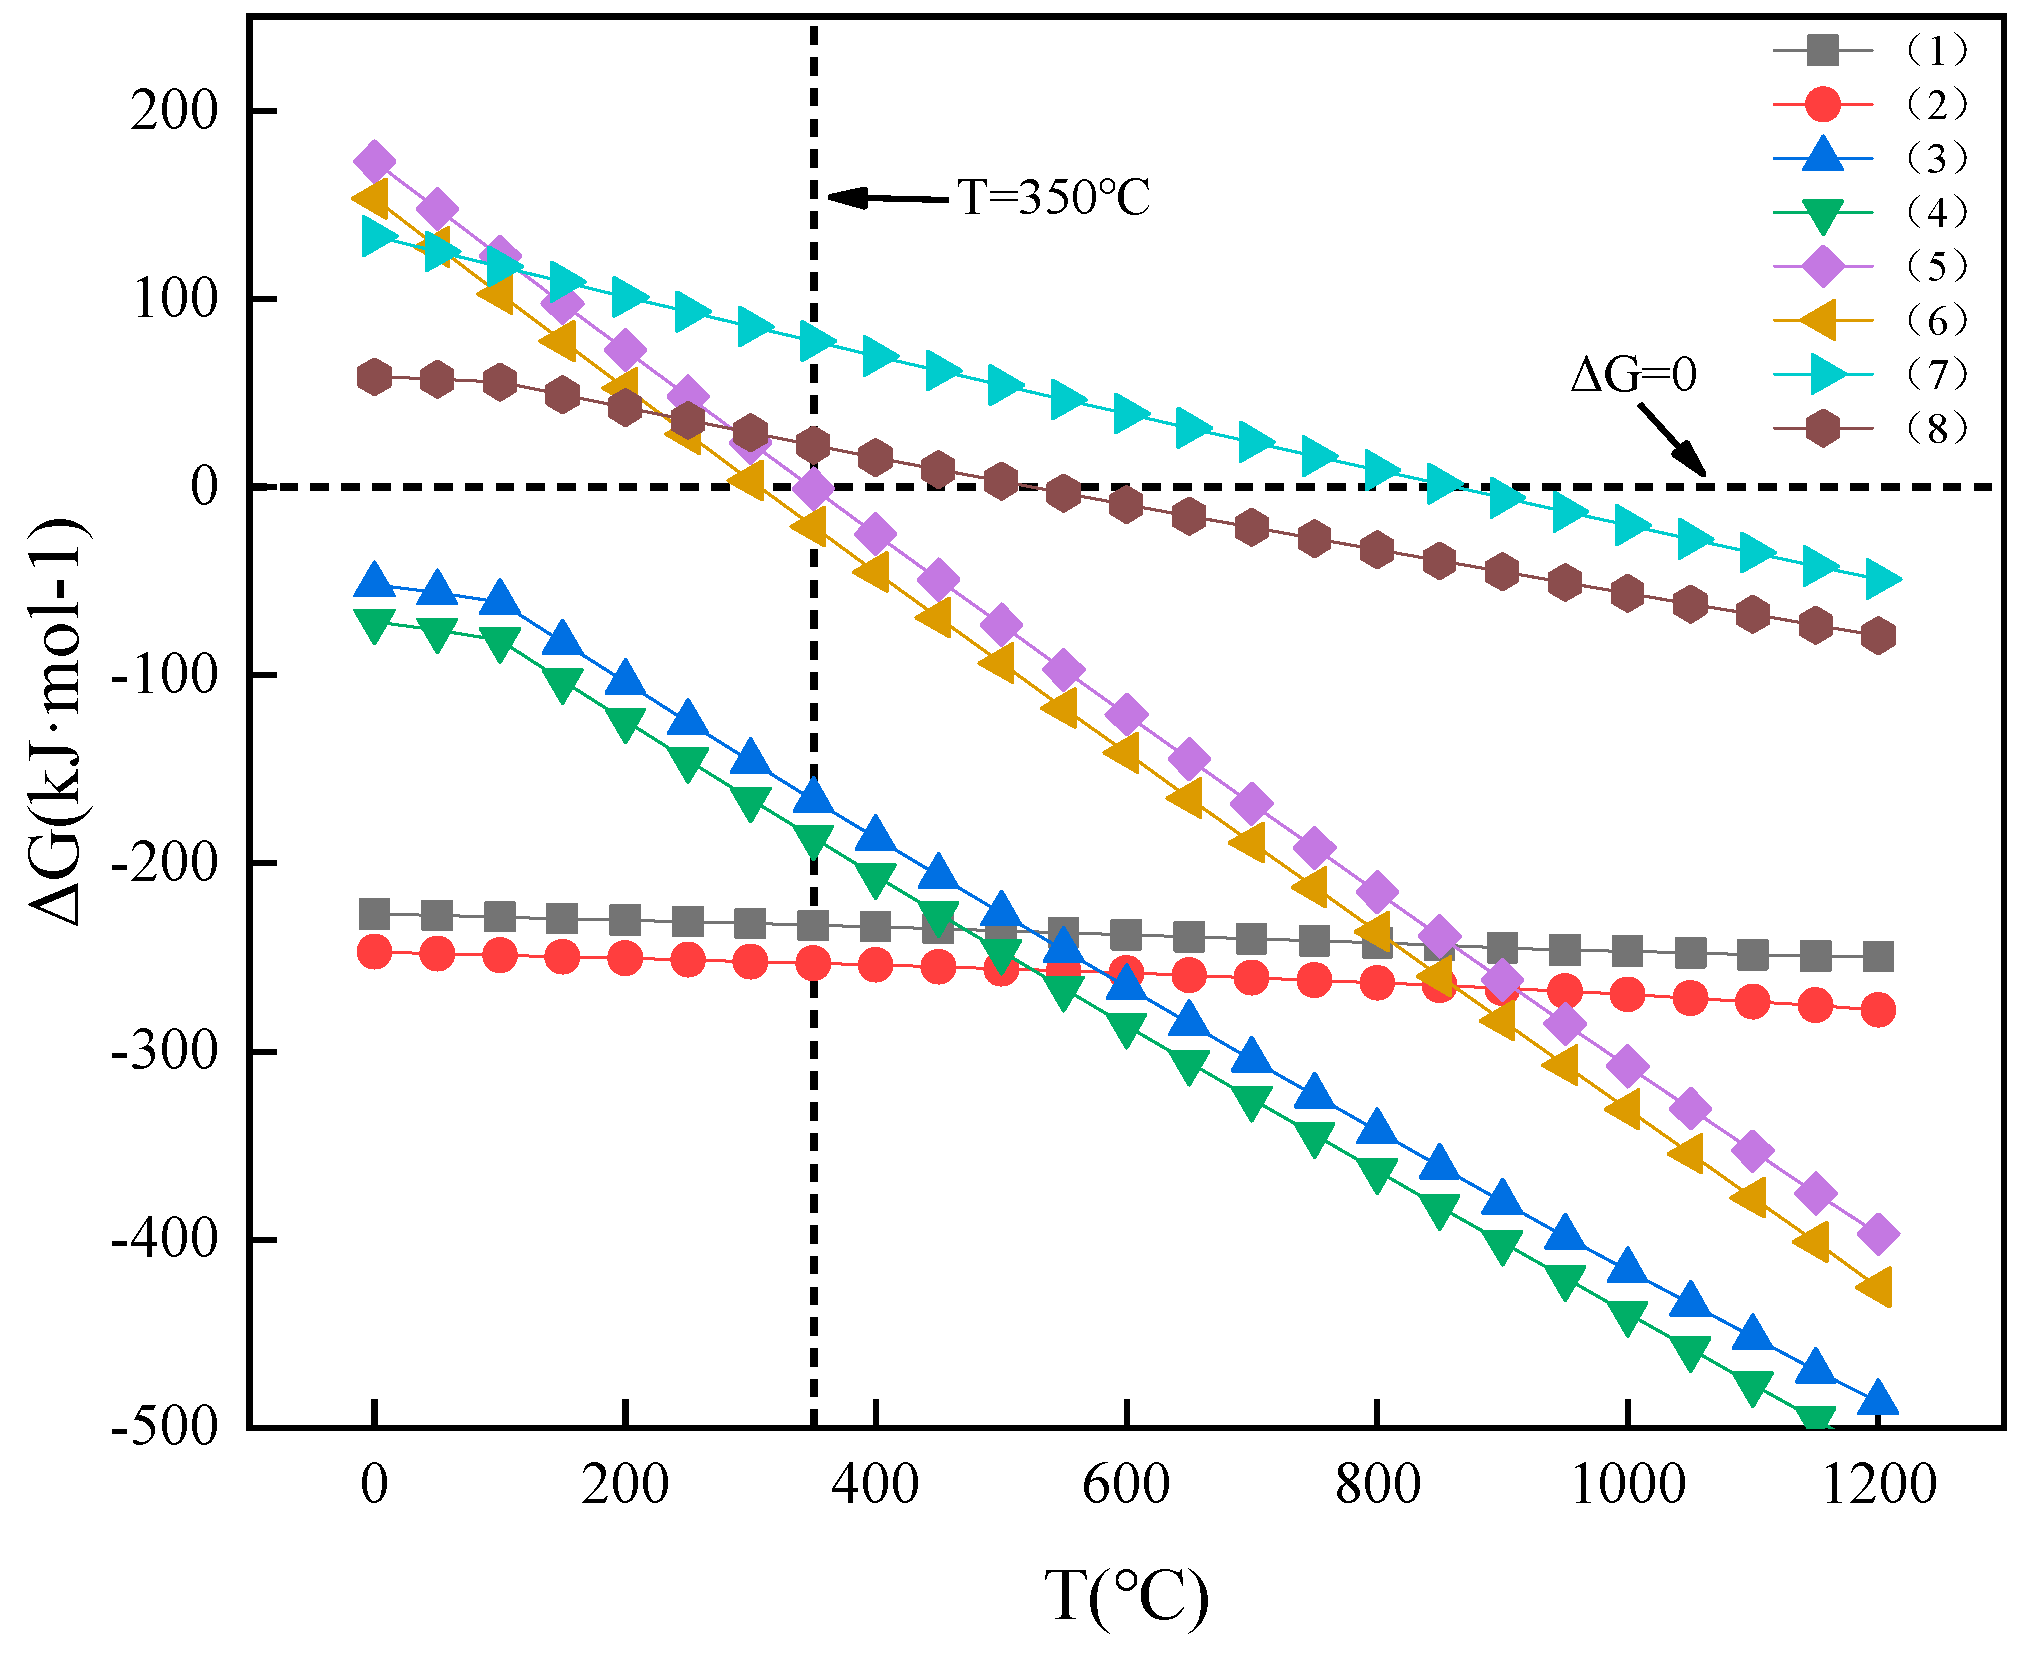
The chemical reactions that may occur during the calcification roasting of RCS are shown in Table 4 [16,17], and the thermodynamic feasibility of chemical reactions was studied. The calculated results using FactSage 8.3 (GTT-Technologies, Aachen, Germany) are shown in Figure 3 and Table 4 [18,19].
Figure 3 shows the ΔG for the potential reactions. Within the temperature range of 0 °C to 1200 °C, the ΔG for Equation (1) is negative and becomes more negative with rising temperature. This indicates that the reaction between TbF3 and CaO is thermodynamically favorable and is further promoted by increased temperature. Equations (2)–(4) exhibit a similar trend, suggesting that these reactions are also influenced by temperature in a positive manner. The ΔG of the reaction in Equations (5) and (6) decreases with the increase in temperature and becomes negative when the temperature is above 350 °C and 300 °C, respectively. These results reveal that the conversion of rare earth fluoride to rare earth oxide by these calcium-containing compounds can occur thermodynamically at temperatures above 350 °C. Furthermore, the ΔG of Equations (7) and (8) becomes negative at 860 °C and 500 °C, respectively, indicating that CaCO3 and Ca(OH)2 in the RCS can be decomposed into CaO and then react with rare earth fluoride. Rare earth fluoride can be converted to rare earth oxide by CaCO3 and Ca(OH)2 which are present in the RCS directly or indirectly during roasting, which is conducive to reducing the amount of additives.

3.2. Effect of Roasting Conditions on Leaching Rate of REEs

The impact of roasting conditions on the leaching rate of REEs was investigated in this study, conducting experiments under a standardized leaching regimen of 90 min in duration, a temperature of 40 °C, an acid concentration of 4 mol/L, and a liquid–solid ratio of 15:1 (cm3/g).

3.2.1. Effect of CaO Dosage

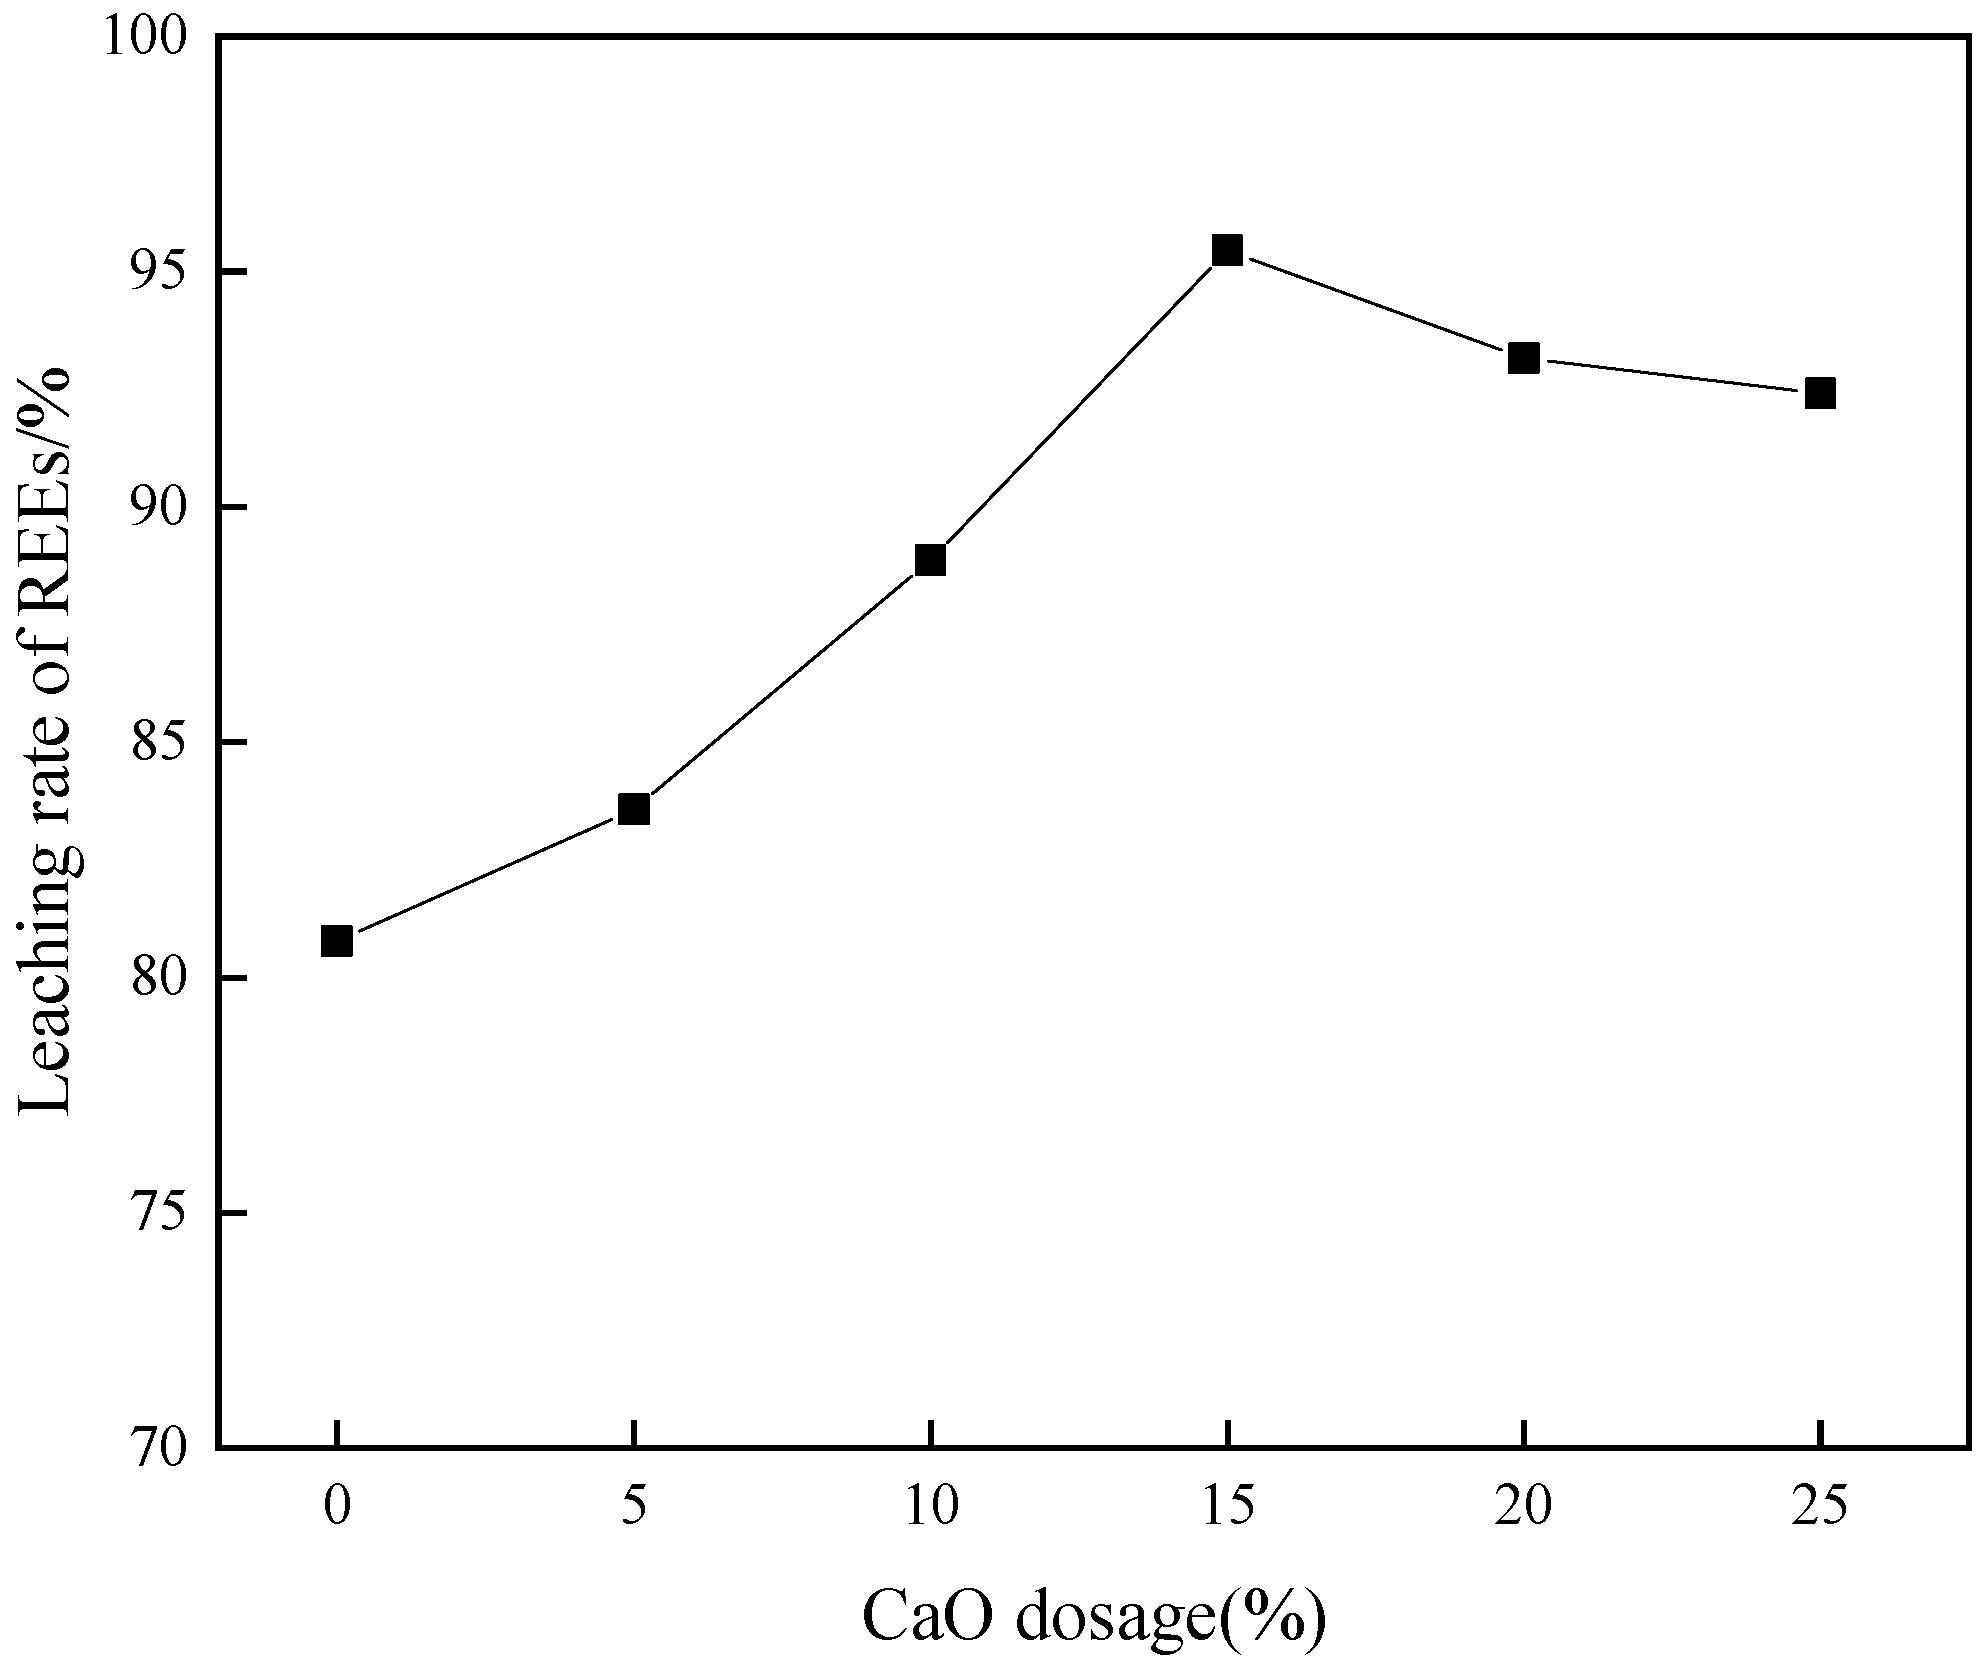
The influence of the CaO dosage (i.e., 5%, 10%, 15%, 20%, and 25%) on the leaching rate of REEs was evaluated under the conditions of a roasting temperature of 1000 °C and a roasting time of 90 min. The results are presented in Figure 4.
As shown in Figure 4, the enhancement of the CaO dosage from 0% to 15% is associated with an increase in the leaching rate of REEs, reaching from 80.77% to 95.45%. However, the leaching rate of REEs decreased with the further increase in the CaO dosage to 20% and 25%. The rare earth fluoride cannot be completely transformed to rare earth oxide with an insufficient CaO dosage, resulting in a low rare earth leaching rate. Increasing the CaO dosage could enhance the leaching of REEs. However, excessive CaO will consume hydrochloric acid, resulting in a decrease in the leaching rate. Thus, the optimal dosage for CaO was determined to be 15%.

3.2.2. Effect of Roasting Temperature

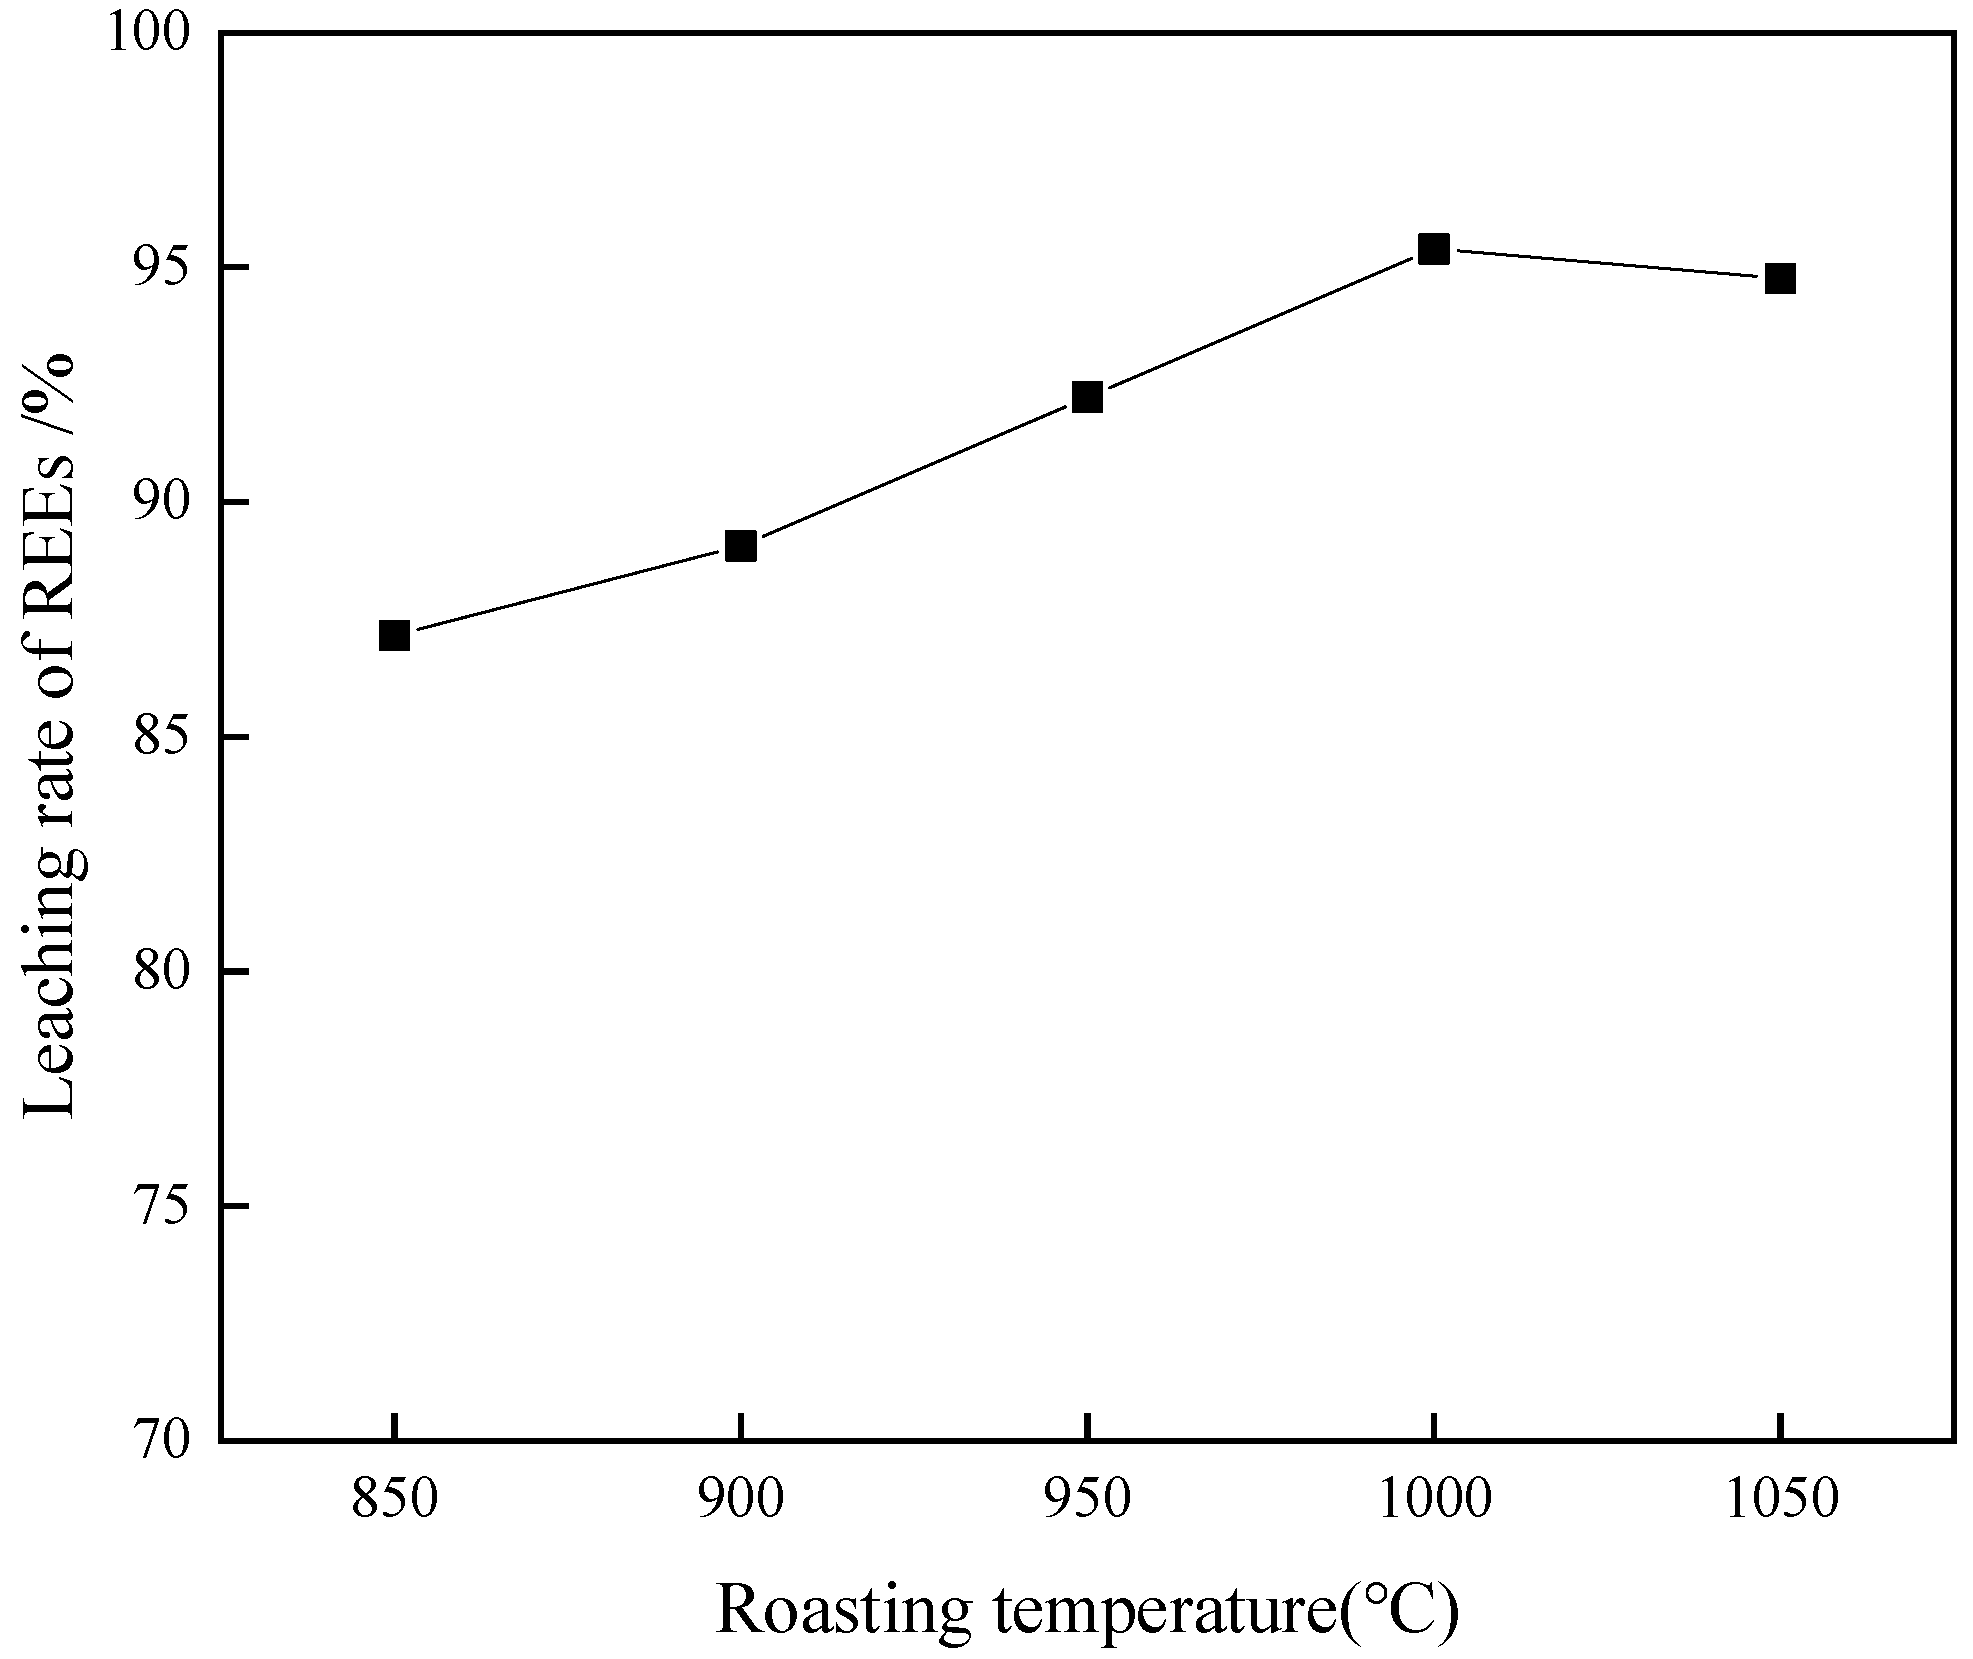
The roasting temperatures (i.e., 850 °C, 900 °C, 950 °C, 1000 °C, and 1050 °C) were selected to examine their effects on the leaching rate of REEs, whereas other conditions were kept consistent, that is, a roasting time of 90 min and a CaO dosage of 15%. The results are shown in Figure 5.
As shown in Figure 5, the leaching rate of REEs increased from 87.16% to 95.39% when the roasting temperature increased from 850 °C to 1000 °C. When the roasting temperature further rose to 1050 °C, the leaching rate of REEs decreased to 94.76%, which may be due to the sintering phenomenon characteristic of roasting products caused by high temperatures, which has an adverse effect on leaching. Therefore, 1000 °C was selected as the optimal roasting temperature in the follow-up experiments.

3.2.3. Effect of Roasting Time

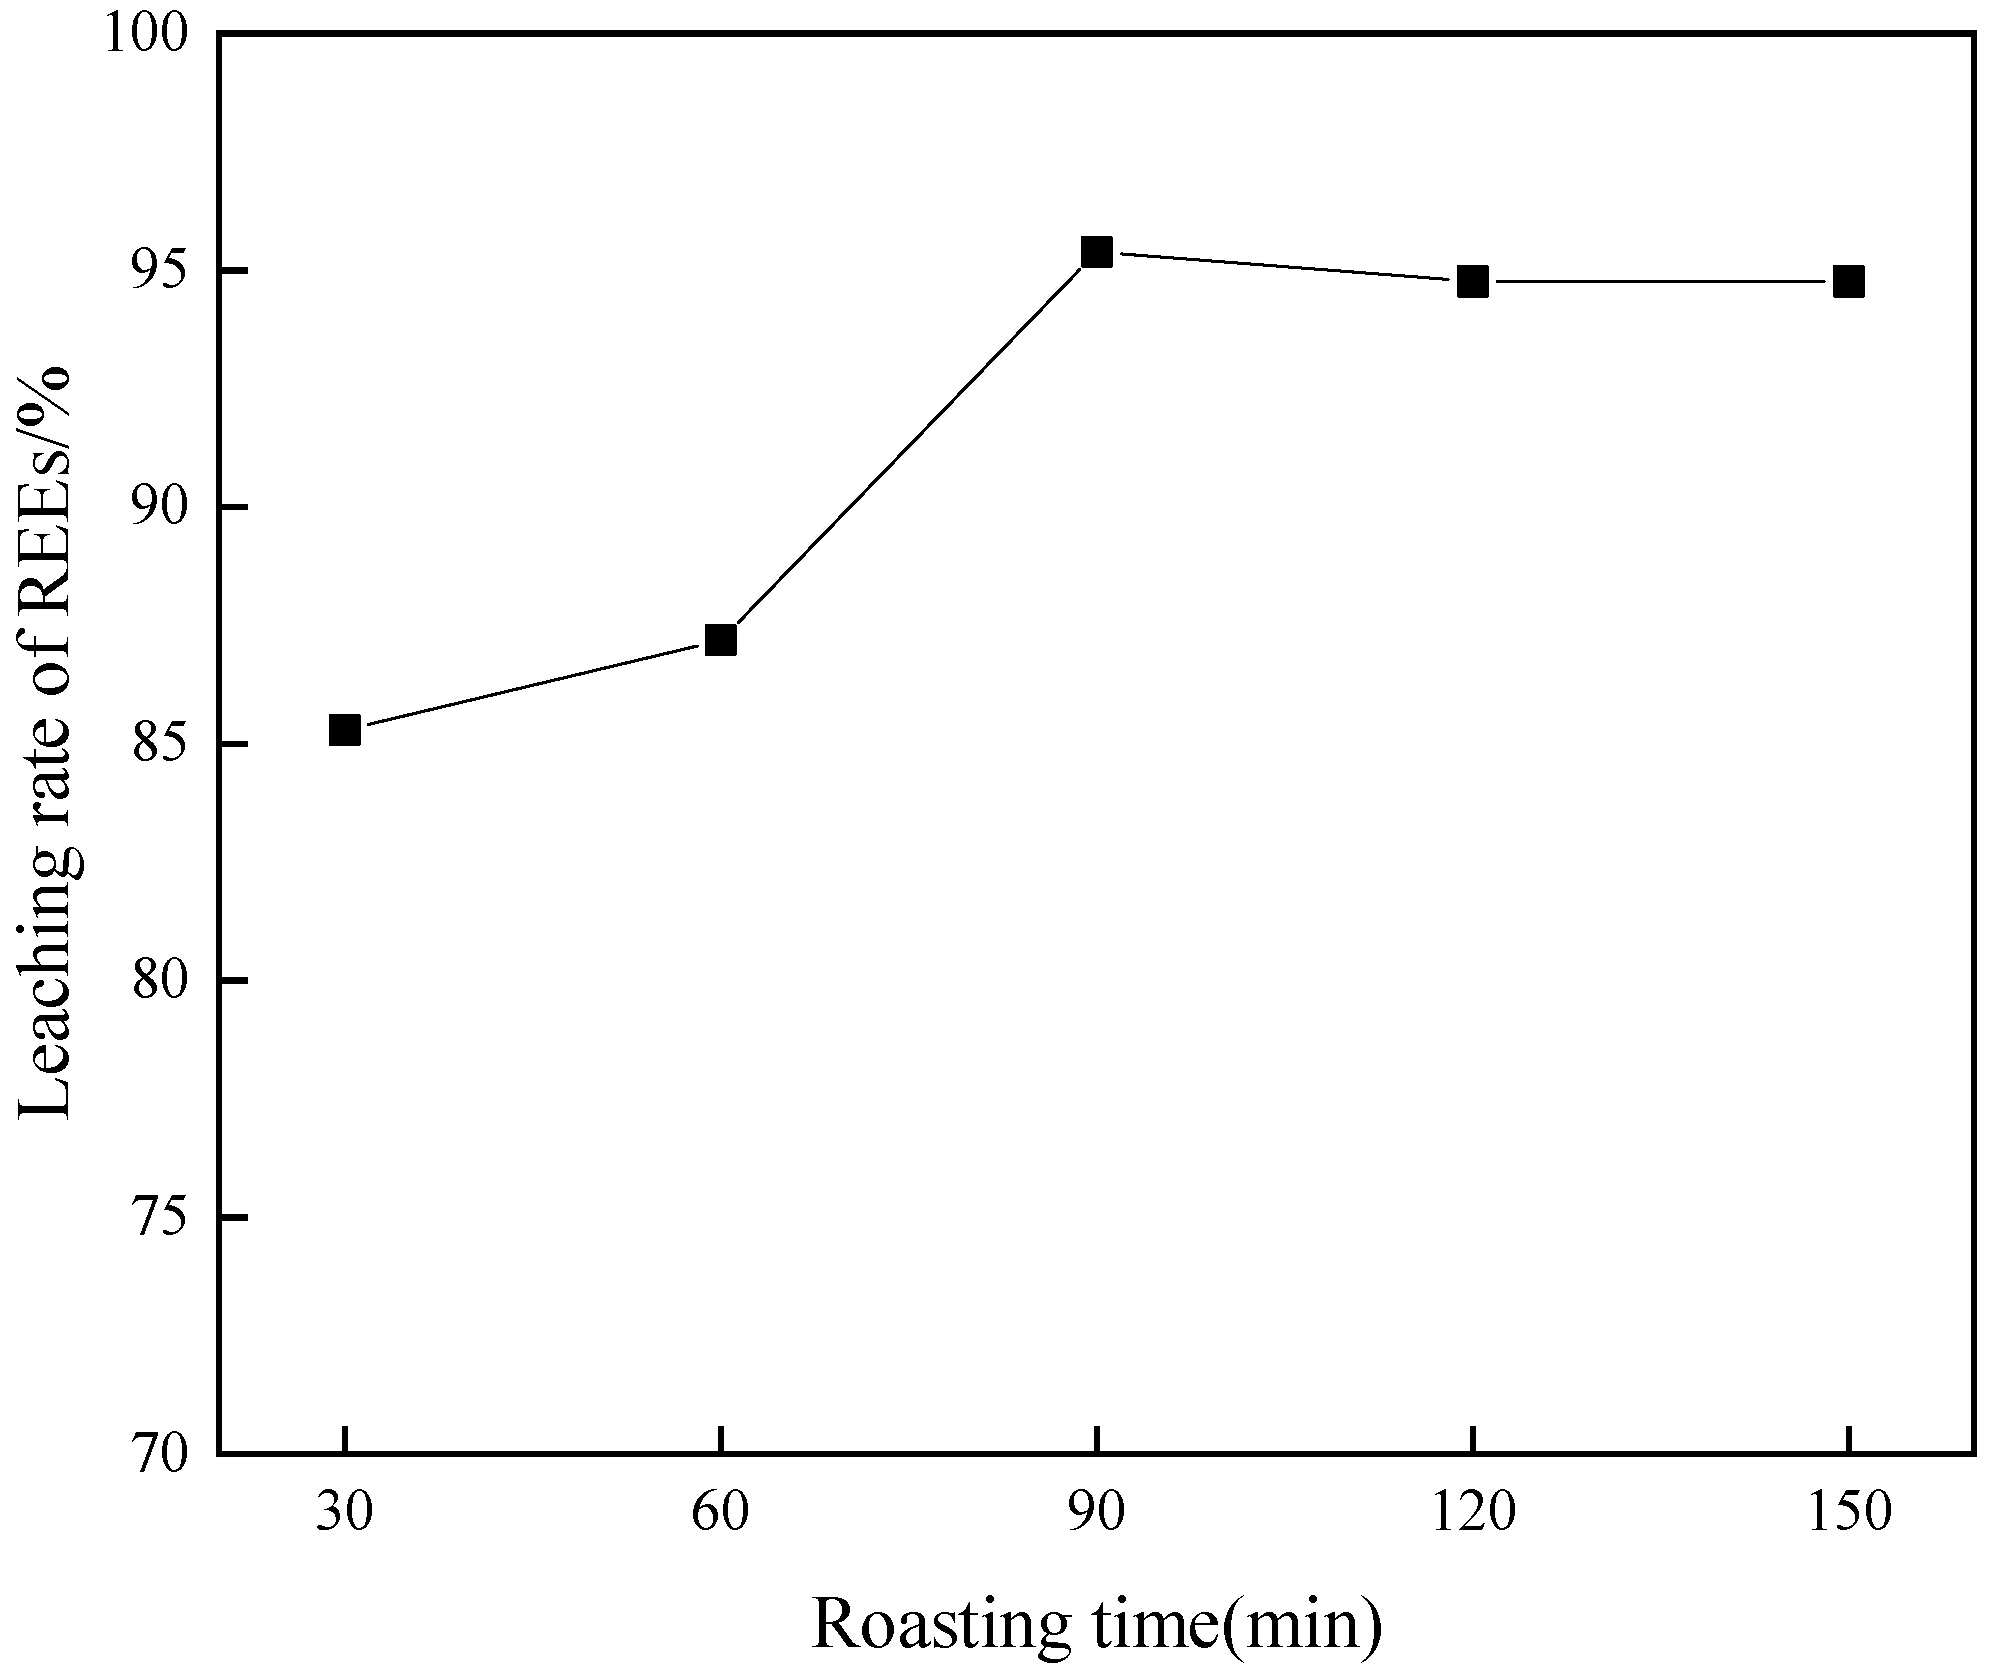
The roasting times (i.e., 30, 60, 90, 120, and 150 min) were selected to evaluate their effects on the leaching of REEs when the CaO dosage was fixed at 15%, and the roasting temperature was fixed at 1000 °C. The outcomes are illustrated in Figure 6.
Figure 6 reveals that the leaching rate of REEs increased from 85.29% to 95.39% when the roasting time increased from 30 min to 90 min. Further increasing the roasting time has no obvious effect on the leaching rate of REEs. Thus, a roasting time of 90 min was determined as optimal.
In summary, the optimal roasting conditions are a roasting temperature of 1000 °C, a CaO dosage of 15%, and a roasting time of 90 min.

3.3. Effect of Leaching Conditions on Leaching Rate of REEs

Leaching time, leaching temperature, acid concentration, and the liquid–solid ratio are recognized as the principal factors that govern the leaching process. The influence of leaching conditions on the leaching rate of REEs from the roasted RCS obtained under optimal conditions was studied.

3.3.1. Effect of Leaching Time

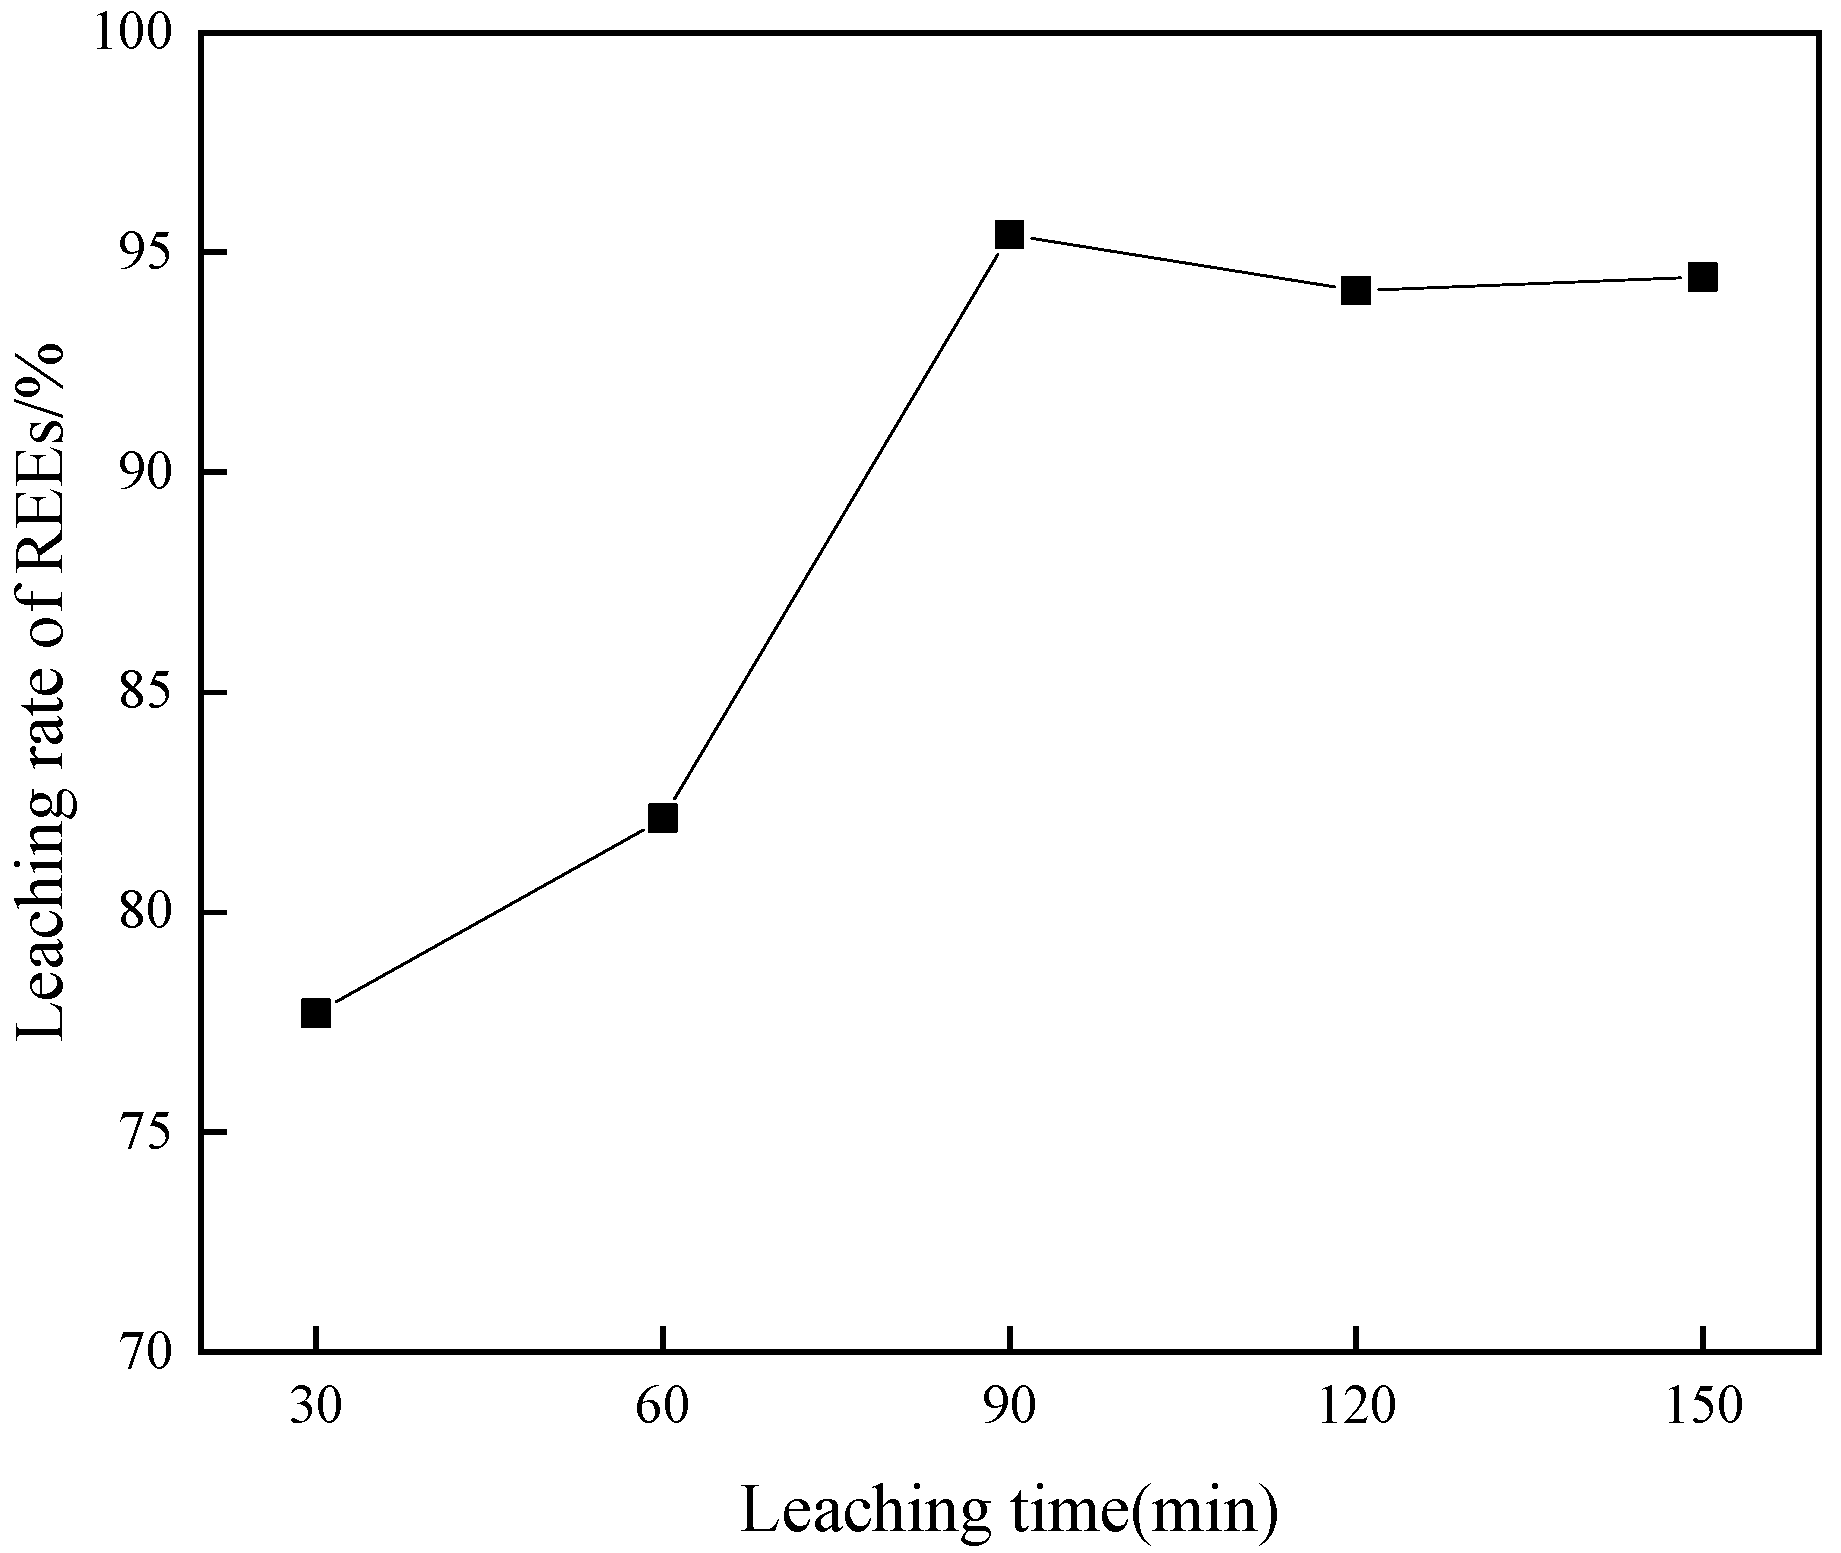
The influence of leaching time (i.e., 30, 60, 90, 120, and 150 min) on the leaching rate of REEs was evaluated under the conditions of a leaching temperature of 40 °C, an acid concentration of 4 mol/L, and a liquid–solid ratio of 15:1. The findings are displayed in Figure 7.
As shown in Figure 7, the leaching rate of REEs increased from 77.07% to 95.41% when the leaching time increased from 30 min to 90 min. Further increasing the leaching time has no obvious effect on the leaching rate of REEs. Thus, a leaching time of 90 min was determined as optimal.

3.3.2. Effect of Leaching Temperature

The leaching temperatures (i.e., 30 °C, 40 °C, 50 °C, 60 °C, and 70 °C) were selected to evaluate their effects on the leaching rate of REEs, and the leaching time was fixed at 90 min with an acid concentration of 4 mol/L and a liquid–solid ratio of 15:1. The results are graphically represented in Figure 8.
As shown in Figure 8, when the temperature was raised from 30 °C to 40 °C, the leaching rate of REEs showed a slight gain, increasing from 93.52% to 94.78%. The leaching rate of REEs decreased from 94.78% to 91.62% when the temperature rose from 40 °C to 70 °C. This phenomenon can be attributed to acid evaporation during the leaching process which leads to a reduction in acid concentration, thereby impeding REE extraction. Consequently, an optimum leaching temperature of 40 °C should be employed.

3.3.3. Effect of Acid Concentration

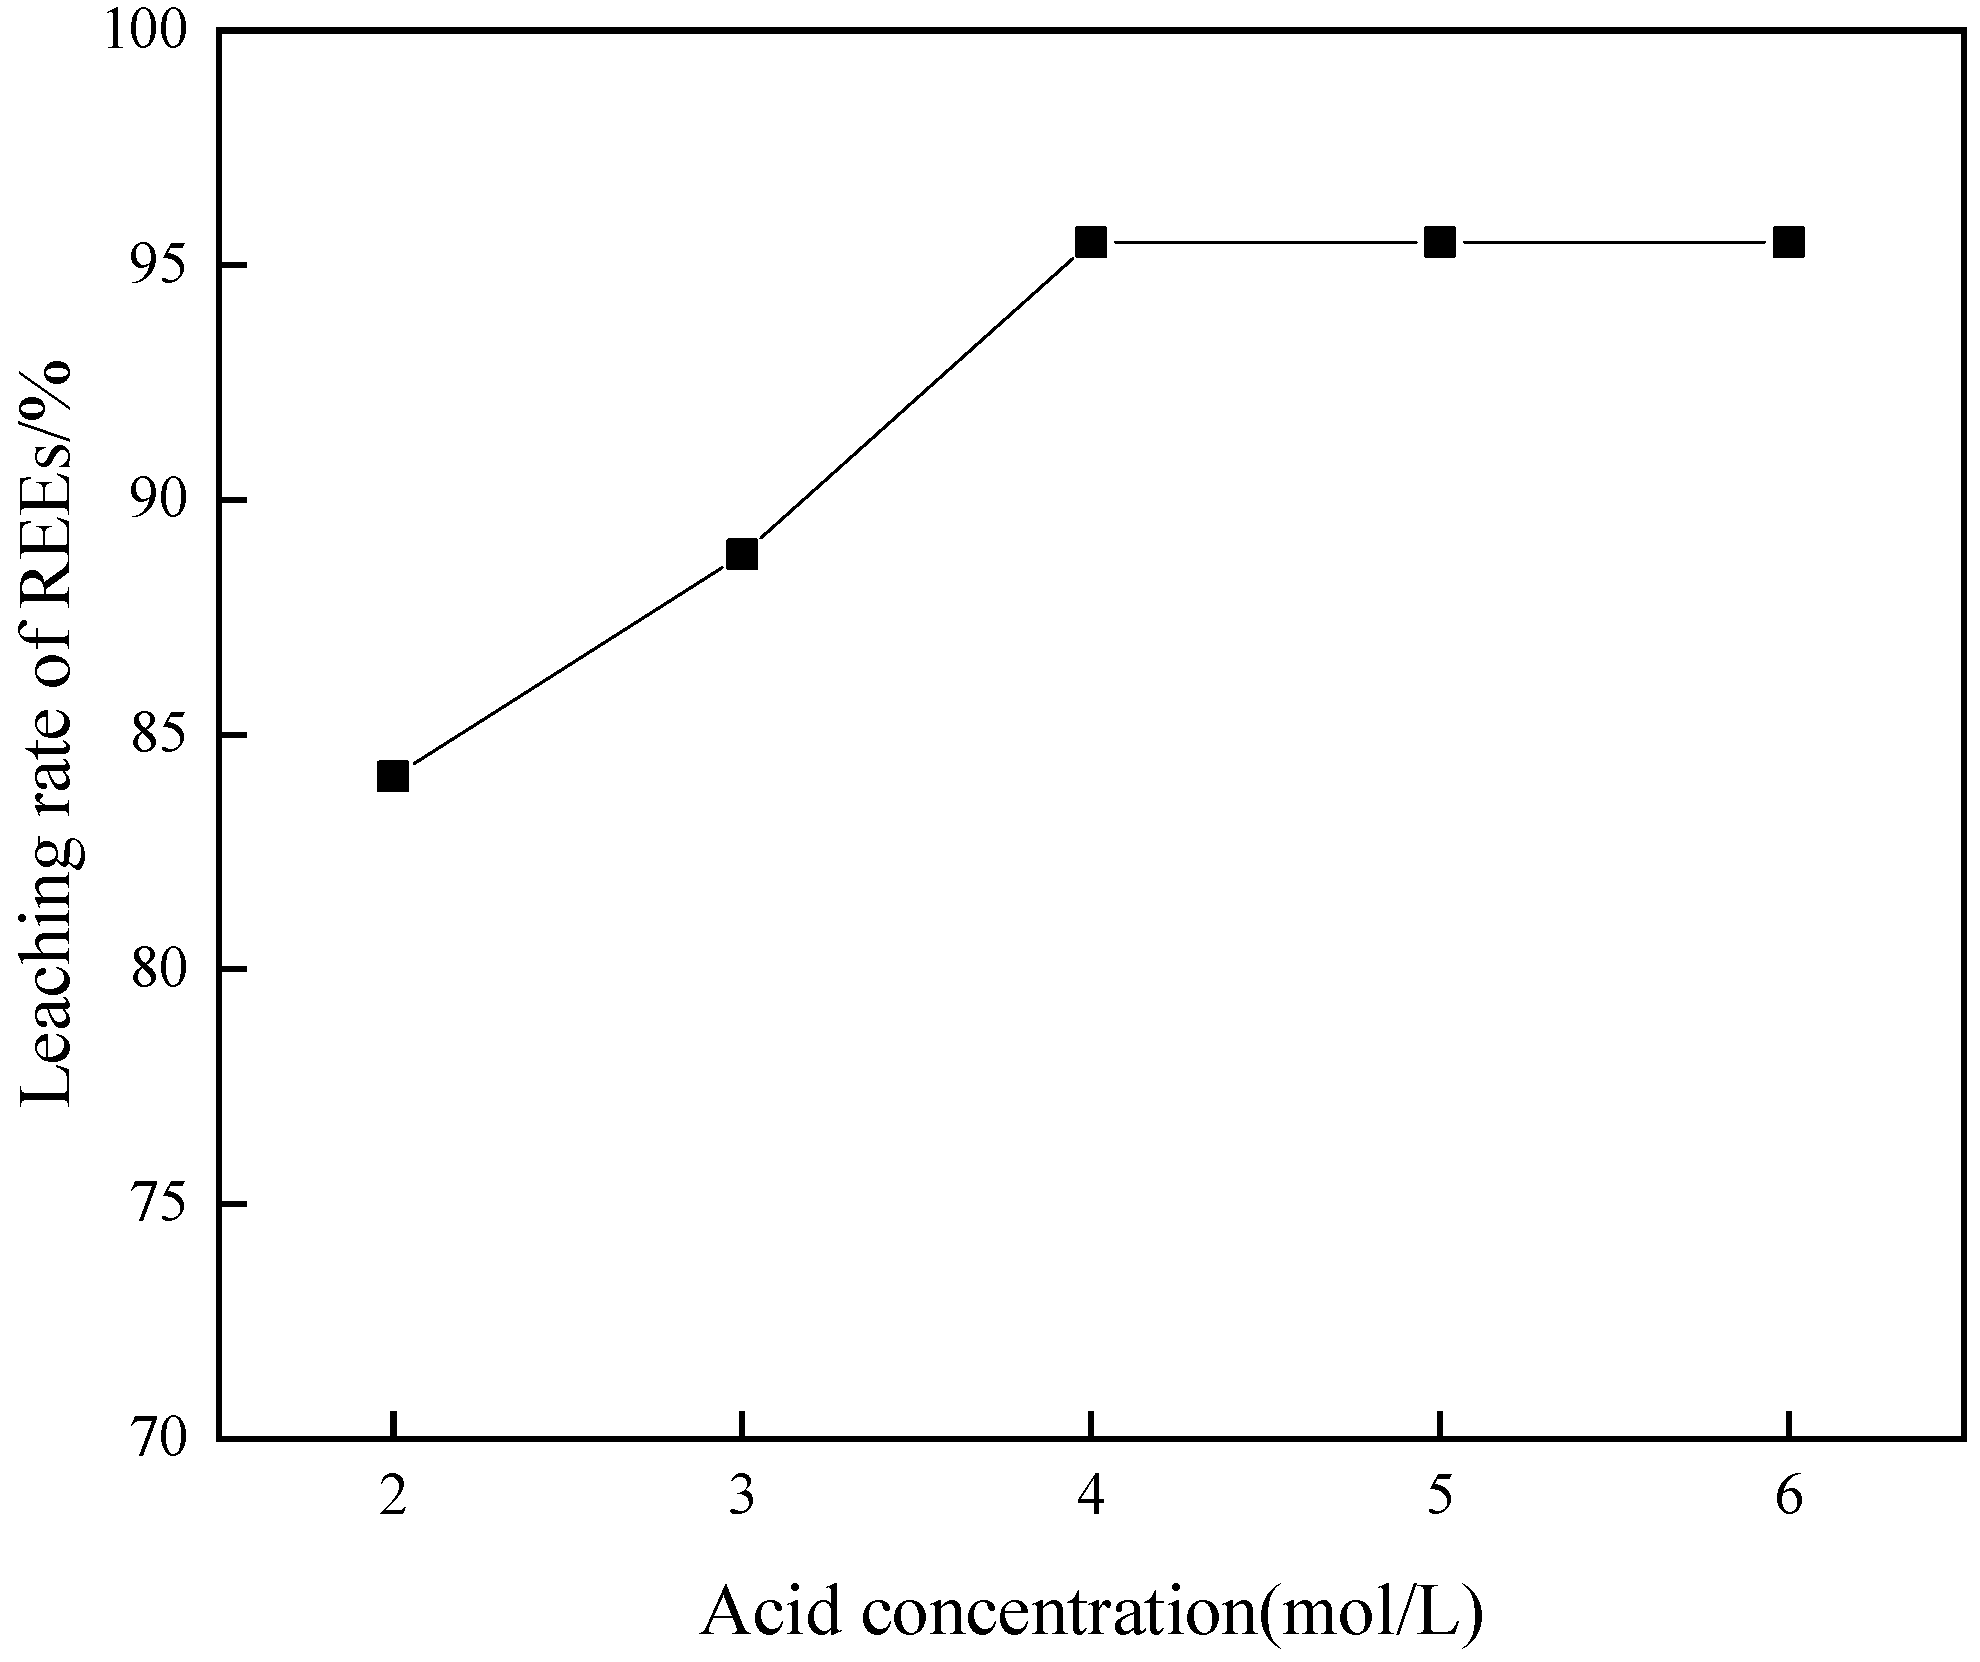
The influence of acid concentration on the leaching rate of REEs was evaluated under the conditions of a leaching time of 90 min, a leaching temperature of 40 °C, and a liquid–solid ratio of 15:1. The results are exhibited in Figure 9.
As shown in Figure 9, the leaching rate of REEs increased from 84.10% to 95.48% as the acid concentration increased from 2 mol/L to 4 mol/L. A further increase in acid concentration had no significant effect on the leaching rate of REEs. Thus, an acid concentration of 4mol/L was determined as optimal.

3.3.4. Effect of Liquid–Solid Ratio

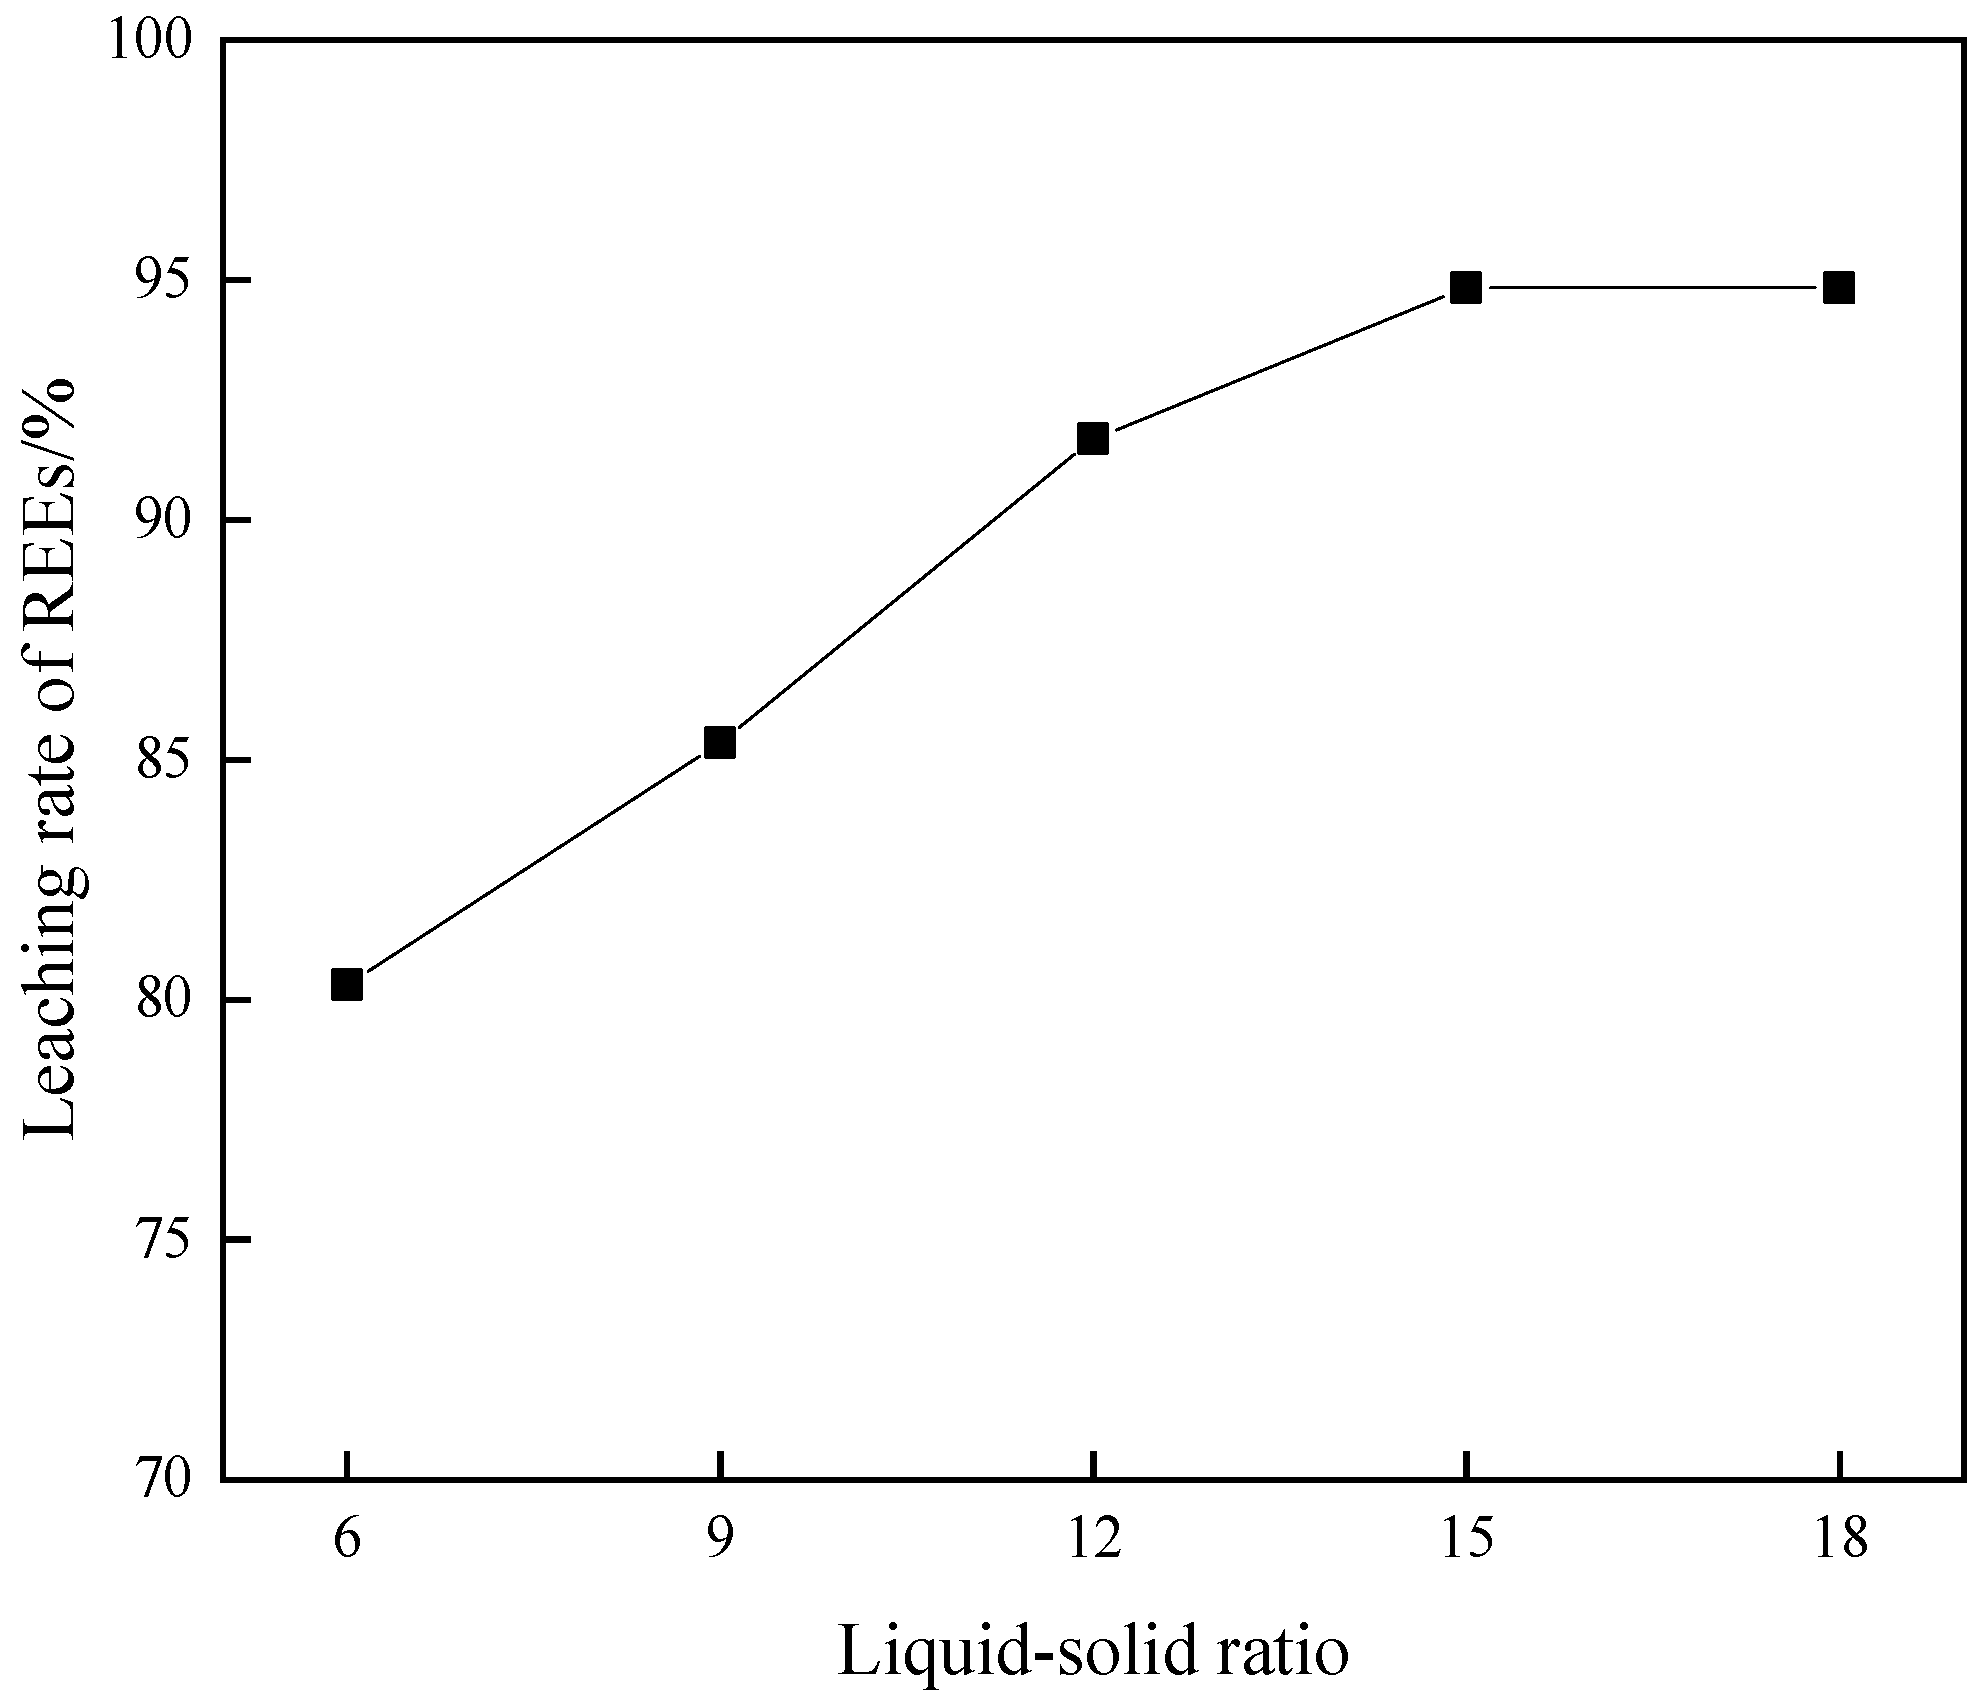
The effects of the liquid–solid ratio were analyzed. The leaching rate of REEs was studied under 6:1–18:1 with a leaching time of 90 min, a leaching temperature of 40 °C, and an acid concentration of 4 mol/L. The results are graphically represented in Figure 10.
As shown in Figure 10, the leaching efficiency of REEs rose from 80.31% to 94.84% as the liquid–solid ratio was elevated from 6:1 to 15:1. The further increase in the liquid–solid ratio to 18:1 did not significantly impact the leaching rate of REEs. Consequently, the liquid–solid ratio of 15:1 was determined to be the optimal choice.
In summary, the optimal leaching parameters for REEs were identified as a leaching time of 90 min, a leaching temperature of 40 °C, an acid concentration of 4 mol/L, a liquid–solid ratio of 15:1, and the optimal leaching rate of REEs was 95.48%. The rare earth leaching rate in our study is found to be equivalent to the optimal conditions previously described by Xia, Liang, and colleagues [10,11,12].

3.4. Characterization

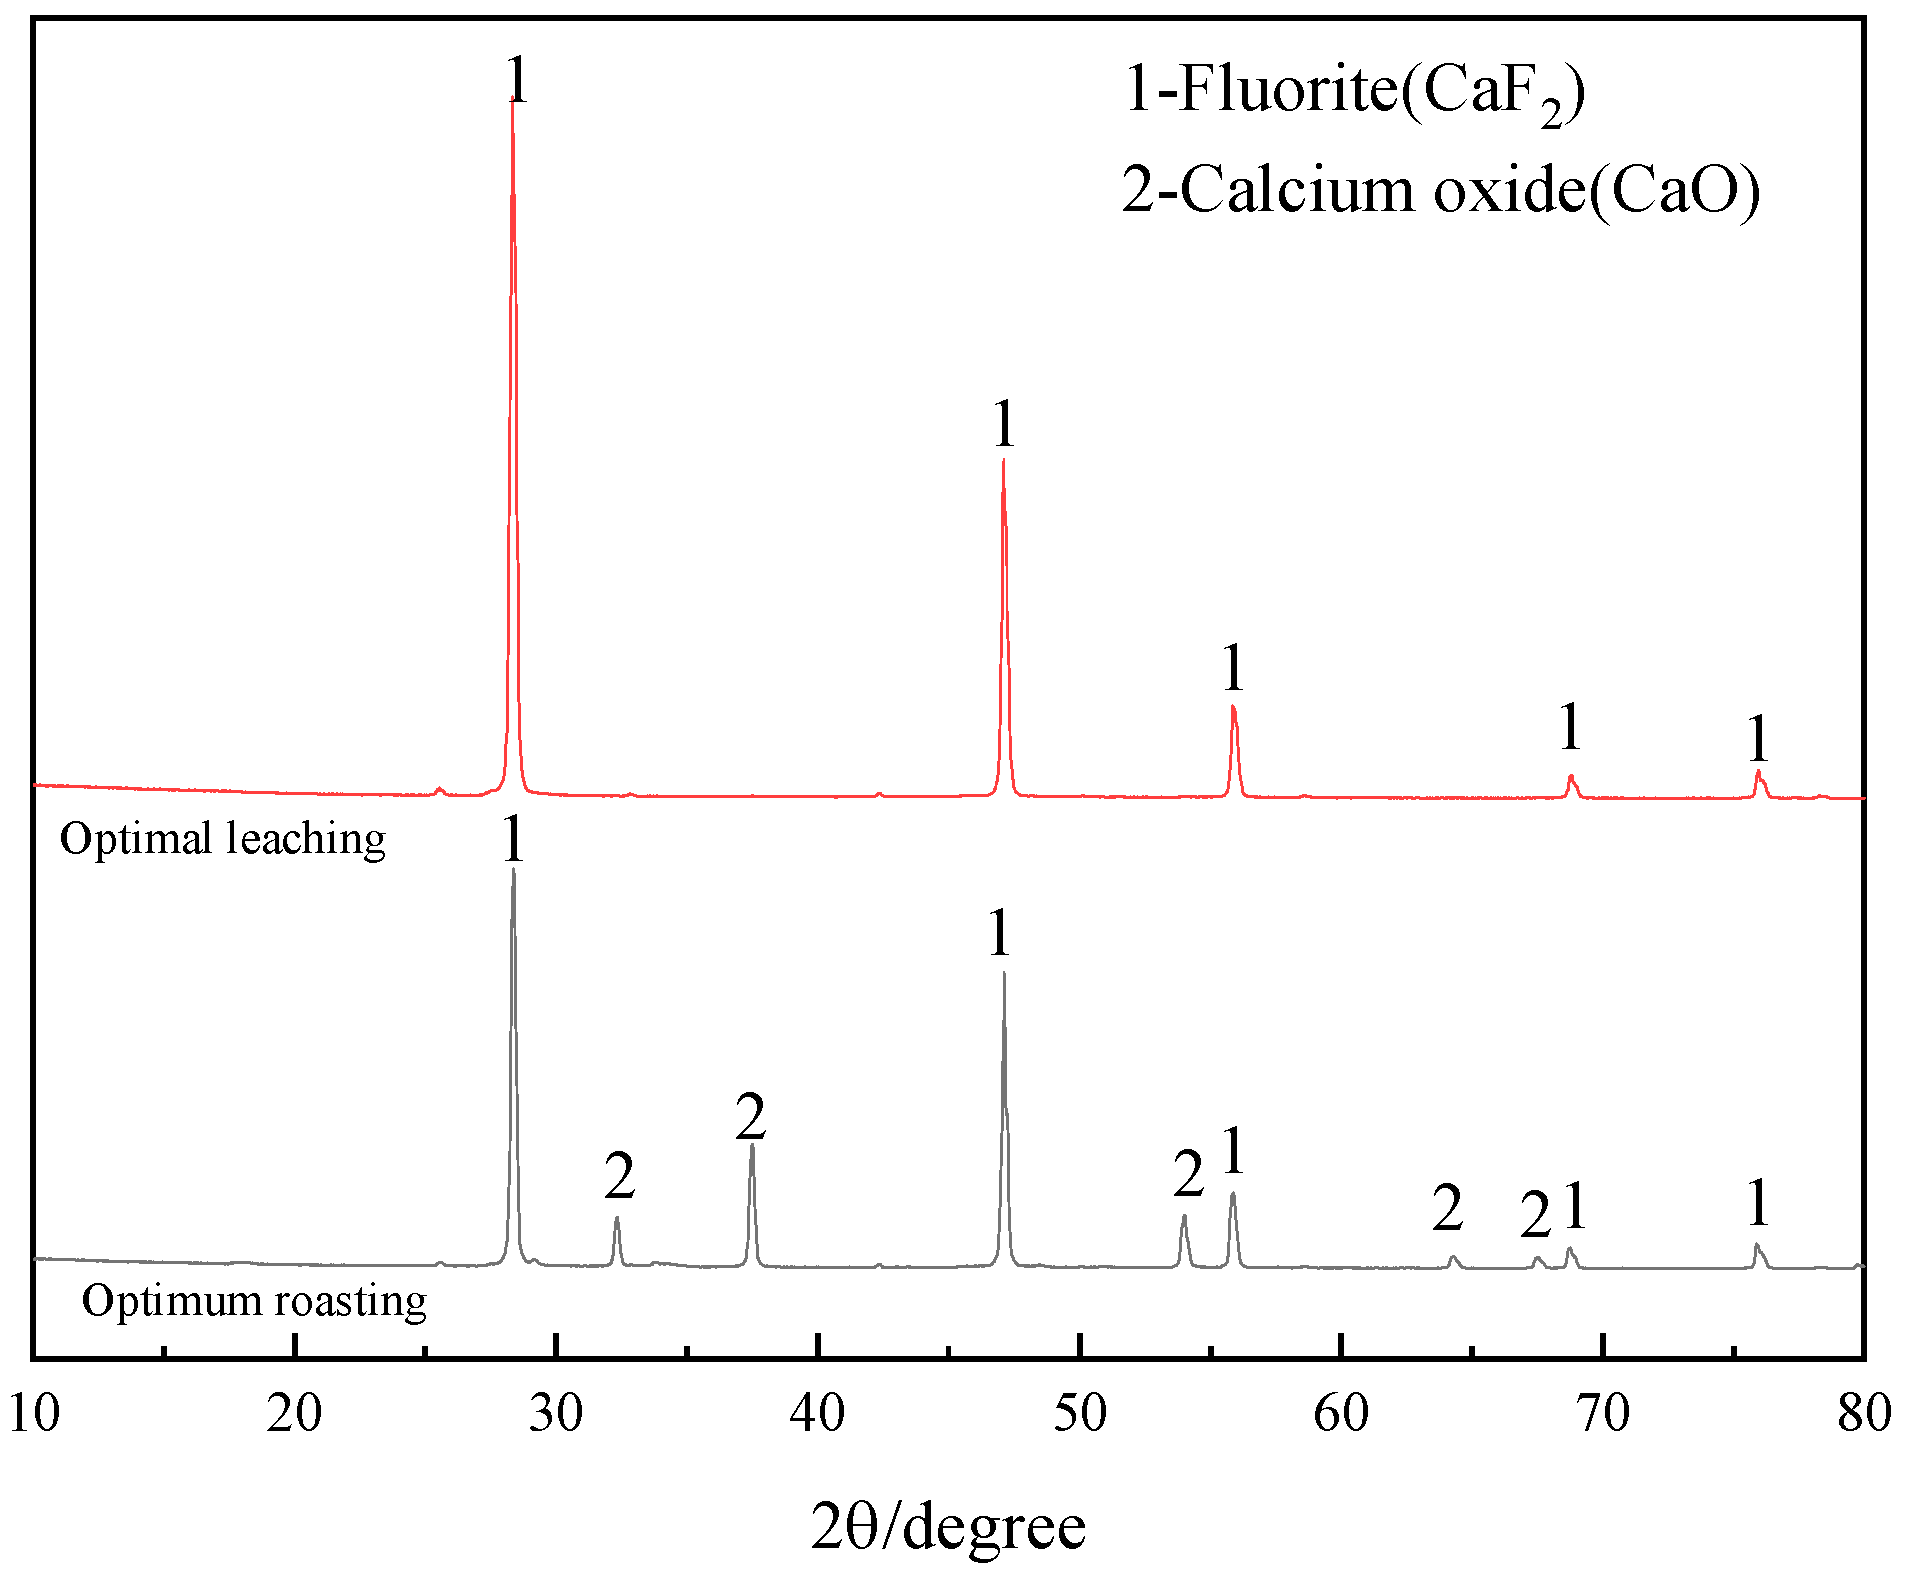
The XRD patterns of both the roasted product and leached residue obtained under the optimal conditions are shown in Figure 11. The primary phases of the roasted product were CaF2 and CaO, and the diffraction peaks of CaCO3 and Ca(OH)2 in the RCS disappeared. These findings suggest that CaCO3 and Ca(OH)2 are likely to decompose or to react with rare earth fluorides. Only the diffraction peak of CaF2 was observed in the leaching residue. Chemical analysis revealed that the leaching residue contained 97.31% CaF2 and exhibited a F element recovery rate of 96.92%, which can be used as fluorspar concentrate [20].
The SEM and EDS analyses of both the roasted and leached slag are presented in Figure 12 and Table 5, respectively. The expressions labeled with +1, +2, +3, +4, +5, +6, and +7 in Figure 12 represent the specific locations and corresponding numbers for the EDS point analyses. Figure 12a,b show the SEM image of the roasted products under the RCS-optimized roasting conditions. As shown in Figure 12a,b, terbium metal particles and terbium oxide were observed; some of the larger particles of terbium metals are associated with CaF2, and small particles of rare earth metals generally exist in the form of liberated particles, which is conducive to the direct contact between hydrochloric acid and REEs during leaching and improves the leaching rate of REEs.
Figure 12c,d show the SEM image of the leaching residue under the optimal leaching conditions. The residue primarily comprises CaF2, with no discernible rare earth metals or oxides, suggesting their efficient extraction by hydrochloric acid. The EDS analysis revealed a significant reduction in terbium content within CaF2 at a range of 0.02–0.12%. This finding confirms that REEs, initially present in CaF2 as isomorphic substitutions, were successfully converted to oxides during the roasting process and subsequently leached effectively by the acid.

3.5. Kinetic Analysis

The leaching process involves a heterogeneous reaction between the liquid and solid phases, which is inherently a kinetic process. The shrinking core model (SCM) is a widely recognized kinetic model that accurately reflects the dynamics of the leaching process [21]. Thus, the SCM is utilized as the kinetic model for leaching, with the process being governed by either chemical reaction control at the phase interface or three-dimensional diffusion control at the phase interface. The equations are as follows:
Chemical reaction control:
1 1 x 1 / 3 = k 1 t
Three-dimensional diffusion control at the phase interface:
1 2 3 x 1 x 2 / 3 = k 2 t
Dickinson and colleagues [22] developed an innovative kinetic model known as the “new variant” to describe the leaching process governed by interfacial mass transfer and diffusion through a solid film. The corresponding kinetic equation for this model is as follows:
1 3 ln 1 x 1 + 1 x 1 / 3 = k 3 t
where ki is the apparent reaction rate constant under the control of each stage; t is the leaching time; x is the leaching rate of REEs.
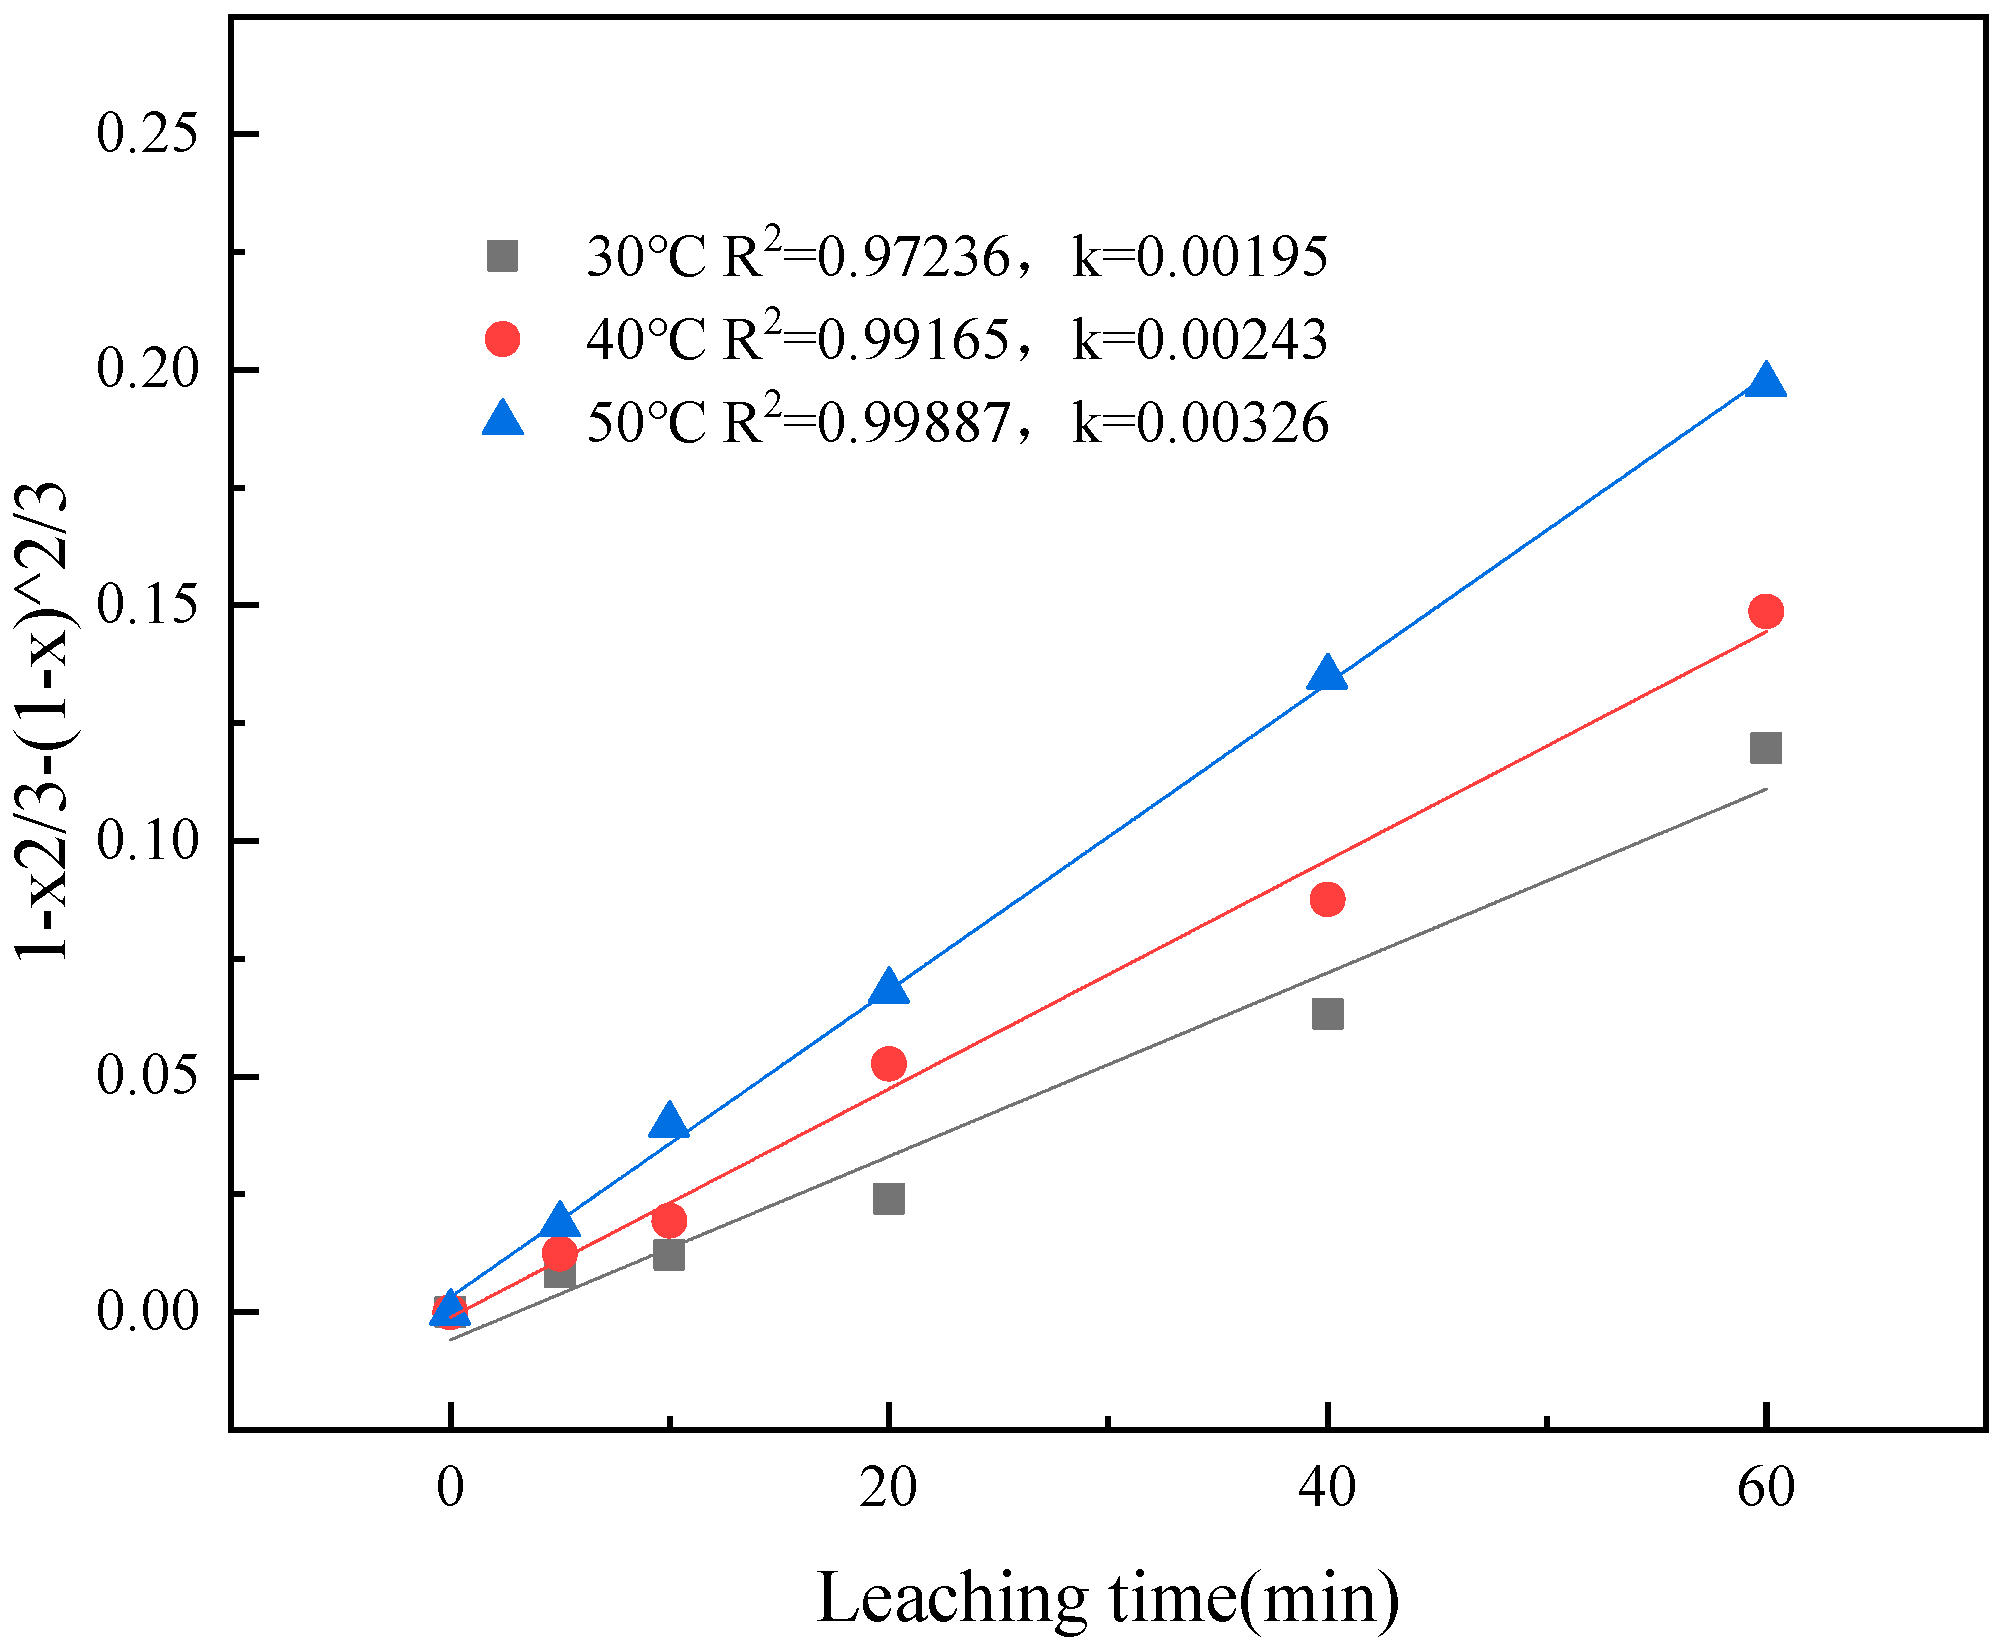
To determine the kinetic equation for controlling the chemical reaction during leaching, using the reduced slag as the raw material, the roasting conditions were set as follows: 15% CaO, a roasting temperature of 1000 °C, and a roasting time of 90 min; the leaching conditions were set as follows: 4mol/L hydrochloric acid and a liquid–solid ratio of 15:1. The leaching time was measured at six different levels of 0 min, 5 min, 10 min, 20 min, 40 min, and 60 min at different temperatures. The degree of chemical reaction was represented by the rare earth extraction rate, and the relationship between leaching time and the rare earth extraction rate at different temperatures is shown in Figure 13.
Upon examining the data presented in Table 6, it is evident that the second model provided a superior fit to the kinetic data across all leaching experiments, with correlation coefficients exceeding 0.95. According to Equation (10), the rate constants of different temperatures were calculated for the leaching rate of REEs. Using the rate constant k derived from Figure 14, the relationship between ln(k) and 1/T was plotted and linearly fitted, resulting in the Arrhenius plot depicted in Figure 15. When the activation energy is less than 40 kJ/mol, the leaching process of rare earth is often controlled by diffusion [23]. The apparent activation energy for rare earth leaching, as indicated by the slope in Figure 15, is 20.869 kJ/mol. Based on the model calculations and the determined activation energy, it is concluded that the leaching rate of rare earth is influenced by three-dimensional diffusion control at the phase interface, which is consistent with the predicted diffusion control.

4. Conclusions

(1)
Thermodynamically, CaO, Ca(OH)2, and CaCO3 are capable of converting insoluble rare earth fluoride into soluble oxides during the roasting process.
(2)
The efficiency of rare earth leaching is significantly influenced by the conditions of both roasting and leaching. The leaching rate of REEs was 95.48% under optimal conditions: a CaO dosage of 15%, a roasting temperature of 1000 °C, a roasting time of 90 min, a leaching time of 90 min, a leaching temperature of 40 °C, an acid concentration of 4 mol/L, and a liquid to solid ratio of 15:1.
(3)
Almost all rare earth metals and REEs present in CaF2 in isomorphic form have been successfully extracted. The leaching residue contains 97.31% CaF2, with a F recovery rate of 96.92%, which can be used as fluorspar concentrate.
(4)
The kinetic analysis of REE leaching is consistent with the three-dimensional diffusion control mechanism as delineated by the SCM. The calculated apparent activation energy for the leaching rate of REEs is 20.869 kJ/mol.

Author Contributions

J.H. was mainly responsible for the writing of this article; L.Z. was mainly responsible for providing the experimental materials and equipment; W.Y., J.C. and S.R. were mainly responsible for the guidance of the paper; C.L. was mainly responsible for the revision of the paper. All authors have read and agreed to the published version of the manuscript.

Funding

This work was supported by the Training Program for Academic and Technical Leaders of Major Disciplines in Jiangxi Province, China (20212BCJL23051), the National Natural Science Foundation of China (52364026), and the Jiangxi Provincial Key Laboratory of Low-Carbon Processing and Utilization of Strategic Metal Mineral Resources (2023SSY01041).

Data Availability Statement

The data are contained within the article.

Conflicts of Interest

Lizhi Zhang is employee of Qiandong Rare Earth Group Co., LTD. The paper reflects the views of the scientists and not the company. Jinqiu Huang and Wen Yu received financial support from Qiandong Rare Earth Group Co., LTD. The funding sponsors had no role in the design of the study; in the collection, analyses, or interpretation of data; in the writing of the manuscript, and in the decision to publish the results.

References

  1. O’keefe, M.; Joshi, S.; Geng, S. Cerium-Based Conversion Coatings as Alternatives to Hex Chrome: Rare-Earth Compounds Provide Resistance against Corrosion for Aluminum Alloys in Military Applications. Met. Finish. 2007, 105, 25–28. [Google Scholar] [CrossRef]
  2. Goodenough, K.M.; Wall, F.; Merriman, D. The Rare Earth Elements: Demand, Global Resources, and Challenges for Resourcing Future Generations. Nst. Resour. Res. 2018, 27, 201–216. [Google Scholar] [CrossRef]
  3. Laghzaoui, S.; Lamrani, A.F.; Laamara, R.A. Robust half-metallic ferromagnet in doped double perovskite Sr2TiCoO6 by rare-earth elements for photovoltaic and thermoelectric conversion: A DFT method. J. Phys. Chem. Solids 2023, 183, 111639. [Google Scholar] [CrossRef]
  4. Gad, S.M.; Jin, Z.; Emad, S.; Vergara, J.E.; Yawas, D.S.; Dagwa, I.M.; Omiogbemi, I.M.B. Potential of rare-earth compounds as anticorrosion pigment for protection of aerospace AA2198-T851 alloy. Heliyon 2023, 9, e14693. [Google Scholar] [CrossRef] [PubMed]
  5. Gupta, C.K.; Krishnamurthy, N. Oxide reduction processes in the preparation of rare-earth metals. Min. Metall. Explor. 2013, 30, 38–44. [Google Scholar] [CrossRef]
  6. Han, W.; Li, M.; Zhang, M.; Yan, Y. Progress in preparation of rare earth metals and alloys by electrodeposition in molten salts. Rare Met. 2016, 35, 811–825. [Google Scholar] [CrossRef]
  7. Liu, H.; Zhang, Y.; Luan, Y.; Yu, H.; Li, D. Research Progress in Preparation and Purification of Rare Earth Metals. Metals 2020, 10, 1376. [Google Scholar] [CrossRef]
  8. Huang, M.; Liu, K.; Zhang, H.; Zhang, X.; Li, J.; Xie, Y.; Lai, Y.; Huang, Z.; Qi, T. A Novel Process for the Recovery of Rare Earth and Fluoride Compounds from Calciothermic Reduction Slag. JOM 2023, 75, 3577–3586. [Google Scholar] [CrossRef]
  9. Chen, D.; Ou, Y.; Lu, D. Study on Comprehensive Utilization of Slag from Vacuum Calcium Thermal Reduction. Jiangxi Nonferrous Met. 2004, 3, 27–30. [Google Scholar]
  10. Xia, H.; Liu, Y.; Liu, D.; Wu, X. Thermodynamics Analysis for NaOH Roasting of Reduction Residue from Calcium Thermal Reduction of Fluorinated Rare Earth. Min. Metall. Eng. 2021, 4, 109–112. [Google Scholar]
  11. Liang, Y.; Li, Y.; Lin, R.; Shao, L.; Liu, Y. Extracting REEs from Smelter Slag of Calcium Thermal Reduction by Roasting with Sodium Metasilicate Nonahydrate. J. Chin. Soc. Rare Earths 2018, 6, 739–744. [Google Scholar]
  12. Liu, Y.; Liang, Y.; Liu, D.; Tang, H. Thermodynamic Analysis on Extracting REEs from Smelter Slag of Calcium Thermal Reduction of Rare Earth Fluoride. J. Chin. Soc. Rare Earths 2021, 5, 759–765. [Google Scholar]
  13. Zeng, G.; Ling, B.; Li, Z.; Luo, S.; Sui, X.; Guan, Q. Fluorine removal and calcium fluoride recovery from rare-earth smelting wastewater using fluidized bed crystallization process. J. Hazard. Mater. 2019, 375, 313–320. [Google Scholar] [CrossRef]
  14. Gupta, C.K.; Krishnamurthy, N. Extractive metallurgy of rare earths. Int. Mater. Rev. 1992, 37, 197–248. [Google Scholar] [CrossRef]
  15. GB/T 14635-2020; Rare Earth Metals and Their Compounds—Determination of Total Rare Earth Content. China Standards Press: Beijing, China, 2020.
  16. Xing, P.; Li, H.; Ye, C.; Zhong, L. Recovery of Rare-Earth Elements from Molten Salt Electrolytic Slag by Fluorine Fixation Roasting and Leaching. J. Sustain. Metall. 2022, 8, 522–531. [Google Scholar] [CrossRef]
  17. Lin, J.; He, Q.; Li, C. A Method for Separating and Recovering Rare Earth Elements from Waste Rare Earth Molten Salt Electrolysis. Chinese Patent CN101956078A, 26 January 2011. [Google Scholar]
  18. Bale, C.; Chartrand, P.; Degterov, G.; Eriksson, K.; Hack, K.; Ben Mahfoud, R.; Melancon, J.; Pelton, A.D.; Petersen, S. FactSage thermochemical software and databases. Calphad 2002, 26, 189–228. [Google Scholar] [CrossRef]
  19. Bale, C.; Belisle, E.; Chartrand, P.; Decterov, S.A.; Eriksson, G.; Gheribi, A.E.; Hack, K.; Jung, I.H.; Kang, Y.B.; Melancon, J.; et al. FactSage thermochemical software and databases, 2010-2016. Calphad 2016, 54, 35–53. [Google Scholar] [CrossRef]
  20. YB/T 5217-2019; Fluorspar. China Standards Press: Beijing, China, 2019.
  21. Schmidt, L.D. The Engineering of Chemical Reactions; Oxford University Press: New York, NY, USA, 2005. [Google Scholar]
  22. Dickinson, C.F.; Heal, G.R. Solid–liquid diffusion controlled rate equations. Thermochim. Acta 1999, 340, 89–103. [Google Scholar] [CrossRef]
  23. Emmanuel, A.O.; Herman, P.; Forture, M.; Noluthando, P.S.; Samaneh, T.; Joseph, K.N. Concurrent leaching of copper and cobalt from a copper–cobalt ore using sulfuric and organic acids. Miner. Eng. 2024, 216, 108853. [Google Scholar]
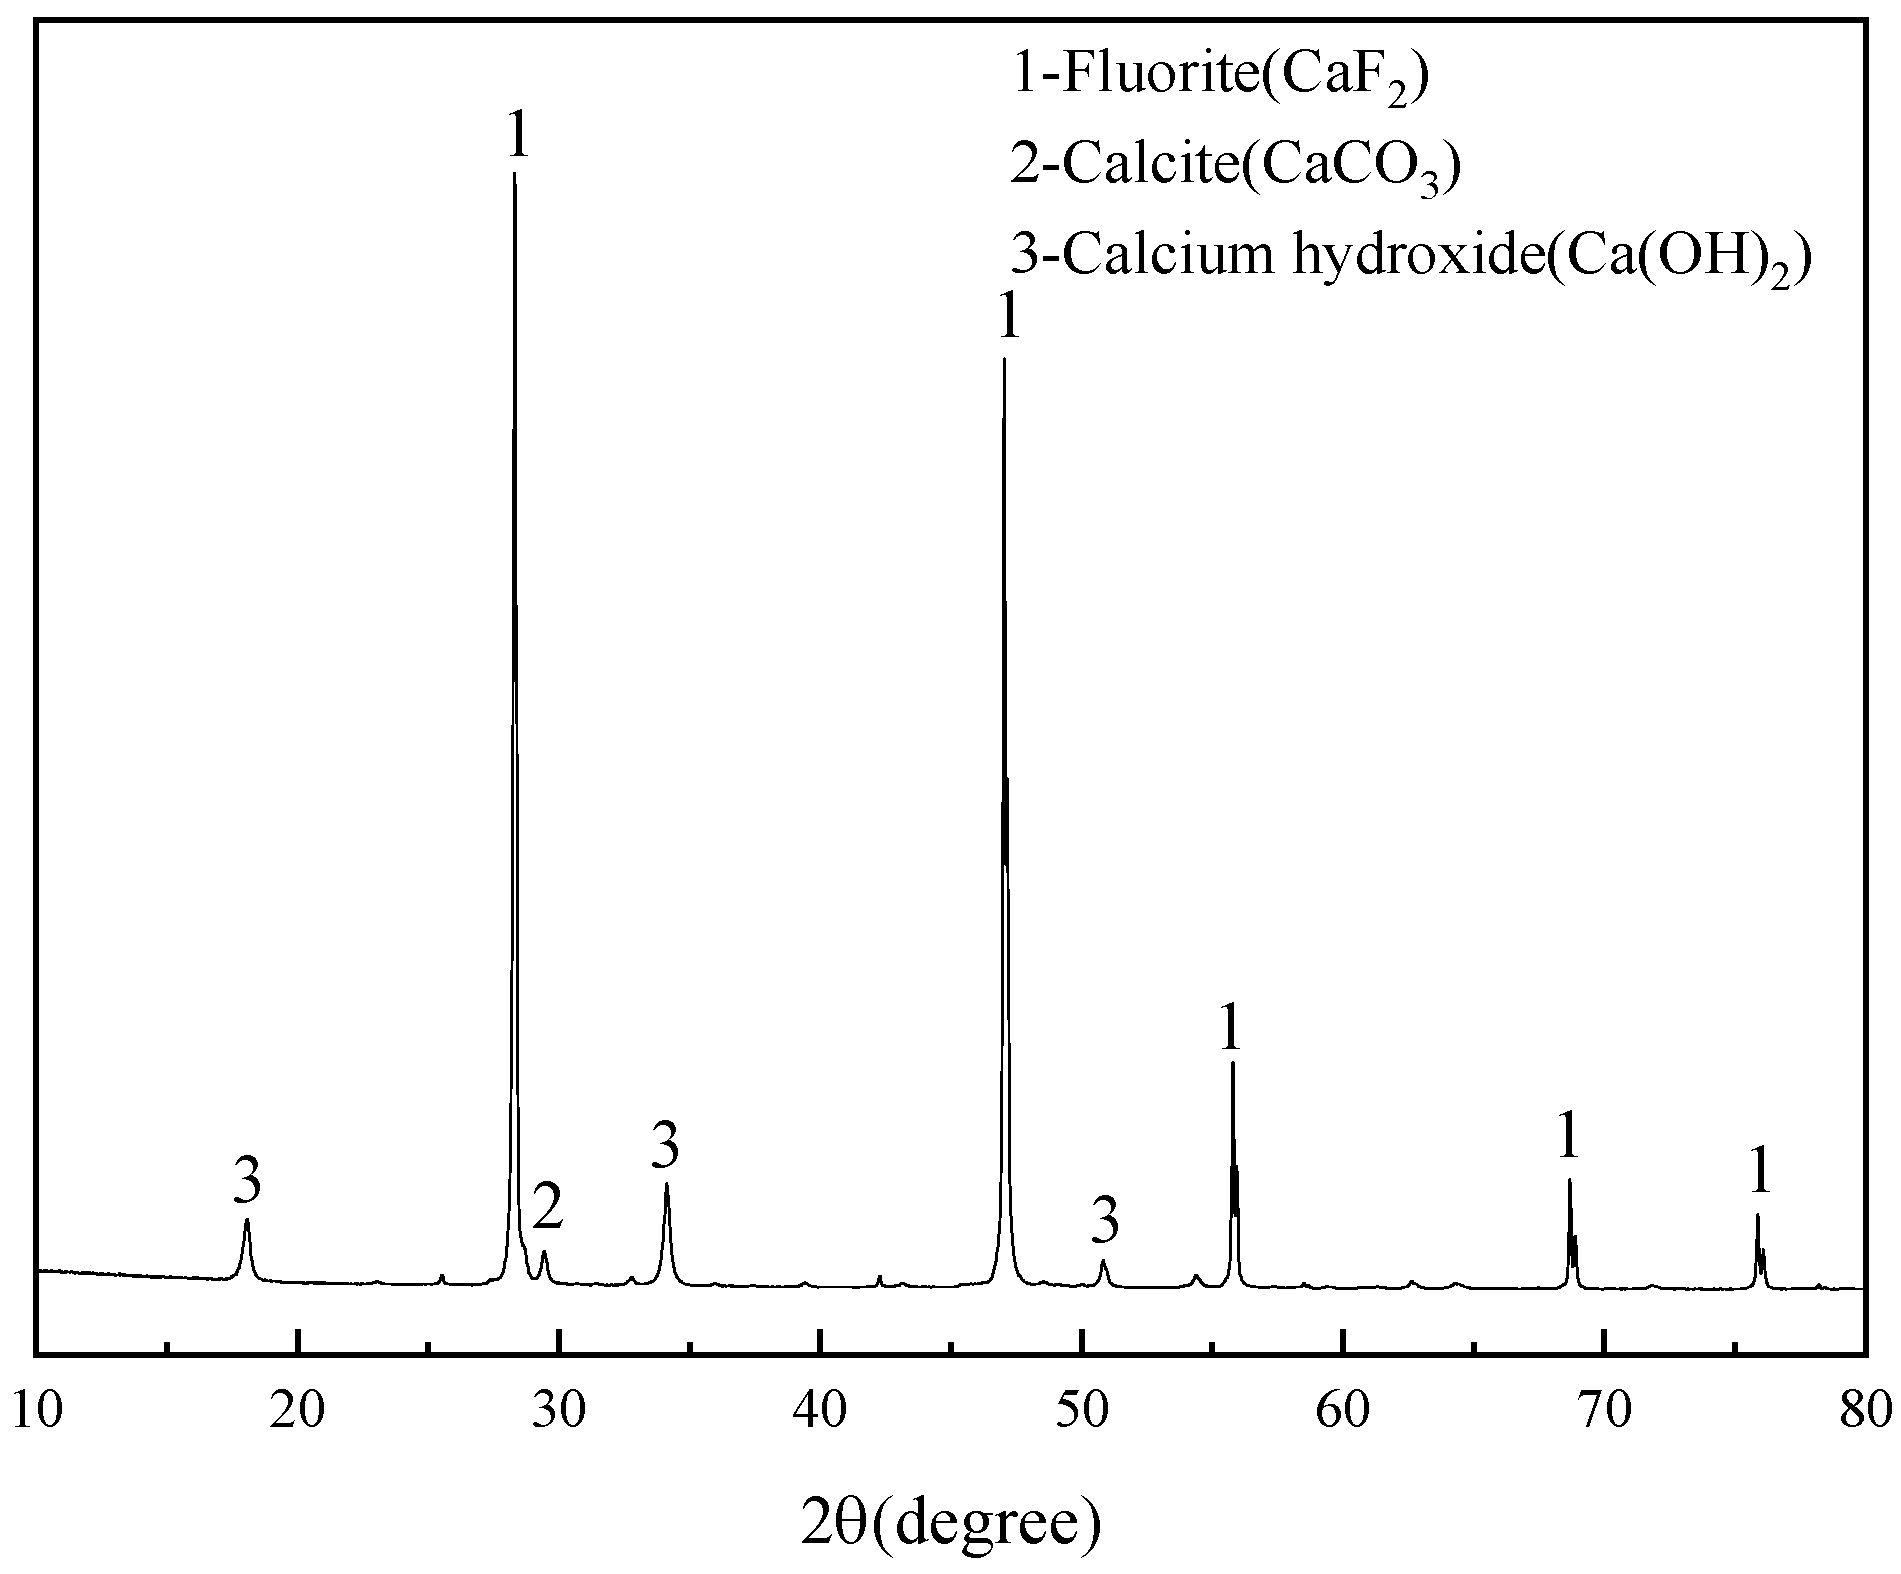
Figure 1. XRD patterns of RCS.
Minerals 14 01001 g001
Figure 2. SEM images of RCS: (a) typical SEM images; (bd) partial enlargements.
Minerals 14 01001 g002
Figure 3. The relationship between the temperature, T, and the reaction of Gibbs free energy.
Minerals 14 01001 g003
Figure 4. Effect of CaO dosage on leaching rate of REEs.
Minerals 14 01001 g004
Figure 5. Effect of roasting temperature on leaching rate of REEs.
Minerals 14 01001 g005
Figure 6. Effect of roasting time on leaching rate of REEs.
Minerals 14 01001 g006
Figure 7. Effect of leaching time on leaching rate of REEs.
Minerals 14 01001 g007
Figure 8. Effect of leaching temperature on leaching rate of REEs.
Minerals 14 01001 g008
Figure 9. Impact of acid concentration on leaching rate of REEs.
Minerals 14 01001 g009
Figure 10. Effect of liquid–solid ratio on leaching rate of REEs.
Minerals 14 01001 g010
Figure 11. The XRD patterns of the optimal roasting product and optimal leaching residue.
Minerals 14 01001 g011
Figure 12. A SEM diagram illustrating the optimal products: (a,b) the optimal roasting products; (c,d) the optimal leaching residues.
Minerals 14 01001 g012
Figure 13. The relationship between leaching time and the leaching rate of REEs at different leaching temperatures.
Minerals 14 01001 g013
Figure 14. The relationship between 1 − 2x/3 − (1 − x)2/3 = k2t and leaching time for the leaching rate of REEs.
Minerals 14 01001 g014
Figure 15. Arrhenius plots for leaching rate of REEs.
Minerals 14 01001 g015
Table 1. Chemical composition of RCS (wt%).
ElementsTREOFCaAlFe
Assay2.3336.7451.010.0850.021
Table 2. REE partitioning of RCS (wt%).
ElementsTb4O7Nd2O3Y2O3Dy2O3Tm2O3
Content94.202.420.700.630.42
Table 3. The EDS chemical composition analysis at each point in Figure 2b (wt%).
PointOFCaTbPhase
1-38.7160.480.81Fluorite
2-41.6756.891.44Fluorite
317.18-13.5969.20Terbium oxide
41.15--98.84Terbium metal
50.19-1.0698.74Terbium metal
Table 4. The reactions of the roasting process.
EquationReactionsΔG (kJ·mol−1)
(1)2TbF3 + 3CaO → Tb2O3 + 3CaF2−0.000002T2–0.0178T − 226.72
(2)2NdF3 + 3CaO → Nd2O3 + 3CaF2−0.00001T2–0.0109T − 247.65
(3)2TbF3 + 3Ca(OH)2 → Tb2O3 + 3CaF2 + 3H2O(g)0.000006T2–0.3889T − 32.731
(4)2NdF3 + 3Ca(OH)2 → Nd2O3 + 3CaF2 + 3H2O(g)−0.000004T2–0.3819T − 53.666
(5)2TbF3 + 3CaCO3 → Tb2O3 + 3CaF2 + 3CO2(g)0.00002T2–0.5051T + 172.99
(6)2NdF3 + 3CaCO3 → Nd2O3 + 3CaF2 + 3CO2(g)0.00001T2–0.4981T + 152.05
(7)CaCO3 → CaO + CO2(g)0.000009T2–0.1624T + 133.23
(8)Ca (OH)2 → CaO + H2O(g)0.000003T2–0.1237T + 64.662
Table 5. The EDS chemical composition analysis at each point in Figure 12 (wt%).
PointOFCaTbPhase
18.730.243.0587.98Terbium metal
213.82-4.3681.82Terbium oxide
38.82-3.6987.49Terbium metal
43.2636.5659.720.47Fluorite
5-42.3257.550.12Fluorite
6-41.9457.980.07Fluorite
7-61.0938.890.02Fluorite
Table 6. Correlation coefficients (R2) of three kinetic models under different leaching conditions.
ParametersValuesChemical Reaction
Control
Three-Dimensional Diffusion ControlNew Variant of Shrinking Core Model
1 − (1 − x)1/3 = k1t1 − 2x/3 − (1 − x)2/3 = k2t1/3ln(1 − x) − 1 + (1 − x)−1/3 = k3t
K1R2K2R2K3R2
T/°C300.006160.976930.001950.972360.002560.90109
400.006990.947710.002430.991650.003850.93028
500.008460.940490.003260.998870.007350.94058
Disclaimer/Publisher’s Note: The statements, opinions and data contained in all publications are solely those of the individual author(s) and contributor(s) and not of MDPI and/or the editor(s). MDPI and/or the editor(s) disclaim responsibility for any injury to people or property resulting from any ideas, methods, instructions or products referred to in the content.