
Geochemistry and Mineralogy of Upper Paleozoic Coal in the Renjiazhuang Mining District, Northwest Ordos Basin, China: Evidence for Sediment Sources, Depositional Environment, and Elemental Occurrence

 ,
,  ,
,
Abstract
1. Introduction
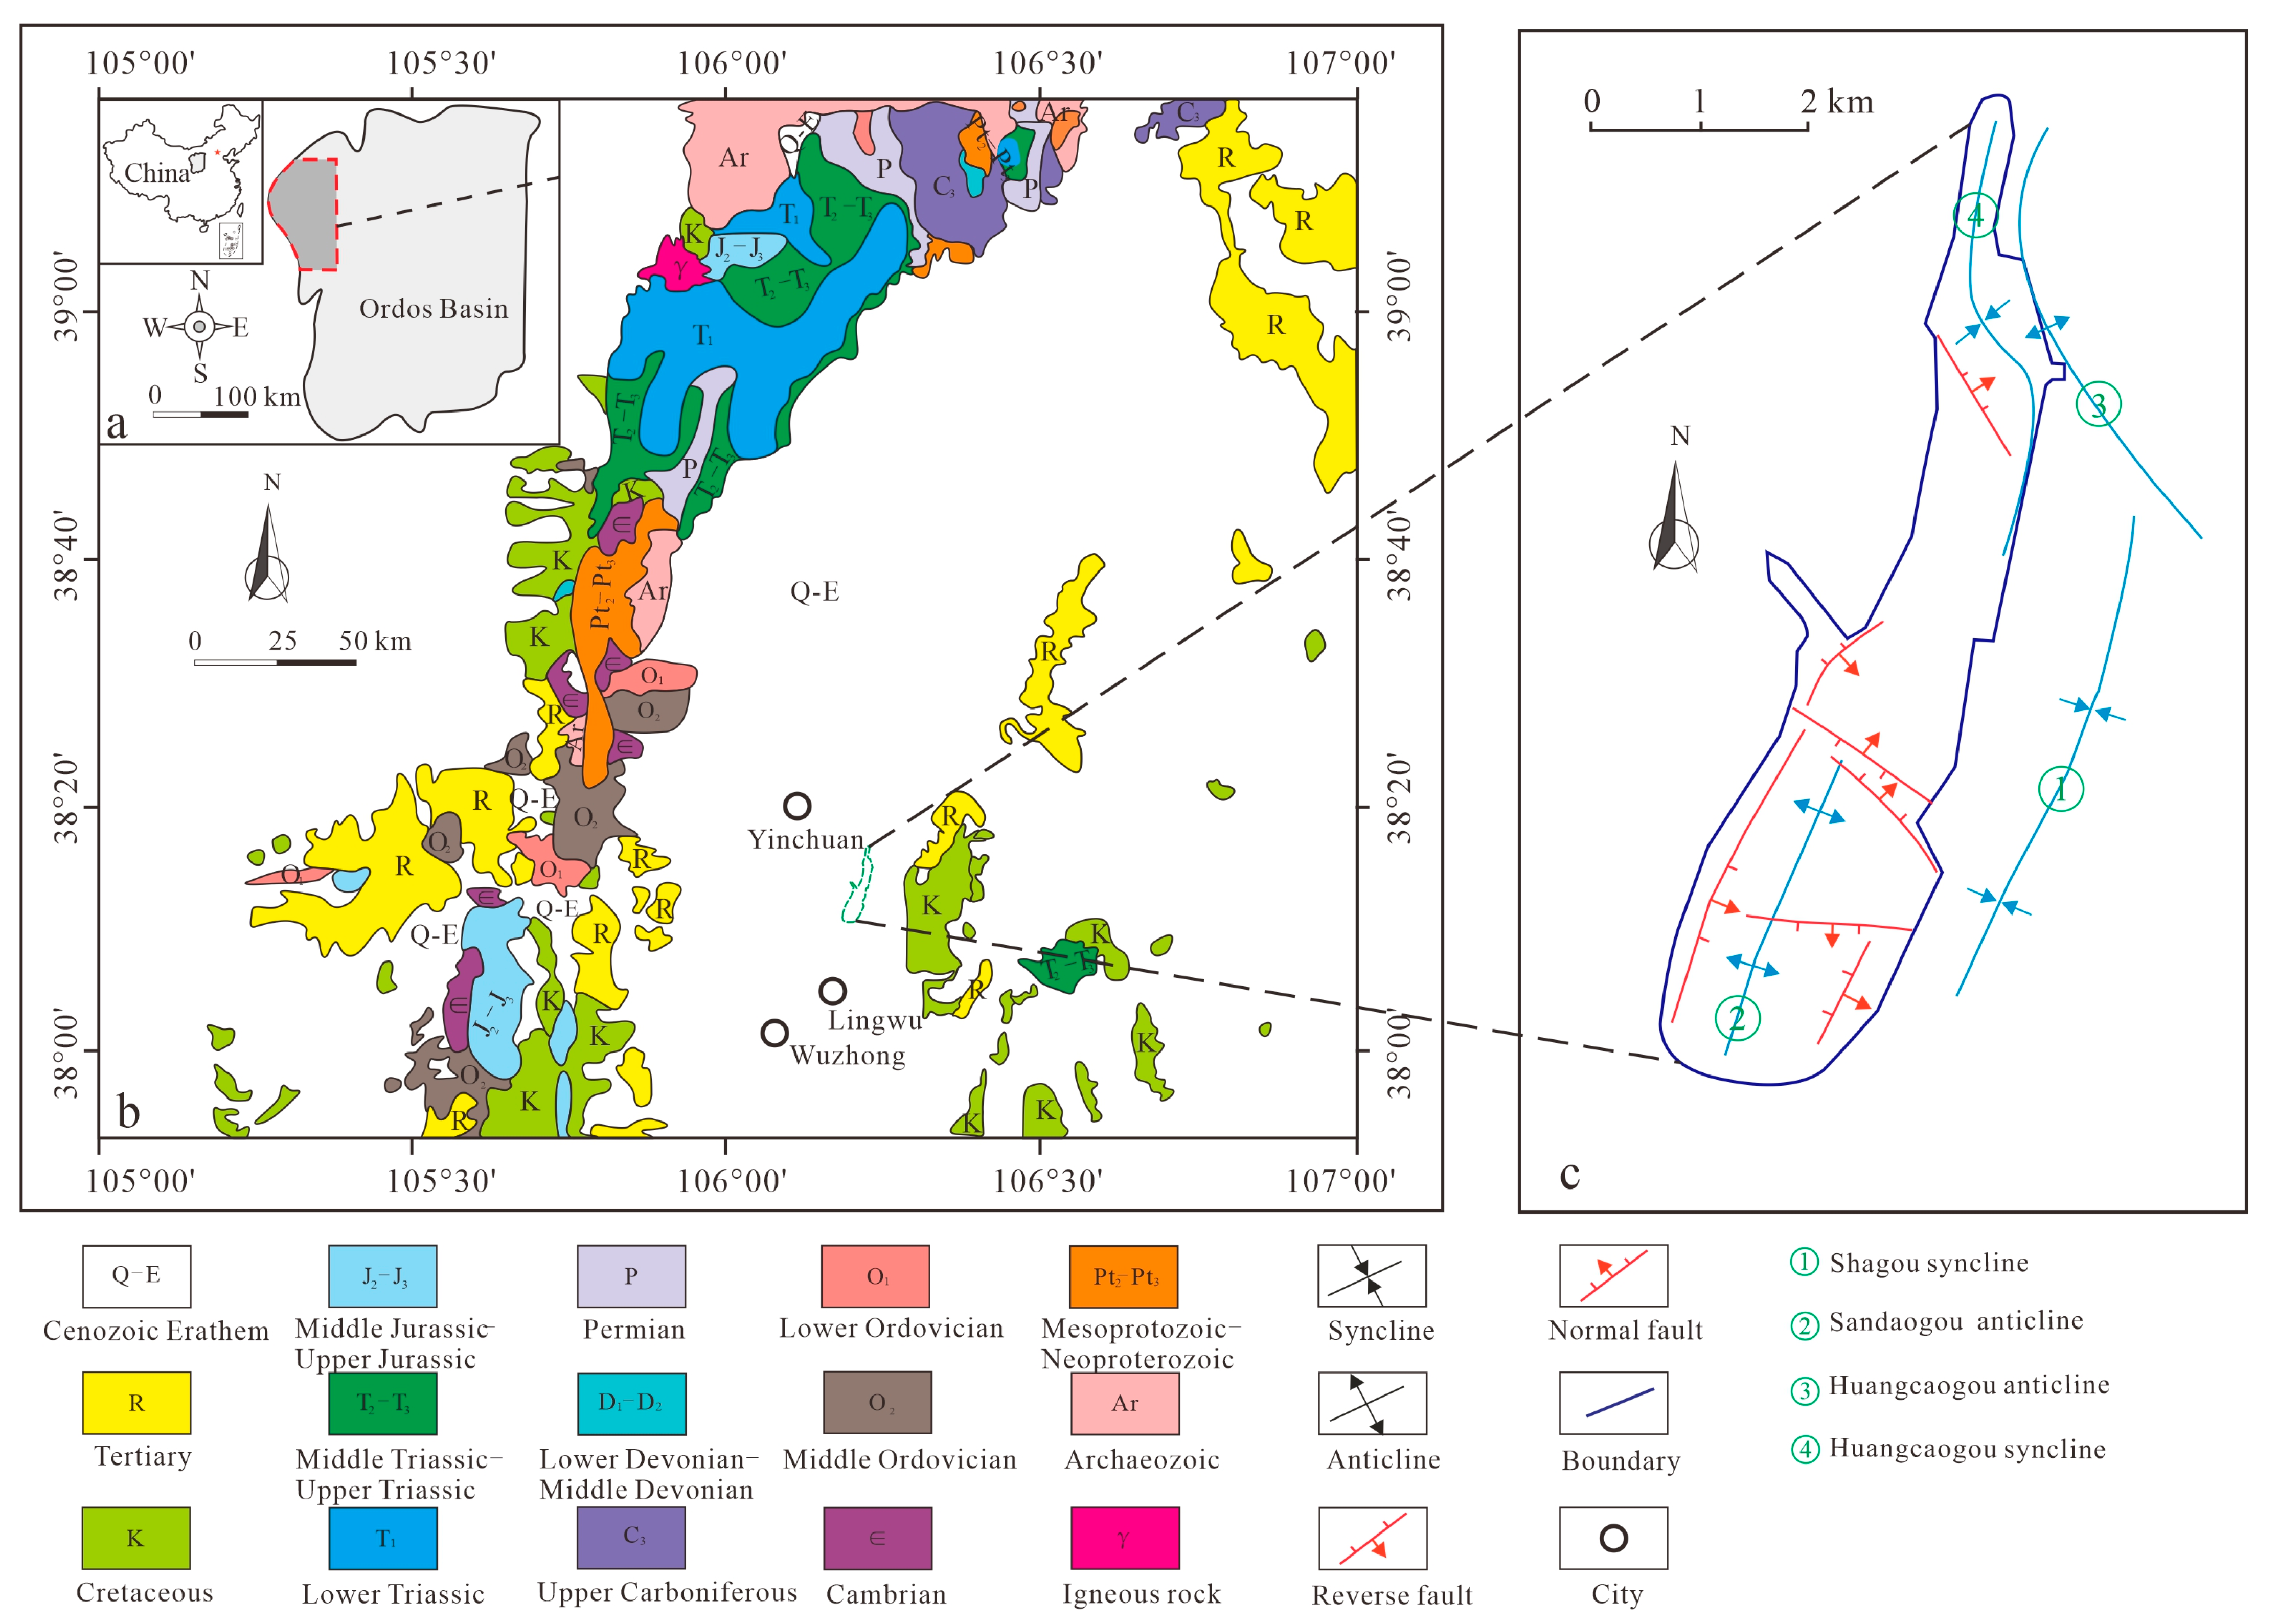
2. Geological Setting

3. Sampling and Methods
3.1. Sampling and Preparation
3.2. Experiments and Methods
4. Results
4.1. Coal Quality
4.2. Organic Petrography
4.3. Geochemistry
4.3.1. Main Elemental Oxides

| Samples | K2O | Na2O | SiO2 | Al2O3 | Fe2O3 | CaO | MgO | TiO2 | MnO2 | P2O5 | SiO2/Al2O3 | Al2O3/TiO2 |
|---|---|---|---|---|---|---|---|---|---|---|---|---|
| 3G-DN | 2.68 | 0.14 | 67.27 | 17.78 | 1.88 | 0.23 | 0.71 | 0.75 | 0.00 | 0.05 | 3.78 | 23.71 |
| T-H-1 | 0.07 | 0.05 | 11.85 | 10.12 | 0.46 | 0.54 | 0.61 | 0.19 | 0.01 | 0.01 | 1.17 | 53.26 |
| T-H-M | 0.03 | 0.02 | 3.72 | 3.12 | 0.33 | 4.29 | 0.90 | 0.11 | 0.04 | 0.01 | 1.19 | 28.36 |
| T-H-2 | 0.05 | 0.06 | 13.13 | 11.36 | 0.23 | 0.22 | 0.31 | 0.22 | 0.00 | 0.02 | 1.16 | 51.64 |
| Av | 0.05 | 0.05 | 9.56 | 8.20 | 0.34 | 1.68 | 0.61 | 0.18 | 0.02 | 0.01 | 1.17 | 45.56 |
| 3G-DE | 2.20 | 0.10 | 66.88 | 11.11 | 0.87 | 0.50 | 0.25 | 0.92 | 0.00 | 0.03 | 6.02 | 12.08 |
| 5G-DN | 2.33 | 0.15 | 67.24 | 16.80 | 2.72 | 0.45 | 0.62 | 1.12 | 0.03 | 0.12 | 4.00 | 15.00 |
| F-H-M | 0.01 | 0.04 | 10.33 | 9.25 | 0.08 | 0.19 | 0.24 | 0.28 | 0.00 | 0.01 | 1.12 | 33.04 |
| F-H-2 | 0.03 | 0.05 | 16.56 | 14.35 | 0.16 | 0.13 | 0.34 | 0.50 | 0.00 | 0.02 | 1.15 | 28.70 |
| Av | 0.02 | 0.05 | 13.45 | 11.80 | 0.12 | 0.16 | 0.29 | 0.39 | 0.00 | 0.02 | 1.14 | 30.26 |
| 5G-DE | 2.91 | 0.18 | 57.17 | 18.89 | 2.25 | 0.40 | 0.64 | 0.80 | 0.04 | 0.07 | 3.03 | 23.61 |
| 9G-DN | 2.38 | 0.11 | 56.55 | 24.72 | 2.03 | 0.34 | 0.89 | 0.96 | 0.11 | 0.15 | 2.29 | 25.75 |
| N-H-1 | 0.03 | 0.07 | 18.20 | 16.62 | 0.95 | 0.63 | 0.69 | 0.33 | 0.00 | 0.05 | 1.10 | 50.36 |
| N-H-2 | 0.04 | 0.07 | 17.66 | 15.91 | 0.59 | 0.26 | 0.43 | 0.37 | 0.00 | 0.07 | 1.11 | 43.00 |
| Av-D-R* | 0.01 | 0.03 | 5.67 | 5.14 | 0.57 | 0.52 | 0.23 | 0.12 | 0.00 | 0.08 | 0.90 | 46.73 |
| Av | 0.04 | 0.07 | 17.93 | 16.27 | 0.77 | 0.45 | 0.56 | 0.35 | 0.00 | 0.06 | 1.10 | 46.49 |
| 9G-DE | 1.39 | 0.02 | 77.82 | 11.25 | 1.28 | 0.17 | 0.40 | 0.94 | 0.01 | 0.03 | 6.92 | 11.97 |
| Av-non-coal | 2.32 | 0.12 | 65.49 | 16.76 | 1.84 | 0.35 | 0.59 | 0.92 | 0.03 | 0.08 | 4.34 | 18.69 |
| Chinese coala | 0.19 | 0.16 | 8.47 | 5.98 | 4.85 | 1.23 | 0.22 | 0.33 | 0.02 | 0.09 | 1.42 | 18.12 |
| NASCb | 3.99 | 1.15 | 64.80 | 16.90 | 5.70 | 3.56 | 2.85 | 0.78 | 0.06 | 0.11 | 3.83 | 21.67 |
4.3.2. Trace Elements
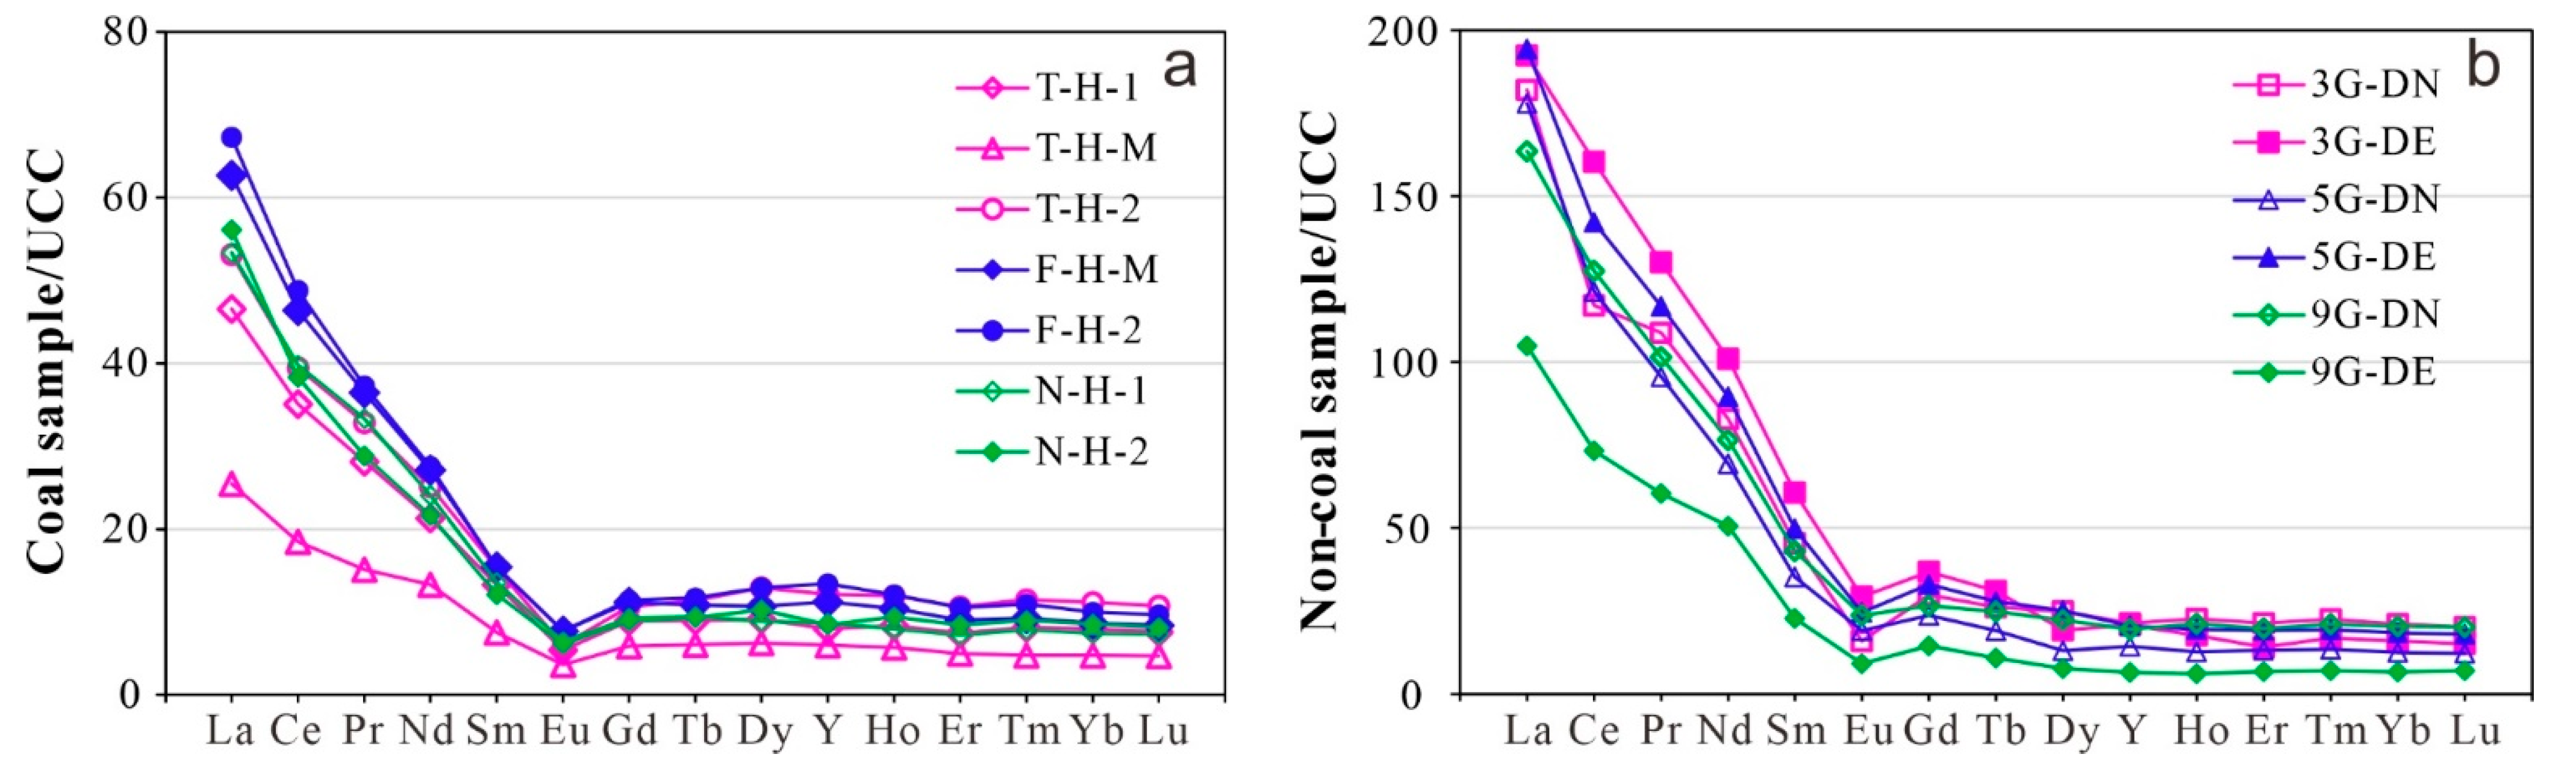
4.3.3. Distribution Pattern of Rare Earth Elements
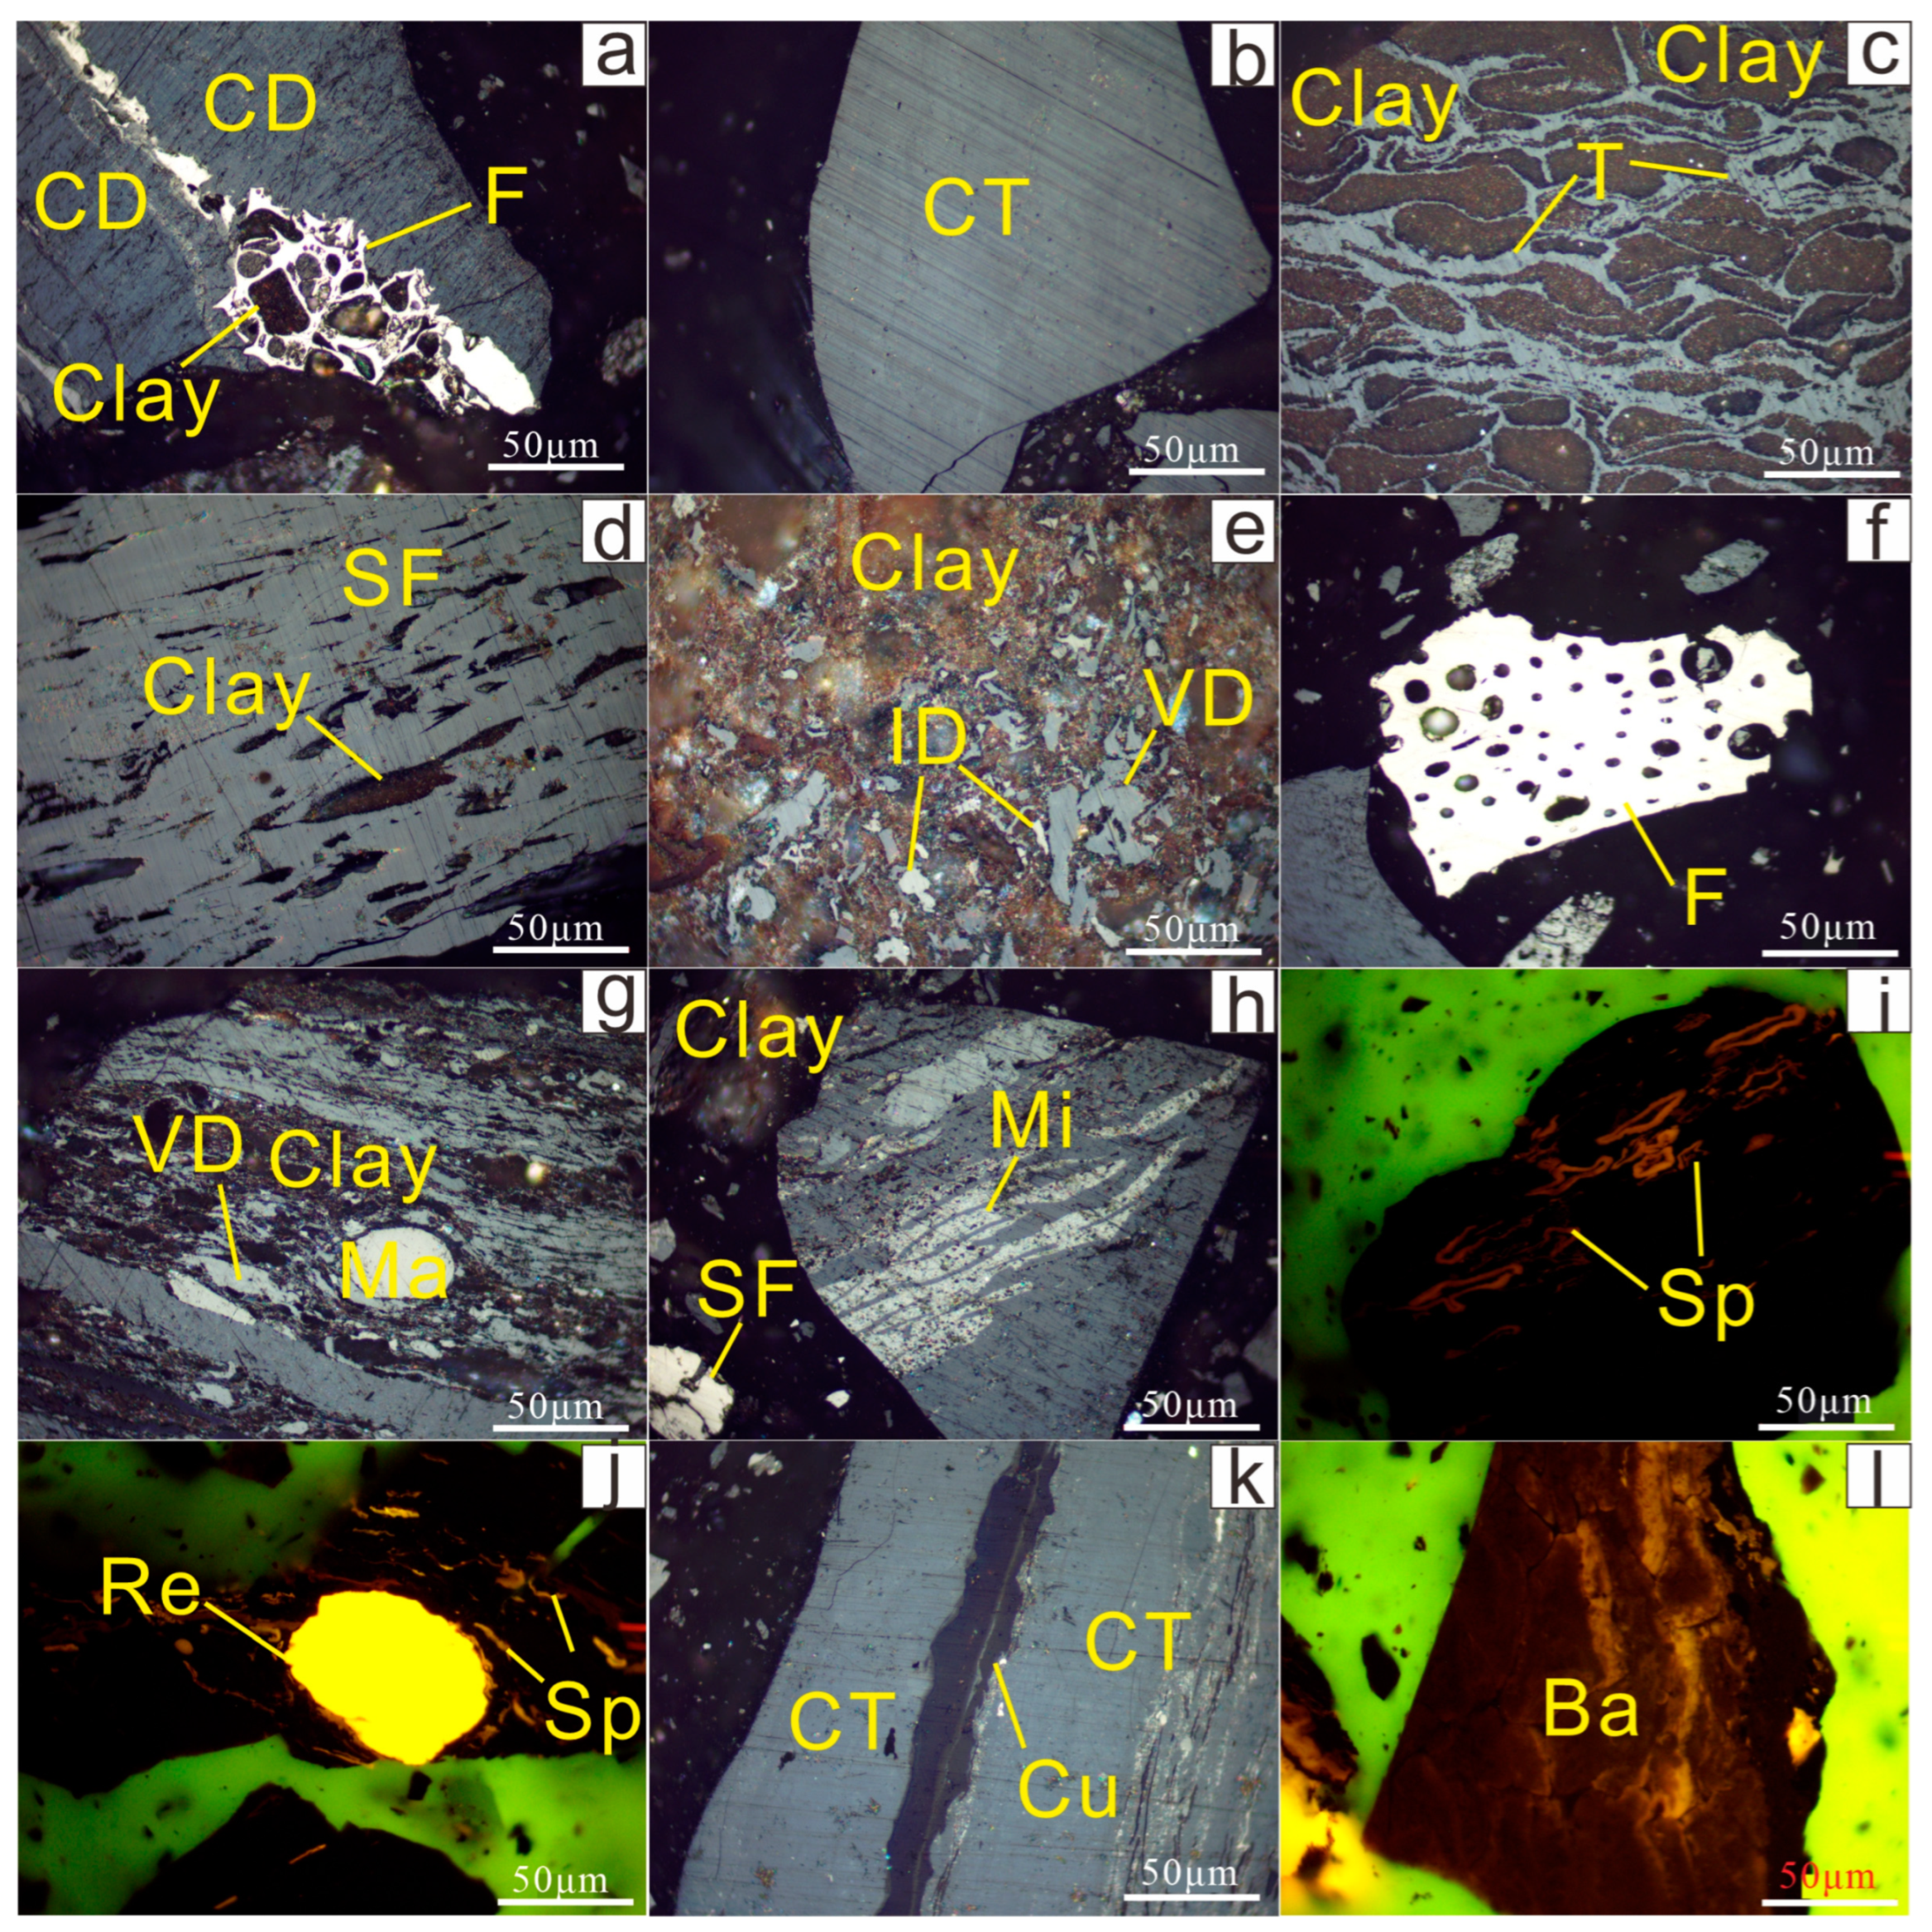
4.4. Minerals and Occurrence Modes
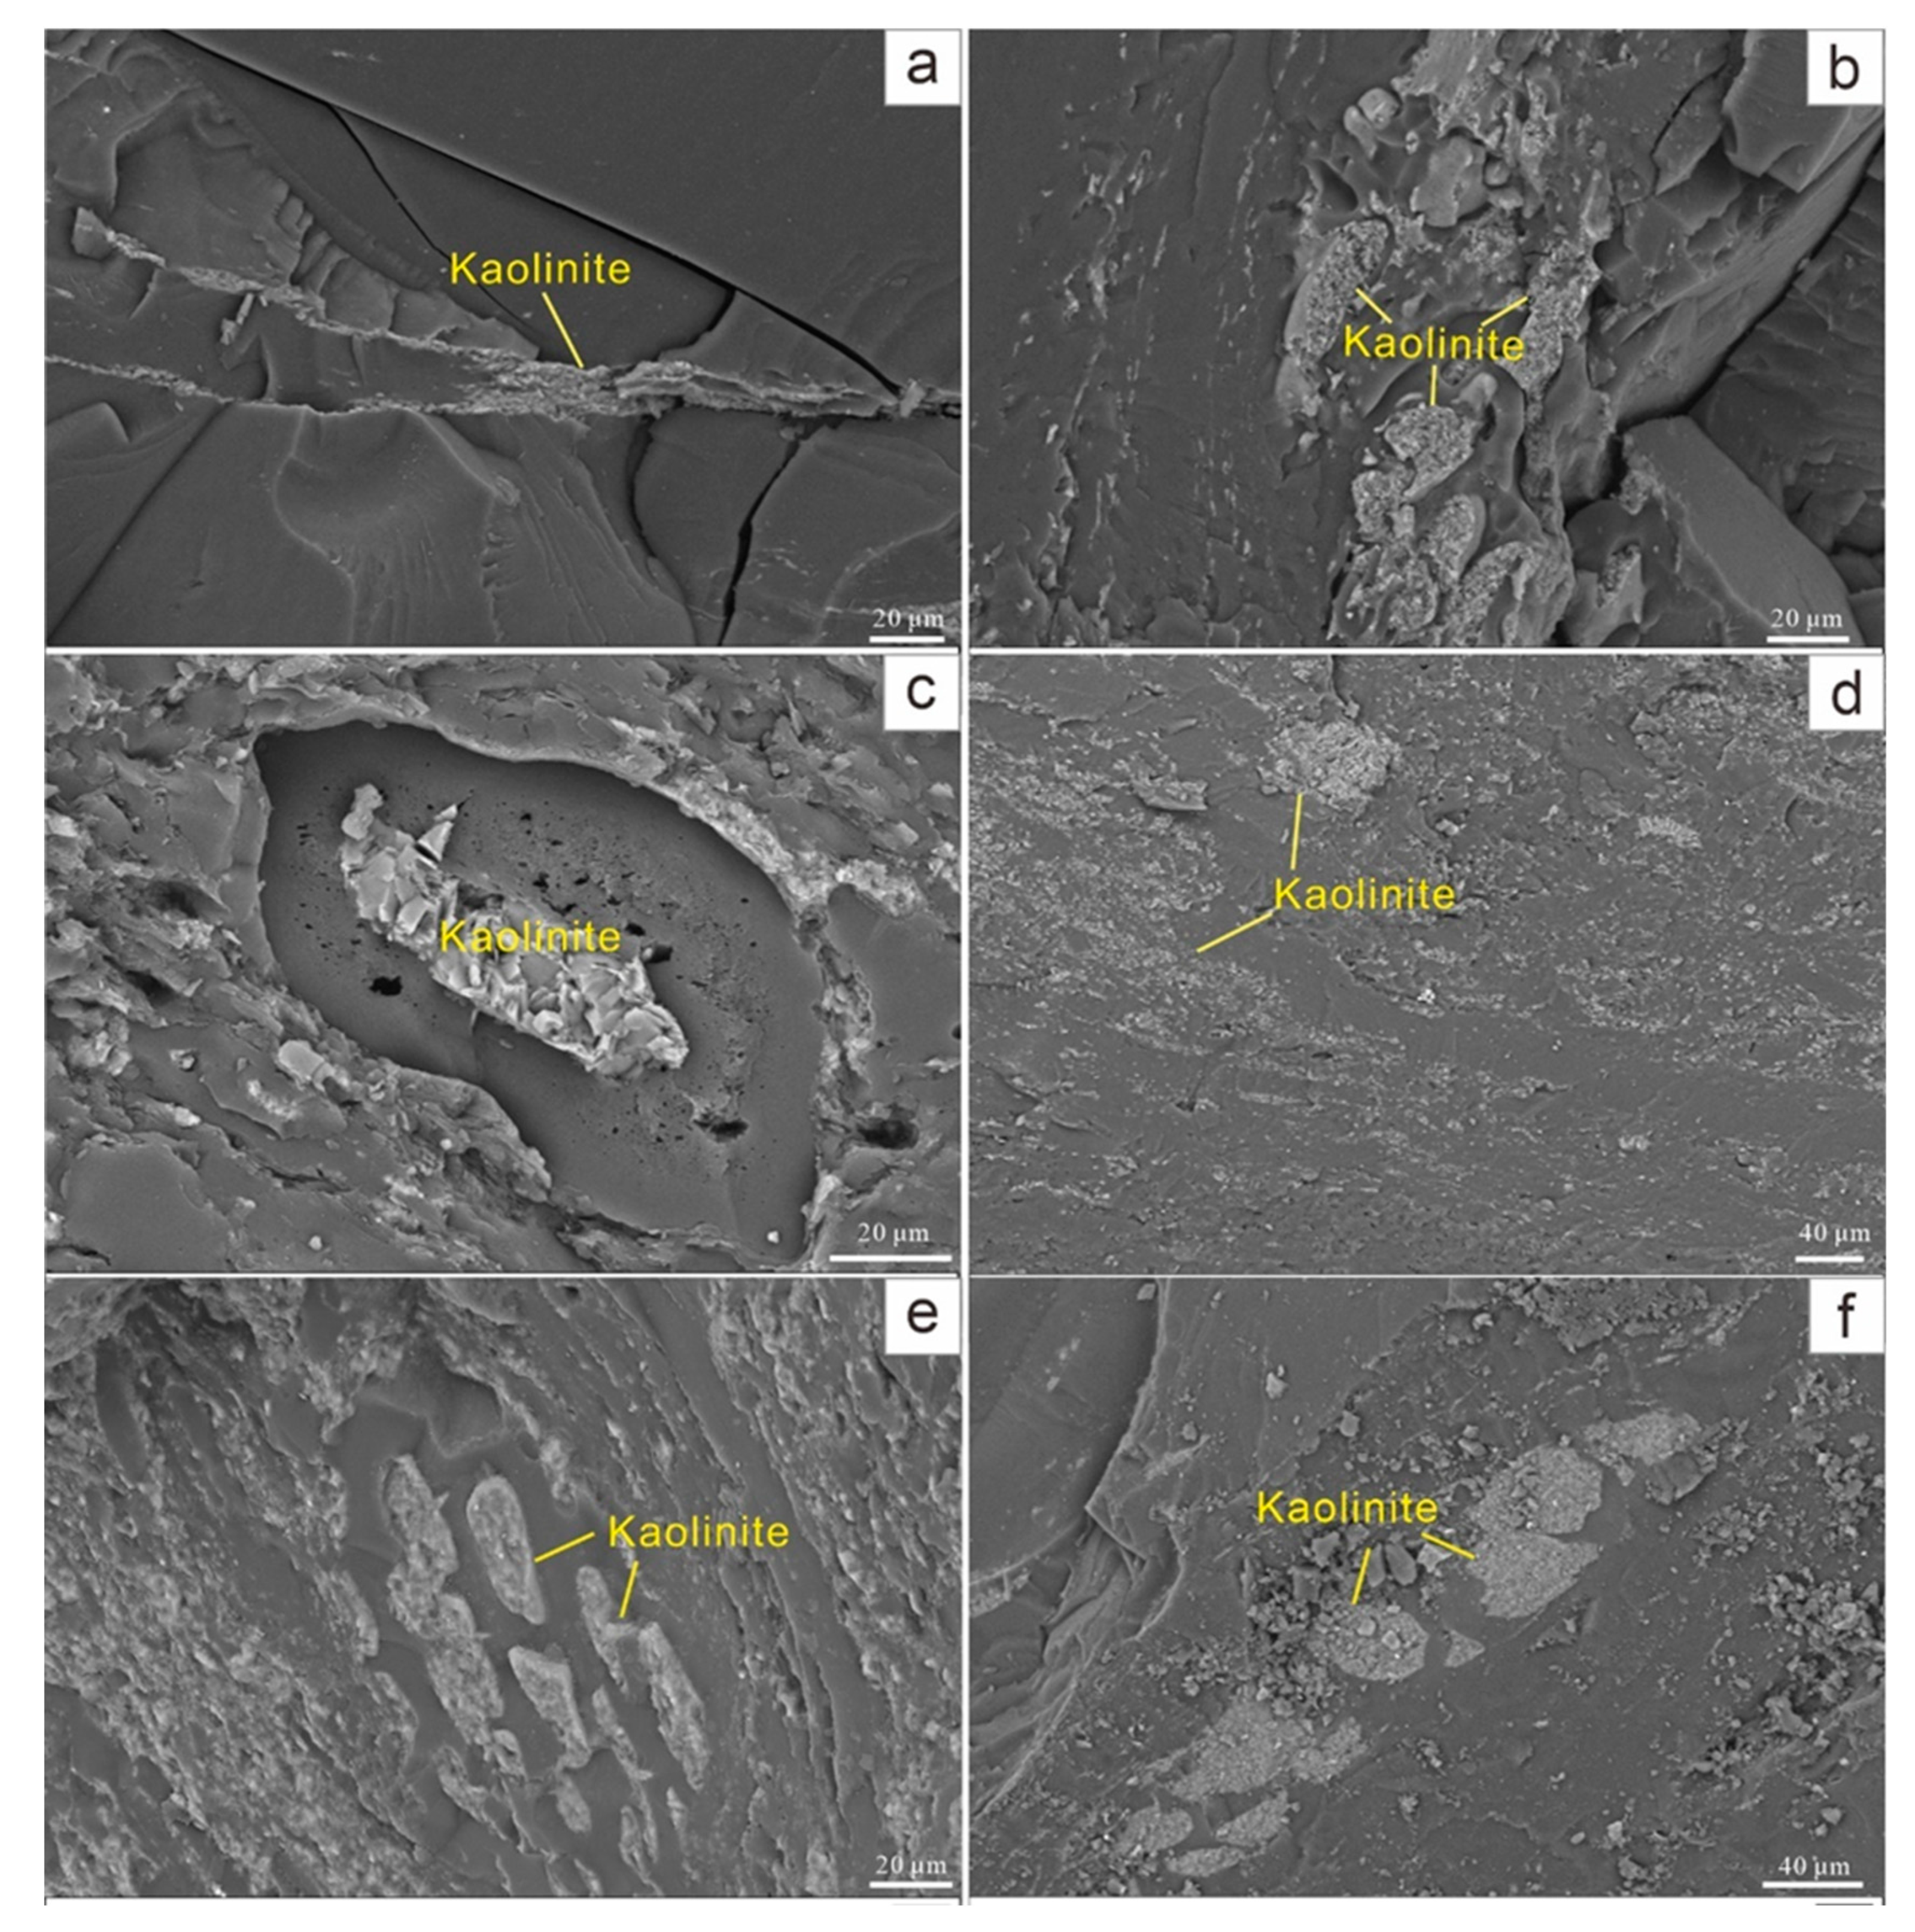
4.4.1. Clay Minerals
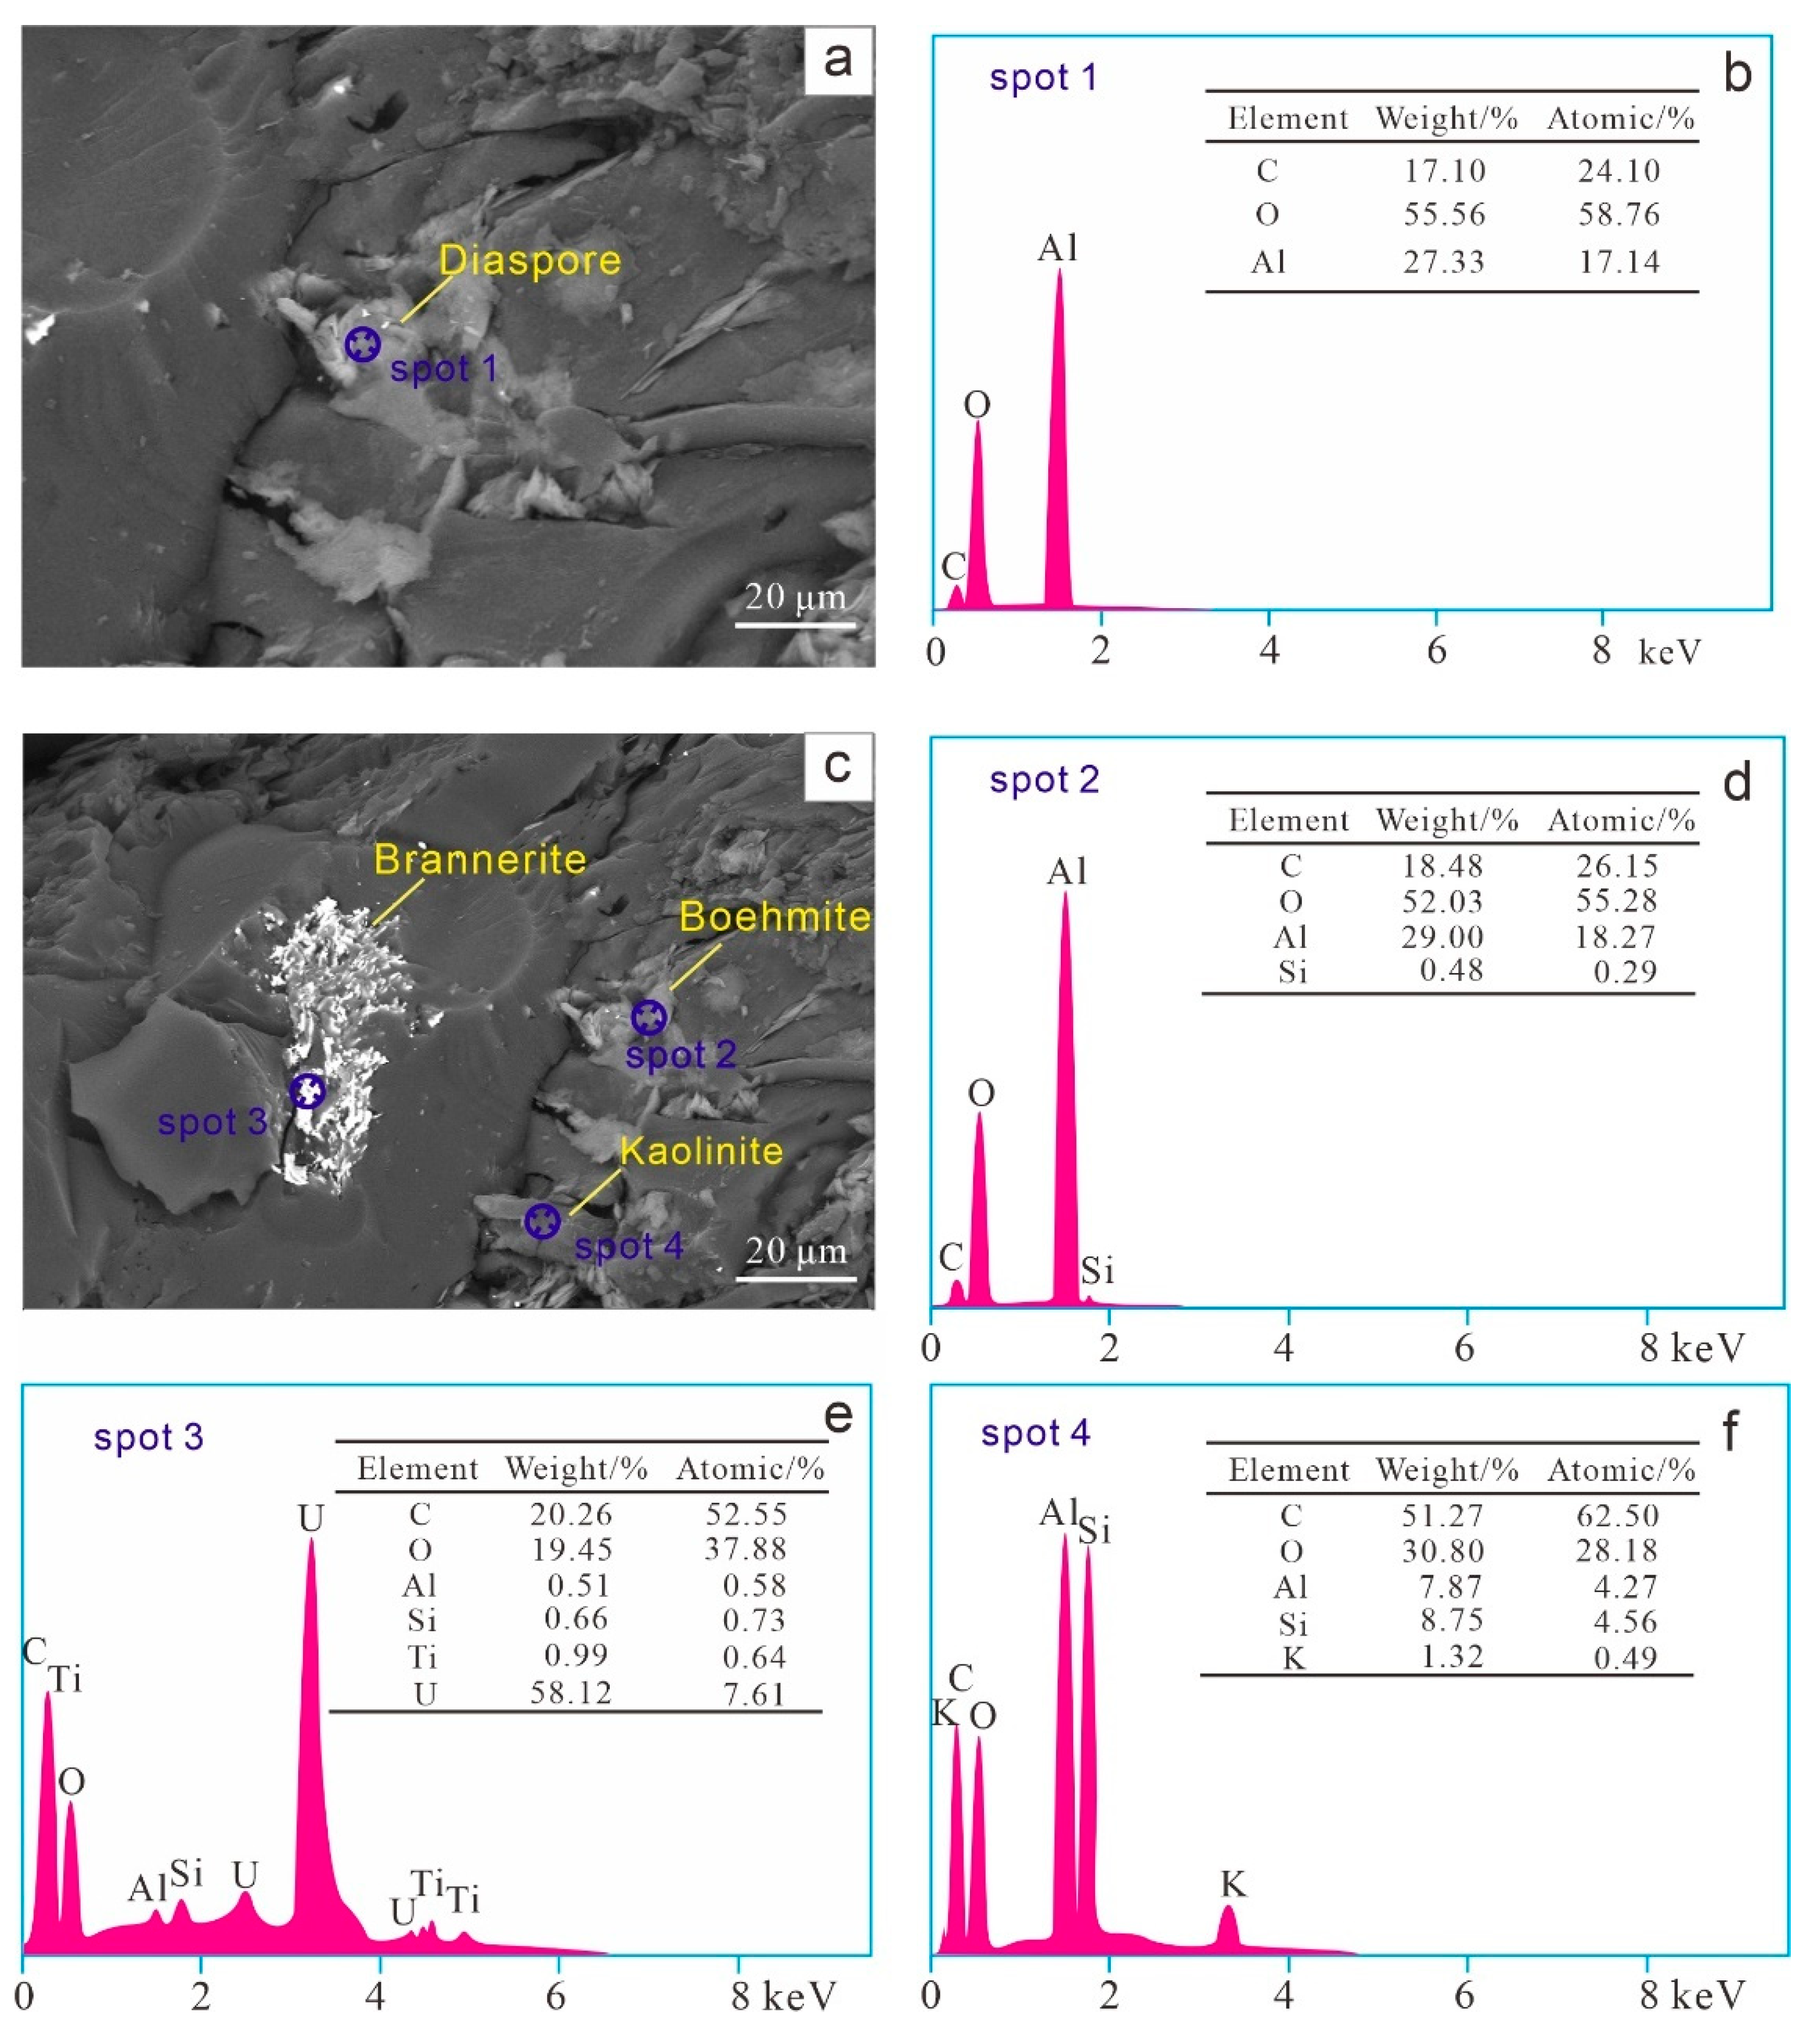
4.4.2. Al-Oxyhydroxide/Hydroxide Minerals
4.4.3. Pyrite
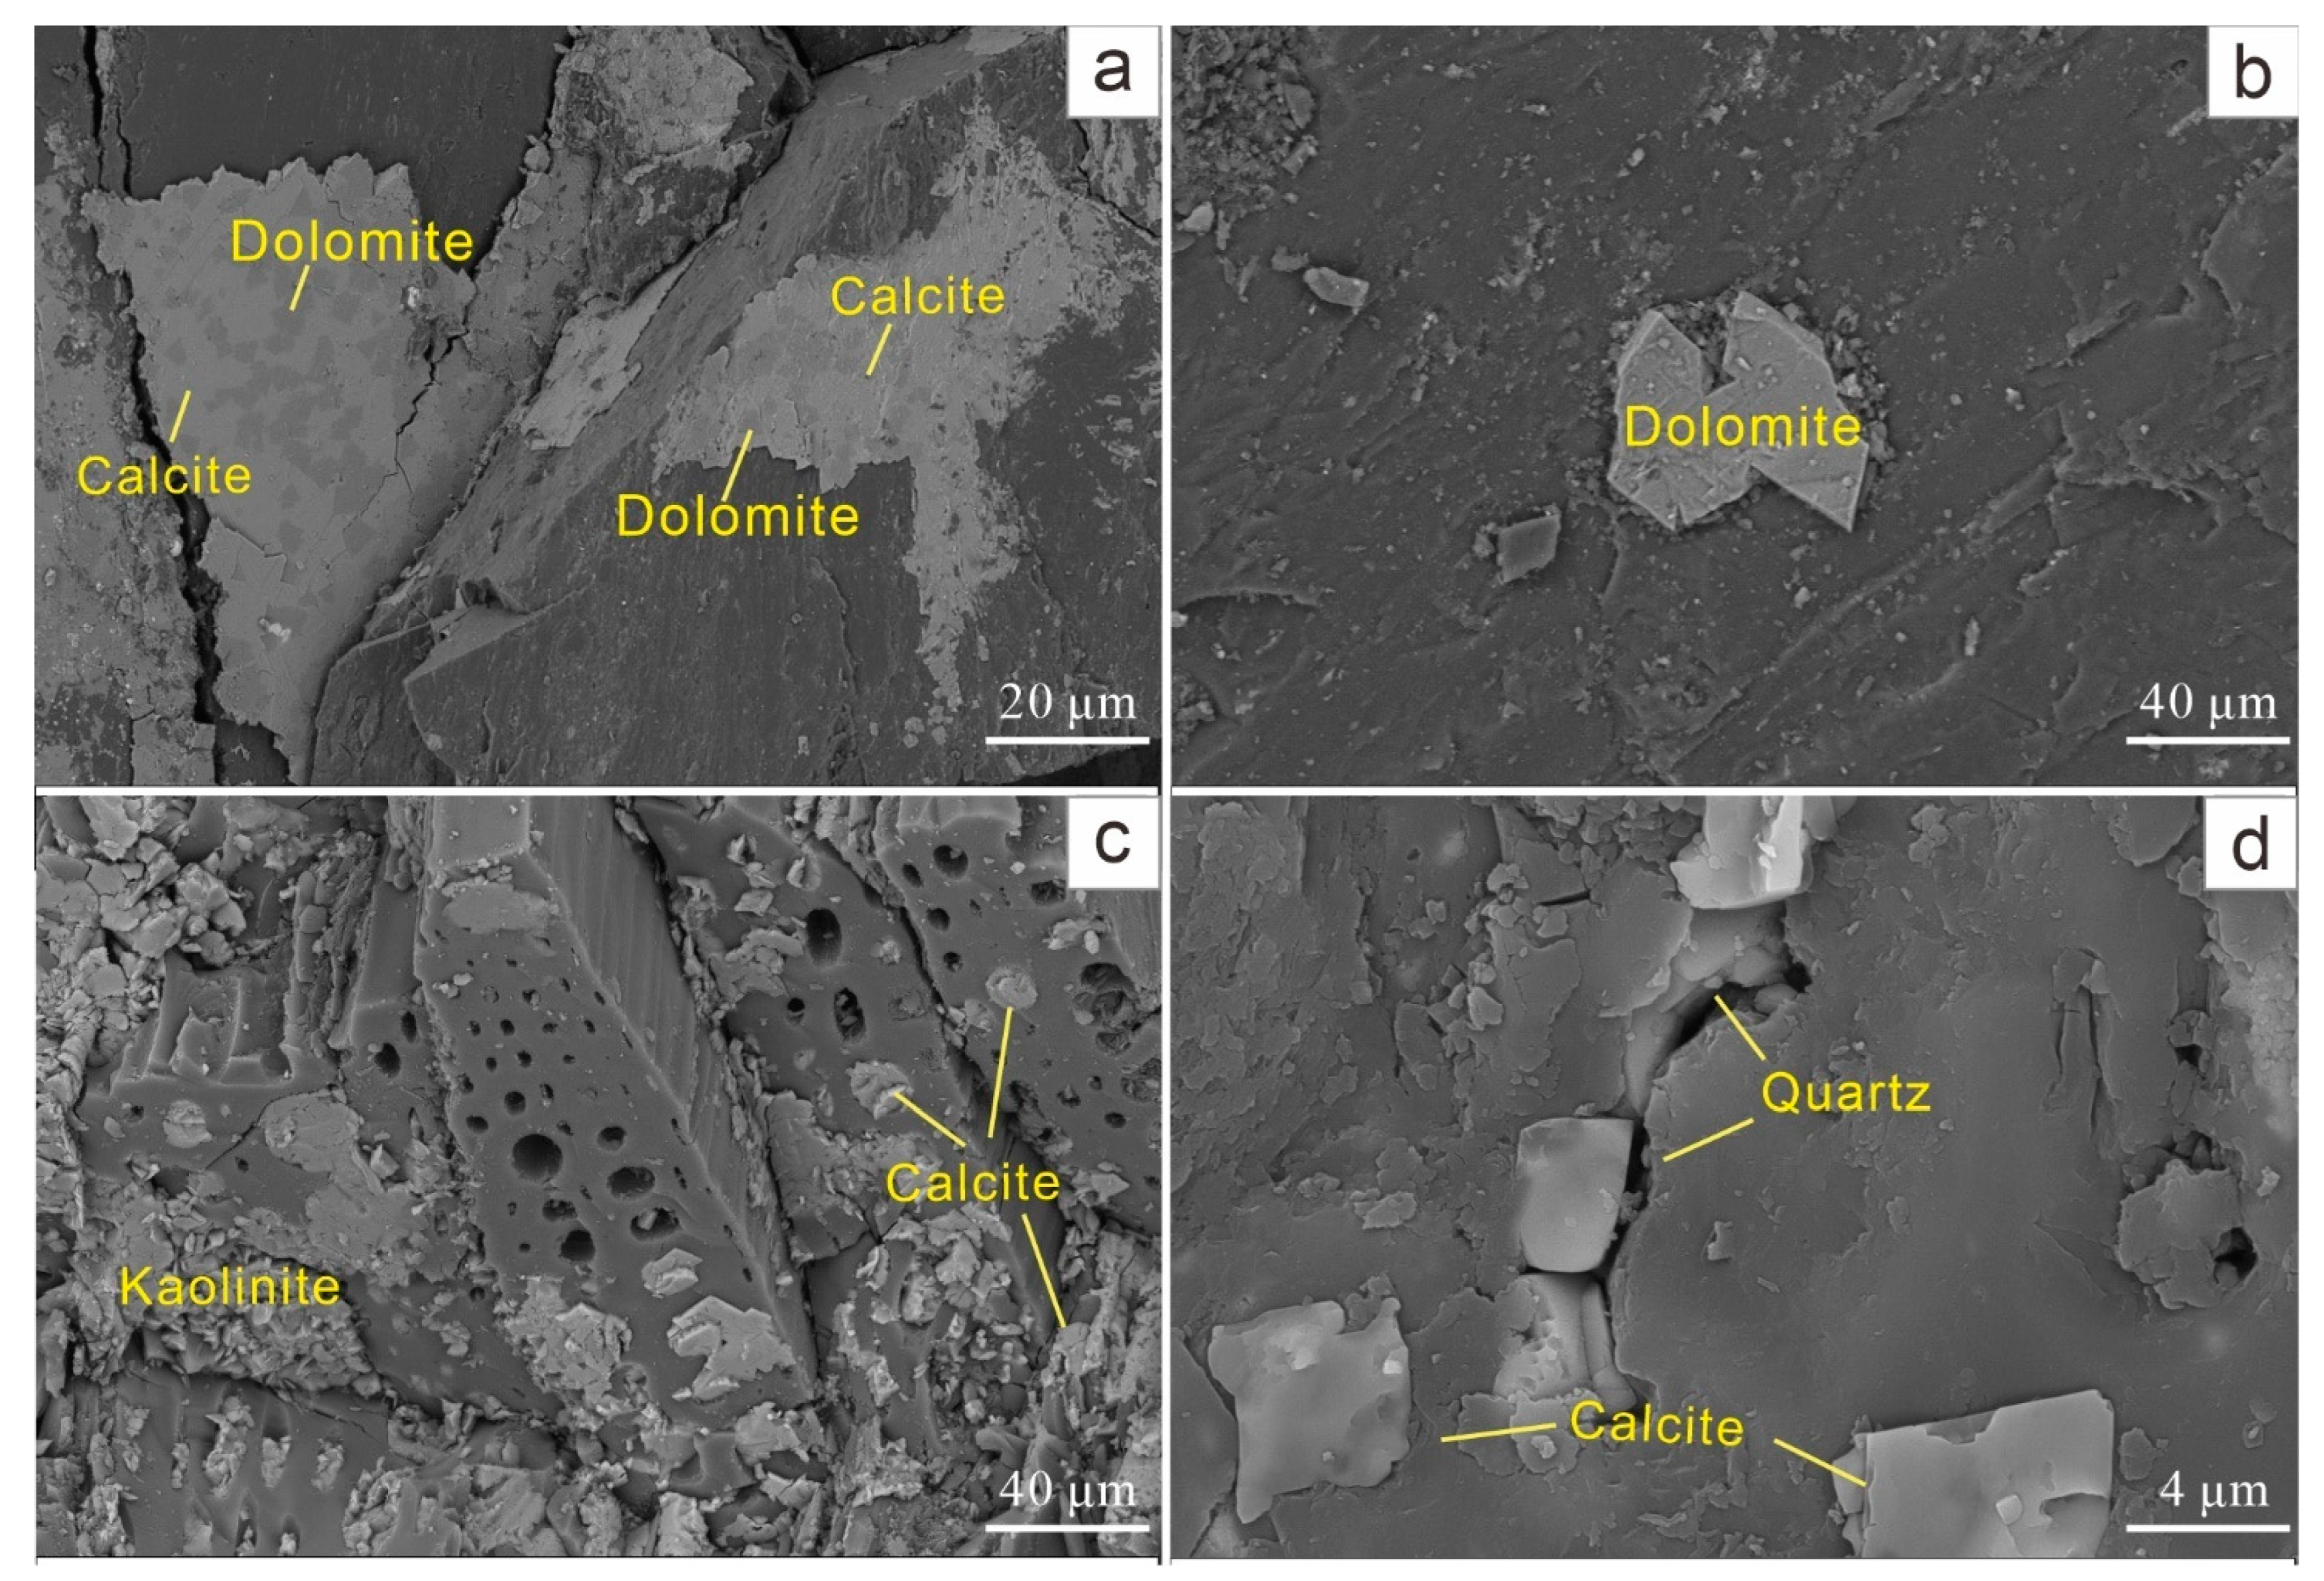
4.4.4. Calcite
4.4.5. Dolomite
4.4.6. Quartz
4.4.7. Other Minerals
5. Discussion
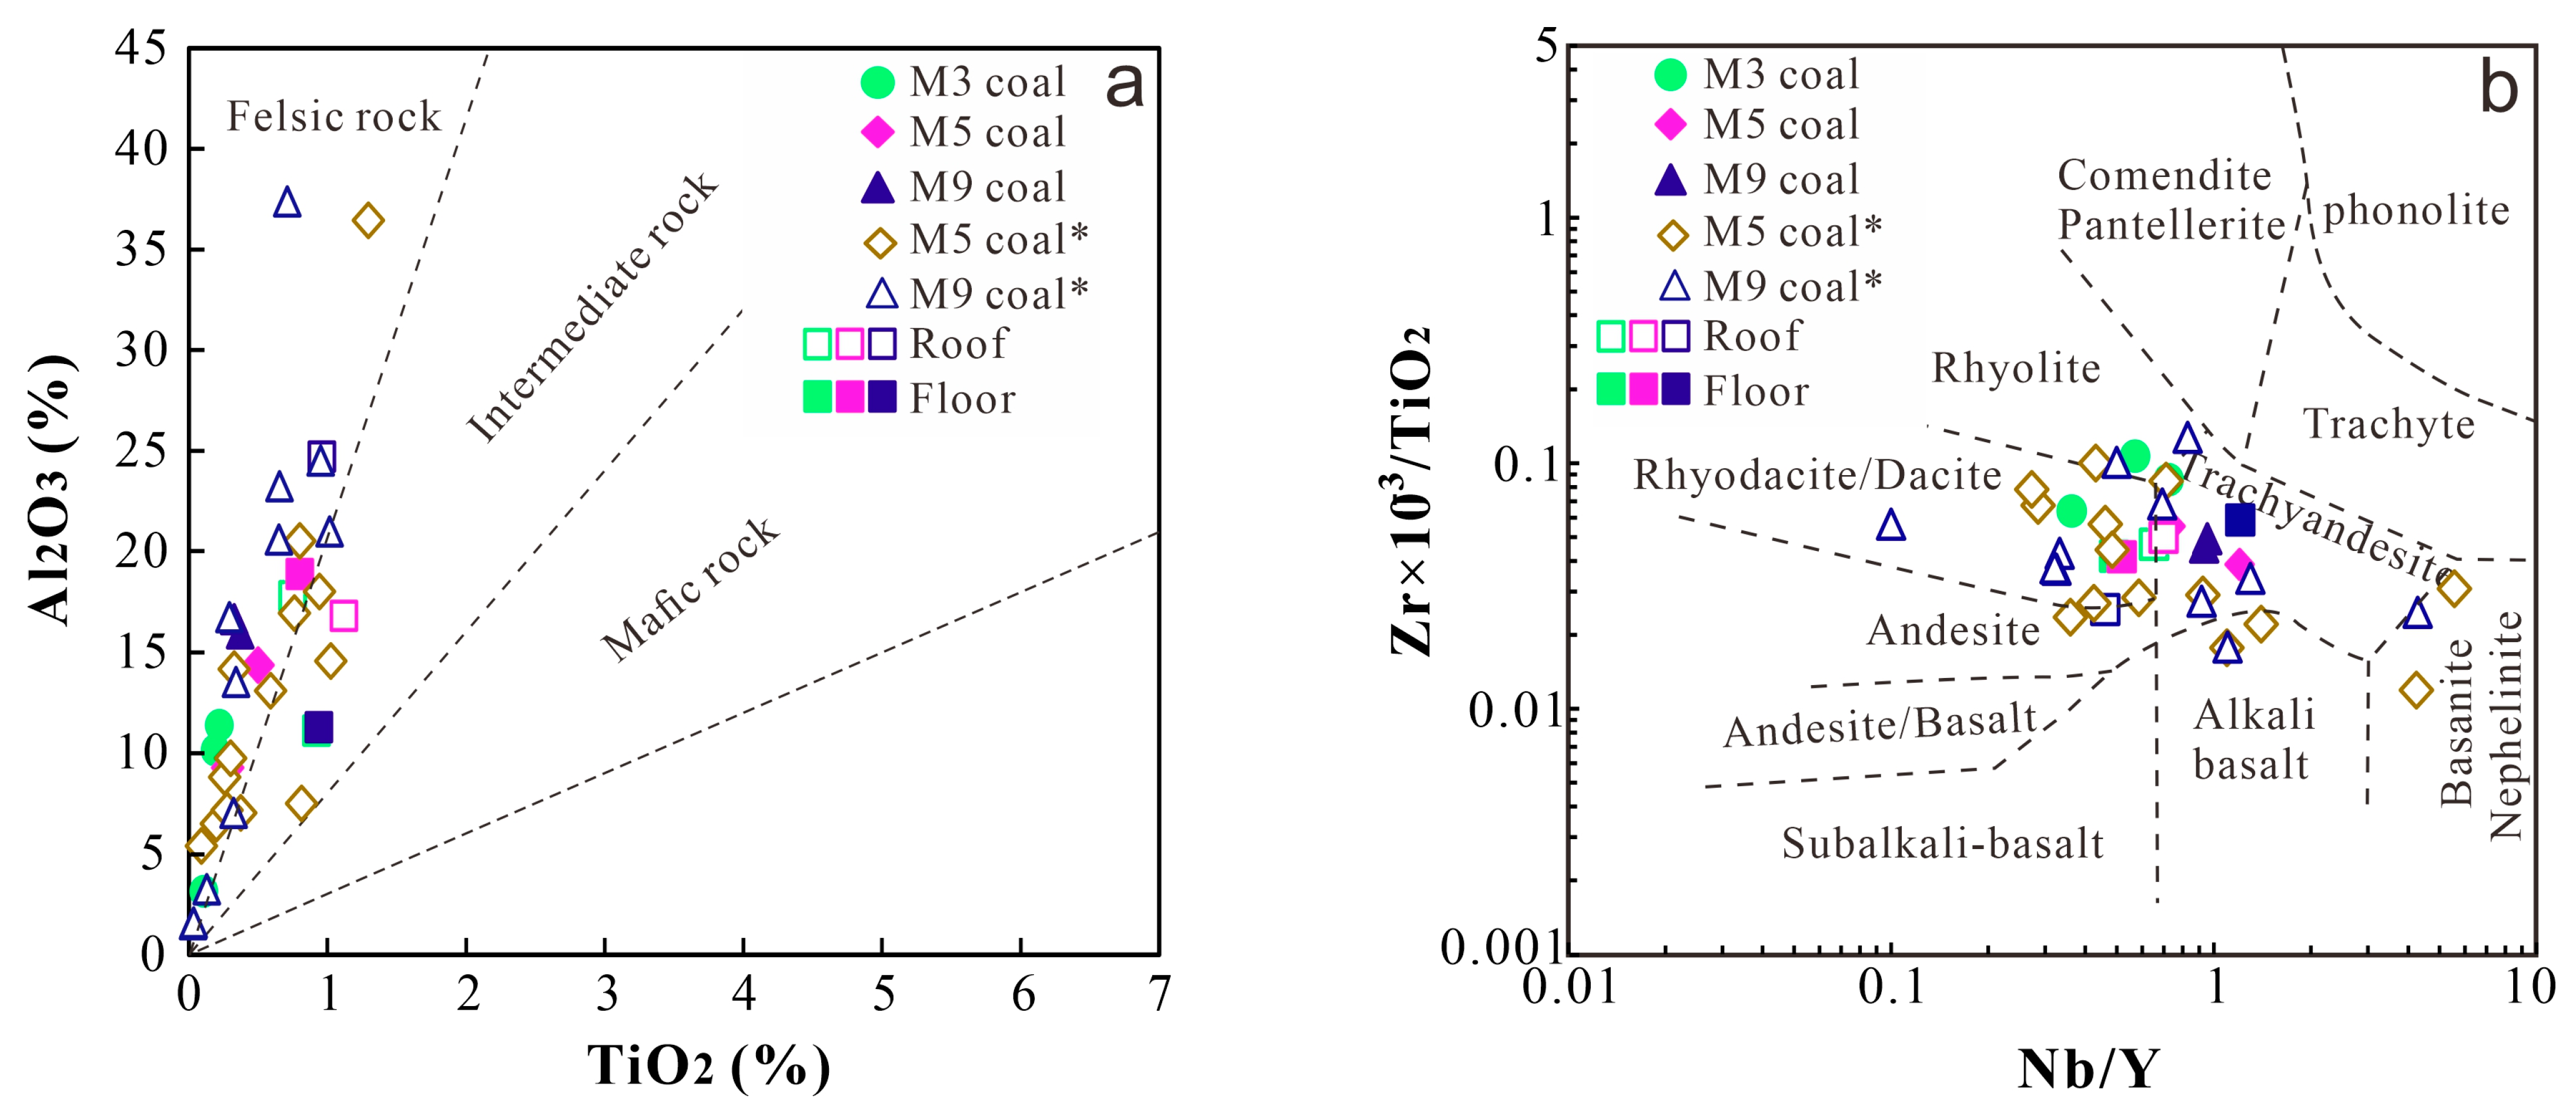
5.1. Sedimental Source
5.2. Paleopeat-Forming Environments
5.2.1. Depositional Environment
5.2.2. Oxidation–Reduction Environment
5.3. Occurrence Mode of Trace Elements
6. Conclusions
- (1)
- The M3, M5, and M9 coal samples were medium-rank bituminous coals (0.66%–0.85%). The M3 and M5 coal samples were classified as medium-ash (13.95%–33.07%), medium-high volatile (32.14%–39.15%), and low-sulfur (0.47%–0.67%) coals. The M9 coal samples were classified as high-ash (36.48%–38.82%), high-volatile (41.77%–42.33%), and medium-high sulfur (2.20%–2.33%) coals. Inertite was the major maceral with a content of up to 76.26% in M5 coal, and the main macerals of the M3 and M9 coal were vitrinite, with concentrations up to 78.50%. The main minerals of the three coal seams included dolomite, pyrite, feldspar, quartz, kaolinite, and calcite.
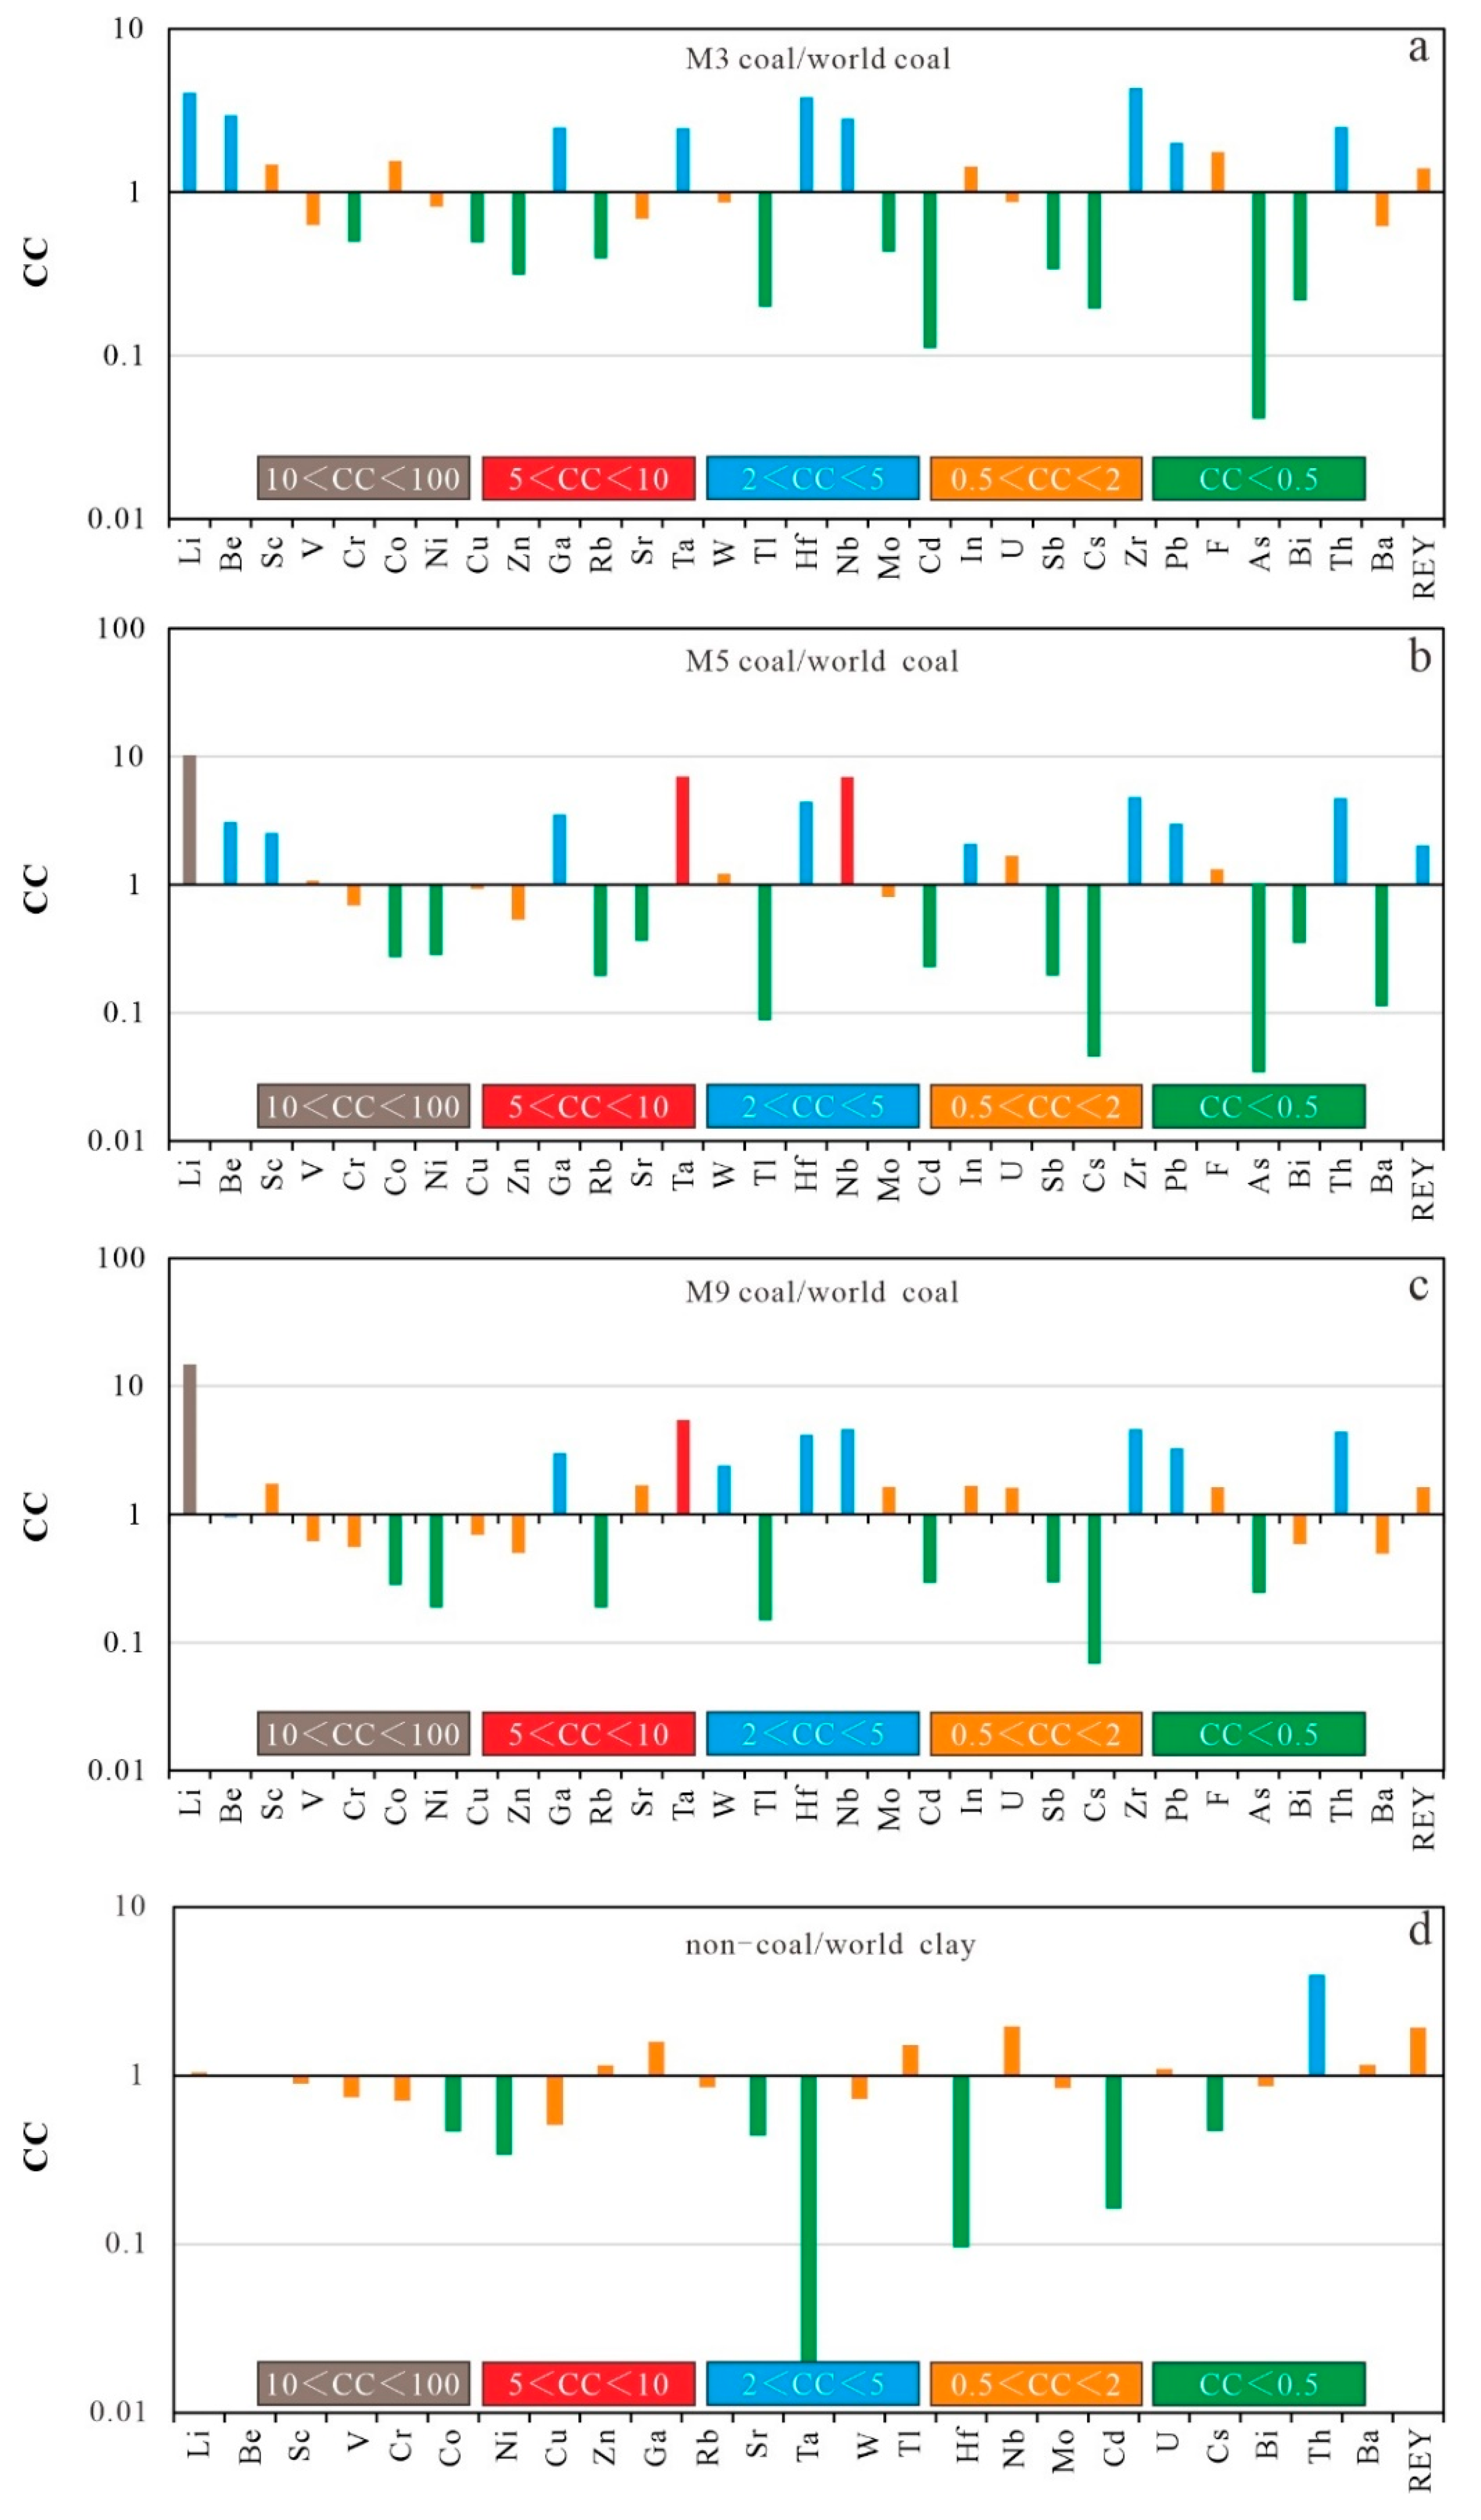
- (2)
- Compared to hard coal in the world, M3 coals were enriched in Be, Ta, Li, Hf, Ga, Nb, Zr, Th, and Pb, M5 coals were enriched in Li, Ta, Nb, Be, Sc, Ga, Hf, In, Zr, Pb, Th, and REY, whereas M9 coals were enriched in Ta, Li, Ga, Pb, W, Hf, Nb, Zr, and Th. The high correlation between Li, Ta, Hf, Nb, Zr, Pb, Th, and ash yield indicates the presence of inorganic affinity. Meanwhile, SiO2 was positively correlated with Al2O3, indicating their presence in aluminosilicates.
- (3)
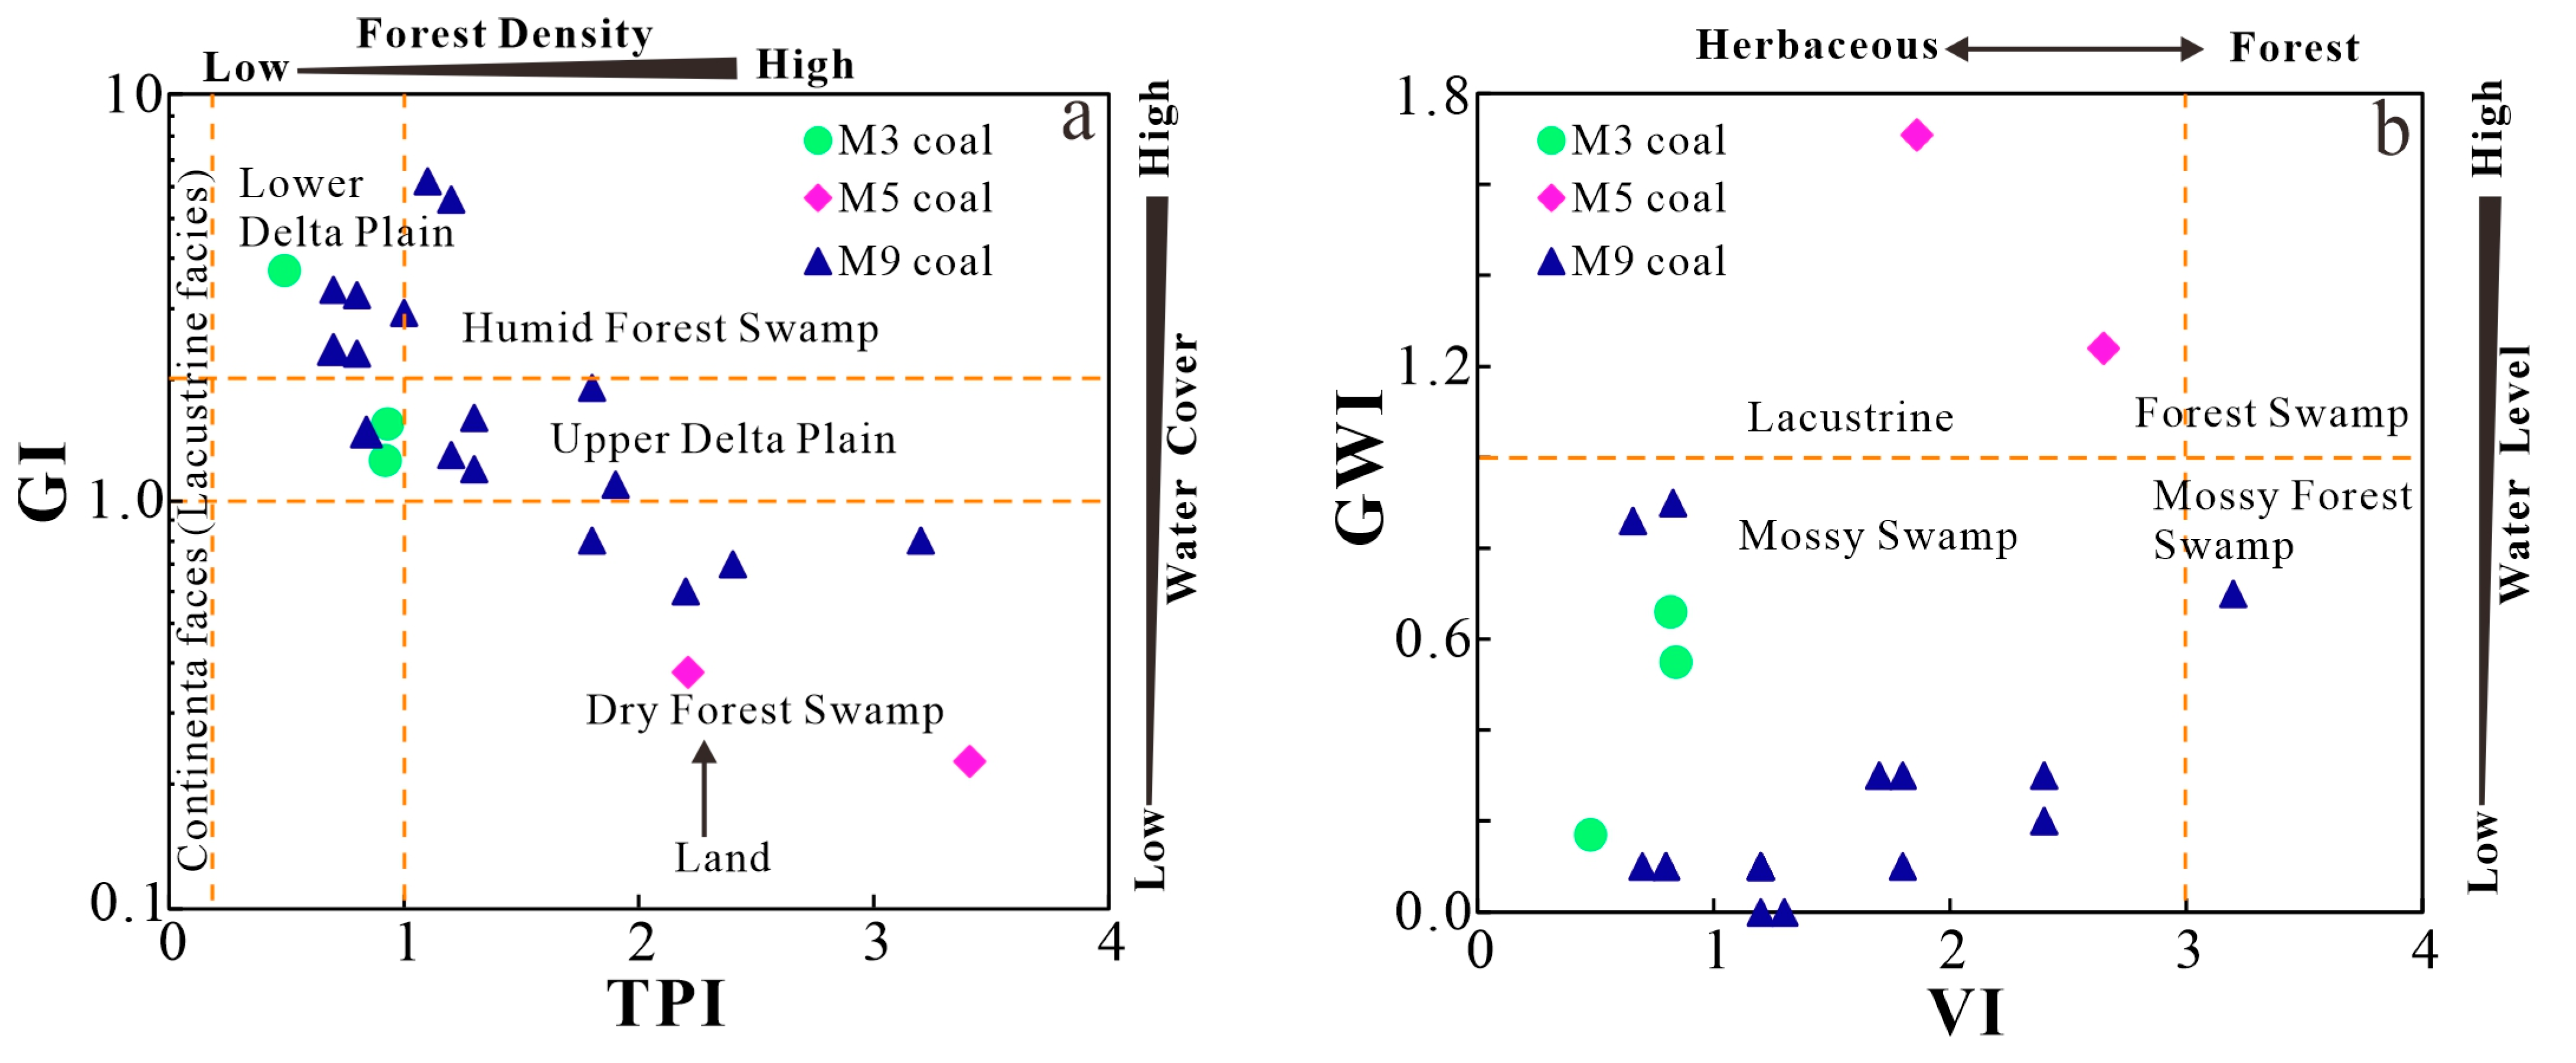
- Indicator parameters (GI, TPI, GWI, VI, V/I, Sr/Ba, Th/U, and CeN/CeN*) suggest that three coal seams are formed in different paleopeat environments: M3 is formed in a terrestrial and lower delta plain facies with weak oxidization–reduction, and M5 coal is formed in a dry forest swamp and terrestrial environment with weak oxidation–reduction, while M9 coal is formed in a seawater environment of humid forest swamps and the transition from the lower delta plain to continental sedimentation with weak oxidization–reduction. The geochemical indicators (TiO2 and Al2O3, Nb/Y and Zr × 0.0001/TiO2 ratios, and REY distribution patterns) reflect that the sediments of coal and non-coal samples are mainly sourced from felsic igneous rocks.
Author Contributions
Funding
Data Availability Statement
Acknowledgments
Conflicts of Interest
References
- Dai, S.; Seredin, V.V.; Ward, C.R.; Hower, J.C.; Xing, Y.; Zhang, W.; Song, W.; Wang, P. Enrichment of U-Se–Mo–Re–V in coals preserved within marine carbonate successions: Geochemical and mineralogical data from the Late Permian Guiding Coalfield, Guizhou, China. Miner. Depos. 2015, 50, 159–186. [Google Scholar] [CrossRef]
- Dai, S.; Yan, X.; Ward, C.R.; Hower, J.C.; Zhao, L.; Wang, X.; Zhao, L.; Ren, D.; Finkelman, R.B. Valuable elements in Chinese coals: A review. Int. Geol. Rev. 2016, 60, 590–620. [Google Scholar] [CrossRef]
- Hower, J.; Granite, E.; Mayfield, D.; Lewis, A.; Finkelman, R. Notes on contributions to the science of rare earth element enrichment in coal and coal combustion by products. Minerals 2016, 6, 32. [Google Scholar] [CrossRef]
- Kolker, A.; Scott, C.; Hower, J.C.; Vazquez, J.A.; Lopano, C.L.; Dai, S.F. Distribution of rare earth elements in coal combustion fly ash, determined by SHRIMP-RG ion microprobe. Int. J. Coal Geol. 2017, 184, 1–10. [Google Scholar] [CrossRef]
- Wagner, N.J.; Matiane, A. Rare earth elements in select Main Karoo Basin (South Africa) coal and coal ash samples. Int. J. Coal Geol. 2018, 196, 82–92. [Google Scholar] [CrossRef]
- Wang, X.; Wang, X.; Pan, Z.; Yin, X.; Chai, P.; Pan, S.; Yang, Q. Abundance and distribution pattern of rare earth elements and yttrium in vitrain band of high-rank coal from the Qinshui basin, Northern China. Fuel 2019, 248, 93–103. [Google Scholar] [CrossRef]
- Zhao, L.; Dai, S.; Nechaev, V.P.; Nechaeva, E.V.; Graham, I.T.; French, D.; Sun, J. Enrichment of critical elements (Nb-Ta-Zr-Hf-REE) within coal and host rocks from the Datanhao mine, Daqingshan Coalfield, northern China. Ore Geol. Rev. 2019, 111, 102951. [Google Scholar] [CrossRef]
- Zhao, L.; Dai, S.F.; Nechaev, V.P.; Nechaev, E.V.; Grahanm, I.T.; French, D. Enrichment origin of critical elements (Li and rare earth elements) and a Mo-U-Se-Re assemblage in Pennsylvanian anthracite from the Jincheng Coalfield, Southeastern Qinshui Basin, northern China. Ore Geol. Rev. 2019, 115, 103184. [Google Scholar] [CrossRef]
- Arbuzov, S.I.; Chekryzhov, I.Y.; Finkelman, R.B.; Sun, Y.Z.; Zhao, C.L.; Ilenok, S.; Blokhin, M.G.; Zarubina, N.V. Comments on the geochemistry of rare-earth elements (La, Ce, Sm, Eu, Tb, Yb, Lu) with examples from coals of North Asia (Siberia, Russian far East, North China, Mongolia, and Kazakhstan). Int. J. Coal Geol. 2019, 206, 106–120. [Google Scholar] [CrossRef]
- Michard, A. Rare earth element systematics in hydrothermal fluids. Geochim. Cosmochim. Acta 1989, 53, 745–750. [Google Scholar] [CrossRef]
- Hower, J.C.; Wagner, N.J.; O'Keefe, J.M.K.; Drew, J.W.; Stucker, J.D.; Richardson, A.R. Maceral types in some Permian Southern African coals. Int. J. Coal Geol. 2012, 100, 93–107. [Google Scholar] [CrossRef]
- Kolker, A.; Hower, J.C.; Karamalidis, A.K. Introduction to critical elements in coal and coal ash and their recovery, a virtual special issue. Int. J. Coal Geol. 2019, 206, 19–20. [Google Scholar] [CrossRef]
- Liu, B.J.; Wang, J.Y.; He, H.T.; Mishra, V.; Li, Y.; Wang, J.; Zhao, C. Geochemistry of Carboniferous coals from the Laoyaogou mine, Ningwu coalfield, Shanxi Province, Northern China: Emphasis on the enrichment of valuable elements. Fuel 2020, 279, 118414. [Google Scholar] [CrossRef]
- Dai, S.; Bechtel, A.; Eble, C.F.; Flores, R.M.; French, D.; Graham, I.T.; Hood, M.M.; Hower, J.C.; Korasidis, V.A.; Moore, T.A.; et al. Recognition of peat depositional environments in coal: A review. Int. J. Coal Geol. 2020, 210, 103383. [Google Scholar]
- Dai, S.; Zou, J.; Jiang, Y.; Ward, C.; Wang, X.; Li, T.; Xue, W.; Liu, S.; Tian, H.; Sun, X.; et al. Mineralogical and geochemical compositions of the Pennsylvanian coal in the Adaohai Mine, Daqingshan Coalfield, Inner Mongolia, China: Modes of occurrence and origin of diaspore, gorceixite, and ammonian illite. Int. J. Coal Geol. 2012, 94, 250–270. [Google Scholar] [CrossRef]
- Sun, Y.; Zhao, C.; Qin, S.; Xiao, L.; Li, Z.; Lin, M. Occurrence of some valuable elements in the unique “high-aluminium coals” from the Jungar coalfield. China. Ore Geol. Rev. 2016, 72, 659–668. [Google Scholar] [CrossRef]
- Zhang, J.S.; Jin, C.; Xing, L.; He, H.; Zhao, Y.; Xin, Y.; Xu, Y.; Zhao, C.; Sun, P. Mineralogy and geochemistry of the coal seam of Shanxi Formation in Guotun Mine, Juye Coalfield, North China. Energy Explor. Exploit. 2019, 37, 1779–1803. [Google Scholar] [CrossRef]
- Shao, P.; Hou, H.J.; Wang, W.L.; Qin, K.M.; Wang, W.F. Distribution and enrichment of Al-Li-Ga-REEs in the High-Alumina coal of the Datong Coalfield, Shanxi Province, China. Ore Geol. Rev. 2022, 140, 104597. [Google Scholar] [CrossRef]
- Yuan, D.; Wang, X.; Yan, D.; Li, J.; Li, B.; Liu, B.; Liu, Z.; Zhang, L. An original set of nanometer-scale mineralogical analyses of cookeite and the implications for Li enrichment: No. 21 coal, Mengjin Mine, western Henan. Int. J. Coal Geol. 2024, 283, 104445. [Google Scholar] [CrossRef]
- Qin, G.; Cao, D.; Wei, Y.; Wang, A.; Liu, J. Mineralogy and geochemistry of the M5-2 high-sulfur coal from the Dongpo Mine, Weibei Coalfield, Shaanxi, North China, with emphasis on anomalies of gallium and lithium. Minerals 2019, 9, 402. [Google Scholar] [CrossRef]
- Bai, Y.; Wang, X.; Liu, H.; Li, T. Determination of the borderline of the Western Ordos Basin and its geodynamics background. Acta Geol. Sin. 2006, 80, 792–813. [Google Scholar]
- Dai, S.; Ren, D.; Chou, C.; Li, S.; Jiang, Y. Mineralogy and geochemistry of the M6 Coal (Pennsylvanian) in the Junger Coalfield, Ordos Basin, China. Int. J. Coal Geol. 2006, 66, 253–270. [Google Scholar] [CrossRef]
- Liu, Z.F.; Wei, Y.C.; Ning, S.Z.; Jia, X.; Qin, R.F.; Cao, D. The differences of element geochemical characteristics of the main coal seams in the Ningdong coalfield, Ordos Basin. J. Geochem. Explor. 2019, 202, 77–91. [Google Scholar]
- Qin, G.; Cao, D.; Wei, Y.; Wang, A.; Liu, J. Geochemical characteristics of the Permian coals in the Junger-Hebaopian mining district, northeastern Ordos Basin, China: Key role of paleopeat forming environments in Ga-Li-REY enrichment. J. Geochem. Explor. 2020, 213, 106494. [Google Scholar] [CrossRef]
- Li, W.; Zhang, Q.; Li, K.; Zhang, Q.; Guo, Y.; Ma, Y.; Li, Z.; Bai, J.; Yang, B. Sedimentary evolution of the late Paleozoic in Ordos Basin and its adjacent areas. J. Palaeogeogr. 2021, 23, 39–52. [Google Scholar]
- Jiu, B.; Huang, W.H.; Mu, N.N. Mineralogy and elemental geochemistry of Permo-Carboniferous Li-enriched coal in the southern Ordos Basin, China: Implications for modes of occurrence, controlling factors and sources of Li in coal. Ore Geol. Rev. 2022, 141, 104686. [Google Scholar] [CrossRef]
- Ji, X.; Zhang, Z.; Qi, F.; Huang, P.; Liu, S.; Yuan, H.; Liang, Y. Enrichment characteristics of strategic metal elements in Late Paleozoic coal-bearing sequences in Renjiazhuang mine field. Coal Sci. Tech. 2023, 51, 65–78. (In Chinese) [Google Scholar]
- Dai, S.; Li, D.; Chou, C.; Zhao, L.; Zhang, Y.; Ren, D.; Ma, Y.; Sun, Y. Mineralogy and geochemistry of boehmite-rich coals: New insights from the Haerwusu Surface Mine, Jungar Coalfield, Inner Mongolia. China. Int. J. Coal Geol. 2008, 74, 185–202. [Google Scholar] [CrossRef]
- Dai, S.; Zhao, L.; Peng, S.; Chou, C.; Wang, X.; Zhang, Y.; Li, D.; Sun, Y. Abundances and distribution of minerals and elements in High-Alumina coal fly ash from the Jungar Power Plant, Inner Mongolia, China. Int. J. Coal Geol. 2010, 81, 320–332. [Google Scholar] [CrossRef]
- Fu, B.; Liu, G.; Liu, Y.; Chen, S.; Qi, C.; Sun, R. Coal quality characterization and its relationship with geological process of the Early Permian Huainan coal deposits, southern North China. J. Geochem. Explor. 2016, 166, 33–44. [Google Scholar] [CrossRef]
- Zhao, C. Distribution and Enrichment Mechanism of Associated Polymetallic Elements in Ordos Basin and Coal; Academic Press: Beijing, China, 2015; pp. 10–65. [Google Scholar]
- Wu, M.; Shen, J.; Qin, Y.; Yang, L.; Song, X.; Zhu, S.; Li, J. Mineralogy and geochemistry of the M9 high-sulfur coal from the Renjiazhuang Mining District, China. ACS Omega 2022, 34, 29794–29803. [Google Scholar] [CrossRef] [PubMed]
- Yi, T.; Qin, Y.; Wu, Y.; Li, Z. Gallium accumulation and geological controls in coal seam and its floor from Liangshan Formation, Kaili, Eastern Guizhou, China. J. China Univ. Min. Tech. 2007, 36, 330–334. [Google Scholar]
- Chen, J.; Chen, P.; Yao, D.; Liu, Z.; Wu, Y.; Liu, W.; Hu, Y. Mineralogy and geochemistry of Late Permian coals from the Donglin Coal Mine in the Nantong coalfield in Chongqing, southwestern China. Int. J. Coal Geol. 2015, 149, 24–40. [Google Scholar] [CrossRef]
- Wu, M.; Qin, Y.; Yang, L.; Zhu, S.; Wang, X.; Du, J.; Cao, L. Characteristics of coal quality and element distribution in 9# coal seam of Renjiazhuang Coal Mine in Ningxia. China Min. Mag. 2020, 29, 170–175. (In Chinese) [Google Scholar]
- Zhu, S.; Liu, L.; Hu, J.; Chen, B.; Wang, Z.; Shi, Y.; Du, X.; Wang, F.; Chen, H.; Zhang, C.; et al. Characteristics of the source-to-sink system and Paleogeographical pattern from the Upper Carboniferous Yanghugou Formation in Western Margin of the Ordos Basin. Acta Seismol. Sin. 2023, 41, 14. [Google Scholar]
- Shao, L.Y.; Yang, Z.Y.; Shang, X.X.; Xiao, Z.H.; Wang, S.; Zhang, W.; Zheng, M.; Lu, J. Lithofacies palaeogeography of the Carboniferous and Permian in the Qinshui Basin, Shanxi Province, China. J. Palaeogeogr. 2015, 4, 384–412. [Google Scholar] [CrossRef]
- Zhao, H. Structural Characteristics and the Evolution in Western Ordos Basin; Academic Press: Xi’an, China, 2003; pp. 45–48. [Google Scholar]
- Zhang, B. The Paleozoic Tectonic Attribute of the Southern Alxa Block: Constrained by Detrital Zircon U-Pb Ages and Structural Deformation Analysis; Academic Press: Beijing, China, 2019; pp. 54–55. [Google Scholar]
- ASTM D2013/D2013M-12; Standard Practice for Preparing Coal Samples for Analysis. International ASTM: West Conshohocken, PA, USA, 2013.
- ASTM D3175-17; Standard Test Method for Volatile Matter in the Analysis Sample of Coal and Coke. International ASTM: West Conshohocken, PA, USA, 2017.
- ASTM D3173/D3173M-17a; Standard Test Method for Moisture in the Analysis Sample of Coal and Coke. International ASTM: West Conshohocken, PA, USA, 2017.
- ASTM D3174-12; International ASTM. Standard Test Method for Ash in the Analysis Sample of Coal and Coke from Coal. International ASTM: West Conshohocken, PA, USA, 2012.
- ASTM D2798-11a; Standard Test Method for Microscopical Determination of the Vitrinite Reflectance of Coal. International ASTM: West Conshohocken, PA, USA, 2019.
- ASTM D2492-02; Standard Test Method for Forms of Sulfur in Coal. International ASTM: West Conshohocken, PA, USA, 2012.
- ASTM D3177-02; Test Methods for Total Sulfur in the Analysis Sample of Coal and Coke. International ASTM: West Conshohocken, PA, USA, 2011.
- GB/T 4633-2014; Determination of Fluorine in Coal. Chinese Standard GB/T: Beijing, China, 2014.
- Diessel, C. On the correlation between coal facies and depositional environments. In Proceeding 20th Symposium of Department Geology; University of New Castle: Callaghan, NSW, Australia, 1986; pp. 19–22. [Google Scholar]
- Calder, J.H.; Gibling, M.R.; Mukhopadhyay, P.K. Peat formation in a Westphalian B piedmont setting, Cumberland Basin, Nova Scotia; implications for the maceral-based interpretation of rheotrophic and raised paleomires. Bull. Soc. Geol. Fr. 1991, 162, 283–298. [Google Scholar]
- Diessel, C. Coal facies and depositional environment. In Coal-Bearing Depositional Systems; Springer: Berlin/Heidelberg, Germany, 1992; pp. 161–264. [Google Scholar]
- Hower, J.C.; Ruppert, L.F.; Eble, C.F. Lanthanide, yttrium, and zirconium anomalies in the Fire Clay coal bed, Eastern Kentucky. Int. J. Coal Geol. 1999, 39, 141–154. [Google Scholar] [CrossRef]
- Dai, S.; Graham, I.T.; Ward, C.R. A review of anomalous rare earth elements and yttrium in coal. Int. J. Coal Geol. 2016, 159, 82–95. [Google Scholar] [CrossRef]
- Zheng, Q.M.; Shi, S.L.; Liu, Q.F.; Xu, Z.J. Modes of occurrences of major and trace elements in coals from Yangquan Mining District, North China. Int. J. Coal Geol. 2017, 175, 36–47. [Google Scholar] [CrossRef]
- MT/T 849-2000; Classification for Volatile Matter of Coal. Chinese Standard MT/T: Beijing, China, 2000.
- GB/T 15224.1-2018; Classification for Quality of Coal. Part 1: Ash. Chinese Standard GB/T: Beijing, China, 2018.
- GB 15224.2-2010; Classification for Coal Quality. Part 2: Sulfur Content. Chinese Standard GB/T: Beijing, China, 2010.
- Dai, S.; Ren, D.; Chou, C.; Finkelman, R.B.; Seredin, V.V.; Zhou, Y.P. Geochemistry of trace elements in Chinese coals: A review of abundances, genetic types, impacts on human health, and industrial utilization. Int. J. Coal Geol. 2012, 94, 3–21. [Google Scholar] [CrossRef]
- Gromet, L.P.; Haskin, L.A.; Korotev, R.L.; Dymek, R.F. The “North American shale composite”: Its compilation, major and trace element characteristics. Geochim. Cosmochim. Acta 1984, 48, 2469–2482. [Google Scholar] [CrossRef]
- Dai, S.; Wang, P.; Ward, C.R.; Tang, Y.; Song, X.; Jiang, J.; Hower, J.C.; Li, T.; Seredin, V.V.; Wagner, N.J.; et al. Elemental and mineralogical anomalies in the coal-hosted Ge ore deposit of Lincang, Yunnan, southwestern China: Key role of N2–CO2-mixed hydrothermal solutions. Int. J. Coal Geol. 2015, 152, 19–46. [Google Scholar] [CrossRef]
- Ketris, M.P.; Yudovich, Y.E. Estimations of Clarkes for Carbonaceous biolithes: World averages for trace element contents in black shales and coals. Int. J. Coal Geol. 2009, 78, 135–148. [Google Scholar] [CrossRef]
- Grigoriev, N.A. Chemical Element Distribution in the Upper Continental Crust; UB RAS: Ekaterinburg, Russia, 2009. [Google Scholar]
- Seredin, V.V.; Dai, S. Coal deposits as potential alternative sources for lanthanides and yttrium. Int. J. Coal Geol. 2012, 94, 67–93. [Google Scholar] [CrossRef]
- Taylor, S.R.; McLennan, S.M. The Continental Crust: Its Composition and Evolution; Academic Press: Blackwell, OK, USA, 1985; p. 312. [Google Scholar]
- Yan, X.; Dai, S.; Graham, I.T.; He, X.; Shan, K.; Liu, X. Determination of Eu concentrations in coal, fly ash and sedimentary rocks using a cation exchange resin and inductively coupled plasma mass spectrometry (ICP-MS). Int. J. Coal Geol. 2018, 191, 152–156. [Google Scholar] [CrossRef]
- Chou, C. Sulfur in coals: A review of geochemistry and origins. Int. J. Coal Geol. 2012, 100, 1–13. [Google Scholar] [CrossRef]
- Qin, G.H.; Deng, L.J.; Liu, K.; Xu, H.; Ma, Z.; Cao, D. Characteristic of rare earth elements in coal in western margin of Ordos basin. Coal Geol. Explor. 2016, 44, 8–14. [Google Scholar]
- Ward, C.R. Analysis, origin and significance of mineral matter in coal: An updated review. Int. J. Coal Geol. 2016, 165, 1–27. [Google Scholar] [CrossRef]
- Wang, W.; Qin, Y.; Liu, X.; Zhao, J.; Wang, J.; Wu, G.; Liu, J. Distribution, occurrence and enrichment causes of gallium in coals from the Jungar Coalfield, Inner Mongolia. Sci. China Earth Sci. 2011, 54, 1053–1068. [Google Scholar] [CrossRef]
- Wang, X.B.; Dai, S.F.; Ren, D.Y.; Yang, J.Y. Mineralogy and geochemistry of Al-hydroxide/oxyhydroxide mineral-bearing coals of Late Paleozoic age from the Weibei coalfield, Southeastern Ordos Basin, North China. Appl. Geochem. 2011, 26, 1086–1096. [Google Scholar] [CrossRef]
- Gürdal, G. Abundances and modes of occurrence of trace elements in the Çan coals (Miocene), Çanakkale-Turkey. Int. J. Coal Geol. 2011, 87, 157–173. [Google Scholar] [CrossRef]
- Wang, W.; Qin, Y.; Sang, S.; Jiang, B.; Zhu, Y.; Guo, Y. Sulfur variability and element geochemistry of the M11 coal seam from the Antaibao Mining District, China. Fuel 2007, 86, 777–784. [Google Scholar] [CrossRef]
- Sun, Y.; Zhao, C.; Li, Y.; Wang, J.; Liu, S. Li distribution and mode of occurrences in Li-bearing coal seam #6 from the Guanbanwusu Mine, Inner Mongolia, northern China. Energy Explor. Exploit. 2012, 30, 109–130. [Google Scholar]
- Gayer, R.A.; Rose, M.; Dehmer, J.; Shao, L. Impact of sulphur and trace element geochemistry on the utilization of a marine-influenced coal-case study from the South Wales Variscan foreland basin. Int. J. Coal Geol. 1999, 40, 151–174. [Google Scholar] [CrossRef]
- Dai, S.; Xie, P.; French, D.; Ward, C.R.; Graham, I.T.; Yan, X.Y.; Guo, W. The occurrence of buddingtonite in super-high-organic-sulphur coals from the Yishan Coalfield, Guangxi, Southern China. Int. J. Coal Geol. 2018, 195, 347–361. [Google Scholar] [CrossRef]
- Zhao, L.; Dai, S.; Graham, I.; Li, X.; Liu, H.; Song, X.; Hower, J.; Zhou, Y. Cryptic sediment-hosted critical element mineralization from Eastern Yunnan Province, Southwestern China: Mineralogy, geochemistry, relationship to Emeishan alkaline magmatism and possible origin. Ore Geol. Rev. 2017, 80, 116–140. [Google Scholar] [CrossRef]
- Zhao, L.; Dai, S.; Graham, I.T.; Li, X.; Zhang, B. New insights into the Lowest Xuanwei Formation in Eastern Yunnan Province, SW China: Implications for Emeishan large igneous province felsic tuff deposition and the cause of the endGuadalupian mass extinction. Lithos 2016, 264, 375–391. [Google Scholar] [CrossRef]
- Moore, F.; Esmaeili, A. Mineralogy and geochemistry of the coals from the Karmozd and Kiasar coal mines, Mazandaran province, Iran. Int. J. Coal Geol. 2012, 96, 9–21. [Google Scholar] [CrossRef]
- Hayashi, K.I.; Fujisawa, H.; Holland, H.D.; Ohmoto, H. Geochemistry of 1.9 Ga sedimentary rocks from Northeastern Labrador, Canada. Geochim. Cosmochim. Acta 1997, 61, 4115–4137. [Google Scholar] [CrossRef]
- Zhou, L.; Kang, Z.; Wang, Z.; Peng, Y.; Xiao, H. Sedimentary geochemical investigation for paleoenvironment of the lower Cambrian Niutitang formation shales in the Yangtze platform. J. Petrol. Sci. Eng. 2017, 159, 376–386. [Google Scholar] [CrossRef]
- Yudovich, Y.E. Geochemistry of Coal; Nauka: Moscow, Russia, 1978; p. 262. [Google Scholar]
- Permana, A.K.; Ward, C.R.; Li, Z.S.; Gurba, L.W. Distribution and origin of minerals in high-rank coals of the South Walker Creek area, Bowen Basin, Australia. Int. J. Coal Geol. 2013, 116, 185–207. [Google Scholar] [CrossRef]
- Zhao, L.; Ward, C.R.; French, D.; Graham, I.T. Mineralogical composition of Late Permian coal seams in the Songzao Coalfield, Southwestern China. Int. J. Coal Geol. 2013, 116, 208–226. [Google Scholar] [CrossRef]
- Yang, N.; Tang, S.H.; Zhang, S.H.; Xi, Z.; Li, J.; Yuan, Y.; Guo, Y. In seam variation of element-oxides and trace elements in coal from the Eastern Ordos Basin, China. Int. J. Coal Geol. 2018, 197, 31–41. [Google Scholar] [CrossRef]
- Allègre, C.J.; Minster, J.F. Quantitative models of trace element behavior in magmatic processes. Earth Planet. Sci. Lett. 1978, 38, 1–25. [Google Scholar] [CrossRef]
- Scott, A.C.; King, G.R. Megaspores and coal facies: An example from the Westphalian a of Leicestershire, England. Rev. Palaeobot. Palynol. 1981, 34, 107–113. [Google Scholar] [CrossRef]
- Silva, M.B.; Kalkreuth, W.; Holz, M. Coal petrology of coal seams from the Leão-Butiá coalfield, lower permian of the paraná basin, Brazil—Implications for coal facies interpretations. Int. J. Coal Geol. 2008, 73, 331–358. [Google Scholar] [CrossRef]
- Lu, J.; Shao, L.; Yang, M.; Zhou, K.; Wheeley, J.R.; Wang, H.; Hilton, J. Depositional model for peat swamp and coal facies evolution using sedimentology, coal macerals, geochemistry and sequence stratigraphy. J. Earth Sci. 2017, 28, 1163–1177. [Google Scholar] [CrossRef]
- Sen, S.; Naskar, S.; Das, S. Discussion on the concepts in paleoenvironmental reconstruction from coal macerals and petrographic indices. Mar. Pet. Geol. 2016, 73, 371–391. [Google Scholar] [CrossRef]
- Qin, Y.; Wang, W.; Li, Z.; Xia, X.; Wu, Y. High-resolution coal facies sequence and peat Paleo-Bog pattern during the transgression. Acta Geol. Sin. 2008, 82, 234–246. [Google Scholar]
- Spirobaruch, F.; Liu, J.; Dai, S.; Zeng, R.; Large, D.; French, D. Marine derived 87Sr/86Sr in coal, a new key to geochronology and palaeoenvironment: Elucidation of the India-Eurasia and China-Indochina collisions in Yunnan, China. Int. J. Coal Geol. 2019, 215, 103304. [Google Scholar]
- Murray, R.W.; Buchholtz, T.; Brink, M.R.; Jones, D.L.; Gerlach, D.C.; Russ, G.P. Rare earth elements as indicators of different marine depositional environments in chert and shale. Geology 1990, 18, 268–272. [Google Scholar] [CrossRef]
- Schijf, J.; Christenson, E.A.; Byrne, R.H. YREE scavenging in seawater: A new look at an old model. Mar. Chem. 2015, 177, 460–471. [Google Scholar] [CrossRef]
- Dai, S.; Xie, P.; Ward, C.R.; Yan, X.; Guo, W.; French, D.; Graham, I.T. Anomalies of rare metals in Lopingian super-high-organic-sulfur coals from the Yishan Coalfield, Guangxi, China. Ore Geol. Rev. 2017, 88, 235–250. [Google Scholar] [CrossRef]
- Karayiğit, A.İ.; Littke, R.; Querol, X.; Jones, T.; Oskay, R.G.; Christanis, K. The Miocene coal seams in the Soma Basin (W. Turkey): Insights from coal petrography, mineralogy and geochemistry. Int. J. Coal Geol. 2017, 173, 110–128. [Google Scholar] [CrossRef]
- Vejahati, F.; Xu, Z.; Gupta, R. Trace elements in coal: Associations with coal and minerals and their behavior during coal utilization—A review. Fuel 2010, 89, 904–911. [Google Scholar] [CrossRef]
- Li, J.; Zhuang, X.; Yuan, W.; Liu, B.; Querol, X.; Font, O.; Moreno, N.; Li, J.; Gang, T.; Liang, G. Mineral composition and geochemical characteristics of the Li-Ga-rich coals in the Buertaohai-Tianjiashipan mining district, Jungar Coalfield, Inner Mongolia. Int. J. Coal Geol. 2016, 167, 157–175. [Google Scholar] [CrossRef]


| Samples | Ro,max | Mad | Ad | Vdaf | St,d | Sp,d | Ss,d | So,d |
|---|---|---|---|---|---|---|---|---|
| 3G-DN | nd | 0.78 | 94.01 | 97.98 | 0.77 | 0.75 | 0.01 | 0.01 |
| T-H-1 | 0.66 | 1.52 | 24.99 | 38.69 | 0.67 | 0.35 | 0.00 | 0.32 |
| T-H-M | 0.73 | 1.54 | 13.95 | 39.15 | 0.61 | 0.24 | 0.00 | 0.37 |
| T-H-2 | 0.79 | 1.34 | 26.27 | 37.23 | 0.47 | 0.13 | 0.01 | 0.32 |
| Av | 0.73 | 1.47 | 21.74 | 38.36 | 0.58 | 0.24 | 0.00 | 0.34 |
| 3G-DE | nd | 0.60 | 93.41 | 99.39 | 0.08 | 0.03 | 0.02 | 0.03 |
| 5G-DN | nd | 0.40 | 92.72 | 93.24 | 0.12 | 0.02 | 0.07 | 0.03 |
| F-H-M | 0.85 | 1.69 | 21.08 | 32.14 | 0.57 | 0.00 | 0.03 | 0.54 |
| F-H-2 | 0.82 | 1.60 | 33.07 | 34.39 | 0.53 | 0.02 | 0.02 | 0.49 |
| Av | 0.84 | 1.65 | 27.08 | 33.27 | 0.55 | 0.01 | 0.03 | 0.52 |
| 5G-DE | nd | 0.66 | 91.21 | 96.68 | 0.06 | 0.00 | 0.04 | 0.02 |
| 9G-DN | nd | 0.60 | 89.21 | 84.25 | 0.42 | 0.40 | 0.01 | 0.01 |
| N-H-1 | 0.74 | 0.94 | 38.82 | 42.33 | 2.33 | 0.69 | 0.01 | 1.64 |
| N-H-2 | 0.78 | 0.84 | 36.48 | 41.77 | 2.20 | 0.37 | 0.00 | 1.83 |
| Av-D-R* | 0.71 | 0.90 | 13.21 | 36.99 | 3.07 | 0.36 | 0.01 | 2.70 |
| Av | 0.76 | 0.89 | 37.65 | 42.05 | 2.27 | 0.53 | 0.01 | 1.74 |
| 9G-DE | nd | 0.55 | 94.26 | 77.93 | 0.84 | 0.66 | 0.03 | 0.15 |
| Samples | T | CT | CD | CG | VD | T-V | F | SF | Ma | Mi | ID | T-I | Sp | Cu | Re | Sub | Alg | Ba | Bi | LD | T-L | TPI | GI | GWI | VI | V/I |
|---|---|---|---|---|---|---|---|---|---|---|---|---|---|---|---|---|---|---|---|---|---|---|---|---|---|---|
| T-H-1 | 2.34 | 11.70 | 38.01 | 0.00 | 4.09 | 56.14 | 6.43 | 23.98 | 0.00 | 0.00 | 5.85 | 36.26 | 4.09 | 1.76 | 0.58 | 0.00 | 0.00 | 0.00 | 1.17 | 0.00 | 7.60 | 0.93 | 1.55 | 0.55 | 0.84 | 1.55 |
| T-H-M | 3.02 | 11.58 | 55.16 | 0.00 | 3.53 | 73.29 | 5.54 | 11.09 | 1.00 | 0.00 | 3.53 | 21.16 | 3.53 | 0.51 | 0.51 | 0.00 | 0.00 | 1.00 | 0.00 | 0.00 | 5.55 | 0.49 | 3.69 | 0.17 | 0.48 | 3.46 |
| T-H-2 | 4.49 | 3.84 | 38.45 | 0.00 | 3.21 | 49.99 | 1.93 | 32.69 | 0.00 | 0.00 | 5.13 | 39.74 | 5.13 | 1.28 | 0.65 | 0.00 | 0.00 | 1.93 | 1.28 | 0.00 | 10.27 | 0.92 | 1.26 | 0.66 | 0.82 | 1.26 |
| F-H-M | 1.13 | 0.57 | 14.68 | 0.00 | 0.00 | 16.38 | 0.57 | 68.90 | 0.57 | 0.57 | 5.65 | 76.26 | 5.09 | 1.70 | 0.57 | 0.00 | 0.00 | 0.00 | 0.00 | 0.00 | 7.36 | 3.41 | 0.23 | 1.24 | 2.65 | 0.21 |
| F-H-2 | 0.69 | 4.16 | 19.45 | 0.00 | 1.39 | 25.69 | 1.39 | 58.34 | 0.00 | 0.69 | 8.34 | 68.76 | 4.16 | 1.39 | 0.00 | 0.00 | 0.00 | 0.00 | 0.00 | 0.00 | 5.55 | 2.21 | 0.38 | 1.71 | 1.86 | 0.37 |
| N-H-1 | 2.04 | 12.92 | 42.86 | 0.00 | 8.84 | 66.66 | 2.72 | 21.76 | 0.68 | 0.00 | 4.09 | 29.25 | 3.40 | 0.68 | 0.00 | 0.00 | 0.00 | 0.00 | 0.00 | 0.00 | 4.09 | 0.70 | 2.36 | 0.86 | 0.66 | 2.28 |
| N-H-2 | 0.65 | 8.44 | 41.56 | 0.00 | 6.50 | 57.14 | 5.20 | 29.88 | 0.65 | 0.65 | 3.89 | 40.26 | 1.94 | 0.00 | 0.65 | 0.00 | 0.00 | 0.00 | 0.00 | 0.00 | 2.59 | 0.84 | 1.48 | 0.90 | 0.83 | 1.42 |
| D-R-1 | 20.90 | 4.40 | 13.60 | 0.60 | 0.00 | 39.50 | 8.10 | 37.60 | 2.40 | 0.60 | 5.50 | 54.30 | 0.00 | 3.70 | 2.40 | 0.00 | 0.00 | 0.00 | 0.00 | 0.00 | 6.20 | 3.20 | 0.80 | 0.70 | 3.20 | 0.73 |
| D-R-2 | 9.90 | 1.60 | 18.60 | 1.10 | 0.00 | 31.20 | 13.50 | 36.80 | 3.60 | 3.60 | 5.20 | 62.60 | 0.00 | 3.60 | 2.60 | 0.00 | 0.00 | 0.00 | 0.00 | 0.00 | 6.20 | 2.20 | 0.60 | 0.20 | 2.40 | 0.50 |
| D-R-3 | 10.80 | 21.20 | 37.40 | 2.50 | 0.00 | 71.90 | 5.40 | 11.90 | 0.00 | 0.50 | 7.40 | 25.20 | 0.90 | 0.50 | 1.50 | 0.00 | 0.00 | 0.00 | 0.00 | 0.00 | 2.90 | 1.00 | 2.90 | 0.10 | 1.20 | 2.85 |
| D-R-4 | 8.00 | 15.40 | 46.80 | 0.60 | 0.00 | 70.80 | 7.50 | 11.50 | 0.00 | 1.70 | 3.40 | 24.10 | 1.70 | 1.10 | 1.70 | 0.00 | 0.60 | 0.00 | 0.00 | 0.00 | 5.20 | 0.80 | 3.20 | 0.10 | 0.80 | 2.94 |
| D-R-5 | 11.70 | 9.20 | 35.10 | 0.50 | 0.00 | 56.50 | 13.20 | 18.00 | 0.50 | 3.40 | 3.90 | 39.00 | 1.00 | 1.90 | 1.00 | 0.00 | 0.00 | 0.00 | 0.00 | 0.50 | 4.50 | 1.30 | 1.60 | 0.00 | 1.30 | 1.45 |
| D-R-6 | 7.70 | 27.30 | 40.20 | 2.60 | 0.00 | 77.80 | 8.80 | 3.60 | 0.50 | 3.60 | 0.50 | 17.10 | 2.60 | 0.00 | 2.60 | 0.00 | 0.00 | 0.00 | 0.00 | 0.00 | 5.10 | 1.10 | 6.10 | 0.10 | 1.20 | 4.55 |
| D-R-7 | 3.40 | 14.90 | 42.80 | 2.00 | 0.00 | 63.10 | 13.00 | 9.60 | 0.90 | 1.40 | 5.80 | 30.70 | 2.40 | 3.40 | 0.50 | 0.00 | 0.00 | 0.00 | 0.00 | 0.00 | 6.30 | 0.80 | 2.30 | 0.10 | 0.80 | 2.06 |
| D-R-8 | 6.20 | 9.10 | 38.30 | 0.50 | 0.00 | 54.00 | 15.30 | 22.50 | 0.00 | 0.50 | 3.80 | 42.20 | 2.40 | 1.40 | 0.00 | 0.00 | 0.00 | 0.00 | 0.00 | 0.00 | 3.80 | 1.20 | 1.30 | 0.00 | 1.20 | 1.28 |
| D-R-9 | 5.30 | 7.80 | 19.40 | 1.00 | 0.00 | 33.50 | 10.00 | 36.10 | 1.60 | 3.10 | 3.10 | 53.90 | 0.60 | 4.10 | 5.70 | 0.00 | 0.00 | 0.60 | 1.60 | 0.00 | 12.60 | 2.40 | 0.70 | 0.30 | 2.40 | 0.62 |
| D-R-10 | 10.60 | 19.70 | 29.80 | 0.50 | 0.00 | 60.60 | 12.50 | 16.40 | 0.50 | 3.80 | 2.90 | 36.00 | 0.50 | 1.00 | 1.90 | 0.00 | 0.00 | 0.00 | 0.00 | 0.00 | 3.40 | 1.80 | 1.90 | 0.10 | 1.80 | 1.68 |
| D-R-11 | 6.90 | 5.20 | 22.00 | 1.50 | 0.00 | 35.70 | 10.50 | 34.10 | 2.60 | 1.50 | 4.70 | 53.40 | 4.70 | 4.10 | 2.10 | 0.00 | 0.00 | 0.00 | 0.00 | 0.00 | 10.90 | 1.80 | 0.80 | 0.30 | 1.70 | 0.67 |
| D-R-12 | 5.70 | 10.00 | 33.40 | 0.50 | 0.00 | 49.70 | 8.90 | 27.20 | 1.10 | 1.60 | 4.70 | 43.40 | 3.20 | 2.10 | 0.50 | 0.00 | 0.00 | 0.00 | 1.10 | 0.00 | 6.90 | 1.30 | 1.20 | 0.10 | 1.20 | 1.15 |
| D-R-13 | 2.90 | 19.20 | 48.50 | 0.50 | 0.00 | 71.20 | 7.20 | 9.20 | 1.50 | 1.90 | 5.70 | 25.50 | 2.40 | 0.90 | 0.00 | 0.00 | 0.00 | 0.00 | 0.00 | 0.00 | 3.30 | 0.70 | 3.30 | 0.10 | 0.70 | 2.79 |
| D-R-14 | 8.00 | 13.40 | 25.70 | 1.00 | 0.00 | 48.10 | 4.80 | 34.30 | 0.00 | 1.00 | 4.30 | 44.50 | 1.00 | 3.20 | 1.00 | 0.60 | 0.00 | 0.00 | 1.00 | 0.60 | 7.40 | 1.90 | 1.10 | 0.30 | 1.80 | 1.08 |
| D-R-15 | 5.20 | 33.80 | 37.90 | 1.50 | 0.00 | 78.50 | 4.70 | 7.70 | 0.50 | 1.10 | 2.10 | 16.10 | 3.20 | 1.10 | 1.10 | 0.00 | 0.00 | 0.00 | 0.00 | 0.00 | 5.30 | 1.20 | 5.50 | 0.10 | 1.20 | 4.88 |
| Samples | Li | Be | Sc | V | Cr | Co | Ni | Cu | Zn | Ga | Rb | Sr | Ta | W | Tl | Hf |
|---|---|---|---|---|---|---|---|---|---|---|---|---|---|---|---|---|
| 3G-DN | 42.40 | 3.67 | 12.90 | 78.00 | 88.10 | 5.29 | 12.80 | 16.00 | 132.00 | 26.70 | 133.00 | 71.00 | 2.36 | 2.41 | 0.97 | 11.10 |
| T-H-1 | 49.30 | 2.43 | 3.66 | 18.80 | 8.86 | 3.20 | 6.29 | 7.48 | 7.22 | 13.68 | 3.46 | 68.39 | 0.78 | 1.11 | 0.14 | 4.97 |
| T-H-M | 23.60 | 6.92 | 3.99 | 12.00 | 5.70 | 17.60 | 19.10 | 7.57 | 7.00 | 13.40 | 2.77 | 107.00 | 0.32 | 0.74 | 0.15 | 2.00 |
| T-H-2 | 73.70 | 4.80 | 8.78 | 24.00 | 9.31 | 3.04 | 6.47 | 8.49 | 7.38 | 16.40 | 3.56 | 51.00 | 0.97 | 1.00 | 0.085 | 6.71 |
| 3G-DE | 71.20 | 4.20 | 13.40 | 89.80 | 71.50 | 3.47 | 7.01 | 17.80 | 81.30 | 28.57 | 112.00 | 87.99 | 1.87 | 2.09 | 0.76 | 10.60 |
| 5G-DN | 28.30 | 1.87 | 12.50 | 80.90 | 76.00 | 8.70 | 11.30 | 14.40 | 97.10 | 21.40 | 92.40 | 96.00 | 1.48 | 1.37 | 0.57 | 14.90 |
| F-H-M | 94.10 | 4.67 | 8.06 | 28.30 | 9.37 | 1.56 | 3.66 | 14.00 | 10.90 | 15.90 | 0.85 | 35.80 | 1.5 | 1.00 | 0.057 | 4.61 |
| F-H-2 | 151.00 | 5.17 | 10.70 | 34.20 | 12.60 | 1.20 | 3.68 | 15.80 | 13.60 | 25.20 | 2.37 | 44.40 | 2.4 | 1.67 | 0.053 | 6.12 |
| 5G-DE | 66.40 | 4.64 | 16.30 | 94.90 | 60.80 | 6.82 | 9.59 | 22.80 | 121.00 | 31.00 | 169.00 | 124.00 | 2.02 | 2.70 | 0.95 | 9.90 |
| 9G-DN | 84.20 | 2.90 | 19.50 | 157.00 | 84.90 | 19.00 | 37.00 | 29.50 | 126.00 | 31.90 | 130.00 | 169.00 | 1.57 | 1.90 | 0.67 | 7.45 |
| N-H-1 | 181.00 | 1.70 | 5.59 | 17.30 | 7.56 | 1.62 | 2.19 | 10.70 | 13.20 | 19.60 | 0.57 | 124.50 | 1.57 | 2.97 | 0.12 | 4.38 |
| N-H-2 | 174.00 | 1.34 | 7.36 | 18.50 | 10.30 | 1.24 | 2.68 | 11.50 | 9.86 | 15.20 | 2.55 | 247.00 | 1.46 | 2.31 | 0.067 | 5.62 |
| Av-D-R* | 98.47 | 1.45 | 4.35 | 10.97 | 3.66 | 1.03 | 1.58 | 12.27 | 3.89 | 9.57 | 0.84 | 171.67 | 0.43 | 0.65 | nd | nd |
| 9G-DE | 47.24 | 0.72 | 6.28 | 34.60 | 89.10 | 9.94 | 21.80 | 9.59 | 60.60 | 12.70 | 46.20 | 86.50 | 1.4 | 0.89 | 0.35 | 15.00 |
| AV-C | 106.67 | 3.86 | 6.88 | 21.87 | 9.10 | 4.21 | 6.30 | 10.79 | 9.88 | 17.05 | 2.30 | 96.87 | 1.3 | 1.50 | 0.10 | 4.90 |
| AV-P | 56.62 | 3.00 | 13.48 | 89.20 | 78.40 | 8.87 | 16.58 | 18.35 | 103.00 | 25.38 | 113.77 | 105.75 | 1.80 | 1.90 | 0.70 | 11.50 |
| *China coala | 31.80 | 2.11 | 4.38 | 35.10 | 15.40 | 7.08 | 13.70 | 17.50 | 41.40 | 6.55 | 9.25 | 140.00 | 0.62 | 1.08 | 0.50 | 3.71 |
| *World coalb | 12.00 | 1.60 | 3.70 | 29.00 | 16.00 | 5.10 | 13.00 | 16.00 | 23.00 | 5.80 | 8.30 | 110.00 | 0.28 | 1.10 | 0.63 | 1.20 |
| *World claysc | 54.00 | 3.00 | 15.00 | 120.00 | 110.00 | 19.00 | 49.00 | 36.00 | 89.00 | 16.00 | 133.00 | 240.00 | 110.00 | 2.60 | 0.47 | 120.00 |
| Samples | Nb | Mo | Cd | In | U | Sb | Cs | Zr | Pb | F | As | Bi | Th | Ba | REY | |
| 3G-DN | 29.40 | 1.83 | 0.220 | 0.074 | 4.59 | 0.21 | 8.32 | 351.00 | 29.50 | 201.57 | 0.00 | 0.30 | 15.40 | 428.00 | 343.53 | |
| T-H-1 | 12.20 | 0.96 | 0.020 | 0.049 | 2.37 | 0.30 | 0.26 | 163.00 | 17.40 | 203.09 | 1.02 | 0.21 | 8.86 | 75.90 | 101.89 | |
| T-H-M | 4.58 | 1.18 | 0.030 | 0.020 | 1.17 | 0.33 | 0.12 | 70.40 | 8.22 | 78.20 | 0.00 | 0.12 | 3.18 | 164.00 | 61.06 | |
| T-H-2 | 14.60 | 0.71 | 0.023 | 0.060 | 2.71 | 0.30 | 0.26 | 234.00 | 21.20 | 184.47 | 0.00 | 0.30 | 12.80 | 37.60 | 125.36 | |
| 3G-DE | 21.50 | 1.11 | 0.110 | 0.071 | 7.10 | 0.21 | 7.32 | 384.00 | 25.40 | 370.22 | 0.00 | 0.32 | 17.20 | 986.92 | 404.41 | |
| 5G-DN | 21.10 | 1.54 | 0.150 | 0.050 | 3.05 | 0.14 | 2.00 | 558.00 | 20.54 | 514.06 | 1.00 | 0.09 | 17.00 | 524.00 | 305.40 | |
| F-H-M | 17.40 | 1.51 | 0.048 | 0.051 | 3.70 | 0.17 | 0.05 | 155.00 | 20.30 | 105.79 | 0.00 | 0.28 | 12.40 | 12.90 | 133.61 | |
| F-H-2 | 34.00 | 2.02 | 0.052 | 0.074 | 4.37 | 0.19 | 0.05 | 194.00 | 26.30 | 127.03 | 0.00 | 0.40 | 18.80 | 20.90 | 144.55 | |
| 5G-DE | 22.40 | 0.59 | 0.190 | 0.085 | 6.47 | 0.16 | 8.30 | 333.00 | 30.90 | 738.88 | 1.01 | 0.52 | 22.60 | 661.00 | 377.44 | |
| 9G-DN | 18.90 | 1.11 | 0.180 | 0.084 | 4.64 | 0.45 | 9.40 | 244.00 | 30.20 | 293.76 | 12.07 | 0.64 | 19.20 | 341.00 | 334.71 | |
| N-H-1 | 17.40 | 3.82 | 0.068 | 0.048 | 4.19 | 0.31 | 0.07 | 162.00 | 26.80 | 151.42 | 3.03 | 0.56 | 12.98 | 77.26 | 112.91 | |
| N-H-2 | 16.70 | 3.41 | 0.061 | 0.053 | 3.57 | 0.23 | 0.08 | 169.00 | 23.80 | 135.14 | 1.01 | 0.58 | 16.10 | 71.20 | 110.64 | |
| Av-D-R* | 4.13 | 1.66 | 0.04 | nd | 1.98 | nd | 0.24 | nd | 17.64 | nd | nd | 0.30 | 7.61 | 62.27 | 100.3 | |
| 9G-DE | 16.50 | 1.91 | 0.039 | 0.032 | 2.53 | 0.11 | 1.34 | 550.00 | 12.80 | 203.12 | 1.01 | 0.11 | 11.40 | 269.00 | 184.92 | |
| AV-C | 16.70 | 1.94 | 0.043 | 0.051 | 3.15 | 0.26 | 0.13 | 163.91 | 20.57 | 140.73 | 0.72 | 0.35 | 12.16 | 65.68 | 112.86 | |
| AV-P | 21.63 | 1.35 | 0.148 | 0.066 | 4.73 | 0.21 | 6.11 | 403.33 | 24.89 | 386.93 | 2.51 | 0.33 | 17.13 | 534.99 | 325.07 | |
| *China coala | 9.44 | 3.08 | 0.25 | 0.05 | 2.43 | 0.84 | 1.13 | 89.50 | 15.10 | 130.00 | 3.79 | 0.79 | 5.84 | 159.00 | 135.89 | |
| *World coalb | 3.70 | 2.20 | 0.22 | 0.03 | 2.40 | 0.92 | 1.10 | 36.00 | 7.80 | 88.00 | 8.30 | 0.97 | 3.30 | 150.00 | 68.47 | |
| *World claysc | 11.00 | 1.60 | 0.91 | 0.063 | 4.30 | 1.30 | 13.00 | 190.00 | 14.00 | 610.00 | 9.30 | 0.38 | 4.30 | 460.00 | 169.00 |
| Samples | REY | LREE | MREE | HREE | L/M | L/H | M/H | LaN/LuN | LaN/SmN | GdN/LuN | EuN/EuN* | CeN/CeN* | GdN/GdN* | YN/YN* |
|---|---|---|---|---|---|---|---|---|---|---|---|---|---|---|
| 3G-DN | 343.53 | 263.10 | 66.39 | 14.04 | 3.96 | 18.74 | 4.73 | 9.01 | 4.00 | 1.47 | 0.41 | 0.80 | 0.92 | 0.94 |
| T-H-1 | 101.89 | 72.77 | 23.98 | 5.13 | 3.03 | 14.18 | 4.67 | 6.05 | 3.50 | 1.16 | 0.46 | 0.94 | 0.86 | 0.95 |
| T-H-M | 61.06 | 40.34 | 17.46 | 3.26 | 2.31 | 12.37 | 5.36 | 5.40 | 3.39 | 1.25 | 0.52 | 0.91 | 0.90 | 1.04 |
| T-H-2 | 125.36 | 83.23 | 34.87 | 7.26 | 2.39 | 11.46 | 4.80 | 4.94 | 3.48 | 0.99 | 0.43 | 0.92 | 0.84 | 1.01 |
| Av | 96.10 | 65.45 | 25.44 | 5.22 | 2.58 | 12.67 | 4.94 | 5.46 | 3.46 | 1.13 | 0.47 | 0.92 | 0.87 | 1.00 |
| 3G-DE | 404.41 | 327.59 | 66.68 | 10.15 | 4.91 | 32.27 | 6.57 | 12.63 | 3.17 | 2.42 | 0.58 | 0.99 | 0.90 | 1.18 |
| 5G-DN | 305.40 | 251.85 | 45.13 | 8.42 | 5.58 | 29.91 | 5.36 | 14.42 | 5.04 | 1.92 | 0.64 | 0.89 | 0.97 | 1.13 |
| F-H-M | 133.61 | 95.27 | 32.40 | 5.94 | 2.94 | 16.04 | 5.45 | 7.46 | 4.06 | 1.33 | 0.55 | 0.94 | 0.90 | 1.07 |
| F-H-2 | 144.55 | 99.67 | 37.99 | 6.89 | 2.62 | 14.47 | 5.51 | 6.93 | 4.37 | 1.18 | 0.54 | 0.93 | 0.89 | 1.11 |
| Av | 139.08 | 97.47 | 35.20 | 6.42 | 2.78 | 15.26 | 5.48 | 7.20 | 4.22 | 1.26 | 0.55 | 0.94 | 0.90 | 1.09 |
| 5G-DE | 377.44 | 298.50 | 66.52 | 12.42 | 4.49 | 24.03 | 5.36 | 10.73 | 3.90 | 1.82 | 0.58 | 0.91 | 0.94 | 1.05 |
| 9G-DN | 334.71 | 260.26 | 61.14 | 13.31 | 4.26 | 19.55 | 4.59 | 8.09 | 3.79 | 1.32 | 0.64 | 0.96 | 0.86 | 0.92 |
| N-H-1 | 112.91 | 82.50 | 25.52 | 4.88 | 3.23 | 16.91 | 5.23 | 7.26 | 3.93 | 1.26 | 0.53 | 0.92 | 0.86 | 1.08 |
| N-H-2 | 110.64 | 79.46 | 25.52 | 5.66 | 3.11 | 14.04 | 4.51 | 6.90 | 4.61 | 1.10 | 0.54 | 0.90 | 0.87 | 0.90 |
| Av-D-R* | 100.30 | 68.96 | 26.06 | 5.28 | 2.82 | 14.11 | 4.92 | 6.37 | 4.41 | 0.87 | 0.55 | 0.95 | 0.87 | 1.20 |
| Av | 111.78 | 80.98 | 25.52 | 5.27 | 3.17 | 15.48 | 4.87 | 7.08 | 4.27 | 1.18 | 0.54 | 0.91 | 0.87 | 0.99 |
| 9G-DE | 184.92 | 158.14 | 22.41 | 4.37 | 7.06 | 36.19 | 5.13 | 14.80 | 4.61 | 2.06 | 0.48 | 0.89 | 0.99 | 1.06 |
| Av-C | 112.86 | 79.04 | 28.25 | 5.57 | 2.80 | 14.18 | 5.07 | 6.42 | 3.93 | 1.17 | 0.51 | 0.92 | 0.87 | 1.03 |
| Av-P | 325.07 | 259.91 | 54.71 | 10.45 | 4.75 | 24.87 | 5.23 | 10.89 | 3.95 | 1.77 | 0.56 | 0.91 | 0.92 | 1.03 |
| Sample | Mineral Compositions (wt%) |
|---|---|
| T-H-1 | Quartz 3.5; Dolomite 9.3; Pyrite 7.3; Kaolinite 79.9 |
| T-H-M | Quartz 1.4; Feldspar 0.6; Calcite 33.3; Dolomite 21.9; Pyrite 1.8; Kaolinite 41.0 |
| T-H-2 | Quartz 2.2; Dolomite 3.7; Kaolinite 94.1 |
| F-H-M | Dolomite 3.1; Kaolinite 96.9 |
| F-H-2 | Dolomite 1.1; Kaolinite 98.9 |
| N-H-1 | Dolomite 8.4; Pyrite 1.8; Kaolinite 89.8 |
| N-H-2 | Dolomite 14.0; Pyrite 1.1; Kaolinite 84.9 |
| Correlation with Ash Yield |
|---|
| Rash: from 0.70 to 1.00 SiO2 (0.97), TiO2 (0.78), Al2O3 (0.94), Li (0.82), Ta (0.82), Hf (0.81), Nb (0.81), Zr (0.77), Pb (0.77), Th (0.87) |
| Rash: from 0.40 to 0.69 |
| Sc (0.69), V (0.45), Cu (0.60), Ga (0.66), U (0.54), |
| Rash: from −0.50 to +0.40 |
| Fe2O3 (0.11), MnO2 (−0.26), MgO (−0.14), CaO (−0.29), Na2O (0.09), K2O (0.23), P2O5 (0.17), Be (0.08), Cr (0.20), Co (−0.05), Ni (0.05), Zn (0.19), Rb (0.23), Sr (0.06), Tl (0.04), Cs (0.26), Ba (0.27) |
| Correlation coefficients between selected pairs of elements Li-Al2O3 (0.90), Li-SiO2 (0.75), Ta-Al2O3 (0.85), Ta-SiO2 (0.79), Hf-Al2O3 (0.80), Hf-SiO2 (0.77), Nb-Al2O3 (0.81), Nb-SiO2 (0.76), Zr-Al2O3 (0.72), Zr-SiO2 (0.74), Pb-Al2O3 (0.75), Pb-SiO2 (0.71), Th-Al2O3 (0.90), Th-SiO2 (0.83), Ga-SiO2 (0.74), Ga-TiO2 (0.57), Li-TiO2 (0.64) |
Disclaimer/Publisher’s Note: The statements, opinions and data contained in all publications are solely those of the individual author(s) and contributor(s) and not of MDPI and/or the editor(s). MDPI and/or the editor(s) disclaim responsibility for any injury to people or property resulting from any ideas, methods, instructions or products referred to in the content. |
© 2024 by the authors. Licensee MDPI, Basel, Switzerland. This article is an open access article distributed under the terms and conditions of the Creative Commons Attribution (CC BY) license (https://creativecommons.org/licenses/by/4.0/).
Share and Cite
Wu, M.; Qin, Y.; Zhang, G.; Shen, J.; Yu, J.; Ji, X.; Zhu, S.; Wang, W.; Wan, Y.; Liu, Y.; et al. Geochemistry and Mineralogy of Upper Paleozoic Coal in the Renjiazhuang Mining District, Northwest Ordos Basin, China: Evidence for Sediment Sources, Depositional Environment, and Elemental Occurrence. Minerals 2024, 14, 1045. https://doi.org/10.3390/min14101045
Wu M, Qin Y, Zhang G, Shen J, Yu J, Ji X, Zhu S, Wang W, Wan Y, Liu Y, et al. Geochemistry and Mineralogy of Upper Paleozoic Coal in the Renjiazhuang Mining District, Northwest Ordos Basin, China: Evidence for Sediment Sources, Depositional Environment, and Elemental Occurrence. Minerals. 2024; 14(10):1045. https://doi.org/10.3390/min14101045
Chicago/Turabian StyleWu, Meng, Yong Qin, Guchun Zhang, Jian Shen, Jianxin Yu, Xiaoyan Ji, Shifei Zhu, Wenqiang Wang, Yali Wan, Ying Liu, and et al. 2024. "Geochemistry and Mineralogy of Upper Paleozoic Coal in the Renjiazhuang Mining District, Northwest Ordos Basin, China: Evidence for Sediment Sources, Depositional Environment, and Elemental Occurrence" Minerals 14, no. 10: 1045. https://doi.org/10.3390/min14101045
APA StyleWu, M., Qin, Y., Zhang, G., Shen, J., Yu, J., Ji, X., Zhu, S., Wang, W., Wan, Y., Liu, Y., & Qin, Y. (2024). Geochemistry and Mineralogy of Upper Paleozoic Coal in the Renjiazhuang Mining District, Northwest Ordos Basin, China: Evidence for Sediment Sources, Depositional Environment, and Elemental Occurrence. Minerals, 14(10), 1045. https://doi.org/10.3390/min14101045