
Opal Synthesis: Toward Geologically Relevant Conditions

 ,
,  , , and
Abstract
:
1. Introduction
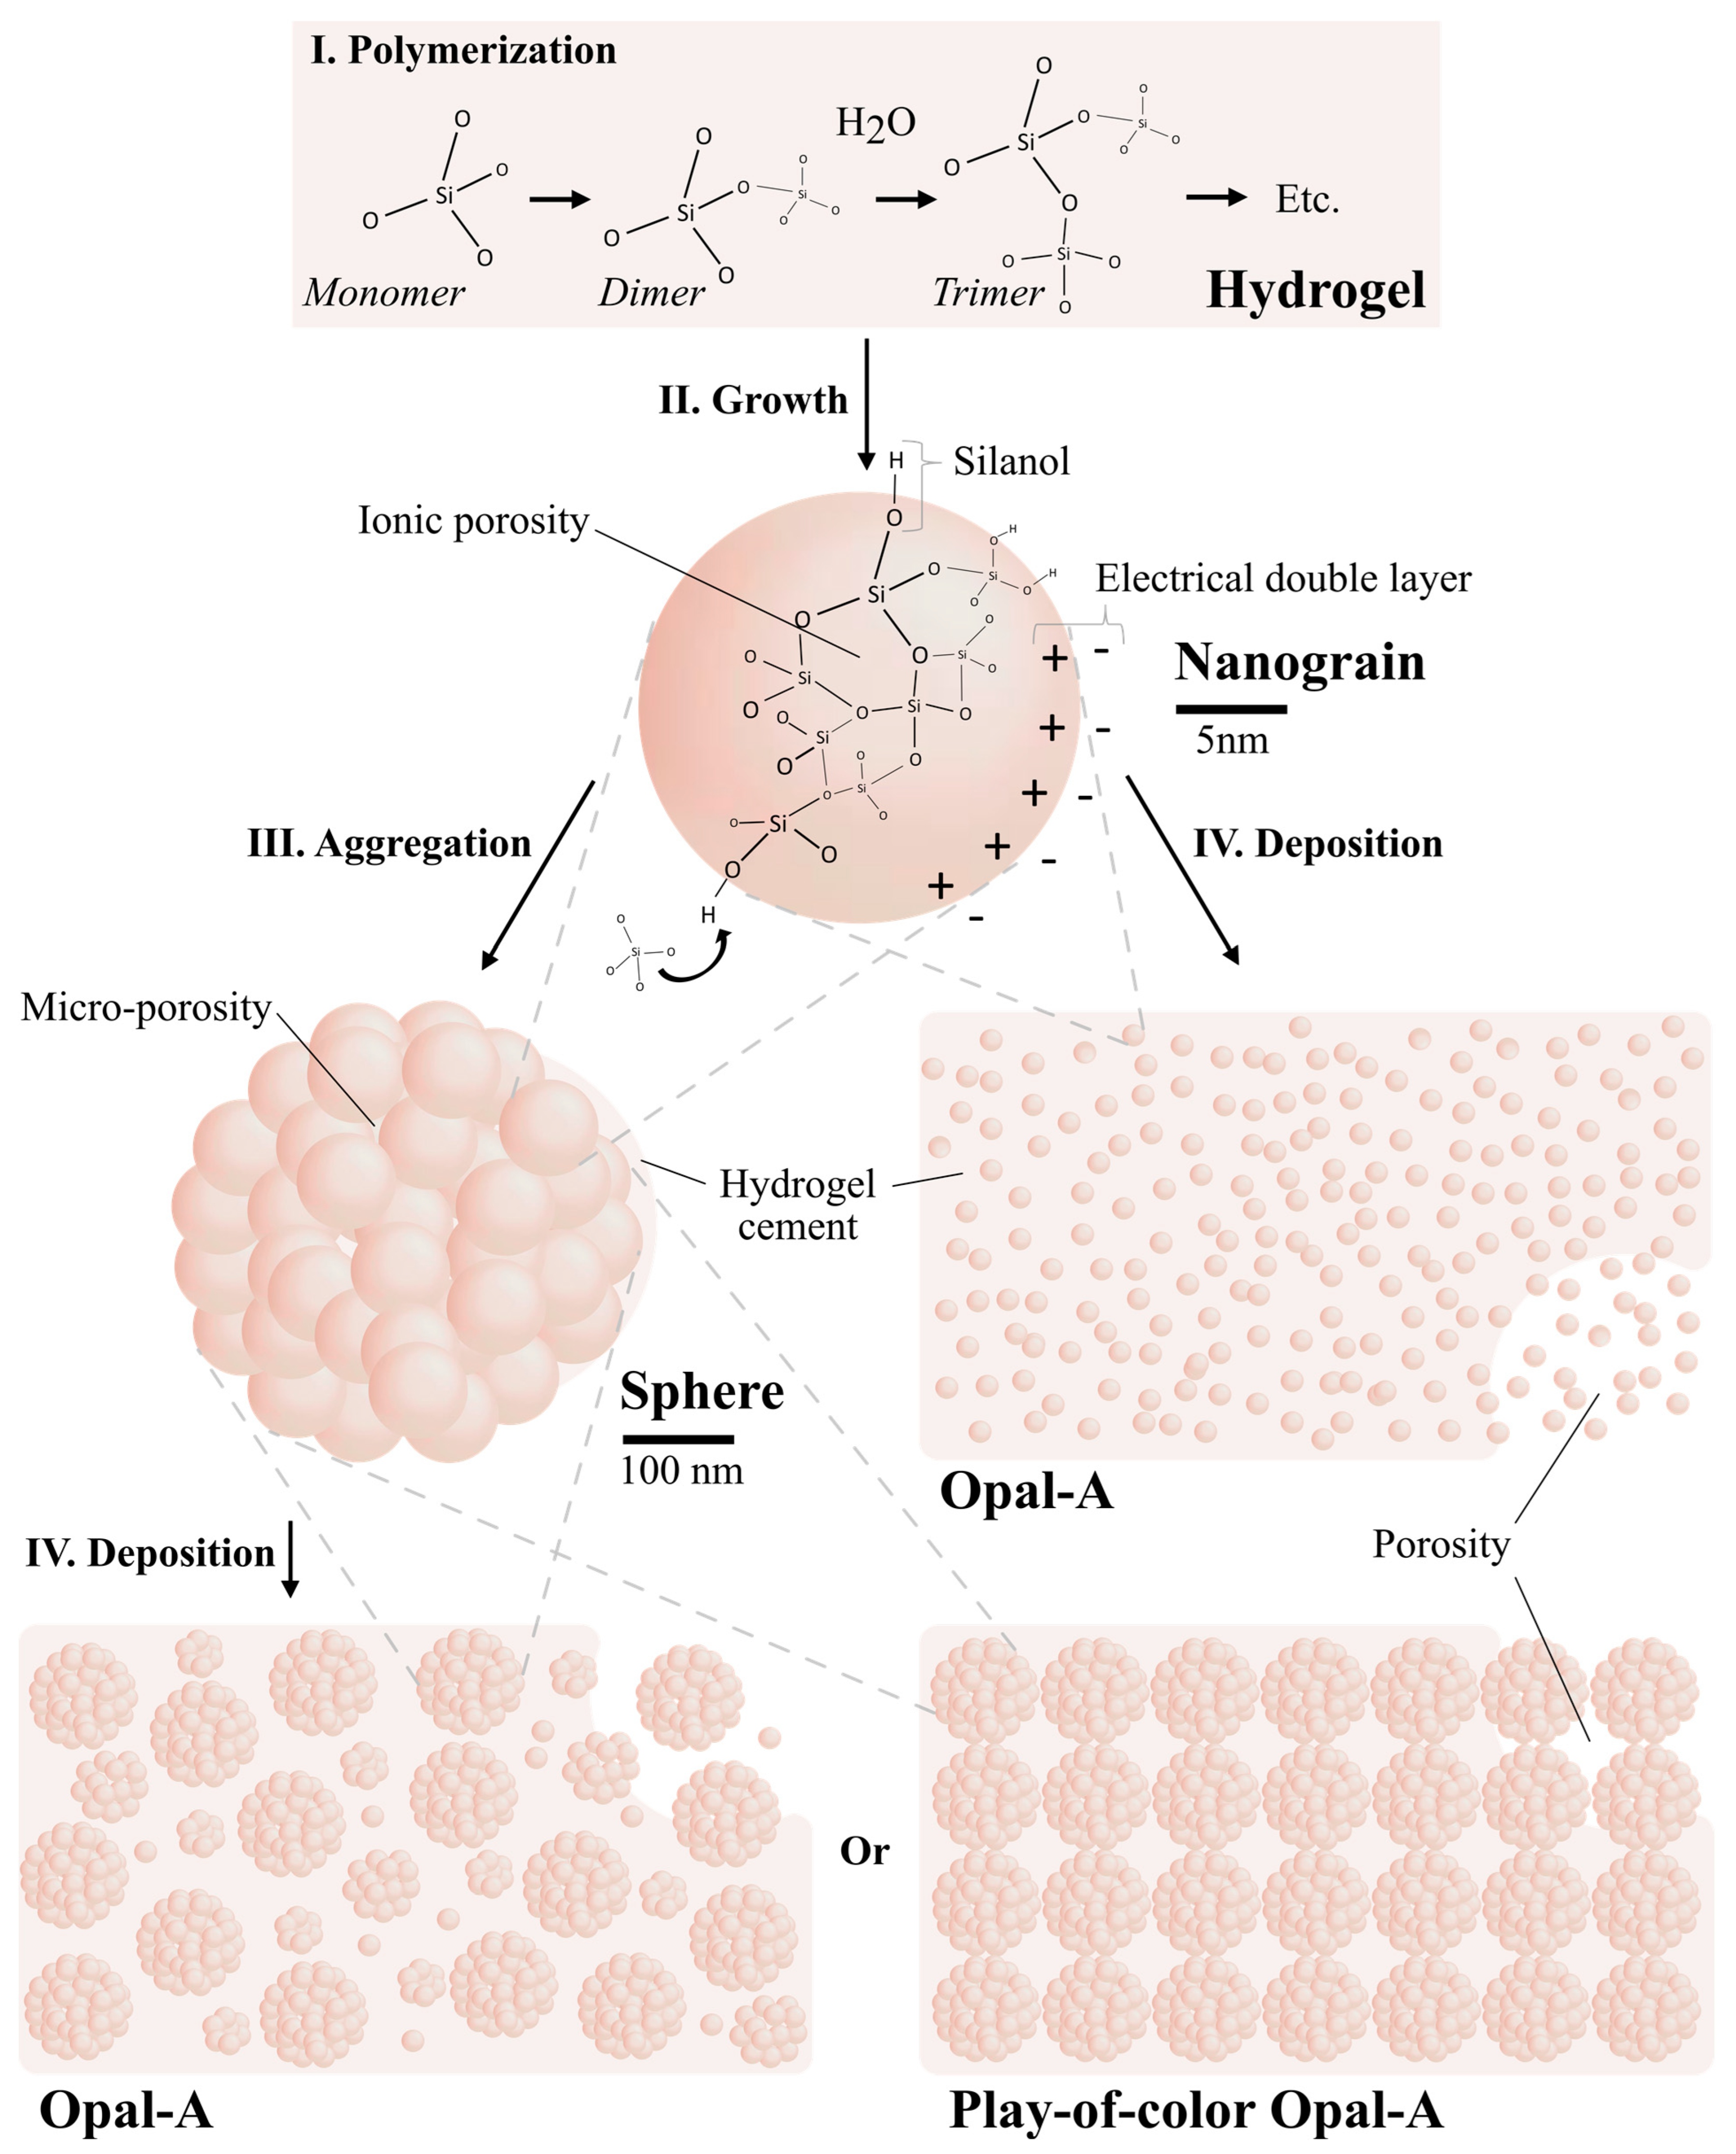
- The pores between the deposited silica nanograins and/or the spheres are partially or entirely filled by amorphous silica hydrogel [42], thus closing the fluid percolating system.
2. Experimental Method
2.1. Materials
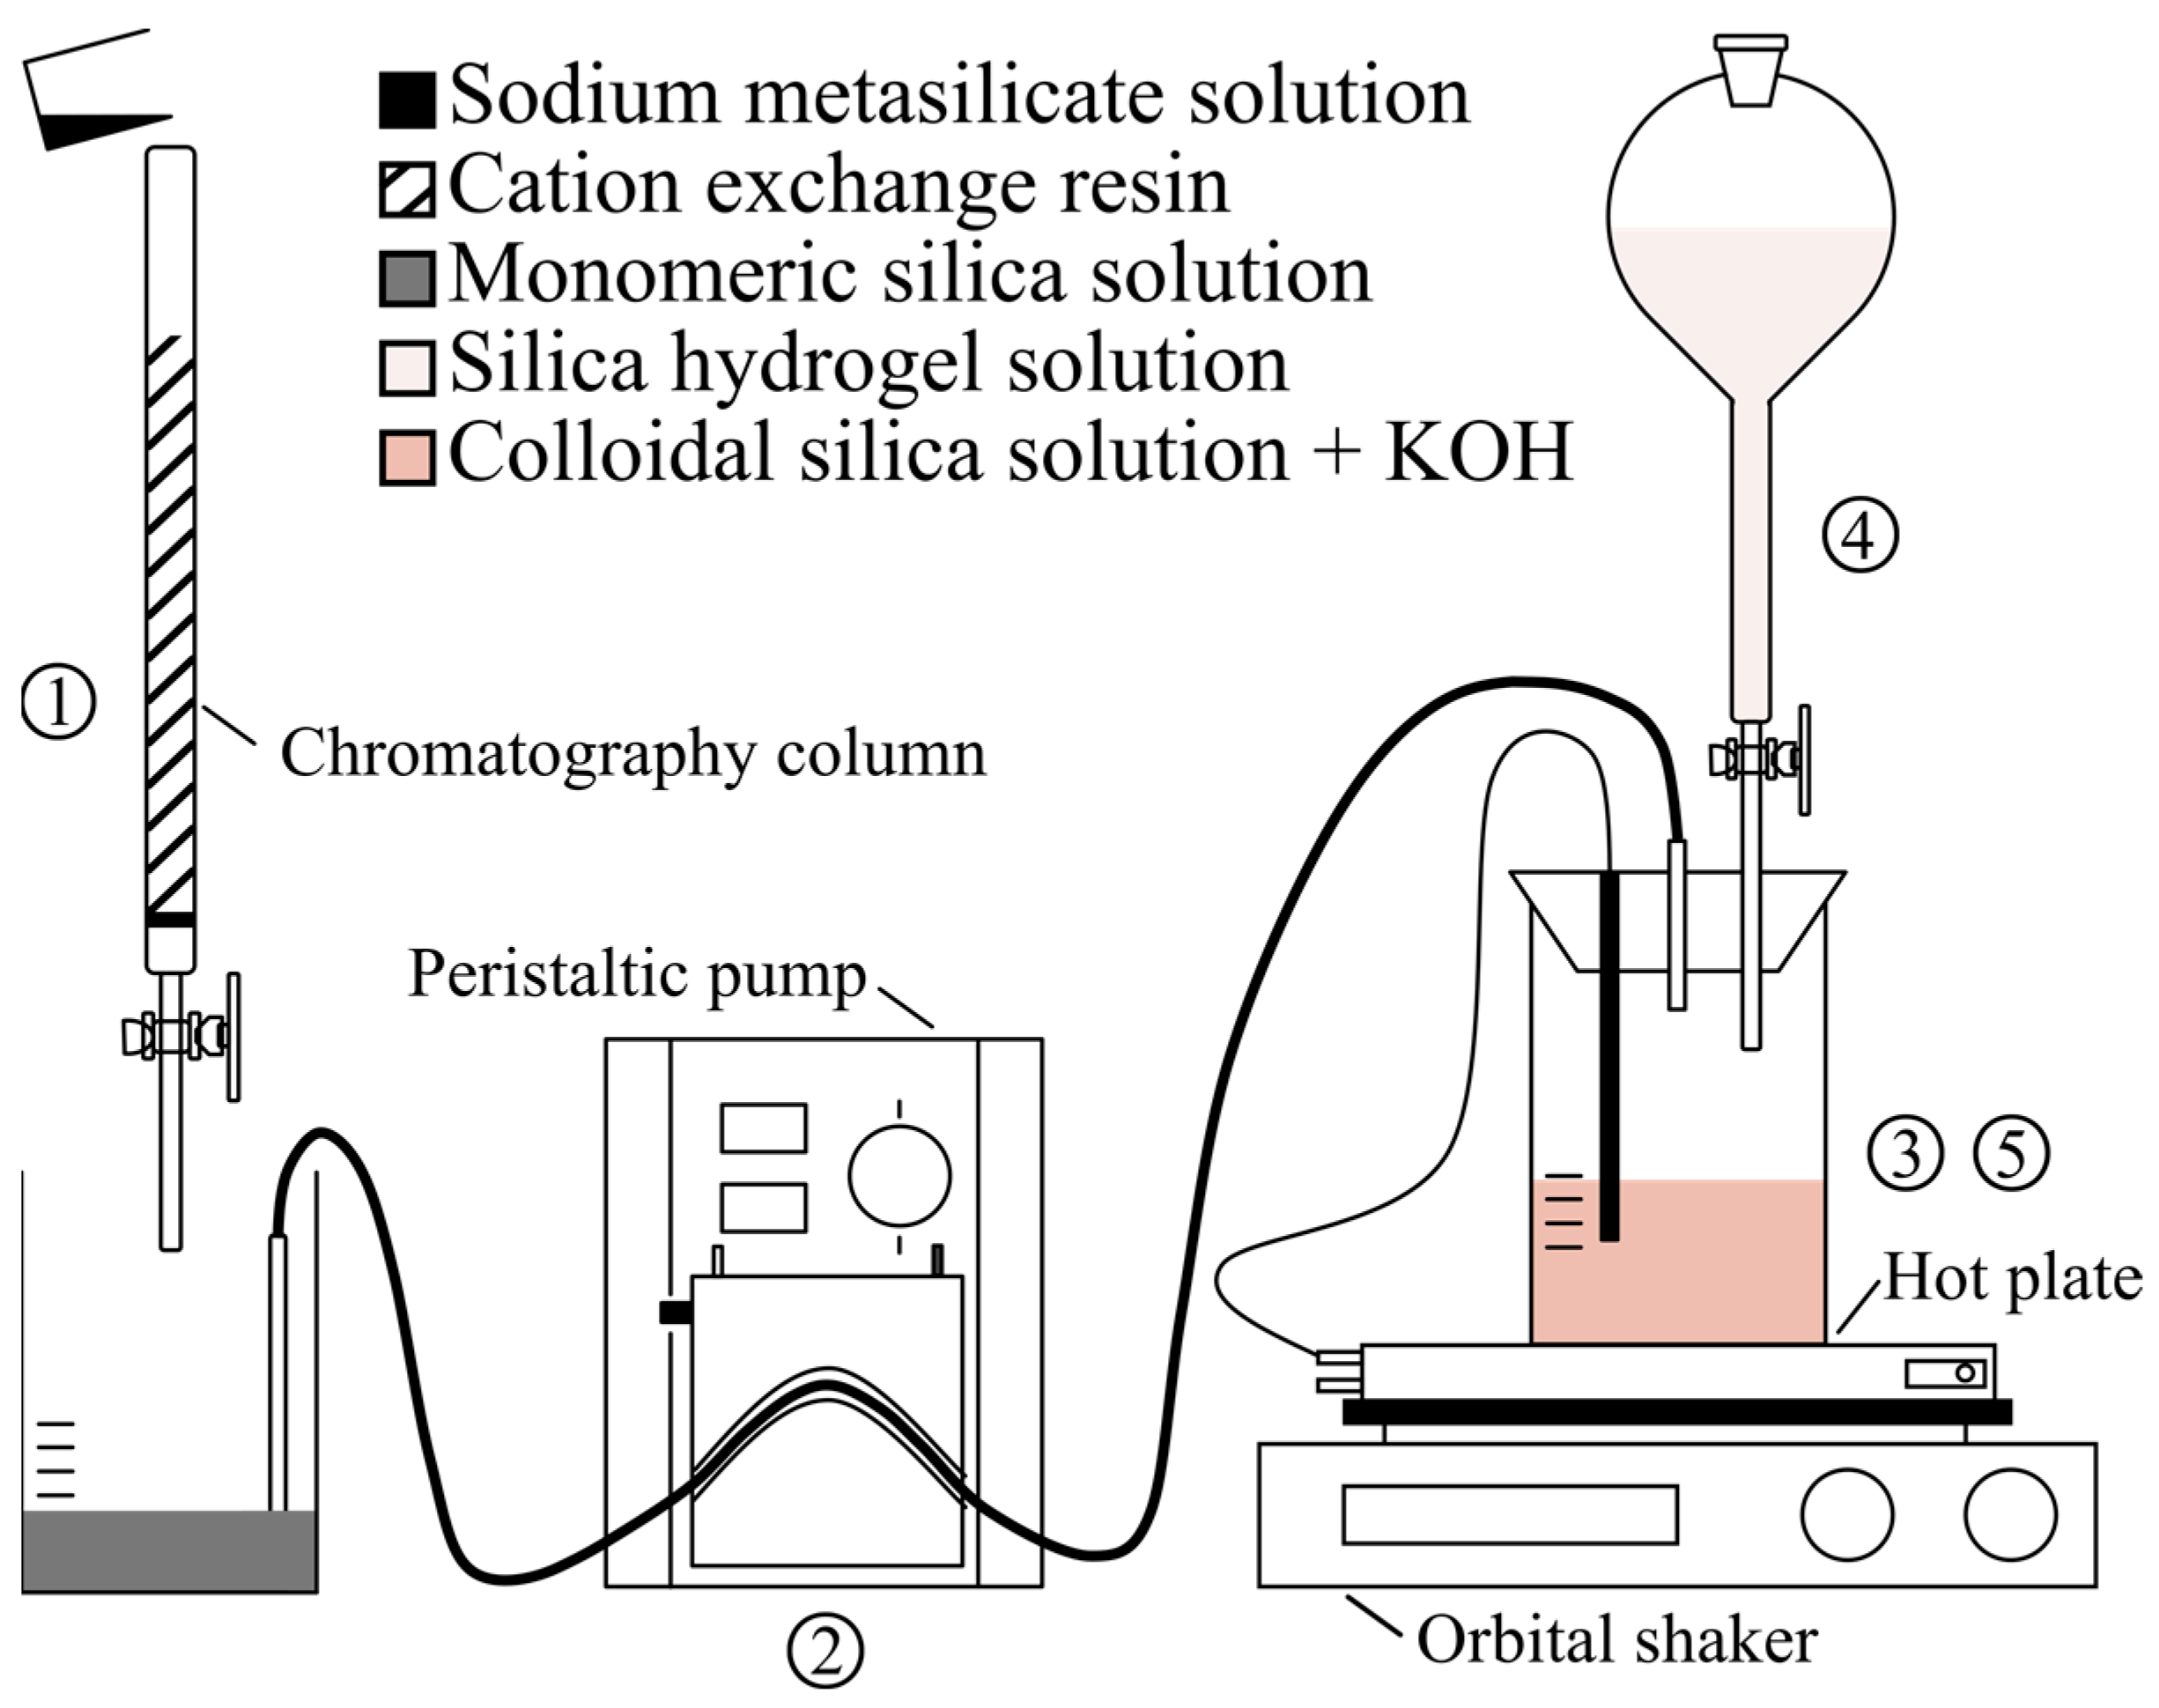
2.2. Experimental Procedure
2.2.1. Preparation of Silica Nanograins
2.2.2. Preparation of Silica Hydrogel
2.2.3. Opal Synthesis
2.3. Methods
2.3.1. Dynamic Light Scattering (DLS)
2.3.2. Scanning Electron Microscopy (SEM)
2.3.3. Loss on Drying (LOD)
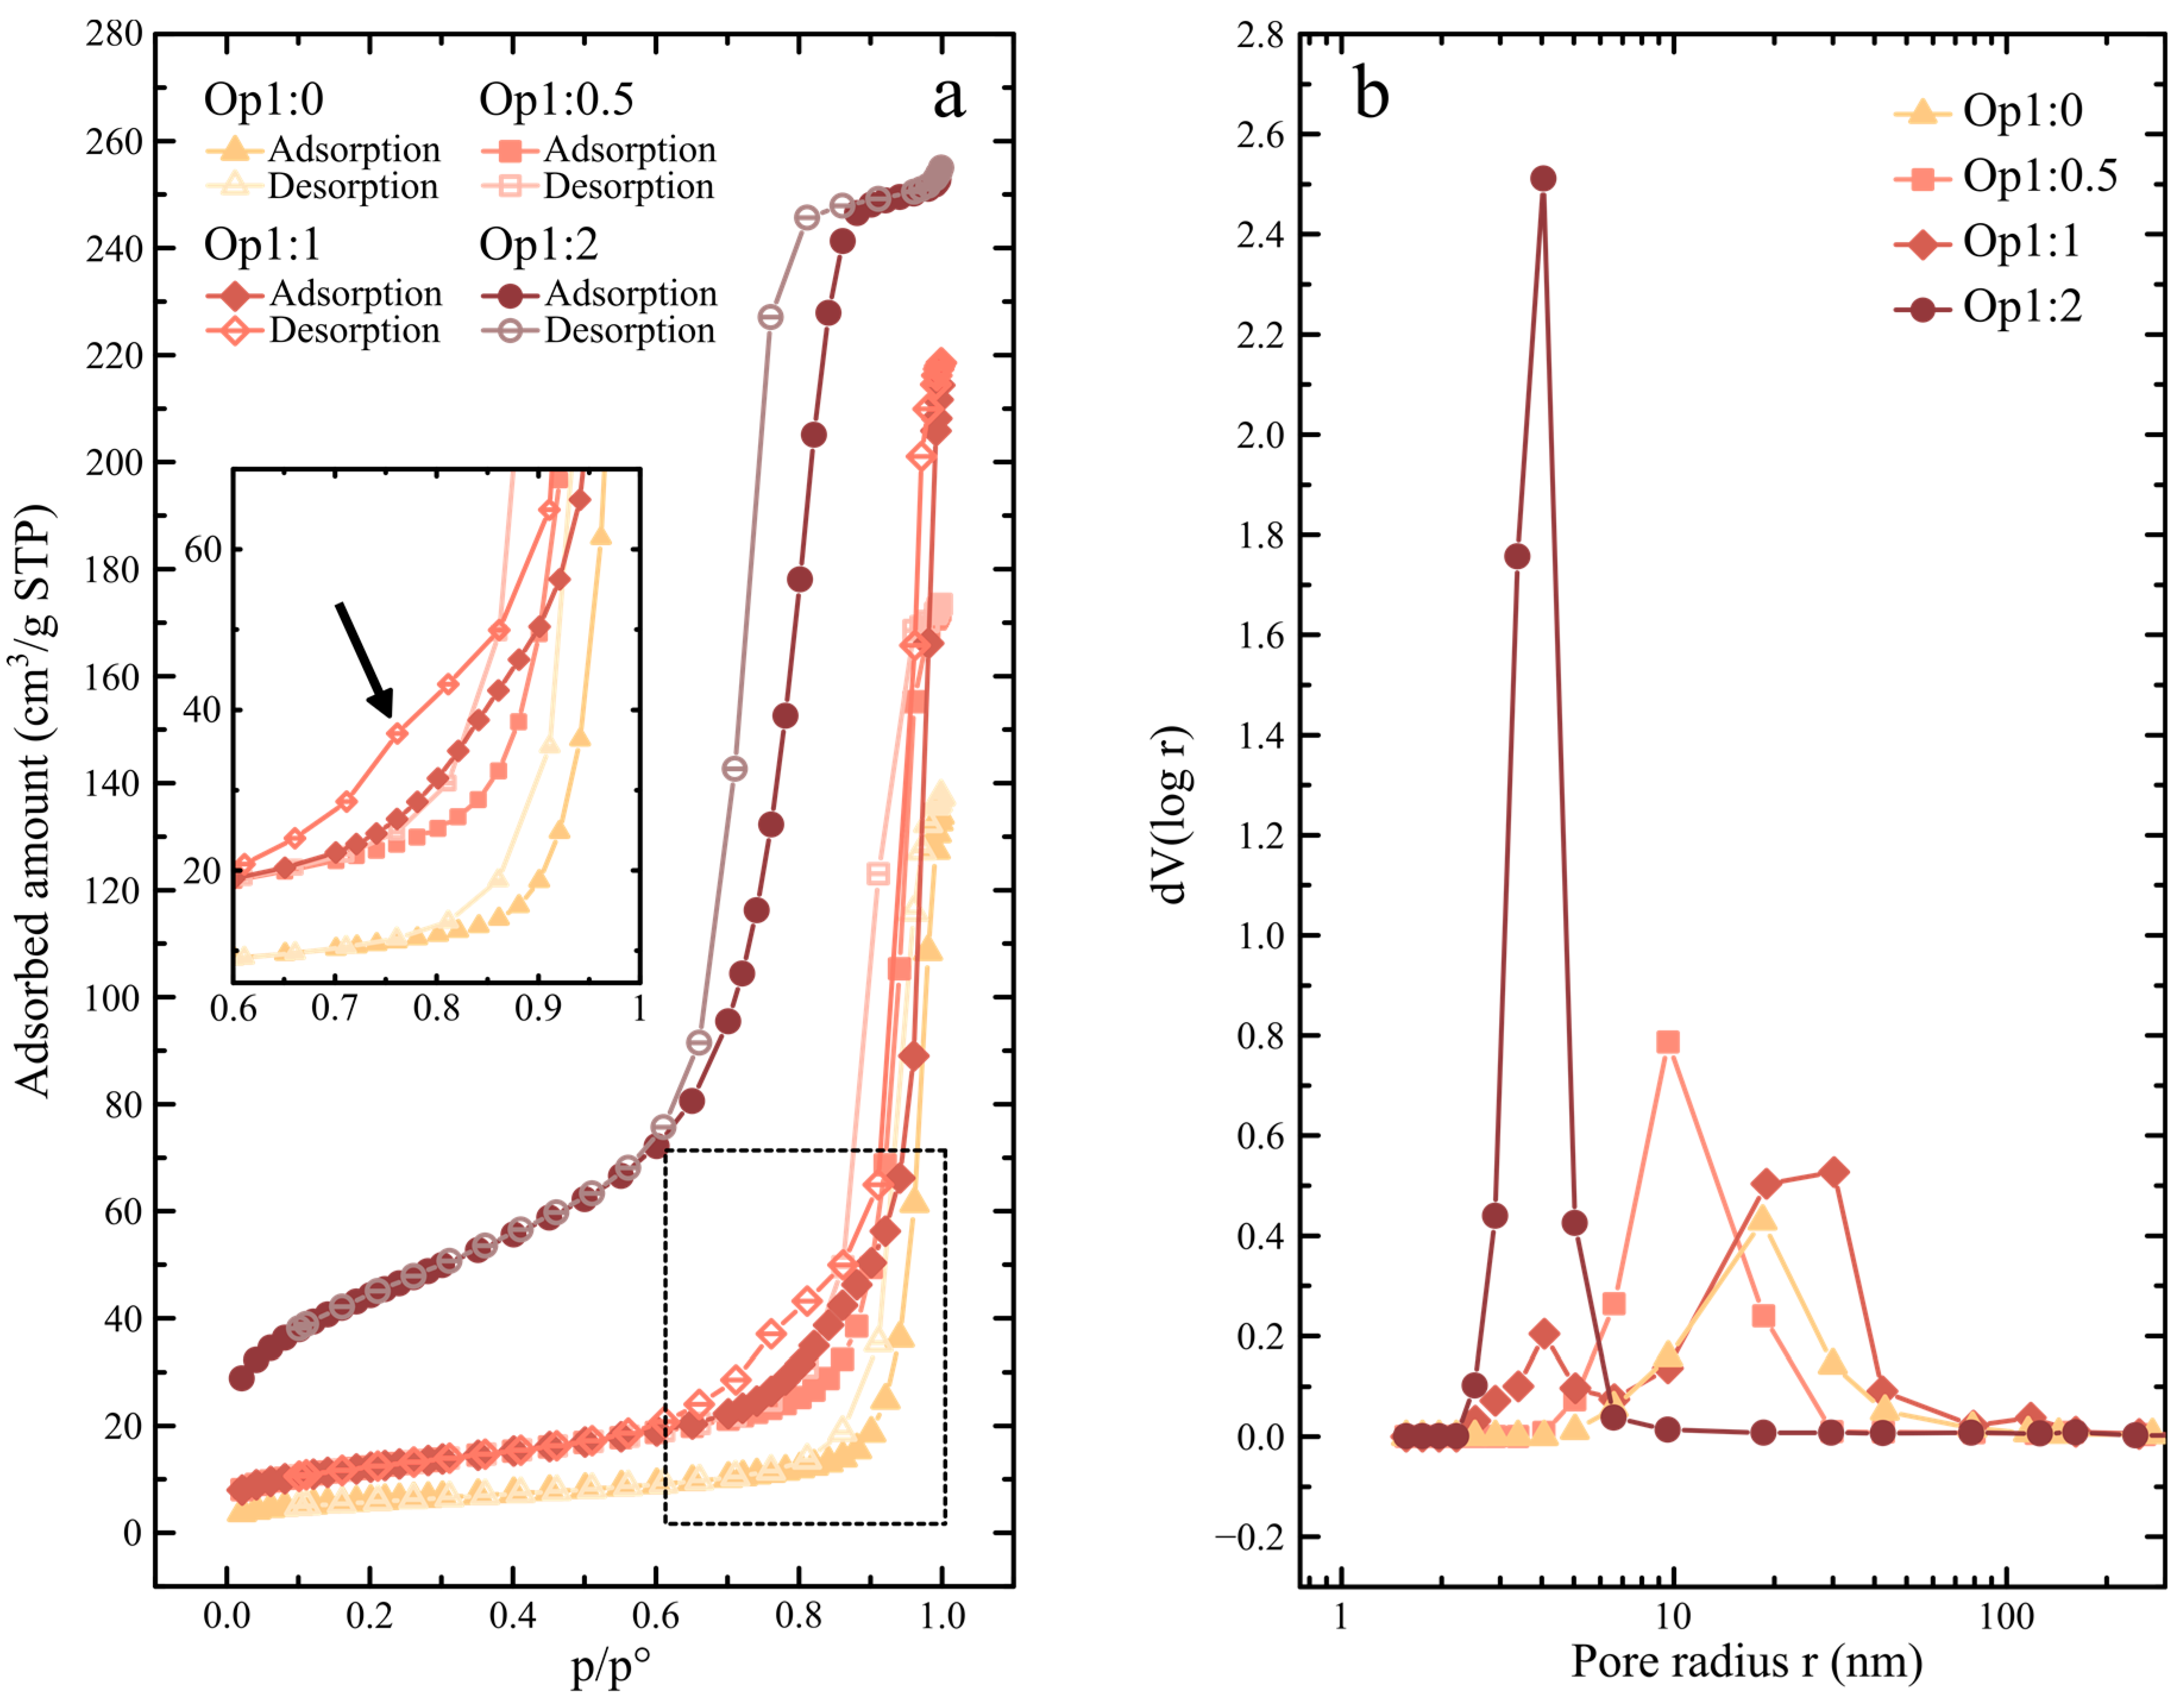
2.3.4. Gas Adsorption
2.3.5. Inductively Coupled Plasma Optical Emission Spectroscopy (ICP-OES)
2.3.6. Raman Spectroscopy
3. Results
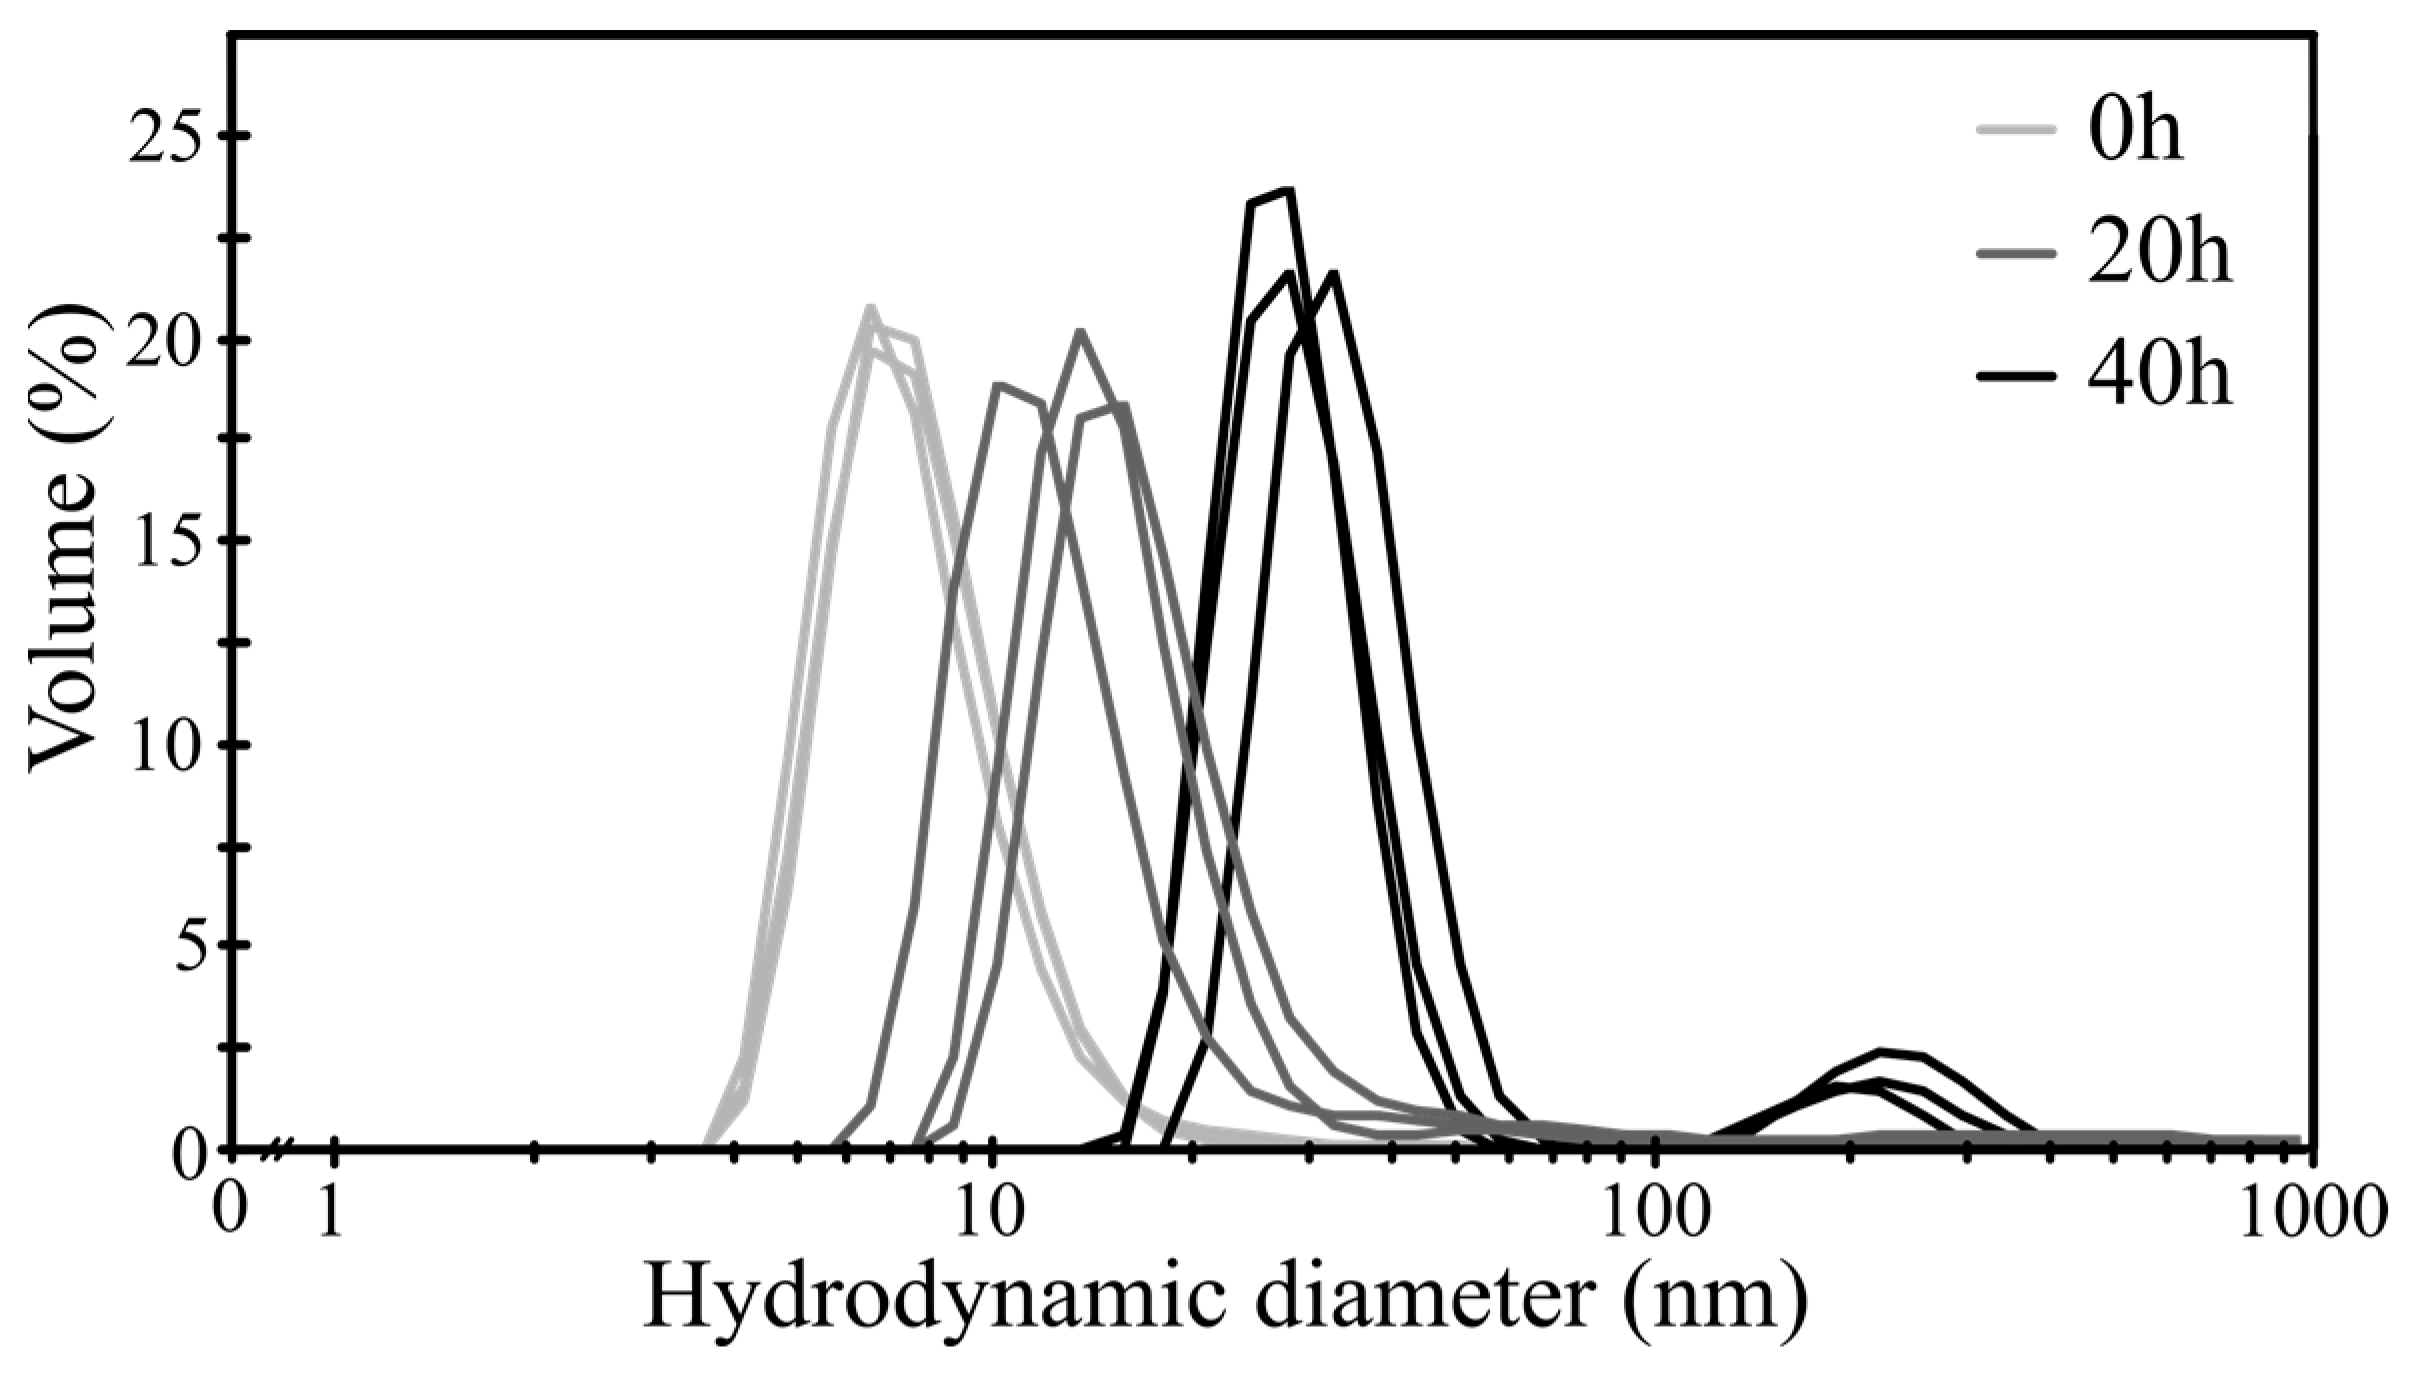
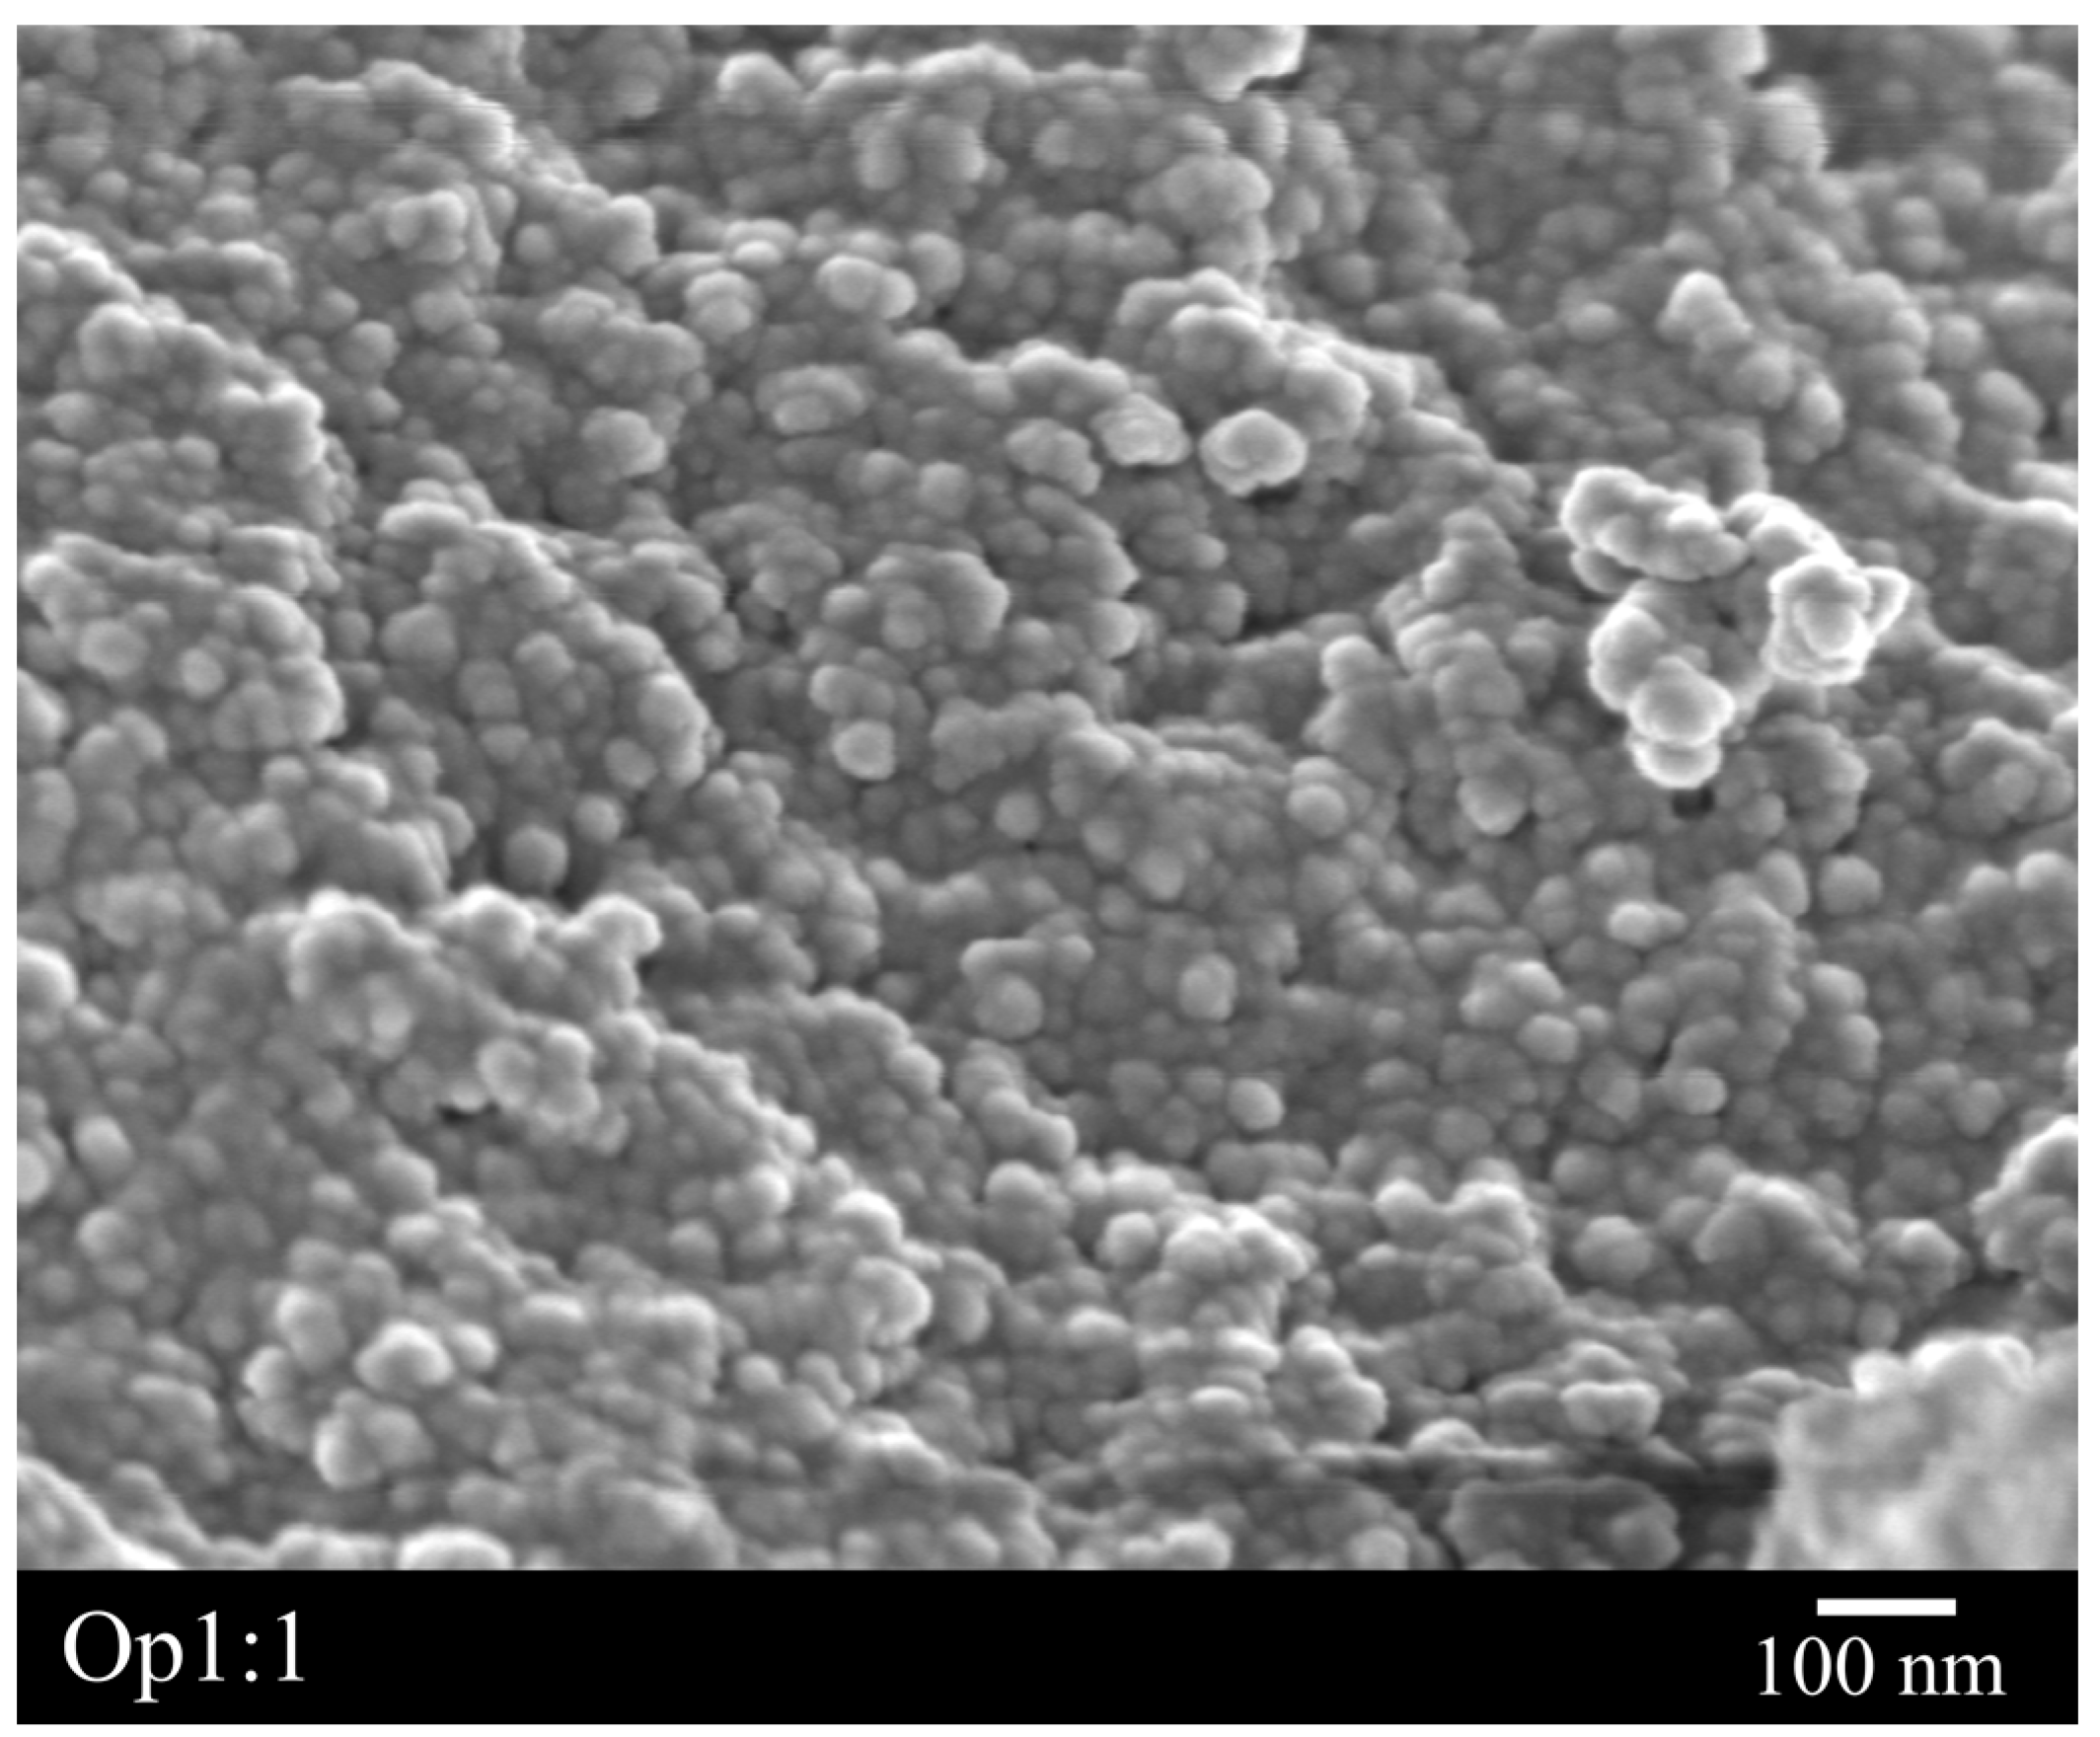
3.1. Silica Nanograin Dimensions
3.2. Synthetic Opal Characterization
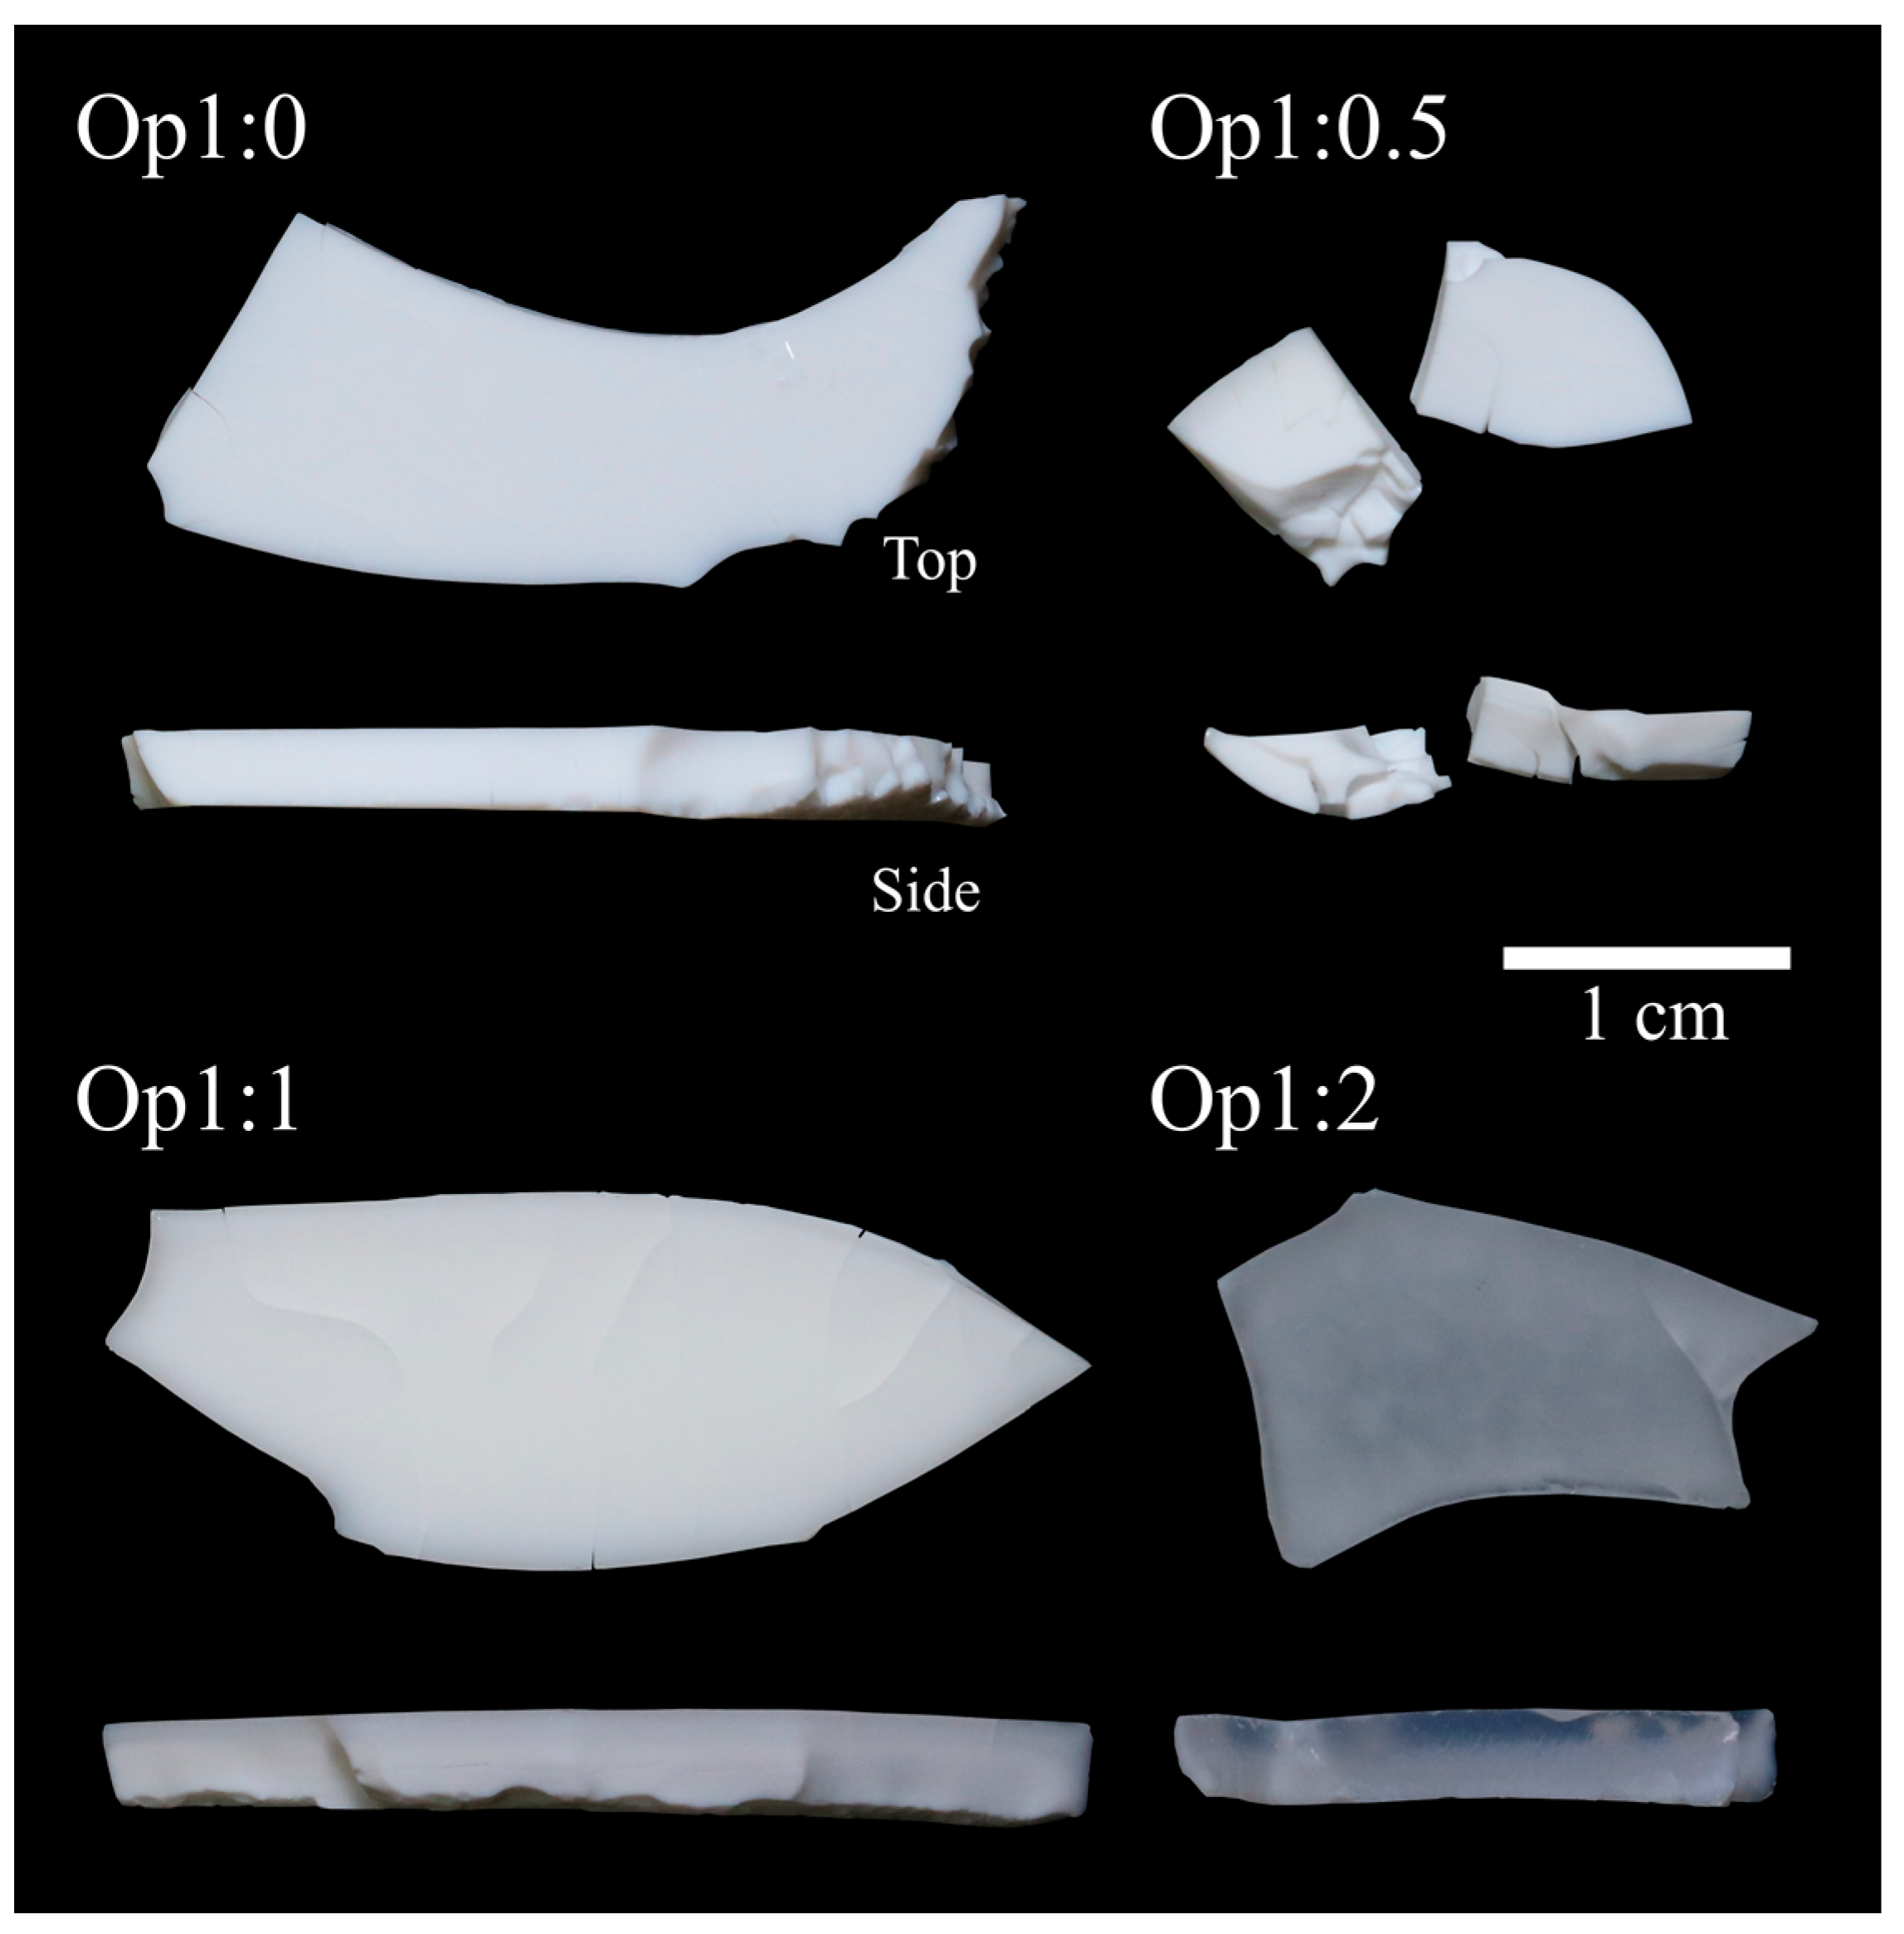
3.2.1. Visual Aspect
3.2.2. Microscopic Aspect
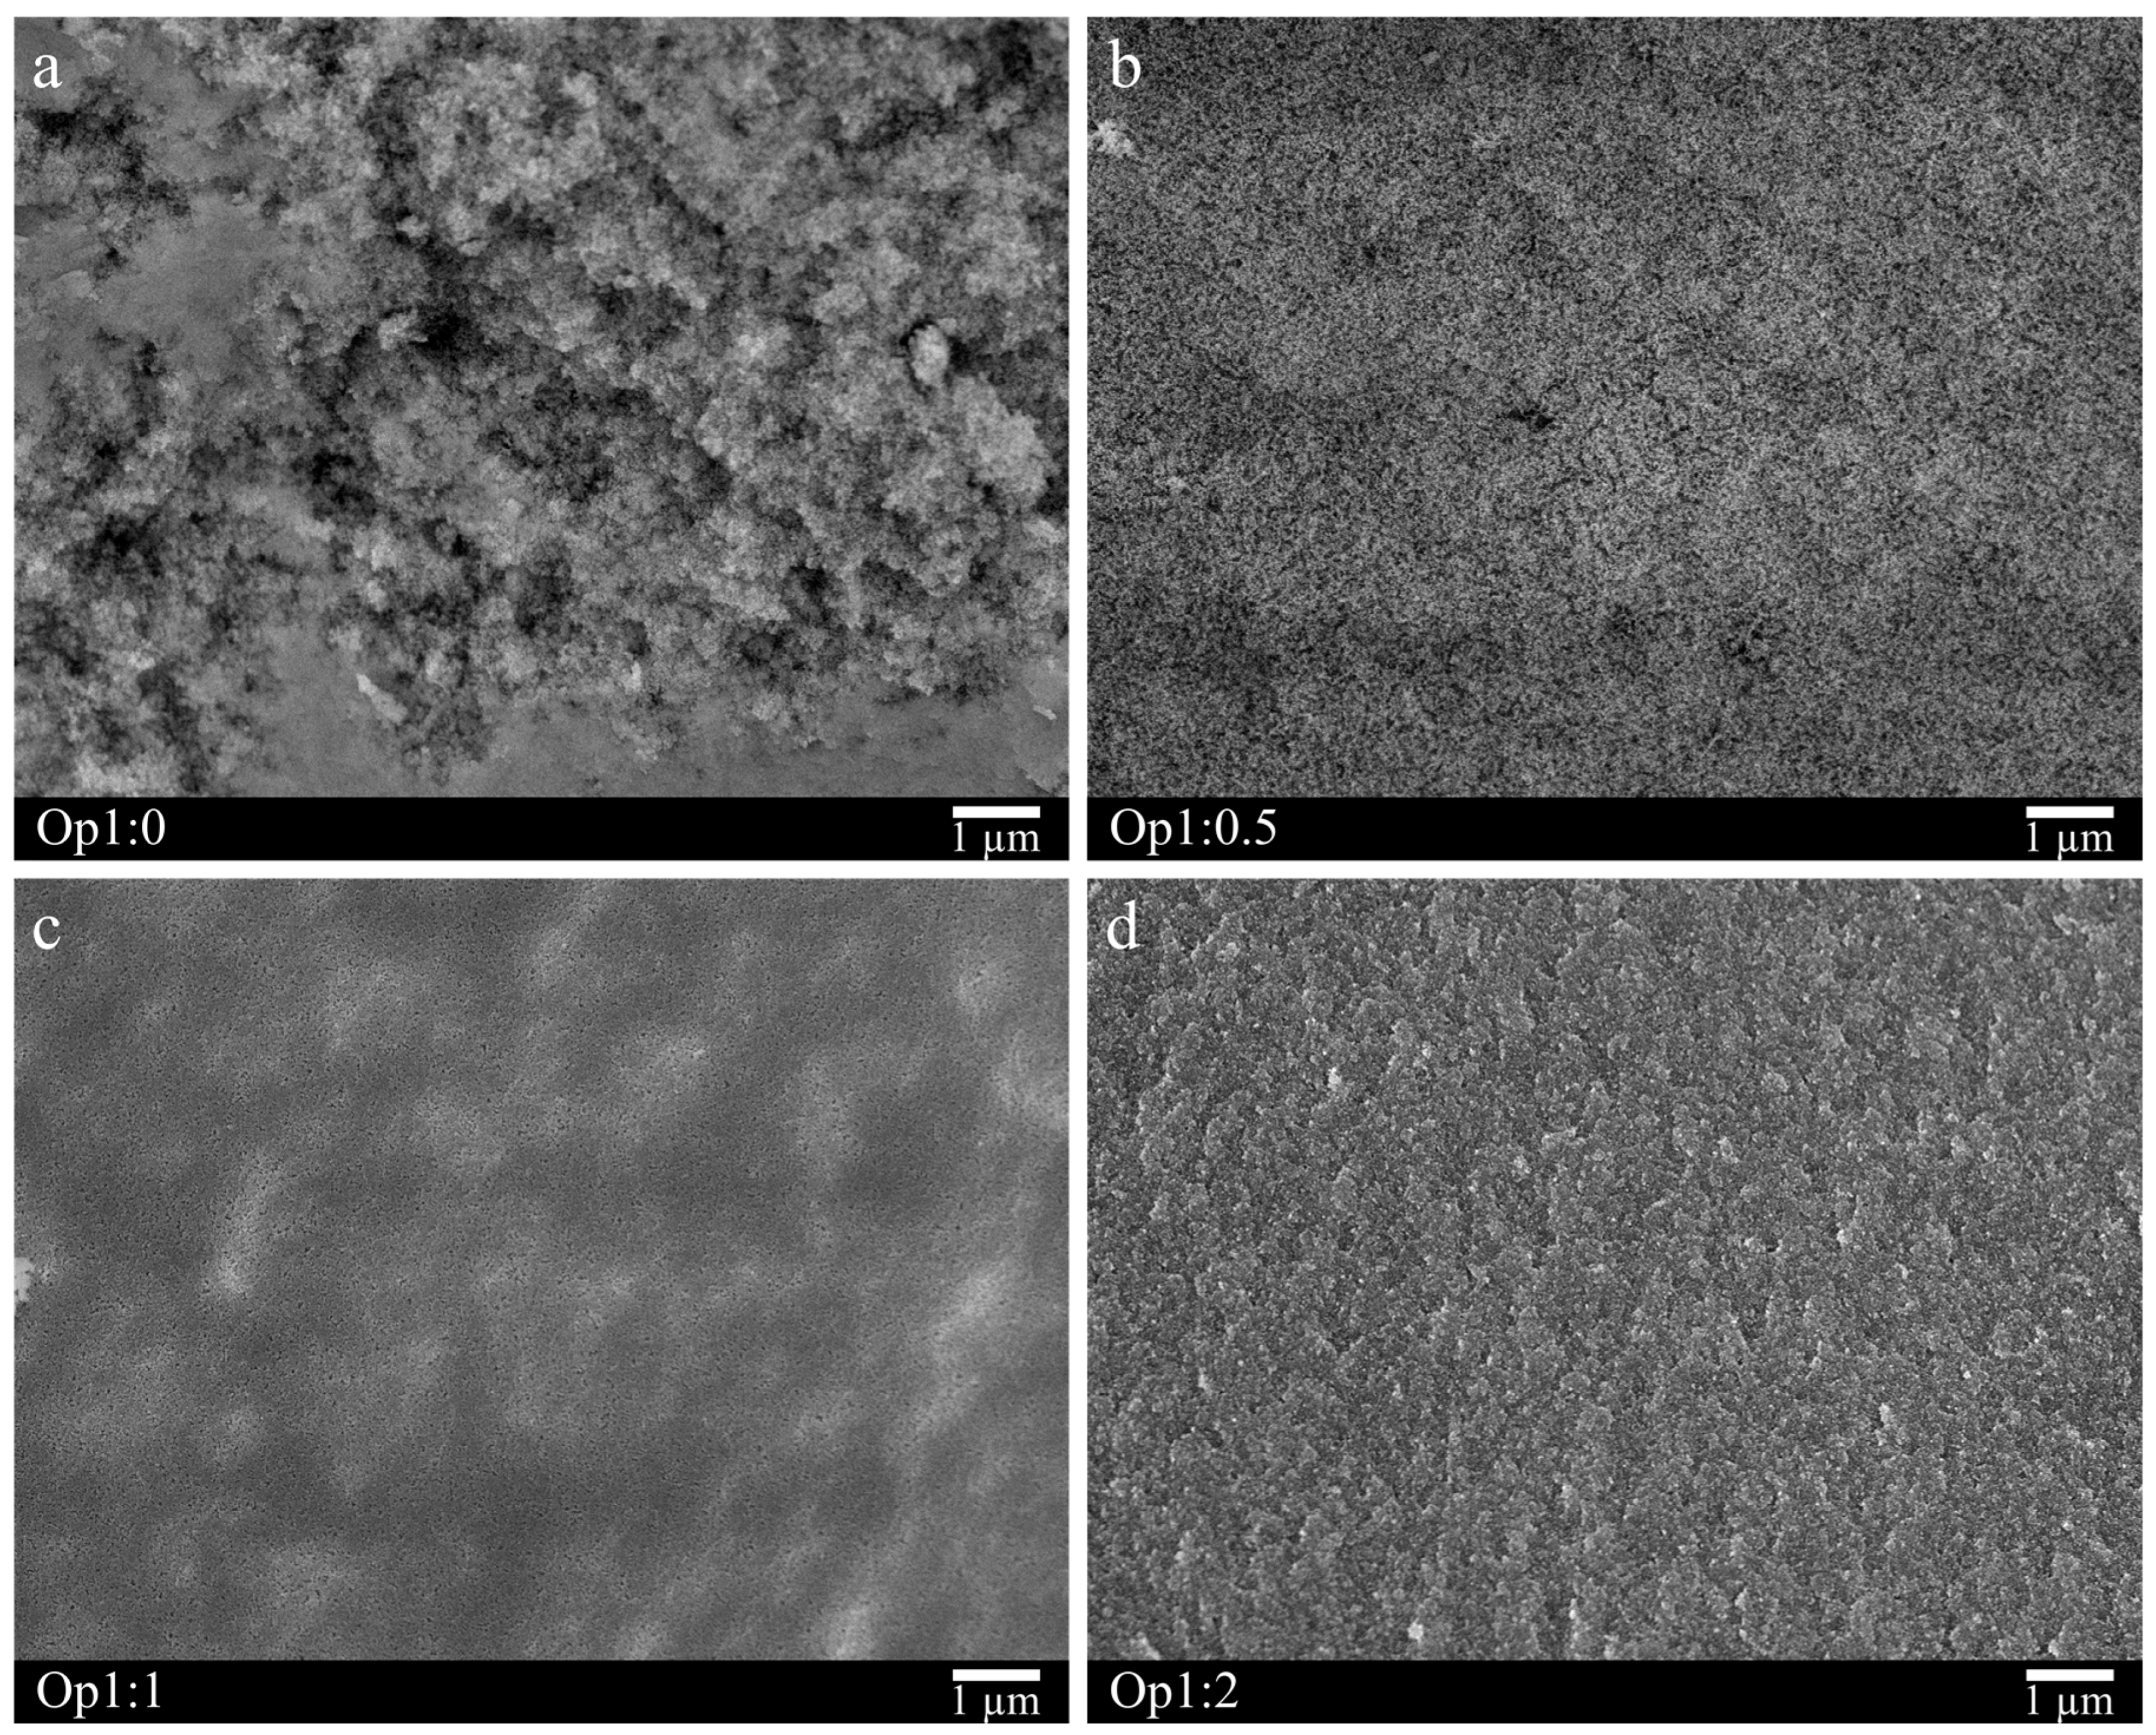
3.2.3. Texture
3.2.4. Chemical Composition
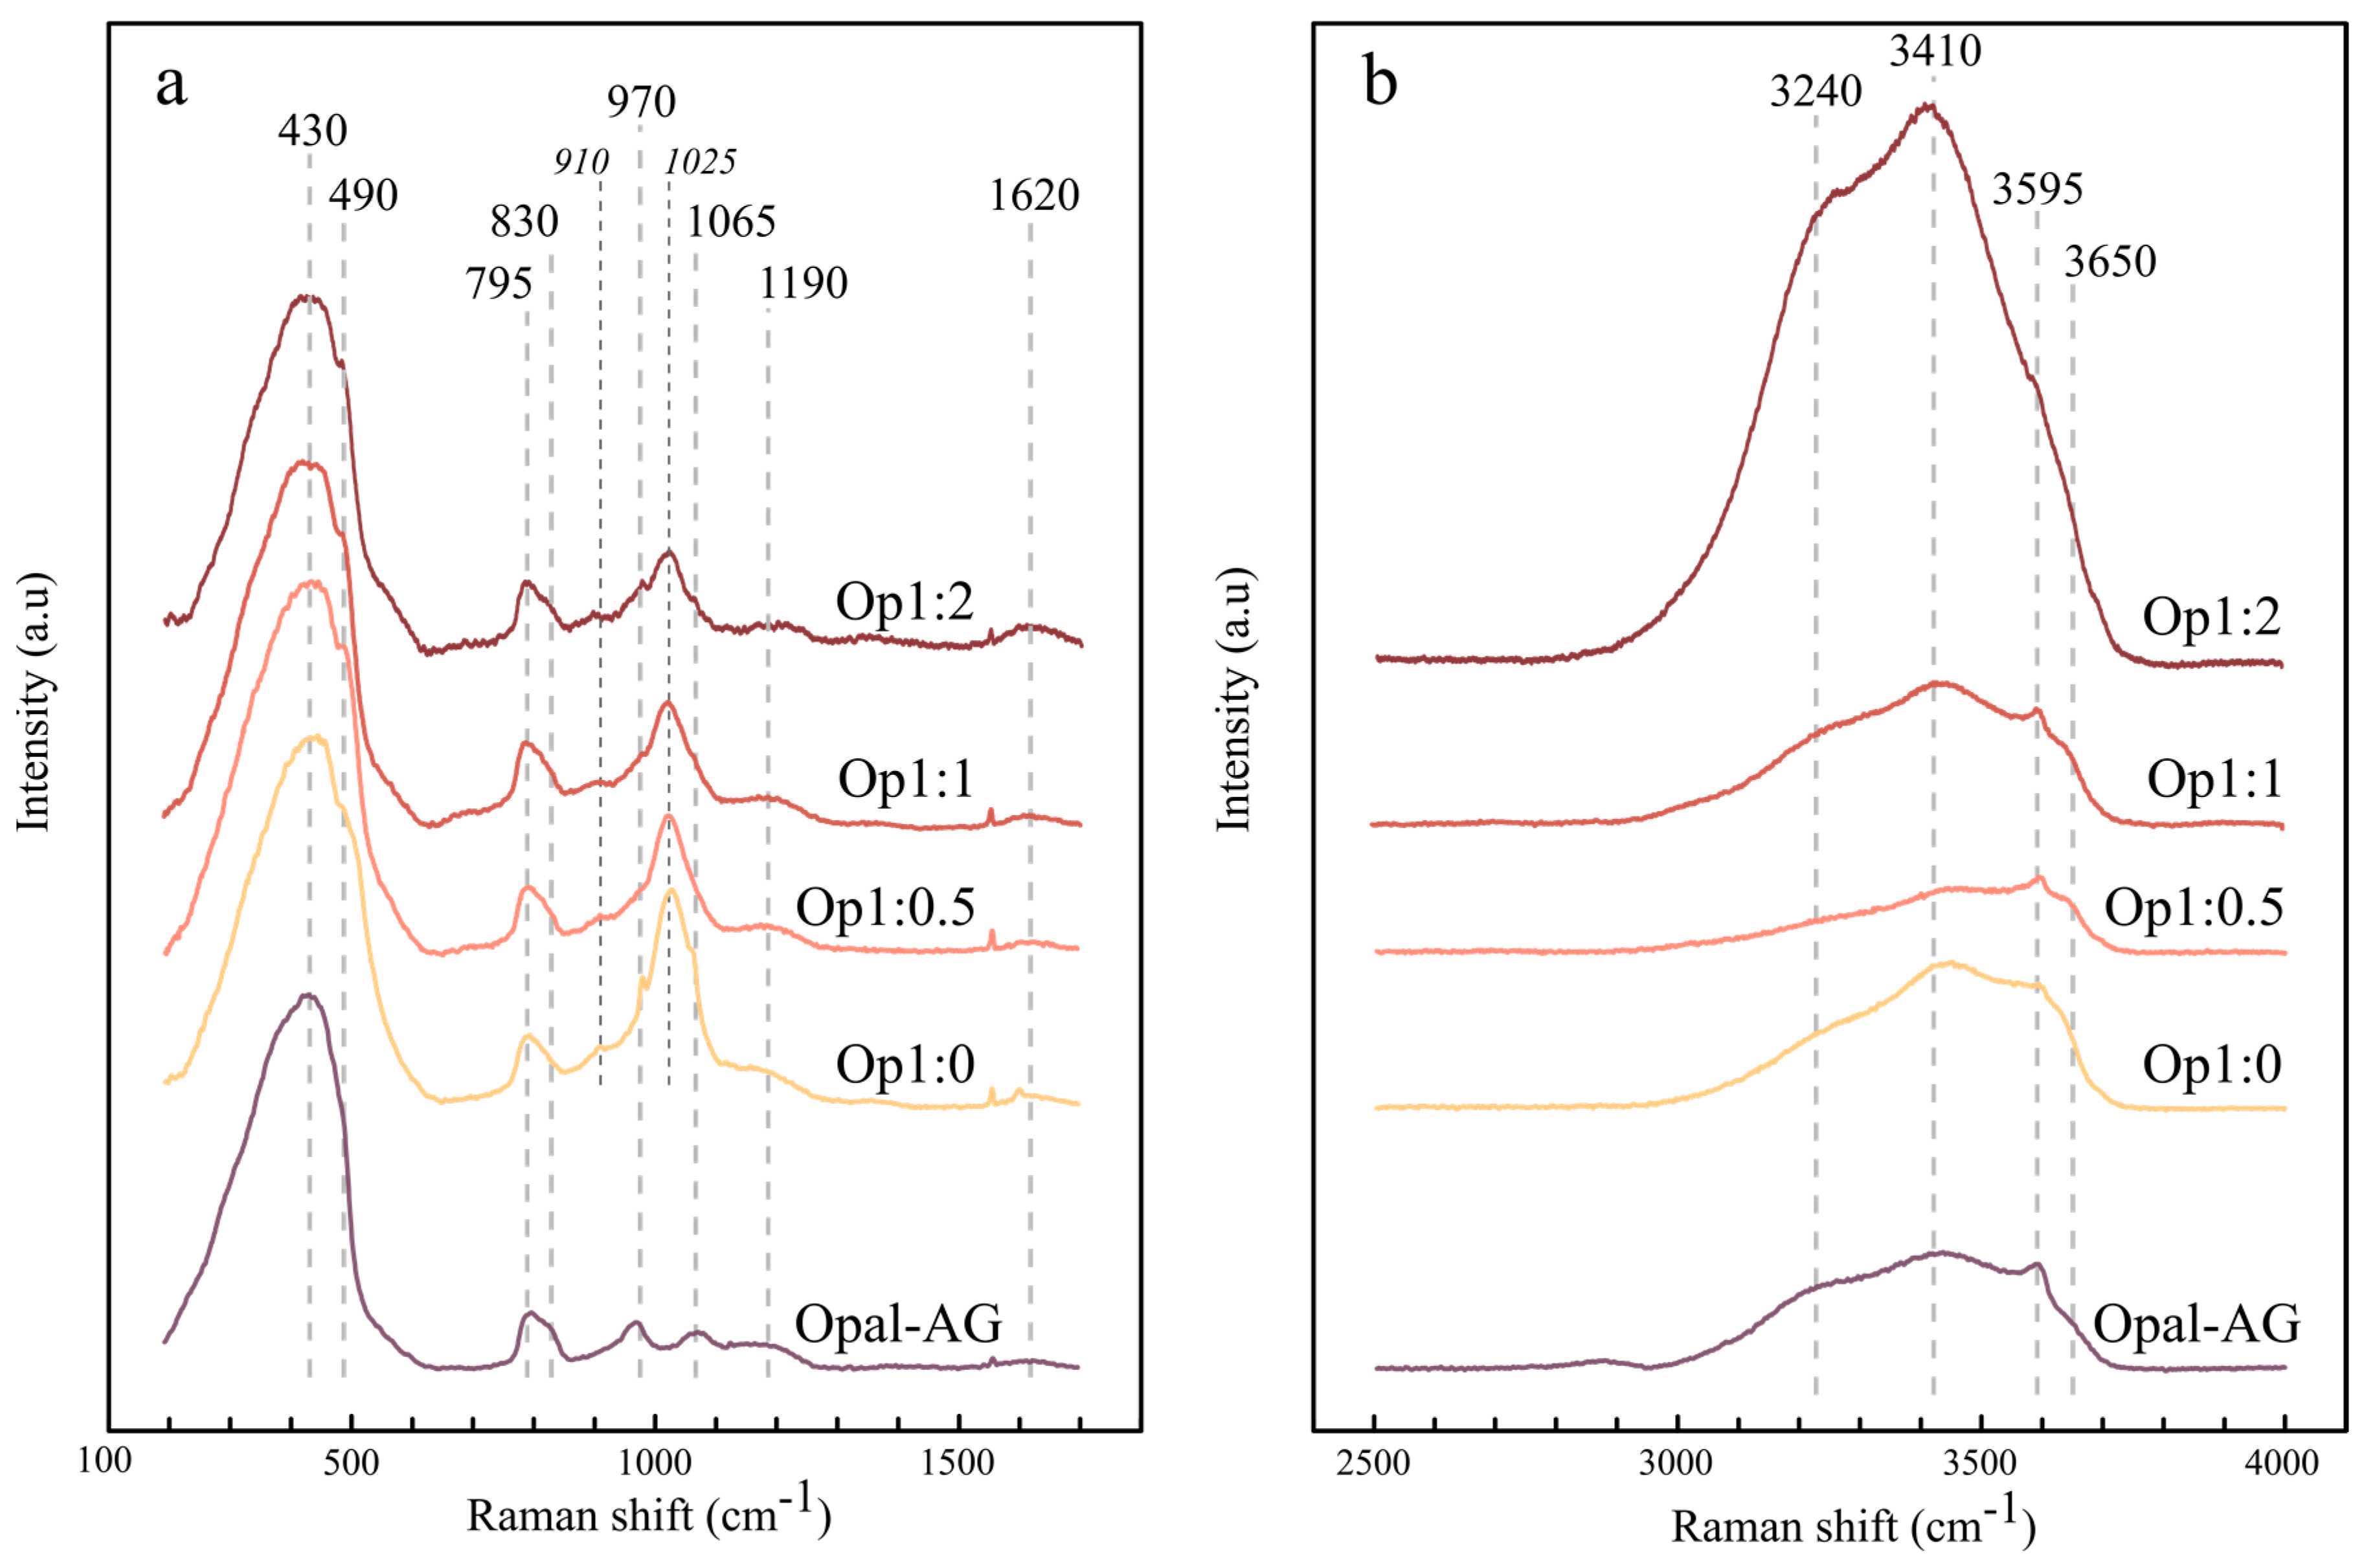
3.2.5. Raman Properties
4. Discussion
4.1. Synthesized Products: Opal-A Analogs
4.1.1. Atomic Structure
4.1.2. Nano- to Micro-Structure
4.1.3. Chemistry
4.1.4. Water State
4.2. Implications for Terrestrial Opal
- We used anomalously high pH thanks to a KOH solution. Thanks to this, we obtained significant yields in reasonable times, which allowed the structural and physical characterization of the final solid product.
4.3. Implications for Martian Opal
5. Conclusions
Supplementary Materials
Author Contributions
Funding
Data Availability Statement
Acknowledgments
Conflicts of Interest
References
- Segnit, E.R.; Stevens, T.J.; Jones, J.B. The Role of Water in Opal. J. Geol. Soc. Aust. 1965, 12, 211–226. [Google Scholar] [CrossRef]
- Jones, J.B.; Segnit, E.R. The Nature of Opal I. Nomenclature and Constituent Phases. J. Geol. Soc. Aust. 1971, 18, 57–68. [Google Scholar] [CrossRef]
- Langer, K.; Flörke, O.W. Near Infrared Absorption Spectra (4000–9000 cm−1) of Opals and the Role of “Water” in the SiO2nH2O Minerals. Fortschritte Mineral. 1974, 52, 17–51. [Google Scholar]
- Thomas, P.; Chauviré, B.; Flower-Donaldson, K.; Aldridge, L.; Smallwood, A.; Liu, B. FT-NIR and DSC Characterisation of Water in Opal. Ceram. Int. 2020, 46, 29443–29450. [Google Scholar] [CrossRef]
- Chauviré, B.; Thomas, P.S. DSC of Natural Opal: Insights into the Incorporation of Crystallisable Water in the Opal Microstructure. J. Therm. Anal. Calorim. 2020, 140, 2077–2085. [Google Scholar] [CrossRef]
- Guthrie, G.D.; Dish, D.L.; Reynolds, R.C., Jr. Modeling the X-ray Diffraction Pattern of Opal-CT. Am. Mineral. 1995, 80, 869–872. [Google Scholar] [CrossRef]
- Elzea, J.M.; Rice, S.B. TEM and X-Ray Diffraction Evidence for Cristobalite and Tridymite Stacking Sequences in Opal. Clays Clay Miner. 1996, 44, 492–500. [Google Scholar] [CrossRef]
- Gaillou, E.; Fritsch, E.; Aguilar-Reyes, B.; Rondeau, B.; Post, J.; Barreau, A.; Ostroumov, M. Common Gem Opal: An Investigation of Micro- to Nano-Structure. Am. Mineral. 2008, 93, 1865–1873. [Google Scholar] [CrossRef]
- Wilson, M.J. The Structure of Opal-CT Revisited. J. Non-Cryst. Solids 2014, 405, 68–75. [Google Scholar] [CrossRef]
- Fröhlich, F. The Opal-CT Nanostructure. J. Non-Cryst. Solids 2020, 533, 119938. [Google Scholar] [CrossRef]
- Smallwood, A.G.; Thomas, P.S.; Ray, A.S. Characterisation of Sedimentary Opals by Fourier Transform Raman Spectroscopy. Spectrochim. Acta Part. A Mol. Biomol. Spectrosc. 1997, 53, 2341–2345. [Google Scholar] [CrossRef]
- Ostroumov, M.; Fritsch, E.; Lasnier, B.; Lefrant, S. Spectres Raman Des Opales: Aspect Diagnostique et Aide a La Classification. Eur. J. Mineral. 1999, 11, 899–908. [Google Scholar] [CrossRef]
- Adamo, I. A Contribution to the Study of FTIR Spectra of Opals. Neues Jahrb. Für Mineral.-Abh. J. Mineral. Geochem. 2010, 187, 63–68. [Google Scholar] [CrossRef]
- Chauviré, B.; Rondeau, B.; Mangold, N. Near Infrared Signature of Opal and Chalcedony as a Proxy for Their Structure and Formation Conditions. Eur. J. Mineral. 2017, 29, 409–421. [Google Scholar] [CrossRef]
- Curtis, N.J.; Gascooke, J.R.; Johnston, M.R.; Pring, A. A Review of the Classification of Opal with Reference to Recent New Localities. Minerals 2019, 9, 299. [Google Scholar] [CrossRef]
- Curtis, N.J.; Gascooke, J.R.; Pring, A. Silicon-Oxygen Region Infrared and Raman Analysis of Opals: The Effect of Sample Preparation and Measurement Type. Minerals 2021, 11, 173. [Google Scholar] [CrossRef]
- Curtis, N.J.; Gascooke, J.R.; Johnston, M.R.; Pring, A. 29Si Solid-State NMR Analysis of Opal-AG, Opal-AN and Opal-CT: Single Pulse Spectroscopy and Spin-Lattice T1 Relaxometry. Minerals 2022, 12, 323. [Google Scholar] [CrossRef]
- Webster, R. Gems: Their Sources, Descriptions and Identification; Butterworth and Co. Publishers: Oxford, UK, 1975. [Google Scholar]
- Summerfield, M.A. Origin and Palaeoenvironmental Interpretation of Sarsens. Nature 1979, 281, 137–139. [Google Scholar] [CrossRef]
- Summerfield, M.A. Silcrete as a Palaeoclimatic Indicator: Evidence from Southern Africa. Palaeogeogr. Palaeoclimatol. Palaeoecol. 1983, 41, 65–79. [Google Scholar] [CrossRef]
- Thiry, M.; Millot, G. Mineralogical Forms of Silica and Their Sequence of Formation in Silcretes. J. Sediment. Res. 1987, 57, 343–352. [Google Scholar] [CrossRef]
- Milnes, A.R.; Wright, M.J.; Thiry, M. Silica Accumulations in Saprolites and Soils in South Australia. Occur. Charact. Genes. Carbonate Gypsum Silica Accumul. Soils 1991, 26, 121–149. [Google Scholar] [CrossRef]
- Thiry, M.; Simon-Coinçon, R. Tertiary Paleoweatherings and Silcretes in the Southern Paris Basin. CATENA 1996, 26, 1–26. [Google Scholar] [CrossRef]
- Ullyott, J.S.; Nash, D.J.; Whiteman, C.A.; Mortimore, R.N. Distribution, Petrology and Mode of Development of Silcretes (Sarsens and Puddingstones) on the Eastern South Downs, UK. Earth Surf. Process. Landf. 2004, 29, 1509–1539. [Google Scholar] [CrossRef]
- Thiry, M.; Milnes, A.R.; Rayot, V.; Simon-CoinÇon, R. Interpretation of Palaeoweathering Features and Successive Silicifications in the Tertiary Regolith of Inland Australia. JGS 2006, 163, 723–736. [Google Scholar] [CrossRef]
- Rondeau, B.; Cenki-Tok, B.; Fritsch, E.; Mazzero, F.; Gauthier, J.-P.; Bodeur, Y.; Bekele, E.; Gaillou, E.; Ayalew, D. Geochemical and Petrological Characterization of Gem Opals from Wegel Tena, Wollo, Ethiopia: Opal Formation in an Oligocene Soil. Geochem. Explor. Environ. Anal. 2012, 12, 93–104. [Google Scholar] [CrossRef]
- Chauviré, B.; Rondeau, B.; Alexandre, A.; Chamard-Bois, S.; La, C.; Mazzero, F. Pedogenic Origin of Precious Opals from Wegel Tena (Ethiopia): Evidence from Trace Elements and Oxygen Isotopes. Appl. Geochem. 2019, 101, 127–139. [Google Scholar] [CrossRef]
- Arnórsson, S. The Use of Mixing Models and Chemical Geothermometers for Estimating Underground Temperatures in Geothermal Systems. J. Volcanol. Geotherm. Res. 1985, 23, 299–335. [Google Scholar] [CrossRef]
- Herzig, P.M.; Becker, K.P.; Stoffers, P.; Bäcker, H.; Blum, N. Hydrothermal Silica Chimney Fields in the Galapagos Spreading Center at 86°W. Earth Planet. Sci. Lett. 1988, 89, 261–272. [Google Scholar] [CrossRef]
- Lalou, C. Deep-Sea Hydrothermal Venting: A Recently Discovered Marine System. J. Mar. Syst. 1991, 1, 403–440. [Google Scholar] [CrossRef]
- Jones, B.; Renaut, R.W. Hot Spring and Geyser Sinters: The Integrated Product of Precipitation, Replacement, and Deposition. Can. J. Earth Sci. 2003, 40, 1549–1569. [Google Scholar] [CrossRef]
- Goryniuk, M.C.; Rivard, B.A.; Jones, B. The Reflectance Spectra of Opal-A (0.5–25 Μm) from the Taupo Volcanic Zone: Spectra That May Identify Hydrothermal Systems on Planetary Surfaces. Geophys. Res. Lett. 2004, 31. [Google Scholar] [CrossRef]
- Channing, A.; Butler, I.B. Cryogenic Opal-A Deposition from Yellowstone Hot Springs. Earth Planet. Sci. Lett. 2007, 257, 121–131. [Google Scholar] [CrossRef]
- Barnes, J.D.; Paulick, H.; Sharp, Z.D.; Bach, W.; Beaudoin, G. Stable Isotope (δ18O, δD, δ37Cl) Evidence for Multiple Fluid Histories in Mid-Atlantic Abyssal Peridotites (ODP Leg 209). Lithos 2009, 110, 83–94. [Google Scholar] [CrossRef]
- Campbell, K.A.; Guido, D.M.; Gautret, P.; Foucher, F.; Ramboz, C.; Westall, F. Geyserite in Hot-Spring Siliceous Sinter: Window on Earth’s Hottest Terrestrial (Paleo)Environment and Its Extreme Life. Earth-Sci. Rev. 2015, 148, 44–64. [Google Scholar] [CrossRef]
- Rey, P.F. Opalisation of the Great Artesian Basin (Central Australia): An Australian Story with a Martian Twist. Aust. J. Earth Sci. 2013, 60, 291–314. [Google Scholar] [CrossRef]
- Staatz, M.H.; Bauer, H.L., Jr. Virgin Valley Opal District, Humboldt County, Nevada; U.S. Geological Survey: Reston, VA, USA, 1951. [CrossRef]
- Koivula, J.I.; Fryer, C.; Keller, P.C. Opal from Querétaro, Mexico: Occurrence and Inclusions. Gems Gemol. 1983, 19, 87–96. [Google Scholar] [CrossRef]
- Spencer, R.J.; Levinson, A.A.; Koivula, J.I. Opal from Quérétaro, Mexico: Fluid Inclusion Study. Gems Gemol. 1992, 28, 28–34. [Google Scholar] [CrossRef]
- Townsend, I.J. The Geology of Australian Opal Deposits. Aust. Gemol. 2001, 21, 34–37. [Google Scholar]
- Ayalew, D.; Pik, R.; Gibson, S.; Yirgu, G.; Ali, S.; Assefa, D. Pedogenic Origin of Mezezo Opal Hosted in Ethiopian Miocene Rhyolites. Can. Mineral. 2020, 58, 231–246. [Google Scholar] [CrossRef]
- Iler, R.K. The Chemistry of Silica, Solubility, Polymerization. Colloid. and Surface Properties, and Biochemistry; Wiley-Interscience: New York, NY, USA, 1979; ISBN 978-0-471-02404-0. [Google Scholar]
- Tobler, D.J.; Shaw, S.; Benning, L.G. Quantification of Initial Steps of Nucleation and Growth of Silica Nanoparticles: An in-Situ SAXS and DLS Study. Geochim. Cosmochim. Acta 2009, 73, 5377–5393. [Google Scholar] [CrossRef]
- Tobler, D.J.; Benning, L.G. In Situ and Time Resolved Nucleation and Growth of Silica Nanoparticles Forming under Simulated Geothermal Conditions. Geochim. Cosmochim. Acta 2013, 114, 156–168. [Google Scholar] [CrossRef]
- Smoluchowski, M. Mathematical Theory of the Kinetics of the Coagulation of Colloidal Solutions. Z. Für Phys. Chem. 1917, 19, 129–135. [Google Scholar]
- Darragh, P.J.; Gaskin, A.J.; Terrell, B.C.; Sanders, J.V. Origin of Precious Opal. Nature 1966, 209, 13–16. [Google Scholar] [CrossRef]
- Salvarezza, R.C.; Vázquez, L.; Míguez, H.; Mayoral, R.; López, C.; Meseguer, F. Edward-Wilkinson Behavior of Crystal Surfaces Grown By Sedimentation of SiO2 Nanospheres. Phys. Rev. Lett. 1996, 77, 4572–4575. [Google Scholar] [CrossRef]
- Sanders, J.V. Colour of Precious Opal. Nature 1964, 204, 1151–1153. [Google Scholar] [CrossRef]
- Stöber, W.; Fink, A.; Bohn, E. Controlled Growth of Monodisperse Silica Spheres in the Micron Size Range. J. Colloid Interface Sci. 1968, 26, 62–69. [Google Scholar] [CrossRef]
- Yoshida, A. Silica Nucleation, Polymerization, and Growth Preparation of Monodispersed Sols. Adv. Chem. 1994, 234, 51–66. [Google Scholar]
- Schlomach, J.; Kind, M. Investigations on the Semi-Batch Precipitation of Silica. J. Colloid Interface Sci. 2004, 277, 316–326. [Google Scholar] [CrossRef] [PubMed]
- Tan, T.T.Y.; Liu, S.; Zhang, Y.; Han, M.Y.; Selvan, S.T. Microemulsion Preparative Methods (Overview). Compr. Nanosci. Technol. 2011, 5, 399–441. [Google Scholar] [CrossRef]
- Rezaei, S.; Manoucheri, I.; Moradian, R.; Pourabbas, B. One-Step Chemical Vapor Deposition and Modification of Silica Nanoparticles at the Lowest Possible Temperature and Superhydrophobic Surface Fabrication. Chem. Eng. J. 2014, 252, 11–16. [Google Scholar] [CrossRef]
- Nabil, M.; Motaweh, H.A. Silica Nanoparticles Preparation Using Alkali Etching Process. Appl. Mech. Mater. 2015, 749, 155–158. [Google Scholar] [CrossRef]
- Nabil, M.; Mahmoud, K.R.; El-Shaer, A.; Nayber, H.A. Preparation of Crystalline Silica (Quartz, Cristobalite, and Tridymite) and Amorphous Silica Powder (One Step). J. Phys. Chem. Solids 2018, 121, 22–26. [Google Scholar] [CrossRef]
- Awaji, N.; Ohkubo, S.; Nakanishi, T.; Aoyama, T.; Sugita, Y.; Takasaki, K.; Komiya, S. Thermal Oxide Growth at Chemical Vapor Deposited SiO2/Si Interface during Annealing Evaluated by Difference X-ray Reflectivity. Appl. Phys. Lett. 1997, 71, 1954–1956. [Google Scholar] [CrossRef]
- Jang, H.D. Experimental Study of Synthesis of Silica Nanoparticles by a Bench-Scale Diffusion Flame Reactor. Powder Technol. 2001, 119, 102–108. [Google Scholar] [CrossRef]
- Cai, X.; Hong, R.Y.; Wang, L.S.; Wang, X.Y.; Li, H.Z.; Zheng, Y.; Wei, D.G. Synthesis of Silica Powders by Pressured Carbonation. Chem. Eng. J. 2009, 151, 380–386. [Google Scholar] [CrossRef]
- Wu, Z.; Hu, X.; Tao, C.; Li, Y.; Liu, J.; Yang, C.; Shen, D.; Li, G. Direct and Label-Free Detection of Cholic Acid Based on Molecularly Imprinted Photonic Hydrogels. J. Mater. Chem. 2008, 18, 5452. [Google Scholar] [CrossRef]
- Koay, N.; Burgess, I.B.; Kay, T.M.; Nerger, B.A.; Miles-Rossouw, M.; Shirman, T.; Vu, T.L.; England, G.; Phillips, K.R.; Utech, S.; et al. Hierarchical Structural Control of Visual Properties in Self-Assembled Photonic-Plasmonic Pigments. Opt. Express 2014, 22, 27750. [Google Scholar] [CrossRef]
- Vazquez, N.I.; Gonzalez, Z.; Ferrari, B.; Castro, Y. Synthesis of Mesoporous Silica Nanoparticles by Sol–Gel as Nanocontainer for Future Drug Delivery Applications. Boletín Soc. Española Cerámica Y Vidr. 2017, 56, 139–145. [Google Scholar] [CrossRef]
- Rothbaum, H.P.; Rohde, A.G. Kinetics of Silica Polymerization and Deposition from Dilute Solutions between 5 and 180°C. J. Colloid Interface Sci. 1979, 71, 533–559. [Google Scholar] [CrossRef]
- Icopini, G.A.; Brantley, S.L.; Heaney, P.J. Kinetics of Silica Oligomerization and Nanocolloid Formation as a Function of pH and Ionic Strength at 25 °C. Geochim. Cosmochim. Acta 2005, 69, 293–303. [Google Scholar] [CrossRef]
- Conrad, C.F.; Icopini, G.A.; Yasuhara, H.; Bandstra, J.Z.; Brantley, S.L.; Heaney, P.J. Modeling the Kinetics of Silica Nanocolloid Formation and Precipitation in Geologically Relevant Aqueous Solutions. Geochim. Cosmochim. Acta 2007, 71, 531–542. [Google Scholar] [CrossRef]
- Scott, S.; Galeczka, I.M.; Gunnarsson, I.; Arnórsson, S.; Stefánsson, A. Silica Polymerization and Nanocolloid Nucleation and Growth Kinetics in Aqueous Solutions. Geochim. Cosmochim. Acta 2024, 371, 78–94. [Google Scholar] [CrossRef]
- Gunnarsson, I.; Rsson, S.N.A. Amorphous Silica Solubility and the Thermodynamic Properties of H4SiO4 in the Range of 0° to 350 °C at Psat. Geochim. Cosmochim. Acta 2000, 64, 2295–2307. [Google Scholar] [CrossRef]
- Gunnarsson, I.; Arnórsson, S. Impact of Silica Scaling on the Efficiency of Heat Extraction from High-Temperature Geothermal Fluids. Geothermics 2005, 34, 320–329. [Google Scholar] [CrossRef]
- Van Den Heuvel, D.B.; Gunnlaugsson, E.; Gunnarsson, I.; Stawski, T.M.; Peacock, C.L.; Benning, L.G. Understanding Amorphous Silica Scaling under Well-Constrained Conditions inside Geothermal Pipelines. Geothermics 2018, 76, 231–241. [Google Scholar] [CrossRef]
- Gaillou, E.; Delaunay, A.; Rondeau, B.; Bouhnik-le-Coz, M.; Fritsch, E.; Cornen, G.; Monnier, C. The Geochemistry of Gem Opals as Evidence of Their Origin. Ore Geol. Rev. 2008, 34, 113–126. [Google Scholar] [CrossRef]
- Rapin, W.; Chauviré, B.; Gabriel, T.S.J.; McAdam, A.C.; Ehlmann, B.L.; Hardgrove, C.; Meslin, P.-Y.; Rondeau, B.; Dehouck, E.; Franz, H.B.; et al. In Situ Analysis of Opal in Gale Crater, Mars. JGR Planets 2018, 123, 1955–1972. [Google Scholar] [CrossRef]
- Pineau, M.; Le Deit, L.; Chauviré, B.; Carter, J.; Rondeau, B.; Mangold, N. Toward the Geological Significance of Hydrated Silica Detected by near Infrared Spectroscopy on Mars Based on Terrestrial Reference Samples. Icarus 2020, 347, 113706. [Google Scholar] [CrossRef]
- Tsai, M.-S. The Study of Formation Colloidal Silica via Sodium Silicate. Mater. Sci. Eng. B 2004, 106, 52–55. [Google Scholar] [CrossRef]
- Matsoukas, T.; Gulari, E. Monomer-Addition Growth with a Slow Initiation Step: A Growth Model for Silica Particles from Alkoxides. J. Colloid Interface Sci. 1989, 132, 13–21. [Google Scholar] [CrossRef]
- Qomariyah, L.; Sasmita, F.N.; Novaldi, H.R.; Widiyastuti, W.; Winardi, S. Preparation of Stable Colloidal Silica with Controlled Size Nano Spheres from Sodium Silicate Solution. IOP Conf. Ser. Mater. Sci. Eng. 2018, 395, 012017. [Google Scholar] [CrossRef]
- Sjöberg, S. Silica in Aqueous Environments. J. Non-Cryst. Solids 1996, 196, 51–57. [Google Scholar] [CrossRef]
- Brunauer, S.; Emmett, P.H.; Teller, E. Adsorption of Gases in Multimolecular Layers. J. Am. Chem. Soc. 1938, 60, 309–319. [Google Scholar] [CrossRef]
- Barrett, E.P.; Joyner, L.G.; Halenda, P.P. The Determination of Pore Volume and Area Distributions in Porous Substances. I. Computations from Nitrogen Isotherms. J. Am. Chem. Soc. 1951, 73, 373–380. [Google Scholar] [CrossRef]
- Jochum, K.P.; Weis, U.; Schwager, B.; Stoll, B.; Wilson, S.A.; Haug, G.H.; Andreae, M.O.; Enzweiler, J. Reference Values Following ISO Guidelines for Frequently Requested Rock Reference Materials. Geostand. Geoanalytical Res. 2016, 40, 333–350. [Google Scholar] [CrossRef]
- Brawer, S.A.; White, W.B. Raman Spectroscopic Investigation of the Structure of Silicate Glasses. I. The Binary Alkali Silicates. J. Chem. Phys. 1975, 63, 2421–2432. [Google Scholar] [CrossRef]
- Virgo, D.; Mysen, B.O.; Kushiro, I. Anionic Constitution of 1-Atmosphere Silicate Melts: Implications for the Structure of Igneous Melts. Science 1980, 208, 1371–1373. [Google Scholar] [CrossRef]
- Mysen, B.O.; Virgo, D.; Seifert, F.A. The Structure of Silicate Melts: Implications for Chemical and Physical Properties of Natural Magma. Rev. Geophys. 1982, 20, 353–383. [Google Scholar] [CrossRef]
- McMillan, P. Structural Studies of Silicate Glasses and Melts-Applications and Limitations of Raman Spectroscopy. Am. Mineral. 1984, 69, 622–644. [Google Scholar]
- Rossano, S.; Mysen, B. Raman Spectroscopy of Silicate Glasses and Melts in Geological Systems. In Raman Spectroscopy Applied to Earth Sciences and Cultural Heritage; Ferraris, G., Dubessy, J., Caumon, M.-C., Rull, F., Eds.; European Mineralogical Union: London, UK, 2012; pp. 321–366. ISBN 978-0-903056-31-1. [Google Scholar] [CrossRef]
- Le Losq, C.; Neuville, D.R. Effect of the Na/K Mixing on the Structure and the Rheology of Tectosilicate Silica-Rich Melts. Chem. Geol. 2013, 346, 57–71. [Google Scholar] [CrossRef]
- Farfan, G.A.; McKeown, D.A.; Post, J.E. Mineralogical Characterization of Biosilicas versus Geological Analogs. Geobiology 2023, 21, 520–533. [Google Scholar] [CrossRef] [PubMed]
- Matson, D.W.; Sharma, S.K.; Philpotts, J.A. The Structure of High-Silica Alkali-Silicate Glasses. A Raman Spectroscopic Investigation. J. Non-Cryst. Solids 1983, 58, 323–352. [Google Scholar] [CrossRef]
- Chabiron, A.; Pironon, J.; Massare, D. Characterization of Water in Synthetic Rhyolitic Glasses and Natural Melt Inclusions by Raman Spectroscopy. Contrib. Mineral. Petrol. 2004, 146, 485–492. [Google Scholar] [CrossRef]
- Zarubin, D.P. The Two-Component Bands at about 4500 and 800 Cm-1 in Infrared Spectra of Hydroxyl-Containing Silicas. Interpretation in Terms of Fermi Resonance. J. Non-Cryst. Solids 2001, 286, 80–88. [Google Scholar] [CrossRef]
- Sodo, A.; Casanova Municchia, A.; Barucca, S.; Bellatreccia, F.; Della Ventura, G.; Butini, F.; Ricci, M.A. Raman, FT-IR and XRD Investigation of Natural Opals. J. Raman Spectrosc. 2016, 47, 1444–1451. [Google Scholar] [CrossRef]
- Hartwig, C.M.; Rahn, L.A. Bound Hydroxyl in Vitreous Silica. J. Chem. Phys. 1977, 67, 4260–4261. [Google Scholar] [CrossRef]
- McMillan, P.; Remmele, R.L. Hydroxyl Sites in SiO2 Glass: A Note on Infrared and Raman Spectra. Am. Mineral. 1986, 71, 772–778. [Google Scholar]
- Mulder, C.A.M.; Damen, A.A.J.M. The Origin of the “Defect” 490 Cm−1 Raman Peak in Silica Gel. J. Non-Cryst. Solids 1987, 93, 387–394. [Google Scholar] [CrossRef]
- Gouzy, S.; Rondeau, B.; Gaudin, P.; Louarn, G.; La, C.; Lebeau, T.; Vinogradoff, V.; Clodoré, L.; Chamard-Bois, S. Whitening of Fire Opal: Transformation of Silica in Soils. Chem. Geol. 2023, 616, 121237. [Google Scholar] [CrossRef]
- Chauviré, B.; Mollé, V.; Guichard, F.; Rondeau, B.; Thomas, P.S.; Fritsch, E. Cracking of Gem Opals. Minerals 2023, 13, 356. [Google Scholar] [CrossRef]
- Depasse, J.; Watillon, A. The Stability of Amorphous Colloidal Silica. J. Colloid Interface Sci. 1970, 33, 430–438. [Google Scholar] [CrossRef]
- Vrij, A.; Sonntag, H.; Težak, B.; Kitchener, J.A.; Matijevič, E.; Mysels, K.J.; Overbeek, J.T.G.; Corkill, J.M.; Goodman, J.F.; Fowkes, F.M.; et al. General Discussion. Discuss. Faraday Soc. 1966, 42, 60–68. [Google Scholar] [CrossRef]
- Davis, K.M.; Tomozawa, M. An Infrared Spectroscopic Study of Water-Related Species in Silica Glasses. J. Non-Cryst. Solids 1996, 201, 177–198. [Google Scholar] [CrossRef]
- Muster, T.H.; Prestidge, C.A.; Hayes, R.A. Water Adsorption Kinetics and Contact Angles of Silica Particles. Colloids Surf. A Physicochem. Eng. Asp. 2001, 176, 253–266. [Google Scholar] [CrossRef]
- Ng, K.C.; Chua, H.T.; Chung, C.Y.; Loke, C.H.; Kashiwagi, T.; Akisawa, A.; Saha, B.B. Experimental Investigation of the Silica Gel–Water Adsorption Isotherm Characteristics. Appl. Therm. Eng. 2001, 21, 1631–1642. [Google Scholar] [CrossRef]
- Ilgen, A.G.; Kabengi, N.; Leung, K.; Ilani-Kashkouli, P.; Knight, A.W.; Loera, L. Defining Silica–Water Interfacial Chemistry under Nanoconfinement Using Lanthanides. Environ. Sci. Nano 2021, 8, 432–443. [Google Scholar] [CrossRef]
- Day, R.; Jones, B. Variations in Water Content in Opal-A and Opal-CT from Geyser Discharge Aprons. J. Sediment. Res. 2008, 78, 301–315. [Google Scholar] [CrossRef]
- Brown, L.D.; Ray, A.S.; Thomas, P.S. Elemental Analysis of Australian Amorphous Banded Opals by Laser-Ablation ICP-MS. Neues Jahrb. Für Mineral.-Monatshefte 2004, 2004, 411–424. [Google Scholar] [CrossRef]
- McOrist, G.D.; Smallwood, A.; Fardy, J.J. Trace Elements in Australian Opals Using Neutron Activation Analysis. J. Radioanal. Nucl. Chem. Artic. 1994, 185, 293–303. [Google Scholar] [CrossRef]
- McOrist, G.D.; Smallwood, A. Trace Elements in Coloured Opals Using Neutron Activation Analysis. J. Radioanal. Nucl. Chem. Artic. 1995, 198, 499–510. [Google Scholar] [CrossRef]
- McOrist, G.D.; Smallwood, A. Trace Elements in Precious and Common Opals Using Neutron Activation Analysis. J. Radioanal. Nucl. Chem. 1997, 223, 9–15. [Google Scholar] [CrossRef]
- Carter, J.; Riu, L.; Poulet, F.; Bibring, J.-P.; Langevin, Y.; Gondet, B. A Mars Orbital Catalog of Aqueous Alteration Signatures (MOCAAS). Icarus 2023, 389, 115164. [Google Scholar] [CrossRef]
- Sun, V.Z.; Milliken, R.E. Distinct Geologic Settings of Opal-A and More Crystalline Hydrated Silica on Mars. Geophys. Res. Lett. 2018, 45, 10221–10228. [Google Scholar] [CrossRef]
- Pan, L.; Carter, J.; Quantin-Nataf, C.; Pineau, M.; Chauviré, B.; Mangold, N.; Le Deit, L.; Rondeau, B.; Chevrier, V. Voluminous Silica Precipitated from Martian Waters during Late-Stage Aqueous Alteration. Planet. Sci. J. 2021, 2, 65. [Google Scholar] [CrossRef]
- Gabriel, T.S.J.; Hardgrove, C.; Achilles, C.N.; Rampe, E.B.; Rapin, W.; Nowicki, S.; Czarnecki, S.; Thompson, L.; Nikiforov, S.; Litvak, M.; et al. On an Extensive Late Hydrologic Event in Gale Crater as Indicated by Water-Rich Fracture Halos. J. Geophys. Res. Planets 2022, 127, e2020JE006600. [Google Scholar] [CrossRef]


| Sample | Nanograin Solution | Hydrogel Solution | ||||
|---|---|---|---|---|---|---|
| Na2SiO3 | KOH | Na2SiO3 | ||||
| C (mol/L) | V (mL) | C (mol/L) | V (mL) | C (mol/L) | V (mL) | |
| Op1:0 | 1.147 | 100 | 0.445 | 20 | / | / |
| Op1:0.5 | 1.147 | 100 | 0.445 | 20 | 1.147 | 50 |
| Op1:1 | 1.147 | 100 | 0.445 | 20 | 1.147 | 100 |
| Op1:2 | 1.147 | 100 | 0.445 | 20 | 1.147 | 200 |
| Sample | Specific Surface Area (m2/g) | C Parameter | Porous Volume at p/p° = 0.99 |
|---|---|---|---|
| Op1:0 | 21 ± 1 | 130 | 0.20 |
| Op1:0.5 | 44 ± 2 | 143 | 0.26 |
| Op1:1 | 44 ± 2 | 140 | 0.32 |
| Op1:2 | 158 ± 2 | 145 | 0.39 |
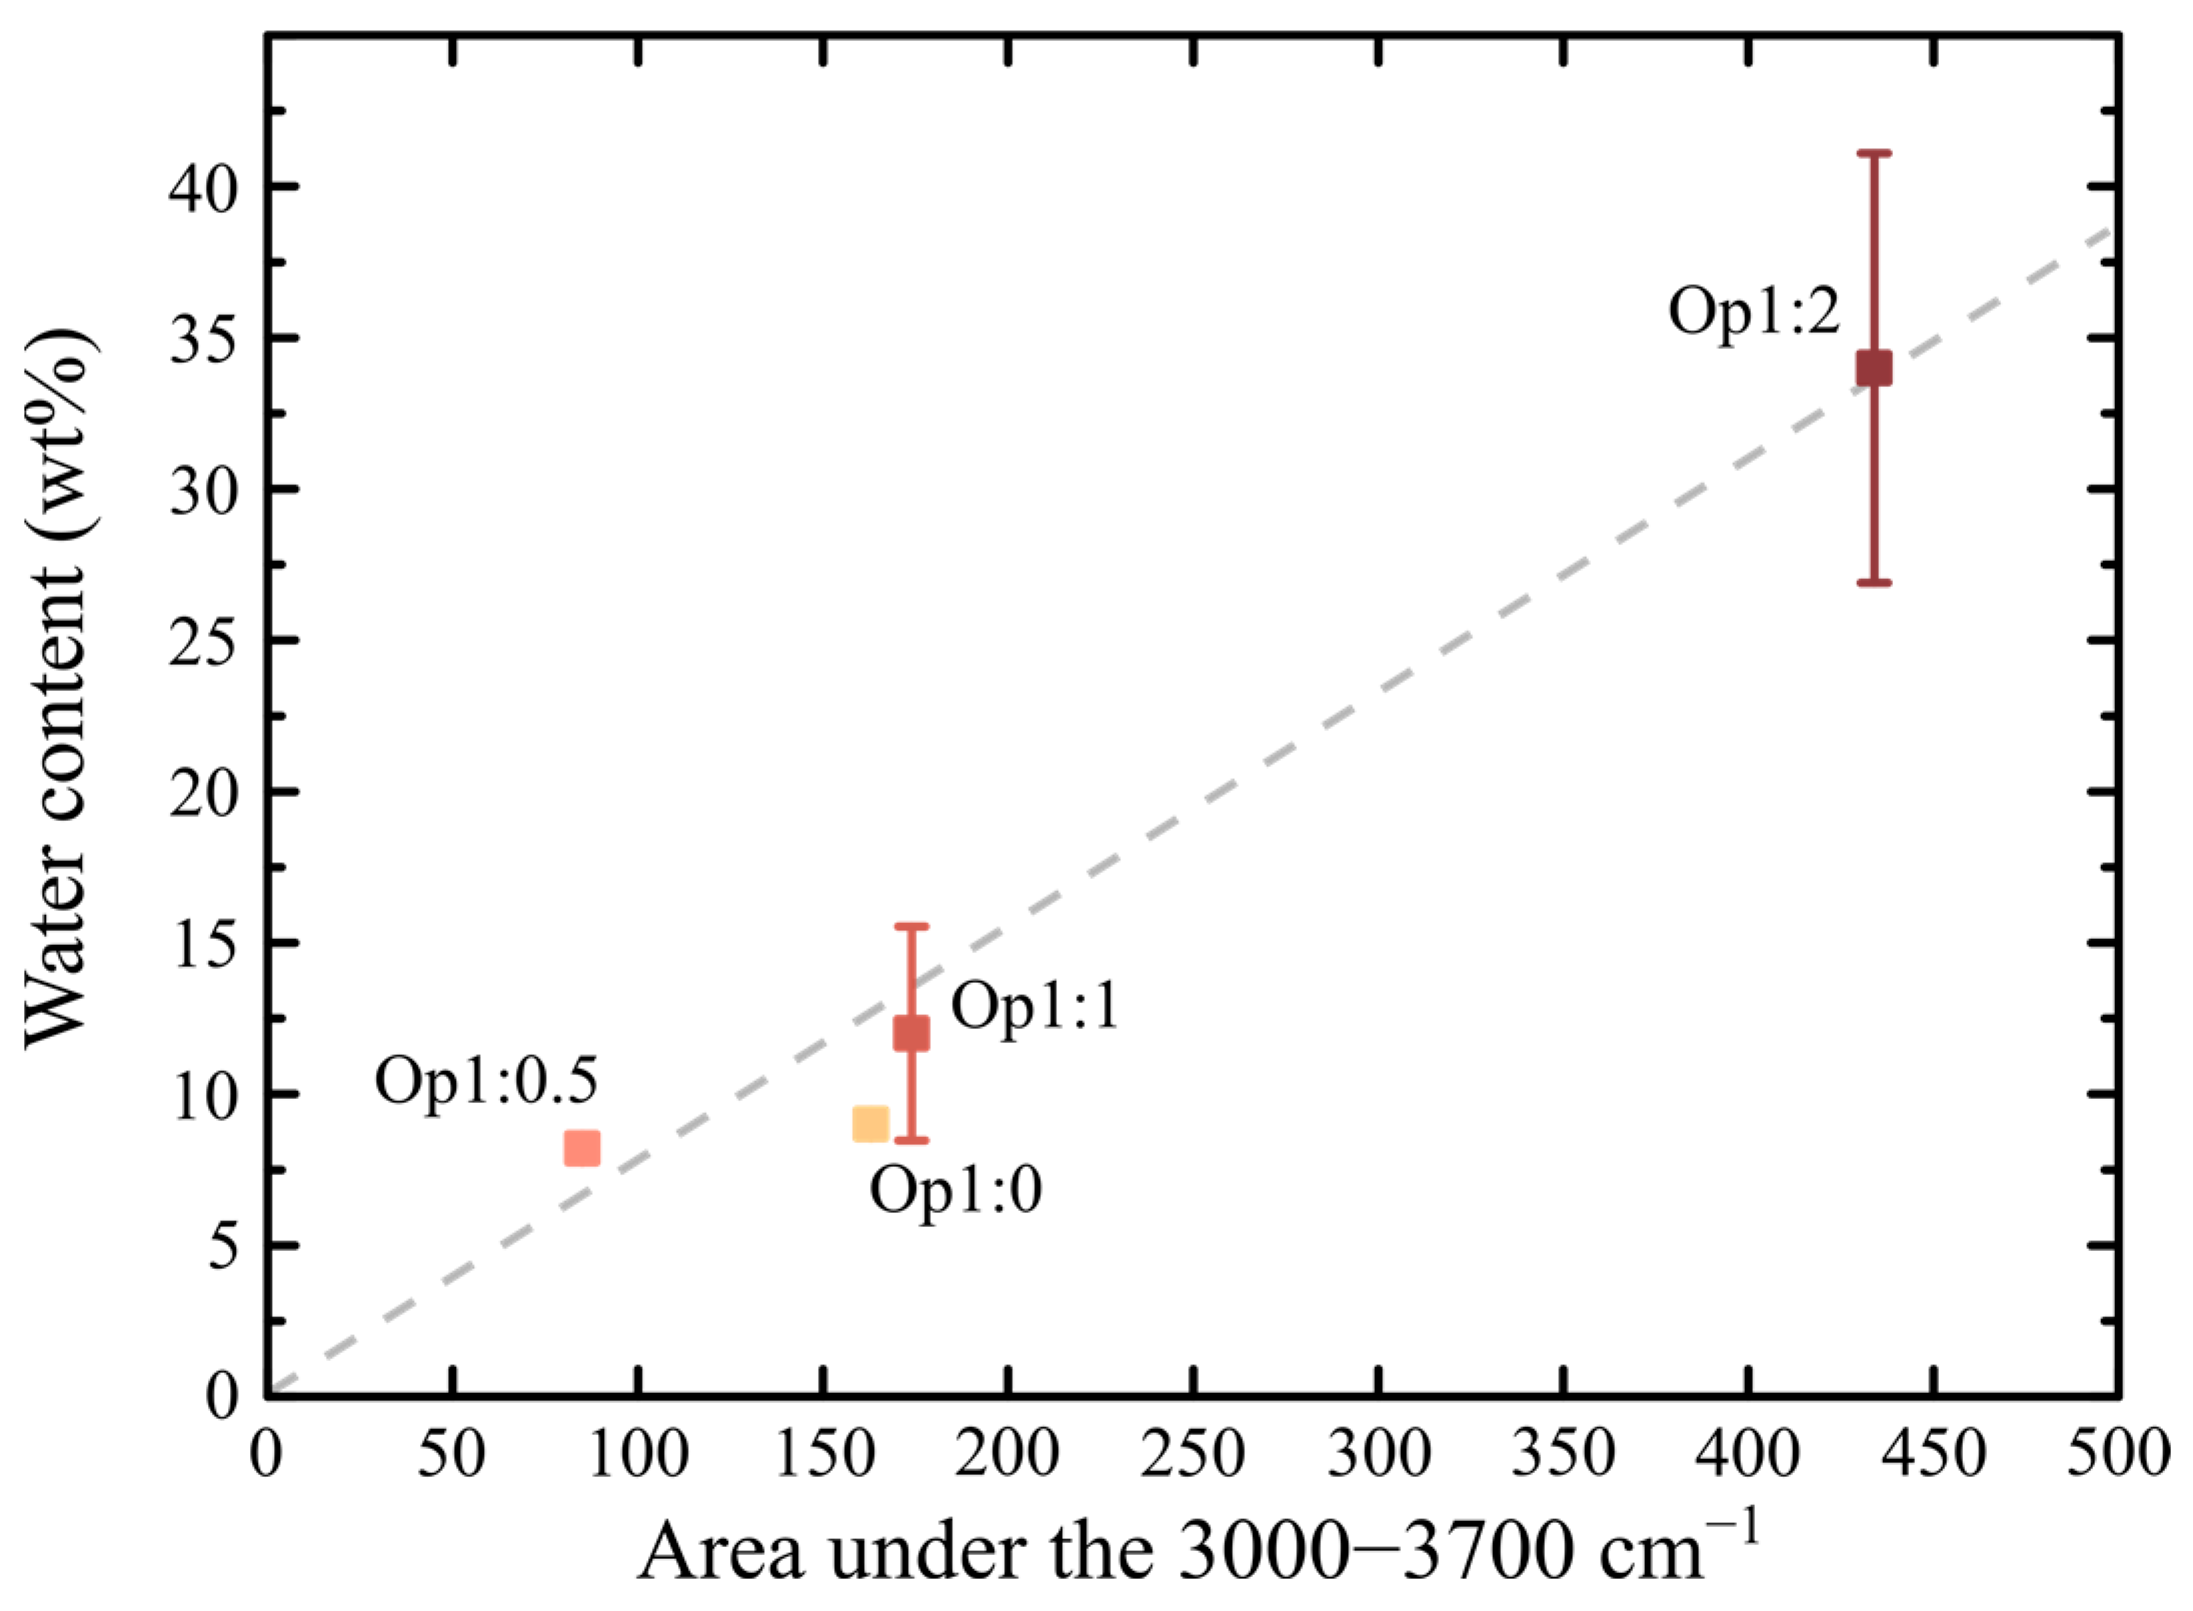
| Sample | SiO2 | K2O | H2O |
|---|---|---|---|
| Op1:0 | 85 ± 1.2 | 6.1 ± 0.1 | 9.0 ± 0.14 |
| Op1:0.5 | 86.5 ± 0.8 | 5.1 ± 0.2 | 8.2 ± 0.10 |
| Op1:1 | 83.9 ± 1.0 | 3.4 ± 0.3 | 12.0 ± 3.54 |
| Op1:2 | 62.2 ± 0.7 | 1.8 ± 0.2 | 34.0 ± 7.10 |
Disclaimer/Publisher’s Note: The statements, opinions and data contained in all publications are solely those of the individual author(s) and contributor(s) and not of MDPI and/or the editor(s). MDPI and/or the editor(s) disclaim responsibility for any injury to people or property resulting from any ideas, methods, instructions or products referred to in the content. |
© 2024 by the authors. Licensee MDPI, Basel, Switzerland. This article is an open access article distributed under the terms and conditions of the Creative Commons Attribution (CC BY) license (https://creativecommons.org/licenses/by/4.0/).
Share and Cite
Gouzy, S.; Rondeau, B.; Vinogradoff, V.; Chauviré, B.; Coulet, M.-V.; Grauby, O.; Terrisse, H.; Carter, J. Opal Synthesis: Toward Geologically Relevant Conditions. Minerals 2024, 14, 969. https://doi.org/10.3390/min14100969
Gouzy S, Rondeau B, Vinogradoff V, Chauviré B, Coulet M-V, Grauby O, Terrisse H, Carter J. Opal Synthesis: Toward Geologically Relevant Conditions. Minerals. 2024; 14(10):969. https://doi.org/10.3390/min14100969
Chicago/Turabian StyleGouzy, Simon, Benjamin Rondeau, Vassilissa Vinogradoff, Boris Chauviré, Marie-Vanessa Coulet, Olivier Grauby, Hélène Terrisse, and John Carter. 2024. "Opal Synthesis: Toward Geologically Relevant Conditions" Minerals 14, no. 10: 969. https://doi.org/10.3390/min14100969