Abstract
Sandstone-type uranium deposits hold significant value and promise within China’s uranium resource portfolio, with the majority of these deposits found at the junctions of basins and mountains within Mesozoic and Cenozoic basins. The Kamust uranium mining area, located in the eastern part of the Junggar Basin, represents a significant recent discovery. Prior research on this deposit has been confined to two-dimensional analyses, which pose limitations for a comprehensive understanding of the deposit’s three-dimensional characteristics. To address the issue of uranium resource reserve expansion, this study employs 3D geological modeling and visualization techniques, guided by uranium deposit models and mineral prediction methods. First, a 3D model database of the Kamust uranium deposit was constructed, comprising drill holes, uranium ore bodies, ore-controlling structures, interlayer oxidation zones, and provenance areas. This model enables a transparent and visual representation of the spatial distribution of favorable mineralization horizons, structures, stratigraphy, and other predictive elements in the mining area. Second, based on the three-dimensional geological model, a mineral prediction model was established by summarizing the regional mineralization mechanisms, ore-controlling factors, and exploration indicators. Combined with big-data technology, this approach facilitated the quantitative analysis and extraction of ore-controlling factors, providing data support for the three-dimensional quantitative prediction of deep mineralization in the Kamust uranium deposit. Finally, using three-dimensional weights of evidence and three-dimensional information-quantity methods, comprehensive information analysis and quantitative prediction of deep mineralization were conducted. One prospective area was quantitatively delineated, located east of the Kalasay monocline, which has been well-validated in geological understanding. The research indicates that the area east of the Kalasay monocline in the Kamust mining district has significant exploration potential.
1. Introduction
Uranium resources are indeed a critical strategic asset for China, playing a pivotal role as the fundamental raw material for the nuclear industry [1,2,3,4,5]. Recognized for their cleanliness and reliability, uranium resources are essential in the pursuit of carbon neutrality, sustainable economic development, and the advancement of ecological civilization within the country. The expansion of uranium resource development is, therefore, a strategic priority. Internationally, three-dimensional uranium deposit modeling technology has seen rapid advancements, supported by organizations such as the International Atomic Energy Agency (IAEA). However, in China, uranium resource exploration techniques have traditionally been more two-dimensional, with three-dimensional geological modeling and visualization still emerging in the field of uranium deposits [6,7,8,9,10,11,12,13,14]. Three-dimensional quantitative prediction and evaluation, an advanced geological analysis method, utilizes three-dimensional spatial computation and analysis techniques. These include topological and attribute analyses of solid objects, combined with ore-forming theories, to identify areas favorable for uranium mineralization and key controlling factors. Applying a three-dimensional quantitative prediction model allows for the extraction of predictive variables and a comprehensive analysis to delineate potential mineralization zones, leading to a more precise assessment of the mineral resource potential [15,16,17,18].
Sandstone-type uranium deposits, with their significant advantages in resource endowment, economic viability, and environmental impact, have become increasingly important [19,20,21,22]. Their suitability for cost-effective in situ leaching, large-scale reserves, and minimal environmental disruption during extraction make them particularly attractive. As a result, they are a focal point for ongoing uranium resource exploration in China [23]. China has identified over 50 sandstone-type uranium deposits, which represent 14.5% of the total number of uranium deposits in the country and account for 43.1% of the total identified uranium resources, which are primarily in large northern sandstone-type sedimentary basins, such as the Yili, Ordos, Junggar, and Erlian Basins [24,25,26,27,28,29,30,31,32,33,34,35,36,37,38,39]. To strengthen uranium resource security, China has initiated comprehensive deep uranium resource prediction and evaluation efforts nationwide [40,41,42]. With technological progress and increasing demand for uranium resources, exploration activities are increasingly focusing on depth and precision, integrating cutting-edge techniques, such as three-dimensional geological modeling and quantitative assessment methodologies [43,44,45].
The Kamust uranium deposit, located in the eastern part of the Junggar Basin, is a medium-sized deposit with uranium ore grades ranging from 0.0153% to 0.1103% and a uranium content per square meter varying between 1.12 and 10.91 kg/m2 [46,47]. Previous research on the Kamust uranium deposit has been limited to two-dimensional analysis, leaving the underground geological conditions largely unexplored in three dimensions. This study aims to synthesize and analyze regional ore-forming mechanisms, ore-controlling elements, and exploration indicators to establish a comprehensive exploration model for the Kamust uranium deposit. By employing three-dimensional geological modeling and visualization techniques, models of key features, such as the interlayer oxidation zone, are constructed. These models are crucial for identifying favorable areas for ore formation and provide essential technical support for deep exploration efforts. Transitioning from a two-dimensional to a three-dimensional analysis enhances our understanding of the deposit’s complex geology and improves the efficiency of future exploration activities, addressing current limitations and demonstrating the potential of advanced modeling techniques in uranium exploration.
2. Geological Background of the Study Area
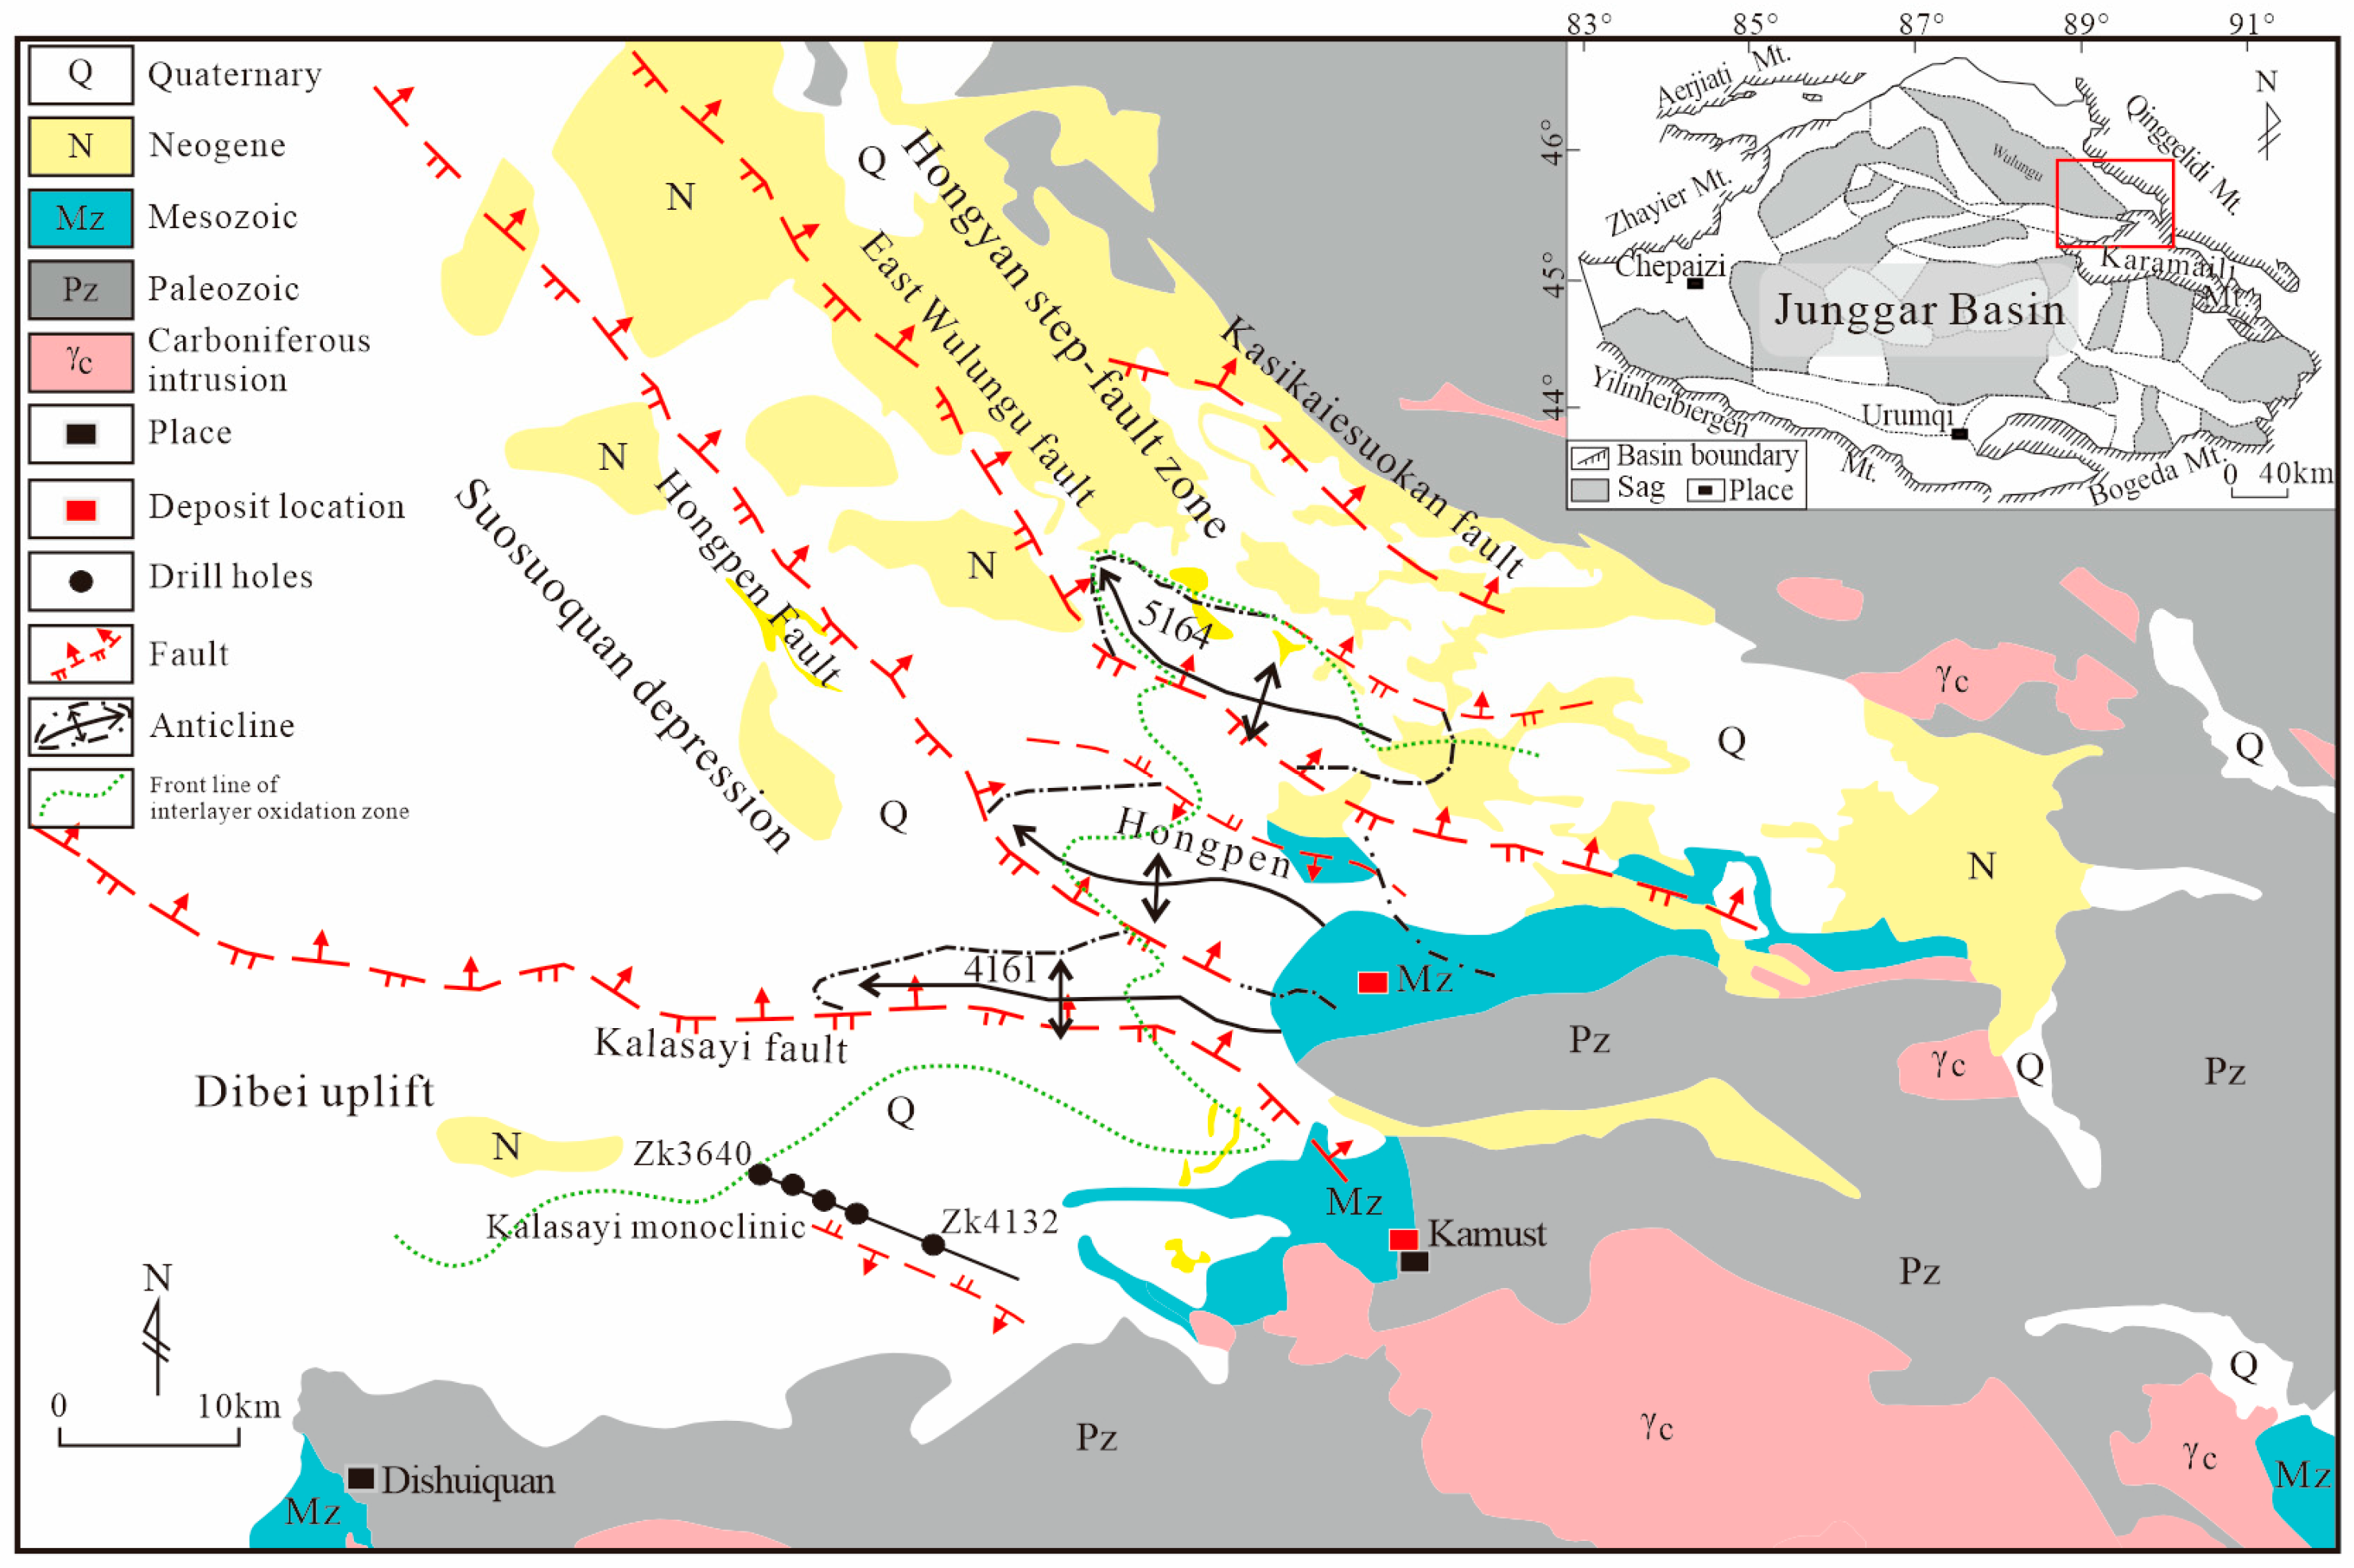
The Kamust uranium deposits are situated in the eastern sector of the Junggar Basin, nestled between the Kalamaili and Qinggelidi mountain ranges. They are part of the Ulungur River uranium metallogenic prospective belt within the Altay–Junggar uranium metallogenic province, which falls under the Paleo-Asian uranium metallogenic domain [48,49,50]. The deposits are segmented into three secondary structural units by the Kalasayi Fault and the Hongpen Fault, namely the eastern segment of the Dibei uplift, the southern segment of the Suosuoquan depression, and the southern segment of the Hongyan fault step zone (Figure 1) [51]. The faults’ strike directions radiate outward from the eastern end near the Qinggelidi and Kalamaili mountains, creating a funnel-shaped distribution. Structural deformation characteristics differ between the eastern and western regions. At the western, divergent end of the “funnel-shaped structure”, deformation is less intense, with less pronounced faults and folds. Conversely, the eastern, convergent end exhibits more intense deformation, with well-defined faults and an alternating development of fault uplifts and depressions, including the sequential development of the Kalasayi monocline, the 4161 anticline, the Hongpen anticline, and the 5164 anticline (Figure 1).
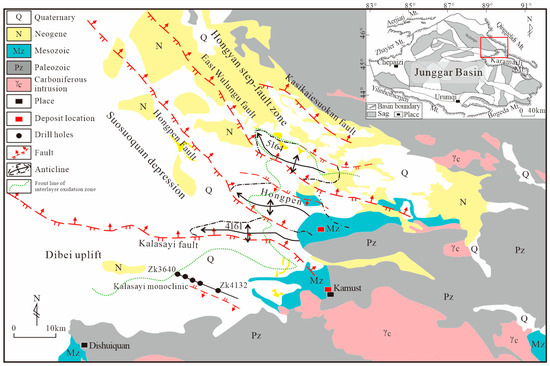
Figure 1.
Regional geological map of Kamust uranium deposit.
The Kamust mining area’s bedrock consists of a pre-Cambrian crystalline basement and a Hercynian folded metamorphic basement, showcasing a dual structural feature [52,53,54,55]. The Paleozoic strata are primarily marine clastic and Hercynian granitic rocks. The Mesozoic and Cenozoic sedimentary cover is relatively intact, encompassing the Triassic, Jurassic, Cretaceous, and Cenozoic periods. Uranium mineralization in the Kamust area is significantly influenced by stratigraphic, structural geological, and paleoclimatic factors. The predominant form of uranium mineralization is sandstone type, occurring within interlayer oxidation zones. Notably, ore bodies are predominantly found within the braided river sandstones of the Middle Jurassic Toutunhe Formation. The discovered uranium mineralization is predominantly within the Jurassic strata, with the Middle Jurassic being the most representative, followed by the Upper Cretaceous Tugulu Group. The Kamust uranium ore bodies are mainly hosted within the gray and gray–green oxidized sandstones and conglomerates of the Middle Jurassic Toutunhe Formation [46,47,48], where they are clearly influenced by the distribution of the sand bodies. The Toutunhe Formation is bifurcated into upper and lower sections. The lower section is marked by variegated, gray, and gray–green conglomerates and sandstones, interspersed with thin layers of mudstone and carbonaceous mudstone, and characterized by thicker sand bodies. The upper section is defined by a series of variegated fine-grained, thick-bedded mudstones interspersed with thin layers of sandstone, indicating a smaller scale of sand bodies.
3. Key Ore-Controlling Factors and Exploration Model
3.1. Internal and External Uranium Sources
An adequate uranium supply is essential for the genesis of sandstone-type uranium deposits [56]. The intermediate-acidic magmatic rocks in the Kalamaili orogenic belt, located south of the Kamust area, are rich in uranium and contain a significant proportion of active uranium (uranium that is prone to migrate during mineralization). These rocks not only contributed substantial amounts of uranium-bearing clastic material for the pre-enrichment of the ore-bearing formation during the synsedimentary phase but also released considerable quantities of dissolved U6+ during subsequent mineralization. This release facilitated the formation of uranium-bearing oxidized waters, which served as a substantial external source of uranium for the oxidation and mineralization processes of the Kamust deposit [56].
3.2. Structural Control of Ore Deposits
Since the Jurassic period, regional tectonic uplift in the Kamust area has repeatedly brought Jurassic sand bodies, developed within the Kalasayi monocline, to the surface, creating a topographical feature where the area is elevated in the south and descends towards the north. This topography has provided favorable conditions for the subsequent infiltration and alteration by oxygenated water rich in uranium. Concurrently, the Kalasayi monocline, in conjunction with the Kalasayi fault, constitutes an efficient groundwater circulation system. In slope zones, the direction of groundwater flow often coincides with the slope’s inclination. Fracture zones, marked by rock fragmentation, typically exhibit higher permeability, acting as pathways for groundwater movement. Within this system, groundwater can be recharged, flowed, and discharged through the slope and fracture zones, which facilitates the circulation and renewal of groundwater and enhances the interaction between the groundwater and the surrounding rock. This interaction is beneficial for the ongoing development of interlayer oxidation zones and the formation of sandstone-type uranium deposits [27].
3.3. Lithology–Lithofacies Control of Ore Deposits
The Toutunhe Formation at the Kamust uranium deposits has developed a series of clastic deposits characteristic of a braided river-delta plain at the basin’s edge, which have significantly extended into the basin. This extension has resulted in the formation of extensive delta-front deposits at the lake entry zone, transitioning gradually into lacustrine deposits [27,46]. The braided river-delta plain facies at the basin’s margin are marked by well-developed distributary channels and robust sand bodies. The lithology of these sand bodies predominantly consists of feldspathic lithic sandstone and lithic sandstone, with minor occurrences of lithic feldspathic sandstone. The clastic components are primarily derived from intermediate-acidic magmatic rocks, quartz, and feldspar. These components exhibit loose cementation, ensuring good connectivity and permeability, which are conducive to the infiltration of uranium-bearing oxygenated water. This lithological and lithofacies setting provides favorable conditions for the in-situ leaching of sandstone-type uranium deposits.
3.4. Interlayer Oxidation
The Toutunhe Formation is characterized by a weakly reducing geochemical environment, which facilitates a large-scale interlayer water infiltration and oxidation process [46,47]. Along the basin margin, phreatic oxidation is predominant, with a transition to interlayer oxidation as one moves further into the basin. The interlayer oxidation zone within the area exhibits good lateral continuity and extensive coverage, with various segments of the oxidation zone interconnected regionally. The oxidation zone extends approximately 8 km in length and varies in thickness from about 30 to 70 m. The width of the zone is not precisely defined due to the constraints of available drilling data.
3.5. Uranium Mineralization Characteristics
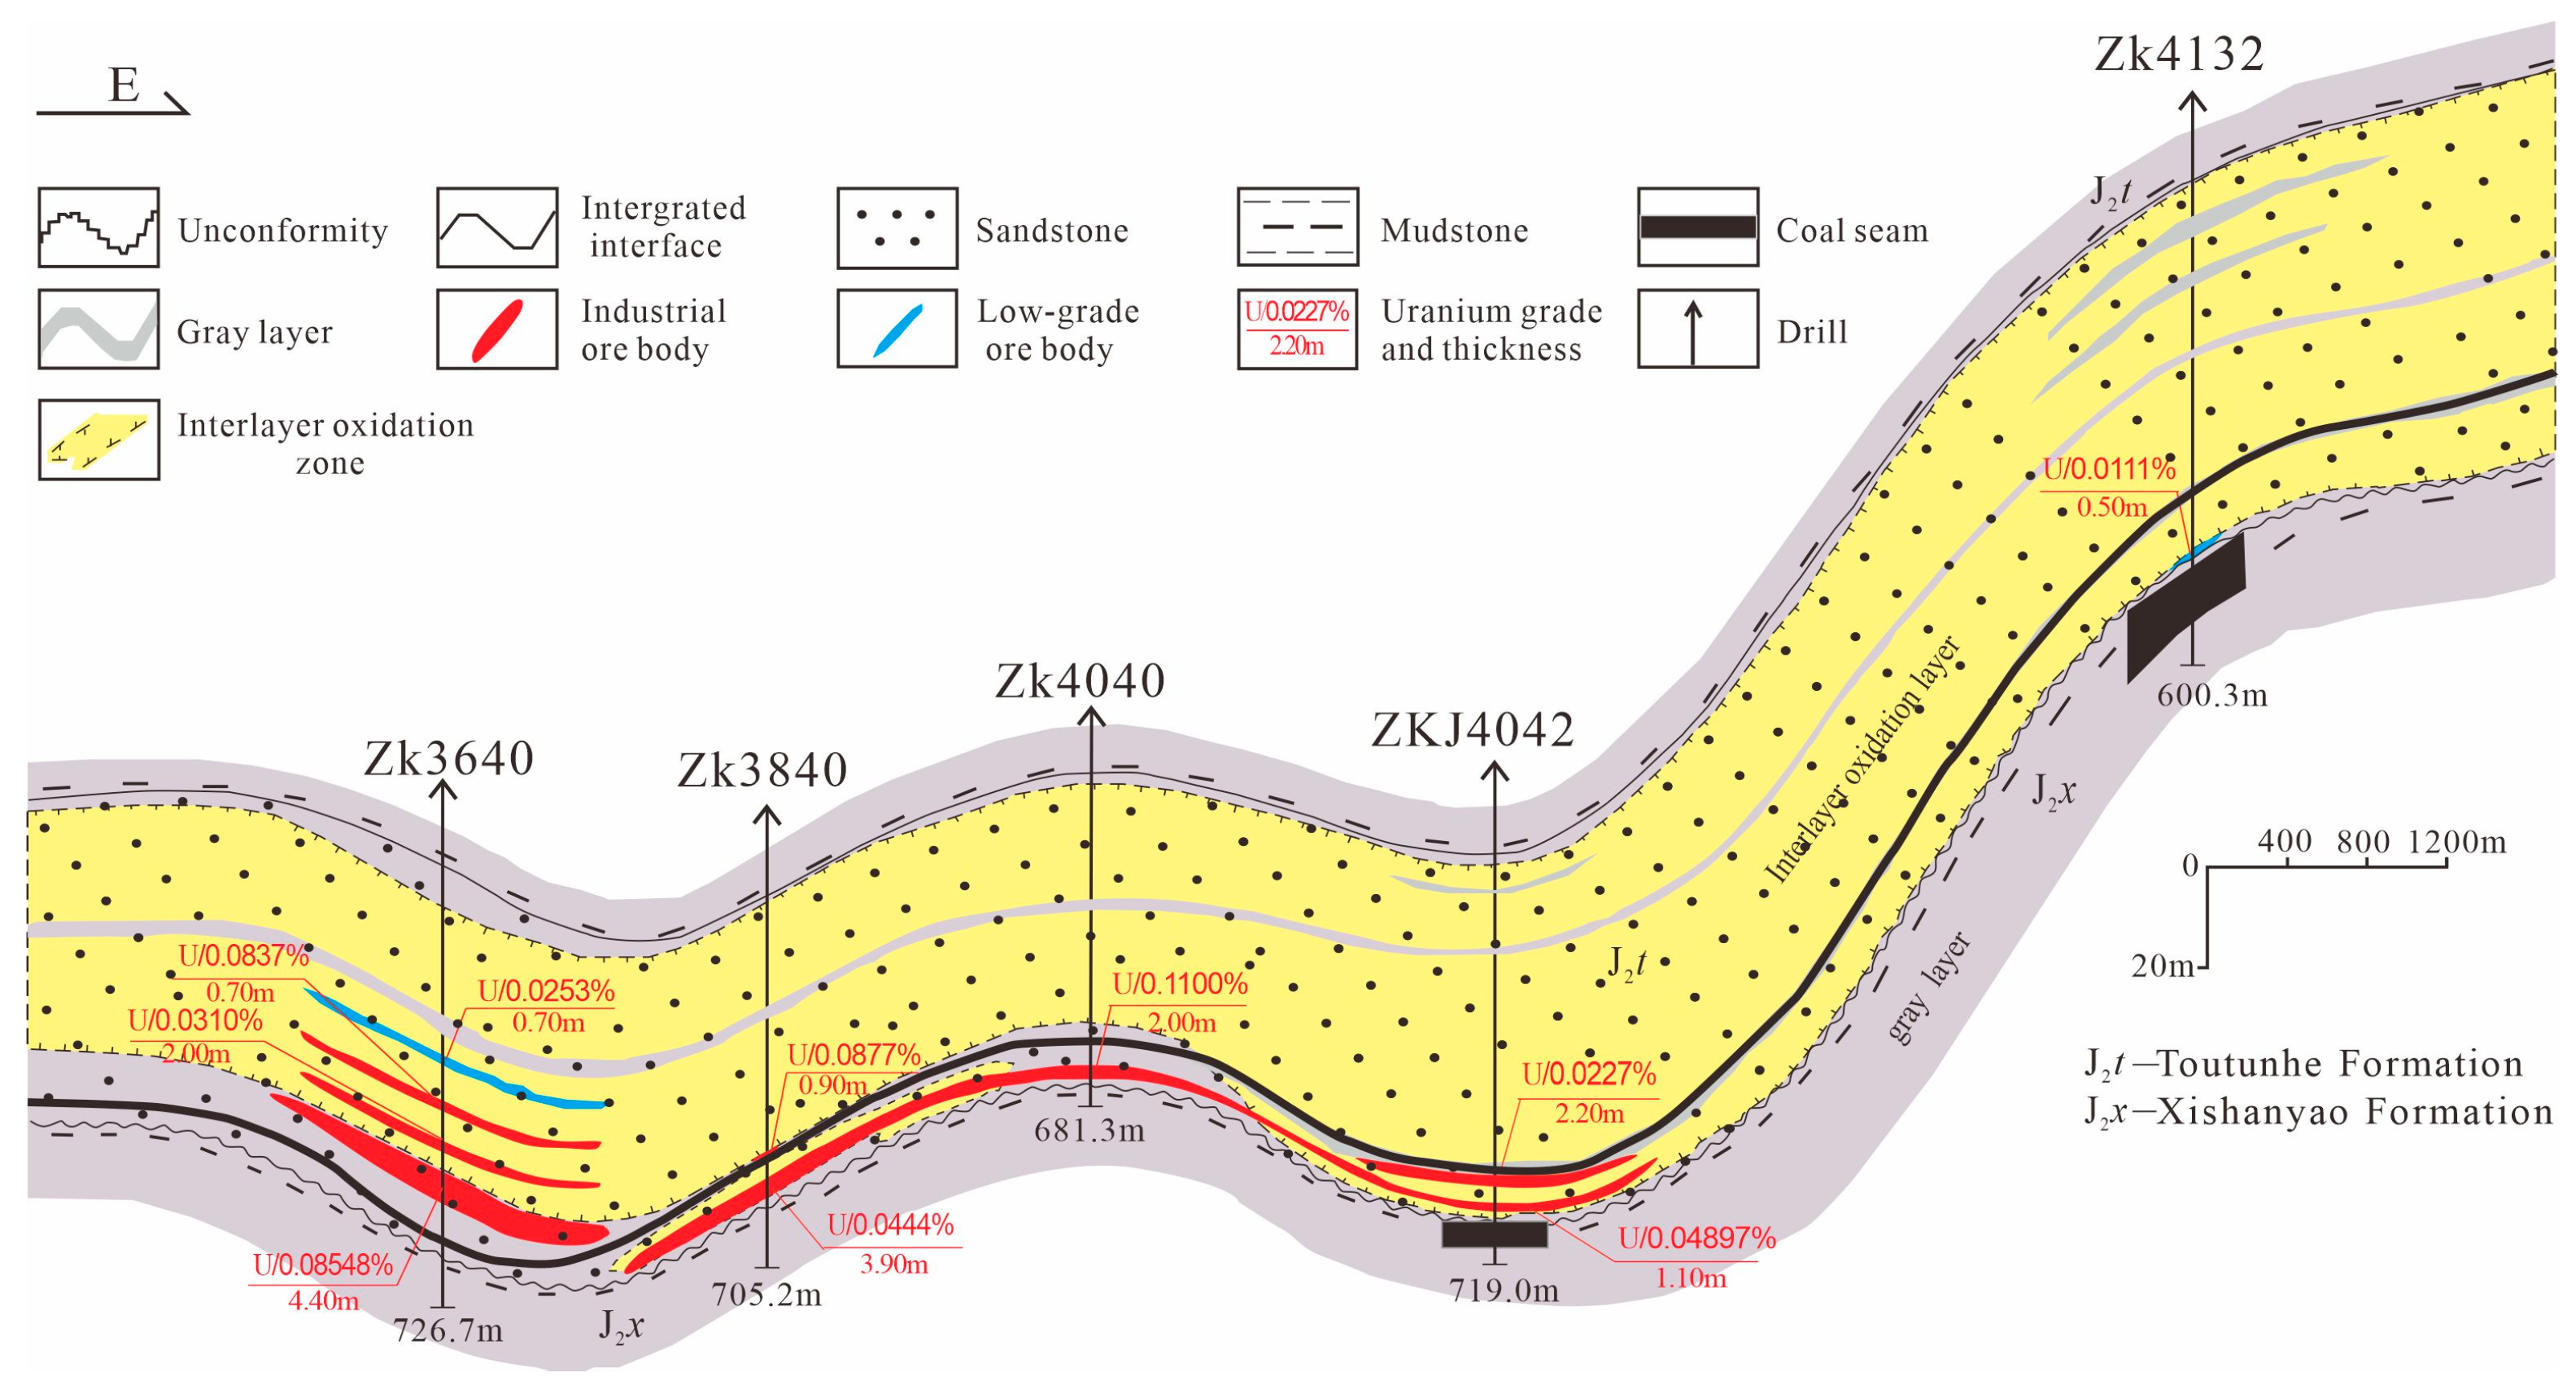
The uranium ore bodies in the area are predominantly hosted within the interlayer oxidation zone of the Middle Jurassic Toutunhe Formation. The industrial-grade uranium ore bodies of the Toutunhe Formation are situated at depths ranging from 340 to 820 m, with a gentle inclination. The strata dip at angles between 3° and 8°, with thicknesses varying from 1.10 to 8.10 m and uranium grades ranging from 0.0153% to 0.1103%. The uranium content per square meter is between 1.12 and 10.91 kg/hm2. The cross-sectional shapes of the ore bodies are predominantly tabular and bed-like (Figure 2). To date, no classic “roll-front” uranium ore bodies have been identified. The mineralized sand bodies are characterized by loose cementation and good permeability, and they demonstrate promising resource potential and favorable exploration conditions [57].
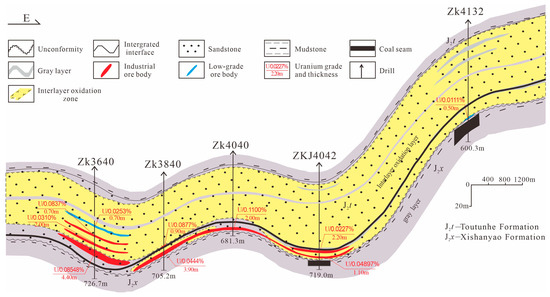
Figure 2.
Spatial distribution profile of interlayer oxidation belt and ore bodies of the Kamust uranium deposit (the profile locations and drill hole locations are shown in Figure 1, modified after [47]).
4. Data Preprocessing from Multiple Sources and the 3D Modeling Process
4.1. Data Preprocessing from Multiple Sources
This paper employs the GoCad integrated geological and reservoir modeling software platform, developed by Paradigm, for three-dimensional geological visualization modeling [58]. The discrete smooth interpolation (DSI) method, central to GoCad’s geological modeling software, offers several advantages, including the flexibility to select grid models, the automatic adjustment of grid configurations, real-time interactive capabilities, and the ability to manage uncertain data. These advantages give it an important position in geological modeling and visualization.
The primary data collected for the Kamust uranium deposit in the Junggar Basin comprises regional geological maps, drill core data, exploration profile diagrams, and other pertinent original geological materials. Given their diverse origins, extensive time frames, and inconsistent standards, these data exhibit multi-source, multi-scale, and multi-resolution characteristics. To optimize the use of existing data, it is essential to standardize the original data to a format compatible with the modeling software, import it into the GoCad platform, and establish an integrated geological database. Utilizing 3S technology, database technology, three-dimensional visualization, and virtual reality technologies, we construct three-dimensional models of the study area’s drill holes, structural geology, stratigraphy, interlayer oxidation zones, ore bodies, and source areas. This approach enables a comprehensive three-dimensional spatial representation of various geological bodies and structural systems.
4.2. Modeling Process
Utilizing drill hole data and a series of exploration profile sections, the construction of a structural–stratigraphic framework model is achieved by integrating surface modeling with rock (ore) body modeling [59]. Surface modeling involves the creation of contour lines and geological layer outlines through the extraction of borehole data and exploration profile information. These contours delineate the boundaries of geological layers, indicating their thickness, dip, and interrelationships. Rock (ore) body modeling, on the other hand, concentrates on the shape, volume, and physical properties of specific rock or ore bodies, representing their spatial structure through the construction of 3D grids, such as triangular meshes. This type of modeling provides more detailed geological insights. The synergy of surface and rock (ore) body modeling leverages the strengths of both, making it suitable for both small-scale regional 3D geological modeling and large-scale uranium deposit 3D modeling. This comprehensive approach allows for a more thorough representation of the complexity and diversity of geological formations.
The modeling process unfolds as follows. Initially, extract the borehole location information and borehole attribute data from the drill core data. The borehole location information is crucial for storing details, such as positioning and deviation. The borehole attribute data encompasses the stratigraphy, lithology, interlayer oxidation zone, and ore grade details. Organize this data into table files and import them into GoCad to create a borehole database, extracting discrete points for stratigraphy and lithology. Subsequently, extract the contour lines for the strata, interlayer oxidation zones, ore bodies, and faults from the exploration profile diagrams, using these to constrain the modeling surfaces based on spatial position, geometric form, and borehole data. Then, construct solid triangular meshes between adjacent contour lines for the strata, interlayer oxidation zones, ore bodies, and faults. In cases where there are significant differences in contour-line geometry, additional auxiliary contour lines may be introduced. Closed contour lines, such as those for interlayer oxidation zones and ore bodies, are processed for closure, and boundary contour lines are extrapolated and closed to form enclosed spaces, thus completing the model for these features. Finally, construct solid triangular meshes between open lines of strata and faults to finalize the fault surface model. The surface model’s effectiveness and closure are then validated to yield the final surface and solid models.
4.3. Ore-Forming Prediction
The “Cubic Prediction Model” method is an extension of the block attribute model, which involves translating an established 3D solid model into a grid system, with cells of uniform or variable sizes. This method assigns geological, geophysical, and geochemical data to each grid cell, allowing for the quantification of these attributes. This quantification aids in the classification, analysis, extraction, and calculation of multi-source data, enhancing the precision of geological predictions [60].
In this study, by leveraging the 3D geological solid model of the Kamust uranium deposit area, we harness the characteristics intrinsic to the formation of sandstone-type uranium ore. By correlating ore bodies with various geological controls, we have distilled an ore-finding model. Employing the “Cubic Prediction Model”, we utilize cubic blocks measuring 300 m × 300 m × 50 m as the fundamental predictive units to construct an attribute model. The dimensions of these cubic blocks are determined by considering the extensive mineralization envelope and the thinness of the mineralized layers that are typical of sandstone-type uranium deposits, while also accounting for computational efficiency. Each cubic cell within the blocks is endowed with geological properties, delineating the favorable conditions for ore formation within each predictive element, thus yielding a quantitative prediction model for the study area. Subsequently, the “Three-Dimensional Information Quantity Method” is applied for both a qualitative and a quantitative assessment of each predictive element. The areas with high values in the ore-finding information quantity are then identified as prospective targets for exploration, guiding further geological investigations. Finally, the Kriging interpolation algorithm is deployed to estimate resource quantities within the delineated favorable and prospective areas, further assessing the likelihood of ore discovery. This comprehensive approach aims to achieve an in-depth prediction of ore formation in the Eastern Junggar Basin.
5. 3D Geological Modeling of the Mining Area
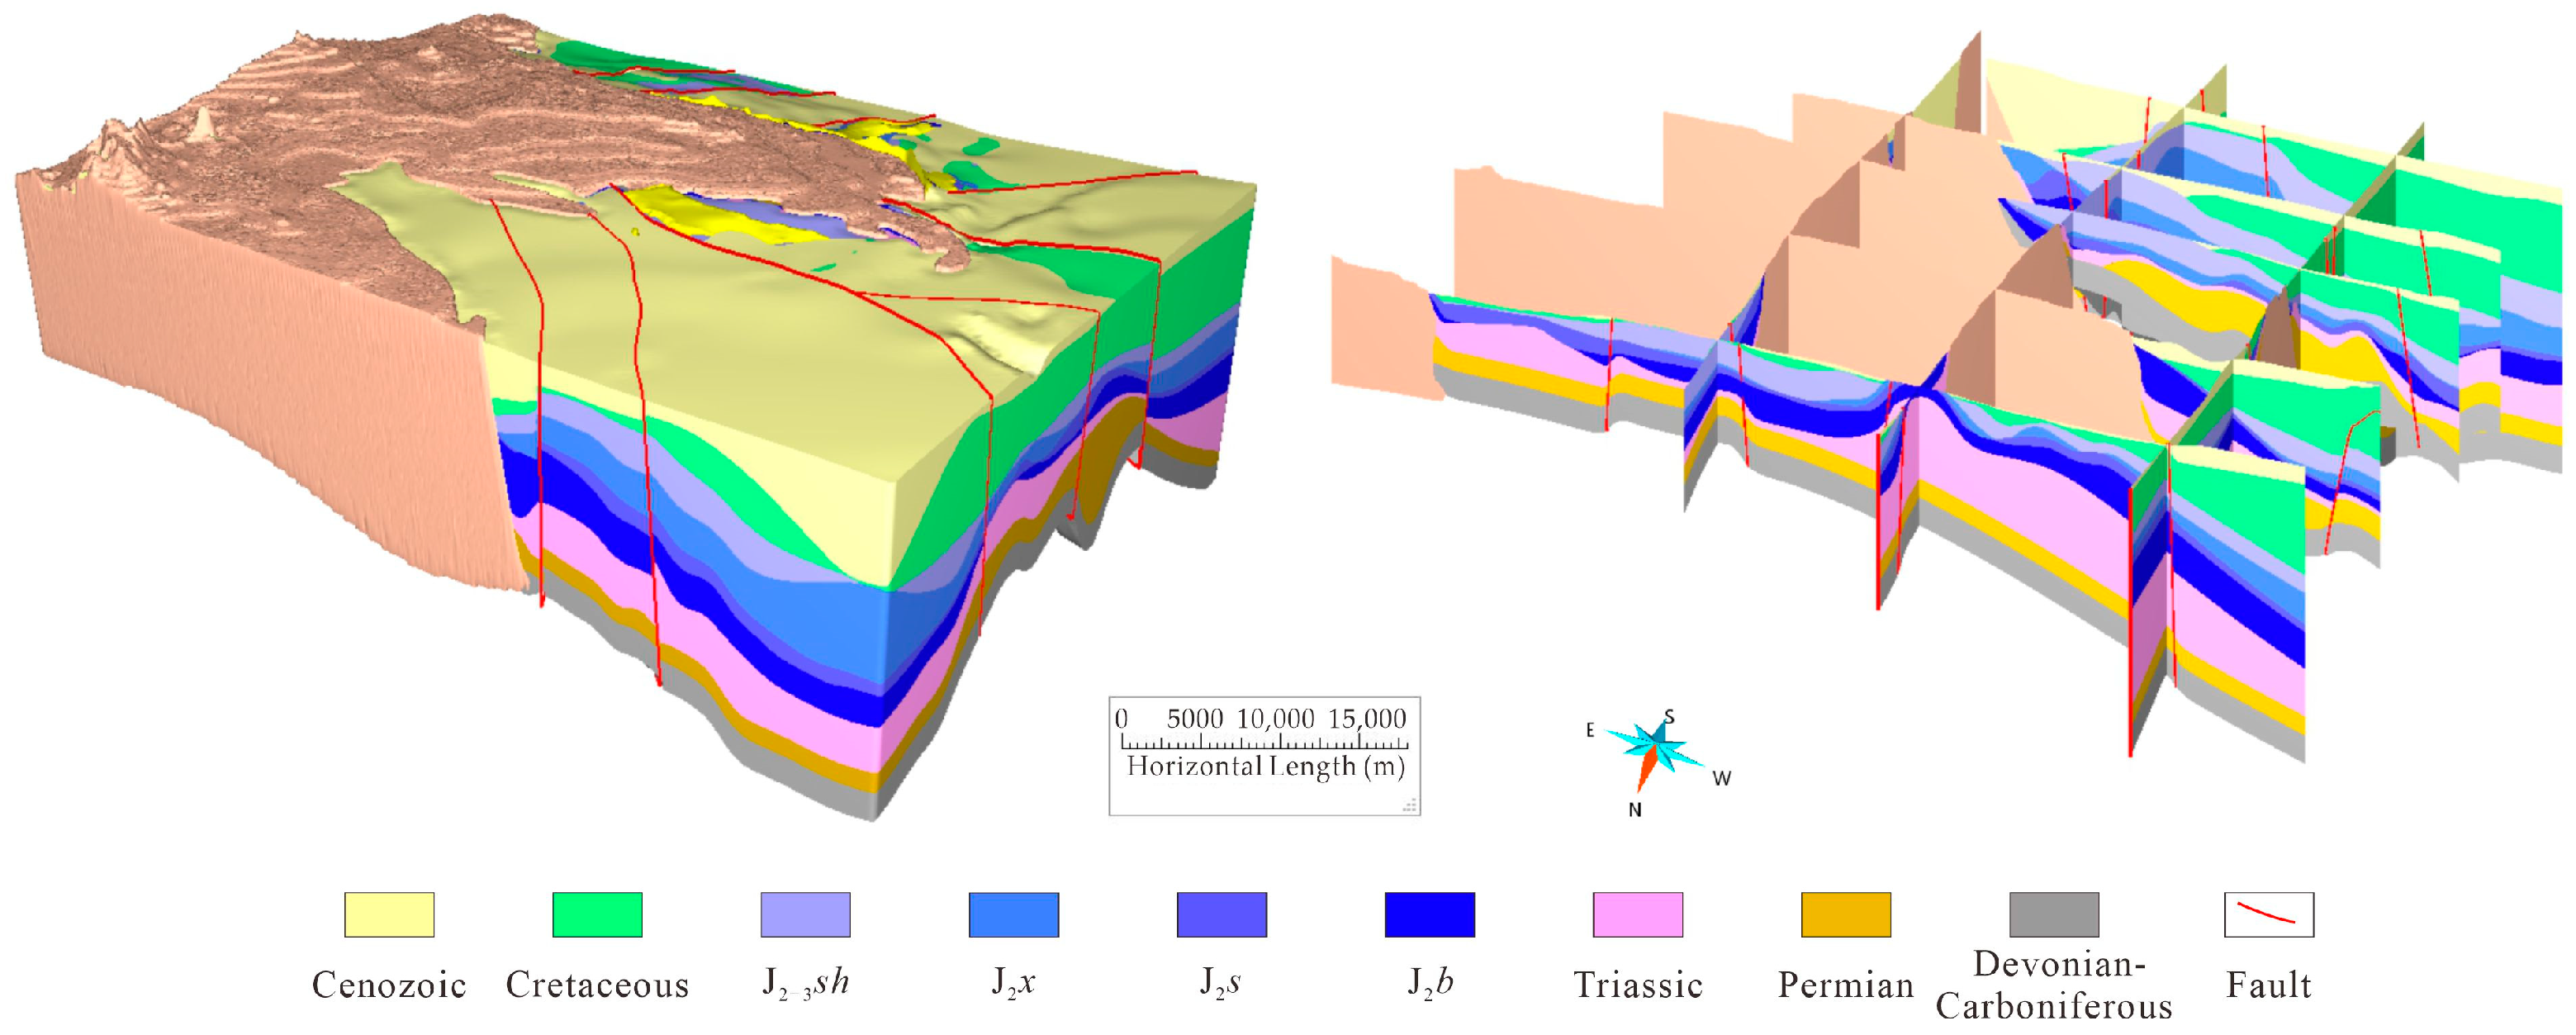
This paper presents a comprehensive three-dimensional geological modeling study encompassing the entire Kalamaili region, with a focus on the Kamst uranium deposit. A diverse array of data materials was collected, including geological mapping, exploration engineering, geophysical, geochemical, and remote-sensing data. The data encompassed various formats, such as grid, vector, and textual data, as outlined in Table 1. Following a series of preparatory steps, including the standardization of textual data, rectification of image data, vectorization, three-dimensional transformation, and other necessary treatments, the data were integrated into the GoCAD platform to establish a comprehensive geological database. Utilizing a suite of technologies, including 3S technology, database technology, three-dimensional visualization, and virtual reality, we constructed three-dimensional models that encompass the study area’s drill holes, interlayer oxidation zones, structural features, geochemical and geophysical surveys, and source areas. These models facilitate the visualization, three-dimensional representation, and quantitative analysis of the spatial distribution and interrelationships among various geological bodies and structural systems (Figure 3). The model’s display reveals that the strata gradually rise towards the east, the faults exhibit an orderly pattern, and there are clear indications of block depression and uplift, resulting in a smooth and visually appealing model.

Table 1.
Quantitative prediction model for the Kamust uranium deposits.

Figure 3.
Three-dimensional comprehensive model and grid diagram of the Kamust area.
5.1. Borehole Model
Boreholes are the cornerstone of three-dimensional geological modeling, providing critical data for such endeavors. The data primarily includes borehole location information and borehole attribute details. The location information encompasses positioning and deviation data, while the attribute data consists of stratigraphic, lithological, structural, ore grade, and oxidation-alteration information. These datasets are imported into the GoCAD software platform, where they are used to constrain surfaces in object modeling, ensuring the accuracy and quality of the modeling process.
5.2. Structural-Stratigraphic Model
This model constructs the primary fault structures in the Eastern Junggar area. The Kamust region is delineated into three secondary structural units by the Kalasayi and Hongpen faults, namely the eastern segment of the Sangequan uplift, the southern segment of the Suosuoquan depression, and the southern segment of the Hongyan fault step zone (Figure 1). By leveraging an integrated geological database, we establish a stratigraphic column framework, define stratigraphic contact relationships, incorporate stratigraphic data, introduce fault information, categorize fault types, and construct a fault model. This process involves generating fault surfaces and stratigraphic surface models. We refine the modeling data in conjunction with seismic interpretation and other datasets, adjusting stratigraphic surfaces, defining structural contact relationships, and performing other operations to simulate the spatial distribution, position, and intercutting relationships of stratigraphic or fault surfaces. Throughout this process, we emphasize the role of borehole exposure points in the correction of geological surfaces and utilize the fault-displacement analysis module to meet modeling requirements effectively. The structural–stratigraphic model integrates data from boreholes, strata, structures, geochemical and geophysical interpretations, and planar geological maps. Prior to modeling, stratified data must be defined and assigned geological significance.
The final model includes a total of nine stratigraphic surfaces, namely Q+E, K, J2-3sh, J2X, J1s, J1b, T, P, C, D, and nine fault surfaces, namely the Wulungu East fault, Hongpen fault, Kalasayi fault, Shaxi fault, Zhangdong fault, and four sub-regional faults.
5.3. Interlayer Oxidation Zone Model
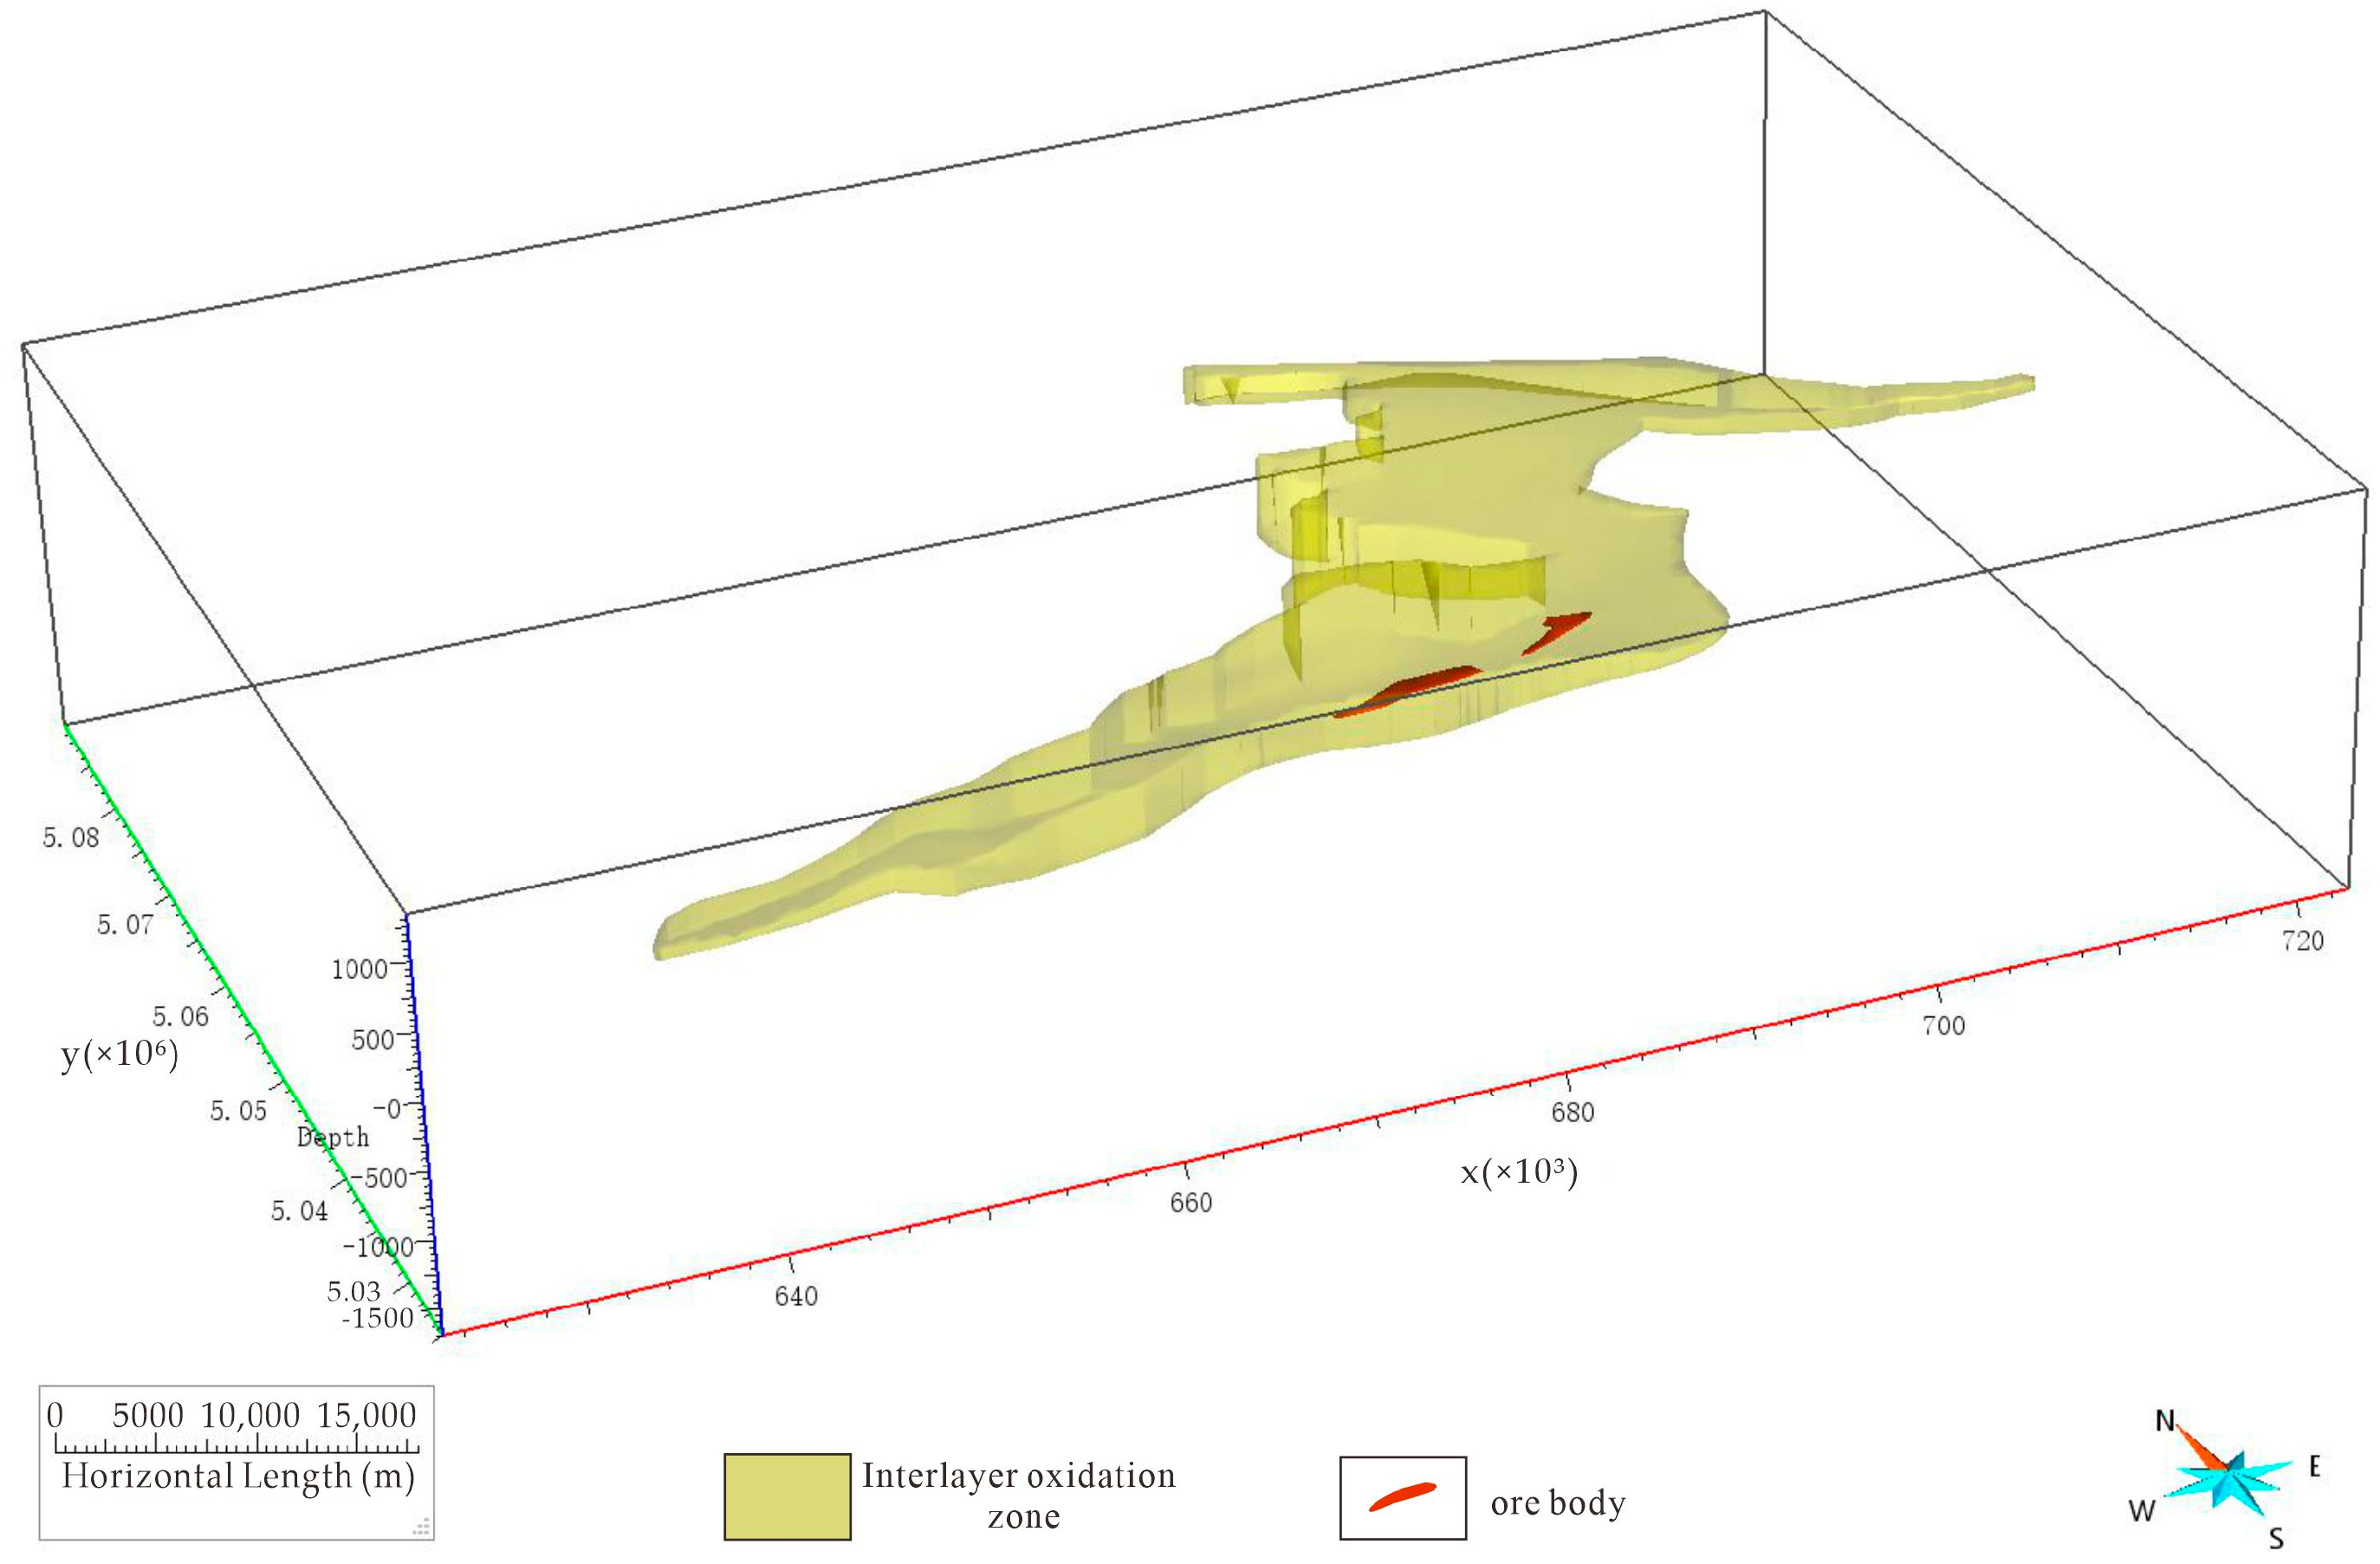
Recent exploration and research in the Kamust uranium deposit area have revealed significant interlayer oxidation zones within both the Toutunhe and Xishanyao formations of the Middle Jurassic, with the Toutunhe Formation showing a larger scale and the Xishanyao Formation a relatively smaller one [47]. The Badaowan and Sangonghe formations of the Lower Jurassic exhibit weaker oxidation interlayers. Given that the development of interlayer oxidation zones is substantially influenced by the distribution of sand bodies, a layered rock model is employed to construct the interlayer oxidation zone model (Figure 4).
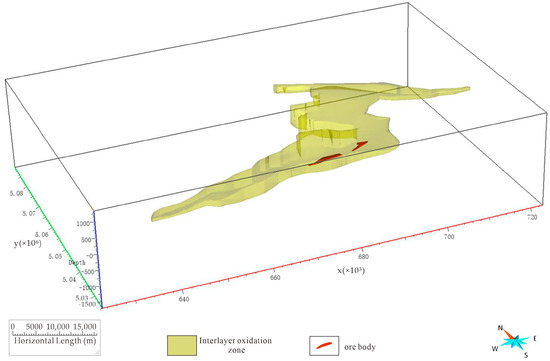
Figure 4.
Three-dimensional model of the interlayer oxidation zone of the Toutunhe Formation in the Kamust uranium deposits.
5.4. Source Area Model
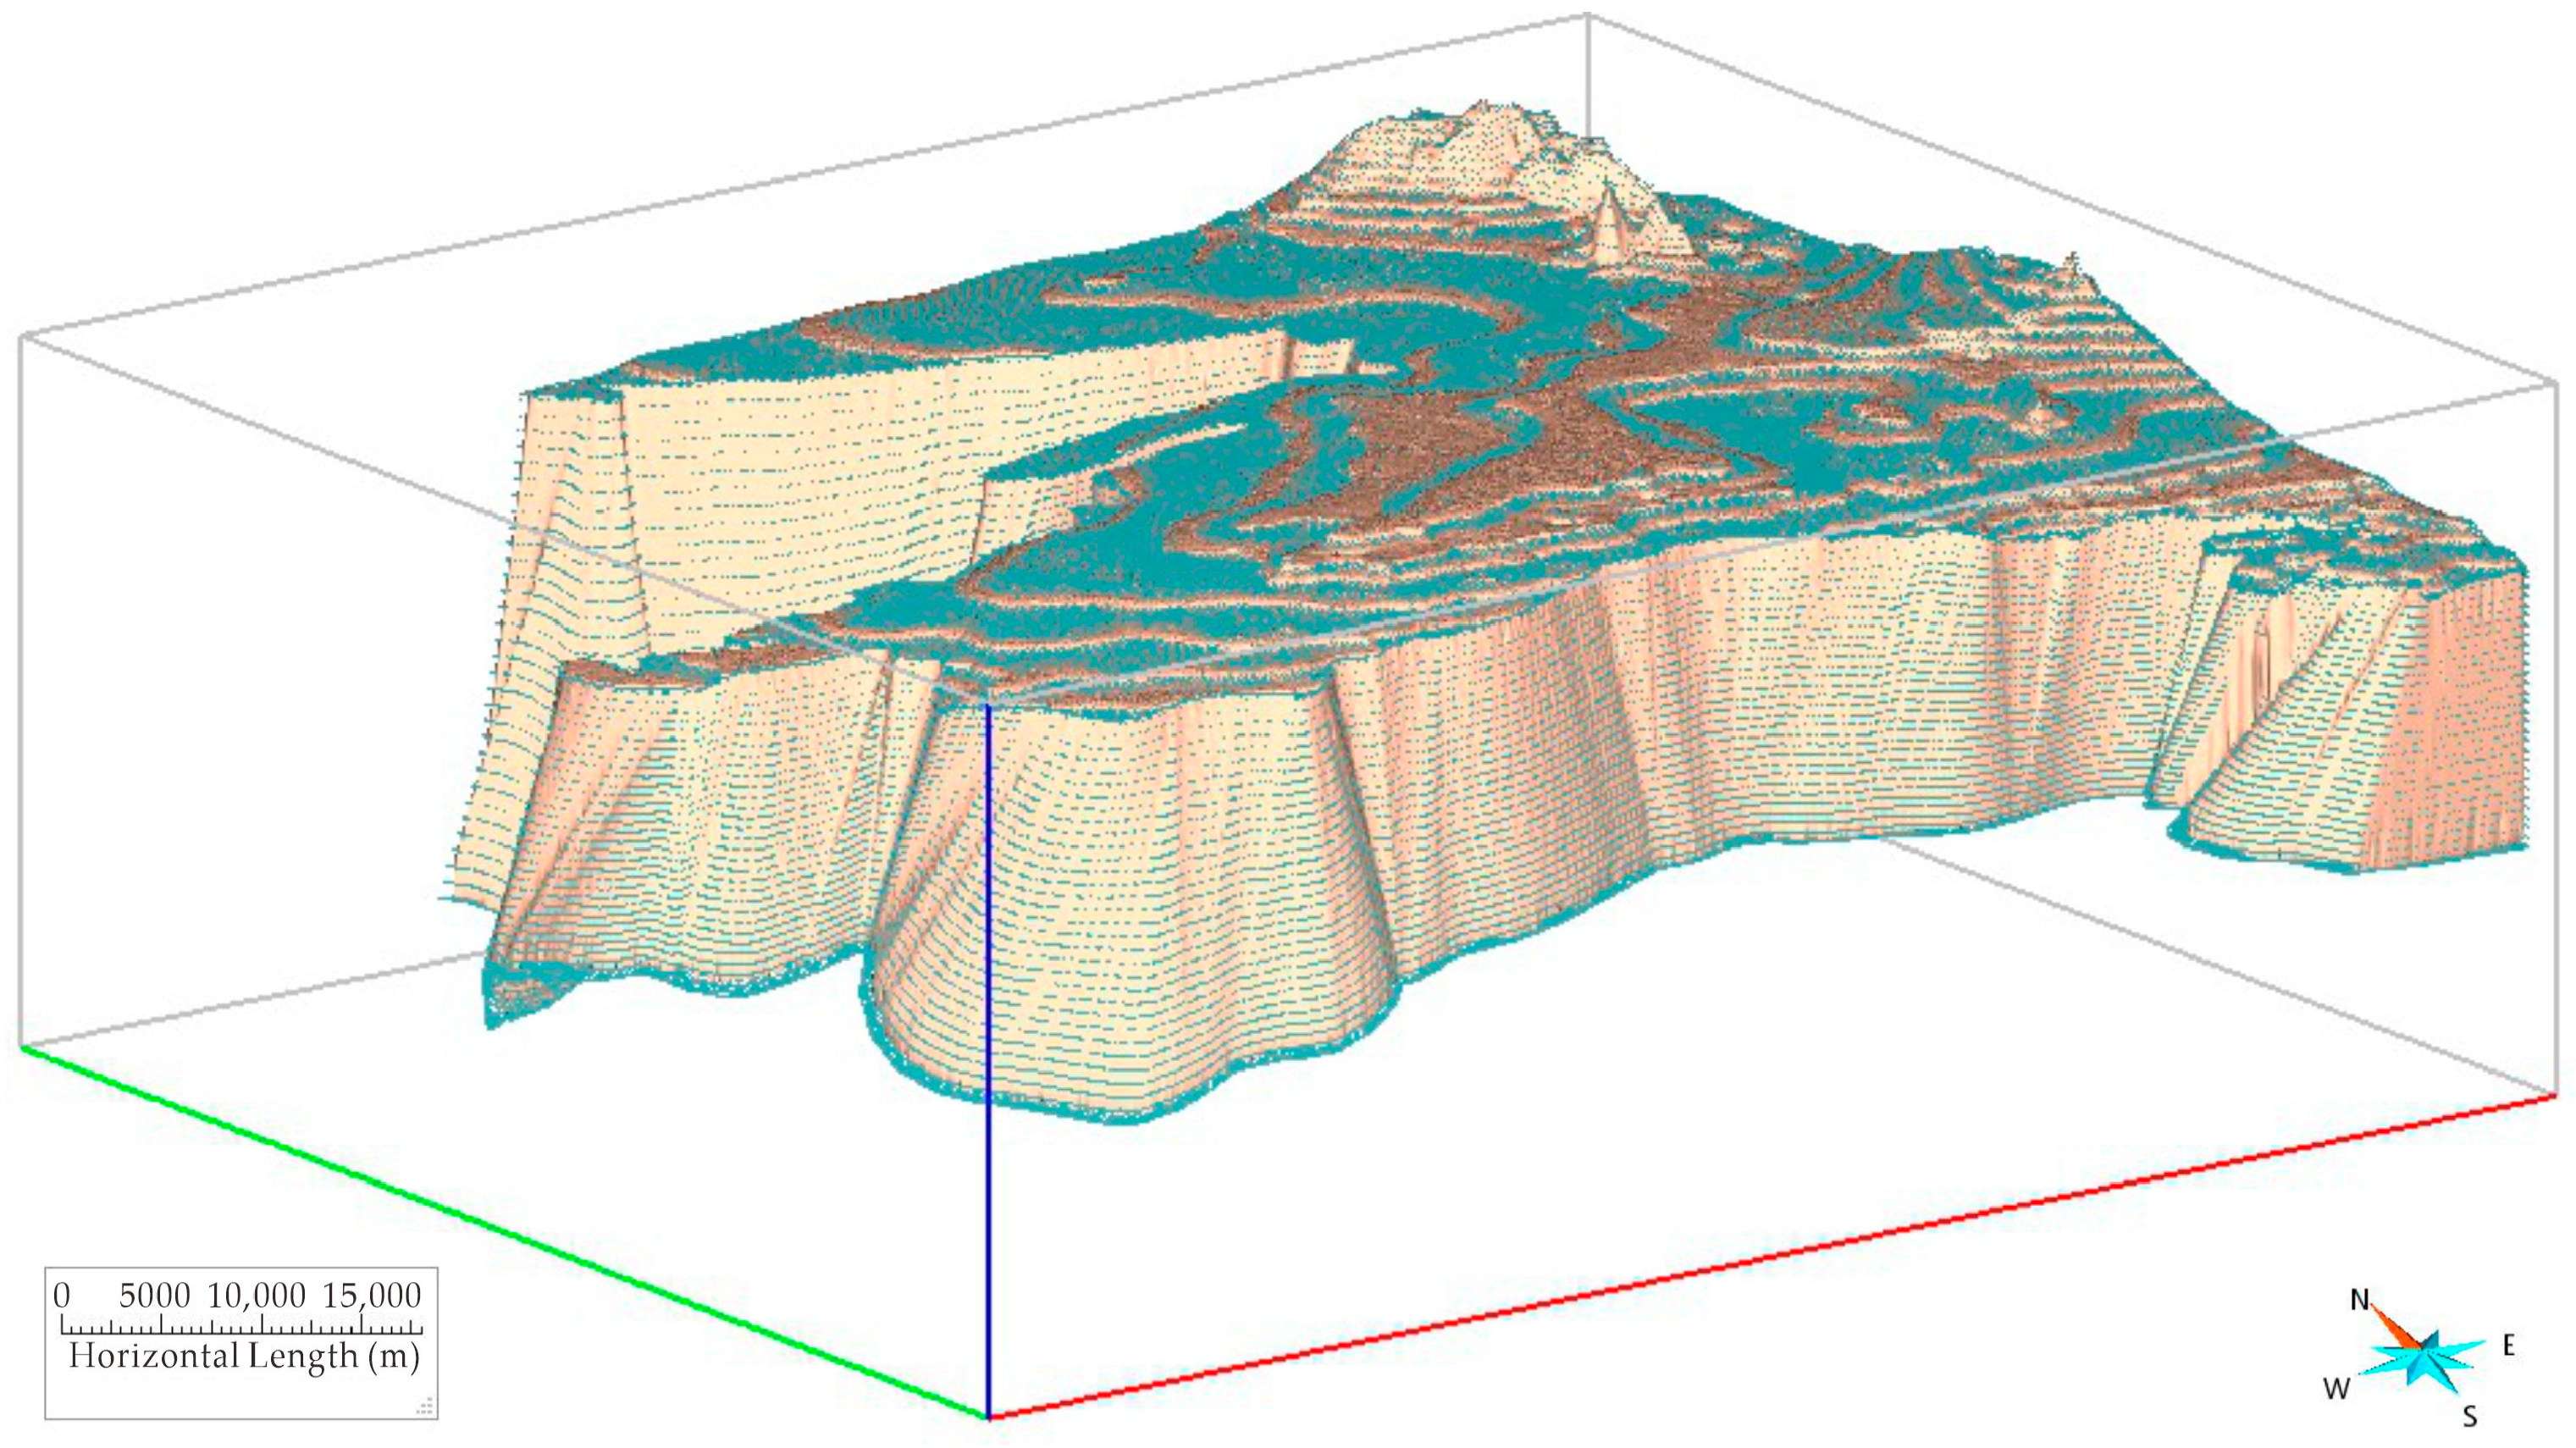
The primary source of uranium for sandstone-type uranium deposits is the weathering source area at the basin’s edge. The extensive distribution of intermediate-acidic magmatic rocks in the Kamust uranium deposit’s weathering source area provides a substantial amount of uranium-bearing detritus, supplying a rich source of uranium for the subsequent oxidation and alteration processes. The weathering source area model’s top surface utilizes topographic DEM data, while the bottom surface is based on the extension interface of the Carboniferous strata (D). Manually added control lines enrich the morphology of the geological body of the weathering source area.
The weathering source area model is constructed using complex rock mass modeling (Figure 5). Observations from the model indicate that the geological body at the base of the weathering source area extends deeply into the central part of the Junggar Basin.
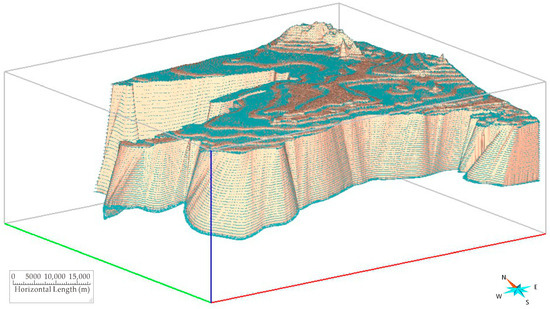
Figure 5.
Three-dimensional model of the erosion source area in the Kamust uranium deposits.
6. Ore-Forming Favorable Information Extraction and Deep Ore-Prospecting Prediction
This paper, based on the three-dimensional geological solid model of the Kamust uranium deposit area, uses the characteristics of sandstone-type uranium ore formation. By analogy with the ore bodies and various ore-controlling elements, a prospecting model is summarized. Utilizing the “Cube Prediction Model” forecasting method, cubic blocks (300 m × 300 m × 50 m) are taken as the basic predictive elements, and a total of 7,800,000 unit blocks are divided according to such scale standards.
6.1. Extraction of Favorable Stratigraphic Information
For the Kamust uranium deposit area, the primary strata targeted for prediction include the Neogene (N), Paleogene (E), Cretaceous (K), Middle Jurassic Toutunhe Formation (J2t), Xishanyao Formation (J2x), Lower Jurassic Sangonghe Formation (J1s), Badaowan Formation (J1b), Triassic (T), Permian (P), and Carboniferous (C). By utilizing the stratigraphic solid model and the known ore body solid model, we constrain the range attributes of the cubic blocks. Superimposed calculations on their spatial correlation with ore bodies are then performed, followed by a statistical analysis of the constrained stratigraphic attributes within the cubic blocks.
The geological statistical results (Table 2) indicate that the Toutunhe, Xishanyao, and Sangonghe formations have significant ore-controlling effects. This study considers the upper and lower 100 m range of these stratigraphic interfaces as the interformational ore-forming zone. Notably, within the 200 m range of the Xishanyao Formation’s interformational interface, 410 out of 416 known ore bodies are found, representing 98% of the total.
Table 2.
Information entropy table of the mineralization elements in the Kamust uranium deposits.
6.2. Structural Zone Information Extraction
Local uplifts at the edges of sedimentary basins create favorable conditions for ore formation, particularly within tectonic slope zones that facilitate the migration of uranium sources. Uranium-bearing, oxygen-rich water migrates along sandstone layers, precipitating at the interlayer oxidation front and discharging fluids along faults. This results in sandstone-type uranium deposits characterized by a large horizontal extent and relatively thin vertical thickness.
In this study, we quantitatively analyzed the development characteristics of fault structures, magmatic activity, distribution features, and intersection point characteristics using methods such as main fault branches, central symmetry, azimuthal anomaly, and the number of structural intersections. By overlaying these characteristic variables with known ore bodies in the prediction area, we extracted favorable ore-forming information data.
Based on the established three-dimensional model of fault structures, we extracted intersection line file data at different elevation levels, yielding a total of 34 distribution maps of fault structures within the predicted area’s elevation range. Subsequently, cubic three-dimensional prediction software was used to perform an interpolation analysis on the fault structure line data across the 34 intermediate planes, further quantitatively analyzing and extracting linear geological characteristics information on the prediction area.
Although the main controlling factor for ore formation in the Kamust uranium deposit area is not tectonic, the final analysis shows a positive correlation between the azimuthal anomaly and the buffer zone of the Kalasayi fault structure with ore formation.
For the azimuthal anomaly, this anomaly reflects the characteristics of local structures, specifically the distribution of secondary structures, in the study area. The favorable interval in the Kamsut uranium deposit area is (0.8, 1) (Figure 6).
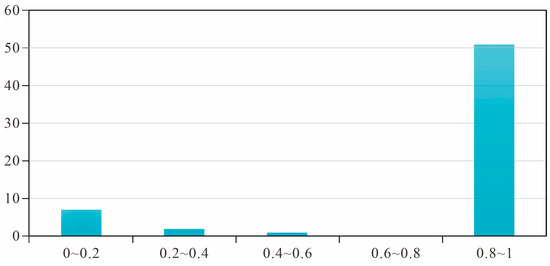
Figure 6.
Histogram of the orientation anomaly degree of known ore bodies in the Kamust uranium deposits.
For the structural fault buffer zones, a structural buffer zone model was established for an 800 m range around the faults to investigate the ore-controlling nature of major deep faults. The deep fault buffer zones were then superimposed and analyzed with the known ore body distribution model, with the results shown in Figure 7.
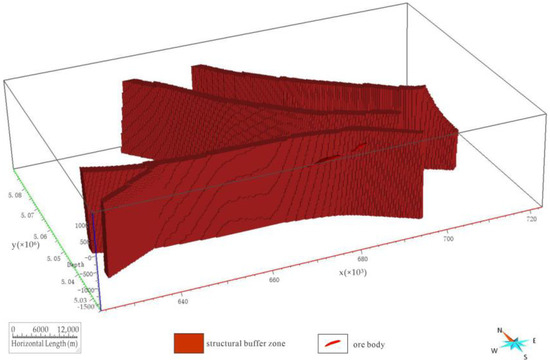
Figure 7.
Overlay diagram of the structural buffer zone blocks and known ore bodies in the Kamust uranium deposits.
According to the statistical analysis based on the theory and methods of geostatistics, the overlap effect of the 800 m buffer zone of the fault structural zone with the known ore body model is average. Within the buffer zone of the Kamust uranium deposit area, there are 18 cubic blocks containing ore bodies.
6.3. Extraction of Interlayer Oxidation Zone Information
The Toutunhe Formation in the Kamust uranium deposit area is characterized by a large-scale interlayer water-infiltration oxidation process that took place in a weakly reduced geochemical environment [47]. Along the basin’s edge, oxidation predominantly occurs through phreatic conditions, with a transition to interlayer oxidation as one moves toward the basin’s center. The interlayer oxidation zone is extensive, exhibiting good lateral continuity and stability, and it spans various segments with interconnectivity. This zone is approximately 8 km long and varies in thickness from about 30 to 70 m. However, the exact width of the oxidation zone remains undefined due to constraints in the available drill hole data.
Recent exploration and scientific research in the Kamust area have identified interlayer oxidation zones of notable scales within both the Middle Jurassic Toutunhe Formation and the Xishanyao Formation [47]. The Toutunhe Formation hosts the more extensive oxidation zones, while the Xishanyao Formation contains relatively smaller ones. Slightly weaker oxidation zones are also present in the Lower Jurassic Badaowan Formation and the Sangonghe Formation. Given that the formation of interlayer oxidation zones is largely governed by the distribution of sand bodies, a stratified rock model is employed to construct the interlayer oxidation zone model.
In this study, interlayer oxidation zone information was extracted through the digitization and spatial reconstruction of exploration profile data, followed by information classification. By delineating the boundaries of these zones, a three-dimensional model of the interlayer oxidation zone for the Kamust uranium deposit was created. This model serves as a key element in quantitative ore prediction. The detailed process of model establishment is described elsewhere and can be referenced in the cited literature [61]. Upon establishing the Toutunhe oxidation zone model and overlaying it with known ore bodies for analysis, it was found that there are 261 ore bodies, which are predominantly located within the oxidation zone.
6.4. Three-Dimensional Predictive Quantitative Model
This study conducts a statistical analysis of the buffer zones surrounding ore-controlling elements to ascertain the optimal influence range of these elements on uranium ore bodies, thereby identifying the geological anomaly elements that are crucial for ore prospecting.
Utilizing the established block property model within the prediction area, and further integrating the geological conditions and ore-forming geological patterns specific to the study area, we perform a quantitative analysis and an extraction of favorable ore-forming information values within the block property model. This analysis is employed to compute a three-dimensional predictive quantitative model for the prediction area.
In the Kamust uranium deposit area, the influence of strata and oxidation zones on ore control is particularly significant. Drawing upon the favorable ore-forming information, such as strata, structures, ore bodies, and oxidation zones, a three-dimensional quantitative predictive model for the Kamust uranium deposit area is constructed (Table 1). The analysis and calculations derived from this three-dimensional predictive quantitative model lead to the selection of specific geological strata, namely, the Toutunhe Formation, Xishanyao Formation, and Sangonghe Formation with a 200 m buffer zone, as well as structural buffer zones (800 m), oxidation zones, and azimuthal anomaly ranges (0.8 to 1) as exploration indicators. The quantitative analysis results are subsequently processed through binarization for a clearer delineation of prospective exploration targets.
6.5. Comprehensive Information Analysis and Prediction
This paper employed three-dimensional evidential belief functions and three-dimensional information entropy methods for comprehensive information analysis and the prediction of deep ore formation in the Dongzhun Kamst uranium deposit area.
6.5.1. 3D Evidential Belief Functions Method
The evidential belief function method, introduced by Canadian mathematical geologist Agterberg F P [62], is a sophisticated geological statistical technique. This method employs Bayes’ theorem to perform a comprehensive statistical analysis of the superimposed favorable ore-forming elements. It assesses the contribution of each element to ore formation and identifies the convergence of favorable factors to predict prospective areas for mining. In this study, the attributes of each evidence factor within the cubic model are binarized (zero or one) to analyze the favorable range for ore formation. Following this, the three-dimensional evidential belief function method is applied to calculate the weight values of each evidence factor within the ore deposit.
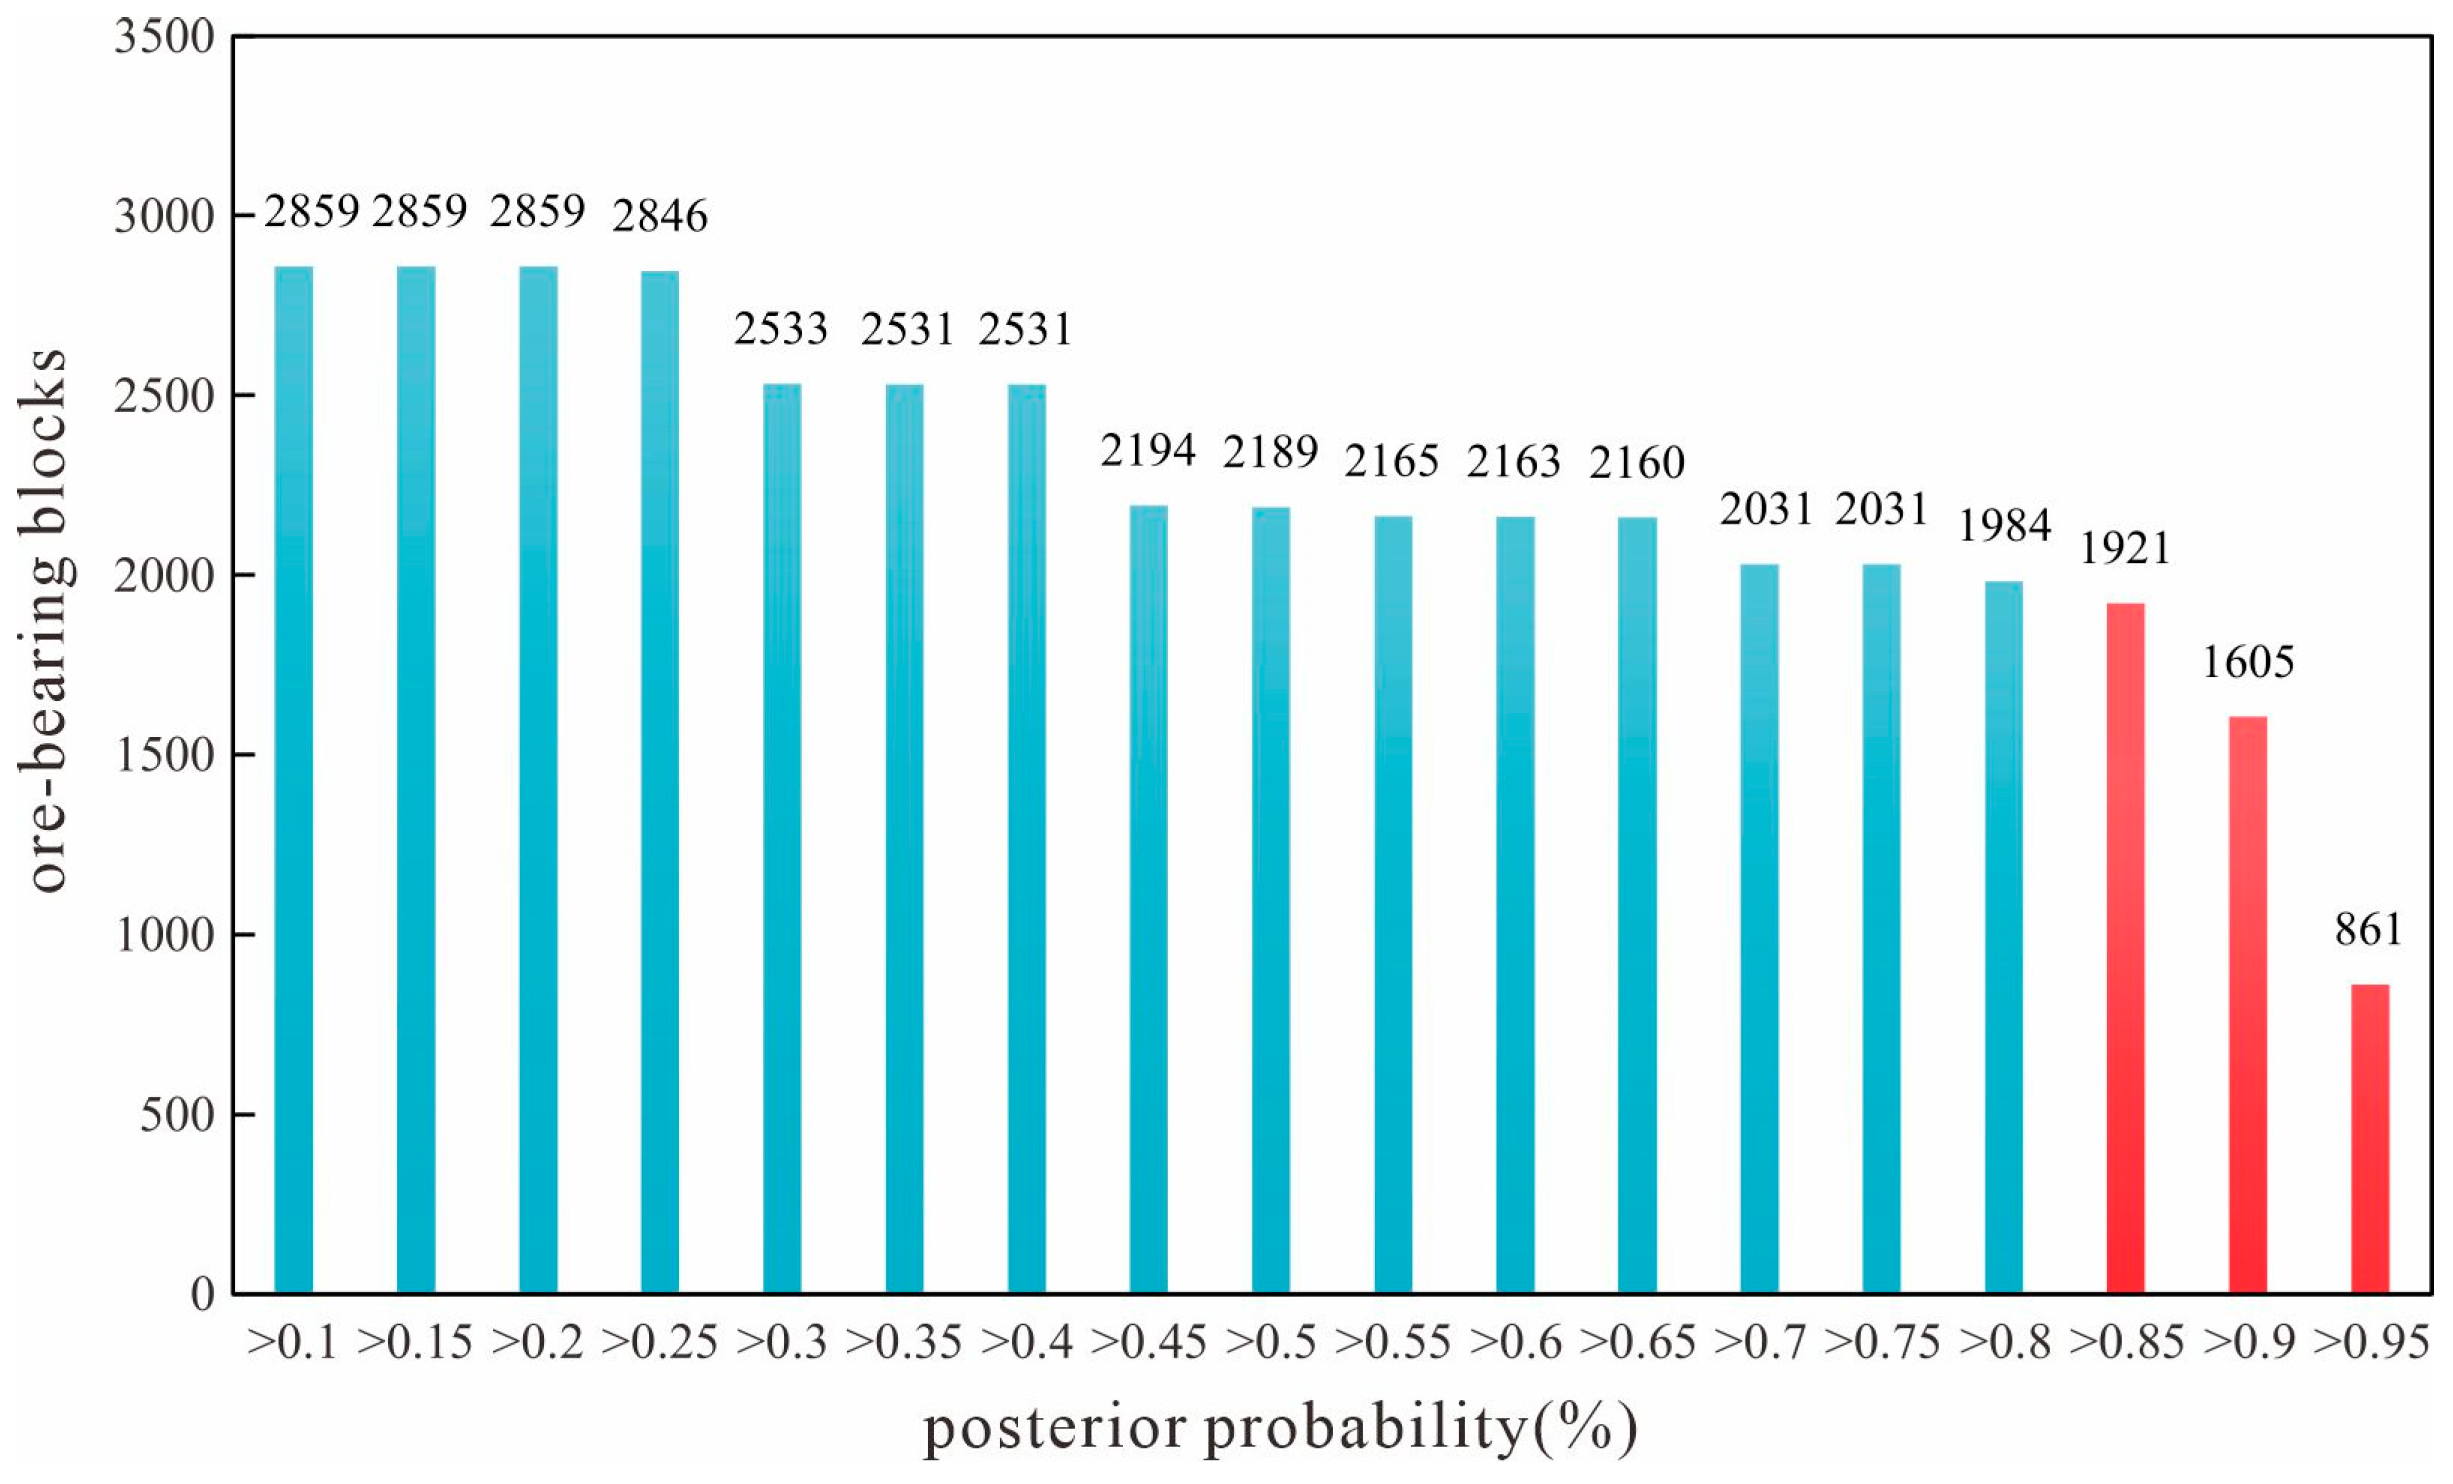
A result analysis (Table 3) reveals that the Jurassic strata, Toutunhe Formation sand bodies, and interlayer oxidation zones have high weight values, indicating a strong correlation with uranium ore bodies and a relatively minor association with fault structure characteristics. Based on the posterior probability values of the predicted blocks, the mining area is categorized into different grade intervals. These intervals are color-coded and quantified to facilitate identification (Figure 8). Figure 8 illustrates that 77.93% of the known ore bodies are located within cubic blocks, where the posterior probability values are ≥0.85. Consequently, areas with a posterior probability exceeding 0.9 are deemed highly prospective for ore formation.
Table 3.
Weights of prediction variables.

Figure 8.
Statistical graph of known ore bodies calculated by posterior probability.
6.5.2. 3D Information Entropy Methods
The 3D information-quantity method, introduced by E.B. Vissotskiy and N.N. Chaykin, employs the principles and techniques of non-parametric univariate geological statistical analysis for regional mineral resource prediction. This method emphasizes the spatial distribution analysis of various geological elements and ore-forming units within a study area, assessing the influence of each ore-forming element, including geological factors, on mineral resource prediction. It involves a quantitative analysis and statistical evaluation of the ore-forming elements in the prediction area to calculate the information-quantity value of these elements.
A statistical analysis of the ore-forming elements in the Kamust uranium deposit area (Table 2) reveals the contribution of each element to mineral exploration. Based on these findings, areas of high information-quantity value are identified by considering the geological context and ore-forming patterns of the study area. The number of mineralized units within these intervals is then statistically combined (Figure 9), along with a distribution table of known ore bodies with varying information-quantity values (Table 4).
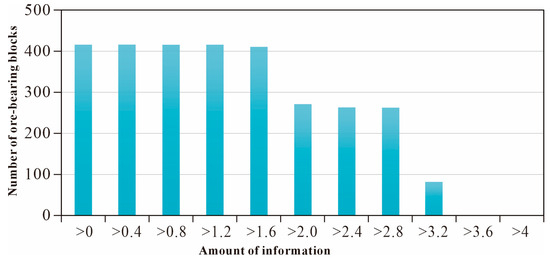
Figure 9.
Map of the study area with information entropy values superimposed on known ore bodies.
Table 4.
Distribution statistics table of known ore bodies within different information entropy values.
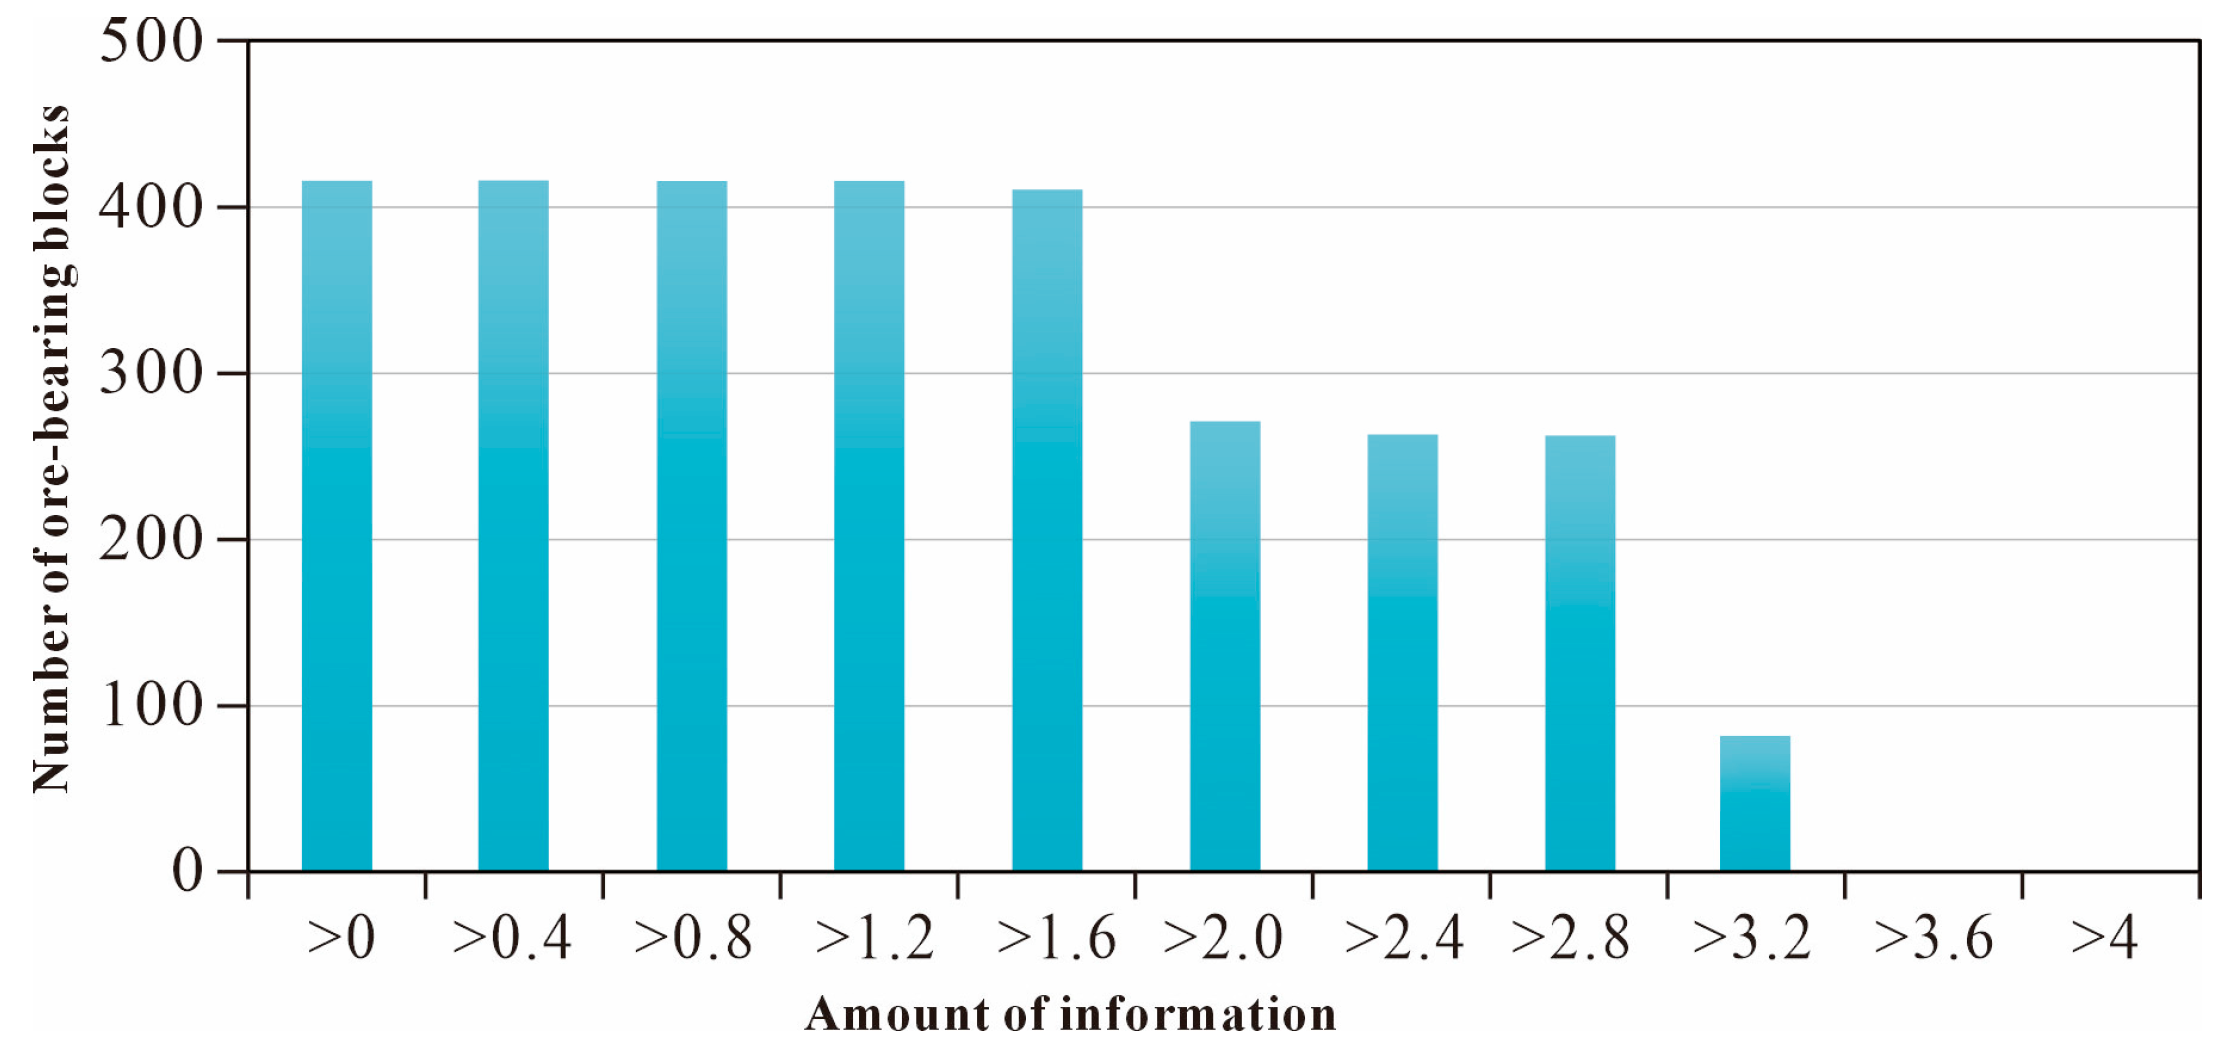
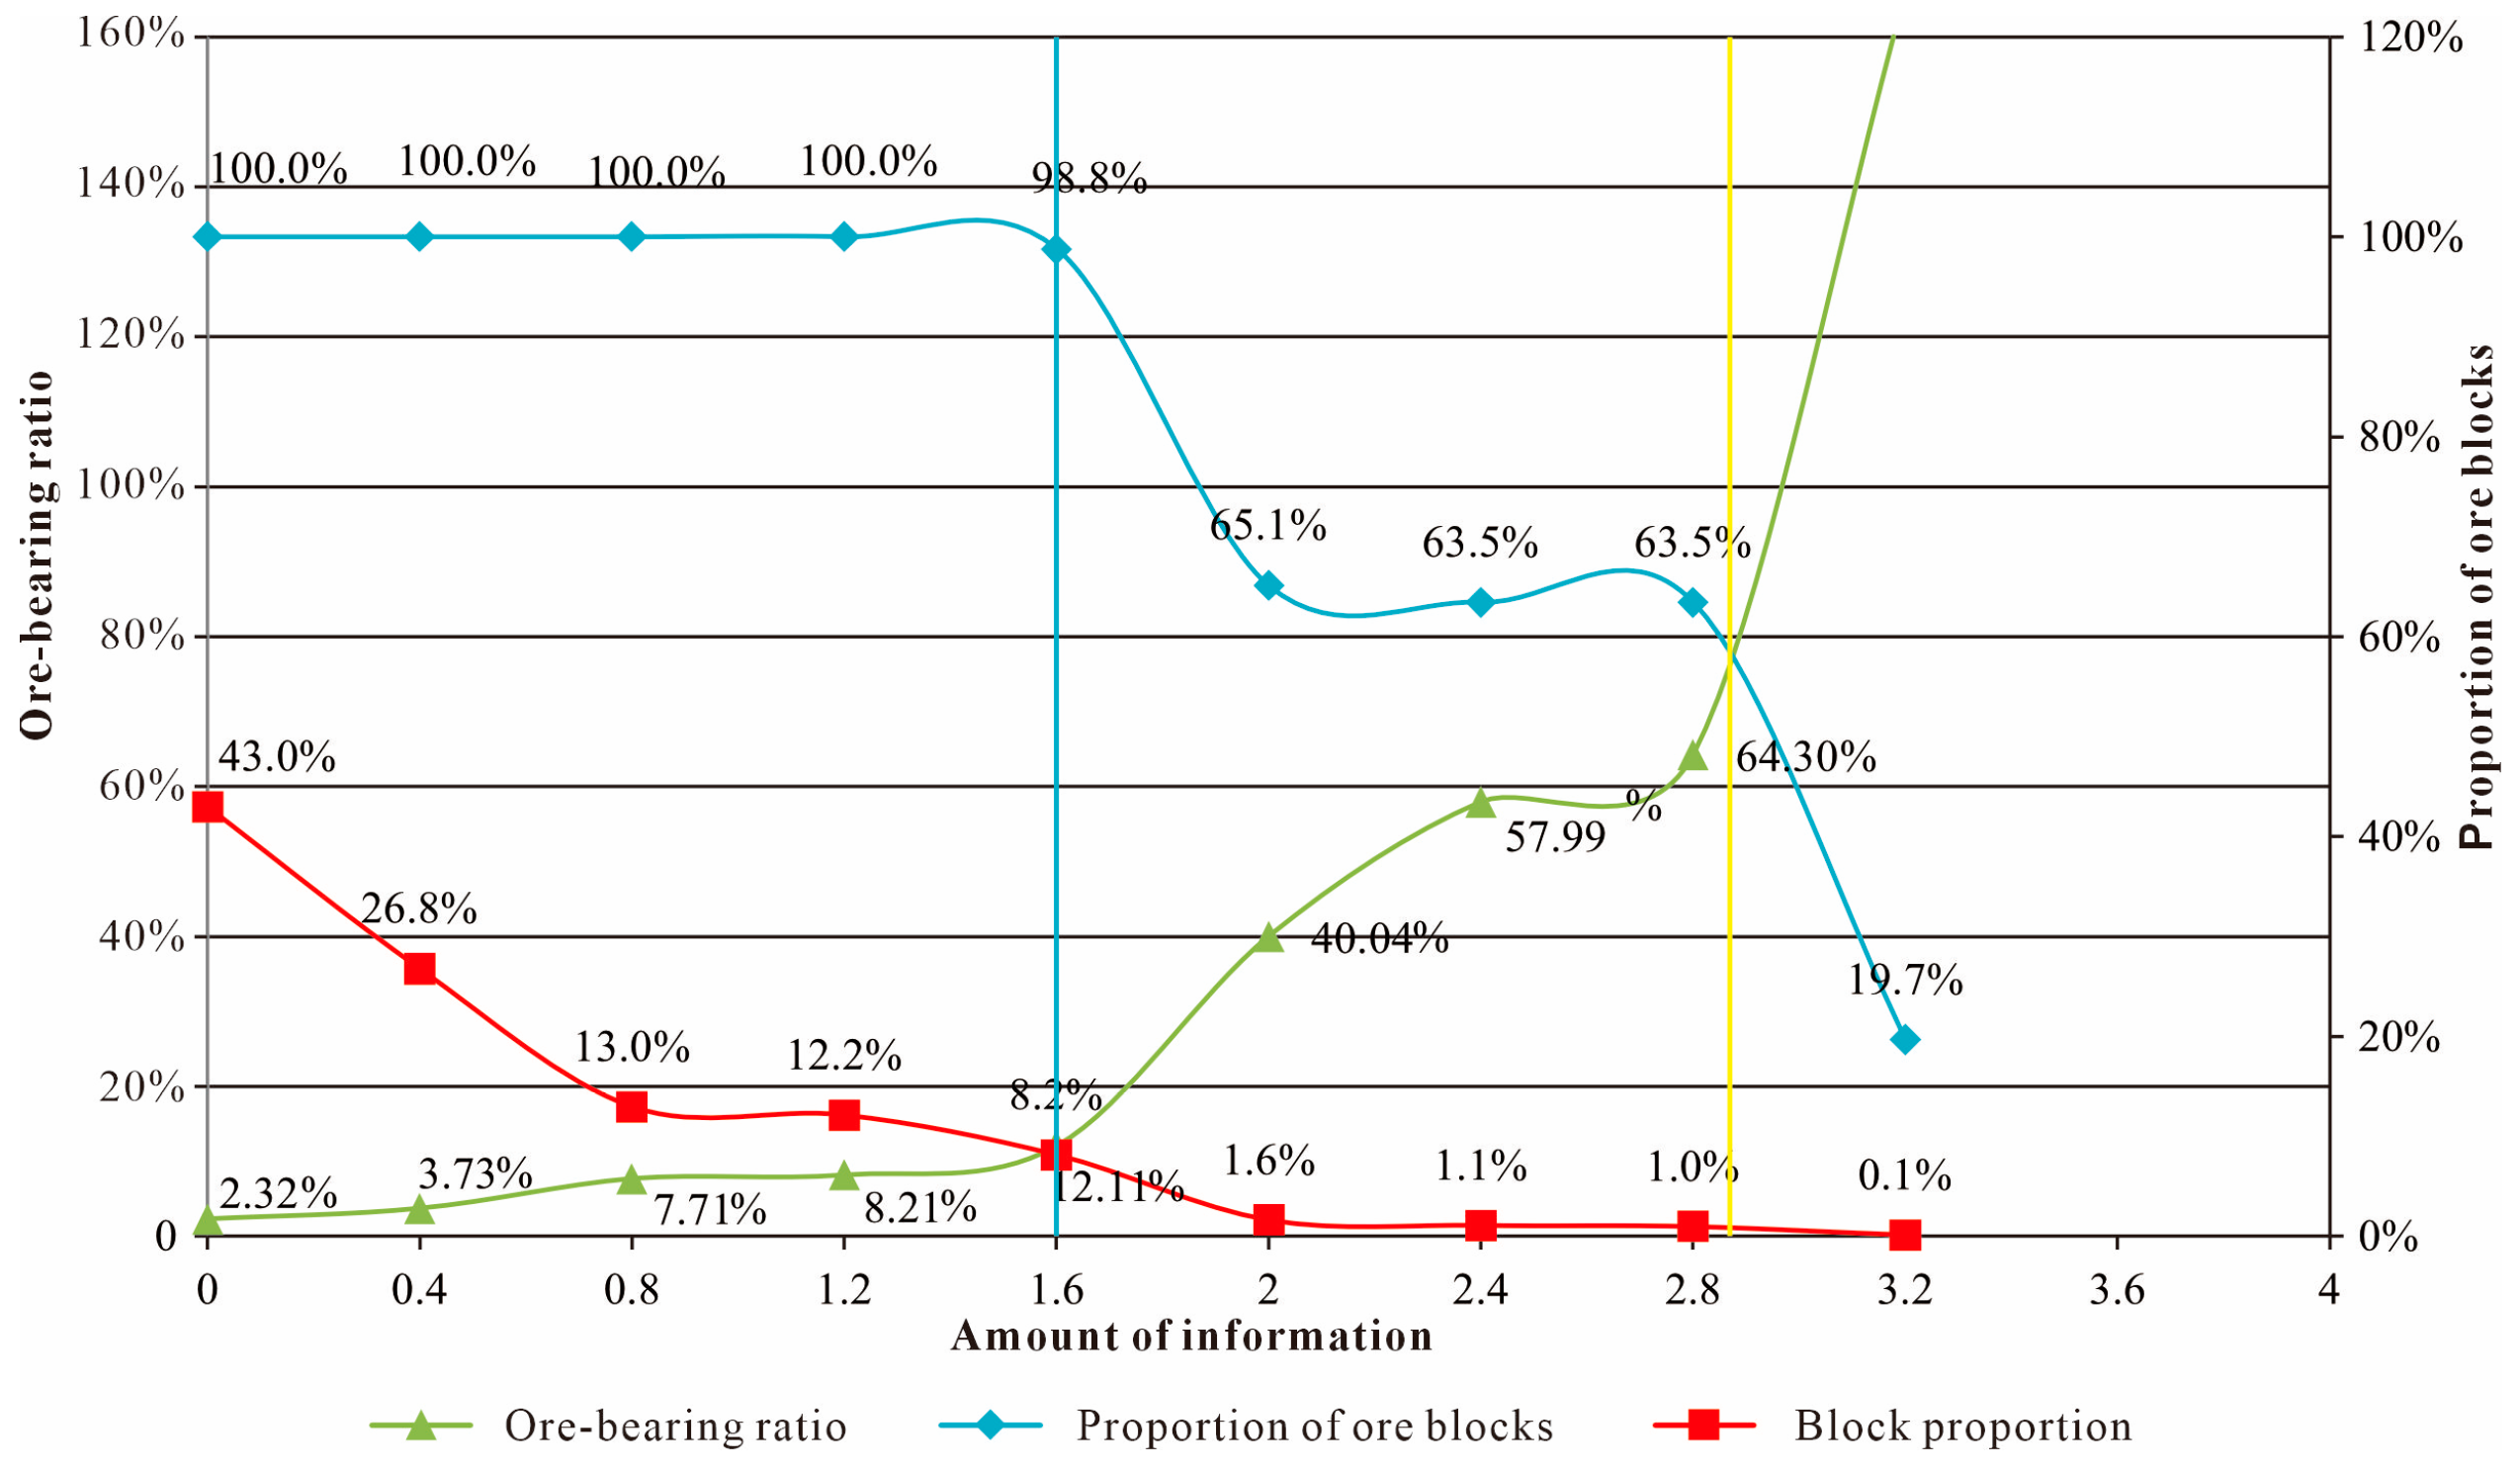
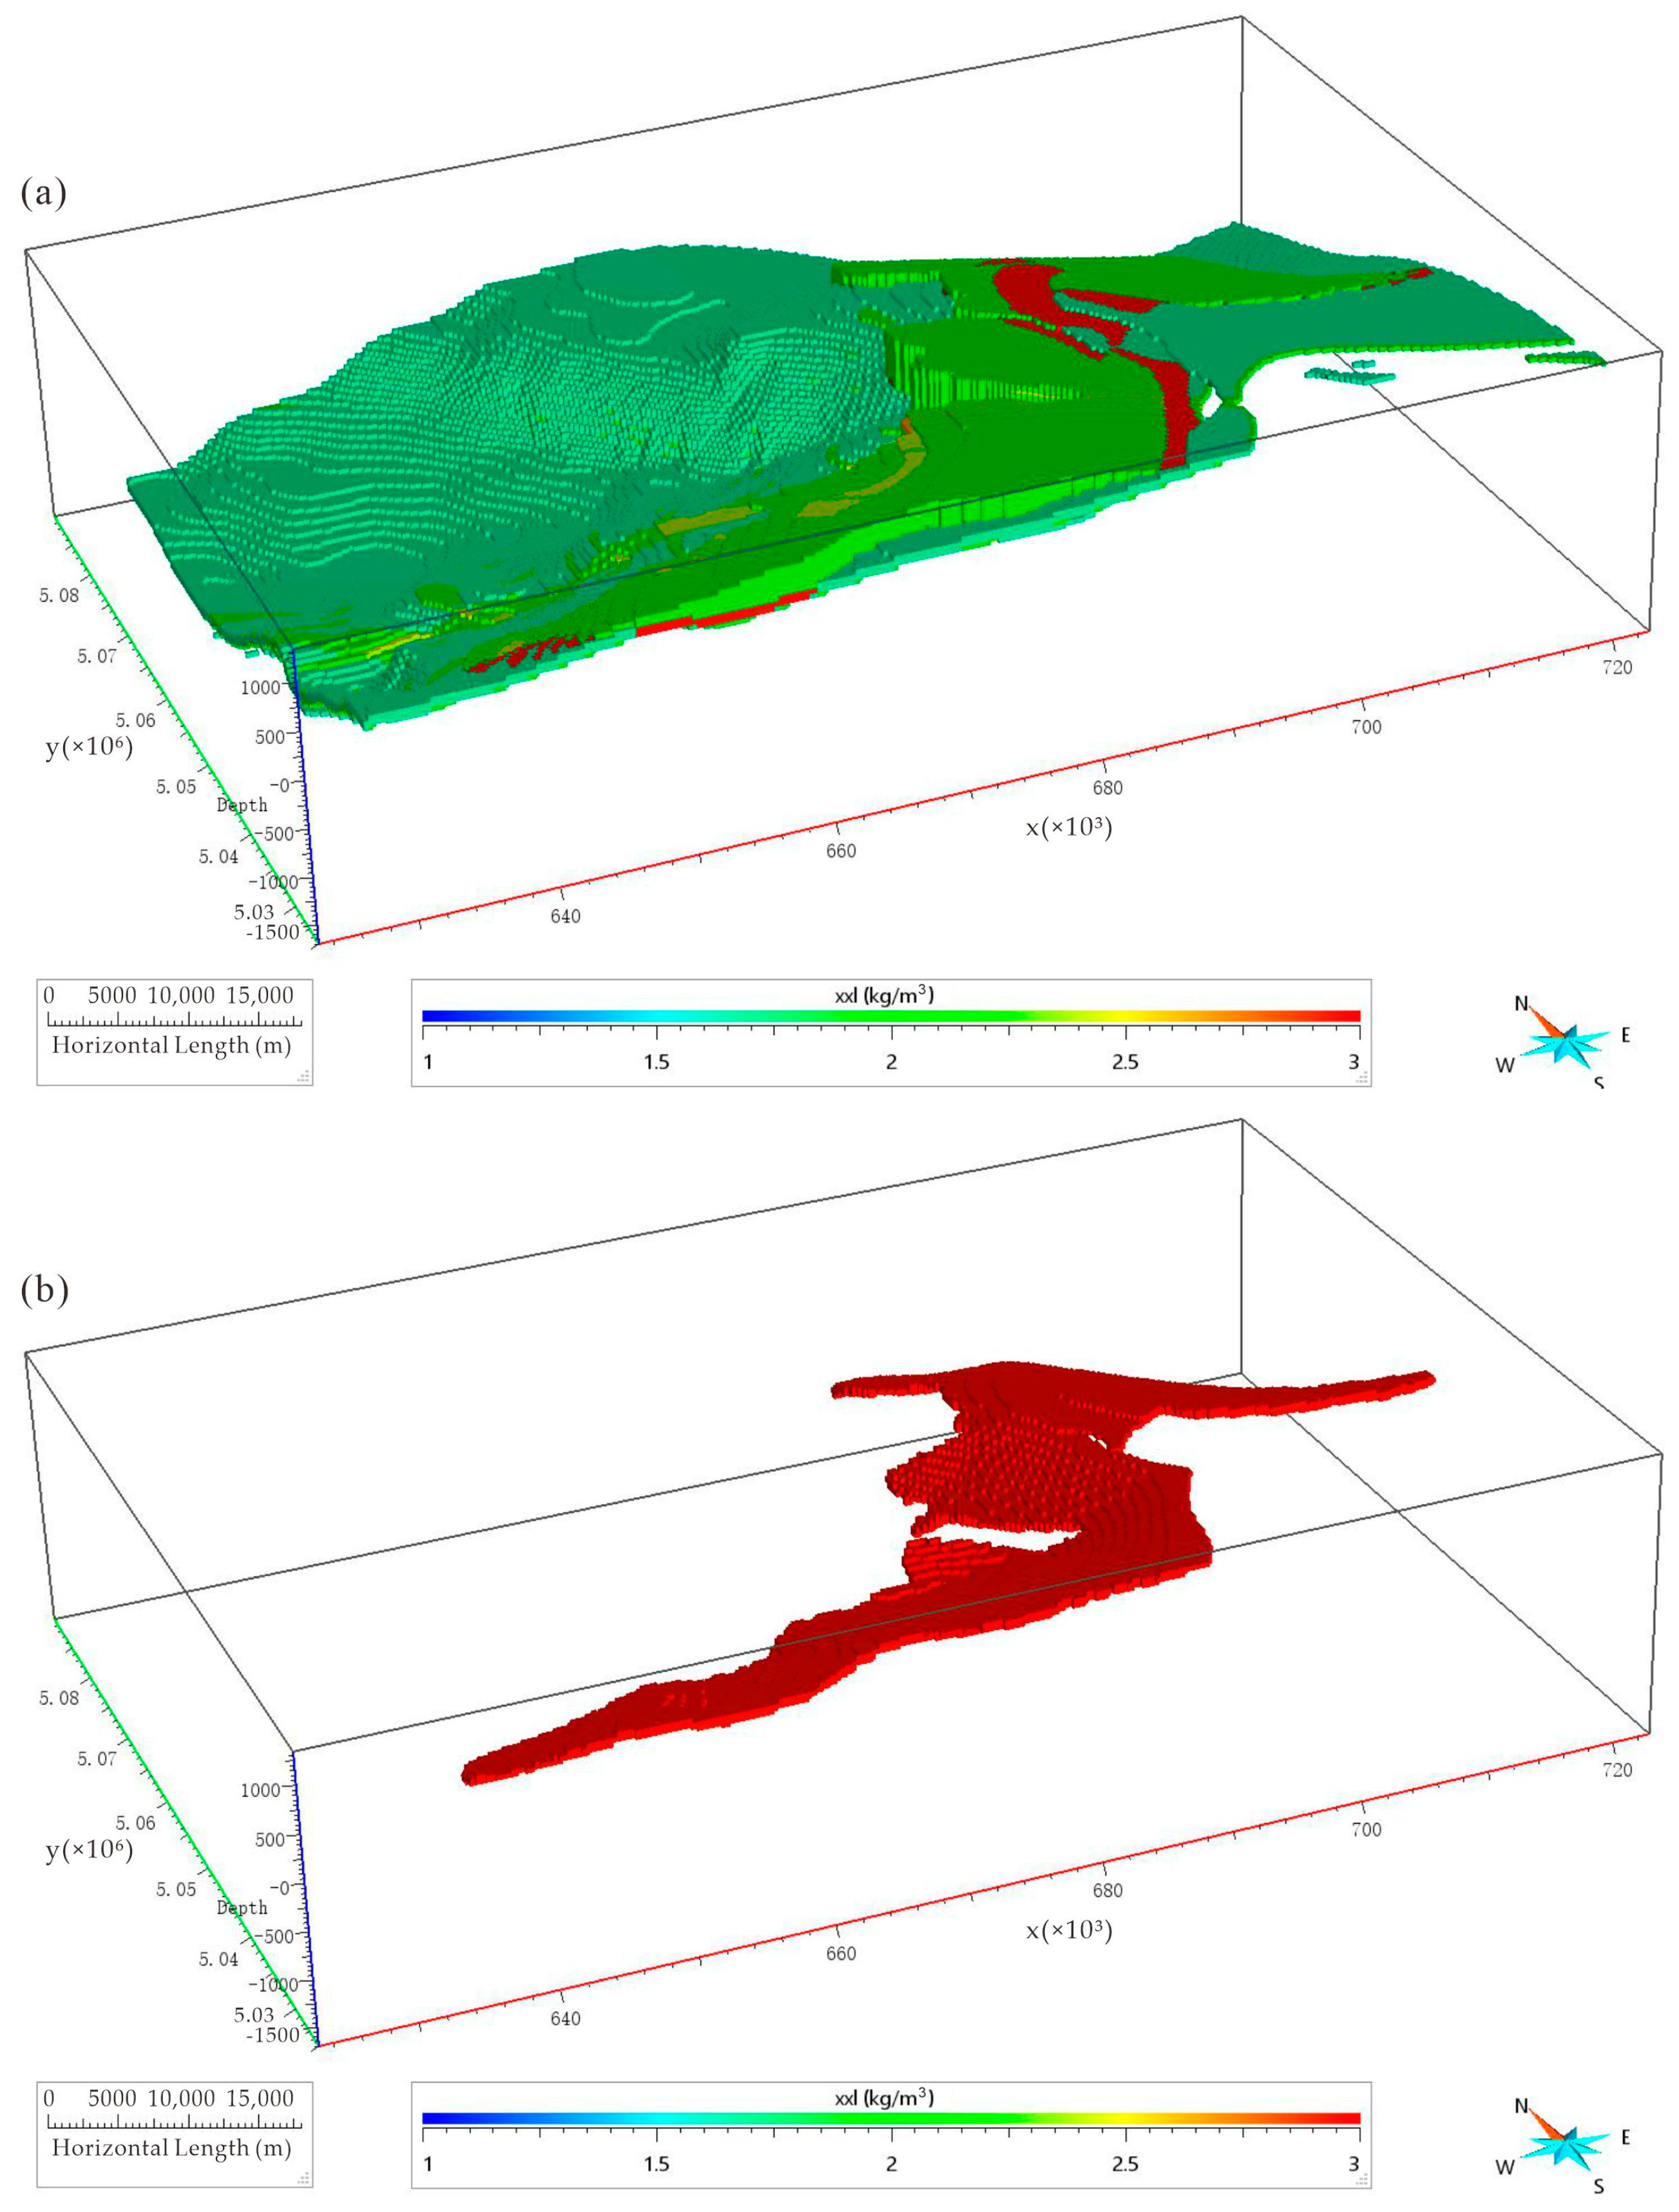
Analyzing the calculation and statistics of different information-quantity values helps to identify trends and inflection points in the changes in ore block proportions and mineralization rates. The information-quantity values range from 1.6 to 2.8 and above 2.80. Significantly, at an information quantity of 1.6, there is a notable shift in the proportion of ore blocks, and at an information-quantity value of 2.8, the proportion of blocks begins to stabilize (Figure 10). During the research, blocks with an information quantity above 1.6 were identified as favorable for ore formation (Figure 11a). These blocks are predominantly located within the spatial range of the Xishanyao Formation’s interformational buffer zone and the Toutunhe oxidation zone in the study area. Given the broad distribution of favorable ore-forming blocks, further refinement is needed to pinpoint prospective areas. To enhance the selection of prospective areas for ore exploration, a threshold of 2.8 is set, where blocks with an information quantity above 2.8 are deemed to be highly favorable for ore formation (Figure 11b).
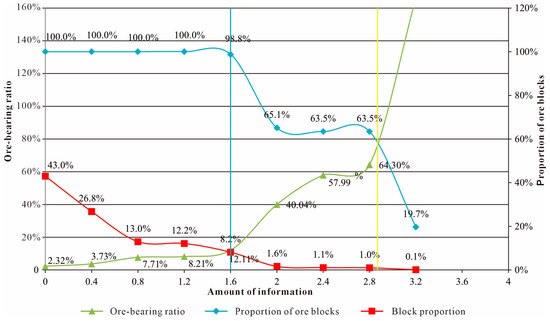
Figure 10.
Statistical analysis diagram of the information entropy in the study area.
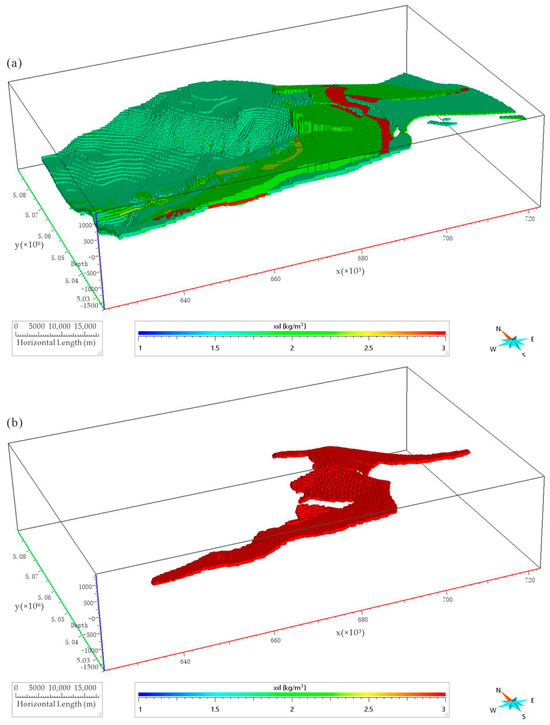
Figure 11.
Distribution of favorable ore-bearing blocks in the Kamust prospecting area. (a) Distribution of favorable ore-bearing blocks with information content > 1.6. (b) Distribution of favorable ore-bearing blocks with information content > 2.8.
6.5.3. Delineation of Prospective Ore-Forming Areas
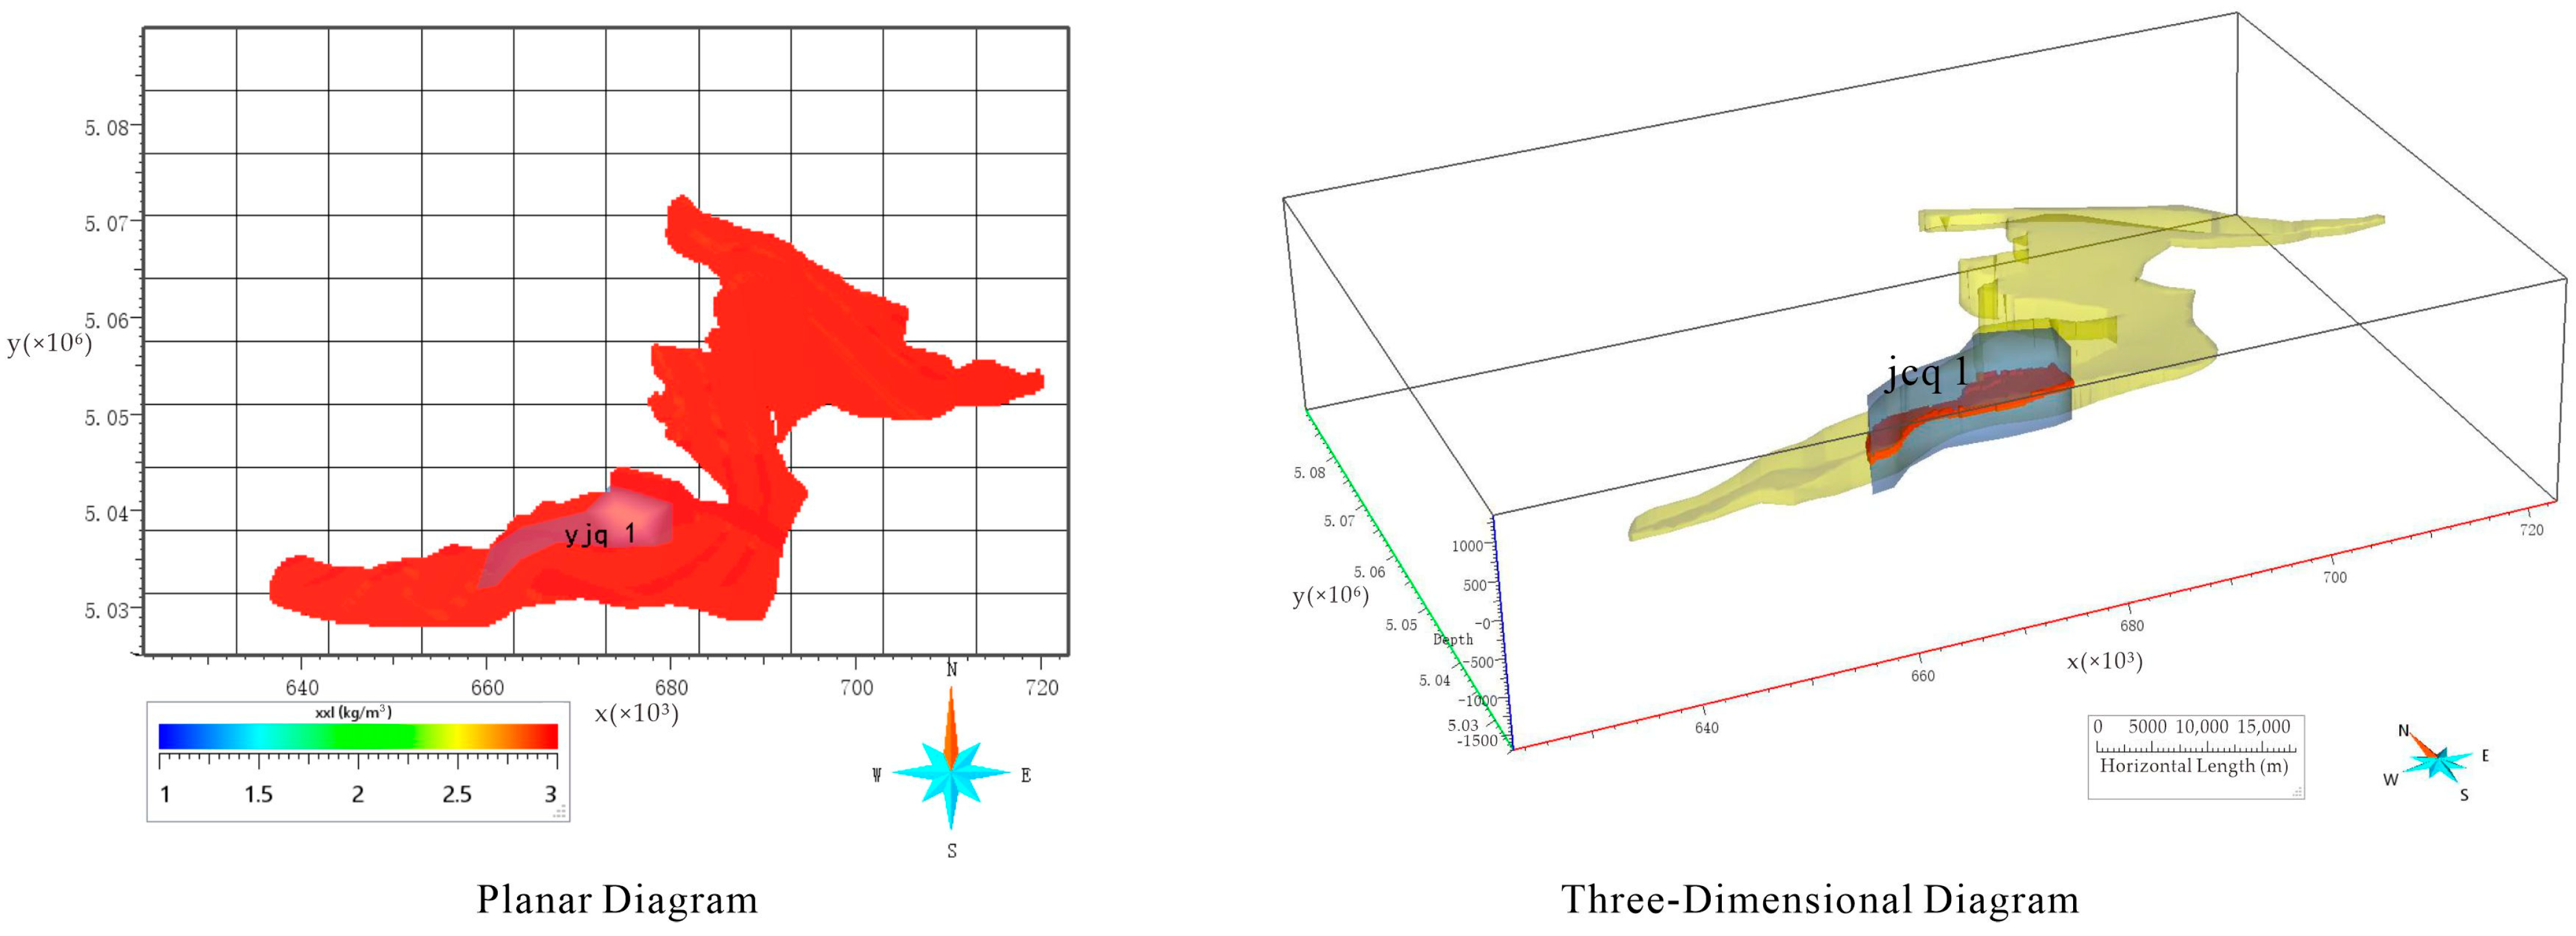
By employing the evidential belief function method and the information entropy method, this study calculated the posterior probability values and information-quantity values for the Kamust uranium deposit area. Through interval statistical analysis and excluding the regions occupied by known ore bodies, the analysis was integrated with the regional geological characteristics and fundamental ore-forming patterns. Additionally, the distribution of these patterns in three-dimensional space was considered. Consequently, one prospective ore-forming area was delineated (Figure 12). This area is located within the Kalasayi monocline and is spatially positioned within the Toutunhe oxidation zone.
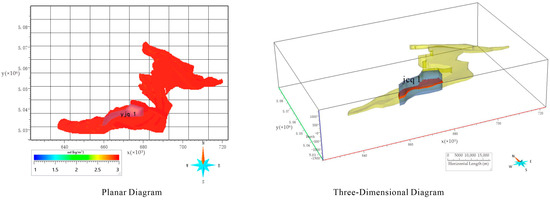
Figure 12.
Distribution map of the Kamust uranium metallogenic prospect area.
6.6. Ore-Prospecting Prediction
The three-dimensional structural model, in conjunction with integrated electromagnetic characteristics, reveals that uranium ore formation in the study area is predominantly governed by stratigraphic lithology, sand bodies, structural features, and interlayer oxidation zones. The coal-bearing clastic sedimentary formation, which is rich in organic matter, carbonaceous debris, and pyrite—substances with reductive properties—formed under a warm and humid climate, provides an ideal environment for the emplacement of sandstone-type uranium ores. The “mud-sand-mud” interbedded lithologic structure of the Toutunhe Formation is instrumental in creating effective aquiclude layers above and below the sand bodies, which is beneficial for ore formation. The tectonic slope zone, shaped by the Kalasayi monocline due to tectonic movements, facilitates the migration of uranium-bearing, oxygen-rich waters from the source area along the sand bodies. These waters precipitate and concentrate at the oxidation front, leading to ore formation. Subsequent tectonic uplifts in the eastern Junggar area have exposed Jurassic sand bodies developed on the Kalasayi monocline, which were subsequently modified by later-arriving uranium-bearing, oxygen-rich waters, promoting the development of interlayer oxidation zones and uranium mineralization.
Furthermore, geophysical and geochemical exploration data indicate that the measured radon concentration ratio R in the Kalasayi monocline and its eastern side exceeds the calculated radon concentration, suggesting the presence of deep-seated radioactive nuclides. This finding also suggests that the area is a prospective zone for deep uranium mineralization, aligning with the outcomes of comprehensive information prediction. Through three-dimensional comprehensive geological modeling, this study quantitatively delineates a prospective ore-forming area to the east of the Kalasayi monocline. This area, as a target for deep exploration, holds significant potential for further ore formation and exploration at greater depths.
7. Conclusions
This study presents a comprehensive and information-driven approach to predicting deep uranium ore formation, particularly in areas where geological data are limited. By integrating multi-source data, employing three-dimensional geological modeling, and utilizing advanced visualization techniques, we have addressed the challenges associated with incomplete geological information in mining regions.
- The study concentrates on the Kamust uranium deposit, adopting a holistic methodology to ascertain the type, location, depth, and quantity of ore. Through the application of three-dimensional geological modeling and visualization technologies, we have developed an intricate 3D model database for the Kamust deposit. This database consolidates various elements, such as drill holes, uranium ore bodies, controlling structures within the mining area, interlayer oxidation zones, and source areas. It facilitates the transparent visualization of the spatial distribution of the favorable ore-forming strata, structures, and other predictive elements within the mining area;
- Based on the three-dimensional geological model, we have summarized and generalized the regional ore-forming mechanisms, ore-controlling elements, and exploration indicators to establish a predictive model for ore discovery. This model, when integrated with big-data technology, enables the quantitative analysis and extraction of ore-controlling elements, offering substantial data support for the in-depth three-dimensional quantitative prediction of the Kamust uranium deposit;
- This research applies both the 3D evidential belief function method and the 3D information entropy method to perform a comprehensive information analysis and a deep ore formation prediction for the Kamust uranium deposit area. Through this approach, we have quantitatively delineated a prospective ore-forming area, situated to the east of the Kalasayi monocline.
Author Contributions
Conceptualization, Y.G. and Z.L.; methodology, P.Z.; software, Y.G.; investigation, Z.H., S.H. and H.J.; writing—original draft preparation, Y.G.; writing—review and editing, Y.G. and Z.L.; project administration, Z.L.; funding acquisition, Z.H. All authors have read and agreed to the published version of the manuscript.
Funding
This research received no external funding.
Data Availability Statement
Data is contained within the article.
Conflicts of Interest
The authors declare no conflict of interest.
References
- Cai, Y.; Zhang, J.; Li, Z.; Guo, Q.; Song, J.; Fan, H.; Liu, W.; Qi, F.; Zhang, M. Outline of Uranium Resources Characteristics and Metallogenetic Regularity in China. Acta Geol. Sin. (Engl. Ed.) 2015, 89, 918–937. [Google Scholar]
- Li, Z.Y.; Huang, Z.Z.; Li, X.Z.; Guo, J.; Fan, C. The Discovery of Natural Native Uranium and Its Significance. Acta Geol. Sin. (Engl. Ed.) 2015, 89, 1561–1567. [Google Scholar]
- Xing, W.; Wang, A.; Yan, Q.; Chen, S. A study of China’s uranium resources security issues: Based on analysis of China’s nuclear power development trend. Ann. Nucl. Energy 2017, 110, 1156–1164. [Google Scholar] [CrossRef]
- Xu, D.; Chi, G.; Nie, F.; Fayek, M.; Hu, R. Diversity of uranium deposits in China—An introduction to the Special Issue. Ore Geol. Rev. 2021, 129, 103944. [Google Scholar] [CrossRef]
- Zhang, H.; Bai, Y. China’s Access to Uranium Resources; The Project on Managing the Atom, Belfer Center for Science and International Affairs, Harvard University: Cambridge, MA, USA, 2015. [Google Scholar]
- Bai, Y.; Guo, C.Y.; Zhu, P.F.; Tian, J.J.; He, Z.L. Three-Dimensional Prediction and Evaluation of Baiyanghe Uranium Deposit in the Xuemistan Volcanic Belt, Xinjiang. Minerals 2023, 13, 1408. [Google Scholar] [CrossRef]
- Fu, G.M.; Lü, Q.T.; Yan, J.Y.; Farquharson, C.G.; Qi, G.; Zhang, K.; Zhang, Y.Q.; Wang, H.; Luo, F. 3D mineral prospectivity modeling based on machine learning: A case study of the Zhuxi tungsten deposit in northeastern Jiangxi Province, South China. Ore Geol. Rev. 2021, 131, 104010. [Google Scholar] [CrossRef]
- Zhang, C.; Liu, S.; Ye, F.; Qiu, J.; Zhang, Z.; Wang, J. Three-dimensional modeling of alteration information with hyperspectral core imaging and application to uranium exploration in the Heyuanbei uranium deposit, Xiangshan, Jiangxi, China. J. Appl. Remote Sens. 2019, 13, 1. [Google Scholar] [CrossRef]
- Fitzpatrick, A.; Large, P. Magnetic modelling and geological modelling come together at the Kintyre uranium deposit. ASEG Ext. Abstr. 2019, 2015, 1–4. [Google Scholar] [CrossRef]
- Freire, R.C.; Veríssimo, C.U.V.; Parente, C.V.; Nogueira Neto, J.D.A.; Castro, G.L.; Silva, J.R.D.A. Three-dimensional geological modeling of the Itataia Phosphate-Uranium Deposit (Ceará, Brazil). Braz. J. Geol. 2022, 52, e20210022. [Google Scholar] [CrossRef]
- Wu, Q.; Wang, Y.; Li, Z.; Qiao, B.; Yu, X.; Huang, W.; Cao, C.; Li, Z.; Pan, Z.; Huang, Y. 2D and 3D Seismic Survey for Sandstone-Type Uranium Deposit and Its Prediction Patterns, Erlian Basin, China. Minerals 2022, 12, 559. [Google Scholar] [CrossRef]
- Jalloh, A.B.; Kyuro, S.; Jalloh, Y.; Barrie, A.K. Integrating artificial neural networks and geostatistics for optimum 3D geological block modeling in mineral reserve estimation: A case study. Int. J. Min. Sci. Technol. 2016, 26, 581–585. [Google Scholar] [CrossRef]
- Qu, H.; Liu, H.; Tan, K.; Zhang, Q. Geological Feature Modeling and Reserve Estimation of Uranium Deposits Based on Multiple Interpolation Methods. Processes 2022, 10, 67. [Google Scholar] [CrossRef]
- Xie, J.; Wang, G.; Sha, Y.; Liu, J.; Wen, B.; Nie, M.; Zhang, S. GIS prospectivity mapping and 3D modeling validation for potential uranium deposit targets in Shangnan district, China. J. Afr. Earth Sci. 2017, 128, 161–175. [Google Scholar] [CrossRef]
- Cao, X.; Liu, Z.; Hu, C.; Song, X.; Quaye, J.A.; Lu, N. Three-Dimensional Geological Modelling in Earth Science Research: An In-Depth Review and Perspective Analysis. Minerals 2024, 14, 686. [Google Scholar] [CrossRef]
- Wang, Y.; Chen, J.; Jia, D. Three-Dimensional Mineral Potential Mapping for Reducing Multiplicity and Uncertainty: Kaerqueka Polymetallic Deposit, QingHai Province, China. Nat. Resour. Res. 2020, 29, 365–393. [Google Scholar] [CrossRef]
- Tan, Y.; Lu, L.; Yang, C.; Zhao, J.; Ding, Y. Uranium-Bearing Layers of Sandstone Type Uranium Deposits Identification and Three-Dimensional Reconstruction in the Northern Ordos Basin, North-Central China. Minerals 2023, 13, 834. [Google Scholar] [CrossRef]
- Xiao, K.; Xiang, J.; Fan, M.; Xu, Y. 3D Mineral Prospectivity Mapping Based on Deep Metallogenic Prediction Theory: A Case Study of the Lala Copper Mine, Sichuan, China. J. Earth Sci. 2021, 32, 348–357. [Google Scholar] [CrossRef]
- Li, Z.Y.; Fang, X.H.; Chen, A.P.; Ou, G.X.; Xiao, X.J.; Sun, Y.; Liu, C.Y.; Wang, Y. Origin of gray-green sandstone in ore bed of sandstone type uranium deposit in north Ordos Basin. Sci. China Ser. D Earth Sci. 2007, 50, 165–173. [Google Scholar] [CrossRef]
- IAEA. World Distribution of Uranium Deposits (UDEPO) with Uranium Deposit Classification; IAEA: Vienna, Austria, 2009. [Google Scholar]
- Cuney, M.; Mercadier, J.; Bonnetti, C. Classification of Sandstone-Related Uranium Deposits. J. Earth Sci. 2022, 33, 236–256. [Google Scholar] [CrossRef]
- Yan, D.; Zhu, R.; Liu, W.; Liu, R.; Shou, H.; Cheng, X.; Cai, Y.; Lei, Z.; Deng, P.; Peng, Y. Metallogenic characteristics and models of sandstone-type uranium deposits in China. Ore Geol. Rev. 2024, 166, 105937. [Google Scholar] [CrossRef]
- Li, G.H.; Yao, J.; Song, Y.M.; Tang, J.Y.; Han, H.D.; Cui, X.D. A Review of the Metallogenic Mechanisms of Sandstone-Type Uranium Deposits in Hydrocarbon-Bearing Basins in China. Eng 2023, 4, 1723–1741. [Google Scholar] [CrossRef]
- Chen, Y.; Miao, P.; Li, J.; Jin, R.; Zhao, H.; Chen, L.; Wang, C.; Yu, H.; Zhang, X. Association of Sandstone-Type Uranium Mineralization in the Northern China with Tectonic Movements and Hydrocarbons. J. Earth Sci. 2022, 33, 289–307. [Google Scholar] [CrossRef]
- Huang, S.; Qin, M.; Liu, Z.; Xiao, J.; Liu, N. Spatiotemporal relationship between hydrocarbon fluid and sandstone-hosted uranium deposits in the Qianjiadian area, Songliao Basin. Geol. J. 2024, 59, 1148–1170. [Google Scholar] [CrossRef]
- Jin, R.; Liu, H.; Li, X. Theoretical System of Sandstone-Type Uranium Deposits in Northern China. J. Earth Sci. 2022, 33, 257–277. [Google Scholar] [CrossRef]
- Liu, Z.Y.; Peng, S.P.; Qin, M.K.; Huang, S.H.; Geng, Y.Y.; He, Z.B. Constraints on Sandstone-Type Uranium Deposits by the Tectonic Uplift and Denudation Process in the Eastern Junggar Basin, Northwest China: Evidence from Apatite Fission Track and Detrital Zircon U-Pb Ages. Minerals 2022, 12, 905. [Google Scholar] [CrossRef]
- Nie, F.; Yan, Z.; Feng, Z.; Li, M.; Xia, F.; Zhang, C.; Wang, Y.; Yang, J.; Kang, S.; Shen, K. Genetic models and exploration implication of the paleochannel sandstone-type uranium deposits in the Erlian Basin, North China—A review and comparative study. Ore Geol. Rev. 2020, 127, 103821. [Google Scholar] [CrossRef]
- Qin, M.K.; Huang, S.H.; He, Z.B.; Xu, Q.; Song, J.Y.; Liu, Z.Y.; Guo, Q. Evolution of Tectonic Uplift, Hydrocarbon Migration, and Uranium Mineralization in the NW Junggar Basin: An Apatite Fission-Track Thermochronology Study. Acta Geol. Sin. (Engl. Ed.) 2018, 92, 1901–1916. [Google Scholar] [CrossRef]
- Zhang, C. Episodic sandstone-type uranium mineralization in Asia during the Late Mesozoic-Cenozoic. Sci. China Earth Sci. 2023, 66, 2034–2044. [Google Scholar] [CrossRef]
- Zhang, L.; Liu, C.; Zhang, S.; Fayek, M.; Lei, K.; Quan, X. Unconformity-controlled bleaching of Jurassic-Triassic sandstones in the Ordos Basin, China. J. Pet. Sci. Eng. 2022, 211, 110154. [Google Scholar] [CrossRef]
- Zhang, F.; Jiao, Y.; Wu, L.; Rong, H. Roles of dispersed organic matters in sandstone-type uranium mineralization: A review of geological and geochemical processes. Ore Geol. Rev. 2021, 139, 104485. [Google Scholar] [CrossRef]
- Han, X.; Wu, Z.; Ji, H.; Jiang, Z.; Guo, Y.; Lin, Z.; Hu, H.; Yin, D. Constraints of tectonic uplift and denudation on sandstone-type uranium mineralization in Meso-Cenozoic basins in northern China: A review. Ore Geol. Rev. 2021, 139, 104528. [Google Scholar] [CrossRef]
- Zhang, P.; Li, F.; Liu, Y.; Liu, Z.; Peng, N.; Ma, X.; Liu, B.; Ogg, J.G. Mesozoic-Cenozoic exhumation history and its implications for the uranium mineralization in the southern Junggar Basin, North China. Ore Geol. Rev. 2022, 144, 104784. [Google Scholar] [CrossRef]
- Hu, X.; Yang, X.; Wu, Z.; Ren, Y.; Miao, P. Sedimentological, petrological, and geochemical constraints on the formation of the Beisantai sandstone-type uranium deposit, Junggar Basin, NW China. Ore Geol. Rev. 2022, 141, 104668. [Google Scholar] [CrossRef]
- Chen, Y.; Jin, R.; Miao, P.; Li, J.; Guo, H.; Chen, L. Occurrence of pyrites in sandstone-type uranium deposits: Relationships with uranium mineralization in the North Ordos Basin, China. Ore Geol. Rev. 2019, 109, 426–447. [Google Scholar] [CrossRef]
- Zhang, B.; Wang, X.; Zhou, J.; Han, Z.; Liu, W.; Liu, Q.; Wang, W.; Li, R.; Zhang, B.; Dou, B. Regional geochemical survey of concealed sandstone-type uranium deposits using fine-grained soil and groundwater in the Erlian basin, north-east China. J. Geochem. Explor. 2020, 216, 106573. [Google Scholar] [CrossRef]
- Jia, J.; Miao, C.; Xie, W.; Wu, Y. Multi-scale sedimentary facies controls on fluvial sandstone-type uranium accumulation process in the Songliao Basin, NE China. Ore Geol. Rev. 2023, 161, 105673. [Google Scholar] [CrossRef]
- Jin, R.; Yu, R.A.; Miao, P. Geological Background of Sandstone-Type Uranium Deposits in Ordos Basin, Northwest China; Springer Nature: Singapore, 2023. [Google Scholar]
- Cai, Y.Q.; Han, M.Z.; Zhang, C.; Yi, C.; Li, X.C.; Zhang, Y.; Wang, G.; Li, H.M. Geological and Geochemical Characteristics of the Zhiluo Formation in the Bayinqinggeli Uranium Deposit, Northern Ordos Basin: Significance for Uranium Mineralization. Acta Geol. Sin. (Beijing) 2021, 95, 2075–2086. [Google Scholar] [CrossRef]
- Zhang, Z.L.; He, F.; Yi, L.S.; Fan, H.H.; Cai, Y.Q.; Liu, H.X.; Liu, X.Y.; Chen, H.B.; Jia, C.; Yang, M.J. Characteristics of Uranium Mineralization in Red Clastic Formations in the Southwestern Margin of the Ordos Basin. Acta Geol. Sin. (Beijing) 2020, 94, 1471–1487. [Google Scholar] [CrossRef]
- Cheng, Y.H.; Wang, S.Y.; Jin, R.S.; Li, J.G.; Ao, C.; Teng, X.M. Global Miocene tectonics and regional sandstone-style uranium mineralization. Ore Geol. Rev. 2019, 106, 238–250. [Google Scholar] [CrossRef]
- de Veslud, C.L.C.; Cuney, M.; Lorilleux, G.; Royer, J.; Jébrak, M. 3D modeling of uranium-bearing solution-collapse breccias in Proterozoic sandstones (Athabasca Basin, Canada)—Metallogenic interpretations. Comput. Geosci. 2009, 35, 92–107. [Google Scholar] [CrossRef]
- Guo, F.S.; Yang, H.Y.; Hou, Z.Q.; Wu, Z.C.; Lin, Z.Y.; Wang, G.C.; Xue, L.F.; Guan, Y.; Zhou, W.P. Structural setting of the Zoujiashan-Julong’an region, Xiangshan volcanic basin, China, interpreted from modern CSAMT data. Ore Geol. Rev. 2022, 150, 105180. [Google Scholar]
- Yang, L.R. Research on 3D Modeling of Complex Orebody Structure and Reserve Calculation with Uranium Deposits as an Example. Ph.D. Thesis, Chengdu University of Technology, Chengdu, China, 2013. [Google Scholar]
- Huang, S.H.; Qin, M.K.; Liu, Z.Y.; He, Z.B.; Geng, Y.Y. Litho-mineralogy, geochemistry, and chronology for the genesis of the Kamust sandstone-hosted uranium deposit, Junggar Basin, NW China. Geol. J. 2022, 57, 1530–1551. [Google Scholar] [CrossRef]
- Tang, X.F.; Wang, G.; Zhang, Z.F.; Li, Y.L.; Wu, S.M.; Li, C.L. A Study on Uranium Metallogenic Model of Jurassic in Kamust Region, Junggar Basin. Geol. Rev. 2018, 64, 647–657, (In Chinese with English Abstract). [Google Scholar]
- He, Z.B.; Qin, M.K.; Song, J.Y.; Guo, Q.; Xu, Q.; Liu, Z.Y.; Yang, Y.; Huang, S.H. A Study of Metallogenic Environments and Prospecting Direction of Jurassic Sandstone-Type Uranium Deposit in Northeastern Junggar Basin. Miner. Depos. 2018, 37, 175–190, (In Chinese with English Abstract). [Google Scholar]
- Qin, M.K.; He, Z.B.; Liu, Z.Y.; Guo, Q.; Song, J.Y.; Xu, Q. Study on Metallogenic Environments and Prospective Direction of Sandstone Type Uranium Deposits in Junggar Basin. Geol. Rev. 2017, 63, 1255–1269, (In Chinese with English Abstract). [Google Scholar]
- Sun, X.; Wang, G.R.; Wang, G.; Lu, K.G. Middle Jurassic-Oligocene Paleoclimate Environment and its Influence on Mineralization of Sandstone-Type Uranium Deposit in Kamuster Area, Eastern of the Junggar Basin. Xinjiang Geol. 2019, 37, 242–246, (In Chinese with English Abstract). [Google Scholar]
- Song, J.Y.; Qin, M.K.; Cai, Y.Q.; Guo, Q.; He, Z.B.; Liu, Z.Y.; Cao, X.; Chen, Z.G. Uplift-Denudation of Orogenic Belts Control on the Formation of Sandstone Type Uranium (U) Deposits in Eastern Junggar, Northwest China: Implications from Apatite Fission Track (AFT). Earth Sci. 2019, 44, 3910–3925, (In Chinese with English Abstract). [Google Scholar]
- Feng, Y.; Coleman, R.G.; Tilton, G.; Xiao, X. Tectonic evolution of the West Junggar Region, Xinjiang, China. Tectonics 1989, 8, 729–752. [Google Scholar] [CrossRef]
- Li, D.; He, D.; Santosh, M.; Ma, D.; Tang, J. Tectonic framework of the northern Junggar Basin part I: The eastern Luliang Uplift and its link with the East Junggar terrane. Gondwana Res. 2015, 27, 1089–1109. [Google Scholar] [CrossRef]
- Bian, W.; Hornung, J.; Liu, Z.; Wang, P.; Hinderer, M. Sedimentary and palaeoenvironmental evolution of the Junggar Basin, Xinjiang, Northwest China. Palaeobiodivers. Palaeoenviron. 2010, 90, 175–186. [Google Scholar] [CrossRef]
- Zhou, X.H.; Xu, S.C. The Basement Features Research of Junggar Basin, China: A Review. Appl. Mech. Mater. 2013, 295–298, 2740–2743. [Google Scholar] [CrossRef]
- Geng, Y.Y.; Liu, Z.Y.; Huang, S.H.; He, Z.B. Geochronology and Geochemistry of the Kalamaili Granitic Rocks and Uranium Ore-forming Potential at the Northeastern Margin of Junggar Basin, China. J. Earth Sci. Environ. 2022, 44, 20–41, (In Chinese with English Abstract). [Google Scholar]
- Du, J.; Tang, X.F. Controlling Factors and Prospecting Direction for Uranium Metallization in Middle Jurassic at Kamusite Area in Xinjiang. Uranium Geol. 2017, 33, 129–136, (In Chinese with English Abstract). [Google Scholar]
- Dong, M.; Shen, N.Q.; Hu, H.; Liu, F. 3D Geological Modeling Method Based on GOCAD. J. Guilin Univ. Technol. 2008, 28, 188–192, (In Chinese with English Abstract). [Google Scholar]
- Li, C.; Wu, Z.C.; Yang, Y.; Hua, C. Modeling Method and Case Study of Drillhole Data Based on GOCAD. Jiangxi Sci. 2019, 37, 125–130, 135, (In Chinese with English Abstract). [Google Scholar]
- Chen, J.P.; Yu, P.P.; Shi, R.; Yu, M.; Zhang, S.C. Research on three-dimensional quantitative prediction and evaluation methods of regional concealed ore bodies. Earth Sci. Front. 2014, 21, 211–220, (In Chinese with English Abstract). [Google Scholar]
- He, Z.L.; Zhu, P.F.; Ma, H.; Wang, W.J.; Bai, Y.; Cao, K. 3D Geological Modeling of the Xiangshan Volcanic Basin Based on Multi-Source Data Fusion. Geol. Explor. 2018, 54, 404–414, (In Chinese with English Abstract). [Google Scholar]
- Agterberg, F.P. Computer Programs for Mineral Exploration. Science 1989, 245, 76–81. [Google Scholar] [CrossRef]


Disclaimer/Publisher’s Note: The statements, opinions and data contained in all publications are solely those of the individual author(s) and contributor(s) and not of MDPI and/or the editor(s). MDPI and/or the editor(s) disclaim responsibility for any injury to people or property resulting from any ideas, methods, instructions or products referred to in the content. |
© 2024 by the authors. Licensee MDPI, Basel, Switzerland. This article is an open access article distributed under the terms and conditions of the Creative Commons Attribution (CC BY) license (https://creativecommons.org/licenses/by/4.0/).