Article

Effect of Rate-Dependent Breakage on Strength and Deformation of Granular Sample—A DEM Study

by
Soukat Kumar Das
1,* and
Hossam Abuel-Naga
2
1
Department of Civil Engineering, National Institute of Technology Rourkela, Rourkela 769008, India
2
Department of Engineering, La Trobe University, Melbourne, VIC 3086, Australia
*
Author to whom correspondence should be addressed.
Minerals 2024, 14(11), 1102; https://doi.org/10.3390/min14111102
Submission received: 19 September 2024 / Revised: 22 October 2024 / Accepted: 27 October 2024 / Published: 29 October 2024
(This article belongs to the Section Mineral Processing and Extractive Metallurgy)

Abstract

:
The mechanical response of granular materials is influenced significantly by both the magnitude and strain rate. While traditionally considered rate-independent in the quasi-static regime, granular media can exhibit rate effects in certain instances. This research uses two-dimensional discrete element modelling (DEM) to investigate the rate effects in one-dimensional compression tests by comparing non-crushable with crushable granular samples. This study indicates that micromechanical properties such as particle breakage and contact force distributions are predominant factors in dictating the macroscopic responses of the material. The DEM simulations highlight differences in macroscopic changes between crushable and non-crushable samples, demonstrating a clear correlation between mechanical properties and underlying microstructural features. Notably, the distribution of contact forces varies with strain rates, influencing the degree of particle breakage and, consequently, the overall rate-dependent behaviour. Further, this study explores the impact of post-breakage contact creation and progressive force redistribution, which contributes to observable differences in macroscopic stress under varying loading rates, which is quantified using coordination number, particle velocity, and fabric tensor profiles at two loading rates.

1. Introduction

The response of materials to loading is affected by both the magnitude and the rate at which the strain is applied. Specifically, the “rate” or “strain rate” mentioned in this study refers to the strain rate at which the uniaxial compression tests are conducted in our DEM simulations in a strain-controlled environment. Granular media, traditionally regarded as rate-independent within the quasi-static regime, can exhibit significant rate-dependent behaviours depending on various grain-scale properties, including its shape [1], size [2], mineralogy [3], etc. Recent studies have confirmed that the applied not only dictates the drained [4,5] and undrained [6,7] behaviour of granular media but also alters the critical state of the granular media [8,9], which plays a crucial in many engineering applications. The issue becomes even more complicated for granular media, which has the unique feature of being discrete at the grain-scale level, whereas it behaves like a continuum at the macroscopic level [10]. This phenomenon is critically vital across various domains, such as mining [11], high-speed transportation systems [12], marine environment [13], and slope stability [14], where materials’ mechanical integrity and stability are crucial under static/dynamic loading conditions. The size distribution of granular materials plays a pivotal role in the mineral extraction industry, where advanced techniques such as laser diffraction, X-ray diffraction (XRD), scanning electron microscopy (SEM), etc., are used to accurately characterize the particle size distribution of granular materials for mineral processing [15,16,17].
One significant issue affecting granular material performance is the breakage of particles [17,18,19]. It has profound implications in the mineral industry as it is useful for understanding the fragmentation behaviour during breakage or grinding of extracted mineral ores, helping to optimize equipment performance and reduce energy consumption during comminution [17,20,21]. Knowing the breakage of granular materials is also crucial in marine geosciences, as the offshore sea beds consist of a significant amount of granular material affecting seabed properties [22], crucial for geological and engineering applications [23]. Changes in sediment size and shape due to particle breakage can affect slope stability [14], elevating landslide risks under dynamic conditions affected by breakage-induced pore water pressure development [24,25]. This phenomenon also contributes to sediment compaction in deep-sea environments [26,27], impacting basin subsidence and the integrity of subsea infrastructure [28]. Furthermore, alterations in permeability caused by particle breakage can induce overpressure, challenging subsurface drilling operations and affecting fluid storage [29]. The shape, size, and surface chemistry of granular materials play a key role in determining how particles interact with reagents and air bubbles, affecting the efficiency of mineral recovery [30,31] in the floatation process. Understanding these effects is essential for optimum mineral extraction, designing resilient offshore structures, and optimising energy extraction and storage strategies [32]. When particles crush, their morphological characteristics, including size, shape, and surface texture, undergo notable changes affecting inter-particle friction, packing, and overall mechanical interlocking within the material [33,34].
Recent studies have confirmed that particle breakage depends on the applied strain rate [35,36]. The rate and breakage effects are not separate but coupled phenomena [4,37,38]. Researchers [39] have confirmed that the rate effects in granular media predominantly arise from grain fragmentation, especially under enhanced confinement pressures where the potential of breakage is higher even at the quasi-static regime where no inertial effect is present. It is observed that stress waves propagate through the matrix of grains when loading is applied. Once a particle crushes, it tends to reorganise and reorient at the grain-scale level to achieve a new equilibrium, often called post-breakage redistribution [40]. This complex microscale interplay between the propagation of stress waves and post-breakage grain realignment results in the observed macroscopic rate-dependent behaviour of crushable granular materials. The breakage of granular samples is also crucial in mineral processing as granular media such as ores are subjected to breakage and grinding processes to reduce particle size and facilitate the extraction of valuable minerals. Understanding the micromechanical behaviour of granular materials during these processes is critical for optimizing energy use and equipment design in comminution circuits [41,42].
In the study of crushable granular materials, understanding the influence of mineralogical composition is also crucial. The mineralogy of the particles significantly affects their crushing behaviour, which in turn impacts the overall mechanical properties of the granular assembly. For instance, carbonate-based sands, like those often found in coral or marine environments, are generally more prone to crushing due to their lower grain strength and internal porosity [43,44]. These materials exhibit enhanced rate-dependent breakage compared to their silica-based counterparts, such as quartz sand, which are inherently stronger and less porous [45,46,47]. The presence of internal pores not only facilitates crushing but also affects the liquefaction potential of the media, where the release of fluid from these pores during crushing can lead to increased pore water pressure and subsequent loss of effective stress. This complex interplay between mineralogical properties and mechanical behaviour underscores the need to consider these factors in depth when studying granular media.
Understanding these microscale phenomena during breakage is difficult through conventional geotechnical experiments. The emergence of advanced technologies has enabled the use of X-ray and CT scans as non-invasive tools to explore the complexities of grain breakage and observe the subtle processes involved in fragmentation [48,49]. However, even with their advanced capabilities, these techniques face particular challenges. Critical micromechanical parameters are often not captured through these tests, which is essential for a comprehensive understanding of particle breakage and its rate dependency, and hence, the use of the Discrete Element Method (DEM) has evolved to bridge the micro–macro-mechanical gap. DEM is extensively used in the optimisation of comminution in the mineral industry [50,51]. Advanced DEM simulations allow for researchers to observe particle-level behaviours such as sliding, rolling, and breakage [52]. Recent studies have confirmed that the evolution of coordination number [53,54] and fabric tensor [39,40] are critical to understanding the small and large strain problems with granular media. However, none of the studies have explicitly focused on their evolution during rate-dependent breakage subjected to oedometric compression. This research intends to fill this gap by examining the micromechanical interactions between the rate aspects and the breakage of particles. By investigating microscopic factors, including the contact force network, the coordination numbers, particle velocity profile, and fabric tensor, this study aims to analyse the macroscopic rate-dependent properties of crushable granular materials.

2. Numerical Modelling

2.1. DEM Working Methodology

The Discrete Element Method (DEM) is a specialised computational technique used to simulate granular systems’ behaviours, as depicted in Figure 1. Figure 1a outlines the DEM algorithm, and Figure 1b details the contact law used in this study. Unlike continuum methods that treat materials as continuous media, DEM treats them as assemblies of discrete elements or particles. These particles are considered rigid and can overlap at contact points, with their movements governed by Newton’s second law. In DEM, the algorithm identifies potential contacts between particles within a critical time step, focusing only on particles that may interact. Contact forces arise when particles interact, including normal contact, friction (typically Coulomb sliding friction), and damping to simulate energy loss during collisions. In this study, the focus is on unbonded granular samples, ignoring cohesive forces. The forces determined (both external and internal body forces) lead to calculations of particle motions using Newton’s second law, where acceleration is integrated to compute velocities (angular and translational) and positions (Cartesian and rotations) at specific time steps.

2.2. Modelling Scheme

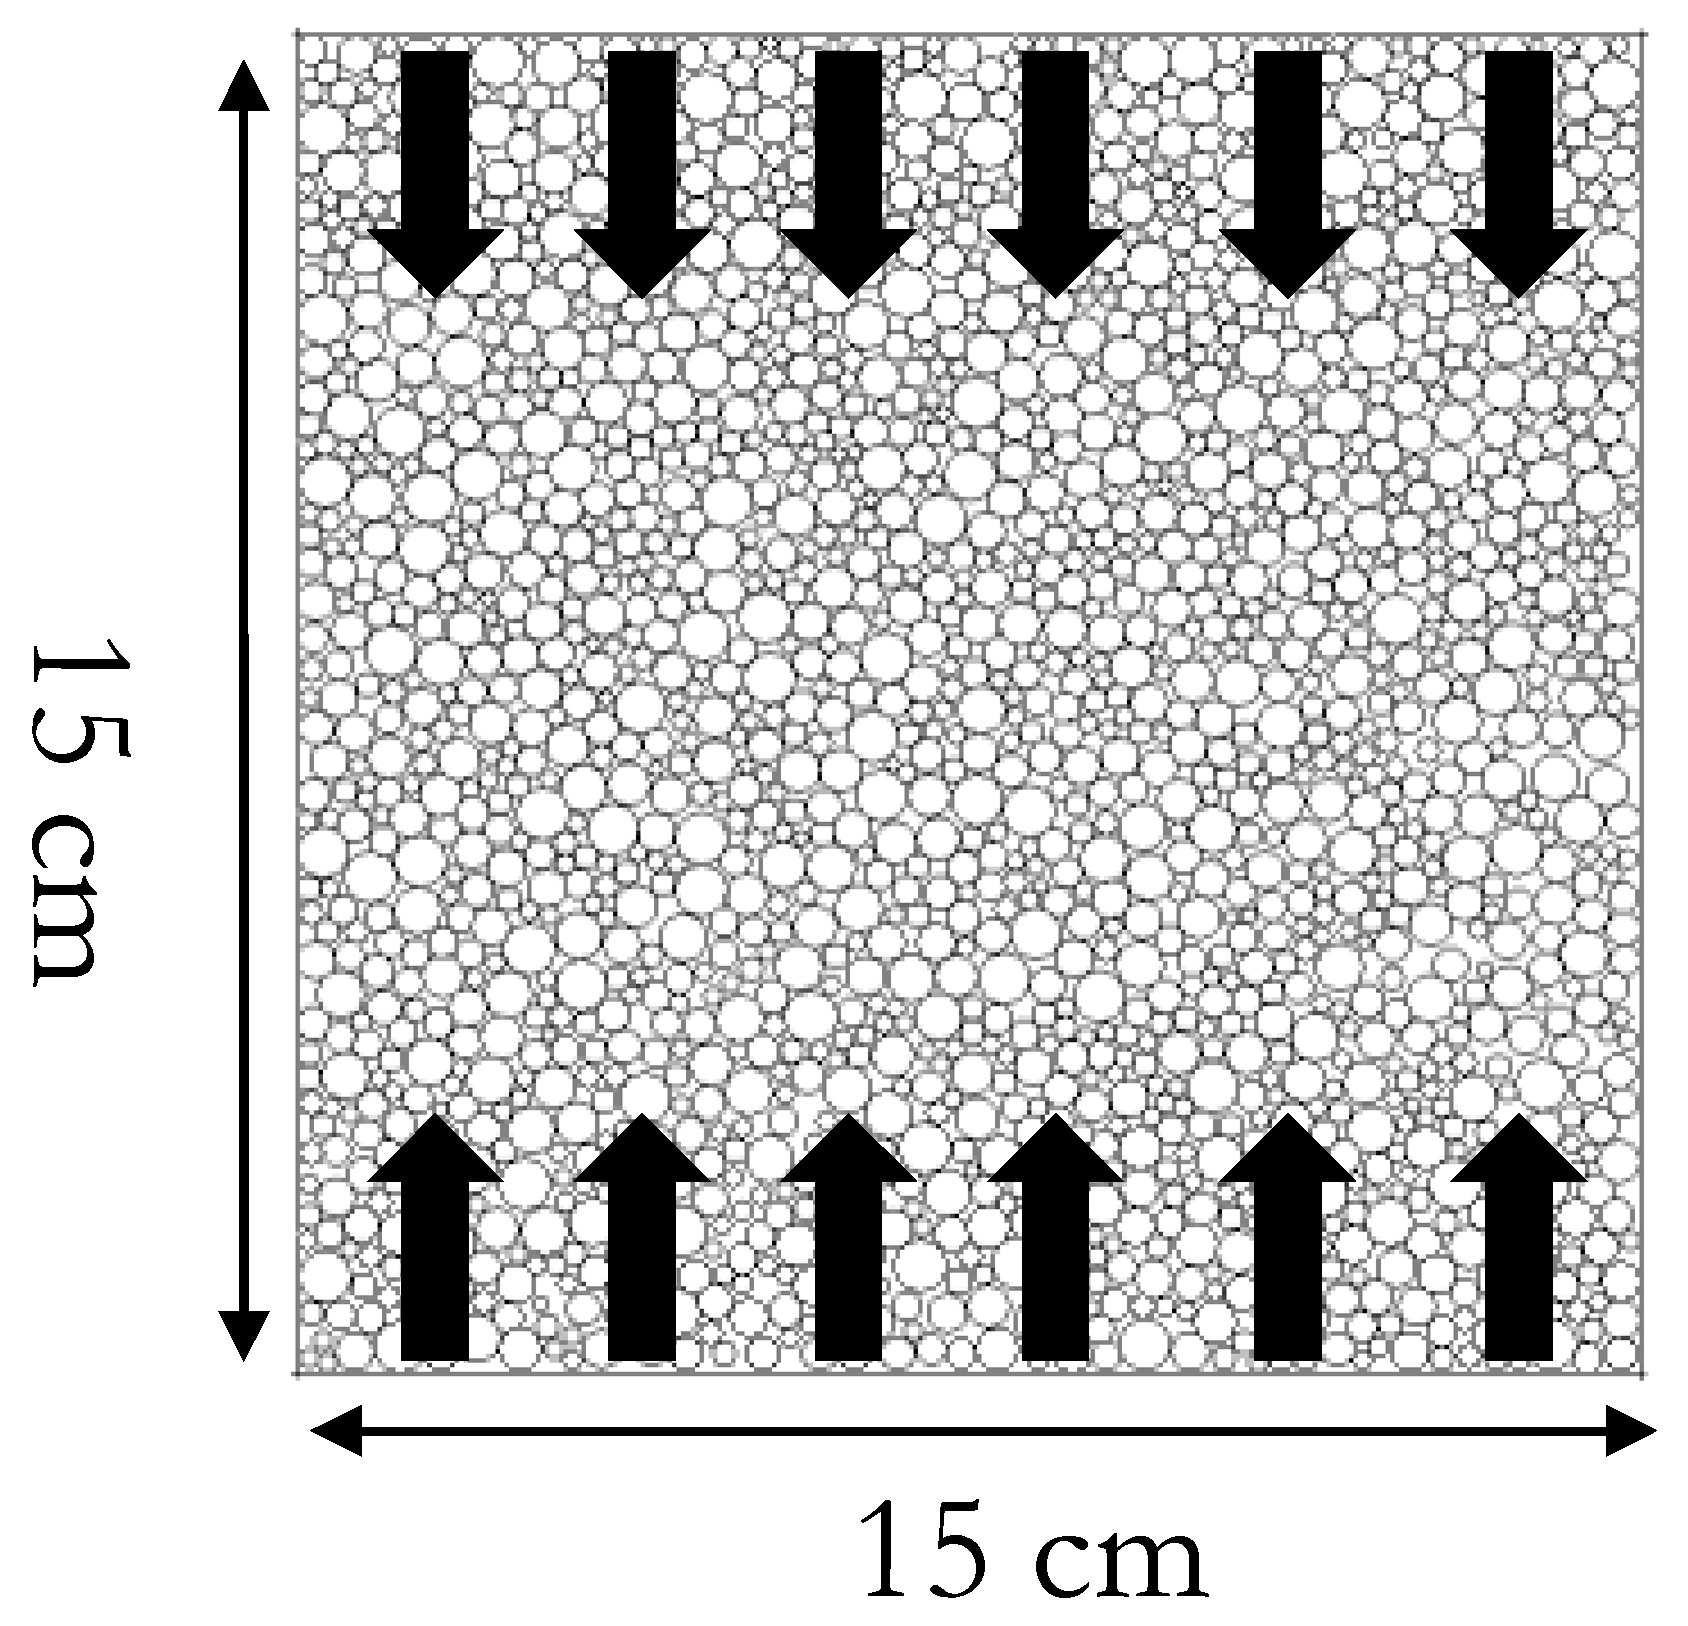
In the present study, a granular sample within a square boundary (0.15 m × 0.15 m) is compressed uniaxially (oedometric compression) using commercially available 2D DEM software named PFC [55], as shown in Figure 2. For simplicity, only disk-shaped particles with diameters ranging between 1 mm to 3 mm are generated with porosity of 20% without any shape effect. Particles follow uniform gsds as it is more susceptible to breakage due to a decreased cushioning effect [56]. After setting a friction value of 0.5, the system is first stabilised without any external loads to eliminate any unbalanced forces due to overlap to attain the applied porosity and grain size distribution. Compression is applied by vertical movement of the bottom and top walls at a velocity corresponding to the given strain rate, while lateral wall movements are restricted to ensure unidirectional compression. Notably, rigid boundaries can introduce stress anisotropy between the specimen’s central region and edges. To avoid such boundary effects, the specimen and particle sizes are chosen to ensure a scale ratio (ratio of specimen side to d50) of at least 25 for all tests [57]. The present study uses the linear spring dashpot model to simulate the particle–particle contact for simplicity and fast convergence.
Two distinct monotonic strain rate conditions are employed to compress the granular assembly by adjusting the top and bottom boundaries of the container at velocities of 0.015 m/s and 1.5 m/s, which translate to strain rates of 0.2/s and 20/s, corresponding to low and high strain rates, respectively, which differ by a factor of 100. The strain rates are selected within the quasi-static domain, ensuring minimal inertial effects. This is verified by the inertial number (I), which is defined as the ratio of the microscopic grain translation time to the macroscopic time due to the system’s shearing. The strain rates are chosen such that the inertial numbers always stay within the quasi-static limit (<1) for both cases [58,59]. More details of the modelling scheme is elaborated in the paper by Das and Das (2019) [60] on which this work is based.

2.3. Model Properties

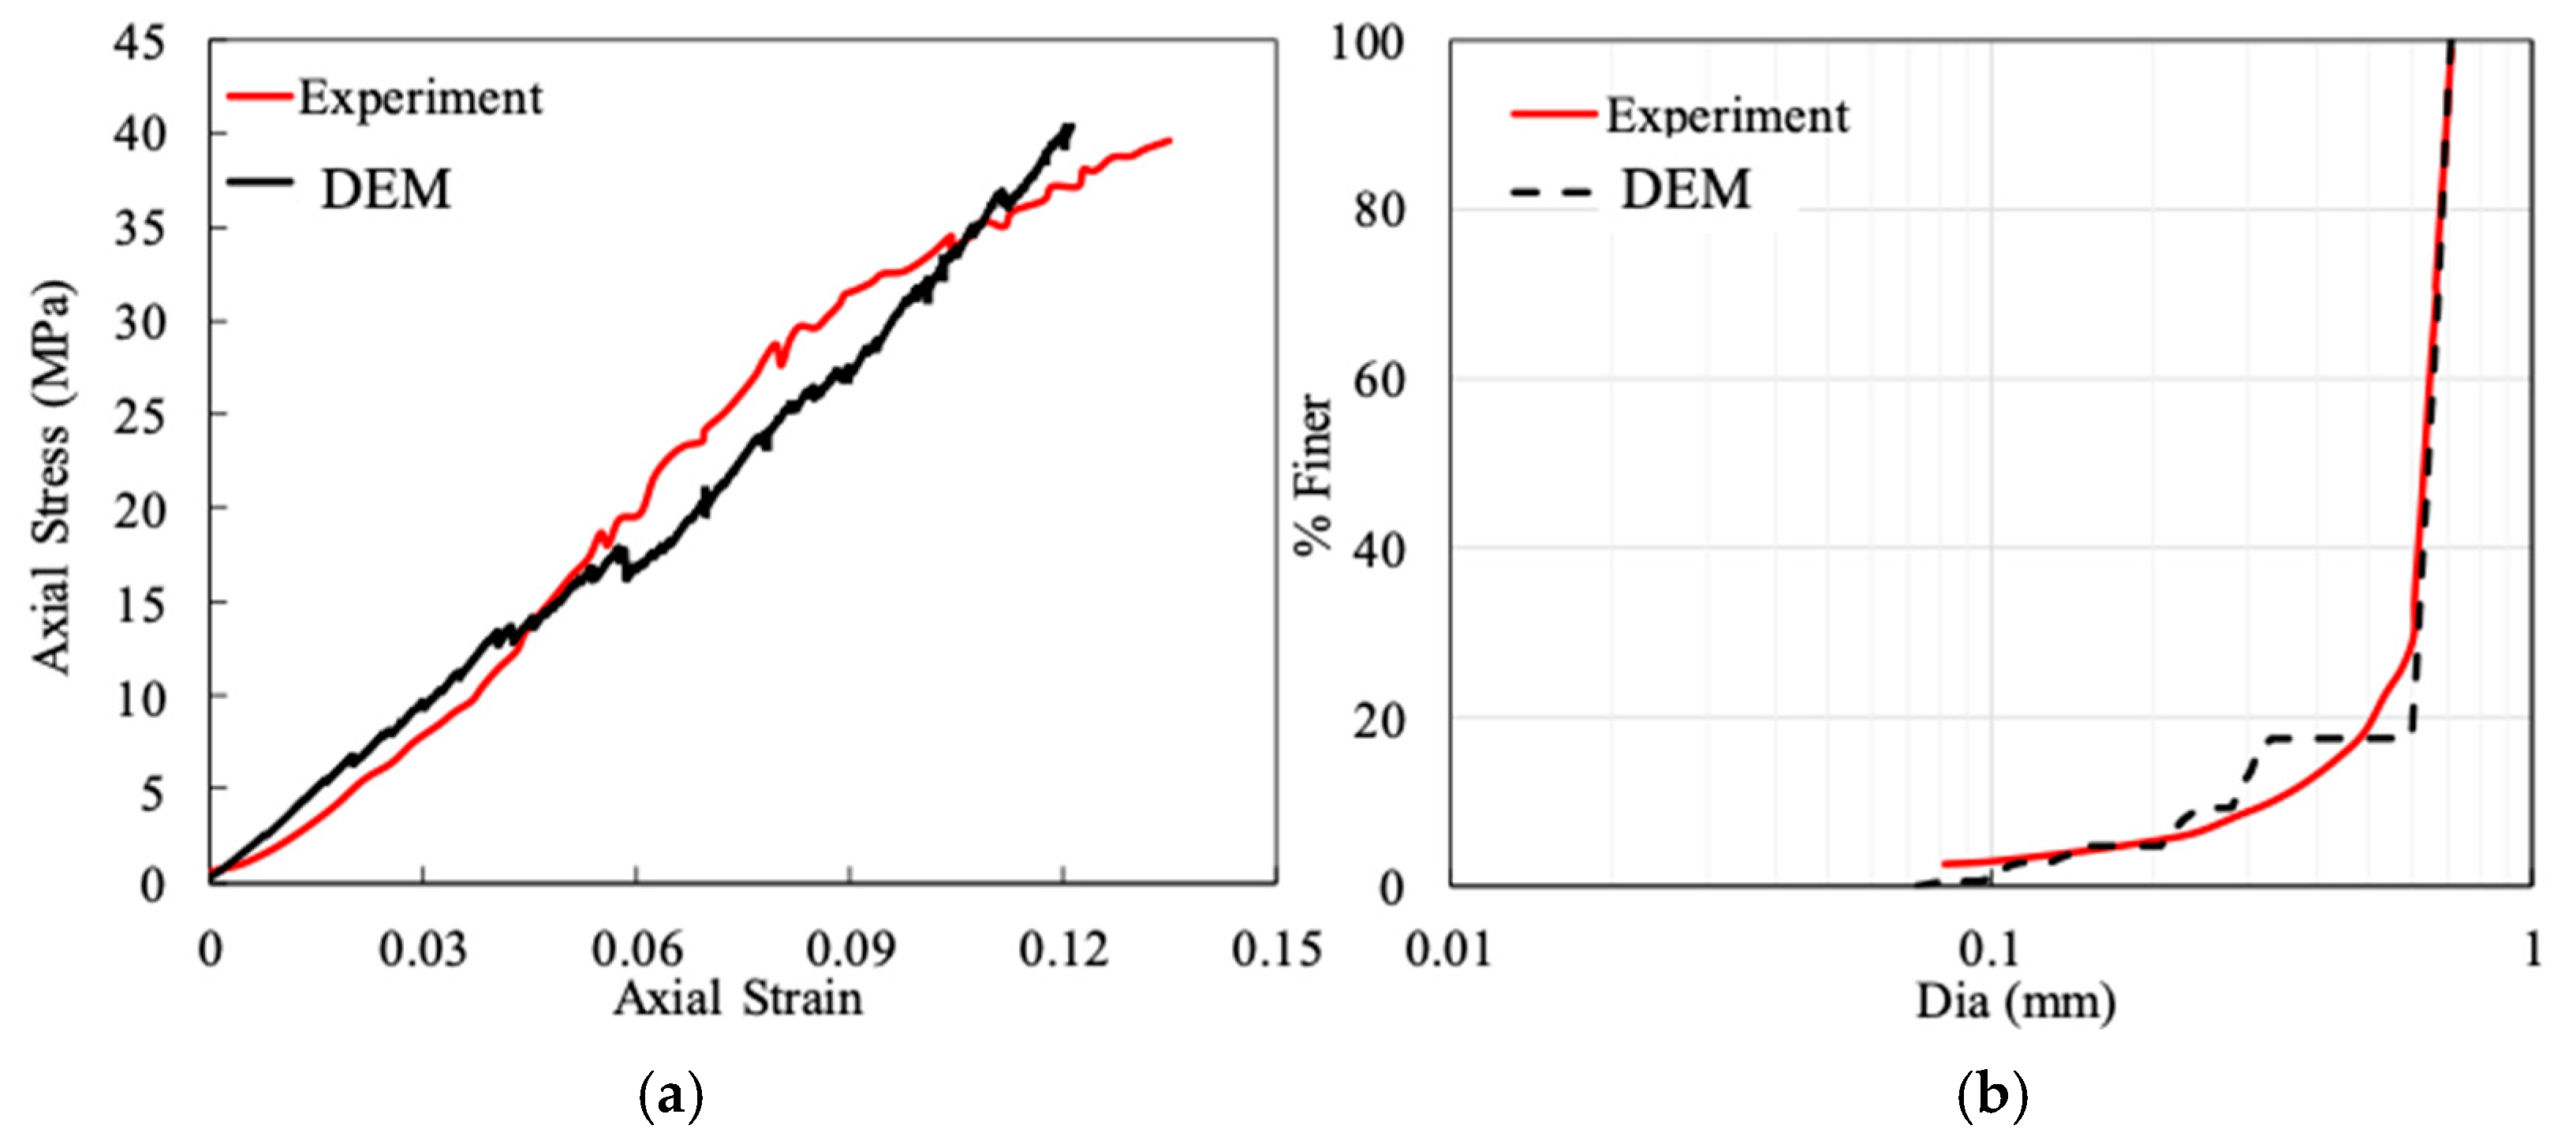
In the present study, the DEM sample input parameters are first calibrated by comparing its response with an experimental 1D compression study by Zheng and Tannant (2018) [61] on Jordan Formation frac sand, as experimental results are not part of the current study. The simulated DEM sample is able to predict the axial stress–strain response with a good match for the selected input parameters (Figure 3a). The grain size distributions are also well predicted for the chosen grain size, as mentioned in the reference paper (Figure 3b). This research primarily compares two granular samples, crushable granular and non-crushable granular material, to evaluate the collective effect of breakage. Crushable samples are those samples where each particle can crush into three smaller fragments based on the adopted breakage criterion (more details given in Section 2.4) and non-crushable samples are those which are assigned higher material strength so that the particles do not break during loading (see Table 1). The input parameters, provided in Table 1, determined through calibration, aim to ensure that both macro- and microscopic responses from the granular sample reflect the behaviour seen in realistic experimental granular samples.

2.4. Breakage Methodology

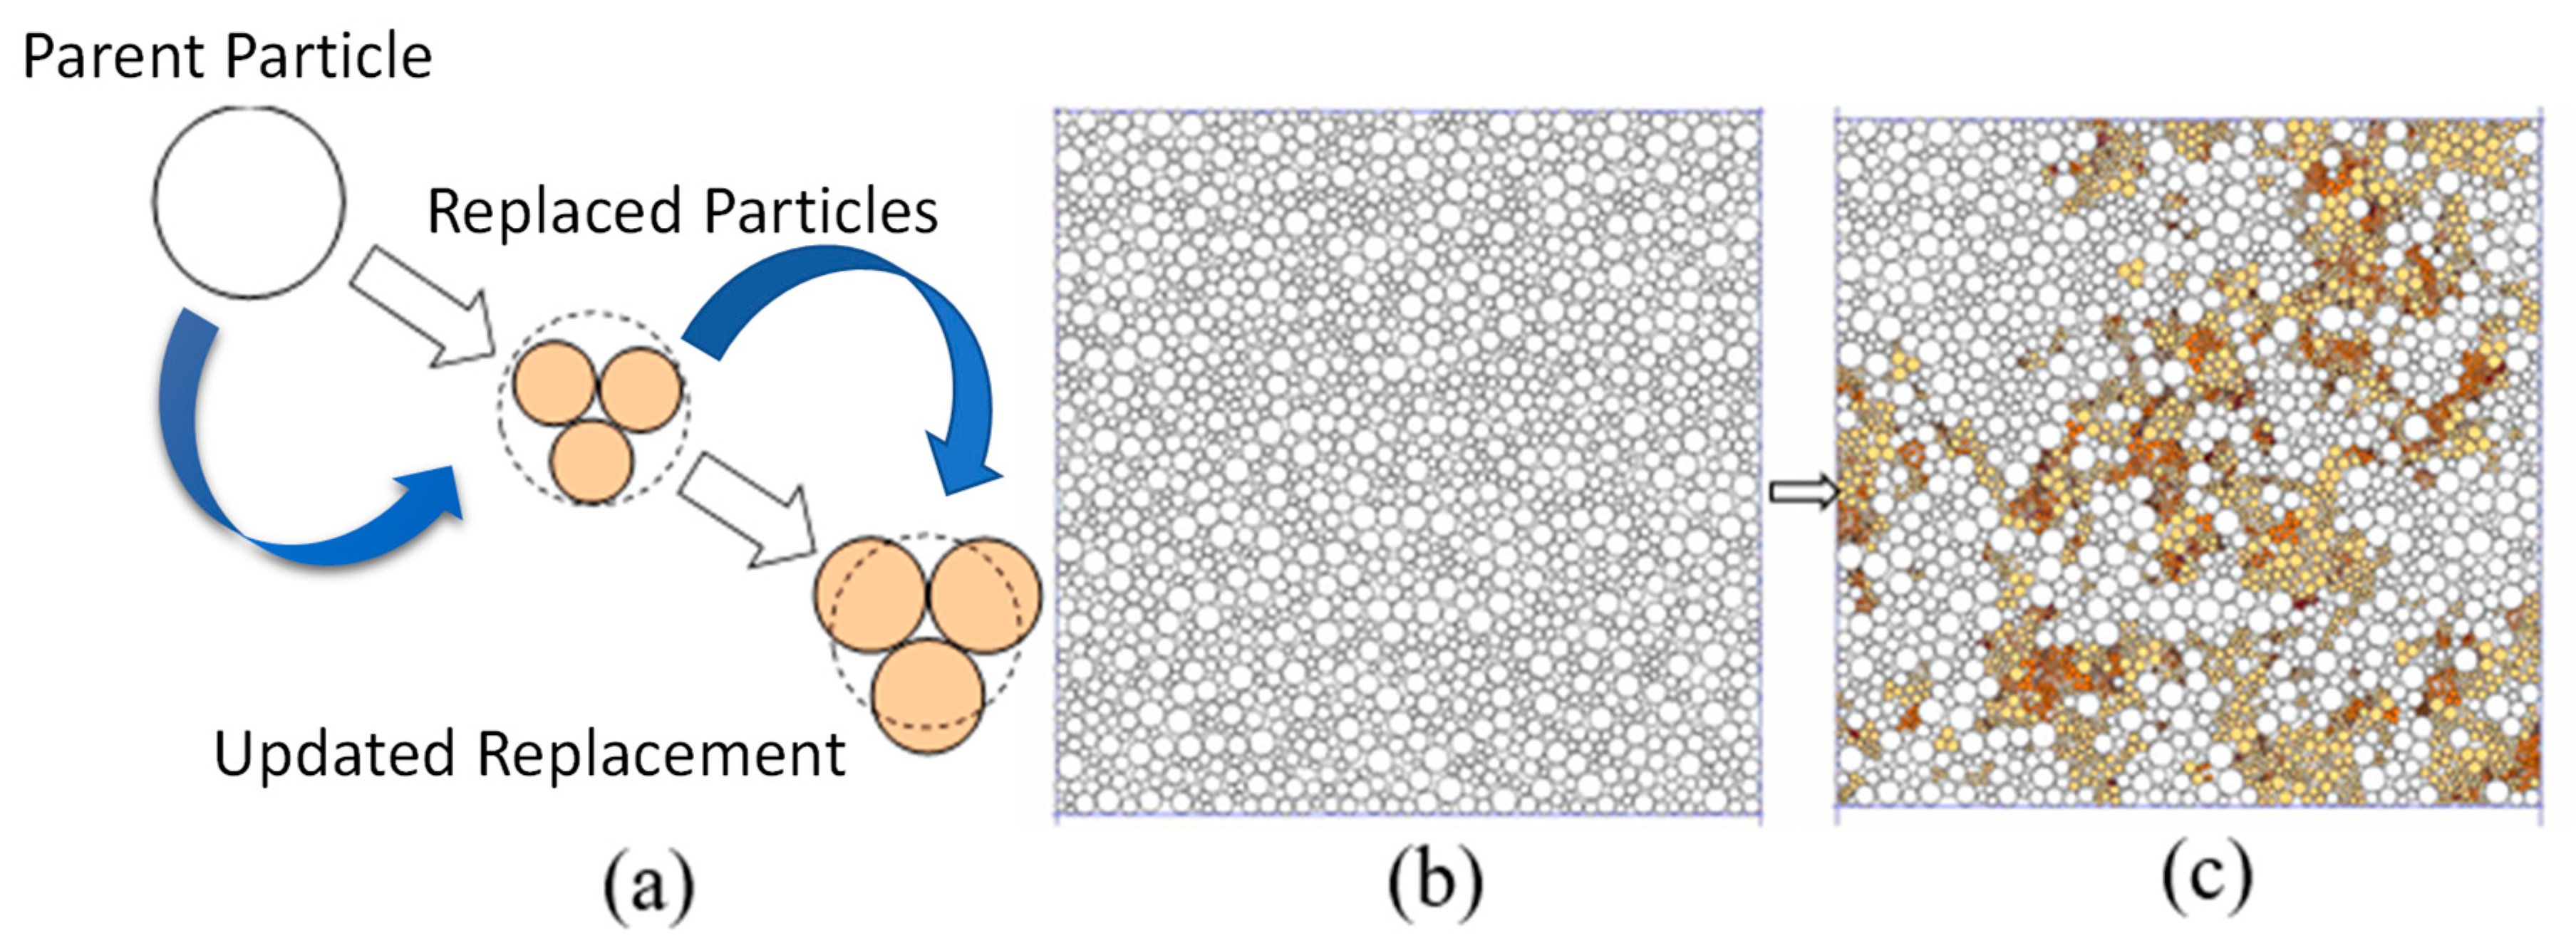
The simulation of particle breakage is the pivotal aspect of the present study. In DEM simulations, three principal approaches are employed to model particle crushing: the replacement method, the agglomerate method, and hybrid methods. The replacement method involves substituting the original particle with smaller ones that mimic the original’s volume, using predefined shapes and sizes dictated by criteria such as critical stress or energy to simulate crushing [56,62,63,64]. The agglomerate method, on the other hand, constructs the original particle as a cluster of smaller, bonded particles. These bonds break progressively under stress until the particle disintegrates, making this method computationally demanding due to the high initial particle count needed for accurate representation. This technique hinges on the strength of inter-particle bonds, whereas the replacement approach applies a force/stress threshold based on particle size and contact conditions, considering factors like intra- and inter-particle porosity [65,66]. Hybrid models often combine the Finite Element Method (FEM) and Discrete Element Method (DEM), where DEM handles the contact stresses and FEM evaluates internal stresses within particles [64,67,68]. A novel hybrid method is the peridynamics-based approach, which treats materials as discrete particles linked by bonds, not as a continuum [69,70,71], facilitating the simulation of crack formation, propagation, and the overall crushing and fragmentation of particles. This method models the material as particles of finite size, enhancing the representation of physical processes. This research adopts the updated replacement method as demonstrated by Ben-Nun et al. (2010) [72]. Since the other methods require many particles at the beginning, it was not computationally feasible for the present study. In the updated replacement method, a threshold force is deduced based on a predefined breakage criterion and checked with the acting normal force calculated from the contact points at any given moment. The prescribed breakage criterion considers the effect of internal flaws, cushioning effect, curvature, and size [73]. If the average normal force acting on a particle surpasses this critical breakage threshold, that particle is removed and replaced by three smaller particles following an apollonian distribution (as seen in Figure 4a). The volume (here, area in 2D scenarios) of the fragmented particles is optimally expanded over a few iterations (100 cycles in the present study) to match the original volume of the initial parent particle, ensuring mass conservation and avoid any unwanted contact forces. Every new generation of the particles is assigned different colours, i.e., if a fragment breaks further, its colour is changed. The breakage criterion is modified based on the Brazilian criterion, where the critical average normal force ( F c r ) on each particle is calculated based on several grain-scale factors such as coordination number ( f C o o r d ), curvature ( f C u r v ), size (d), survival probability ( f P r o b ), and tensile stress factor ( σ f M ) and is given as
F c r = d σ f M f P r o b f C u r v f C o o r d
Figure 4b,c offer a visual representation of an initial sample and its crushed counterpart at the end of analyses, respectively, subjected to the low rate of compression. Please note that in the current study, all newly generated particles are assigned the same material properties as the parent particle except for size.

3. Results and Discussions

3.1. Stress–Strain Response

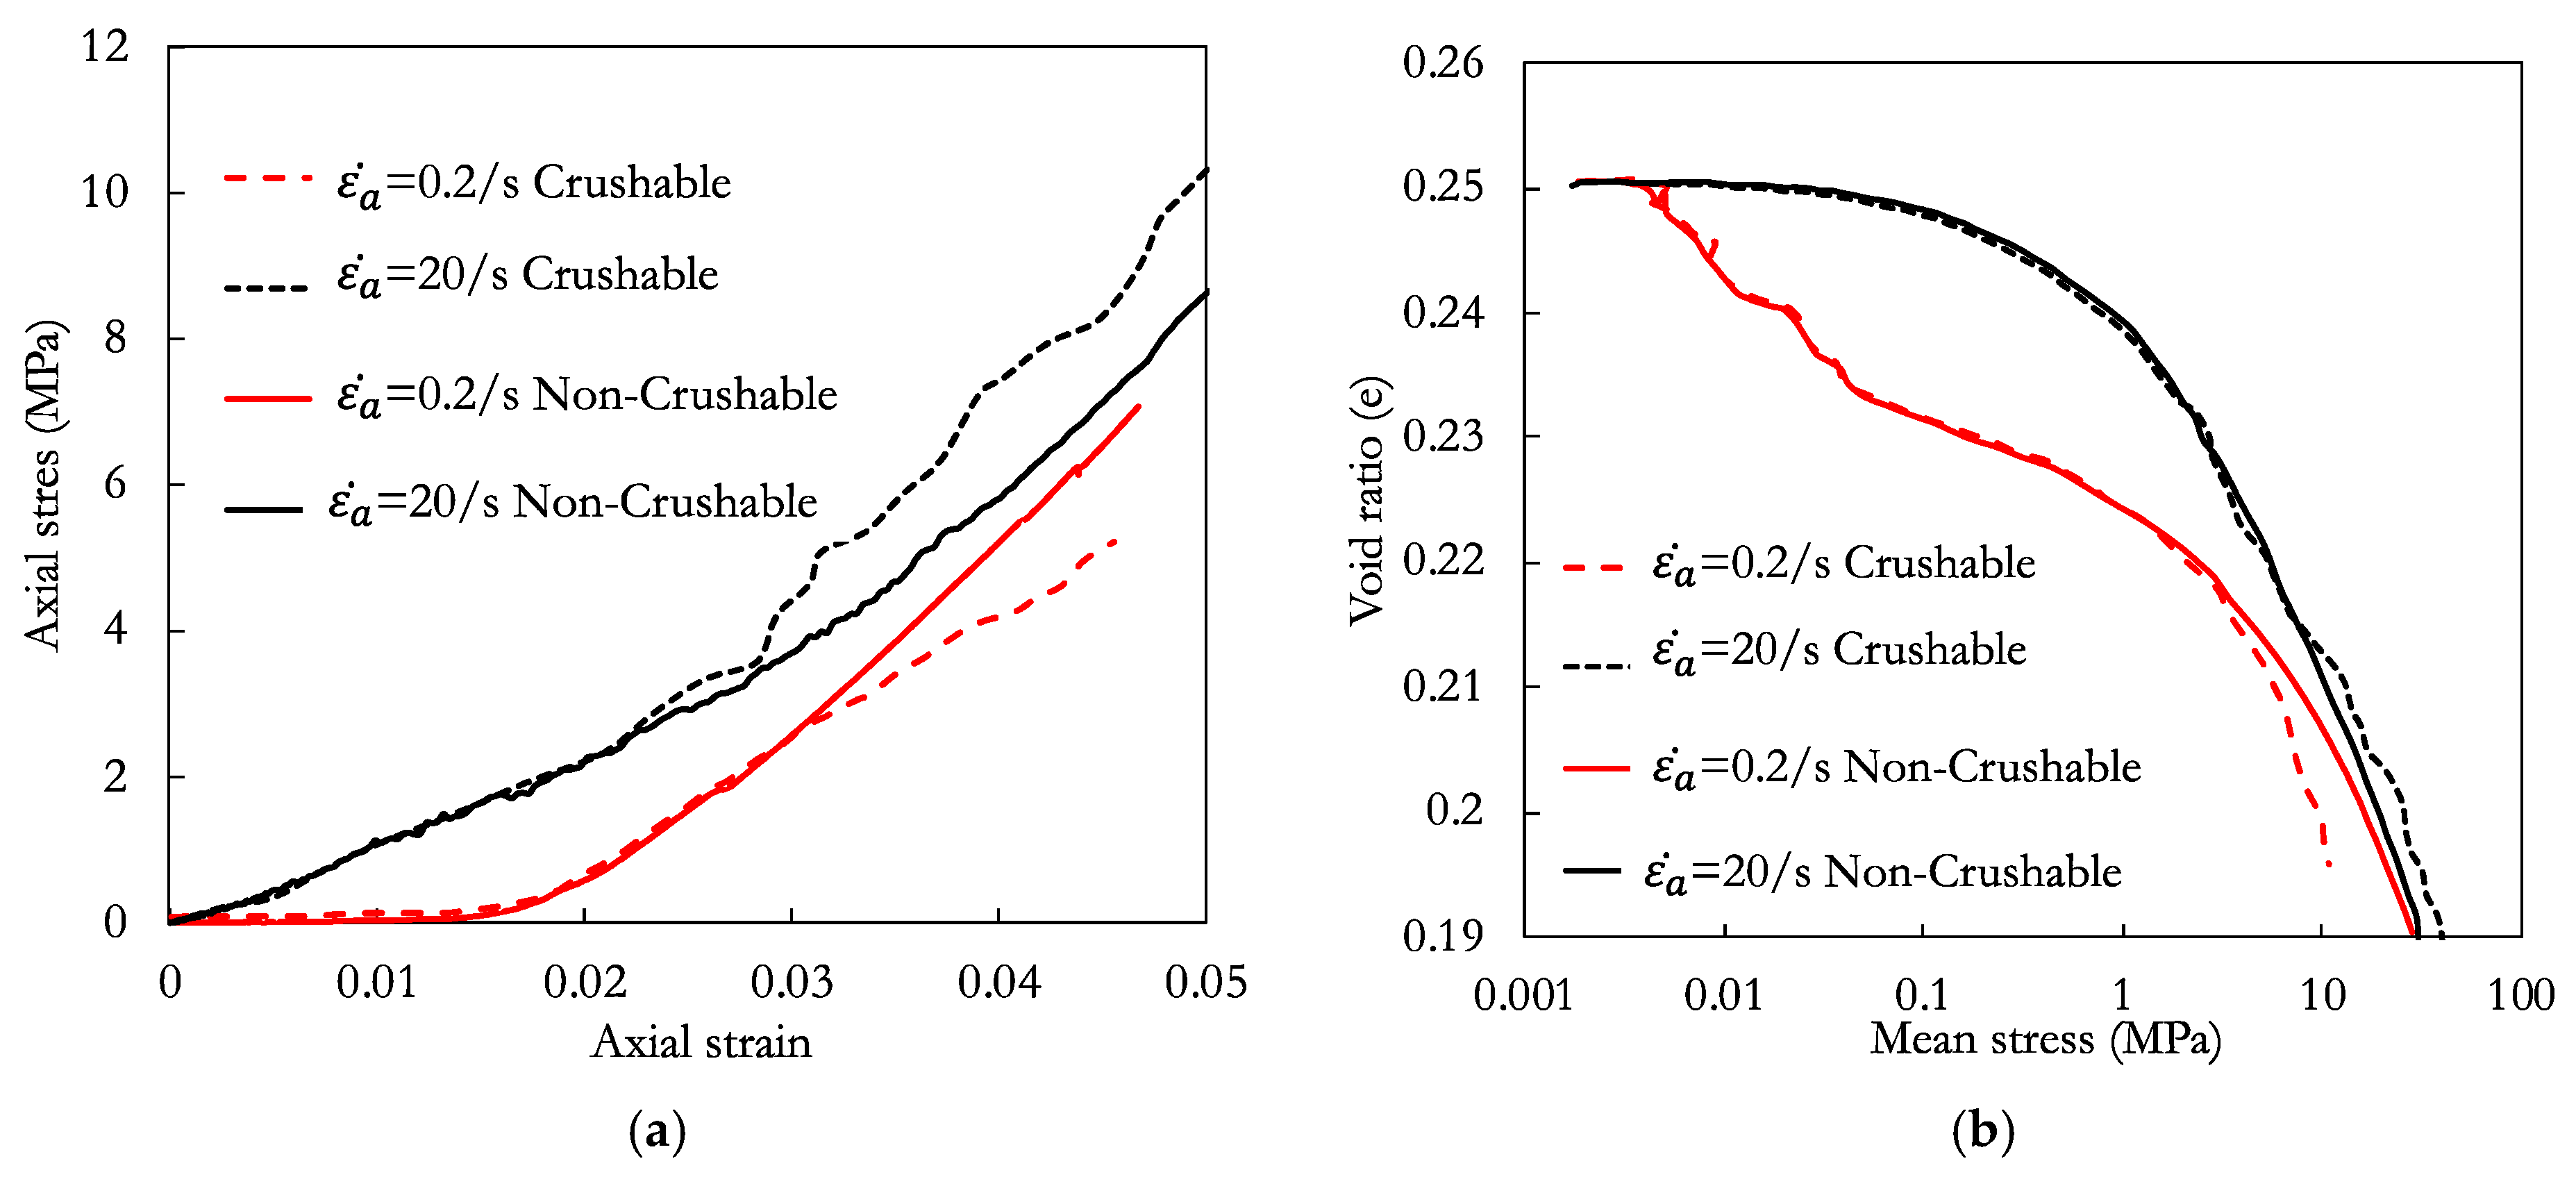
Figure 5 shows the stress vs. strain responses for strain rates of  ε a ˙  = 0.2/s and 20/s for crushable and non-crushable granular samples. In order to model the non-crushable sample, the particles are assigned higher material strength so that the particles are not crushed during loading (see Table 1). Simulations are continued until strains of about 5% because the computational effort grows exponentially with the increasing number of particles with breakage at higher strains. It is seen that axial stress increases with strain without apparent deviation between elastic and plastic phases, typical of one-dimensional compression [74]. The non-crushable sample with high strain rate shows a stress increase from the onset of loading. The response for the low rate, however, starts with an initial compression without notable strength gain until 1.5% strain but eventually aligns with the high strain rate response near the 4%–5% strain level.
Crushable samples, however, have significantly varied stress responses for the two rates. Up to 3% strain, the crushable sample’s behaviour follows the non-crushable sample’s behaviour. After that, the low strain rate crushable specimen shows a reduction in strength response with respect to the non-crushable sample, unlike the high-rate sample, which exhibits a strain hardening response, gaining strength with respect to its non-crushable counterpart. This divergence arises due to rate-dependent particle breakage. Previous research notes that granular assemblies become denser as particles crush, enhancing their strength [75], especially in dynamic regimes.
In thermodynamic definition, if breakage is predominant, energy dissipates less through volume compression, leading to hardening. Yet, this study suggests that the strain rate effect can overshadow such an argument, leading the system towards either softening or hardening post-breakage depending on the applied loading rate. Similar patterns also manifest in the void ratio (e) vs. the mean stress graph, presented in Figure 5b, underscoring the impact of breakage on strain rate-dependent volumetric behaviours. It clearly shows that at the same stress level (10 MPa), the low-rate sample void ratio is much lower for the crushable sample with respect to the non-crushable sample and vice versa. This highlights the fact that, due to different rates, the amount of breakage varies in the sample, resulting in different macroscopic responses, unlike the non-crushable samples, where the rate effect is diminished at higher strain levels.

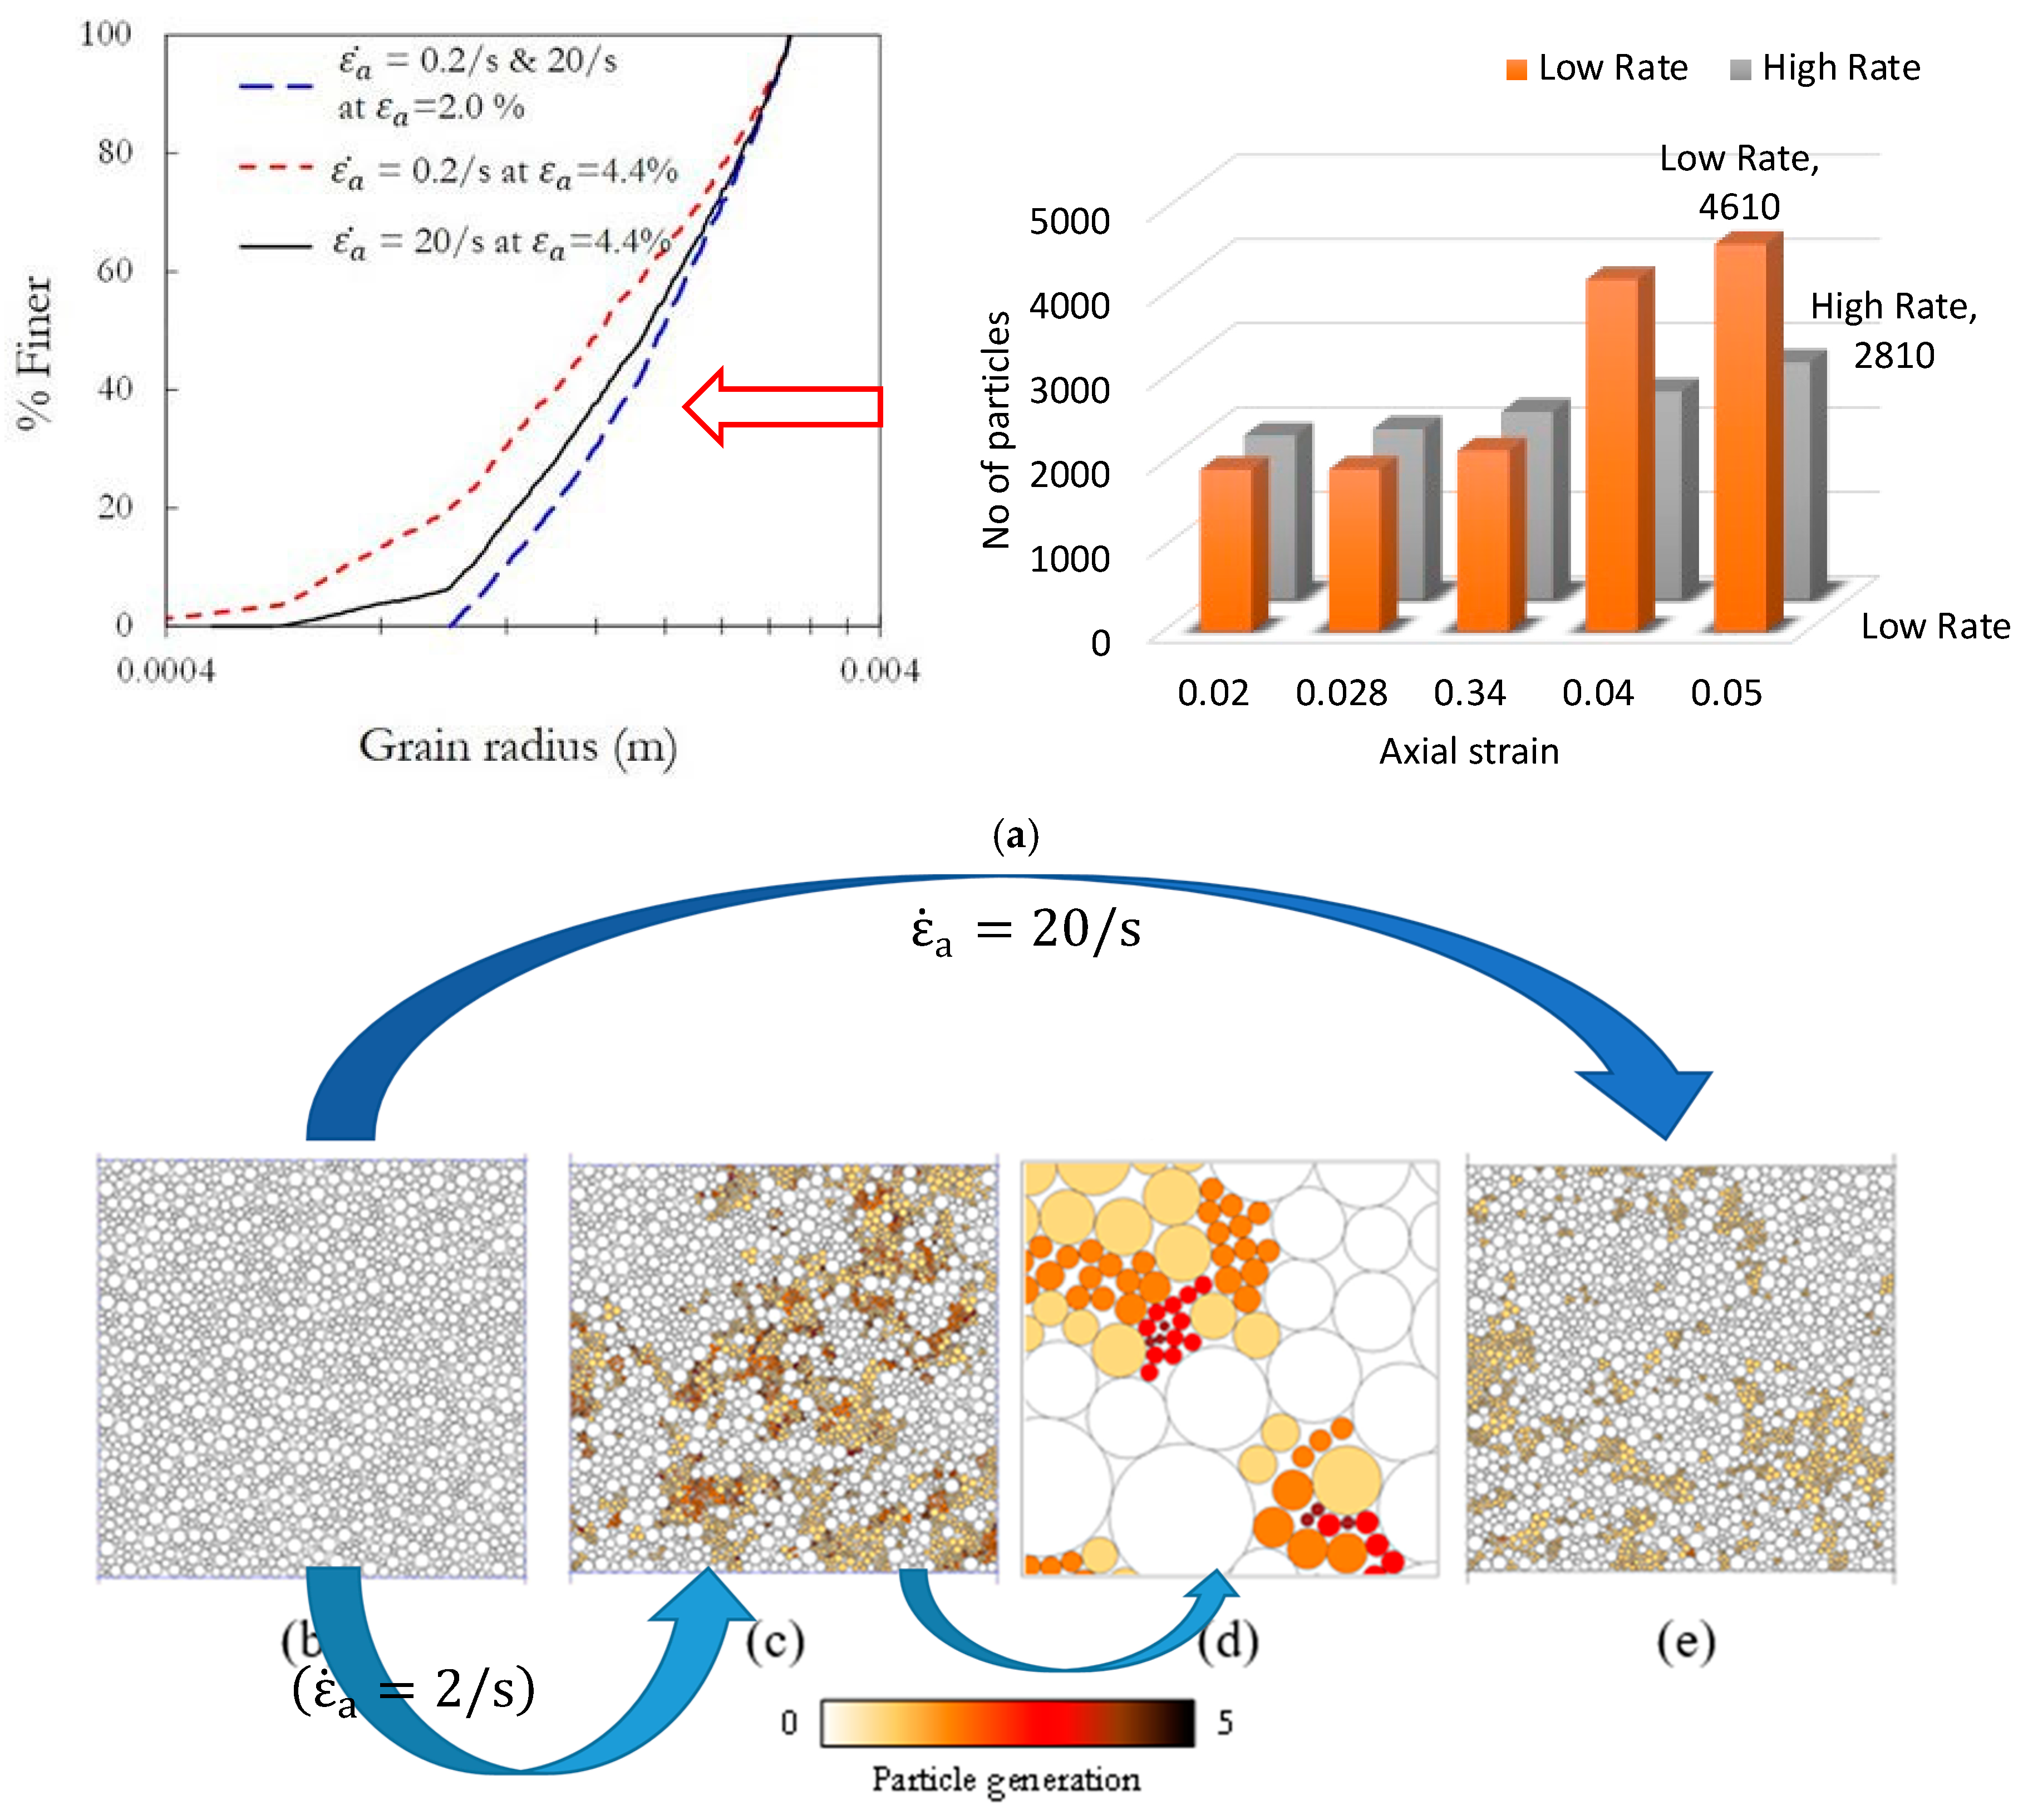
3.2. Breakage Response

To analyse how the breakage progression is influenced by strain rate, grain size distributions (gsds) are plotted in Figure 6a at 2% and 4.4% strain for the two strain rates. At 2% strain, gsds appear nearly unchanged from the initial gsd regardless of the strain rate. As loading progresses, the sample with a rate of loading, i.e.,  ε a ˙  = 0.2/s, results in more particle breakage, while breakage is less for the high-rate sample, i.e.,  ε a ˙  = 20/s. This indicates that a higher loading rate corresponds to reduced breakage and vice versa, reported in previous experimental and numerical works on strain rate effects as well [5,76].
High-rate loading led to the creation of around 2810 particles, whereas low-rate breakage progressed to produce around 4610 particles when traced at the end of analyses (Figure 6a). The number increases significantly after 3.5% strain, matching the point at which changes are observed in the stress–strain response in Figure 5, thus confirming the breakage-induced rate effects in granular samples. Notable differences in breakage evolution emerge between the two strain rates when reaching advanced loading levels (4.4% strain). The slower-rate samples have four generations of crushed particles (Figure 6c,d), while in the case of the higher loading rate, only one generation of crushed particles is generated (Figure 6e).

3.3. Spatial Contact Force Network

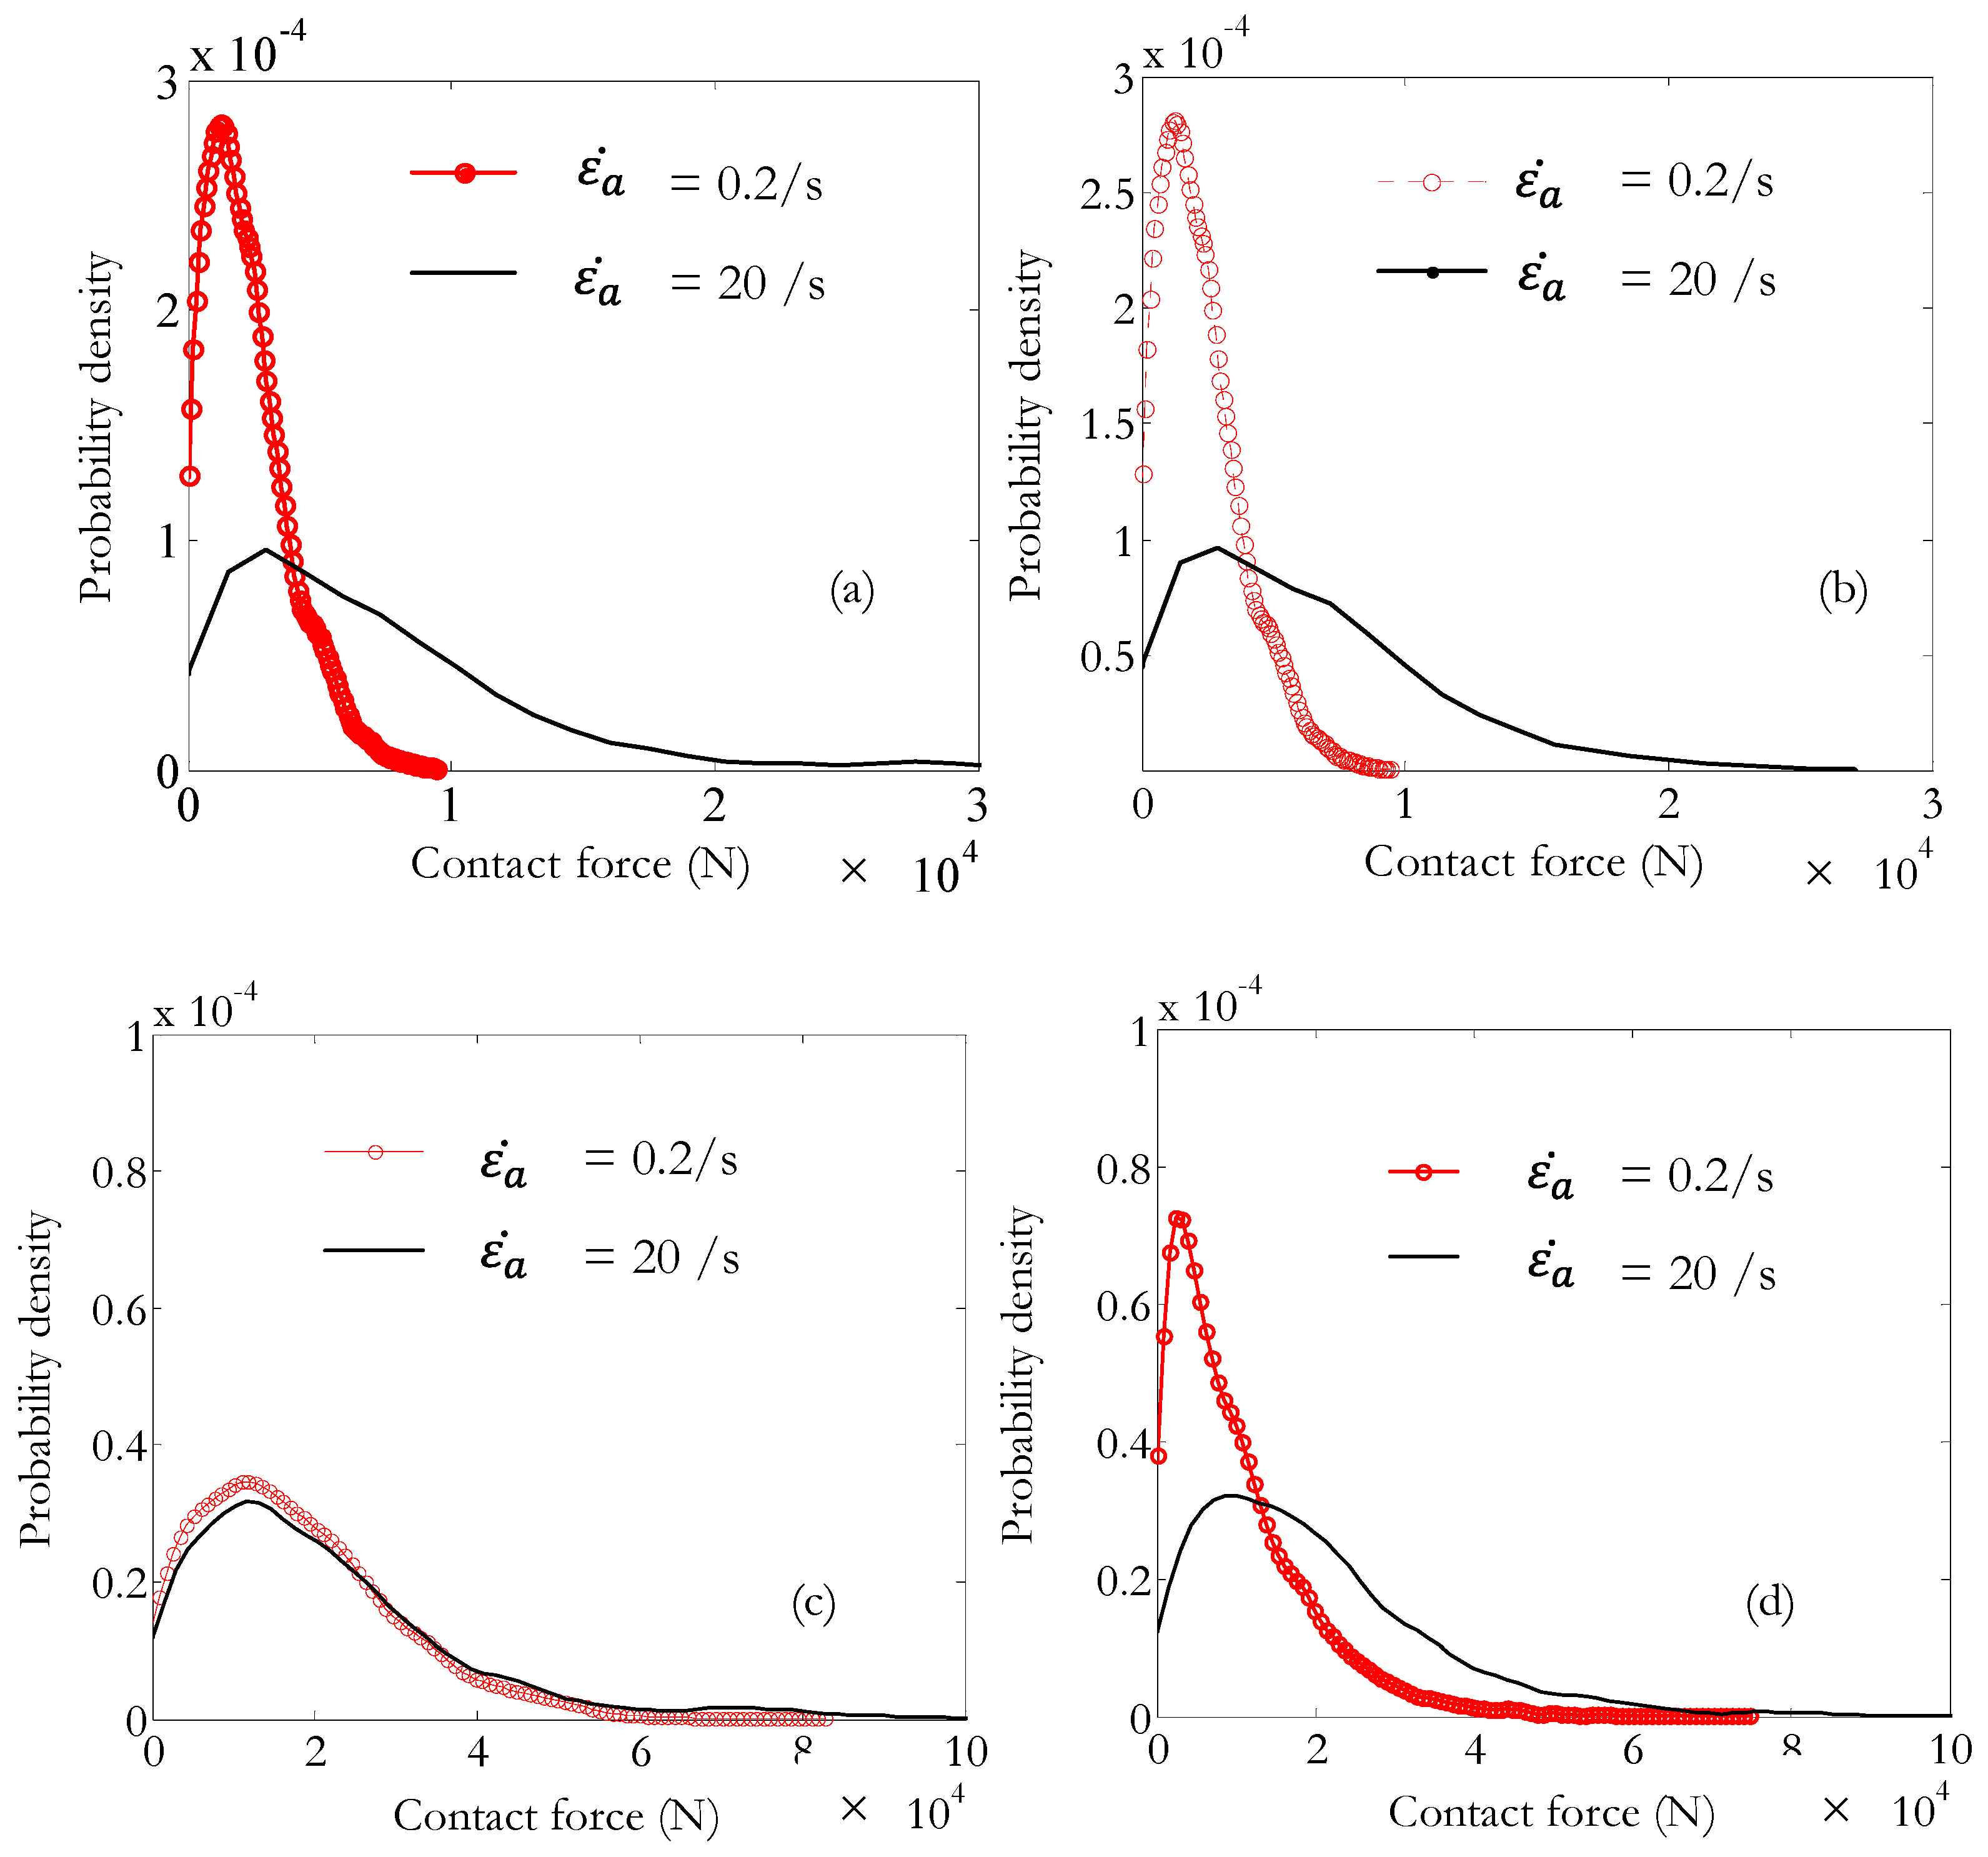
The contact force distribution (CFD) during various loading phases (Figure 7) is analysed to understand the micromechanics of rate dependency and breakage. Initially (at strain 2%), samples display a broader contact force distribution as the strain rate increases, meaning higher contact forces are more likely with increased strain rates. Both crushable and non-crushable samples have an identical contact force distribution at this phase due to minimal breakage.
As loading advances (strain 4.4%), non-crushable samples show similar responses for the two strain rates, aligning with previous experimental findings [38], suggesting granular materials’ low sensitivity to time-dependent loading at the quasi-static regime. However, the crushable sample response differs due to the variation in particle numbers resulting from breakage (Figure 7d). Particle breakage is governed by a force criterion based on average normal contact forces. An increase in the modal value of the force density plots amplifies the possibility of uniform contact force distribution throughout the specimen, as seen in Figure 7b,d. Consequently, more extensive and uniform breakage is expected at lower strain rates, and as compression continues, these samples cannot gain as much strength since the load is distributed among many particles, decreasing the average contact force. In contrast, higher strain rates, due to their wide CFD, display higher macroscopic stress.
Figure 8 depicts the force chain distribution in granular assemblies under two scenarios: (1) at the same strain level (Figure 8a,b) and (2) at the same stress level of 581 kPa (Figure 8c,d). The thickness of the black lines symbolises the relative contact normal force magnitude where the maximum contact force is taken as 300 N for all the cases. At 2% axial strain, the high strain rate sample (Figure 8b) has greater average contact forces compared to its slow strain rate counterpart (Figure 8a). Yet, in similar stress conditions (i.e., 581 kPa), both samples’ force chain thicknesses remain close (Figure 8c,d). Here, high strain rate simulations show force chains clustered adjacent to the loading boundaries, forming a vertical column of CFD, revealing the characteristics of granular materials under different compressions. Slow strain rate samples have ample time for particle contact, leading to uniform force distribution and more breakage. Many particles achieve the breakage limit simultaneously. The reorganisation of fragments in the post-crushed sample takes time, leading to a decrease in sample strength, evident as softening in the stress–strain curve. Conversely, high strain rate samples initially have uneven coordination, resulting in localised breakage, which gradually propagates but remains limited. This localised breakage aids in material densification, leading to sample hardening, unlike in slower strain rates. Thus, the formation of post-breakage contacts and progressive force distribution dictate the rate dependent macroscopic response in crushable granular media.

3.4. Variation of Particle Contacts

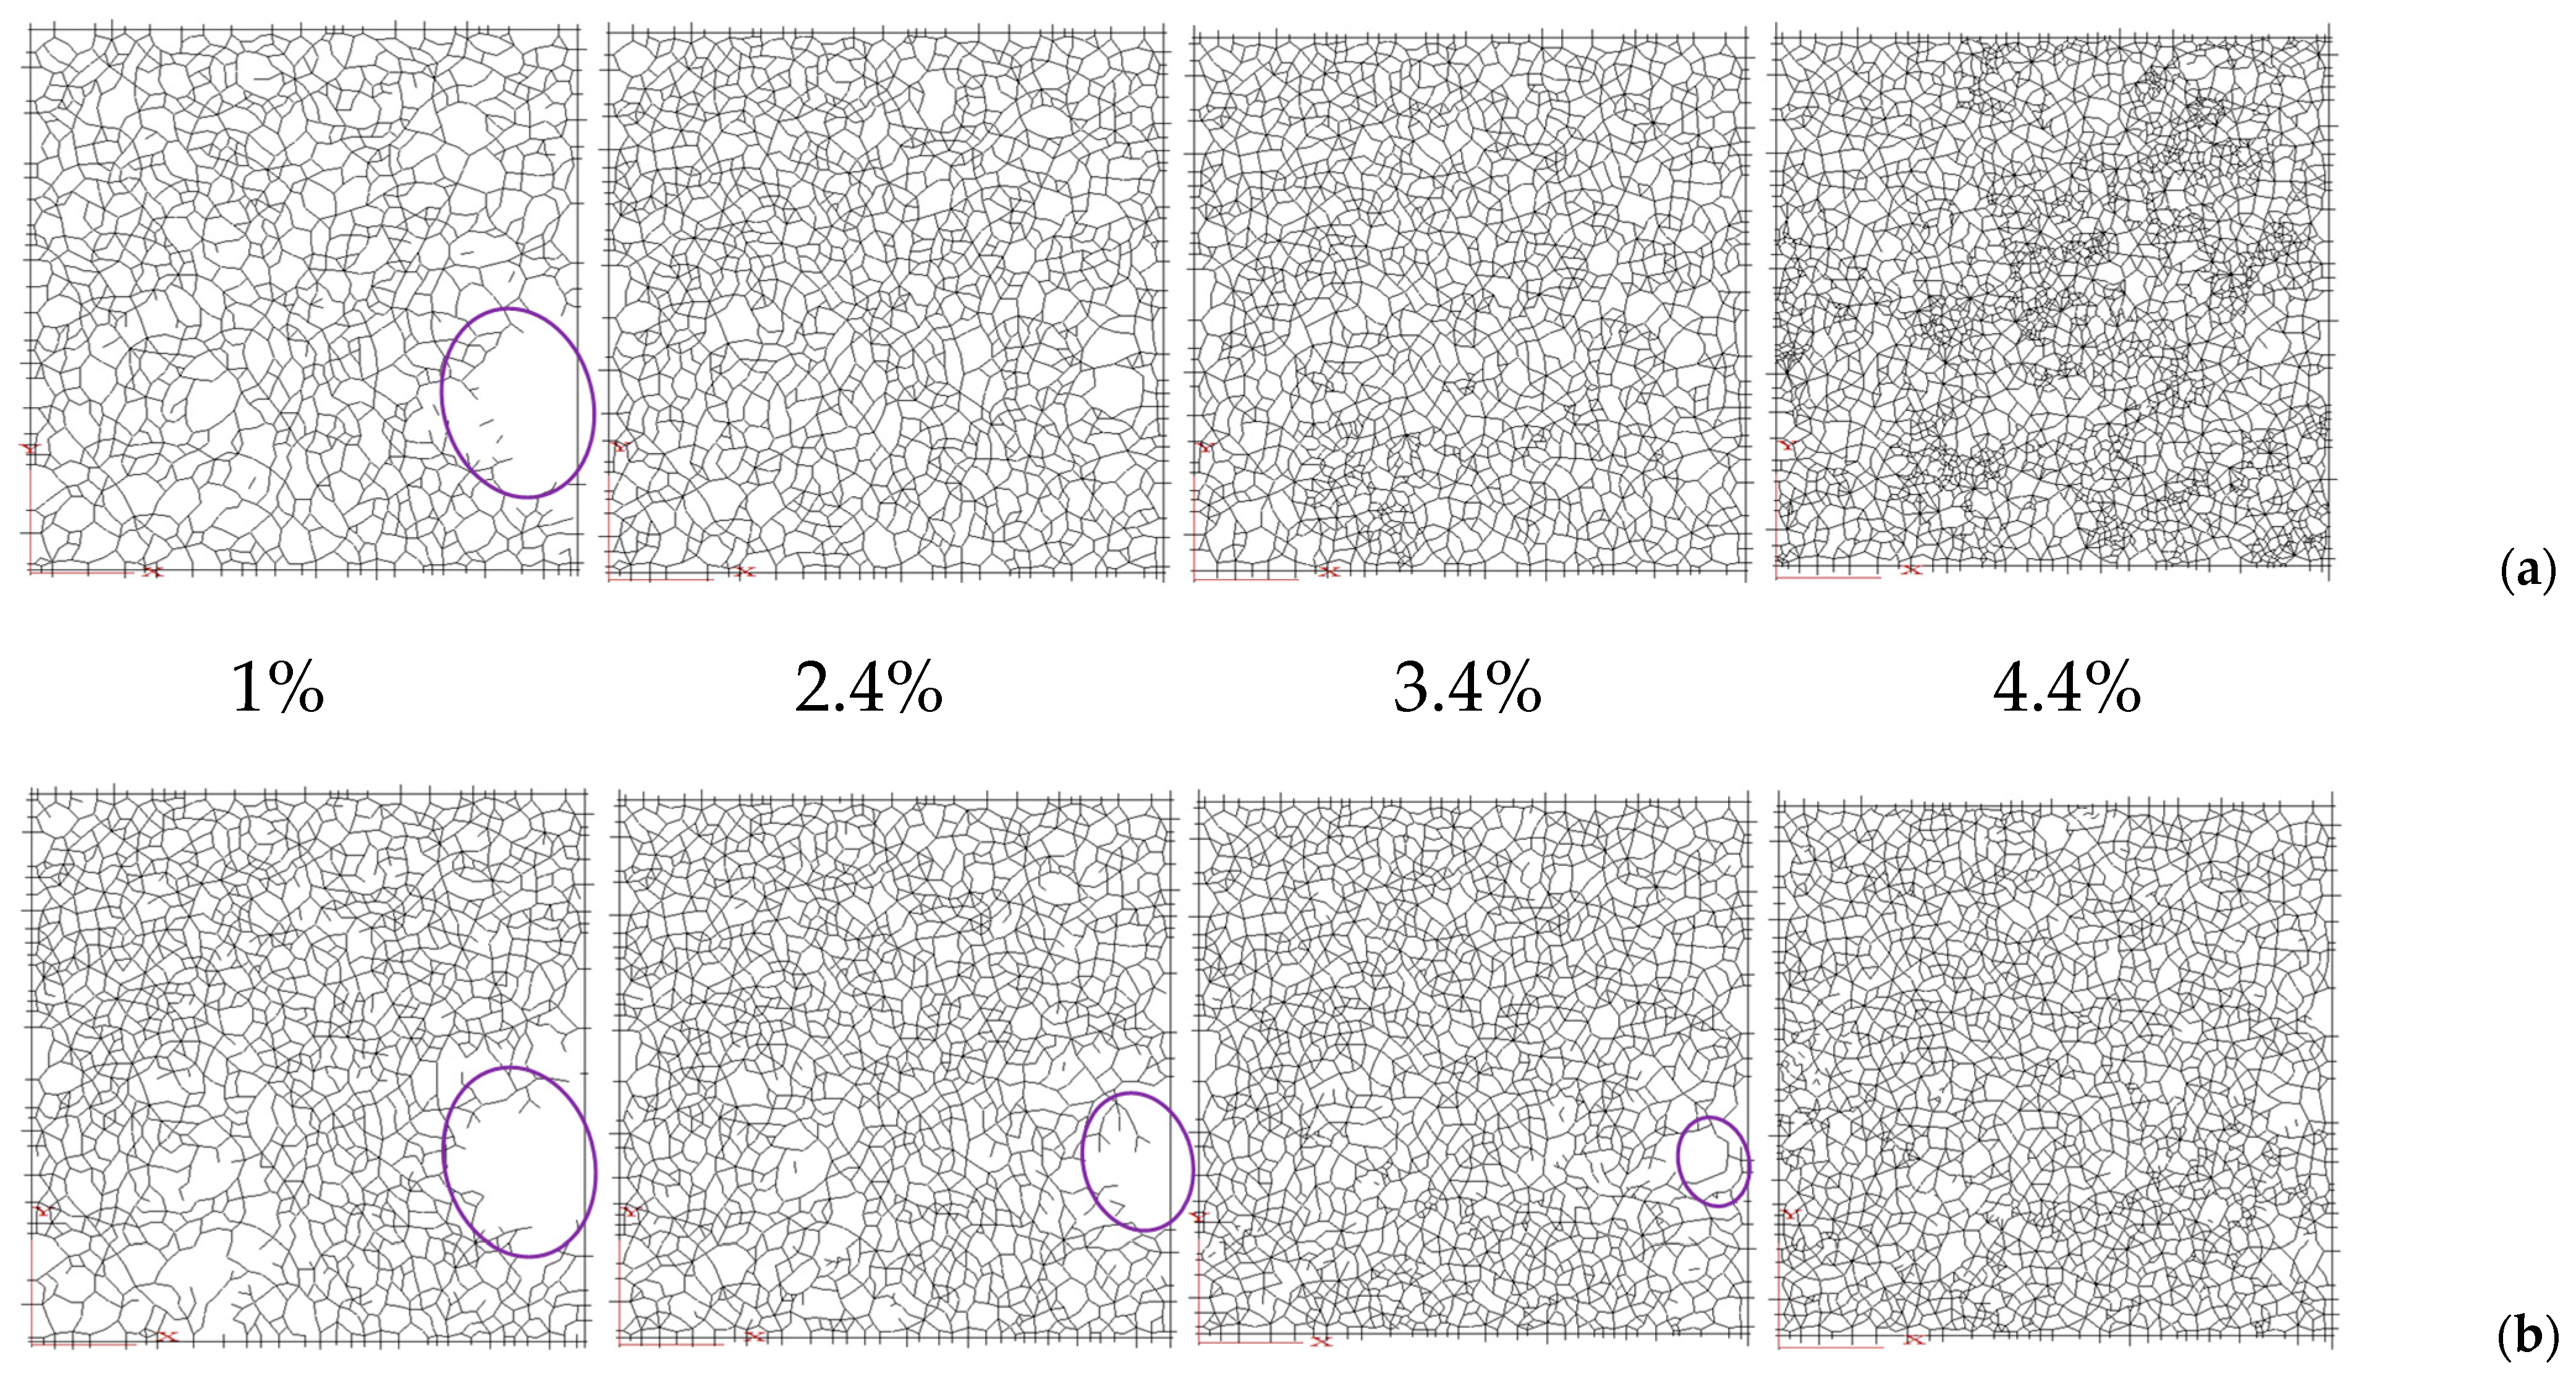
The distribution of particle contacts at various strain levels is illustrated in Figure 9 for both strain rates under consideration. This figure highlights that at lower strain levels, the contact distribution is quite similar for both low (Figure 9a) and high strain rates (Figure 9b). However, as particle breakage progresses, particles in the low strain rate scenario form contacts with neighbouring particles, unlike the high-rate case, where contact-free zones persist, resulting in a lack of contacts. As breakage intensifies, newly generated particles in the low-rate case establish additional contacts with their neighbours, while the number of contacts in the high-rate case remains consistently lower. This observation is in alignment with the contact force distribution presented in Figure 7.
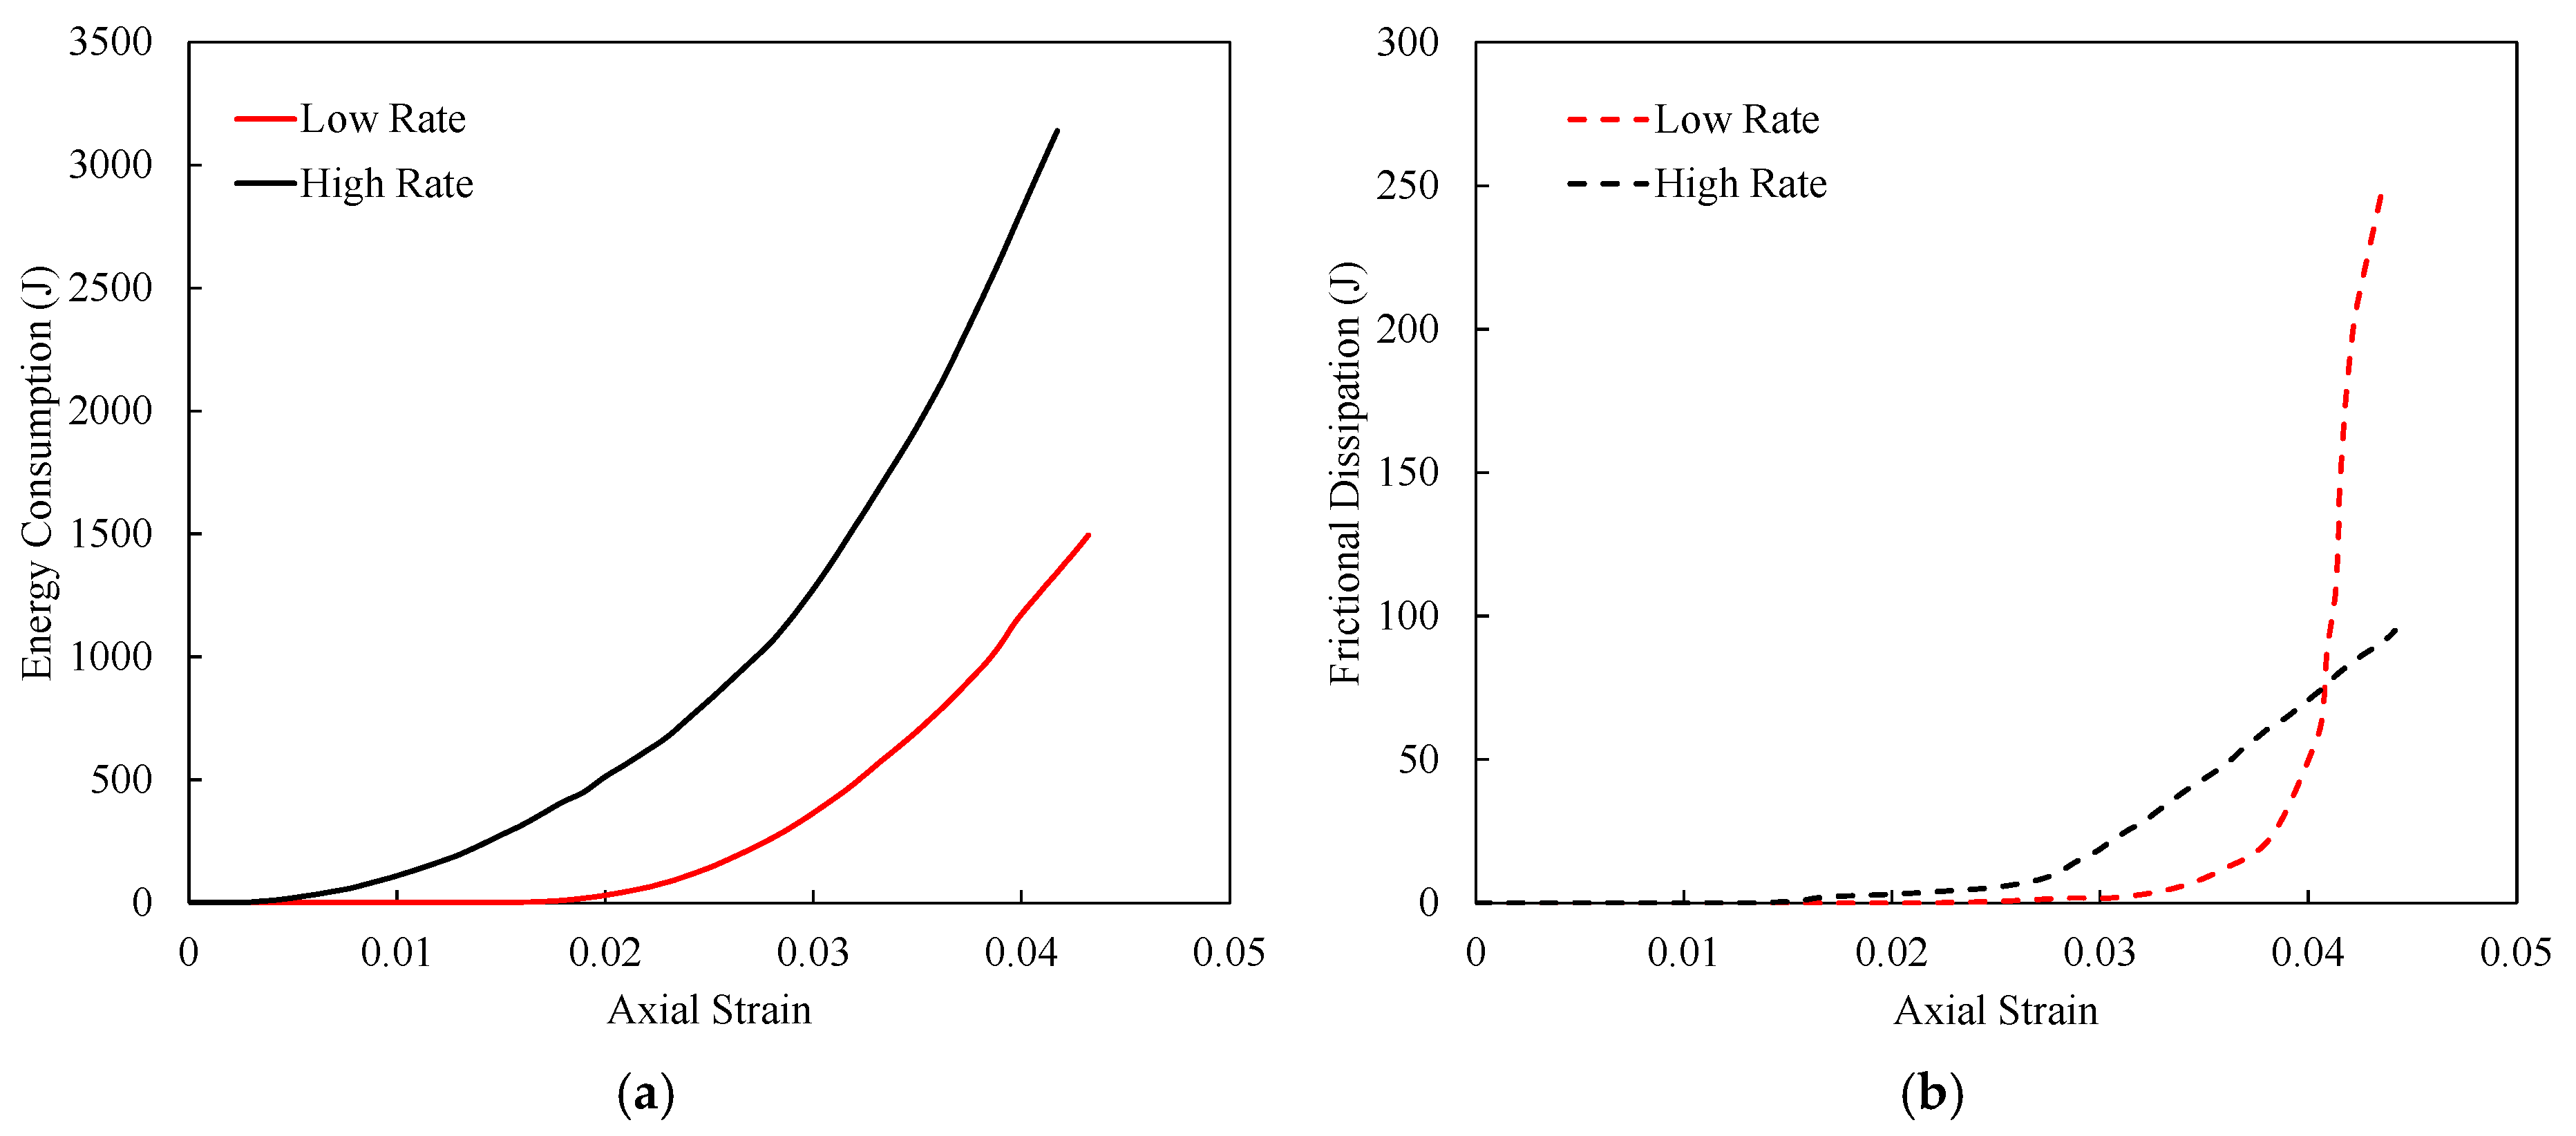
Another key finding from Figure 9 is the redistribution of contacts following particle breakage, particularly at higher strain levels (e.g., 4.4%), where post-breakage particle rearrangement leads to dense contact formation in the crushed zones. Such redistribution is absent in the high strain rate case due to the lower number of particles available to bear the load, and the reduced time for contact formation. In the low-rate scenario, contact-free zones close earlier (around 2.4% strain, Figure 9a), while in the high-rate case, they persist until much later (Figure 9b), confirming the limited time for particle contact formation at higher rates. The progressive creation of contacts due to redistribution in the low-rate case also contributes to lower mean stress, as the external energy is distributed among a larger number of particles, unlike in the high rate case, where such redistribution is minimal. Please note that it was expected that the contact force distribution would be similar for the two rates in non-crushable cases and, hence, is not reported here. The energy consumption due to the application of load for the two different strain rates is shown in Figure 10a, while the frictional dissipation resulting from particle breakage is depicted in Figure 10b. It is evident that the energy consumed is significantly higher for the high-rate sample, exceeding 3000 Joules in the current study, aligning with higher stress–strain response in Figure 5. In contrast, the energy consumption for the low-rate sample is just over half of that amount.
Interestingly, the frictional dissipation caused by particle breakage and redistribution is maximum for the low-rate sample, reaching approximately 250 J. This is attributed to the extensive particle breakage in the low-rate scenario. On the other hand, the initial frictional dissipation in the high-rate sample remains higher than that of the low-rate sample until around 4% strain due to a higher applied loading rate. Beyond this point, the dissipation for the low-rate sample increases exponentially due to breakage-induced redistribution.
Two key observations can be made here:
The overall frictional dissipation resulting from particle breakage remains below 20% of the total energy consumption, which has also been witnessed by other researchers [40,77,78].
The exponential increase in energy dissipation lags slightly behind the onset of breakage (which initiates after 2.4% strain, as shown in Figure 6). This delay occurs because the newly formed particles require time to establish contacts before they begin dissipating energy through friction with neighbouring particles, further confirming the findings presented in Figure 9. The quantification of energy, if carried out based on experimental observations, can help optimise the strain rate during breakage, which can give the most economic outcome.

3.5. Particle Velocity Profile

Figure 11 illustrates the particle velocity profiles at different strain levels for two distinct strain rates derived from DEM simulations of crushable granular media. For clarity, velocities have been separately scaled for each strain rate to enhance visual comprehension. At an initial strain of 1%, the particle velocities in the low-rate sample are uniformly distributed throughout the media (Figure 11a), indicating homogeneous deformation. In contrast, the high-rate sample (Figure 11b) shows velocities concentrated near the moving walls, suggesting more localised deformation. As the strain increases, distinct behaviours emerge between the two samples. In the low-rate sample, particles begin to displace more uniformly across the sample, with no significant particle breakage observed up to 2.8% strain level.
Conversely, the high-rate sample exhibits a significant shift at a strain of 2.8%, where localised breakage near the bottom platen leads to a sharp increase in particle velocities, destabilising the sample’s structural equilibrium. This velocity spike indicates early particle breakage in the high-rate sample, contrary to the gradual contact formation and subsequent breakage events in the low-rate sample, as seen at 3.4% strain and described in Figure 9. As the strain progresses to 4.4% in the low-rate sample, enhanced particle interaction increases contacts, contributing to the load-bearing mechanism and leading to multiple simultaneous velocity peaks due to particle breakage. In comparison, the high-rate sample displays fewer instances of localised breakage at advanced strain levels near the boundaries. This is attributed to the insufficient time available for particles to form contacts before being subjected to further load, resulting in an enhanced reaction to the boundary walls and a corresponding increase in sample strength, as previously discussed in Figure 5.

3.6. Coordination Number Profile

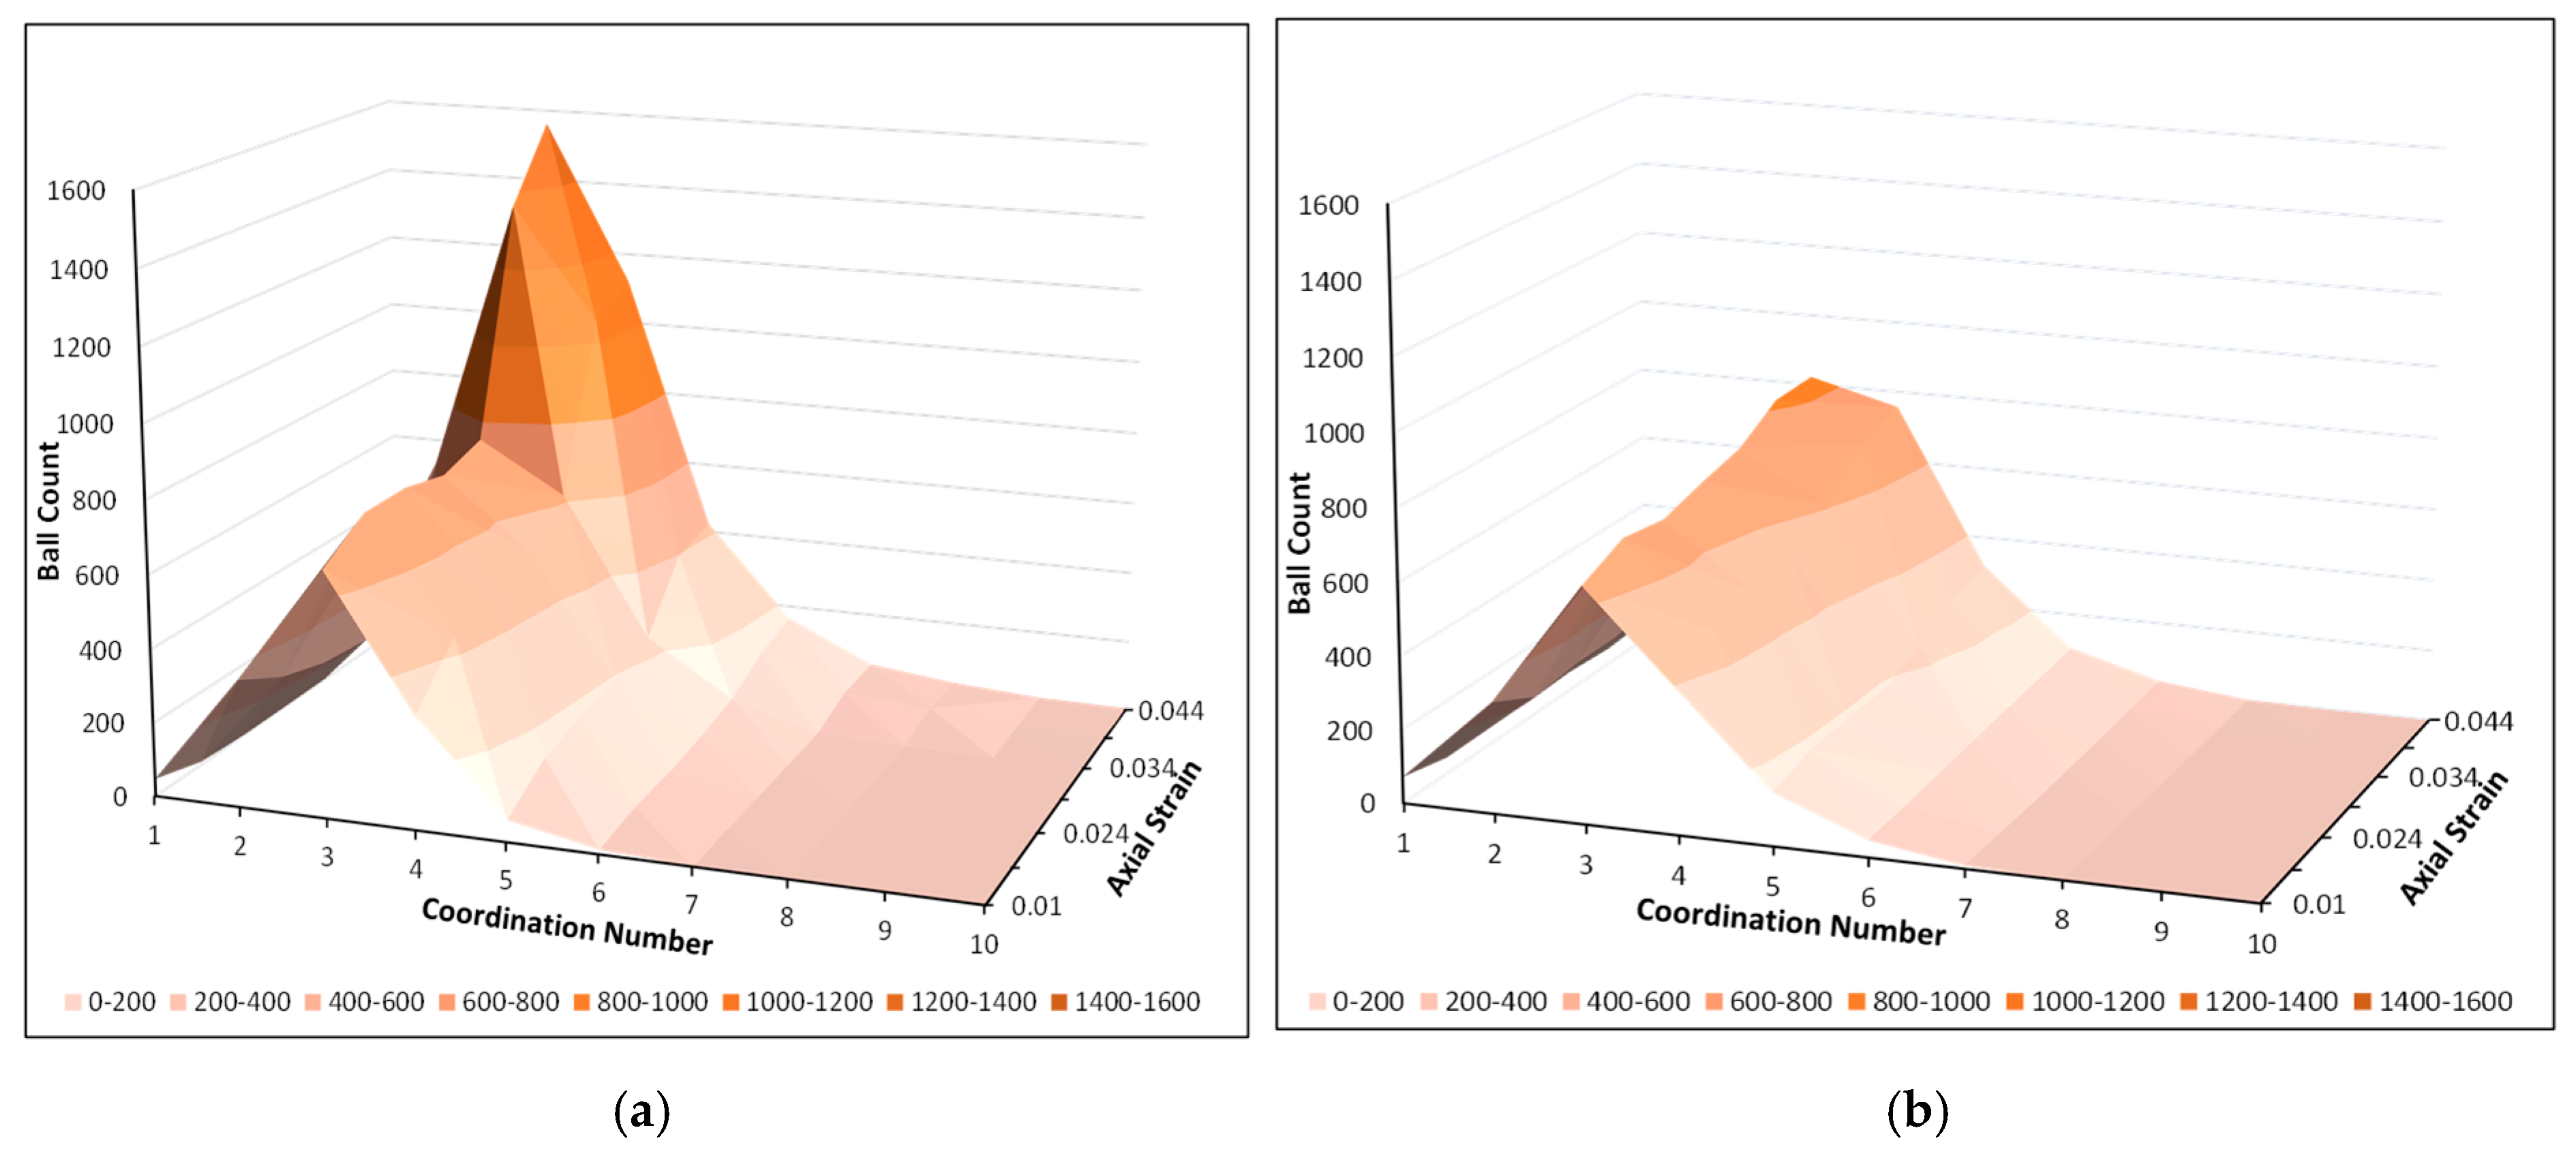
Next, we analyse the coordination number at different strain levels as shown in Figure 12 for the two rate cases to gather information on the microscale contact creation for the crushable sample. The number represents the number of particles in contact with neighbouring ones, thus quantifying the contacts at the grain-scale level. Initially, at low strain levels, where particle breakage is minimal—as indicated by the gradation variations discussed earlier (Figure 4)—both high and low strain rate samples exhibit similar coordination number patterns. However, as the loading continues and the breakage intensifies, the coordination number pattern starts to vary.
The samples subjected to a lower strain rate (Figure 12a) displayed a significant increase in the coordination number after the 2% strain level, after which significant breakage sets in. This can be attributed to the particles having more time to form contacts, consequently increasing the coordination number, which, in turn, amplified the breakage within the sample, as seen in Figure 9 and Figure 11. Conversely, the high strain rate samples (Figure 12b) did not show any notable increase in coordination numbers, likely because the particles lacked sufficient time to establish contacts. An additional observation is that the maximum coordination number frequency for the high-strain samples was in the range of 1000, unlike in the low-rate case, where the maximum coordination number frequency was 1400. This phenomenon can be linked to the breakage scheme adopted in this study, where one particle breaks into three smaller fragments, thereby resulting in the most frequent coordination number being four.

3.7. Fabric Tensor Evolution

To elucidate the anisotropy of granular fabric during rate-dependent loading, Figure 13 and Figure 14 illustrate fabric tensors represented as polar projections. These tensors are derived from unit contact normal for both low- and high-rate scenarios. The fabric tensor ( F i j ) is calculated using the following formula:
              F i j = 1 N c n i c n j c        
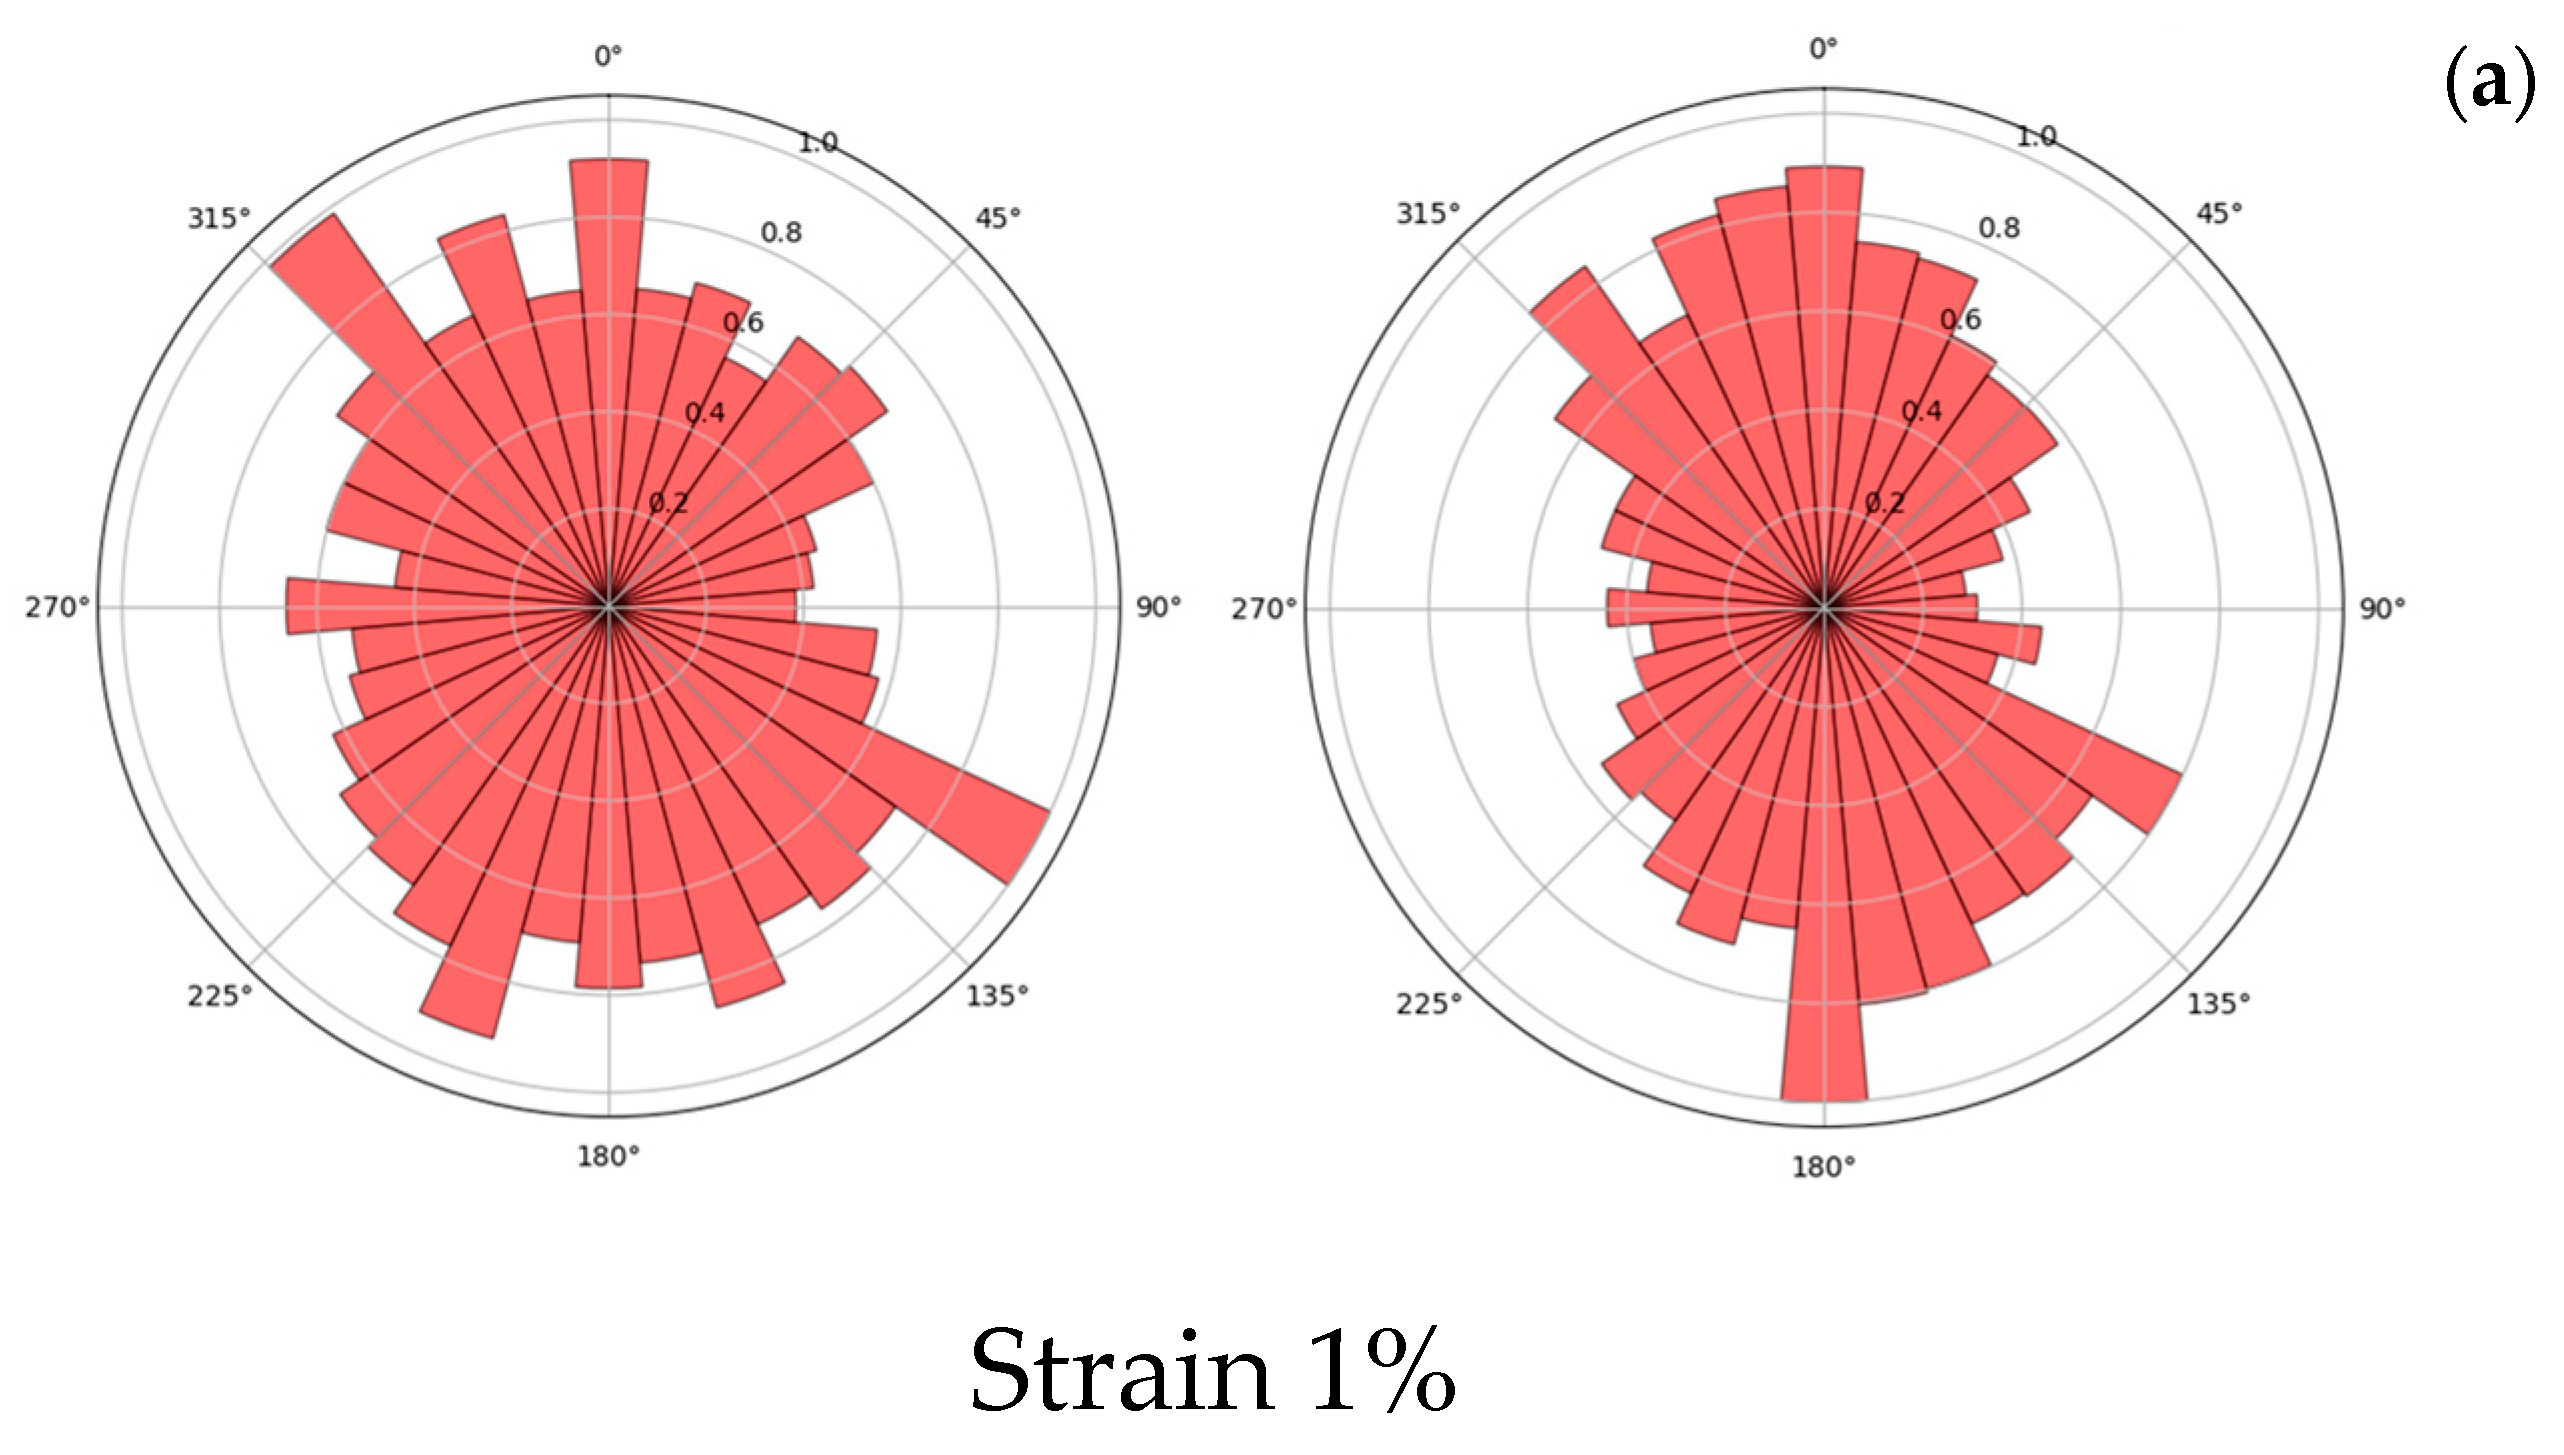
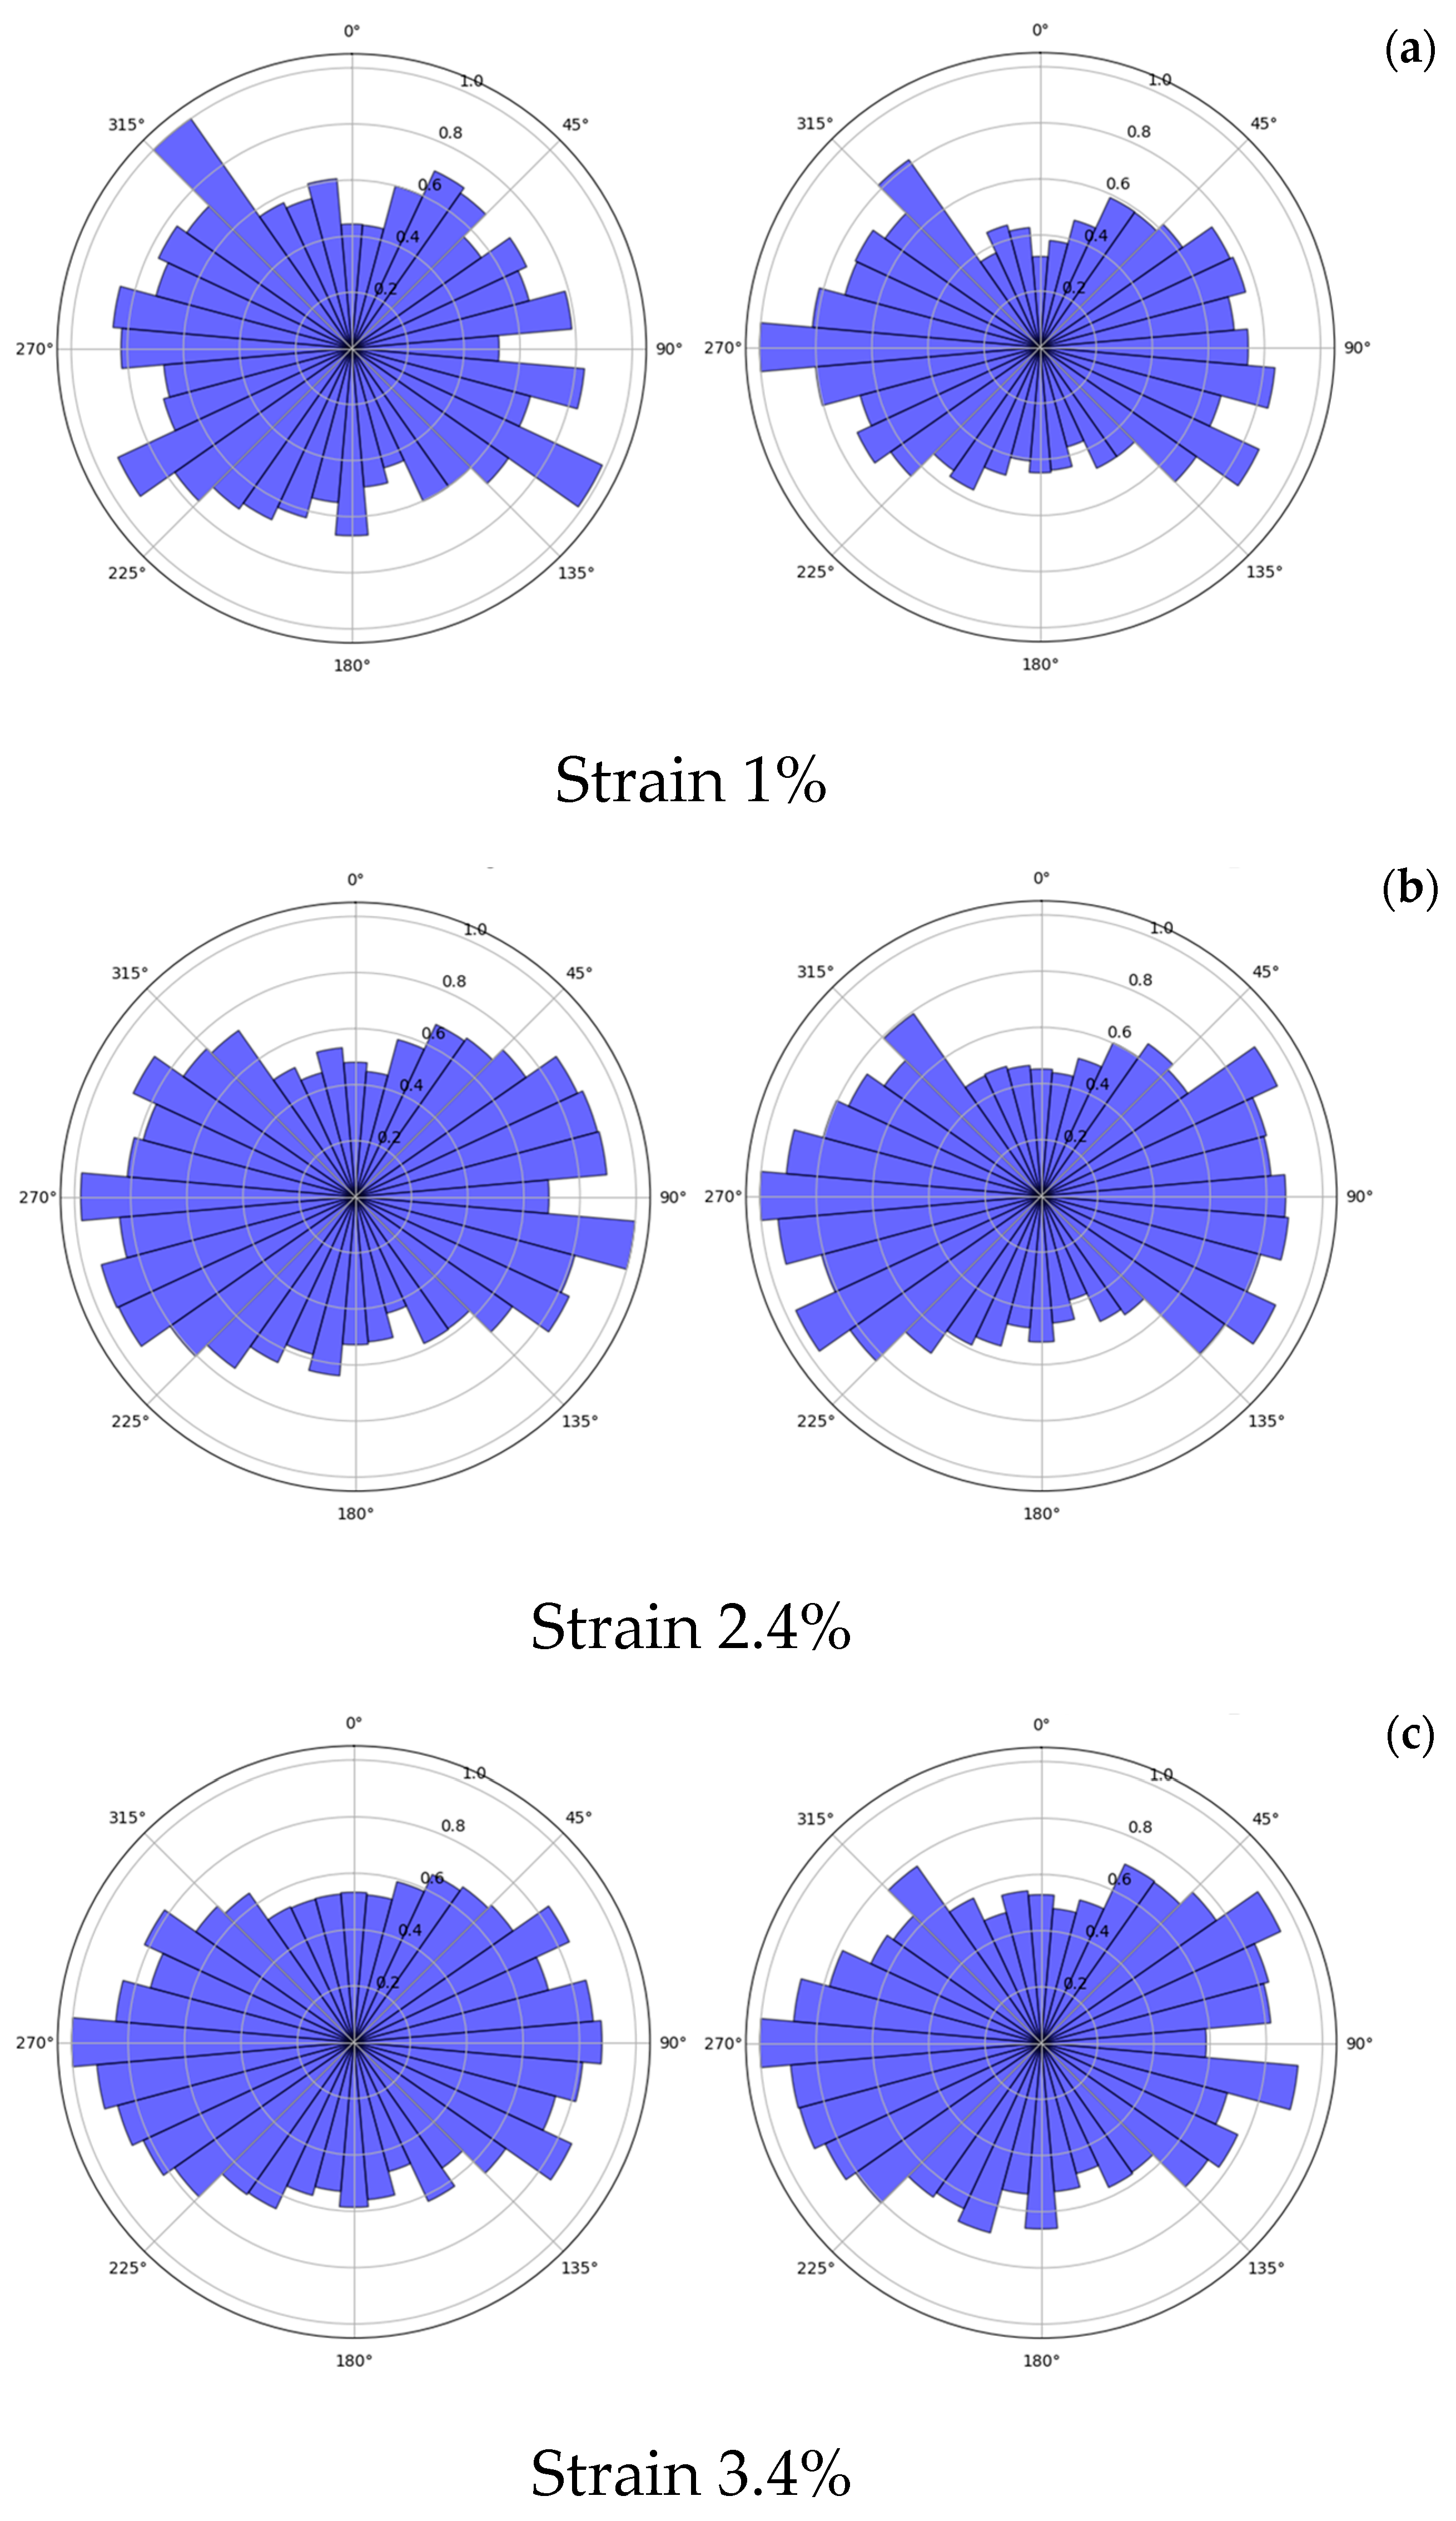
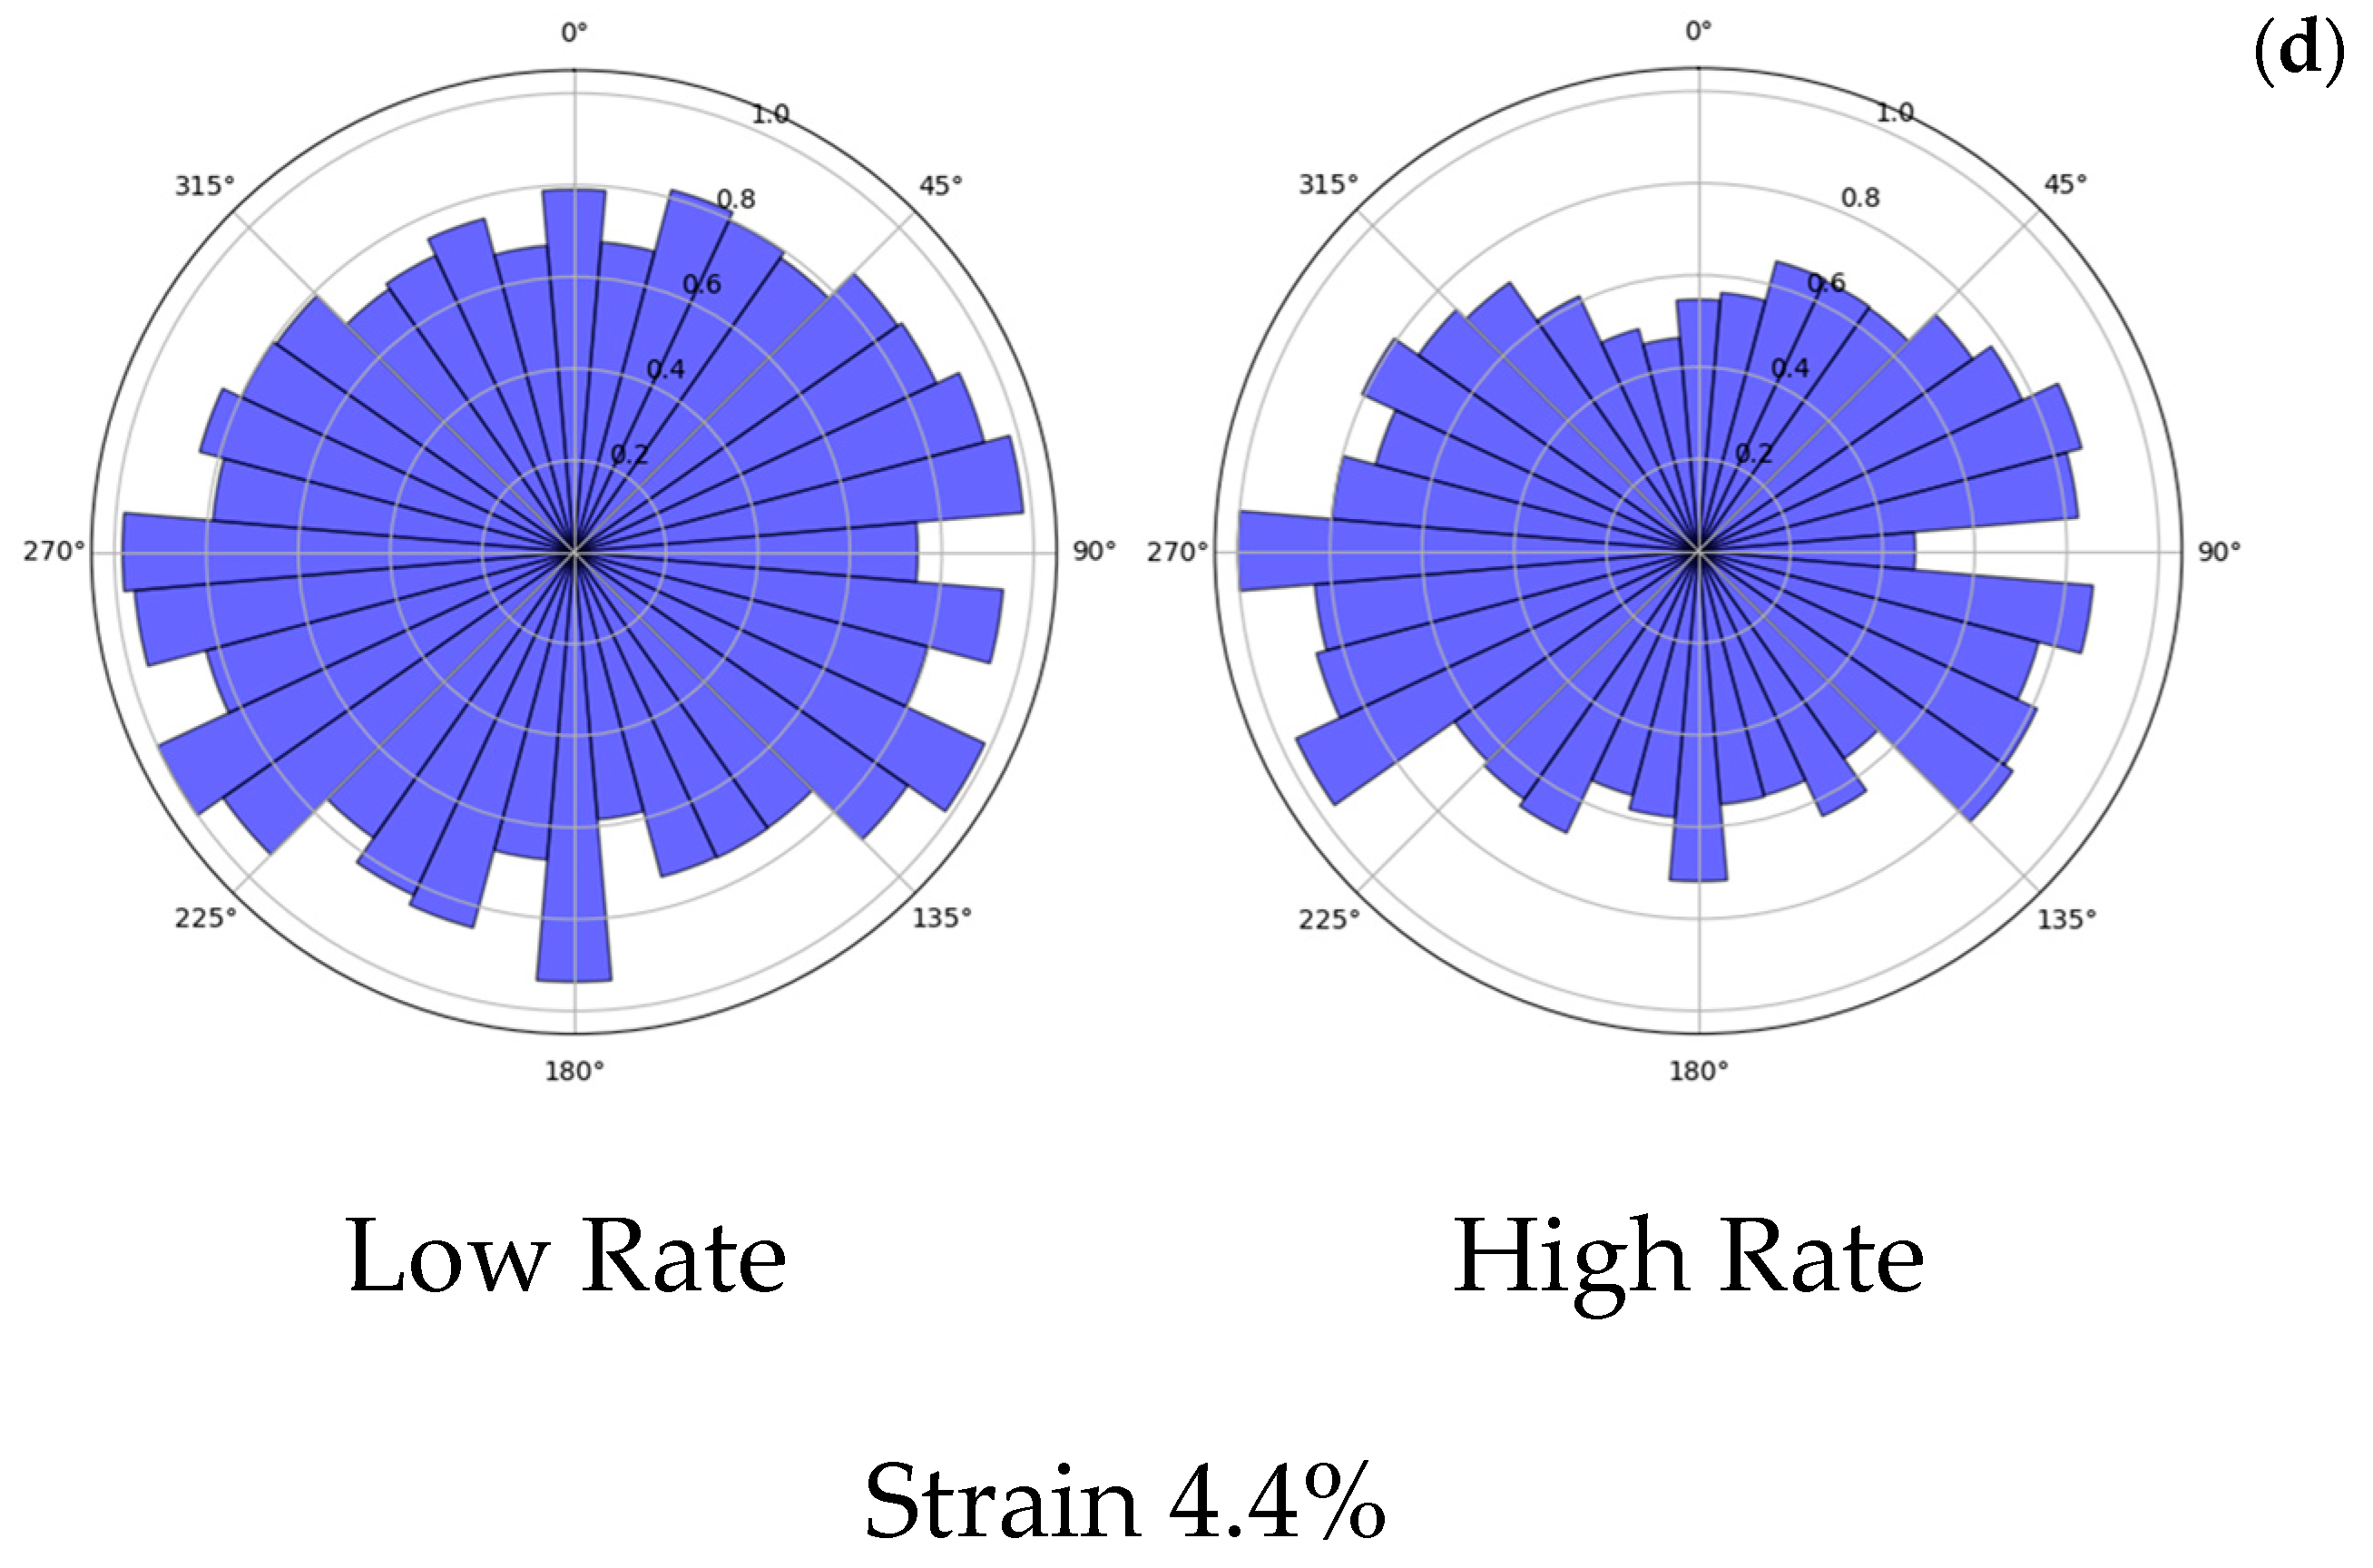
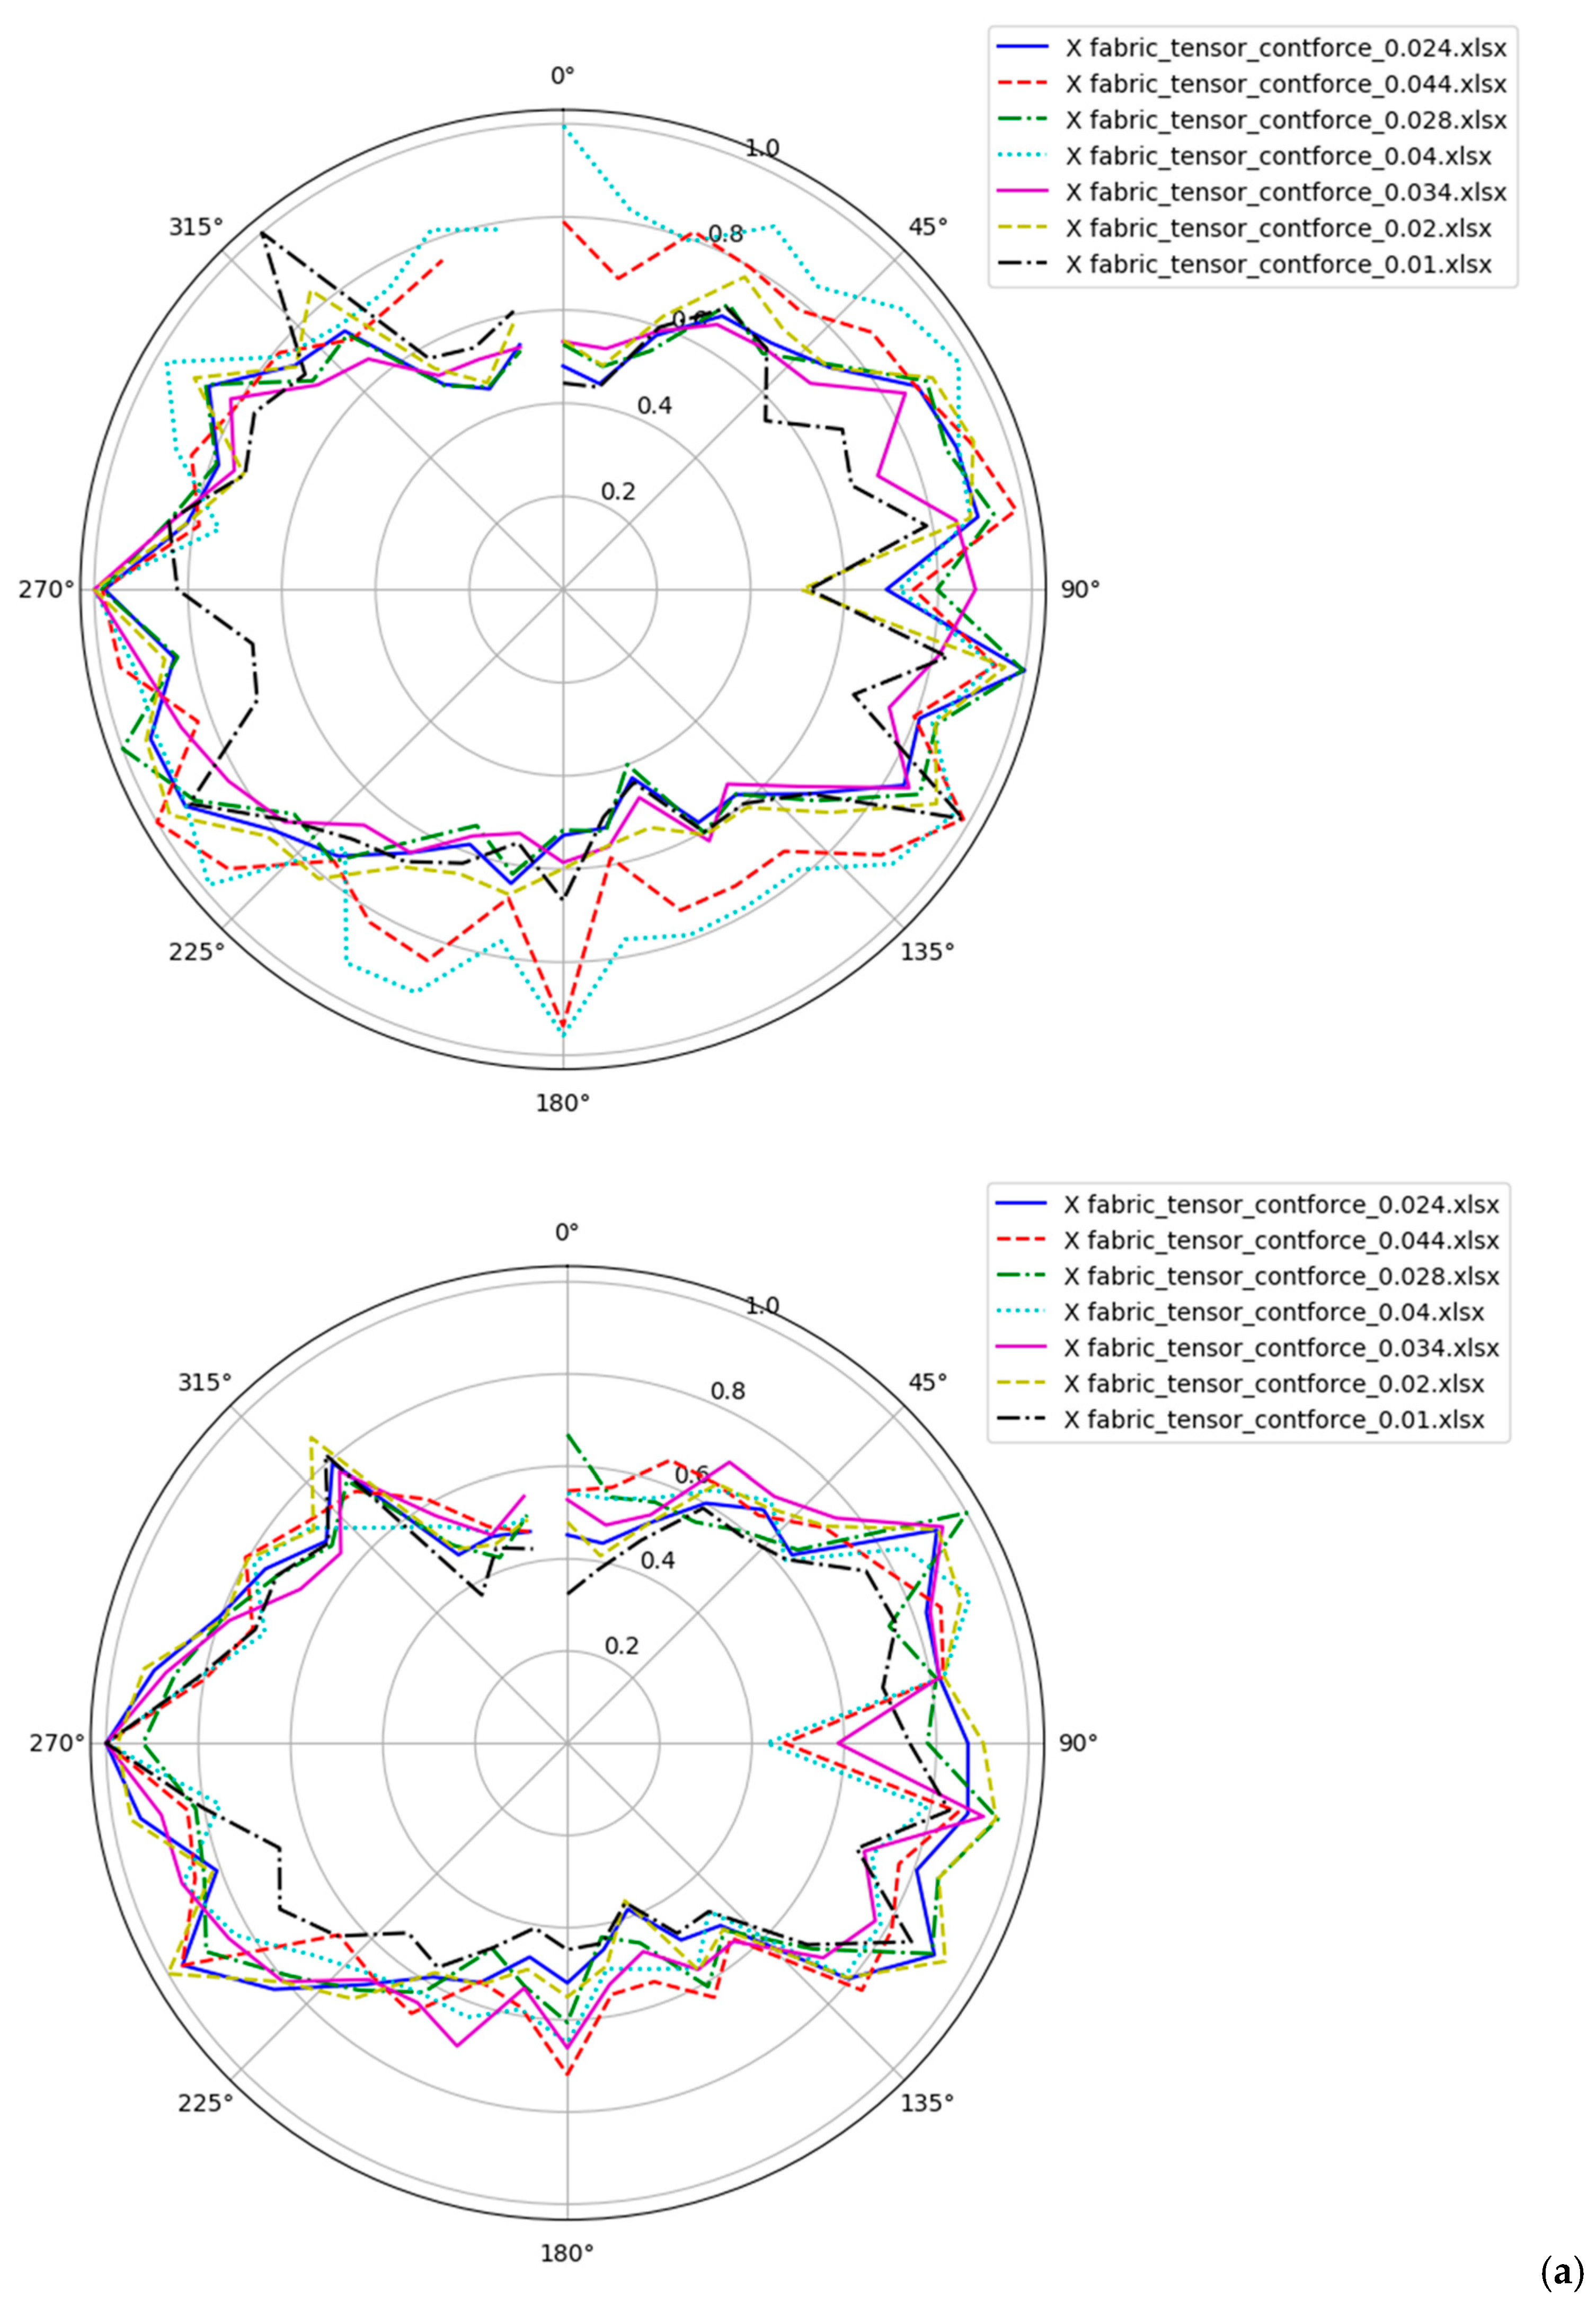
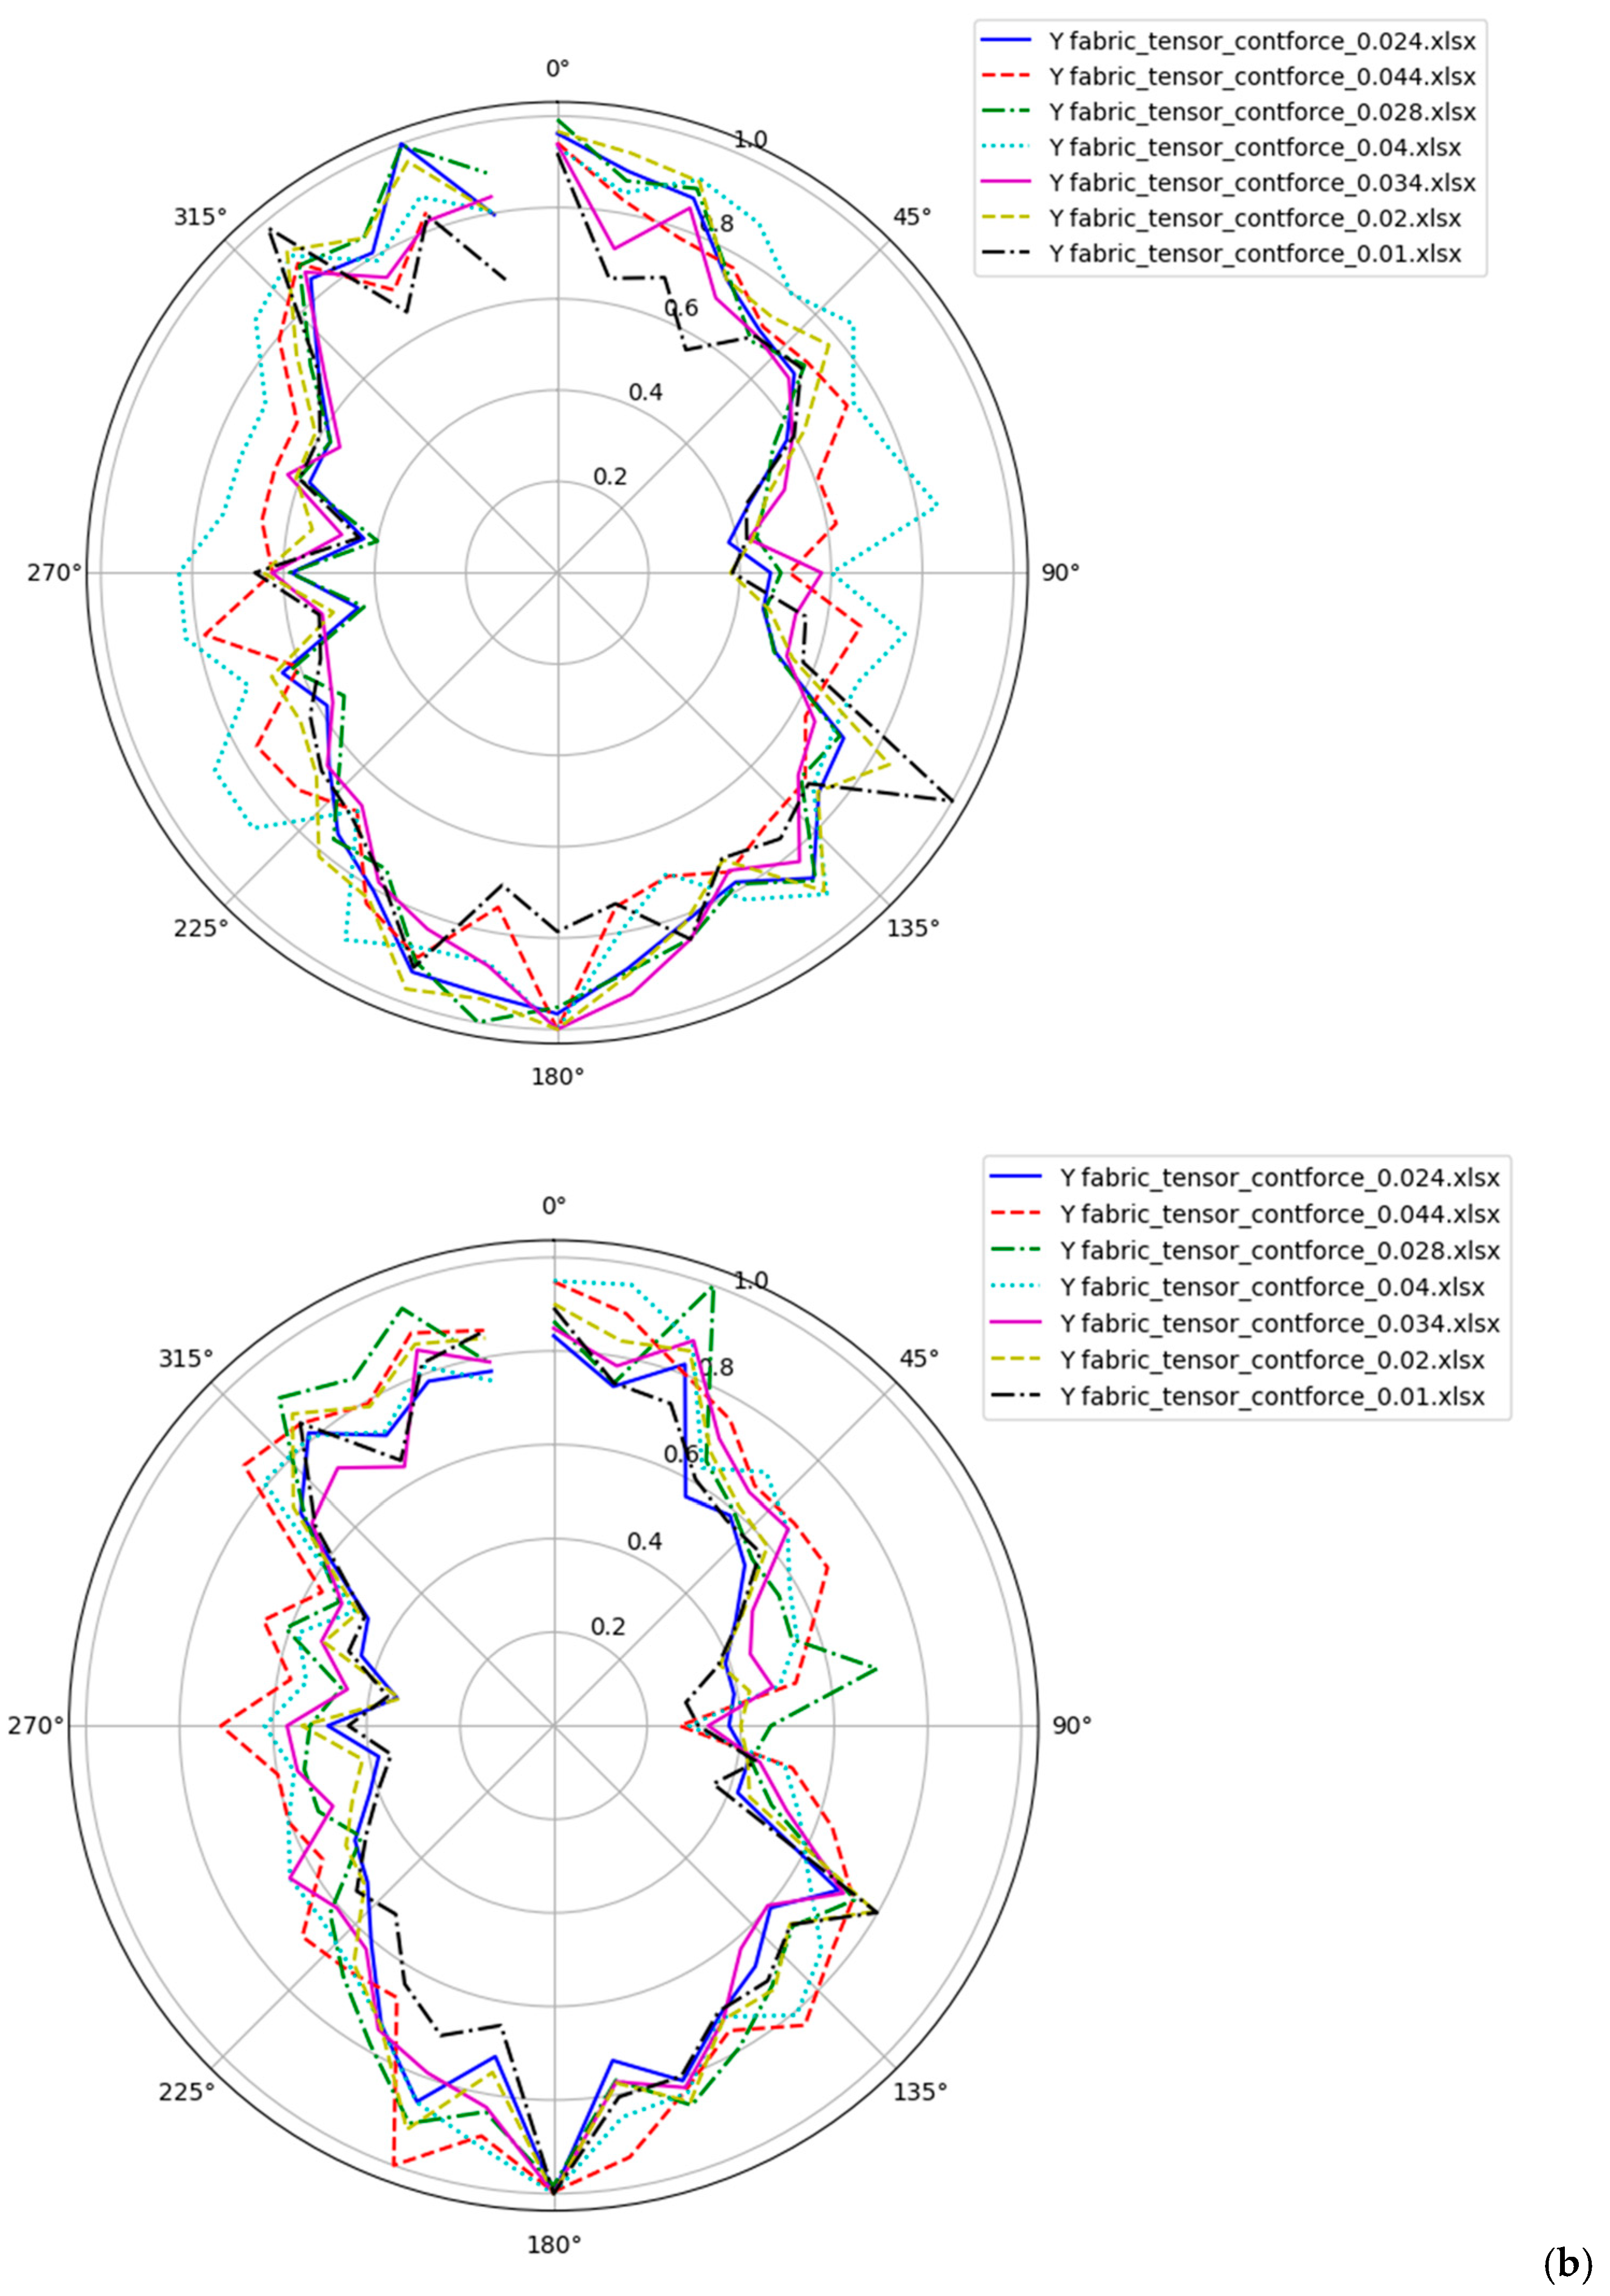
where  N  is the number of contacts, and  n i c  and  n j c  are the components of the unit normal vector for contact c in x and y directions, respectively. In the analysis, the polar plots are divided into 36 sectors of 10 degrees each, encompassing the full 360-degree range in 36 sections. Each ‘petal’ in the plot signifies the magnitude of contact forces, normalised against the maximum contact force within that angular segment. The Y directional fabric tensors are plotted in Figure 13, whereas the X-directional fabric orientations are shown in Figure 14 respectively.
Initially, at 1% strain (Figure 13a), the low-rate sample exhibits a diffuse fabric profile with sporadic spikes directed towards the north and northwest, contrasting sharply with the high-rate sample, which displays an elongated profile with a strong directional bias in the north–south direction. This difference in orientation suggests that, at low loading rates, particles have sufficient time to establish contacts, whereas at high rates, the rapid loading does not allow for particles to establish contacts evenly, resulting in pronounced bias towards the loading direction. As the loading progresses to 2.4% strain (Figure 13b), the low-rate sample also begins to exhibit directional dependence consistent with the application of load, though it remains less pronounced than in the high-rate sample. By 3.4% strain (Figure 13c), significant particle breakage in the low-rate sample leads to stress redistribution and a marked directional preference in the northeast–southwest quarter. In contrast, the high-rate sample, experiencing less particle breakage, maintains a stable fabric profile aligning with the initial loading direction.
At higher strains, such as 4.4% (Figure 13d), the low-rate sample shows increased particle reorganisation and stress redistribution, affecting broader areas, particularly in the second and fourth quadrants. Meanwhile, the high-rate sample continues to exhibit a more dispersed profile but retains its northward orientation due to the direction of loading. On the contrary, the fabric orientation in the X direction (Figure 14a–d) remains less affected by such breakage induced directional bias. This may be attributed to the fact that the loading direction plays a crucial role in case of one directional loading. However, at higher strain levels (Figure 14d), a diffused fabric profile for the low-rate case is due to the larger number of particles available due to breakage unlike the high-rate case where such profile is absent. Figure 15 finally compares the combined plots at different strain levels for both rate scenarios, illustrating the evolution of fabric anisotropy under different strain levels in the X (Figure 14a) and Y direction (Figure 14b), respectively. These observations confirm other studies’ findings that post-breakage stress redistribution [78,79] due to particle reorganisation leads to macroscopic stress differentials in rate-dependent loading scenarios, as previously discussed in Figure 5.

3.8. Summary

This study provides a detailed view of the rate effects due to the breakage behaviour of granular samples using DEM, focusing on the micro-level behaviour of crushable and non-crushable particles under varying strain rates. The analysis is confined to quasi-static strain rates. Key findings include the following:
1. For non-crushable particles, sensitivity to strain rate is noticeable at lower strains. However, at higher strains, the macroscopic stress response is independent of the loading rate. It is attributed to the rapid formation and dispersal of narrow force chains in high strain rate compression.
2. Crushable aggregates under slow strain rates experience more widespread particle breakage due to homogeneous particle contacts. The crushable sample has reduced strength compared to the non-crushable sample. This is because particle breakage enhances contact numbers, lowering the average contact force and overall strength.
3. In samples subjected to higher rates, breakage primarily occurs in localised regions near the boundaries. This leads to an uneven distribution of contact forces, causing less breakage. Therefore, the material becomes more compact, which in turn induces hardening of the sample.
4. The particle velocity profiles show that high rates promote early localised breakage, and low rates allow for gradual, uniform deformation.
5. The coordination number increases steadily for the low-rate sample due to enhanced particle contact creation whereas it remains steady for the high-rate sample
6. The low-rate sample facilitates early contact-free zone closure due to ample availability of time for the particles, leading to reduced mean contact stress, unlike the high-rate case, where the contact-free zone closes at a much later stage, resulting in localised contact creation near the boundaries.
7. The loading direction affects the fabric tensor alignment for the two rates, with the sample with a low rate of breakage enhancing post breakage particle redistribution in both X and Y directions.
In a nutshell, this study provides a comprehensive understanding of the rate-dependent breakage behaviour in granular media by examining both microscale interactions and their influence on macroscale responses. By incorporating mechanisms such as contact creation, energy dissipation, and energy consumption, the complex dynamics governing the volumetric and strength behaviour of granular materials under different loading rates are explored. The detailed analysis of fabric tensor evolution and coordination number further enhances the understanding of how contact force distribution and particle rearrangement impact the material’s response during crushing. This work, therefore, fills a critical gap in the literature, offering new insights into the interplay between micromechanical processes and macroscopic behaviour in crushable granular media. While the simulations are conducted within a simplified boundary that might not directly mimic the operational conditions of industrial comminution equipment such as ball mills or crushers, the findings of this study could be crucial for predicting wear patterns, optimizing milling efficiency, and designing better crusher geometries. Future research should focus on adapting these DEM insights to dynamic comminution models, where the freedom of particle movement and interaction more closely resembles industrial conditions.

Author Contributions

Conceptualization, S.K.D.; methodology, S.K.D.; Software, S.K.D.; Validation, S.K.D.; formal analysis, S.K.D.; Investigation, S.K.D.; Resources: S.K.D.; Data curation, S.K.D.; writing—original draft preparation, S.K.D.; editing, S.K.D. and H.A.-N.; visualization, S.K.D. and H.A.-N.; supervision, H.A.-N.; project administration, H.A.-N. All authors have read and agreed to the published version of the manuscript.

Funding

This research received no external funding.

Data Availability Statement

Data are contained within the article.

Acknowledgments

The authors sincerely acknowledge the resource support and constructive inputs from Arghya Das from Indian Institute of Technology, Kanpur.

Conflicts of Interest

The authors declare no conflict of interest.

References

  1. Cola, F.D.; Pellegrino, A.; Glößner, C.; Penumadu, D.; Petrinic, N. Effect of Particle Morphology, Compaction, and Confinement on the High Strain Rate Behavior of Sand. Exp. Mech. 2018, 58, 223–242. [Google Scholar] [CrossRef]
  2. Gong, D.; Nadolski, S.; Sun, C.; Klein, B.; Kou, J. The Effect of Strain Rate on Particle Breakage Characteristics. Powder Technol. 2018, 339, 595–605. [Google Scholar] [CrossRef]
  3. Suescun-Florez, E.; Iskander, M. Effect of Fast Constant Loading Rates on the Global Behavior of Sand in Triaxial Compression. Geotech. Test. J. 2017, 40, 52–71. [Google Scholar] [CrossRef]
  4. Lade, P.V.; Karimpour, H. Static Fatigue Controls Particle Crushing and Time Effects in Granular Materials. Soils Found. 2010, 50, 573–583. [Google Scholar] [CrossRef]
  5. Yamamuro, J.A.; Abrantes, A.E.; Lade, P.V. Effect of Strain Rate on the Stress-Strain Behavior of Sand. J. Geotech. Geoenviron. Eng. 2011, 137, 1169–1178. [Google Scholar] [CrossRef]
  6. Gong, G.; Thornton, C.; Chan, A.H.C. DEM Simulations of Undrained Triaxial Behavior of Granular Material. J. Eng. Mech. 2012, 138, 560–566. [Google Scholar] [CrossRef]
  7. Wang, G.; Wang, Z.; Ye, Q.; Zha, J. Particle Breakage Evolution of Coral Sand Using Triaxial Compression Tests. J. Rock Mech. Geotech. Eng. 2021, 13, 321–334. [Google Scholar] [CrossRef]
  8. Kodicherla, S.P.K.; Gong, G.; Fan, L.; Wilkinson, S.; Moy, C.K.S. Discrete Element Modelling of Strength and Critical State Characteristics of Granular Materials under Axial Compression and Axial Extension Stress Path Tests. Particuology 2021, 56, 152–162. [Google Scholar] [CrossRef]
  9. Das, S.K.; Verma, S.K.; Das, A. Numerical Assessment of Effects of Strain Rate on the Critical State of Crushable Sand. Geotech. Lett. 2022, 12, 8–13. [Google Scholar] [CrossRef]
  10. Tian, J.; Lai, Y.; Liu, E.; Yang, Y. A Micromechanics-Based Elasto-Plastic Model for Granular Media Combined with Cosserat Continuum Theory. Acta Geotech. 2022, 17, 2259–2285. [Google Scholar] [CrossRef]
  11. Kim, E.; Stine, M.A.; de Oliveira, D.B.M. Effects of Water Content and Loading Rate on the Mechanical Properties of Berea Sandstone. J. S. Afr. Inst. Min. Metall. 2020, 119, 1077–1082. [Google Scholar] [CrossRef]
  12. Christie, D.; Lackenby, J.; Indraratna, B.; McDowell, G. Effect of Confining Pressure on Ballast Degradation and Deformation under Cyclic Triaxial Loading. Géotechnique 2007, 57, 527–536. [Google Scholar] [CrossRef]
  13. Lyu, H.; Gu, J.; Zhou, J.; Li, B. Mechanical Behavior and Particle Breakage of Calcareous Sand in Triaxial Test. Mar. Geophys. Res. 2023, 44, 18. [Google Scholar] [CrossRef]
  14. Gerolymos, N.; Gazetas, G. A Model for Grain-Crushing-Induced Landslides-Application to Nikawa, Kobe 1995. Soil Dyn. Earthq. Eng. 2007, 27, 803–817. [Google Scholar] [CrossRef]
  15. Cardoso, F.W.; Silva, M.C.; de C. Meira, N.F.; Rabelo Oliveira, R.A.; Bianchi, A.G.C. Advancing Particle Size Detection in Mineral Processing: Exploring Edge AI Solutions; Springer: Cham, Switzerland, 2024; pp. 97–118. [Google Scholar]
  16. Nyembwe, A.M.; Cromarty, R.D.; Garbers-Craig, A.M. Relationship Between Iron Ore Granulation Mechanisms, Granule Shapes, and Sinter Bed Permeability. Miner. Process. Extr. Metall. Rev. 2017, 38, 388–402. [Google Scholar] [CrossRef]
  17. Guimaraes, M.S.; Valdes, J.R.; Palomino, A.M.; Santamarina, J.C. Aggregate Production: Fines Generation during Rock Crushing. Int. J. Miner. Process. 2007, 81, 237–247. [Google Scholar] [CrossRef]
  18. Alhani, I.J.; Albadri, W.M.; Noor, M.J.M.; Lim, S.M.; Alwash, A. Effect of Particle Breakage on Strength Characteristics of Limestone Aggregate. Geotech. Geol. Eng. 2022, 40, 5295–5306. [Google Scholar] [CrossRef]
  19. Harireche, O.; McDowell, G.R. Discrete Element Modelling of Cyclic Loading of Crushable Aggreates. Granul. Matter 2003, 5, 147–151. [Google Scholar] [CrossRef]
  20. Gawenda, T.; Saramak, D. Optimization of Aggregate Production Circuit through Modeling of Crusher Operation. Minerals 2022, 12, 78. [Google Scholar] [CrossRef]
  21. Pacana, A.; Siwiec, D.; Bednarova, L.; Sofranko, M.; Vegsoova, O.; Cvoliga, M. Influence of Natural Aggregate Crushing Process on Crushing Strength Index. Sustainability 2021, 13, 8353. [Google Scholar] [CrossRef]
  22. Beemer, R.D.; Sadekov, A.; Lebrec, U.; Shaw, J.; Bandini-Maeder, A.; Cassidy, M.J. Impact of Biology on Particle Crushing in Offshore Calcareous Sediments. In Proceedings of the Geo-Congress 2019, Philadelphia, 21 March 2019; American Society of Civil Engineers: Reston, VA, USA; pp. 640–650. [Google Scholar]
  23. Wei, X. Mechanical Behavior and Particle Crushing of Marine Carbonate Gravel in Xisha Islands, South China Sea. Eur. J. Environ. Civ. Eng. 2024, 28, 973–992. [Google Scholar] [CrossRef]
  24. Li, X.; Liu, J.; Nan, J. Prediction of Dynamic Pore Water Pressure for Calcareous Sand Mixed with Fine-Grained Soil under Cyclic Loading. Soil Dyn. Earthq. Eng. 2022, 157, 107276. [Google Scholar] [CrossRef]
  25. Liu, L.; Orense, R.P.; Pender, M.J. Crushing-Induced Liquefaction Characteristics of Pumice Sand. In Proceedings of the 2015 Annual Technical Conference on New Zealand Society for Earthquake Engineering (NZSEE), Wellington, New Zealand, 10–12 April 2015; New Zealand Society for Earthquake Engineering: Wellington, New Zealand, 2015; pp. 521–528. [Google Scholar]
  26. Ovalle, C.; Frossard, E.; Dano, C.; Hu, W.; Maiolino, S.; Hicher, P.Y. The Effect of Size on the Strength of Coarse Rock Aggregates and Large Rockfill Samples through Experimental Data. Acta Mech. 2014, 225, 2199–2216. [Google Scholar] [CrossRef]
  27. Xiao, Y.; Meng, M.; Wang, C.; Wu, H.; Fang, Q.; Liu, S. Breakage Critical State of Gravels with Different Gradings. Part I: Experimental Results. Transp. Geotech. 2023, 42, 101087. [Google Scholar] [CrossRef]
  28. Lin, T.-K.; Hsieh, B.-Z. Prevention of Seabed Subsidence of Class-1 Gas Hydrate Deposits via CO2-EGR: A Numerical Study with Coupled Geomechanics-Hydrate Reaction-Multiphase Fluid Flow Model. Energies 2020, 13, 1579. [Google Scholar] [CrossRef]
  29. Zhu, L.; Yang, Q.; Luo, L.; Cui, S. Pore-Water Pressure Model for Carbonate Fault Materials Based on Cyclic Triaxial Tests. Front. Earth Sci. 2022, 10, 842765. [Google Scholar] [CrossRef]
  30. Ahmed, M.M. Effect of Comminution on Particle Shape and Surface Roughness and Their Relation to Flotation Process. Int. J. Miner. Process. 2010, 94, 180–191. [Google Scholar] [CrossRef]
  31. Wang, C.; Sun, C.; Liu, Q. Entrainment of Gangue Minerals in Froth Flotation: Mechanisms, Models, Controlling Factors, and Abatement Techniques—A Review. Min. Metall. Explor. 2021, 38, 673–692. [Google Scholar] [CrossRef]
  32. Wei, H.; Yin, M.; Zhao, T.; Yan, K.; Shen, J.; Meng, Q.; Wang, X.; He, J. Effect of Particle Breakage on the Shear Strength of Calcareous Sands. Mar. Geophys. Res. 2021, 42, 23. [Google Scholar] [CrossRef]
  33. Einav, I. Breakage Mechanics-Part I: Theory. J. Mech. Phys. Solids 2007, 55, 1274–1297. [Google Scholar] [CrossRef]
  34. Tengattini, A.; Das, A.; Einav, I. A Constitutive Modelling Framework Predicting Critical State in Sand Undergoing Crushing and Dilation. Géotechnique 2016, 66, 695–710. [Google Scholar] [CrossRef]
  35. Liu, M.; Wang, F. Numerical Simulation of Influence of Coarse Aggregate Crushing on Mechanical Properties of Concrete under Uniaxial Compression. Constr. Build. Mater. 2022, 342, 128081. [Google Scholar] [CrossRef]
  36. Bubakova, P.; Pivokonsky, M.; Filip, P. Effect of Shear Rate on Aggregate Size and Structure in the Process of Aggregation and at Steady State. Powder Technol. 2013, 235, 540–549. [Google Scholar] [CrossRef]
  37. Karimpour, H.; Lade, P. V Time Effects Relate to Crushing in Sand. J. Geotech. Geoenviron. Eng. 2010, 136, 1209–1219. [Google Scholar] [CrossRef]
  38. Karimpour, H.; Lade, P.V. Creep Behavior in Virginia Beach Sand. Can. Geotech. J. 2013, 1178, 1159–1178. [Google Scholar] [CrossRef]
  39. Augustesen, A.; Liingaard, M.; Lade, P.V.P.V.; Asce, M. Evaluation of Time-Dependent Behavior of Soils. Int. J. Geomech. 2004, 4, 137–156. [Google Scholar] [CrossRef]
  40. Wang, P.; Arson, C. Energy Distribution during the Quasi-Static Confined Comminution of Granular Materials. Acta Geotech. 2018, 13, 1075–1083. [Google Scholar] [CrossRef]
  41. Weerasekara, N.S.; Powell, M.S.; Cleary, P.W.; Tavares, L.M.; Evertsson, M.; Morrison, R.D.; Quist, J.; Carvalho, R.M. The Contribution of DEM to the Science of Comminution. Powder Technol. 2013, 248, 3–24. [Google Scholar] [CrossRef]
  42. Weerasekara, N.S.; Liu, L.X.; Powell, M.S. Estimating Energy in Grinding Using DEM Modelling. Miner. Eng. 2016, 85, 23–33. [Google Scholar] [CrossRef]
  43. He, S.; Shan, H.-F.; Xia, T.-D.; Liu, Z.-J.; Ding, Z.; Xia, F. The Effect of Temperature on the Drained Shear Behavior of Calcareous Sand. Acta Geotech. 2020, 7, 613–633. [Google Scholar] [CrossRef]
  44. Das, S.K.; Das, A. A Critical State Based Viscoplastic Model for Crushable Granular Materials. Soils Found. 2022, 62. [Google Scholar] [CrossRef]
  45. Wang, F.; Sassa, K. Relationship Between Grain Crushing and Excess Pore Pressure Generation by Sandy Soils in Ring-Shear Tests. J. Nat. Disaster Sci. 2000, 22, 87–96. [Google Scholar] [CrossRef]
  46. Li, Y.; Lin, Z.; Li, B.; He, L.; Gong, J. Effects of Gradation and Grain Crushing on the Liquefaction Resistance of Calcareous Sand. Geomech. Geophys. Geo-Energy Geo-Resour. 2021, 7, 1–16. [Google Scholar] [CrossRef]
  47. Sönmezer, Y.B.; Akyüz, A.; Kayabalı, K. Investigation of the Effect of Grain Size on Liquefaction Potential of Sands. Geomech. Eng. 2020, 20, 243–254. [Google Scholar] [CrossRef]
  48. Andò, E.; Viggiani, G.; Hall, S.A.; Desrues, J. Experimental Micro-Mechanics of Granular Media Studied by x-Ray Tomography: Recent Results and Challenges. Géotechnique Lett. 2013, 3, 142–146. [Google Scholar] [CrossRef]
  49. Parab, N.D.; Claus, B.; Hudspeth, M.C.; Black, J.T.; Mondal, A.; Sun, J.; Fezzaa, K.; Xiao, X.; Luo, S.N.; Chen, W. Experimental Assessment of Fracture of Individual Sand Particles at Different Loading Rates. Int. J. Impact Eng. 2014, 68, 8–14. [Google Scholar] [CrossRef]
  50. Kruszelnicka, W.; Macko, M.; Łączny, D.; Bałdowska-Witos, P.; Lewandowski, J. The Use of Simulation Software Using the Discrete Element Method (DEM) for the Process of Materials Comminution. MATEC Web Conf. 2022, 357, 07005. [Google Scholar] [CrossRef]
  51. Cleary, P.W.; Sinnott, M.D.; Morrison, R.D. DEM Prediction of Particle Flows in Grinding Processes. Int. J. Numer. Methods Fluids 2008, 58, 319–353. [Google Scholar] [CrossRef]
  52. Syed, Z.; Tekeste, M.; White, D. A Coupled Sliding and Rolling Friction Model for DEM Calibration. J. Terramech. 2017, 72, 9–20. [Google Scholar] [CrossRef]
  53. Shi, D.; Cao, D.; Xue, J.; Deng, Y.; Liang, Y. DEM Studies on the Effect of Particle Breakage on the Critical State Behaviours of Granular Soils under Undrained Shear Conditions. Acta Geotech. 2022, 17, 4865–4885. [Google Scholar] [CrossRef]
  54. Hanley, K.J.; O’Sullivan, C.; Huang, X. Particle-Scale Mechanics of Sand Crushing in Compression and Shearing Using DEM. Soils Found. 2015, 55, 1100–1112. [Google Scholar] [CrossRef]
  55. Itasca Consulting Group Inc. PFC3D-Particle Flow Code 3 Dimension; Ver. 6.0; User’s Manual; Itasca Consulting Group Inc.: Minneapolis, MN, USA, 2010. [Google Scholar]
  56. Tsoungui, O.; Vallet, D.; Charmet, J.C. Numerical Model of Crushing of Grains inside Two-Dimensional Granular Materials. Powder Technol. 1999, 105, 190–198. [Google Scholar] [CrossRef]
  57. Chen, L.; He, Y.; Yang, Y.; Niu, S.; Ren, H. The Research Status and Development Trend of Additive Manufacturing Technology. Int. J. Adv. Manuf. Technol. 2017, 89, 3651–3660. [Google Scholar] [CrossRef]
  58. Da Cruz, F.; Emam, S.; Prochnow, M.; Roux, J.N.; Chevoir, F. Rheophysics of Dense Granular Materials: Discrete Simulation of Plane Shear Flows. Phys. Rev. E Stat. Nonlinear Soft Matter Phys. 2005, 72, 021309. [Google Scholar] [CrossRef]
  59. Andrade, J.E.; Chen, Q.; Le, P.H.; Avila, C.F.; Matthew Evans, T. On the Rheology of Dilative Granular Media: Bridging Solid- and Fluid-like Behavior. J. Mech. Phys. Solids 2012, 60, 1122–1136. [Google Scholar] [CrossRef]
  60. Das, S.K.; Das, A. Influence of Quasi-Static Loading Rates on Crushable Granular Materials: A DEM Analysis. Powder Technol. 2019, 344, 393–403. [Google Scholar] [CrossRef]
  61. Zheng, W.; Tannant, D.D. Grain Breakage Criteria for Discrete Element Models of Sand Crushing under One-Dimensional Compression. Comput. Geotech. 2018, 95, 231–239. [Google Scholar] [CrossRef]
  62. Lobo-Guerrero, S.; Vallejo, L.E. Application of Weibull Statistics to the Tensile Strength of Rock Aggregates. J. Geotech. Geoenviron. Eng. 2006, 132, 786–790. [Google Scholar] [CrossRef]
  63. Cil, M.B.; Buscarnera, G. DEM Assessment of Scaling Laws Capturing the Grain Size Dependence of Yielding in Granular Soils. Granul. Matter 2016, 18, 1–15. [Google Scholar] [CrossRef]
  64. Laufer, I. Grain Crushing and High-Pressure Oedometer Tests Simulated with the Discrete Element Method. Granul. Matter 2015, 17, 389–412. [Google Scholar] [CrossRef]
  65. McDowell, G.R.; Harireche, O. Discrete Element Modelling of Soil Particle Fracture. Géotechnique 2002, 52, 131–135. [Google Scholar] [CrossRef]
  66. Wang, J.F.; Huang, R.Q. DEM Study on Energy Allocation Behavior in Crushable Soils. Adv. Mater. Res. 2014, 871, 119–123. [Google Scholar] [CrossRef]
  67. Liu, H.Y.; Kou, S.Q.; Lindqvist, P.-A. Numerical Studies on the Inter-Particle Breakage of a Confined Particle Assembly in Rock Crushing. Mech. Mater. 2005, 37, 935–954. [Google Scholar] [CrossRef]
  68. Bagherzadeh, K.A.; Mirghasemi, A.A.; Mohammadi, S.; Bagherzadeh, K.A.; Mirghasemi, A.A.; Mohammadi, S. Numerical Simulation of Particle Breakage of Angular Particles Using Combined DEM and FEM. Powder Technol. 2011, 205, 15–29. [Google Scholar] [CrossRef]
  69. Zhu, F.; Zhao, J. Modeling Continuous Grain Crushing in Granular Media: A Hybrid Peridynamics and Physics Engine Approach. Comput. Methods Appl. Mech. Eng. 2019, 348, 334–355. [Google Scholar] [CrossRef]
  70. Ma, G.; Chen, Y.; Yao, F.; Zhou, W.; Wang, Q. Evolution of Particle Size and Shape towards a Steady State: Insights from FDEM Simulations of Crushable Granular Materials. Comput. Geotech. 2019, 112, 147–158. [Google Scholar] [CrossRef]
  71. Zhang, J.-Z.; Zhou, X.-P.; Zhu, J.-Y.; Xian, C.; Wang, Y.-T. Quasi-Static Fracturing in Double-Flawed Specimens under Uniaxial Loading: The Role of Strain Rate. Int. J. Fract. 2018, 211, 75–102. [Google Scholar] [CrossRef]
  72. Ben-Nun, O.; Einav, I.; Tordesillas, A. Force Attractor in Confined Comminution of Granular Materials. Phys. Rev. Lett. 2010, 104, 108001. [Google Scholar] [CrossRef]
  73. Ben-Nun, O.; Einav, I. The Role of Self-Organization during Confined Comminution of Granular Materials. Philos. Trans. R. Soc. A Math. Phys. Eng. Sci. 2010, 368, 231–247. [Google Scholar] [CrossRef]
  74. Suescun-Florez, E.; Kashuk, S.; Iskander, M.; Bless, S. Predicting the Uniaxial Compressive Response of Granular Media over a Wide Range of Strain Rates Using the Strain Energy Density Concept. J. Dyn. Behav. Mater. 2015, 1, 330–346. [Google Scholar] [CrossRef]
  75. Einav, I. Breakage Mechanics-Part II: Modelling Granular Materials. J. Mech. Phys. Solids 2007, 55, 1298–1320. [Google Scholar] [CrossRef]
  76. Lade, P.V.; Yamamuro, J.A.; Bopp, P.A. Significance of Particle Crushing in Granular Materials. J. Geotech. Geoenviron. Eng. 1997, 123, 889–890. [Google Scholar] [CrossRef]
  77. Kruyt, N.P.; Rothenburg, L. Shear Strength, Dilatancy, Energy and Dissipation in Quasi-Static Deformation of Granular Materials. J. Stat. Mech. Theory Exp. 2006, 2006, P07021. [Google Scholar] [CrossRef]
  78. Das, S.K.; Das, A. Strain-Rate Dependent Energy Redistribution during Isotropic Confined Comminution. Géotechnique Lett. 2020, 10, 542–549. [Google Scholar] [CrossRef]
  79. Hanley, K.J.; Huang, X.; O’Sullivan, C.; Kwok, F. Challenges of Simulating Undrained Tests Using the Constant Volume Method in DEM. AIP Conf. Proc. 2013, 1542, 277–280. [Google Scholar] [CrossRef]
Figure 1. (a) DEM working algorithm. (b) Adopted contact laws for normal and shear directions.
Minerals 14 01102 g001
Figure 2. Initial 2D DEM sample with arrows showing the direction of application of load.
Minerals 14 01102 g002
Figure 3. Calibration of DEM input parameters from experimental analyses [61]: (a) stress–strain response; (b) grain size distribution.
Minerals 14 01102 g003
Figure 4. (a) Breakage methodology. (b) Intact sample. (c) Crushed sample after compression.
Minerals 14 01102 g004
Figure 5. (a) Macroscopic axial stress–strain variation; (b) void ratio vs. mean stress plot for non-crushable and crushable samples for two strain rates.
Minerals 14 01102 g005
Figure 6. (a) Grain size distribution plots and particle counts at different strain levels. Breakage evolution; (b) initial sample; (c) at strain 4.4% for low rate; (d) zoomed image showing multiple generation of particles for low rate; (e) at strain 4.4% for high rate.
Minerals 14 01102 g006
Figure 7. Probability distribution of normal contact force at 0.02 strain: (a) non-crushable sample and (b) crushable sample; at strain 0.044: (c) non-crushable and (d) crushable sample.
Minerals 14 01102 g007
Figure 8. CFD at 2% strain for (a) low and (b) high rate; at 581 kPa for (c) low and (d) high rate.
Minerals 14 01102 g008
Figure 9. Variation in grain-scale particle contacts at 1%, 2.8%, 3.4%, and 4.4.% strain for (a) low rate and (b) high rate, highlighting contact-free zones for crushable samples.
Minerals 14 01102 g009
Figure 10. (a) Energy consumption during loading. (b) Frictional dissipation for two strain rate in the crushable sample.
Minerals 14 01102 g010
Figure 11. Particle velocity profile at 1%, 2.8%, 3.4%, and 4.4.% strain for (a) low rate and (b) high rate for crushable sample.
Minerals 14 01102 g011
Figure 12. Coordination number variation for (a) low rate and (b) high rate at different strain levels for crushable sample.
Minerals 14 01102 g012
Figure 13. Fabric tensor evolution in Y direction for low rate and high rate at strain (a) 1%, (b) 2.4%, (c) 3.4%, and (d) 4.4%.
Minerals 14 01102 g013aMinerals 14 01102 g013b
Figure 14. Fabric tensor evolution in X direction for low rate and high rate at strain (a) 1%, (b) 2.4%, (c) 3.4%, and (d) 4.4% for low- and high-rate crushable samples.
Minerals 14 01102 g014aMinerals 14 01102 g014b
Figure 15. Fabric tensor evolution in (a) X and (b) Y direction for low rate and high rate.
Minerals 14 01102 g015aMinerals 14 01102 g015b
Table 1. Properties of DEM model parameters.
ParameterValue
Grain   density   ρ   ( kg / m 3 )2650
Initial grain diameter (d) (m)0.001–0.003
Initial   porosity     ( n 0 ) 0.2
Number of grains1932
Shear   and   Normal   stiffness   k n &   k s  (N/m) 1 × 10 9
Friction   μ 0.5
Weibull modulus (m)4.0
Material strength * ( σ fM ) (MPa)14.5
* Material strength is taken as 900 MPa for non-crushable sample.
Disclaimer/Publisher’s Note: The statements, opinions and data contained in all publications are solely those of the individual author(s) and contributor(s) and not of MDPI and/or the editor(s). MDPI and/or the editor(s) disclaim responsibility for any injury to people or property resulting from any ideas, methods, instructions or products referred to in the content.