Article

The Paleoproterozoic Raimunda Porphyry-Type Gold Deposit, Juruena Mineral Province, Amazonian Craton (Brazil): Constraints Based on Petrological, Fluid Inclusion and Stable Isotope Data

by
Adriana Araujo Castro Lopes
1,2,* and
Márcia Abrahão Moura
1
1
Universidade de Brasília (UnB), Instituto de Geociências, Campus Universitário Darcy Ribeiro, Brasília 70910-900, DF, Brazil
2
Universidade Federal do Oeste do Pará (UFOPA), Campus Universitário de Juruti, Juruti 68170-000, PA, Brazil
*
Author to whom correspondence should be addressed.
Minerals 2024, 14(12), 1185; https://doi.org/10.3390/min14121185
Submission received: 21 September 2024 / Revised: 16 November 2024 / Accepted: 17 November 2024 / Published: 21 November 2024

Abstract

:
The Juruena Mineral Province is an emerging world-class mineral province in the southern Amazonian Craton, due to numerous Au-Cu and base metal deposits, such as the Raimunda deposit, related to Novo Mundo 2.03–1.98 Ga I-type calc-alkaline granites. Its hydrothermal alteration zones comprise Na-metasomatism, microclinization, propylitic and sericitic alteration, silicification, a sulfide stage, and late carbonate alteration. The disseminated mineralization, associated with the sulfide stage, the main mineralization stage, is represented by gold inclusions and fracture-filling grains in pyrite, chalcopyrite, and Cu-Bi sulfides. Chlorite geothermometer and fluid inclusion data indicate temperature conditions of 325–380 °C for the mineralization. The coexistence of high-temperature aqueous and aqueous-carbonic fluid inclusions, based on a microthermometric study of fluid inclusions, reveals a mixing of medium-saline hot fluids with cooler and low-saline fluid. The δ18Ofluid (3.11–7.86‰) and δ34Spy data (−1.4–0.1‰) are coherent to the magmatic origin of the mineralizing fluid. Gold was initially transported as chlorine complexes in a hot, high-salinity, acidic, and oxidized fluid from the magma chamber, and later as H2S complexes. The chemical-physical instability during fluid ascent is interpreted as a triggering factor for ore precipitation. The results offer valuable insights into the genesis of porphyry–Au deposits and their implications for prospecting in the Amazonian Craton.

Graphical Abstract

1. Introduction

The Amazonian Craton (Brazil) has undergone a series of calc-alkaline granitogenic events over its geological history, some of which led to gold and other metal mineralization [1]. The Tapajós and Juruena Mineral provinces are the major metallogenic provinces in Brazil, located in the southern Amazonian Craton. The Juruena Province, especially, has been an important gold producer in the country. Its main mineralization is predominantly spatially and temporally related to Paleoproterozoic calc-alkaline granites formed in volcanic-arc settings [2,3,4,5].
In the Juruena Mineral Province, mainly in the surroundings of the cities Nova Santa Helena, Peixoto de Azevedo, Matupá, Guarantã do Norte, and Novo Mundo, primary gold mineralization associated mainly with granite systems and, subordinately, with volcanic sequences occur either disseminated or hosted into veins and stockwork-veins [5,6].
The emplacement of these bodies into continental magmatic arcs has been essential for forming disseminated, vein-type, and Au ± Cu ± base metals stockwork-type magmatic-hydrothermal systems. The systematic and integrative study of these orebodies points out to a magmatic-hydrothermal model comparable to that of porphyry gold deposits [7], low-, intermediate-, and high-sulfidation epithermal systems [8], and structurally controlled [9] placed at variable crustal levels.
The Novo Mundo granite complex, which hosts the Raimunda deposit, the main object of this study, is in the homonymous municipality in the mid-northern region of the state of Mato Grosso, east of the Juruena Mineral Province. This granite body hosts several mineral deposits, including the Raimunda deposit, located in its northwestern region.
The percolation of hydrothermal fluids promotes anomalous and systematic mineralogical and geochemical changes in the host rocks, the extent and magnitude of which depend on their alteration state, porosity, permeability, and degree of chemical reactivity of the host rocks. The fluid-rock interaction generates alteration footprints that may assist in determining the exploratory guides in mature terrains [10].
Despite recent advances in knowledge about Proterozoic mineralizing events in the Amazonian Craton, prospecting complex Paleoproterozoic gold-copper deposits in Juruena Mineral province is a challenge, especially due to the few studies that have investigated the origin of mineralizing fluids using stable isotopic data to constrain the genesis of mineral deposits in the southern region of the Amazonian Craton.
This paper integrates new petrological (i.e., drill core samples, whole-rock assay results), ore mineral chemistry (e.g., chlorite, muscovite, sulfides and gold), fluid inclusion, and stable isotope data (O and S) from a preserved Paleoproterozoic deposit, located in the southern Amazonian Craton, and proposes a metallogenetic model for the Raimunda deposit and other analogous deposits in Brazil and worldwide.

2. Geological Settings

The Amazonian Craton has been a tectonically stable area since the Grenvillian Orogeny (1.2 Ga). It has been understood for decades as the result of the successive amalgamation of accretionary arcs from the Archean to the Paleo- and Mesoproterozoic [11,12]. However, newer alternative concepts and models have been proposed based on new isotopic and geophysical data (Figure 1).
Based on the progressively younger igneous bodies striking NE, at 1.88 Ga, the central region of the Amazonian Craton underwent a period of flat-slab subduction, which caused the migration of arc-related units towards the Central Amazonian block [13]. The sequence related to the Paleoproterozoic Tapajós Province arc was developed on an Archean basement and the well-defined E-W-striking lineament, which extends from the Tapajós Province to the Carajás Province and represents the ancient cratonic basement [14]. The lack of fold belts and/or metamorphic terranes, as well as the orogenic and post-orogenic tectonics, led Juliani et al. [15] to suggest weakly extensional to slightly compressive settings for the region.
Magnetotelluric profiles carried out in the eastern region of the province found a high-resistivity anomaly approximately 20 km deep, which is ascribed to the Peixoto de Azevedo Domain, surrounded by conductive anomalies related to the Statherian magmatism and mafic enclaves [16]. Furthermore, this domain presents a controversial tectonic evolution linked to long-lived shear deformation comparable to that of the Tapajós Province [17].
In the southern segment of the Amazonian Craton, there are two extensive Paleoproterozoic domains: an older one, named Peixoto de Azevedo (2.05 to 1.98 Ga), and a younger one, named Juruena (1.85–1.75 Ga). The Peixoto de Azevedo Domain comprises the Cuiú-Cuiú Magmatic Arc and post-magmatic arc rocks, mainly composed of Paleo- to Mesoproterozoic volcano-plutonic sequences formed in arc settings [6,18,19].
The eastern segment of the Juruena Province is mainly composed of oxidized, medium- to high-K calc-alkaline, volcanic-plutonic, and meta- to peraluminous rocks. These rocks mostly belong to the magnetite series (I-type granites) and are volcanic, subvolcanic, and alkaline granites [20].
Figure 1. Geological and tectonic environment of the Juruena Mineral Province in the Amazonian Craton, based on [5,21]. Geochronological provinces based on [11].
Minerals 14 01185 g001

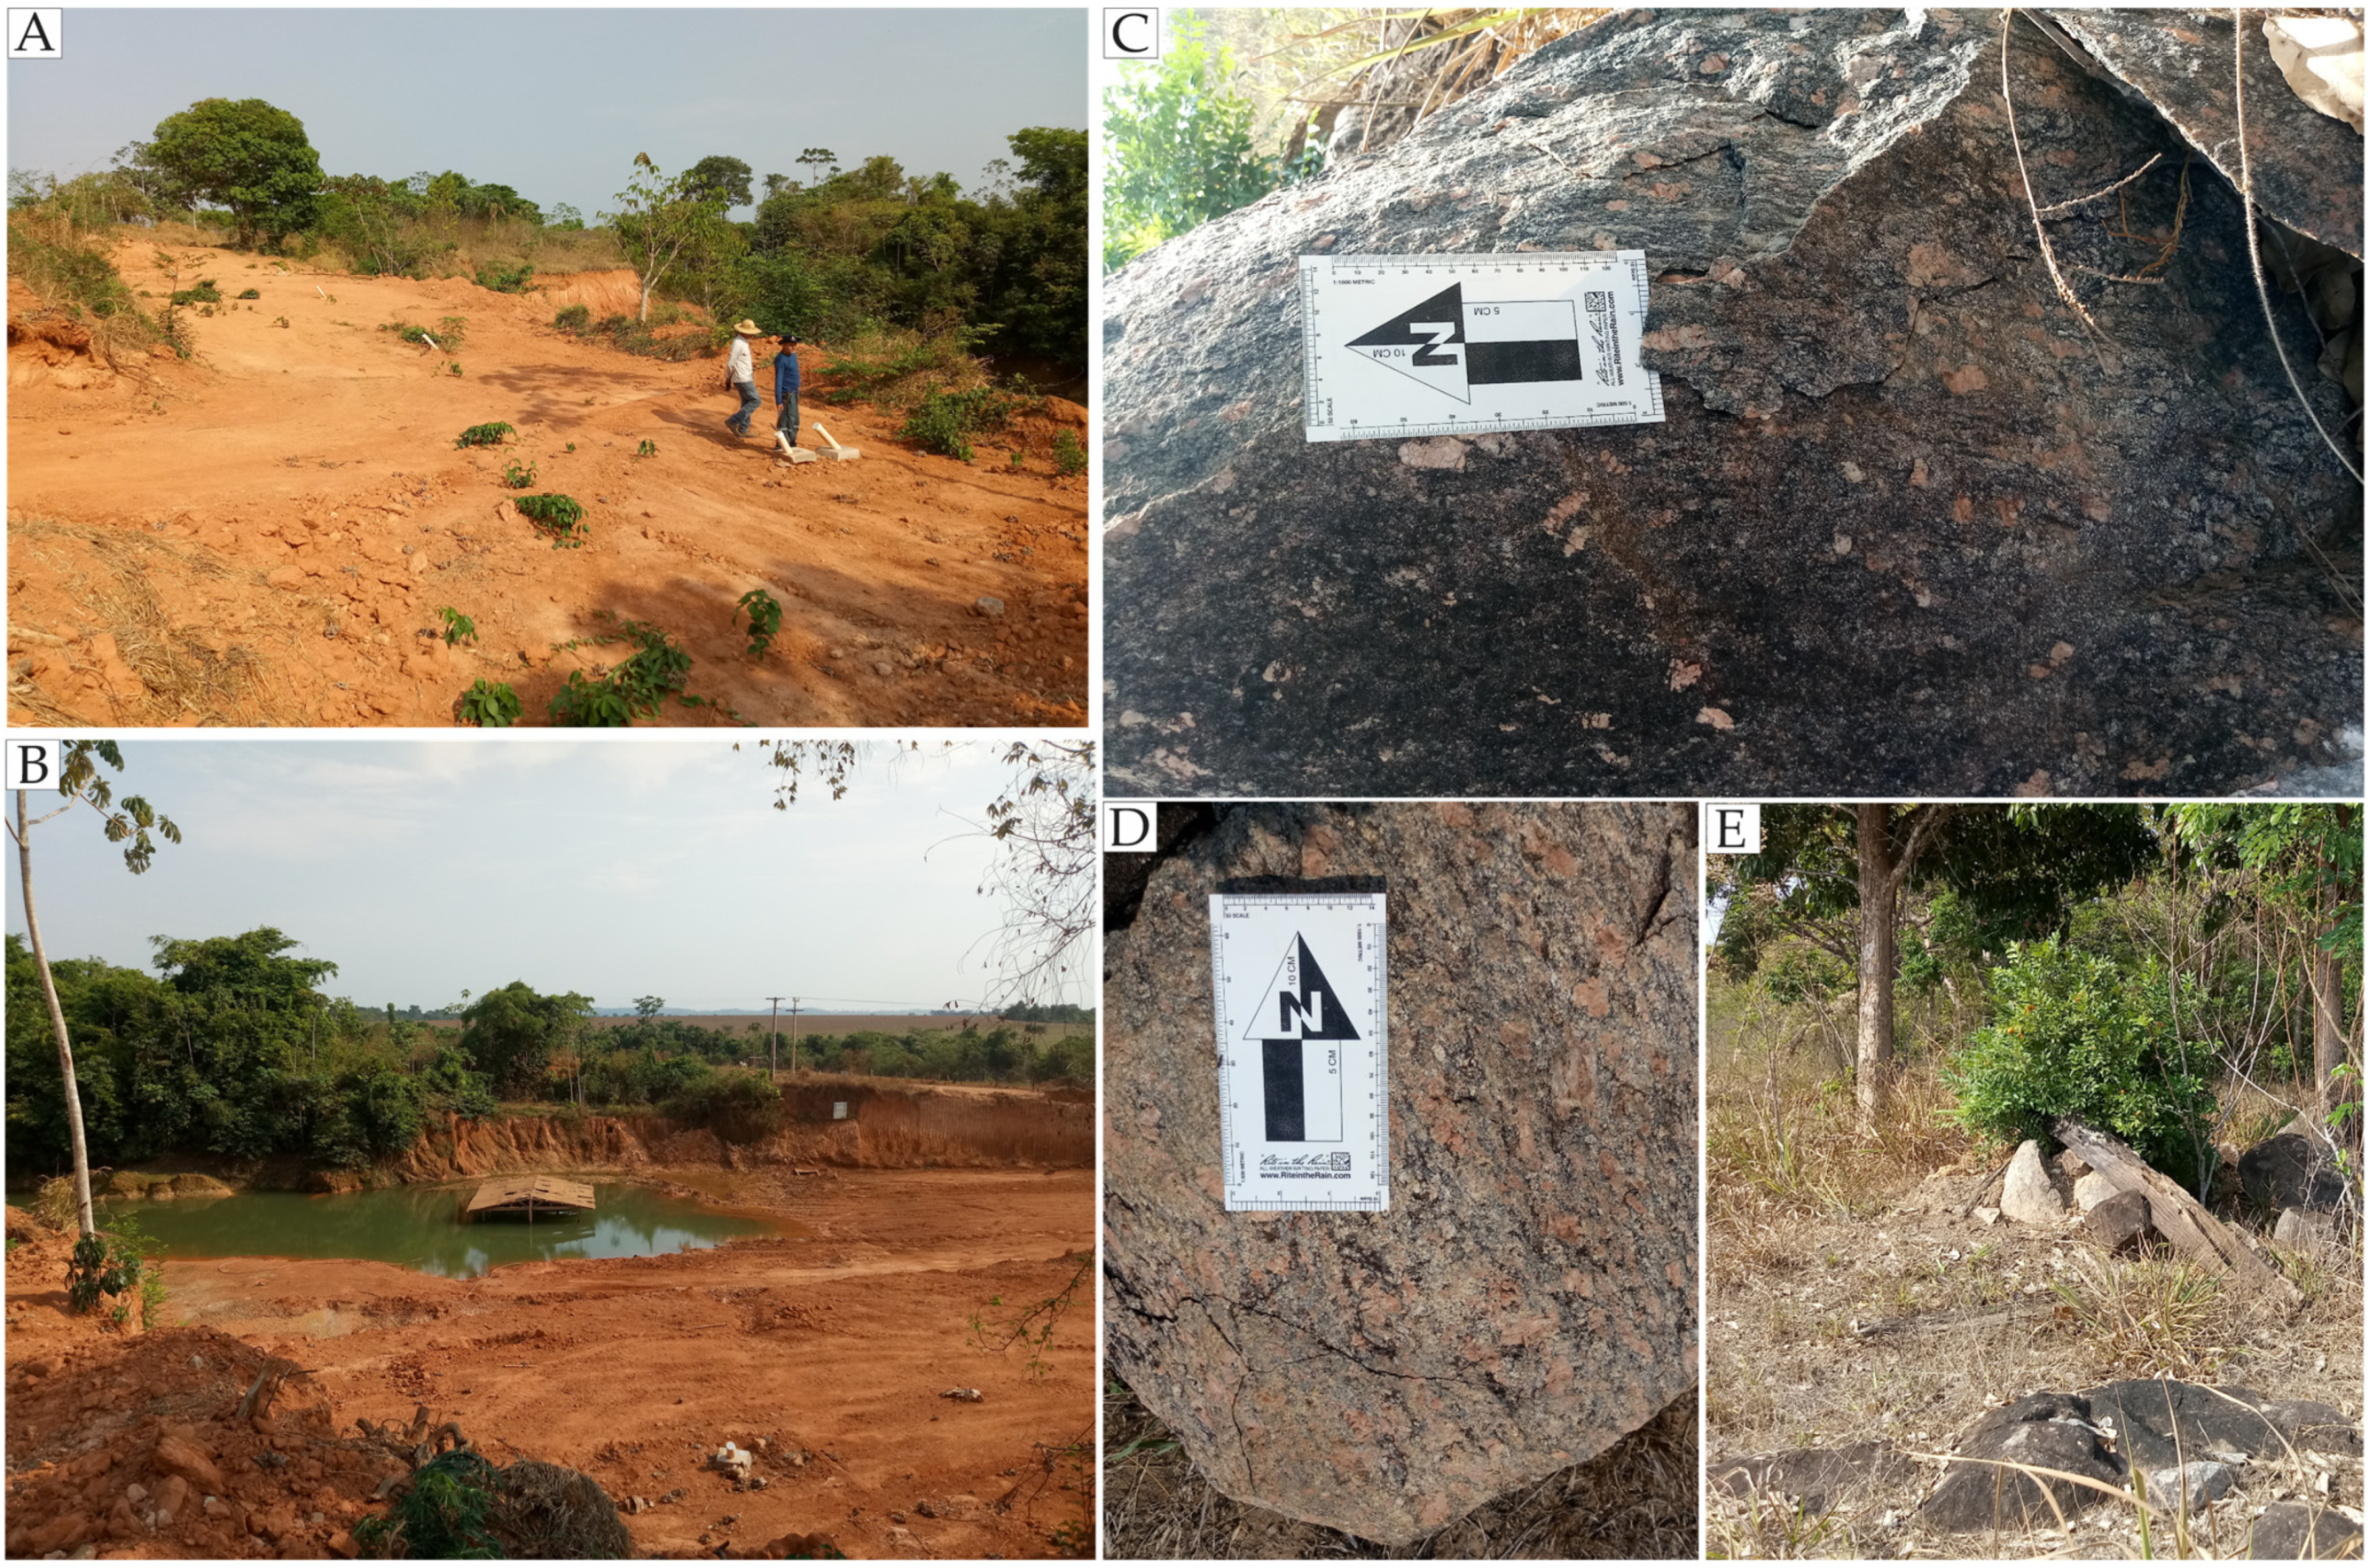
2.1. Geology of the Deposit

The exploration area of Novo Mundo Paleoproterozoic Complex exhibits surface coverage that contains dozens of mineral deposits that host Paleoproterozoic Au mineralization [22], Au-Cu-Mo [9], and Cu [23] along a NW-SE-striking lineament.
The Novo Mundo complex intrudes Cuiú-Cuiú Archean rocks (granitic- to tonalitic gneisses and migmatites) and shows U–Pb data between 2.03 and 1.98 Ga [24]. It has an approximately 60-km diameter and is composed mainly of granites, along W-NW, which is compatible with the preferred orientation of the major regional lineaments mapped from the oldest terranes in that region [3], although there is no evidence of structural controls [19].
The Raimunda deposit is associated with monzonite, biotite granodiorite, monzogranite and syenogranite facies. The last two are the main host rocks of the deposit. The granites are cut by dikes of basaltic–andesite and andesite compositions.
The overview of the deposit is shown in Figure 2A,B, with a detailed view of the open-pit constructed by artisanal miners in the late 1990s and early 2000s for ore extraction. Figure 2C–E show rare blocks of outcrops classified as syenogranite, monzogranite and mafic bodies, respectively, all found around the deposit. Contact between the granitic facies is rarely observed. In drill holes, subangular to rounded microgranular enclaves are locally registered, especially monzonite enclaves into syenogranite.
Although the study area is in a region with local NW-SE-striking ductile-brittle shear zones (Novo Mundo Shear Zone–NMSZ) [25], which host several gold-bearing mineral deposits in the eastern region of the Juruena Mineral Province [6] and display a high density of microfractures, the rocks of the Raimunda deposit have not undergone significant deformation. The strongly fractured and crushed appearance of the minerals results from the action of the hydrothermal system over those rocks. Centimeter-to-millimeter-thick veins and veinlets are mostly non-oriented and contain alteration minerals (e.g., quartz, chlorite, muscovite, epidote, calcite, pyrite and rutile).

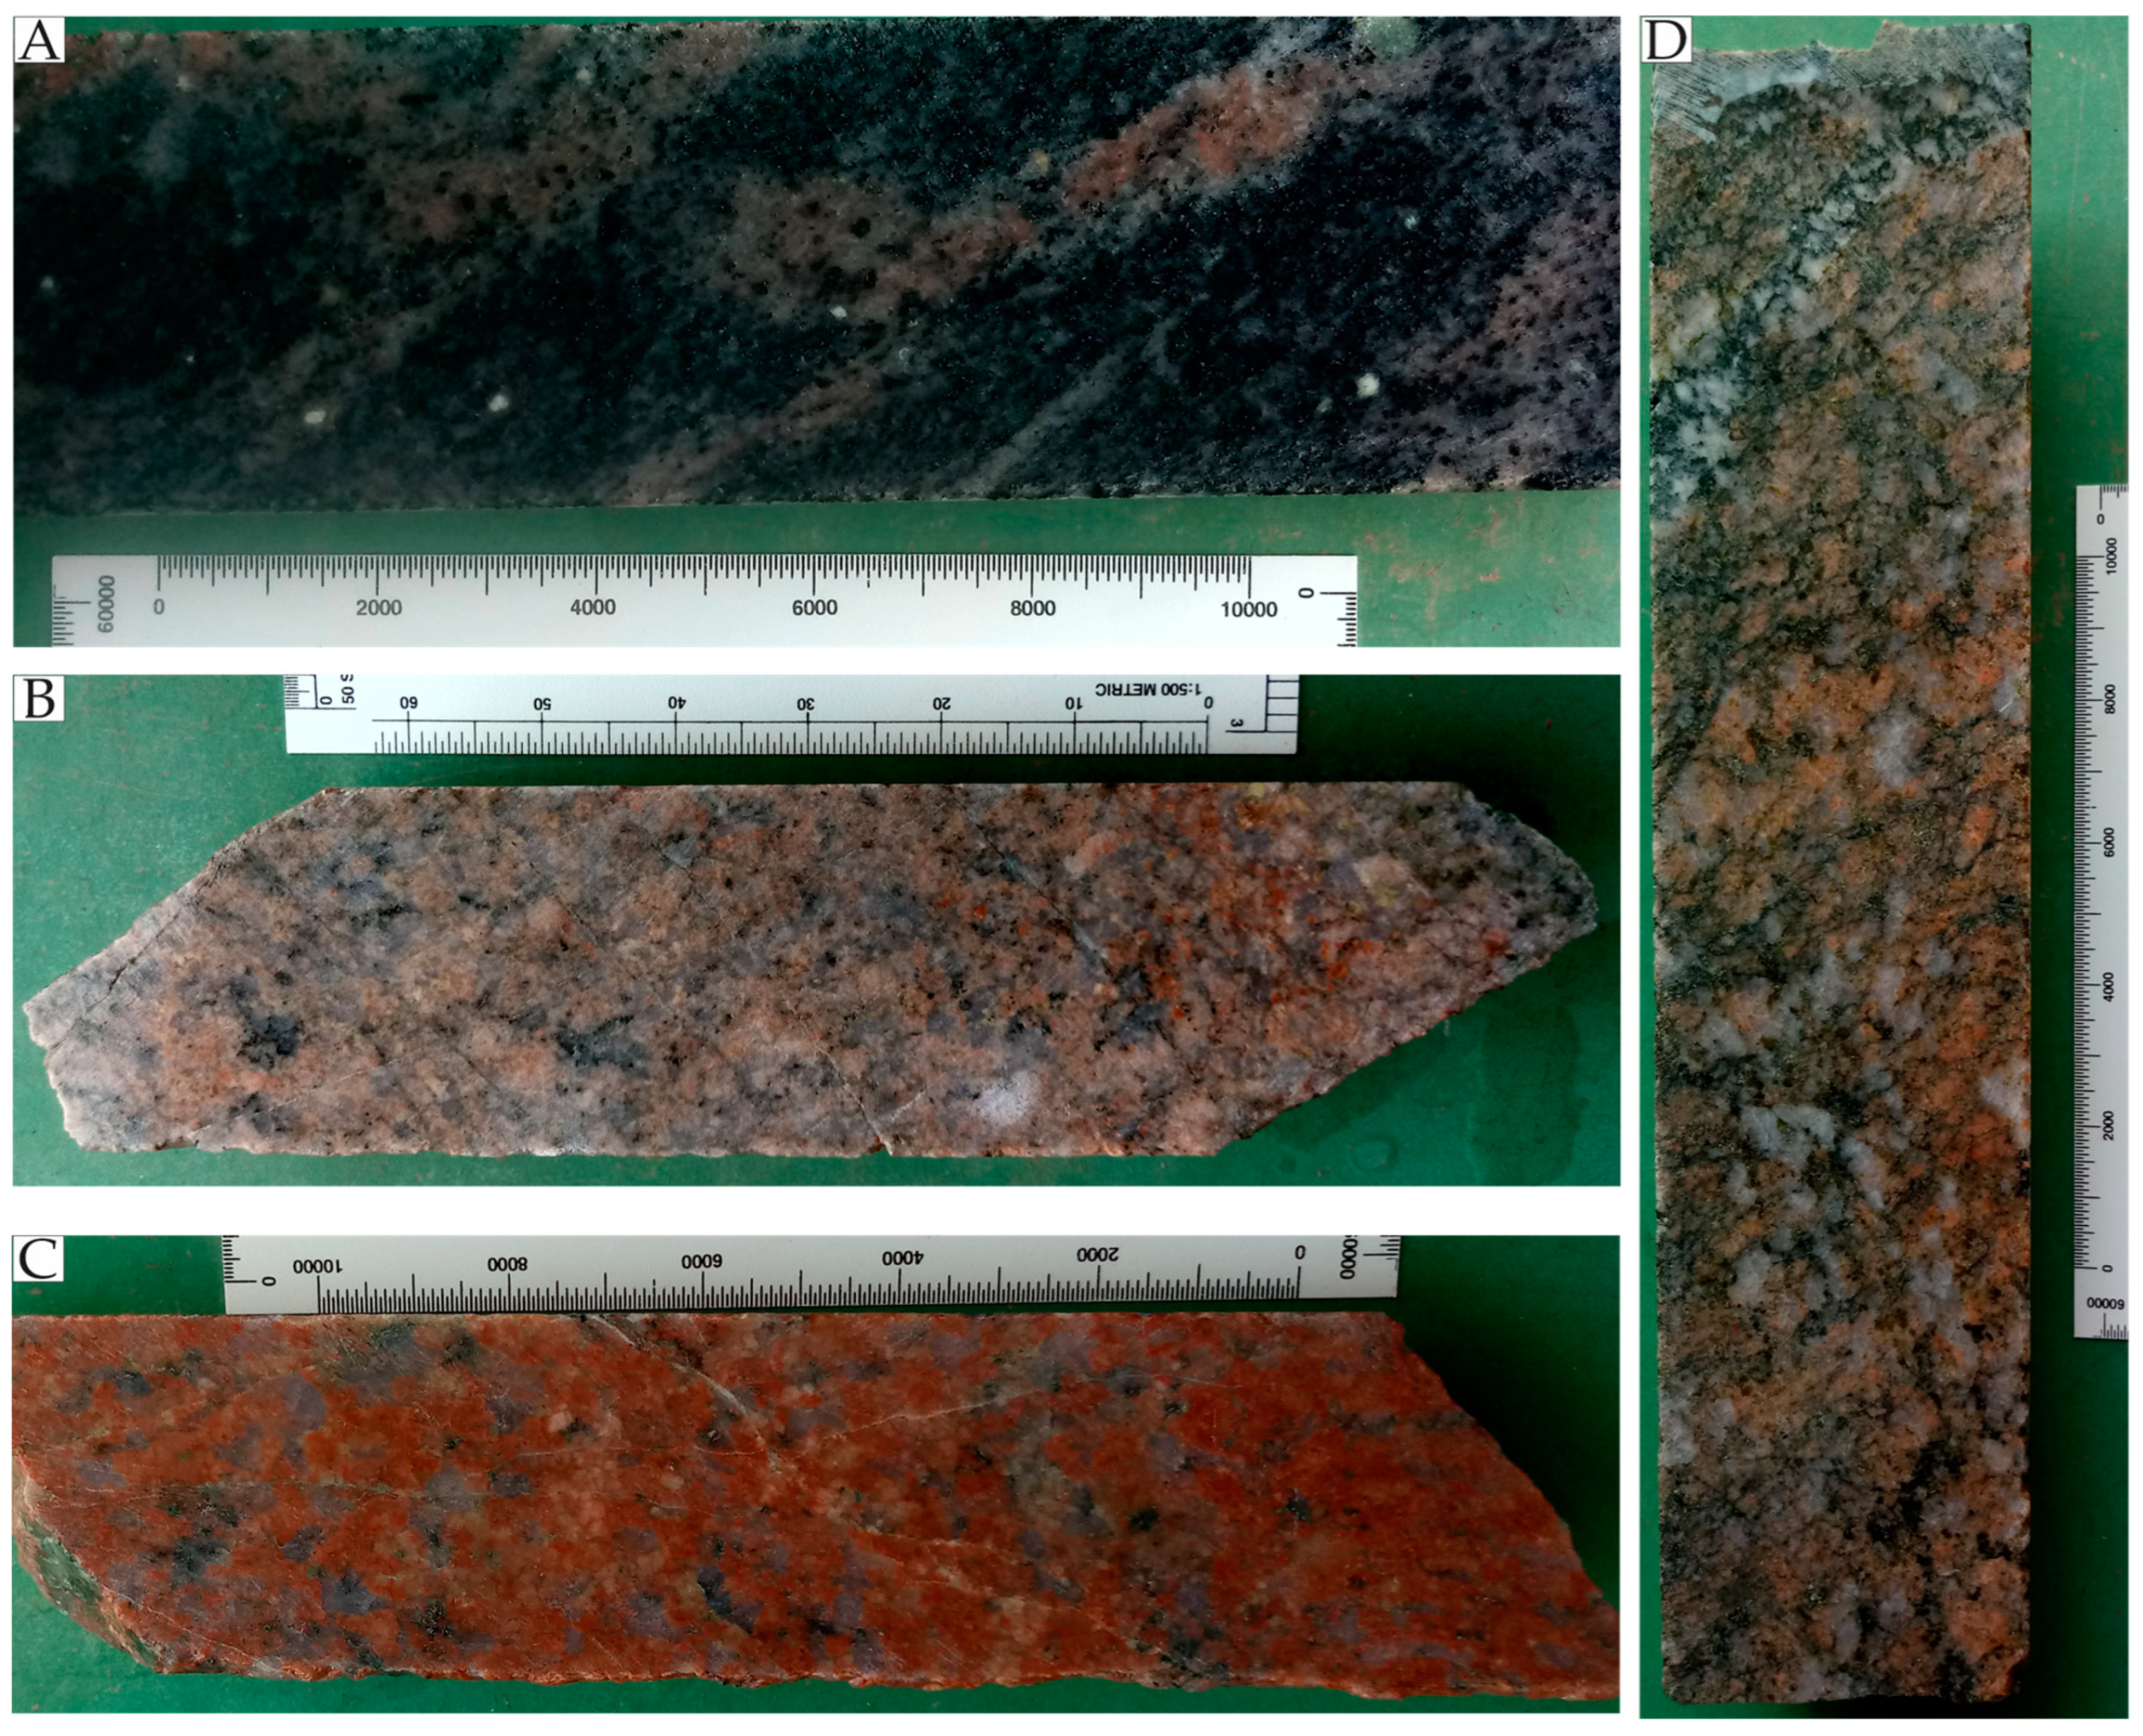
2.1.1. Monzonite Facies

The monzonite is dark gray, medium-grained, inequigranular, and exhibits a phaneritic texture (Figure 3A). It contains andesine crystals (An40–30 tending to An25) (20–25%), orthoclase (18–20%), quartz (18–20%), biotite (3–5%), and hornblende (2–5%). Accessory minerals are magnetite (2%), titanite (1%), apatite 1%), and zircon (<0.1%), as well as hydrothermal minerals, such as epidote (1–2%), chlorite, muscovite, and carbonate (~5%) (Figure 4A).

2.1.2. Monzogranite Facies

The monzogranite is the more representative facies of the deposit. It has a greenish-gray color and is composed of quartz (25–30%), albite (15–20%), orthoclase (20–25%), and biotite (3–5%); accessory minerals (magnetite < 1%), and hydrothermal minerals (muscovite, chlorite, carbonate, epidote, and rutile, 12–15%) (Figure 3B). Microtextures show widespread veins and veinlets through the rock in association with potassic alteration (Figure 4B–D). Locally, open-space filling textures (“comb texture”) are also observed, especially proximal to or in sulfide-bearing strongly hydrothermalized zones. Quartz megacrysts (0.5–3 mm) are restricted to strongly silica-altered zones (Figure 4B).

2.1.3. Syenogranite Facies

The syenogranite is reddish to pinkish and, in places, displays a porphyritic texture with quartz megacrystals/phenocrysts (Figure 3C). It is composed of quartz (30–35%), orthoclase (20–25%), albite (15–20%), and biotite (1–2%). Accessory magnetite (<1%), apatite (<0.1%), and zircon (<0.1%) feature as inclusions in quartz, plagioclase, and potassium feldspar. Muscovite, carbonate, and epidote commonly replace feldspar and plagioclase (12–15%) (Figure 4F,G). These samples also contain quartz megacrystals (0.5–3.5 mm) in strongly silicified zones, which are similar to those of monzogranites.

2.1.4. Granodiorite Facies

The granodiorite is greyish, medium-grained, composed of quartz (25–30%), andesine (An40–30 tending to An25) (25–30%), orthoclase (15–20%), biotite (2–5%), and hornblende (1–3%) (Figure 3D). The accessory minerals are magnetite (1–3%), titanite (1%), apatite (<0.1%), and zircon (<0.1%); and the secondary minerals are muscovite, carbonate, epidote, and rutile (10–12%) (Figure 4E).

3. Materials and Methods

3.1. Fieldwork, Sampling, and Petrography

Three fieldwork campaigns were carried out for mapping and sampling. In total, 80 samples were collected for petrographic analysis to identify the main gangue and ore mineral associations of hydrothermal alteration and ore-bearing zones, as well as their patterns and styles [26,27]. This enables a better understanding of their evolution throughout time in the system.
The polished thin sections and polished sections were made at the thin-section laboratory of the Geosciences Institute of the University of Brasília (LABLAM-UnB). The doubly polished thin sections were made at the thin-section laboratory of the Petrografia-BR company (Contagem–MG). The petrographic descriptions were carried out at the Microscopy Laboratory of the UnB Geosciences Institute using an Olympus BX-50 petrographic microscope (Olympus Corporation, Tokyo, Japan), as well as at the UnB Fluid Inclusions Laboratory (LIF-UnB) using an Olympus BX-50 petrographic microscope.

3.2. Electron Microprobe

The mineral chemistry analyses were determined using a JEOL® JXA-8230 Electron Probe Micro-analyzer (EPMA) (JEOL Ltd., Tokyo, Japan), at the Institute of Geosciences, University of Brasília. For silicates, the chemical analyses were obtained using an acceleration voltage of 15 kV, a beam current of 10 nA, and a nominal beam diameter of 1 μm in the spot mode. The counting time for each element during the analysis was 10 s on the peak and 5 s on the background. Interference correction was implemented for Ti and V. Matrix effects were corrected using an in-house ZAF program. The natural and synthetic calibration standards used were albite (Na), forsterite (Mg), orthoclase (Al, Si, K), topaz (F), vanadinite (Cl, V), apatite (P), andradite (Ca, Fe), pyrophanite (Ti, Mn), barite (Ba), Ni oxide (Ni), and vanadinite (V).
For the sulfides and gold, an accelerating voltage of 20 kV, a beam current of 20 nA, and a counting time of 10 s, except for selenium (25 s) were used; the counting time for backgrounds was always half of the used-on peaks values. The X-ray Kα-lines were used for sulfur, selenium, copper, iron, nickel, and cobalt; Lα for arsenic, silver, antimony, palladium, cadmium, tellurium, and molybdenum; and Mα for lead, mercury, gold, and platinum; Mα and Mβ were used for bismuth. The natural minerals applied as standards in both electron probes were pyrite (Fe, S), chalcopyrite (Cu), galena (Pb), and stibnite (Sb), and the native elements gold, silver, platinum, palladium, bismuth, copper, and antimony. The synthetic standards were gallium arsenide (As), zinc selenide (Zn, Se), and cinnabar (Hg). The following detection limits were obtained (in wt.%): 0.018 for gold, 0.012 for silver, 0.008 for palladium, 0.016 for platinum, 0.032 for bismuth, 0.025 for lead, 0.016 for copper, 0.013 for iron, 0.017 for mercury, 0.025 for arsenic, 0.009 for antimony, 0.017 for selenium, 0.005 for sulfur, 0.012 for cadmium, 0.013 for nickel and cobalt, 0.017 for tellurium, and 0.030 for molybdenum.

3.3. Chlorite Geothermometry

The studies of formation temperature and pressure conditions at the Raimunda deposit were complemented using a chlorite-independent geothermometer. The structural formulas of chlorite and muscovite were calculated based on 28 and 11 oxygen atoms, respectively. The temperatures are based on the cationic proportion of tetrahedral aluminum (AlIV) in chlorites, which allows the crystallization temperature to be calculated using the following equation: T (°C) = 321.98 × (AlIV/2) − 61.92 [28,29]. In total, 18 analyses of chlorite were carried out on carbon-coated polished thin sections at the LME-UnB using a JEOL® JXA-8230 EPMA (JEOL Ltd., Tokyo, Japan). The WDS operated under the conditions of an acceleration voltage of 15 Kv, a beam current of 10 nA, and a count time of 10 s.

3.4. Fluid Inclusions

The study of fluid inclusions was performed on doubly polished thin sections from six different mineralized samples. Petrography of fluid inclusions was carried out at room temperature (±25 °C) under a Zeiss Axioplan 2 petrographic microscope (Zeiss, Oberkochen, Germany) according to the criteria of [30,31,32].
Microthermometric measurements were obtained with a LINKAM THMSG600 heating-freezing system (Linkam Scientific, Salfords, Surrey, UK) mounted on an Olympus BX-50 petrographic microscope (Olympus Corporation, Tokyo, Japan), at the UnB Fluid Inclusions Laboratory (LIF-UnB). Rock fragments were observed at variable temperatures between −195 °C and 600 °C under a 10× to 100× objective lens following the procedures of [31].
The calibration was carried out using synthetic H2O–NaCl two-phase and H2O–CO2 three-phase fluid inclusions at speed rates of 2 to 15 °C/min, with an estimated accuracy of ±0.5 °C for freezing (±25 at −150 °C), and ±2 °C for heating (above 350 °C).

3.5. Stable Isotopes

The study of stable isotopes was performed on minerals of representative mineralized samples from the Raimunda deposit. Sample selection and sample preparation took place at the sample preparation laboratory at the University of Brasília (LPA-UnB). The pure mineral concentrates were handpicked under a binocular microscope at LME-UnB.
Analyzes were performed at the Queen’s Facility for Isotope Research (QFIR) laboratory at Queen’s University, Ontario, Canada. Results are reported as delta (δ) values per mil (‰) relative to V-SMOW (Vienna Standard Mean Ocean Water) for oxygen, and V-CDT (Canyon Diablo Troilite) for sulfur.
Oxygen isotope data were obtained for nine samples, between 20 and 28 mg each, using the Thermo Finnigan Delta V Advantage and Finnigan Delta XP mass spectrometers (Thermo Fisher Scientific, Waltham, MA, USA). The analytical protocol applies the laser fluorination method to release oxygen from minerals through the reaction with BrF5 by using a CO2 laser as a heat source. It is then either converted into CO2 through the reaction with graphite at 750 °C, or it is collected as O2 in a molecular sieve and analyzed as O2. The analytical uncertainties for δ18O were lower than 0.1 and 0.16‰.
For sulfur, six samples of pyrite were prepared, each weighing between 80 and 95 mg. For this analysis, the SO2 produced through combustion of about 0.5 mg of sample is loaded into tin capsules reacting at 1080 °C. The gases were transported through current and reduced by contact with high-purity copper wires. The SO2 was eventually measured using gas chromatography. Analyzes were performed using a Flash Elemental Analyzer (EA) coupled with a ThermoFisher MAT 253 Isotope Ratio Mass Spectrometer (IRMS) (Thermo Fisher Scientific, Waltham, MA, USA). Analytical uncertainties are estimated at 0.2‰.

4. Results

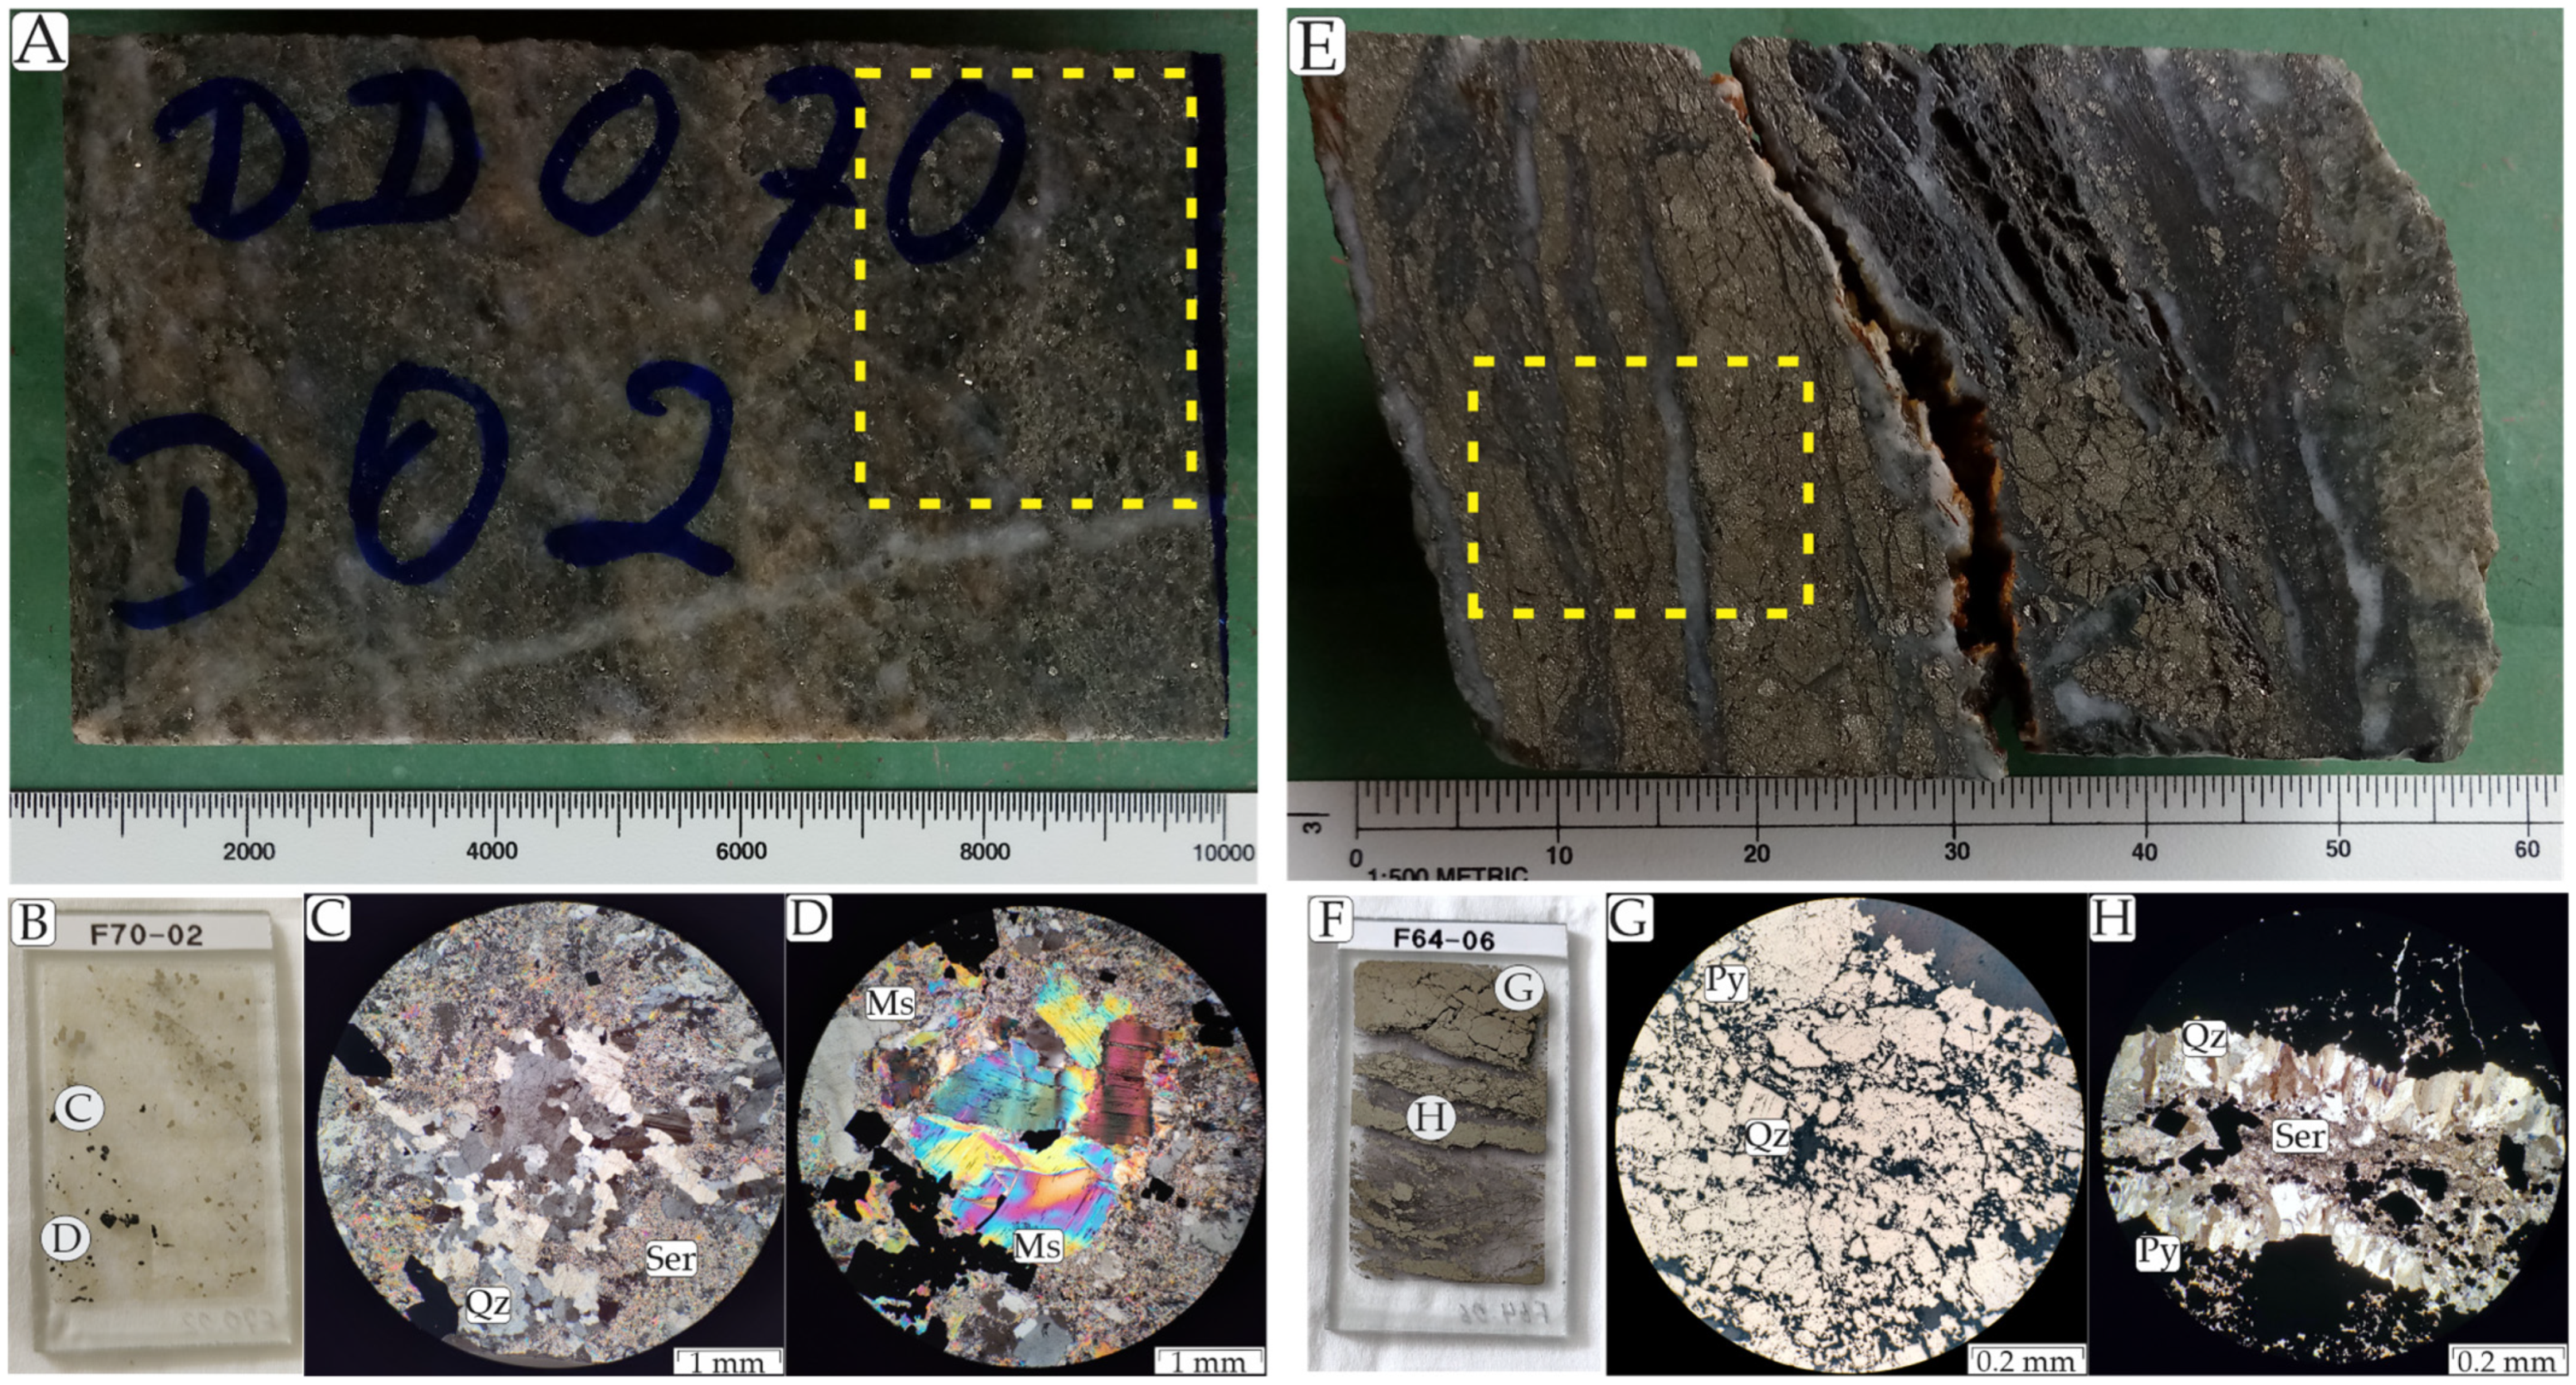
4.1. Hydrothermal Alteration and Mineralization

The Au (±Cu) Raimunda deposit sits in the NW of the Novo Mundo Complex, being hosted by variably hydrothermally altered granite facies (i.e., monzonite, biotite granodiorite, monzogranite, and syenogranite).
The types of hydrothermal alteration identified at the Raimunda deposit, and their respective mineral assemblages, are summarized in Table 1. The hydrothermal system and the associated mineralization are mainly observed through pervasive zones, and, subordinately, along veins and veinlets and the more affected rocks are the monzo- to syenogranite facies.
Based on overprinting relationships, mineralogy, and alteration assemblages, seven alteration zones are recognized: (1) Early sodic metasomatism (albite); (2) Microclinization (orthoclase/microcline-quartz1-hematite); (3) Early or intermediate propylitic alteration (epidote-chorite1-carbonate-rutile-titanite-pyrite1); (4) Intermediate to proximal sericitic alteration (muscovite-chlorite2-quartz2-pyrite2-gold1); (5) Silicification (quartz3); (6) Main mineralization phase: sulfide stage (gold2-pyrite3-chalcopyrite-bismuthinite and other Bi- and Cu sulfides); and (7) Late-stage carbonate alteration and chloritization (carbonate-chlorite3-quartz4).
The alterations occur throughout the ore-bearing host granite at the deposit. At the field scale, and even when analyzing the different drill cores, it is not possible to macroscopically delineate hydrothermal alteration zones.
The early Na-metasomatism alteration modified the essential mineralogy of the granites. The oligoclase is completely or partially replaced by albite and the magmatic biotite is locally preserved.
Subsequently, microclinization represents another outward alteration halo surrounding the previous one, and it is commonly observed at the periphery of the alteration profile. Microclinization commonly occurs within all granite facies; although more intensely in the syenogranite, through the alteration of K-feldspar and the formation of microcline rims. The orthoclase is microclinized and the feldspar and biotite crystals are partially to completely altered to fine muscovite. Hydrothermal quartz grains (quartz1) are generally milky.
The propylitic alteration can be noticed in all granitic facies of the Raimunda deposit but is more perceptive in non-mineralized samples, including monzonite and granodiorite facies. It is pervasive, affecting especially feldspar crystals, which are partially or completely replaced by epidote-chlorite1-carbonate. It is common to occur in veins and/or veinlets with epidote-chlorite1-carbonate crossing the samples and rutile, titanite, and fine-grained pyrite1 in agglomerates mass.
Sericitic alteration is marked by its pale green color throughout all granite facies, where they occur pervasively or selectively altered and become more intense towards the monzogranite facies. The alteration mineral assemblage is mainly composed of muscovite, chlorite2 (Chl2), pyrite2 (Py2), quartz2 (Qz2), and chalcopyrite. The main feature is the texture obliterated by the replacement of feldspars with fine muscovite, along with disseminated fine-grained pyrite and quartz, locally. In this case, pyrite (Py2) occurs disseminated either into quartz veins and veinlets or associated with quartz2 and muscovite. This phase was identified as the first stage of mineralization (i.e., muscovite, pyrite2, quartz2, and gold1). Euhedral to subhedral pyrite is classified as pyrite2, which is poorly fractured and displays a low degree of fracture filling, occurring disseminated in host rocks and, locally, into veins or veinlets that cut through the rock (Figure 5A). Gold (Au1) occurs either as inclusions or as fracture-fills in pyrite2.
Silicification occurs pervasively or as veins and veinlets (Figure 5C). The veins/veinlets consist of microcrystalline quartz (massive and mosaic texture—Qz3), associated with sulfides and other minerals, such as muscovite and carbonate.
The sulfide stage is both disseminated and forming massive sulfide zones that crosscut the rocks. At the deposit, that corresponds to the main mineralizing stage with a high content of associated sulfides (i.e., pyrite3, chalcopyrite, chalcocite, bismuthinite, hodrushite, krupkaite, wittchenite) and gold2. The pyrite3 occurs in massive sulfide levels, strongly fractured, and with a high degree of fracture filling (Figure 4E,G). Gold (Au2) occurs as fracture-fills in pyrite3 and as seldom inclusions in quartz3. The samples highlight pressure relief features, vuggy silica in quartz veins/veinlets, and levels of massive sulfide (Figure 5E,F).
Late hydrothermal alteration is represented by carbonate alteration. It is less expressive than the last two stages and restricted to the final stages of hydrothermal alteration. In general, potassium feldspar and albite are affected by carbonate alteration. Carbonate-quartz4-chlorite3 veins and veinlets crosscut the rock samples (Figure 5E).

4.2. Ore and Hydrothermal Mineral Chemistry

Tables S1–S7 display EPMA analyses of pyrite, chalcopyrite, gold, copper-rich minerals, bismuth-rich minerals, chlorite and muscovite which can be found in the Supplementary Material. The selection considered the variable styles of mineralization (veins/veinlets and disseminated) for each mineral as well as their ore mineral paragenesis.

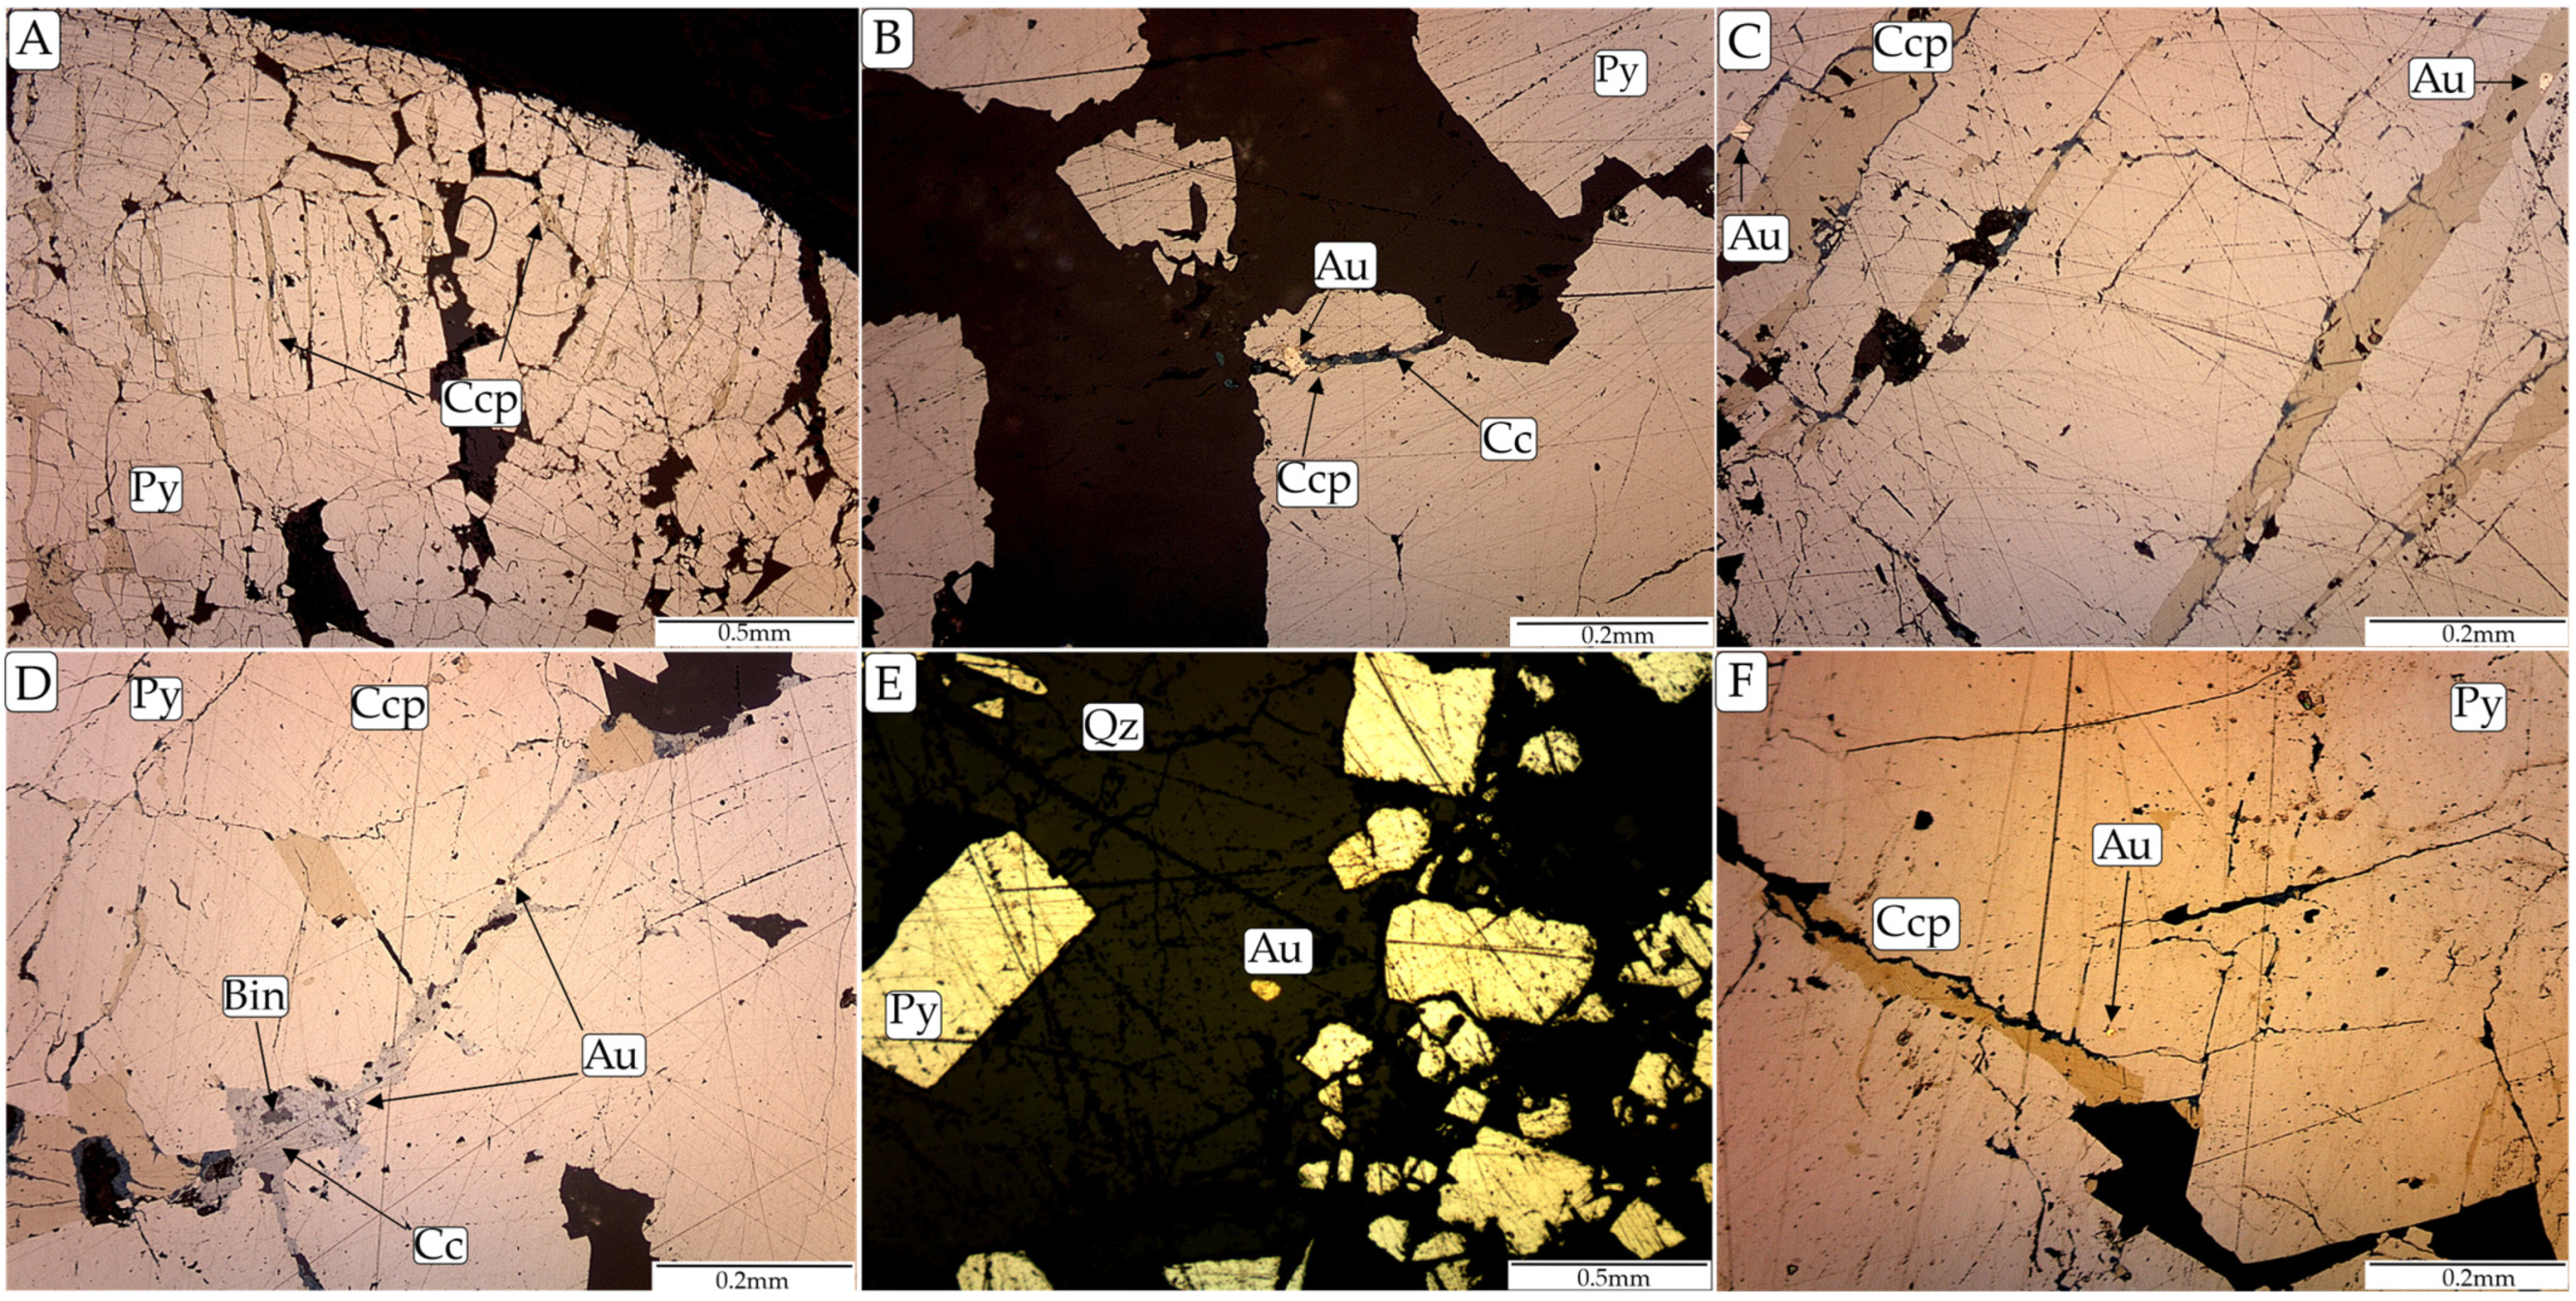
4.2.1. Sulfides and Gold

The analysis of pyrite focused on types 2 (Py2) and 3 (Py3), which are associated with the mineralization stages at the deposit (Table S1, Figure 6). Py3 (Figure 6A) contains slightly higher contents of Au (Py3: 0–0.09%; Py2: 0.02–0.07%), Te (Py3: 0–0.24%; Py2: 0–0.12%), and Mo (Py3: 0.01–0.17%; Py2: 0–0.08%). Furthermore, there are higher contents of Pb (Py3: 0.1–0.34%; Py2: 0.19–0.23%), as well as higher contents of Cu (Py3: 0–0.82%; Py2: 0–0.04%).
The significant amount of these elements in Py3 compared to Py2 reveals the genetic differences between those types based on chemical evidence, which had been previously corroborated by textural features. This points out variable timings and fluctuating element availability throughout ore precipitation.
The chalcopyrite occurs in fracture-fills and inclusions in Py2 and, more intensely, in Py3 (Figure 6A,C,D,F). Chemically, there are no significant differences between them, with average Au contents of 0–0.06%, Ag contents of 0–0.16%, Te contents of 0–0.23%, Mo contents of 0–0.12%, Pb contents of 0.04–0.30% and Bi contents of 0–0.23%.
Chalcocite (Cu2S) occurs together with chalcopyrite and other copper sulfides, such as larosite ((Cu, Ag)21(Pb, Bi)2 S13), filling fractures in pyrite3. Bismuthinite is the most abundant bismuth mineral and, likewise, occurs as fracture-fills. Other Cu- and Bi-rich sulfides identified as part of the mineral paragenesis at the deposit are hodrushite (Cu8Bi12S22), krupkaite (PbCuBi3S6), and wittchenite (Cu3BiS3) (Figure 6D).
All sulfides are in equilibrium with Py3 making up the main mineralization stage at the Raimunda deposit. Gold occurs either as inclusions (Au1) or fracture-fills (Au2) (Figure 6B–F). In both cases, gold inclusions and fracture-fills in pyrite showed no significant compositional variation between them (Table S3, Supplementary Material). Fracture-filling gold grains (Au2) display average Au values of 57.03–66.77%, and Ag values of 28.45–28.74%, while gold inclusions yield Au contents of 65.91–66.80% and Ag contents of 27.90–28.70%. Therefore, their chemistry reveals relative constant silver values and variable gold values, which are related to Cu, Te, and Mo input.

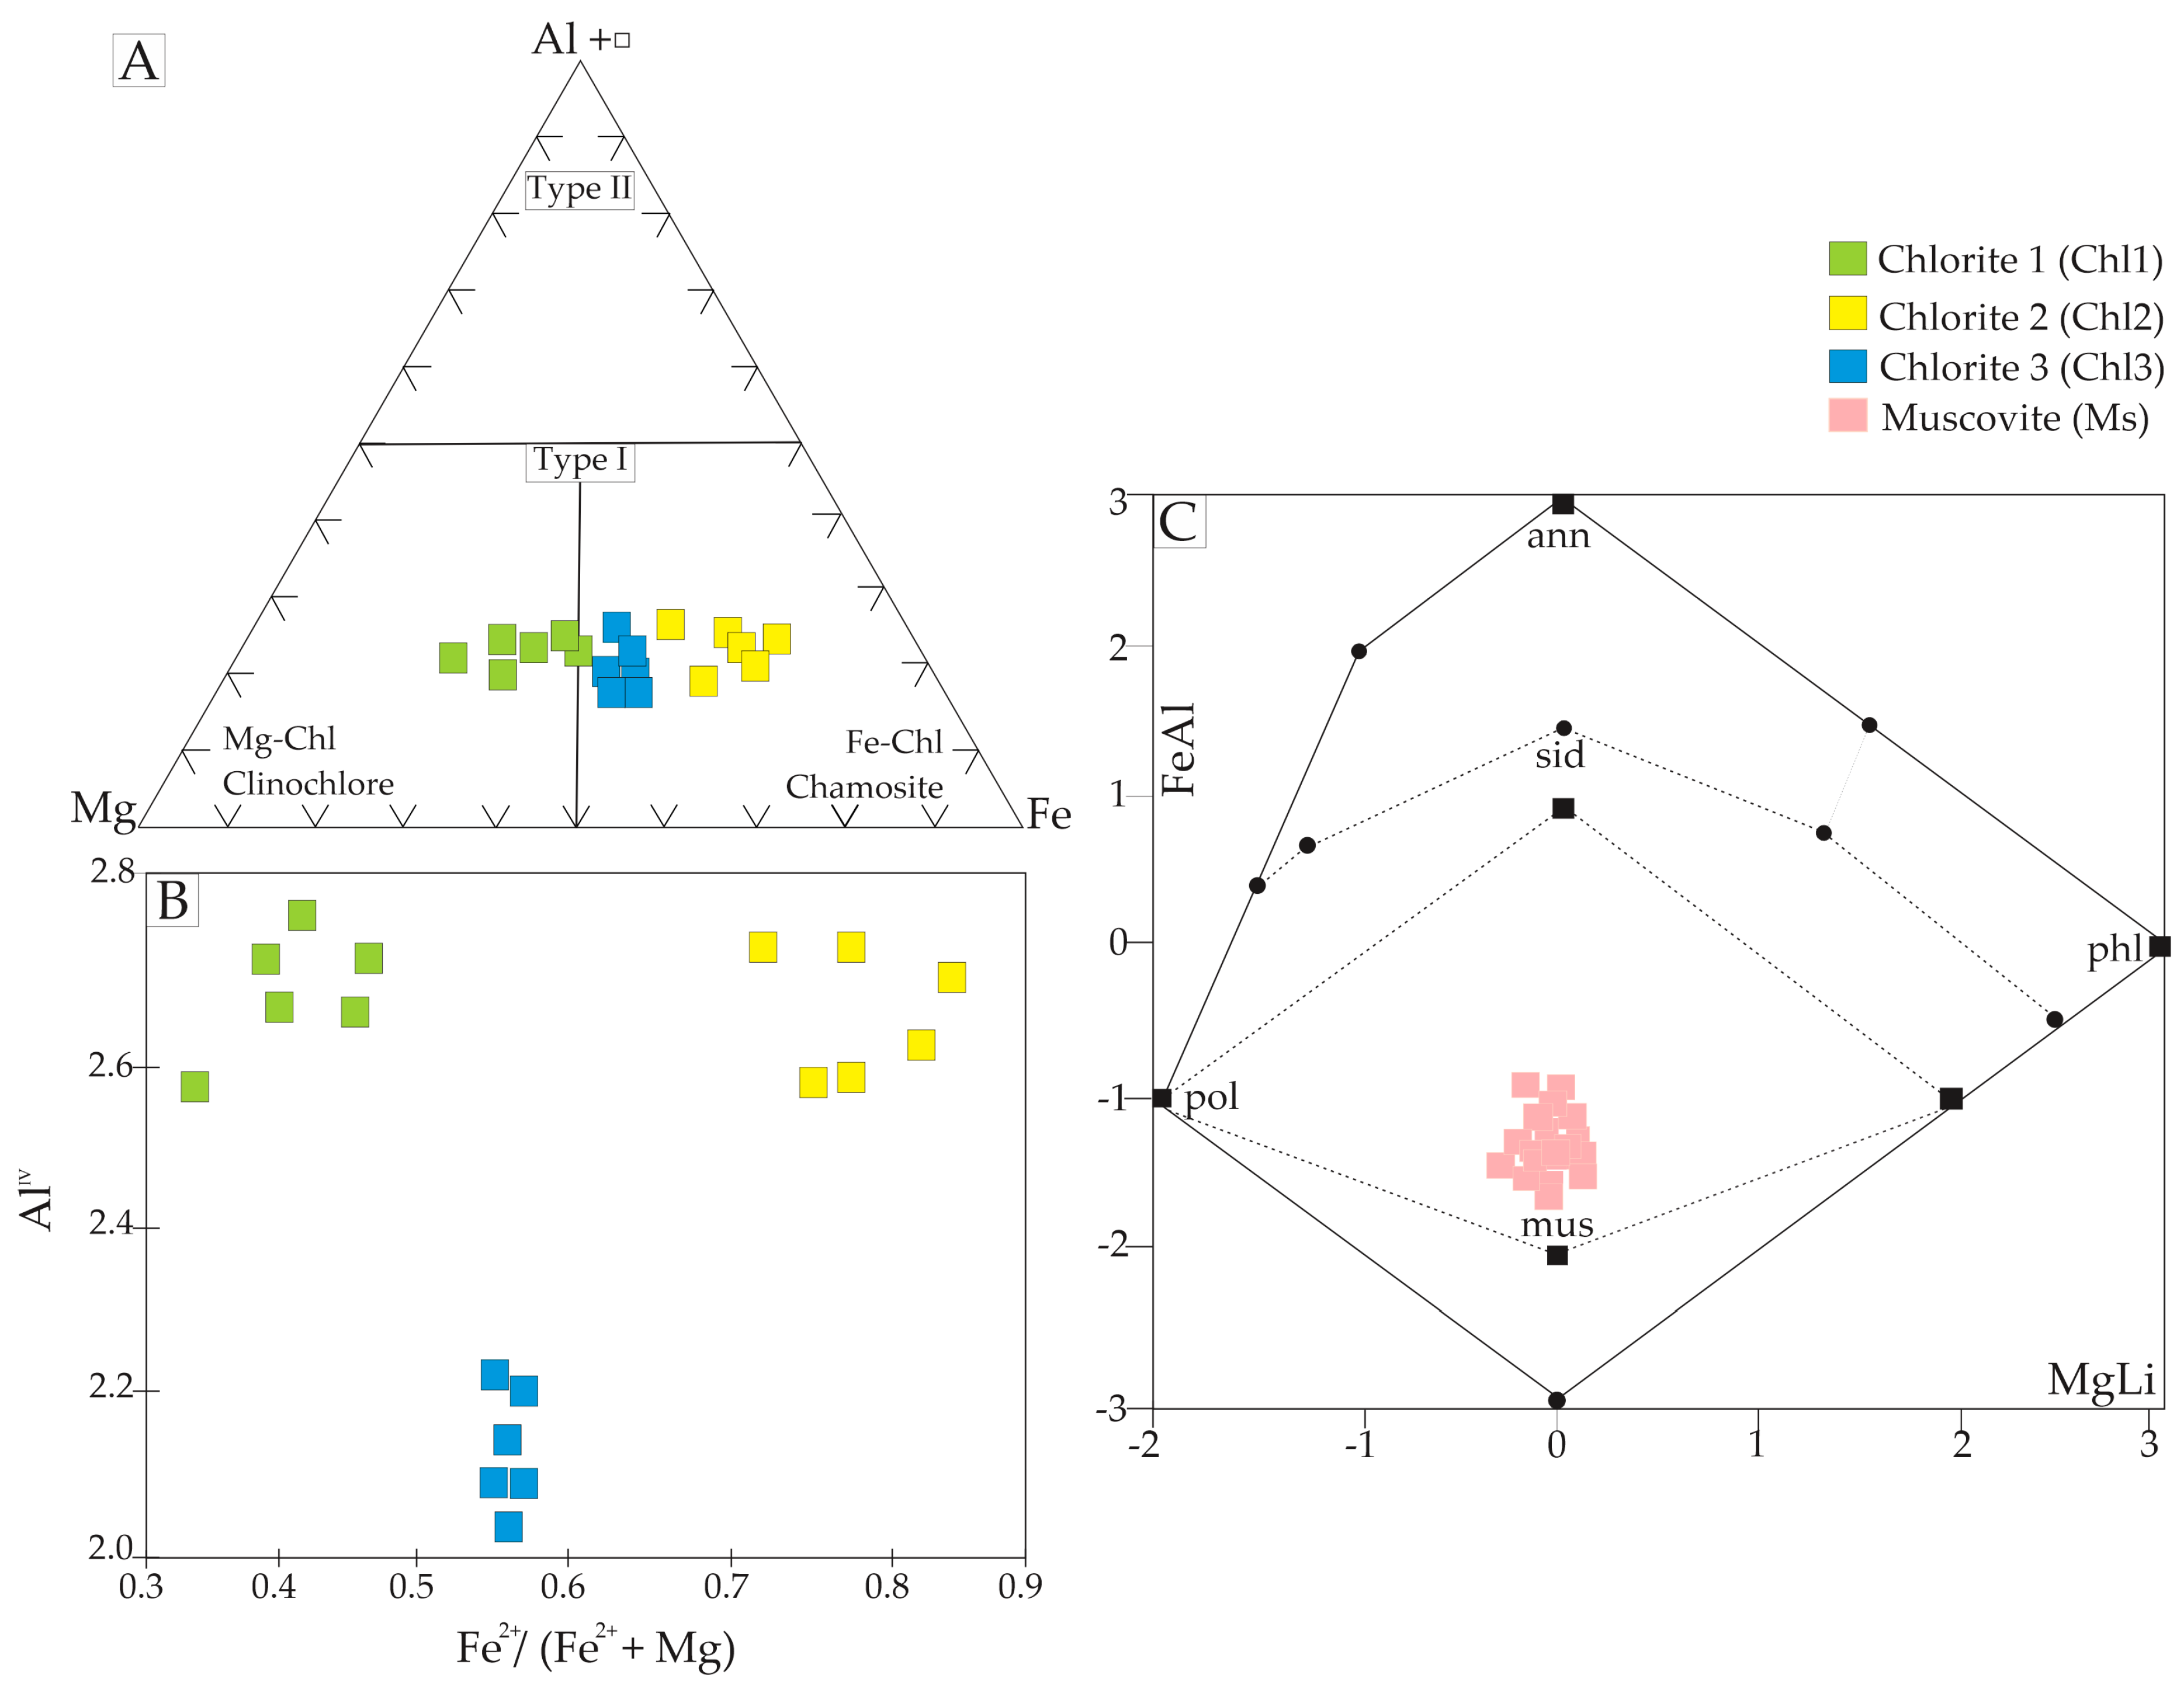
4.2.2. Chlorite Chemistry and Geothermometry

The chemical composition of chlorite contributes to the study of hydrothermal alteration processes to delineate the former physical–chemical conditions (T, P, fO2, pH, and host rock composition) of the geological environment at the time of its formation, which makes it an important indicator of the rock formation temperature [28,33].
Table S6 (Supplementary Material) presents 18 microprobe analyses of chlorite (i) after biotite (Chl1), (ii) in equilibrium with muscovite and epidote (sericitic alteration) (chl2), and (iii) in association with the late-stage carbonatization (Chl3). The compositional variation in chlorite might be related to the partial replacement of igneous biotite by chlorite, which had been depicted from textural features and is used for a classification scheme.
Magnesium-rich chlorite yields Fe/(Fe + Mg) ratios varying between 0.33 and 0.56, and Si/Al ratio varying between 1.02 and 1.39. Si atoms range between 5.24 and 5.98 a.p.f.u., and AlIV ranges from 2.02 to 2.76 a.p.f.u. Iron-rich chlorite exhibits Fe/(Fe + Mg) ratios of 0.67–0.84 and less varying Si/Al ratios of 1.03–1.09. Si atoms range between 5.31 and 5.51 a.p.f.u., and AlIV values fall within the range of 2.49–2.70 a.p.f.u. Based on the classification of [34], these compositions plot at the transition between clinochlore-chamosite (Figure 7A,B).
Empirical geothermometers were proposed by several authors [28,29,34,36,37]. Each one applies correction criteria based on the characteristics of the given chlorite, as follows: (i) tetrahedral Al (AlIV) contents [28,29] and (ii) corrected AlIV contents based on the relationship between AlIV and Fe/(Fe + Mg) ratios [36,37,38,39]. Empirical geothermometers used in this study are summarized in Table S6 (Supplementary Material). The peak temperature was obtained through the equation of Cathelineau [29]. The values calculated according to Cathelineau and Nieva [28] are similar to those calculated according to Cathelineau [29]. The lowest temperatures were obtained using the equation of Zang and Fyfe [37]. Based on the features and compositions of the different types of chlorites here identified, the formation temperatures estimated through Cathelineau [29] were selected.
The chlorite geothermometry data are coherent with the petrographic data: the hydrothermal alteration had its onset with propylitic alteration, marked by the replacement of biotite by chlorite (Chl1) along with the formation of other Fe-rich minerals (e.g., rutile) at temperatures between 355 and 382.4 °C. As alteration progressed, Chl2, which is associated with sericitic alteration, began to nucleate, at temperatures between 338.9 and 372.8 °C, under the conditions where the first mineralization stage took place. During late hydrothermal alteration, Chl3 was predominant in association with late quartz and carbonate veinlets, at temperatures ranging between 263.3 and 297.87 °C.

4.2.3. Muscovite

Electron microprobe data and the chemical formula of muscovite from the Raimunda deposit are available in Table S7 (Supplementary Material). The muscovite samples chosen for analysis are those associated with the first (1) mineralization stage (sericitic alteration) due to their greater occurrence. The 16 spot analyses reveal a relatively homogeneous composition with small variations in Al2O3 (29.8–31.4%), MgO (0.6–1.18%), FeO (1.54–5%), and Na2O (0.13–0.4%) [35] (Figure 7C).

4.3. Fluid Inclusions Data

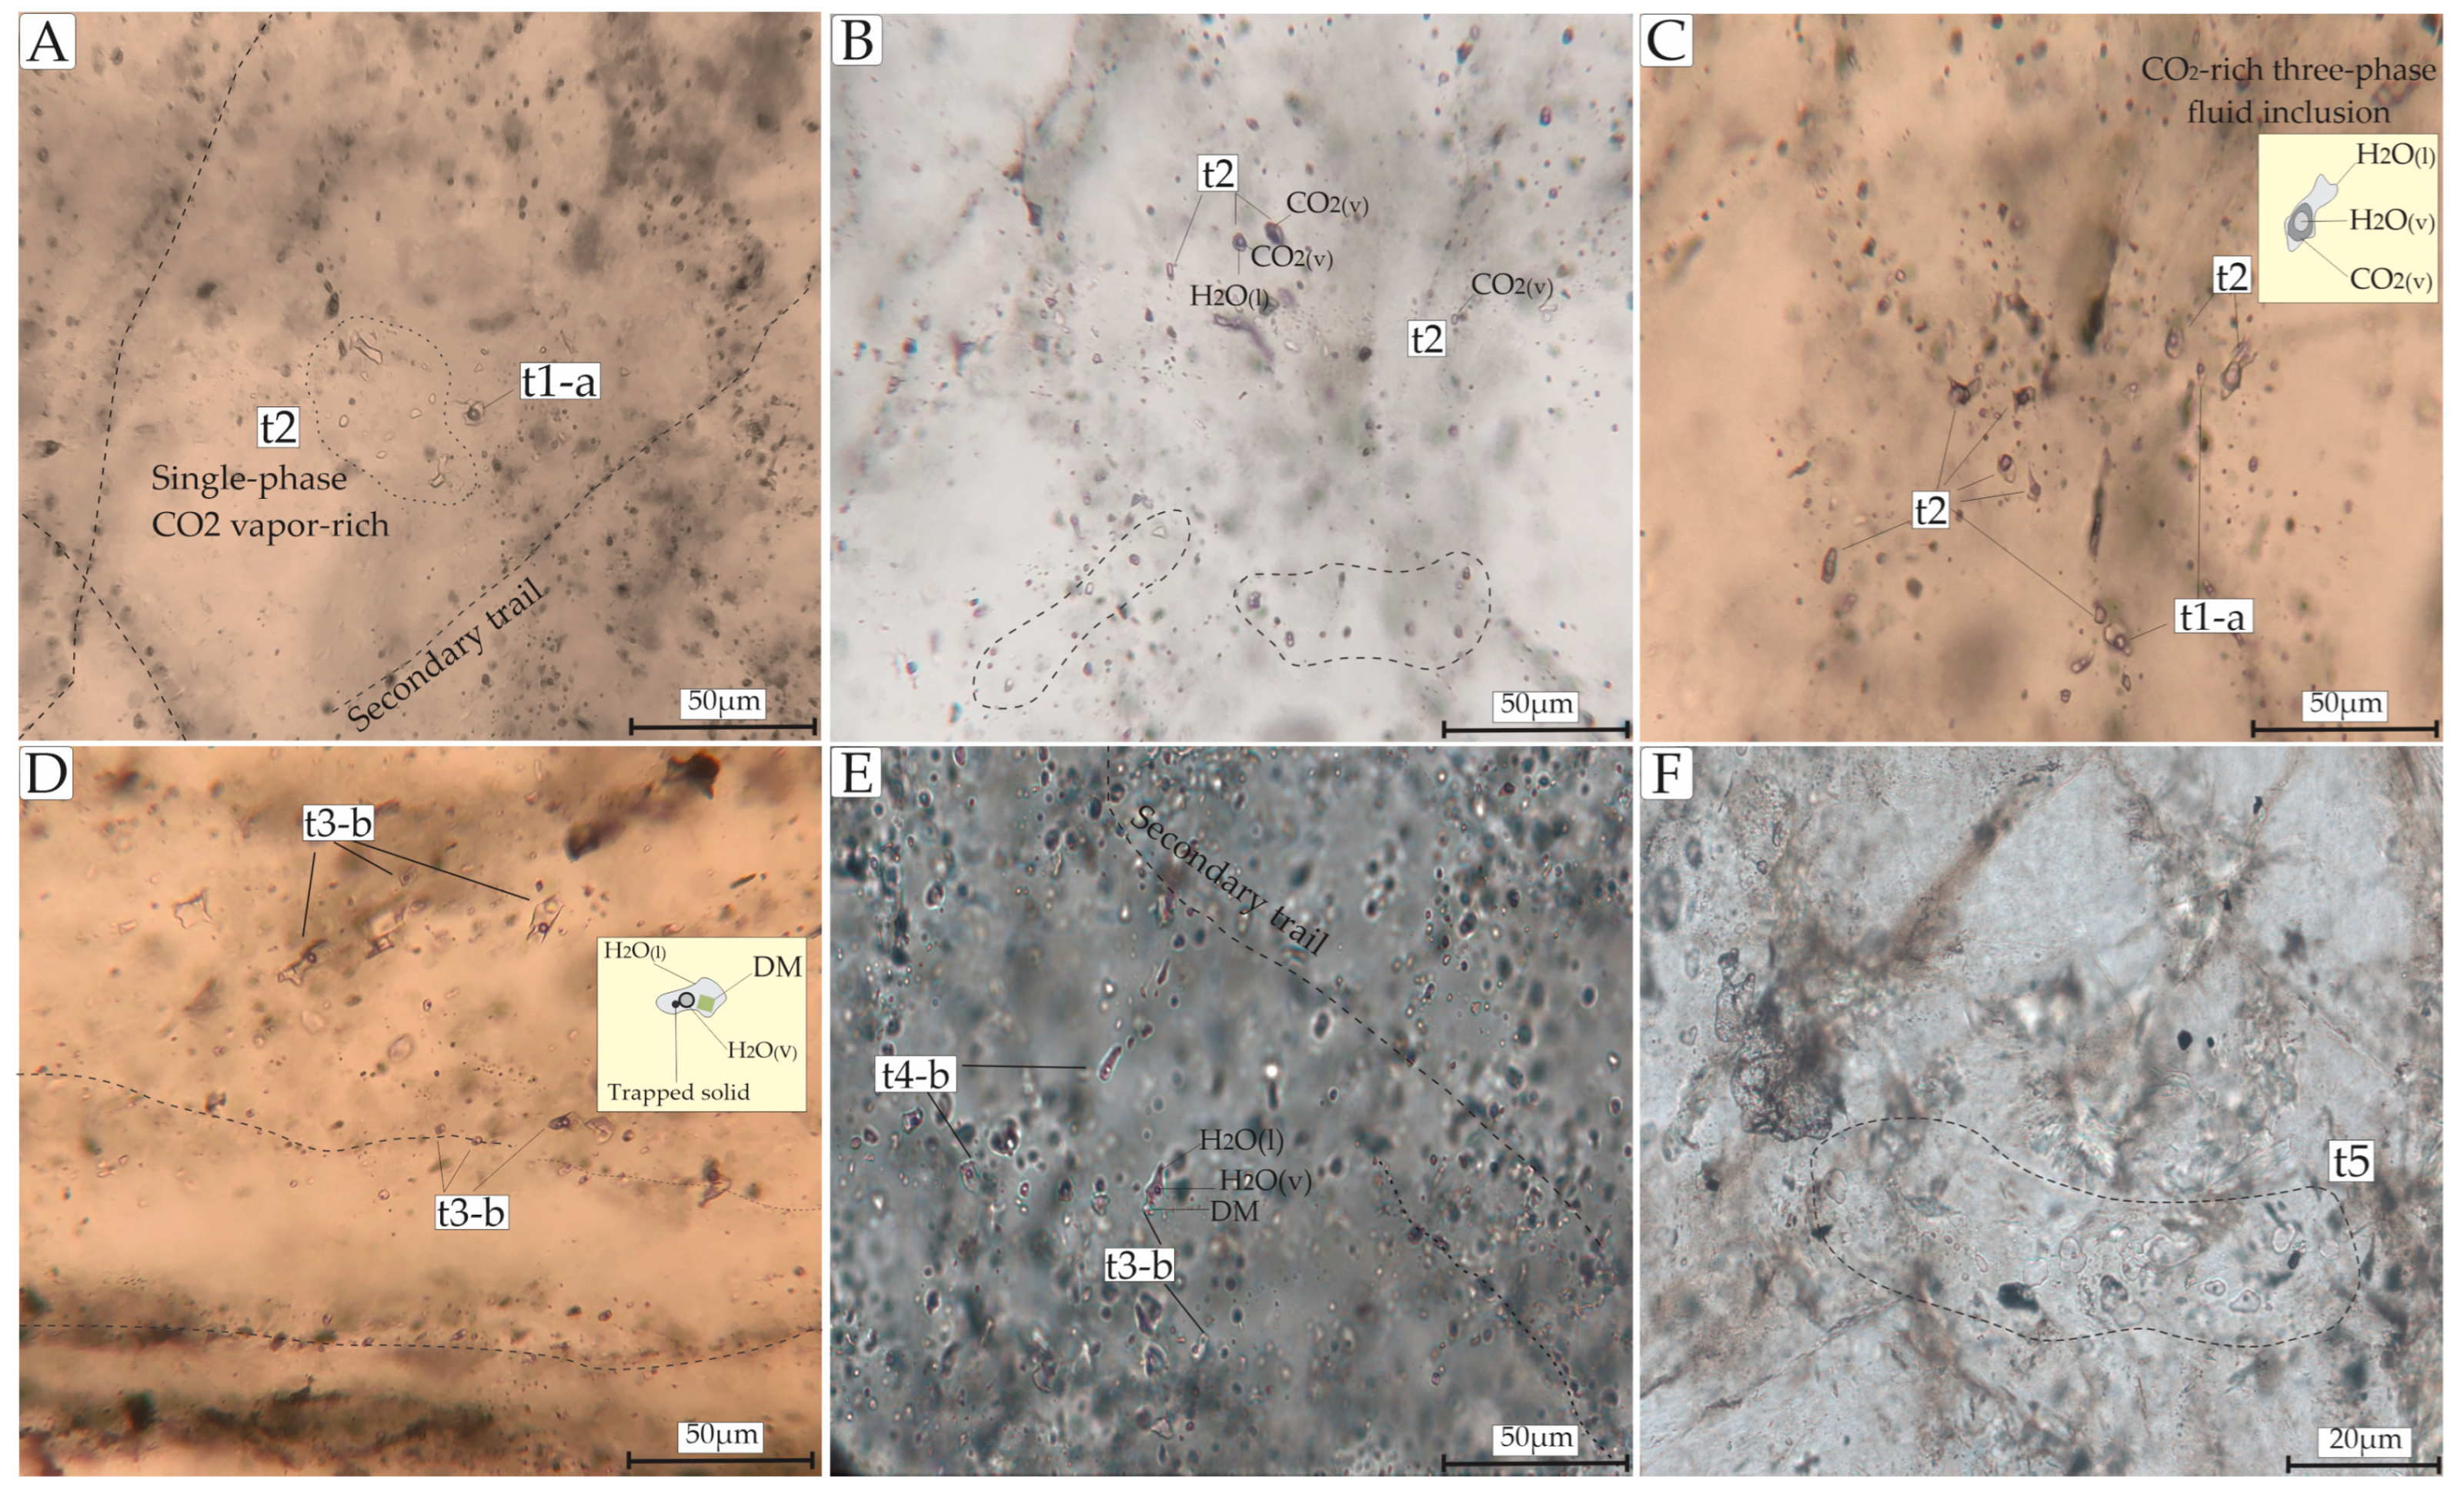
4.3.1. Petrography and Classification

The fluid inclusion study was carried out on quartz grains from the mineralization stage (Qz2 and Qz3) and late alteration stage (Qz4), using doubly polished thin sections from the Raimunda deposit. Primary and secondary fluid inclusions were described according to the fluid inclusion assemblage (FIA) criteria proposed by [40], which is based on the classification criteria of [31].
Based on the distribution, number of phases present at room temperature, patterns of occurrence, phase transitions throughout heating and freezing runs, and Raman spectrometry data, nine subtypes of fluid inclusions were recognized. The main characteristics are summarized in Table 2.
Type 1 (t1) are two-phase (liquid + vapor) aqueous liquid-rich primary (t1-a) and secondary (t1-b) inclusions. Type t1-a inclusions show clear evidence of primary fluid, and occur in Qz3, which is associated with sulfide stage, as clusters or isolated inclusions with a liquid fill ration (F) of 0.70–0.8. They are usually colorless, with a light-colored bubble surrounded by a dark rim. They are rounded, oval, and, more rarely, irregularly shaped, varying between 8–20 μm (Figure 8A,C). Type t1-b inclusions encompass secondary inclusions in Qz2 associated with sericitic alteration. They mostly occur along trails and subordinately as clusters. They are colorless and display an F of 0.7–0.8. The light-colored bubble moves at room temperature in some samples. They range between 3 and 12 μm and are rounded, sub-rounded, elongated, and, more rarely, rectangular.
Type 2 (t2) are primary, single-phase carbonic vapor-rich, two-phase (LH2O + VCO2) and three-phase (LH2O + LCO2 + VCO2) aqueous-carbonic fluid inclusions that occur in Qz3. Single-phase inclusions are gray, with an F of 100% CO2, varying between 5 and 15 μm. Two-phase and three-phase inclusions display bubbles with a dark rim, varying between 5 and 20 μm. They are sub-rounded, elongated, and, more locally, irregularly-shaped. Their F is 30–50 vol% (Figure 8A–C). They occur as single inclusions or in clusters being oval to irregularly shaped. Three-phase inclusions usually display CO2 bubbles only during reheating, before the homogenization temperature for CO2 is reached. They are considered part of the same fluid inclusion assemblage (FIA).
Type 3 encompasses three-phase primary (t3-a) and three-phase secondary (t3-b) inclusions (LH2O + VH2O + S1) containing daughter minerals and multiphase-solid phases (LH2O + VH2O + S1 + S2). The t3-a inclusions correspond to the primary in Qz4, associated with late-carbonatization. It varies between 10 and 20 μm, and is elongated, and sub-rounded; colorless to greenish. They contain cubic solid phases (daughter mineral) that are colorless, isotropic, and interpreted as halite based on petrographic and microthermometric data as well as in the lack of a Raman signal. Overall, the F for both subtypes is 15–20 vol% (vapor), 15–20 vol% (solid), and 60–70 vol% (liquid).
The t3-b fluid inclusion is secondary in Qz3 and occurs as trails and/or aligns associated with sulfide stage. They vary between 8 and 22 μm and are square-shaped, elongated, sub-rounded, and greenish. The cubic solid phases (daughter mineral) are colorless and, locally, also occur as a trapped solid (opaque mineral) in the fluid inclusion (Figure 8D). The F for both subtypes is 15–20 vol% (vapor), 15–20 vol% (solid), and 60–70 vol% (liquid) (Figure 8D,E).
Type 4 (t4) are liquid-rich two-phase aqueous inclusions. Primary fluid inclusions (t4-a) in Qz3 are associated with sulfide stage. Secondary inclusions (t4-b) predominate in all samples studied and are associated with sericitic alteration (Qz2). In both types, the liquid phase is dominant, with an F of 0.8–0.85 and with a vapor bubble content of 15–20 vol%. They are colorless, 8 to 20 μm, and display rounded, sub-rounded, elongated, and irregular shapes. They are generally found as trails/aligned along micro-fractures in the crystal (t3-b), clusters, and isolated (t3-a) (Figure 8E).
Type 5 (t5) are secondary, liquid-rich two-phase aqueous (L + V) inclusions (Figure 8F). The degree of fill (F) is 0.75–0.8. They are irregular to sub-rounded, vary between 15 and 50 μm, and occur only in Qz2 which is associated with sericitic alteration.
Type 6 (t6) are single-phase liquid-rich and/or vapor-rich inclusions. They are colorless to greenish, rounded/oval to irregular, and locally occur along trails varying between 4 and 20 μm. Vapor-rich inclusions are dark, irregular, and vary between 2 and 15 μm. They occur in all samples studied.

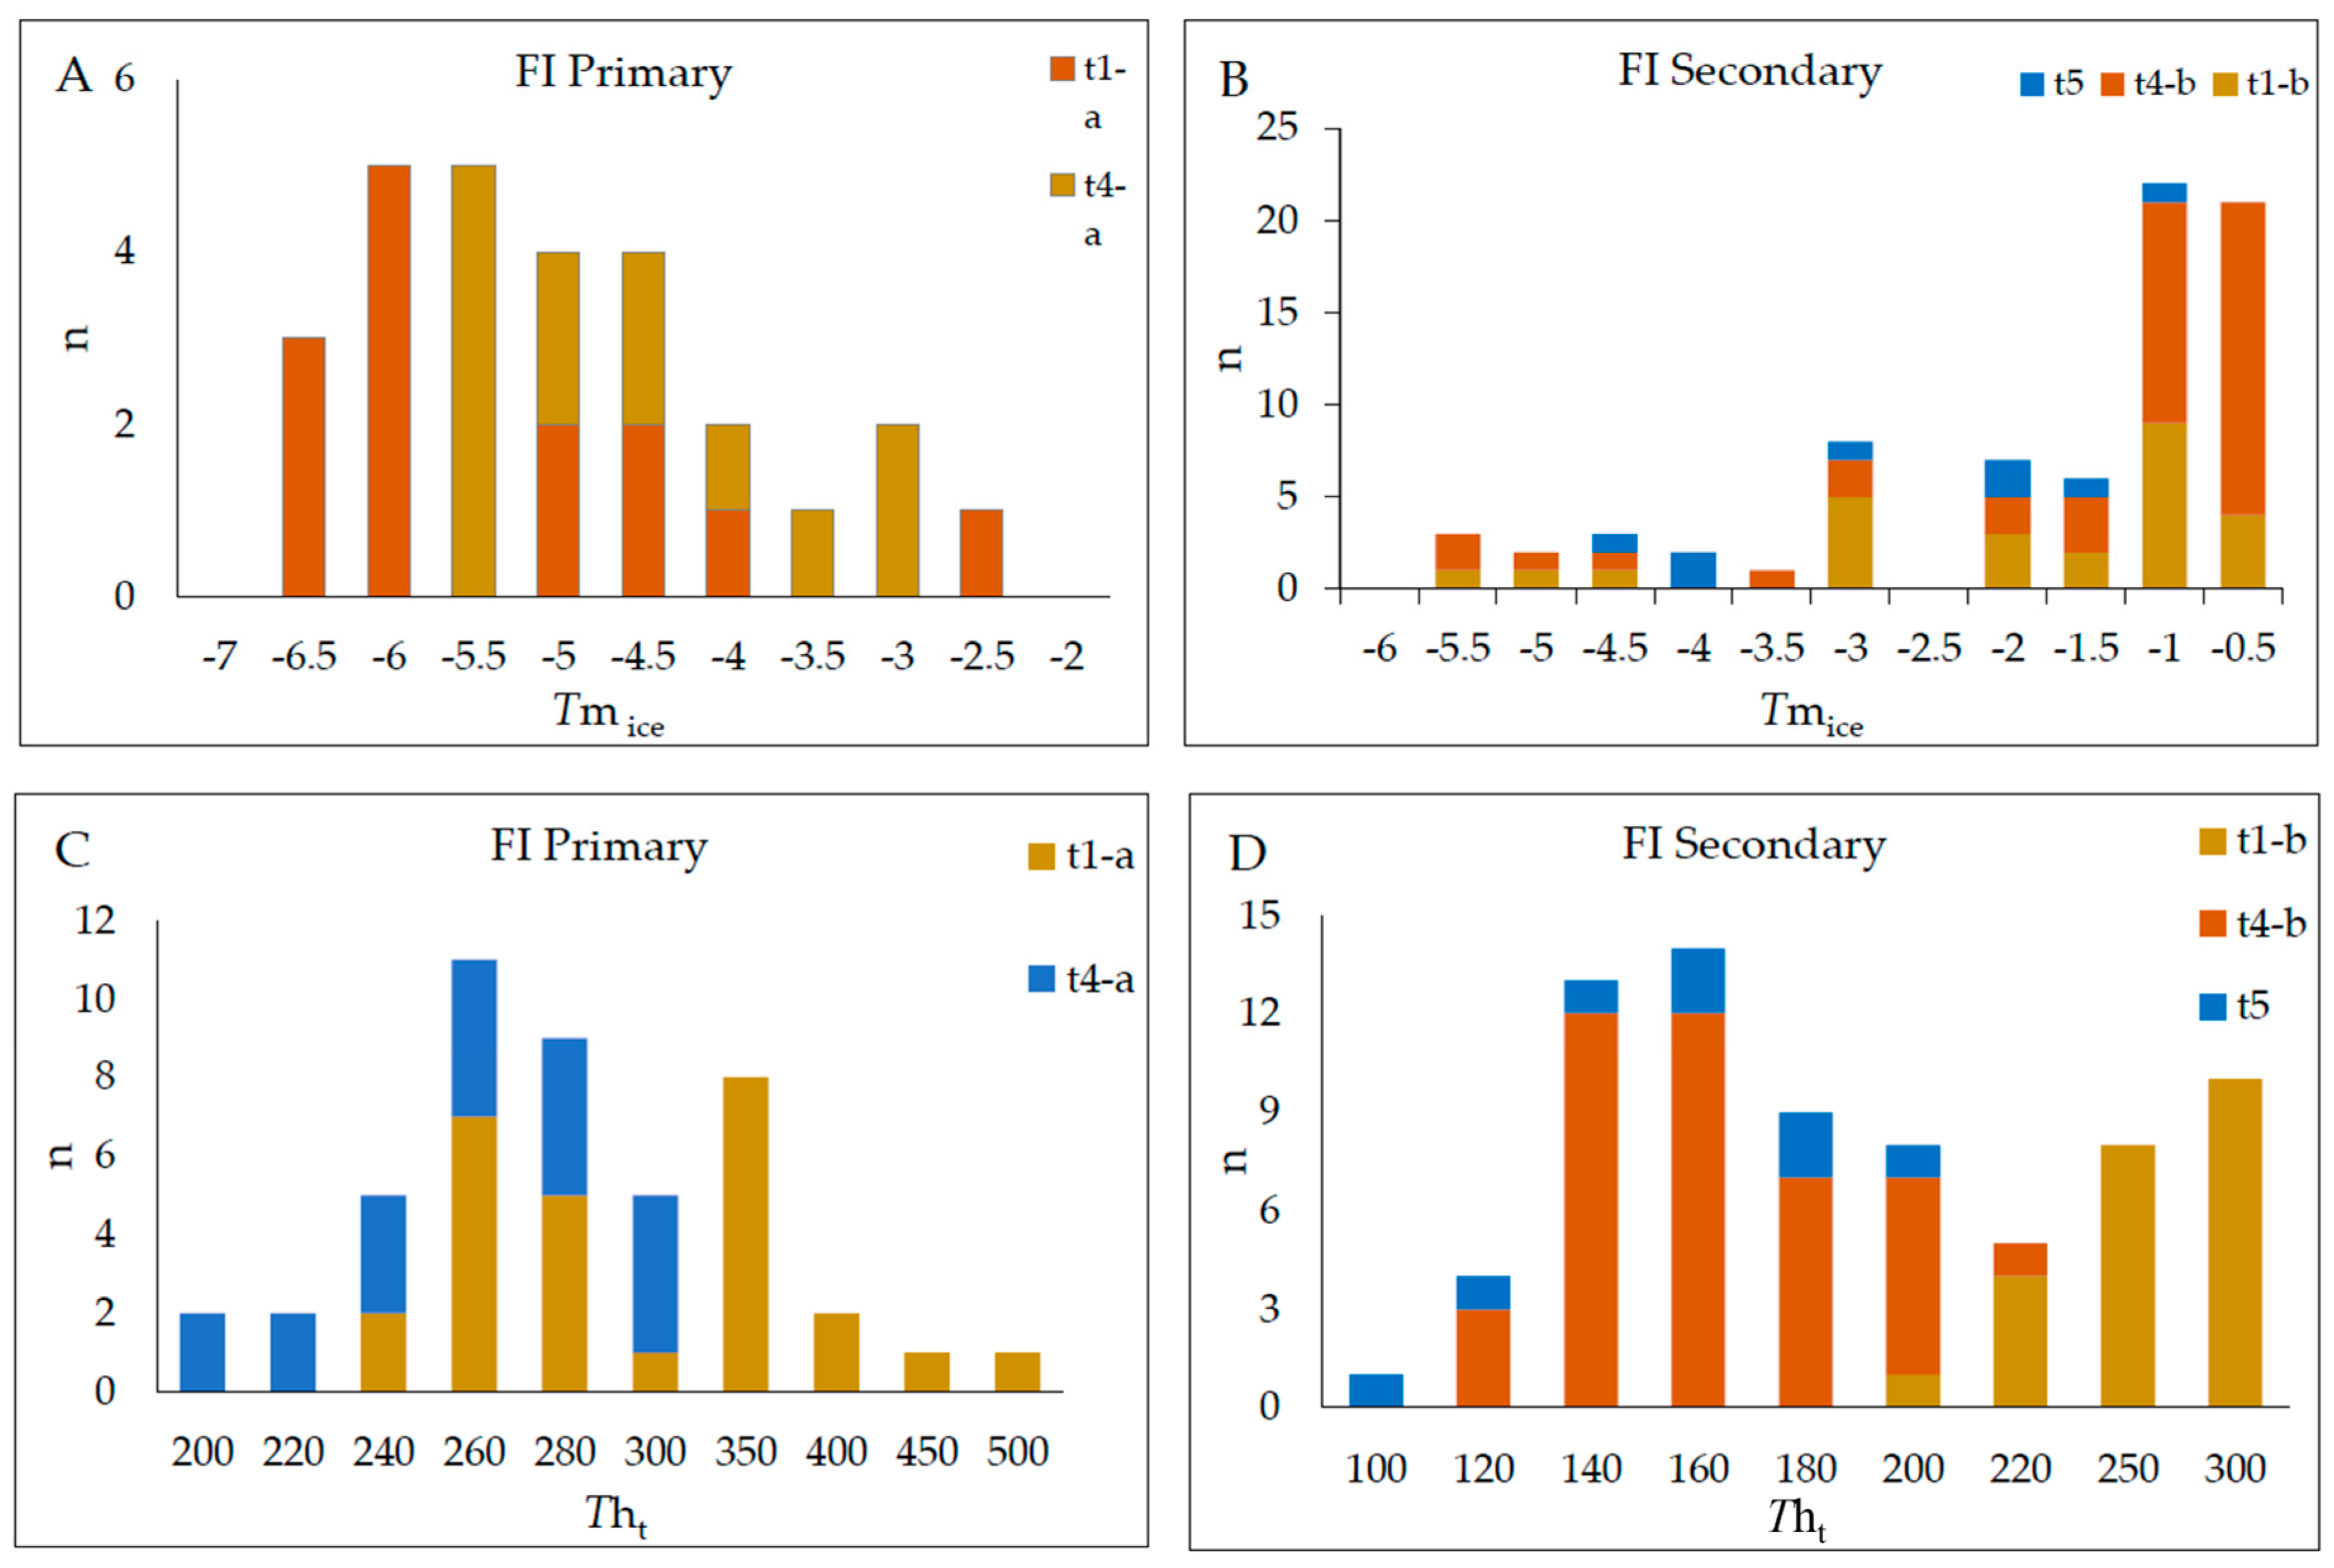
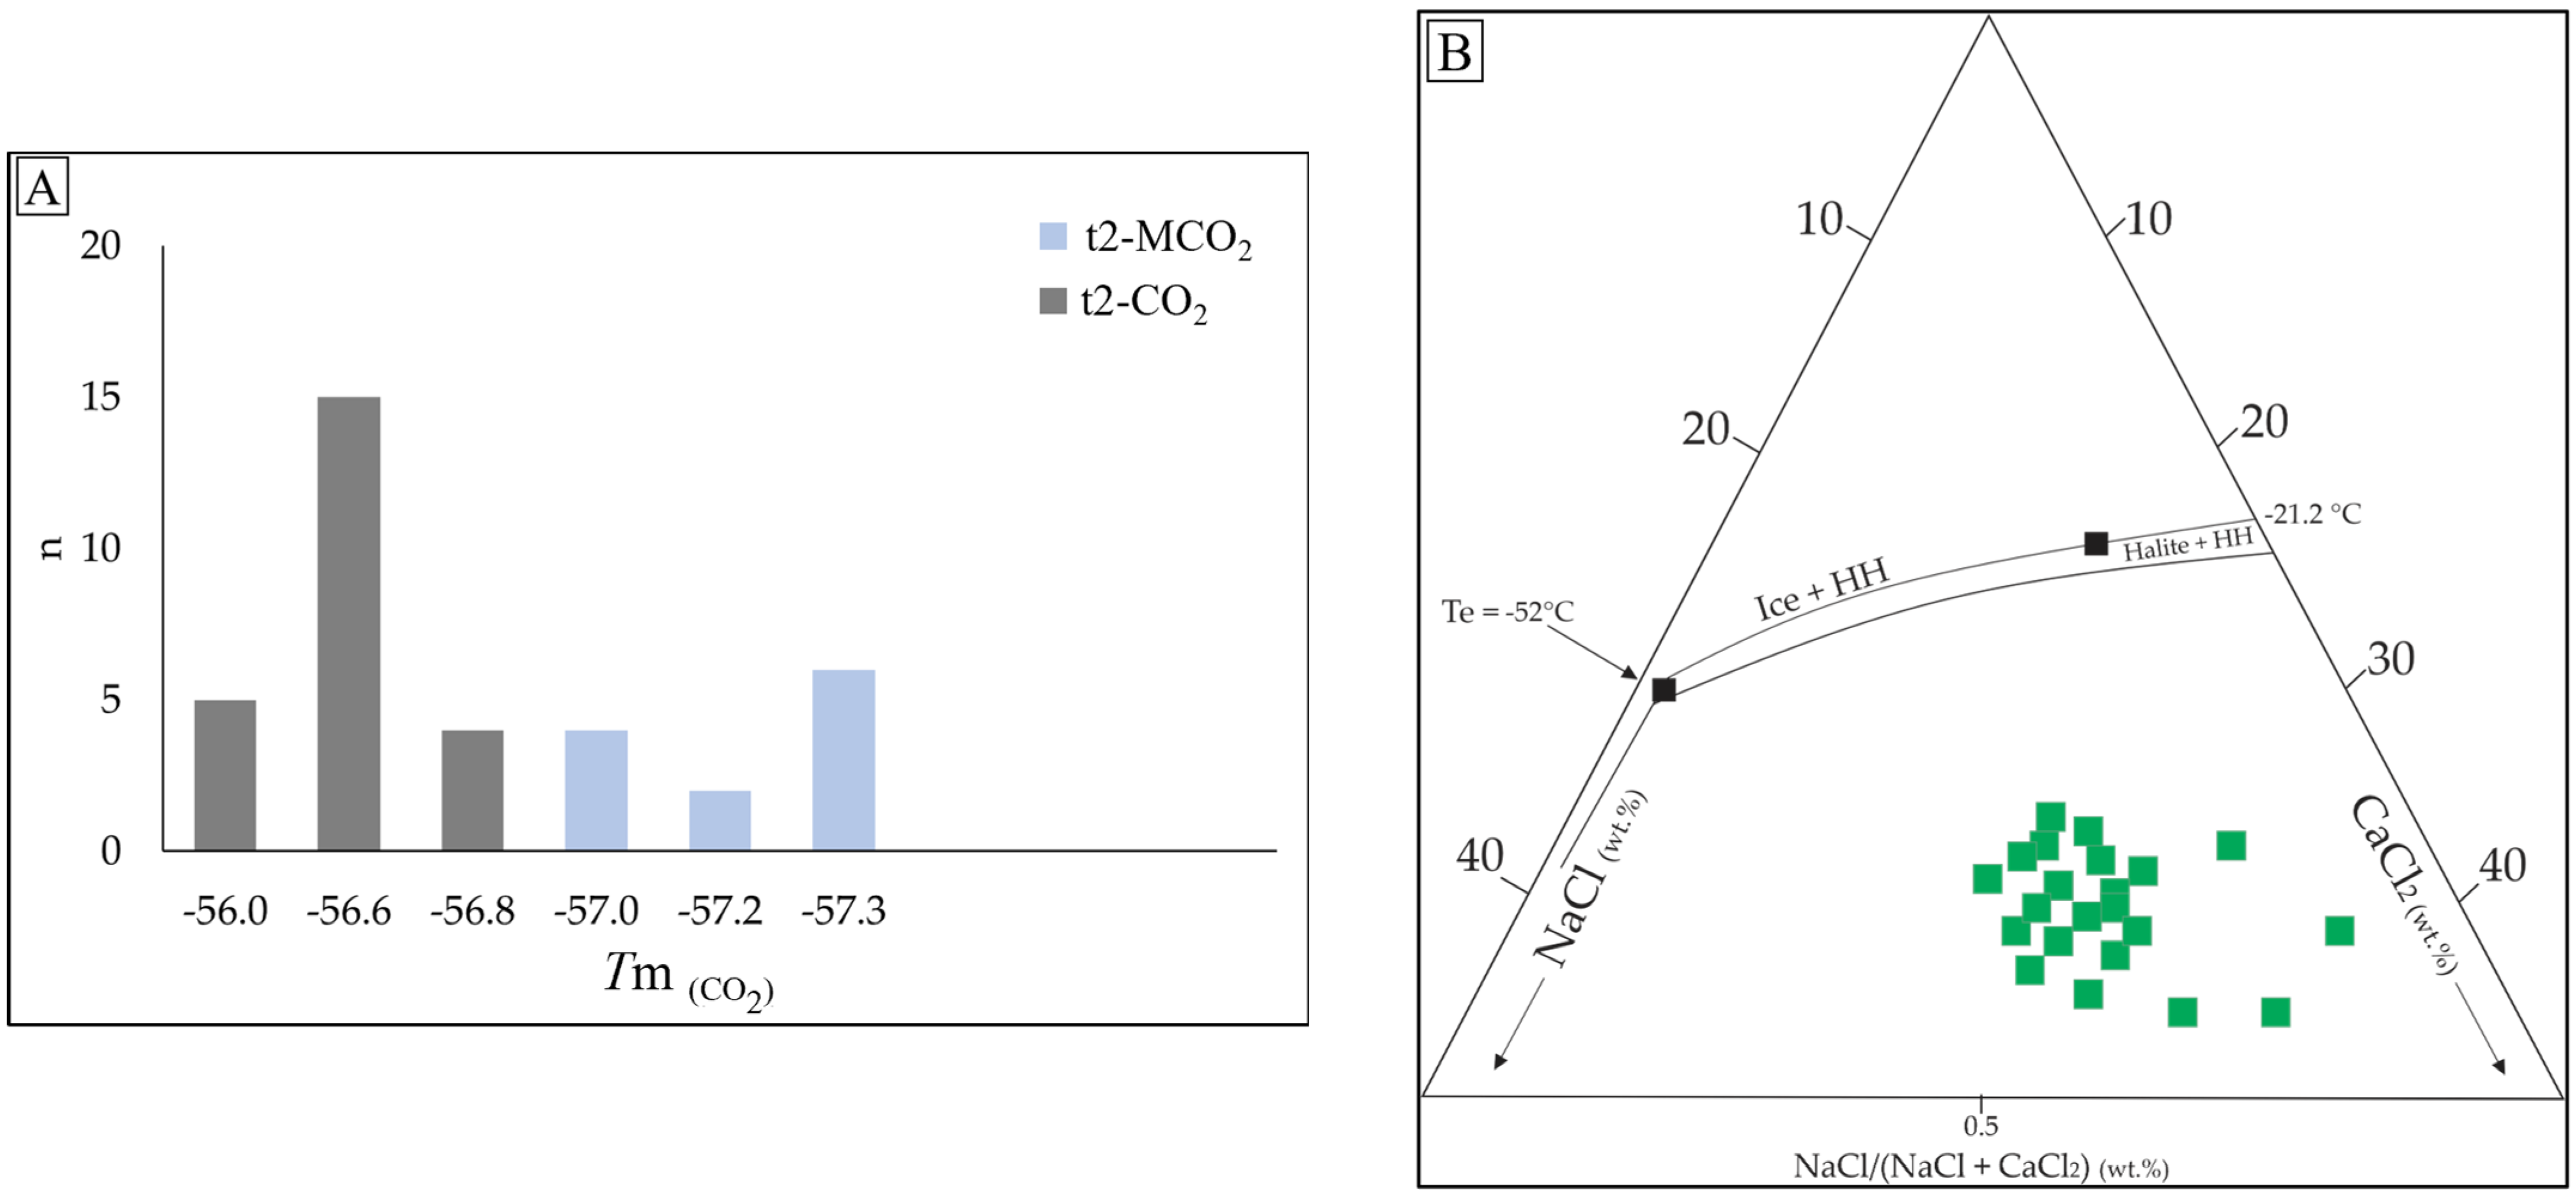
4.3.2. Microthermometric Data

Table 2 summarizes the fluid inclusions microthermometric data of the Raimunda deposit. Microthermometry was carried out on all types of inclusions in quartz grains previously selected according to petrographic criteria. A total amount of 182 valid measurements were obtained (Table S8, Supplementary Material). The salinity and density of types 1, 4, and 5 aqueous fluid inclusions were calculated based on the equation of Bodnar [40], using the final ice melting temperature (Tmice) to estimate salinity in the H2O–NaCl system. For the fluid inclusions interpreted to be of the system H2O–NaCl–CaCl2, salinities were calculated using the Steele-Macinnis et al. equation [41]. The salinities in H2O–NaCl–CO2 inclusions (type 2) were estimated using the final CO2-clathrate melting temperatures [42], and the densities were estimated using the equations of Parry 1986 [43].
Type t1-a shows the temperature of the first visible melting (Te) ranging between −24.5 and −21.0 °C and encompasses inclusions with the final ice melting temperatures (Tmice) between −6.4 and −0.8 °C (Figure 9A). The total homogenization temperature (Tht), into the liquid phase, took place between 233.5 and 471.2 °C (Figure 9C), with average values of 325–380 °C. The salinities data are between 1.40 and 9.72 wt.% NaCl eq. and the density values between 0.41 and 0.89 g/cm3. In type t1-b, Tmice took place between −6.4 and −0.5 °C (Figure 9B), with an average from −4.2 to −0.5 °C and the Tht varies from 200.5 to 297 °C (Figure 9D). The salinity varies from 0.88 to 6.74 wt.% NaCl eq. and densities of 0.71–0.92 g/cm3.
Type 2 has average CO2 melting temperature (TmCO2) values ranging between −56.8 and −56.6 °C for two-phase and three-phase aqueous-carbonic inclusions (Figure 10A). For carbonic inclusions, TmCO2 is −57.3 to −57 °C. These values vary to either more positive or more negative values compared to the pure H2O-CO2 system (−56.6 °C). This points out the presence of other volatile compounds apart from CO2 (e.g., CH4 and N2). The clathrate melting temperatures (TmCla) are between 6.2 and 8.5 °C and the CO2 homogenization temperatures (ThCO2) vary between 26.8 and 30.1 °C for aqueous-carbonic inclusions, and between 19 and 26 °C for single-phase carbonic inclusions. Tht varies from 210 to 390 °C, but the main range for three-phase (LH2O + LCO2 + VCO2) inclusions take place between 280 and 340 °C; and, for two-phase (LH2O + VCO2) inclusions, the main temperature range is 300–364.7 °C. Salinities are between 3.00 and 5.94 wt.% NaCl eq. and the densities range from 0.87 to 0.88 g/cm3.
Type t3-a primary inclusions showed Tmhh values ranging between −10.7 and −3.8 °C. These inclusions homogenized into the liquid and vapor phase between 290.5 and 367.5 °C (Tht). The salinities are between 38.88 and 50.25 wt.% NaCl + CaCl2 eq. with densities varying from 0.78 to 0.82 g/cm3.
Type t3-b inclusions show the first observed melting temperature range between −55 to −51.2 °C, interpreted as a eutectic temperature (Te) and suggesting the composition of the H2O-NaCl-CaCl2 system [41]. The final melting of ice is between −43.2 and −37.8 °C, and the hydrohalite dissolution (Tmhh) occurs between −10.7 and −1.1 °C, with a main interval between −9 to −5 °C. During heating, the vapor bubble homogenizes first (132 to 202 °C), and, as temperature increases, daughter minerals homogenize (Tht) in the range of 192–278.6 °C, with an average between 210 and 250 °C. The salinities show range values of 33.02–38.21 wt.% NaCl + CaCl2 eq. and density values range from 0.87 to 0.97 g/cm3. The H2O–NaCl–CaCl2 ternary diagram plots the composition for type t3–b inclusions at the Raimunda deposit based on Steele-MacInnis et al. [41] (Figure 10B).
Type 4-a primary inclusions display Tmice values between −5.4 and −1.0 °C (Figure 9A) and Tht took place in the range between 200 and 288 °C (Figure 9C). The corresponding salinity of 1.56–8.41 wt.% NaCl eq. and the density was estimated between 0.74 and 0.92 g/cm3. Type t4-b secondary inclusions yielded Tmice values in the range of −4.7 and −0.1 °C (Figure 9B). This type homogenized into the liquid phase between 101 and 195 °C (Figure 9D). The salinity is between 0.53 and 6.59 wt.% NaCl eq. with densities between 0.74 and 0.92 g/cm3.
In type 5, the Tmice values fall between −4.2 and −0.8 °C and total homogenization temperatures (Tht) into the liquid phase range between 98 and 190 °C. The salinity is between 1.39–6.74 wt.% NaCl eq. and densities between 0.92 and 0.97 g/cm3 (Figure 9B,D). This type homogenized both into the liquid and vapor phase and the latter showed some inclusions crepitating while other inclusions did not return to their original state before heating.

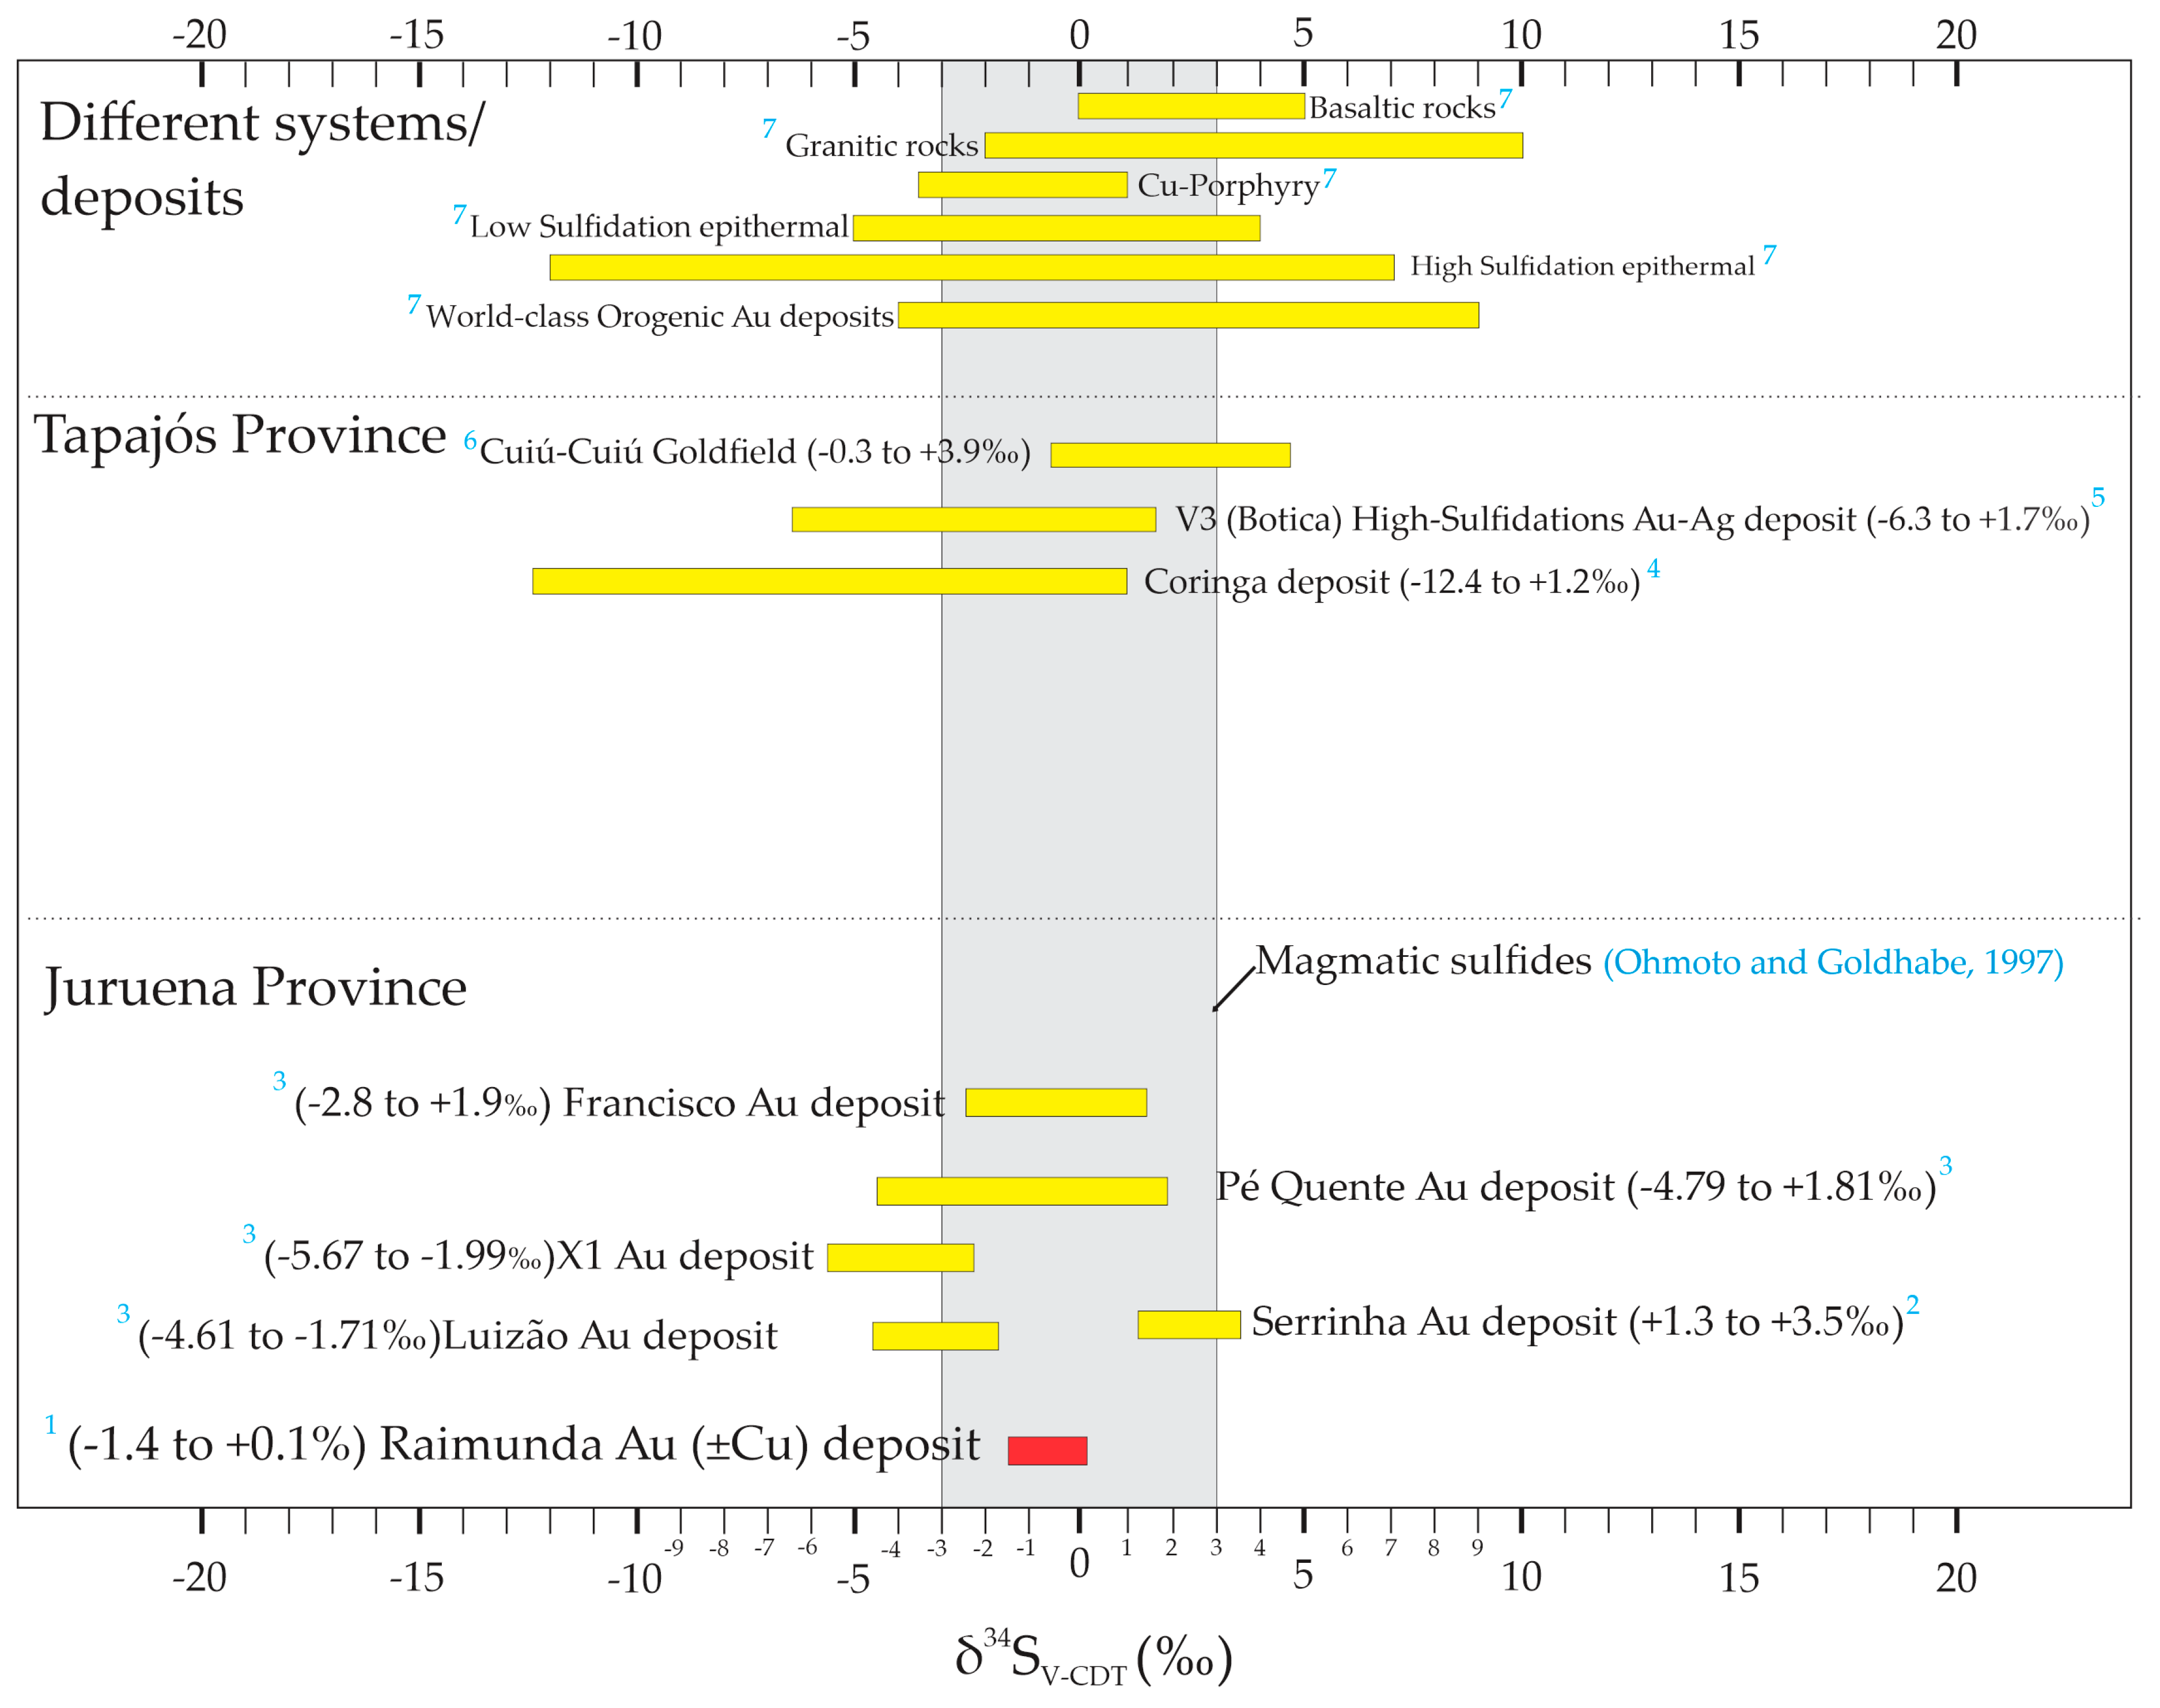
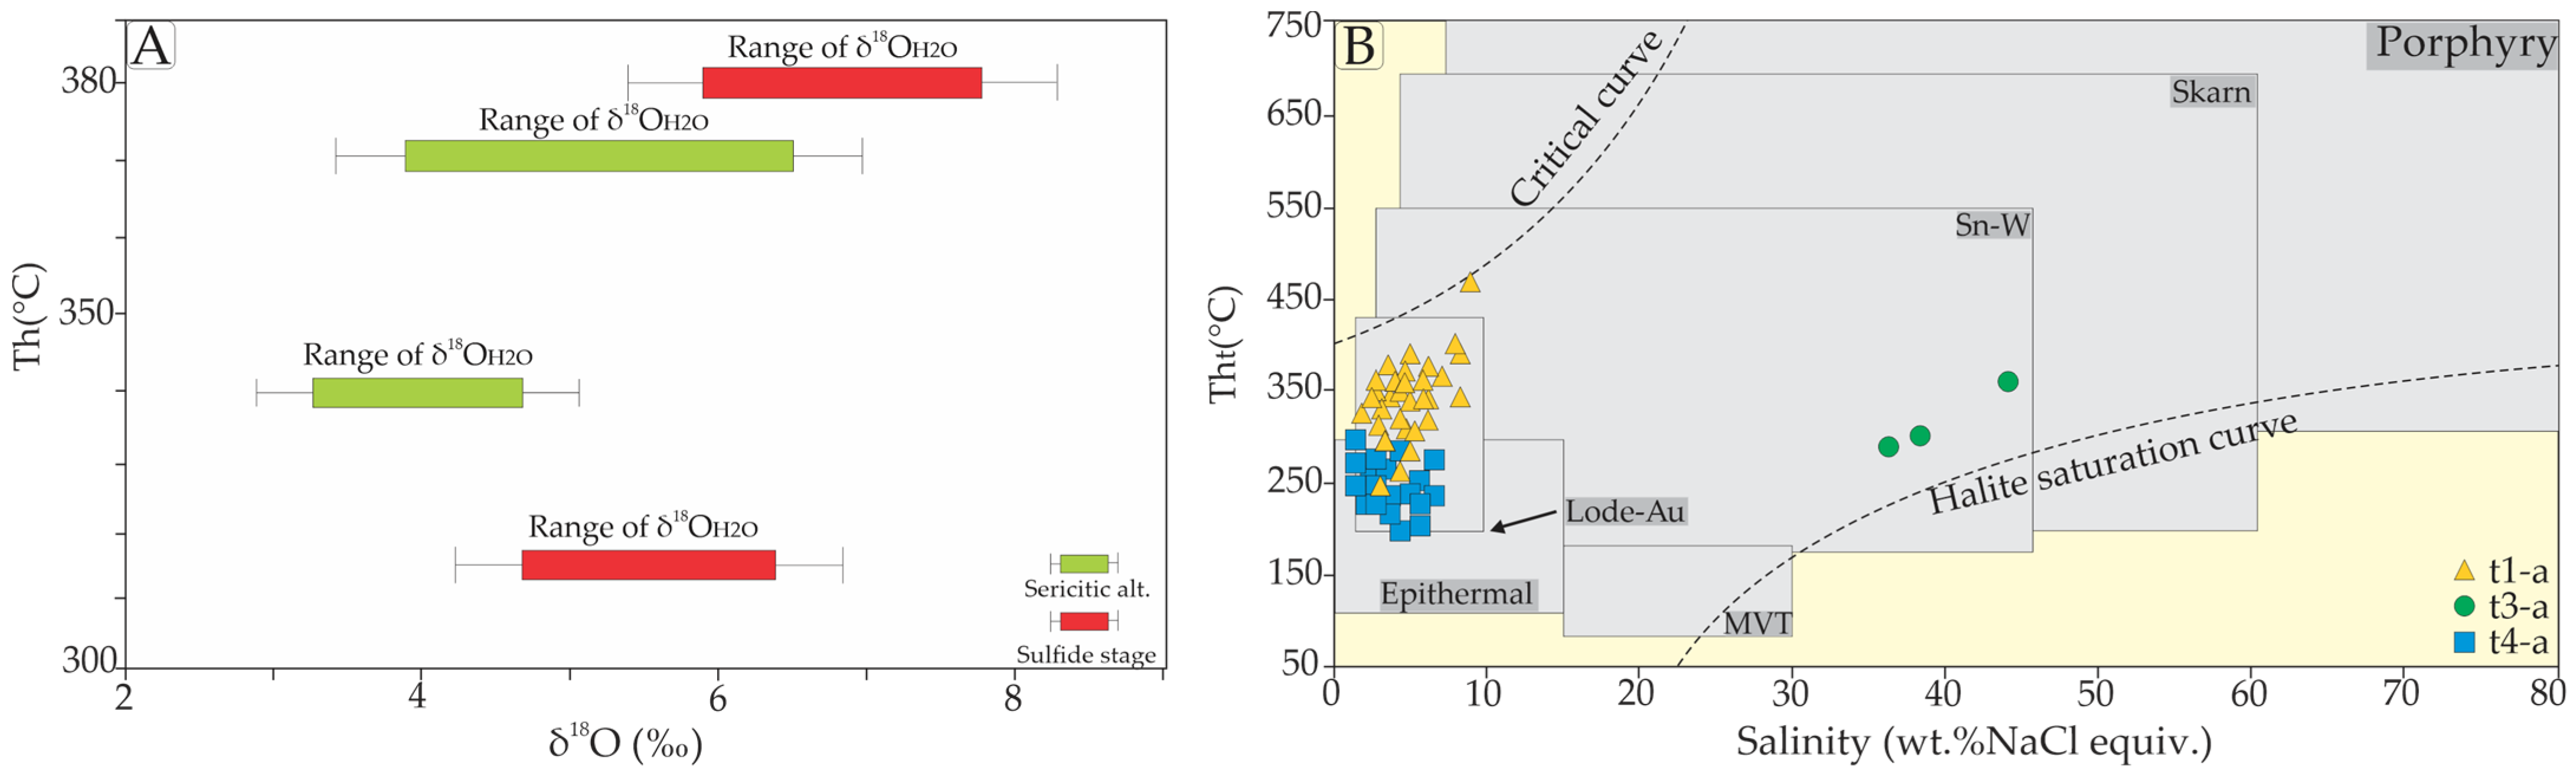
4.4. Stable Isotopes Data

Stable isotope data are summarized in Table 3. The oxygen data were obtained for Qz2, which is associated with sericitic alteration (Ms-Qz2-Py2-Au1), and for Qz3, which is related to the sulfide stage (Py3-Au2-Ccp-Cc-Bin and Cu sulfides); sulfur data were obtained for Py2 (sericitic alteration) and Py3 (sulfide stage), both associated with the mineralization stages at the Raimunda deposit (Table 1).
The δ18O values of quartz vary between 9.0 and 12.6‰. The isotopic values of the fluid (δ18OH2O) were calculated using the total homogenization temperature range (Tht) of primary t1 fluid inclusions (325–380 °C) as the isotopic equilibrium temperature for the main mineralized phase, sulfide stage, and the chlorite geothermometric temperature (340–370 °C) for the sericitic alteration stage.
These fluid inclusions are associated with the main mineralization stage at the Raimunda deposit. For the quartz-water system, the oxygen isotopic fractionation factor and the isotopic balance equation were used [44]; for oxygen, the following formula was applied to determine the temperature range between 250 and 500 °C: 1000 lnαQz-Water = 3.34 × (106T−2) − 3.31.
δ34Spy values for sulfides slightly varied between −1.4 and +0.1‰. Pyrite associated with sericitic alteration (Py2) yielded a δ34S value of −0.5‰; pyrite from massive sulfide zones (Py3) provided δ34S values from −1.4 to +0.1‰. The isotopic fractionation factor between pyrite–H2S was retrieved from [45].

5. Discussion

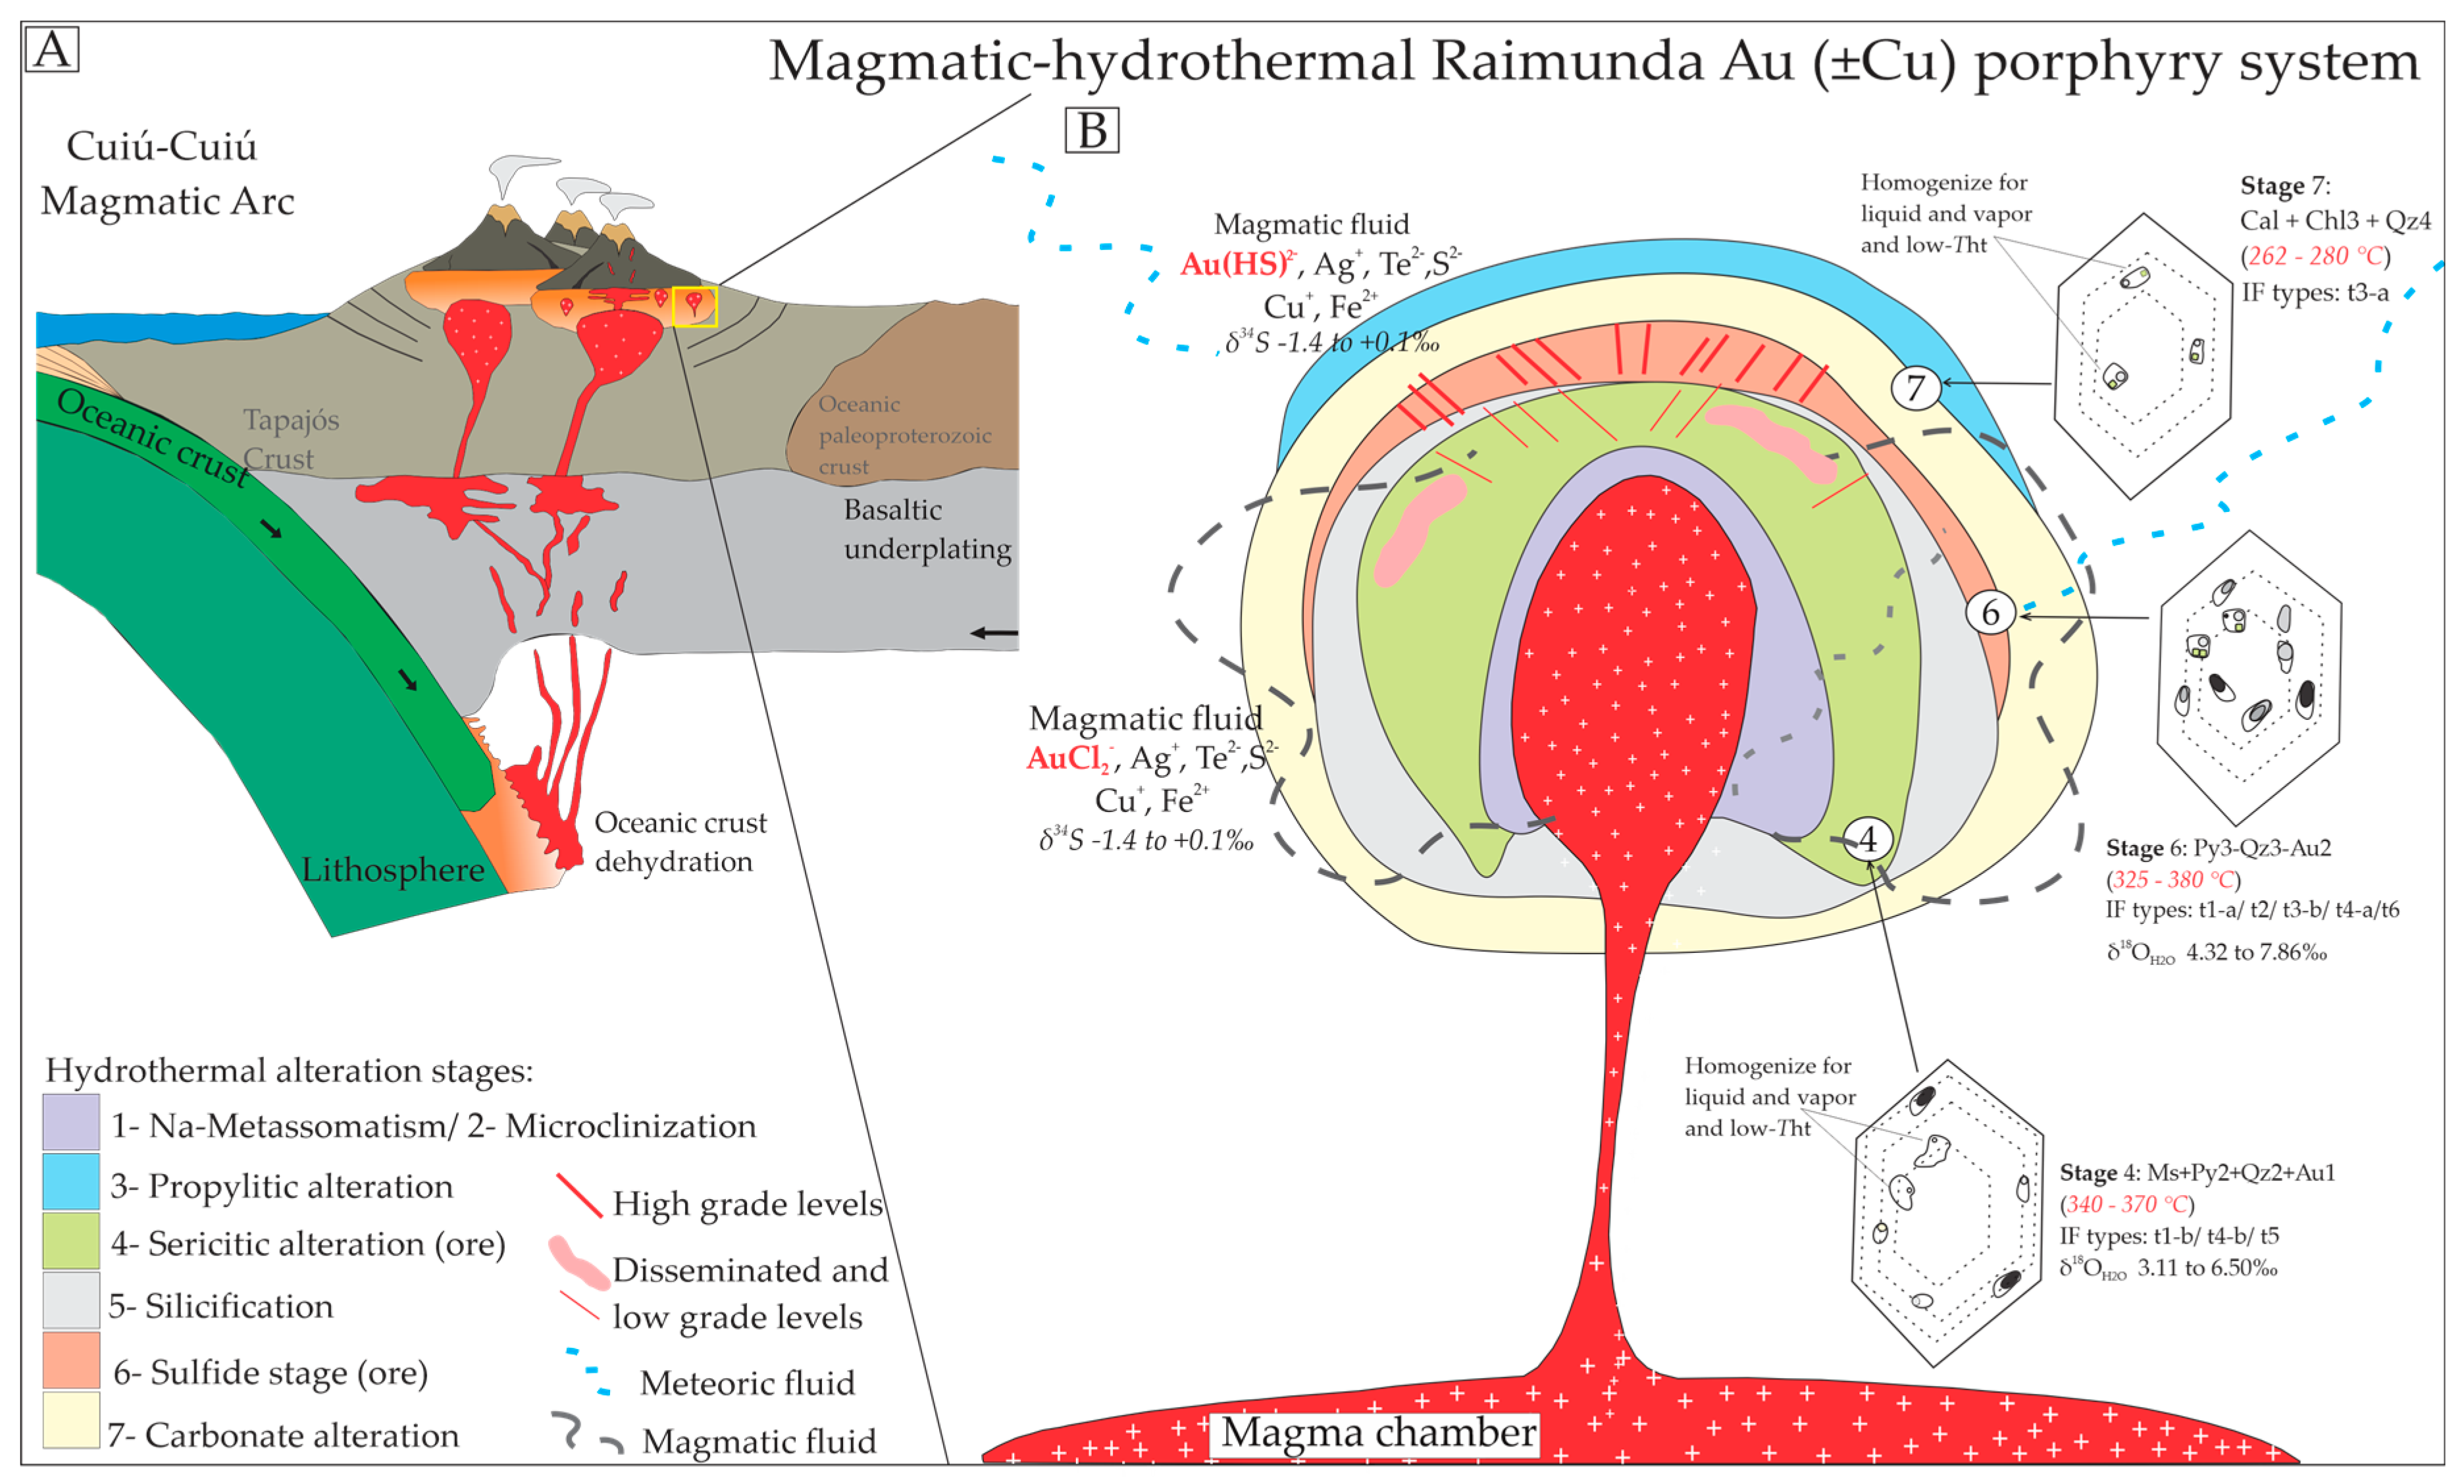
5.1. Tectonic Settings of Host Rocks, Hydrothermal Zonation and Mineralization

The Au (±Cu) Raimunda hydrothermal deposit is hosted in the monzogranite (2029 ± 4 Ma) and syenogranite (1987 ± 7.4 Ma to 1964 ± 1 Ma) facies, which are part of the Cuiú-Cuiú granite complex (2.03 and 1.98 Ga), eastern region of the Juruena Mineral Province [24]. These rocks are related to a plutonic-volcanic event in volcanic arc settings [46].
The zones more intensely affected by hydrothermal alteration are indicative of ore precipitation at intermediate to shallower levels. This is corroborated by pressure-release structures and vuggy quartz as well as breccias and brittle-like structures typical of shallower depths (Figure 5E).
Gold-rich mineral deposits in Novo Mundo were studied by [19,22]. These authors found disseminated gold hosted in intensely hydrothermally-altered syenogranite and monzogranite crosscut by andesitic to basaltic dikes. Those authors observed that mineralization was associated with intense phyllic alteration overprinting strong pervasive potassic alteration [22]. These other deposits share strong similarities with the Raimunda deposit, which might be indicative of similar mineralization events in the region. Other neighboring mineral deposits are hosted in 1.99–1.97 Ga granites [22].
In Novo Mundo, the mineralogical composition, the magmatic and hydrothermal textural features, the mineral parageneses, the cutting and overprinting relationships among host rocks and alteration and mineralization zones, microthermometric data, as well as chlorite and muscovite chemistry, allow us to propose the following paragenetic sequences for the Raimunda deposit presented in Table 1.
The evolution of the mineralizing hydrothermal system goes through the development of sericitic alteration (muscovite + pyrite2 + quartz2 + gold1), a lower-temperature stage compared to the previous ones (Na-metasomatism, microclinization, and propylitic alteration). Sericitic alteration represents the first mineralization stage, with a temperature estimate between 340 and 370 °C based on chlorite chemistry (Table S6, Supplementary Material).
This stage is followed by the main ore precipitation stage, with average temperature estimates between 325 and 380 °C, based on the homogenization temperature of type 1-a fluid inclusions. The following post-mineralization stage is marked by cooling and de- compression of hydrothermal fluids [47] and is represented by chloritization–carbonate alteration, with average temperatures of 262–280 °C, based on chlorite geothermometer (Chl3).

5.2. Origin, Hydrothermal System, and Evolution of Fluid Composition

Isotopic and fluid inclusion data indicate an evolution from hot, medium-salinity fluid (>450 °C and ≤10 wt.% NaCl eq.) to cooler, medium- to low-salinity fluids (<300 °C and ≤5 wt.% NaCl eq.).
The petrographic characteristics and fluid inclusion microthermometric data reveal the existence of two fluids: a low to medium salinity H2O–NaCl–CO2 aqueous-carbonic fluid (3.0–5.94 wt.% NaCl eq.) and a low-temperature high-salinity H2O–NaCl–CaCl2 aqueous late fluid (33.02–50.25 wt.% NaCl + CaCl2 eq.), and that make up the fluid system of the Au (±Cu) Raimunda deposit.
The CO2 content in aqueous-carbonic and carbonic fluid inclusions might be related to hydrolysis during hydrothermal alteration of the host rock (propylitic alteration), which consumed water from the fluid, enriching it in CO2. The high homogenization temperatures observed at these inclusions (up to 472 °C) corroborate this interpretation.
Aqueous fluids are divided into two chemical systems, based on the relationship Te versus salinity: (1) H2O-NaCl fluid in Qz2 and Qz3, with Te between −24.5 °C and −21.4 °C, and salinity between 0.87 and 9.72 wt.% NaCl eq.; (2) H2O-NaCl-CaCl2 fluid in Qz3 and Qz4, with the first melting temperature observed, interpreted as a Te, between −55 and −51.2 °C, and salinity between 33.02–50.25 wt.% NaCl + CaCl2 eq. (Table S8, Supplementary Material).
The saturated fluid displays homogenization temperatures Tht (290.5–367.5 °C, for t3-a; 200–250 °C, for t3-b main interval) with complete dissolution of the daughter mineral, thereby indicating homogeneous entrapment. And, despite the occurrence of two primary fluids (H2O–CO2 and H2O–NaCl) deriving from a single fluid and the variable homogenization into the vapor and liquid phases (t3 and t5), theses inclusion types do not belong to the same assembly (FIA), and the homogenization occurs in a medium to a large range of temperature, which is compatible with a homogeneous entrapment.
The occurrence of brines in aqueous and aqueous-carbonic primary fluid inclusions can yield the fluid mixing hypotheses, leading to brine dilution and an increase in salinity for aqueous-carbonic fluid, therefore, explaining the presence of the late-carbonate alteration at the deposit. Fluid mixing may have taken place at the time of the formation of Qz3, with ongoing brine activity through the formation of Qz4 at a lower temperature, when the aqueous-carbonic fluid began to reduce its activity and precipitate calcite, which is corroborated by late hydrothermal alteration (Cal + Chl3).
Thus, the evolution of the medium-salinity and very hot system (>470 °C) is linked to the stages of hydrothermal alteration prior to mineralization (sodic metasomatism, microclinization, and propylitic alteration); and the medium to low salinity (<10 wt.% NaCl eq.) cool system or progressively cooler (<380 °C) is associated with the main to late alteration stages sericitic alteration and contemporaneous sulfide stage associated with silica veins and carbonate alteration). Furthermore, the transition from microclinization into late carbonate alteration can suggest a progressive increase in pH values [48,49,50], which likely lasted throughout ore precipitation.
The calculated isotopic composition of the hydrothermal fluid responsible for both mineralization stages shows δ18OH2O values for stage 2 in the range between +4.32 and +7.86‰ (sulfide stage), while those calculated for stage 1 vary between +3.11 and +6.49‰ (sericitic alteration) (Table 3), which is coherent to isotopic compositions of fluids associated with felsic magmas [51] and are compatible with the magmatic compositional isotopic range expected for world-class porphyry-type magmatic-hydrothermal deposits, with a homogeneous isotopic fluid (δ18OH2O, 6–10‰) [52,53,54,55]. The results are similar to paragenetic and fluid inclusion data, and point to mixing between magmatic and meteoric fluids, that have values within the δ¹⁸O range of −10 to −20‰ according to Craig [56] but remained predominantly with characteristics of magmatic fluid [57].
Figure 11 compares δ18OH2O values, based on temperatures provided by chlorite chemistry, which is associated with sericitic alteration and the first mineralization stage, and δ18OH2O values based on homogenization temperatures from fluid inclusions associated with the main mineralization stage at the Raimunda deposit. The two groups show an isotopic range similar to those obtained for magmatic-hydrothermal deposits with mantle-derived fluid.
The coexistence of t1-a and t2 primary inclusions at the deposit, with similar temperatures, can indicate simultaneous fluid entrapment. Phase changes among the different types of inclusions may suggest that fluid immiscibility preceded their entrapment; homogenization temperatures decrease from type t1-a to t4-a on the salinity vs. homogenization temperatures diagram (Figure 11B), which is likely due to progressive cooling and/or mixing with relatively lower-temperature fluids, such as meteoric water [58].
δ34S data directly reflects its source given that under proper redox and pH conditions for precipitation, much or all of the sulfur available in the system may have been converted into H2S at the first mineralization stage [59]. In turn, once the second mineralization stage is composed of sulfides only, the isotopic composition of sulfur in pyrite matches that of the sulfur source [59].
Figure 12 correlates δ34S values of the Raimunda deposit (−1.4 to +0.1‰) with the isotopic ranges of several deposits in the Tapajós and Juruena Provinces, as well as with world-class deposits and deposits and geological environments available in the literature and are compatible with those of other world-class magmatic-hydrothermal deposits [60,61,62].
Reference values of δ34S from [63], combined with petrological and mineral textural evidence at the Raimunda deposit, are indicative of mineralization of magmatic origin, which may be related to the fluids that hydrothermally altered the Novo Mundo granite. This is corroborated by the similarity between δ34S values and hydrothermal patterns at the Raimunda deposit and those reported for other world-class magmatic-hydrothermal deposits and/or granite-related mineral deposits [64,65,66,67,68].
The occurrence of primary gold in the Juruena Mineral Province demonstrates a close spatial relationship with (i) oxidized I-type calc-alkaline granites, (ii) volcanic rocks, and (iii) volcano-sedimentary sequences linked to continental magmatic arcs [4]. The common occurrence of native Au as inclusions in pyrite and chalcopyrite is indicative of early Au oversaturation in the fluid which we relate to sulfide precipitation and phase separation, destabilizing the AuHS0 or Au(HS)2− complex, leading to the accumulation of Au particles [67,69].
At the Raimunda deposit, the ore is composed of native gold and has a mantle-like polymetallic signature (Au ± Ag ± Cu ± Bi ± Te ± Pb) associated with pyrite, chalcopyrite, chalcocite, larosite, bismuthinite and other bismuth sulfides emplaced at a zone of intense sulfidation.
This copper-rich sulfide ore assemblage suggests that the Raimunda deposit formed under fO2 conditions above the PPM buffer, pyrrhotite + pyrite + magnetite, which is close to mSO2/mH2S = 1 [69,70]. It is compatible with moderate to high fO2 conditions where fluids oscillate from low to high temperatures; the latter being represented by moderate-salinity aqueous-carbonic fluids (up to ≤370 °C and up to ≤10 wt% NaCl eq.). This scenario suggests that ore precipitation is linked and/or similar to porphyry magmatic-hydrothermal systems [71].
Figure 12. Sulfur isotope values (δ34SCDT) of different geological mineral deposits, isotopic data from the Tapajós and Juruena Province, Amazonian Craton. Numbers: 1—this study; 2—[2]; 3—[19]; 4—[8]; 5—[68]; 6—[71]; 7—Mineral deposits from Shanks [51]. The magmatic sulfides range (−3 to +3‰) corresponds to [62].
Minerals 14 01185 g012
Hence, our hypothesis is that during the final stage of granite crystallization (~2.03–1.98 Ga), high-salinity and higher-temperature single-phase fluids, with an intermediate density, were exsolved from a magma at high depth. These fluids went through immiscibility and separated into H2O-NaCl and CO2-rich fluids. During their ascent, fluids decompressed and cooled down [56], while ions (e.g., Au+, Ag+, Te2− and S2−) precipitated along favorable structures, under proper P–T conditions, giving rise to the first mineralization stage.
Other ore-forming elements (i.e., Au, Cu+, Ag+, Fe2+, S2− and Te 2+) were exsolved from the magmatic fluid and precipitated along microfractures and stockwork sulfide veins.
This last stage gave rise to the main stage of mineralization at the deposit, which is coherent with the ore mineral paragenesis.
The ore precipitation was triggered by the cooling of magmatic fluid expelled from magmatic chambers at shallower depths [67]. This model outlines that the input of meteoric water would only affect peripheral and/or post-mineralization hydrothermal alteration, such as propylitic alteration [57,67], without playing a significant role in the main mineralization stage, and the homogeneous δ18Ofluid values (3.11–7.86‰) corroborates this scenario. The relative depth of gold precipitation and, consequently, deposit formation can be helpful to preserve the Raimunda deposit until these days (Figure 13).
All these features are compatible with those of porphyry magmatic-hydrothermal deposits, commonly found in Phanerozoic volcano-plutonic settings, e.g., [72]. Although they lack some classic features of Phanerozoic analogous surrounding the Raimunda deposit, which may be due to variable erosion levels, it is likely associated with mineralizing events reported earlier for the Tapajós-Parima Paleoproterozoic Province [8].

6. Conclusions

The current study allows us to draw the following conclusions about the Au (±Cu) Raimunda deposit:
The gold mineralization is hosted in arc I-type calc-alkaline, peraluminous to metaluminous granitic rocks, subdivided into four granite facies (monzonite, monzogranite, biotite granodiorite, and syenogranite), with U–Pb zircon ages of 2.03–1.98 Ga, named Novo Mundo Complex, eastern region of the Juruena Mineral Province, Amazonian Craton.
The hydrothermal system resembles that of mineral deposits previously studied in the Novo Mundo Complex and in the eastern region of the province, which reveals an important regional association.
Hydrothermal alteration data and mineral and fluid chemistry data allow us to establish the following relationships: (a) the initial stages of alteration indicate temperatures > 470 °C; (b) progressive evolution of the hydrothermal system led to a temperature decrease that culminated into the first mineralization stage associated with sericitic alteration (340 and 370 °C); (c) it was followed by the main stage of ore precipitation, sulfide stage (Py3-Ccp-Cc-Bin-Au2), with average temperatures of 325–380 °C, as demonstrated by the homogenization temperature of type 1-a primary fluid inclusions; (d) the post-mineralization stage, marked by carbonate alteration and chloritization (Chl3), yielded average temperatures from 262 to 280 °C for the system.
Au (±Cu) mineralization occurs as Ag-rich (25–28%, electrum) gold inclusions and fracture-fills in pyrite, and the main mineralization stage mineralization at the deposit is composed of the following sulfide assemblage: pyrite, chalcopyrite, chalcocite, larosite, bismuthinite, hodrushite, krupkaite, and wittchenite.
The fluid inclusion study identified nine different subtypes of inclusion, varying from H2O–NaCl, H2O–NaCl–CO2, and H2O–NaCl–CaCl2 model systems. Based on the relationship between Te versus salinity, it was possible to identify two chemical systems in the Raimunda deposit: (1) H2O–NaCl fluid in Qz2 and Qz3, with Te between −24.5 and −21 °C and salinity between 0.87 and 9.72 wt.% NaCl eq.; and (2) H2O–NaCl–CaCl2 fluid in Qz3 and Qz4, with Te between −55.3 and −51.2 °C, and salinity of 33.02–50.25 wt.% NaCl + CaCl2 eq.
The Raimunda deposit evolved from essentially high to medium temperature (≤472 °C) and medium salinity (≤10 wt.% NaCl eq.) magmatic fluids, mixed with fluids meteoric (Tht: 98–190 °C; lower salinity: 1.39–6.74 wt.% NaCl eq.).
Ore precipitated under considerably high fS2 and fO2 conditions, and relatively medium to high temperatures (e.g., homogenization temperature of t1-a primary fluid inclusion suggests ~325 to 380 °C).
The isotopic composition of the mineralizing fluid points out to magmatic fluid, with δ18OH2O values of 3.11–7.86‰, indicating magmatic origin with a meteoric fluid contribution. The main stage of ore deposition was triggered by the instability of magmatic fluids with δ34Spy values between −1.4 to +0.1‰, similar to several regional and world-class magmatic-hydrothermal deposits.
The overall features of the Raimunda deposit are genetically compatible with those of magmatic-hydrothermal systems related to Au-mineralized porphyry formed from oxidized granitic magmas. These findings have implications for mineral exploration of gold and associated metals in the Juruena Mineral Province and Tapajós Province, Amazonian Craton.

Supplementary Materials

The following supporting information can be downloaded at: https://www.mdpi.com/article/10.3390/min14121185/s1, Table S1: Electron microprobe analyses results for pyrite crystals to Raimunda Au (±Cu) deposit, Novo Mundo, Juruena Mineral Province, Brazil, Table S2: Electron microprobe analyses results for chalcopyrite to Raimunda Au (±Cu) deposit, Novo Mundo, Juruena Mineral Province, Brazil, Table S3: Electron microprobe analyses results for gold to Raimunda Au (±Cu) deposit, Novo Mundo, Juruena Mineral Province, Brazil, Table S4: Electron microprobe analysis of chalcocite crystals and other copper-rich minerals in samples from Raimunda Au (±Cu) deposit, Novo Mundo, Juruena Mineral Province, Brazil, Table S5: Electron microprobe analysis of bismutinita and other copper-rich minerals in samples from Raimunda Au (±Cu) deposit, Novo Mundo, Juruena Mineral Province, Brazil, Table S6: Electron microprobe analyses results for chlorite from the Raimunda Au (±Cu) deposit, Novo Mundo, Juruena Mineral Province, Brazil. Abrreviations: CAT: Cathelineau (1988) [29]; CAT&N: Cathelineau & Nieva (1985) [28]; Z&F: Zang & Fyfe (1995) [37], Table S7: Electron microprobe analyses results for muscovite to Raimunda Au (±Cu) deposit, Novo Mundo, Juruena Mineral Province, Brazil, Table S8: Summary of microthermometric data of fluid inclusions from the Raimunda deposit, Novo Mundo, Juruena Mineral Province.

Author Contributions

Conceptualization, A.A.C.L. and M.A.M.; methodology, A.A.C.L.; software, A.A.C.L.; validation, A.A.C.L. and M.A.M.; formal analysis, A.A.C.L.; investigation, A.A.C.L. and M.A.M.; resources, A.A.C.L.; data curation, M.A.M.; writing—original draft preparation, A.A.C.L.; writing—review and editing, M.A.M.; supervision, M.A.M.; project administration, M.A.M.; funding acquisition, M.A.M. All authors have read and agreed to the published version of the manuscript.

Funding

This research was funded by the Coordenação de Aperfeiçoamento de Pessoal de Nível Superior—Brazil (CAPES)—Grant numbers 001 and by the Conselho Nacional de Desenvolvimento Científico e Tecnológico, Brazil (CNPq) (Grant numbers 426769/2016-3), provided funding for research.

Data Availability Statement

Data is contained within the article and Supplementary Materials.

Acknowledgments

The authors are grateful to mining companies Nexa Resource and Bemisa Holding S.A. for their logistical support and donation of materials to carry out this study; CAPES—Coordenação de Aperfeiçoamento de Pessoal de Nível Superior (Brazil) for the financial resources for assistance of laboratory analysis; CNPq—Conselho Nacional de Desenvolvimento Científico e Tecnológico, Brazil, for the financial resources for assistance of laboratory and field analysis.

Conflicts of Interest

The authors declare no conflicts of interest.

References

  1. Dardenne, M.A.; Schobbenhaus, C. Metalogênese do Brasil, 1st ed.; Universidade de Brasília: Brasília, Brazil, 2001; p. 394. [Google Scholar]
  2. Moura, M.A.; Botelho, N.F.; Olivo, G.R.; Kyser, T.K. Granite-related Paleoproterozoic, Serrinha gold deposit, Southern Amazonia, Brazil: Hydrothermal alteration, fluid inclusion and stable isotope constraints on genesis and evolution. Econ. Geol. 2006, 101, 585–605. [Google Scholar] [CrossRef]
  3. Paes de Barros, A.J. Granitos da Região de Peixoto de Azevedo—Novo Mundo e Mineralizações Auríferas Relacionadas—Província Aurífera Alta Floresta (MT). Ph.D. Thesis, Instituto de Geociências, Universidade Estadual de Campinas, Campinas, Brazil, 2007. [Google Scholar]
  4. Juliani, C.; Vasquez, M.L.; Klein, E.L.; Villas, R.N.; Echeverri-Misas, C.M.; Santiago, E.S.B.; Monteiro, L.V.S.; Carneiro, C.C.; Fernandes, C.M.D.; Usero, G. Metalogenia da Província Tapajós. In Metalogênese das Províncias Tectônicas Brasileiras, 1st ed.; Silva, M.G., Jost, H., Kuyumajian, R.M., Eds.; CPRM-Serviço Geológico do Brasil: Brasília, Brazil, 2014; pp. 51–90. [Google Scholar]
  5. Juliani, C.; Assis, R.R.; Monteiro, L.V.S.; Fernandes, C.M.D.; Martins, J.E.Z.S.; Costa, J.R.C. Gold in Paleoproterozoic (2.1 to 1.77 Ga) Continental Magmatic Arcs at the Tapajós and Juruena Mineral Provinces (Amazonian Craton. Brazil): A New Frontier for the Exploration of Epithermal-Porphyry and Related Deposits. Minerals 2021, 11, 714. [Google Scholar] [CrossRef]
  6. Mesquita, M.J.; Gomes, M.E.B.; Moreira, I.C.; Paes, R.A.S.; Hevelyn, E.S.M.; Matos, J.H.; Ruggiero, A.; Primo, G.; Ducart, D.F.; Poggi, L.; et al. Paleoproterozoic gold deposits at Alta Floresta Mineral Province, Brazil: Two overprinted mineralizing events? In Recent Advances in Understanding Gold Deposits: From Orogeny to Alluvium; Torvela, T., Lambert-Smith, J.S., Chapman, R.J., Eds.; Special Publications; Geological Society of London: London, UK, 2022; Volume 516, pp. 109–154. [Google Scholar] [CrossRef]
  7. Jamasmie, C. Anglo American ‘Encouraged’ by Drilling Results from Copper Asset in North Brazil. Available online: https://www.mining.com/anglo-american-encouraged-drilling-results-copper-asset-north-brazil/ (accessed on 18 November 2024).
  8. Guimarães, S.B.; Klein, E.L.; Harris, C.; Costa, I.S.L. Metallogenesis of the orosirian epithermal coringa gold-silver (Cu-Pb-Zn) deposit, southeastern Tapajós mineral Province, Amazonian craton, Brazil. Ore Geol. Rev. 2021, 128, 103908. [Google Scholar] [CrossRef]
  9. Poggi, L.; Ducart, D.F.; Mesquita, M.J.; Moreira, I.C.; Gomes, M.E.B.; Filho, C.R.S. New Insights into the Evolution and Footprints of the Paraíba Au-Cu-Mo Deposit, Alta Floresta Mineral Province (Brazil), through Integration of Spectral and Conventional Methods. Minerals 2022, 12, 1327. [Google Scholar] [CrossRef]
  10. Gaillard, N.; Williams-Jones, A.E.; Clark, J.R.; Salvi, S.; Perrouty, S.; Linnen, R.L.; Olivo, G.R. The use of lithogeochemistry in delineating hydrothermal fluid pathways and vectoring towards gold mineralization in the Malartic district, Québec. Ore Geol. Rev. 2020, 120, 103351. [Google Scholar] [CrossRef]
  11. Tassinari, C.C.G.; Macambira, M.J.B. A evolução tectônica do Cráton Amazônico. In Geologia do Continente Sul-Americano: Evolução da obra de Fernando Flávio Marques de Almeida; Mantesso Neto, V., Ed.; Beca: São Paulo, Brazil, 2004; pp. 471–485. [Google Scholar]
  12. Santos, J.O.S.; Hartmann, L.A.; Gaudette, H.E.; Groves, D.I.; McNaughto, N.; Fletcher, I.R. A new understanding of the provinces of the Amazonian Craton based on integration of sector mapping and U-Pb and Sm-Nd geochronology. Gondw. Res. 2000, 3, 453–488. [Google Scholar] [CrossRef]
  13. Fernandes, C.M.D.; Juliani, C.; Monteiro, L.V.S.; Lagler, B.; Echeverri Misas, C.M. High-K calc-alkaline to A-type fissure-controlled volcano-plutonism of the São Félix do Xingu region, Amazonian craton, Brazil: Exclusively crustal sources or only mixed Nd model ages? J. S. Am. Earth Sci. 2011, 32, 351–368. [Google Scholar] [CrossRef]
  14. Carneiro, C.D.C.; Juliani, C.; Carreiro-Araújo, S.A.; Monteiro, L.V.S.; Crósta, A.P.; Fernandes, C.M.D. New crustal framework in the Amazon Craton based on geophysical data: Evidences of deep east–west trending suture zones. IEEE Geosci. Remote Sens. Lett. 2019, 16, 20–24. [Google Scholar] [CrossRef]
  15. Juliani, C.; Fernandes, C.M.D.; Monteiro, L.V.S. Características da subducção, paleoclima e eventos erosivos paleoproterozoicos (2.1–1.88 Ga) e seus efeitos na estruturação da parte sul do Cráton Amazônico. In Simpósio de Geologia da Amazônia, 14th ed.; Gorayeb, P.S.S., Teixeira, S.G., Eds.; Sociedade Brasileira de Geologia–Núcleo Norte: Marabá, Brazil, 2015; p. 81. (In Portuguese) [Google Scholar]
  16. Fernandes, C.M.; Fontes, S.L.; La Terra, E.F.; Miquelutti, L.G.; Maurya, V.P. Electrical crustal structure of Alta Floresta Gold Province eastern sector, SW Amazon Craton, Brazil. J. S. Am. Earth Sci. 2018, 86, 244–258. [Google Scholar] [CrossRef]
  17. Cassini, L.V.; Moyen, J.; Juliani, C. Orosirian magmatism in the Tapajós Mineral Province (Amazonian Craton): The missing link to understand the onset of Paleoproterozoic tectonics. Lithos 2020, 356–357, 105350. [Google Scholar] [CrossRef]
  18. Alves, C.L.; Rizzotto, G.J.; Rios, F.S.; Barros, M.A.S. The Orosirian Cuiú-Cuiú magmatic arc in Peixoto de Azevedo domain, Southern of Amazonian Craton. J. South Am. Earth Sci. 2020, 102, 102648. [Google Scholar] [CrossRef]
  19. Alves, C.L.; Rizzotto, G.J.; Rios, F.S.; Gonçalves, G.F. Áreas de Relevante Interesse Mineral-Projeto Evolução Crustal e Metalogenia da Província Mineral Juruena-Teles Pires; CPRM: Goiânia, Brazil, 2019; ISBN 978-85-7499-547-2. [Google Scholar]
  20. Assis, R.R. Depósitos Auríferos Associados ao Magmatismo Félsico da Província de Alta Floresta (MT), Cráton Amazônico: Litogeoquímica, Idade das Mineralizações e Fonte dos Fluidos. Ph.D. Thesis, Instituto de Geociências, Universidade Estadual de Campinas, Campinas, Brazil, 2015. [Google Scholar]
  21. Lagler, B.; Juliani, C.; Fernandes, C.M.D.; da Cruz, R.S.; Vieira, D.A.S. Paleoproterozoic volcanic caldera in the Amazonian Craton, northern Brazil: Stratigraphy, lithofacies characterization, and lithogeochemical constraints. J. S. Am. Earth Sci. 2019, 95, 102252. [Google Scholar] [CrossRef]
  22. Assis, R.R.; Xavier, R.P.; Creaser, R.A. Linking the Timing of Disseminated Granite-Hosted Gold-Rich Deposits to Paleoproterozoic Felsic Magmatism at Alta Floresta Gold Province, Amazon Craton, Brazil: Insights from Pyrite and Molybdenite Re-Os Geochronology. Econ. Geol. 2017, 112, 1937–1957. [Google Scholar] [CrossRef]
  23. Teixeira, N.; Borda, M.; Ganade, C.; Gaspar, J.C.; Chelle-Michou, C.; Porto, F. Jaca Cu-Au (Mo) Pórfiro: Geocronologia e Isotopia do Sistema Magmático Mineralizante; Sumário Executivo; CPRM: Goiânia, Brazil, 2023; 7p. [Google Scholar]
  24. Testa, L.G.C. Geologia, Petrologia e Geocronologia dos Granitos da Região de Novo Mundo (MT) e Implicações para a Evolução Magmática e Regional. Master’s Thesis, University of Brasília, Brasília, Brazil, 2018. [Google Scholar]
  25. Miguel, E., Jr. Mineralizações Auríferas do Lineamento Peru-Trairão Província Aurífera de Alta Floresta—MT, Controle Estrutural e idade U–Pb das Rochas Hospedeiras. Master’s Thesis, Instituto de Geociências, Universidade Estadual de Campinas, Campinas, Brazil, 2011. [Google Scholar]
  26. Pirajno, F. Hydrothermal Processes and Mineral Systems, 1st ed.; Springer: Berlin, Germany, 2009; p. 1273. [Google Scholar]
  27. Hedenquist, J.W.; Arribas, A. 2022. Exploration Implications of Multiple Formation Environments of Advanced Argillic Minerals. Econ. Geol. 2022, 117, 609–643. [Google Scholar] [CrossRef]
  28. Cathelineau, M.; Nieva, D. A chlorite solid solution geothermometer. The Los Azufres geothermal system (Mexico). Contrib. Miner. Petrol. 1985, 91, 235–244. [Google Scholar] [CrossRef]
  29. Cathelineau, M. Cation site occupancy in chlorites and illites as a fuction of temperature. Clay Miner. 1988, 23, 471–485. [Google Scholar] [CrossRef]
  30. Roedder, E. Fluid inclusions. In Reviews in Mineralogy, 1st ed.; Mineralogical Society of America: Blacksburg, VA, USA, 1984; Volume 12. [Google Scholar]
  31. Shepherd, T.J.; Rankin, A.H.; Alderton, D.H.M. A Practical Guide to Fluid Inclusions Studies; Blackie and Sons: Glasgow, UK; London, UK, 1985; p. 253. [Google Scholar]
  32. Van den Kerkhof, A.M.; Hein, U.F. Fluid inclusion petrography. Lithos 2001, 55, 27–47. [Google Scholar] [CrossRef]
  33. Chinchilla, D.; Arroyo, X.; Merinero, R.; Piña, R.; Nieto, F.; Ortega, L.; Lunas, R. Chlorite geothermometry applied to massive and oscillatory-zoned radiated Mn-rich chlorites in the Patricia Zn-Pb-Ag epithermal deposit (NE, Chile). Appl. Clay Sci. 2016, 134, 210–220. [Google Scholar] [CrossRef]
  34. Hey, M.H. A new review of chlorites. Miner. Mag. 1954, 30, 277–292. [Google Scholar] [CrossRef]
  35. Tischendorf, G.; Forster, H.-J.; Gottesmann, B.; Rieder, M. True and brittle micas: Composition and solid-solution series. Miner. Mag. 2007, 71, 285–320. [Google Scholar] [CrossRef]
  36. Kranidiotis, P.; MacLean, W.H. Systematics of chlorite alteration at the Phelps Dodge massive sulfide deposit, Matagami, Québec. Econ. Geol. 1987, 82, 1898–1911. [Google Scholar] [CrossRef]
  37. Zang, W.; Fyfe, W.S. Chloritization of the hydrothermally altered bedrock at the Igarapé Bahia gold deposit, Carajás, Brazil. Miner. Depos. 1995, 30, 30–38. [Google Scholar] [CrossRef]
  38. Jowett, E.C. Fitting iron and magnesium into the hydrothermal chlorite geothermometer. In Proceedings of the GAC/MAC/SEG Joint Annual Meeting, Program with Abstracts, Toronto, Canada, 27–29 May 1991; Volume 16, p. A62. [Google Scholar]
  39. Xie, X.; Byerly, G.R.; Ferrell, R.E. IIb trioctahedral chlorite from the Barberton greenstone belt: Crystal structure and rock composition constraints with implications for geothermometry. Contrib. Mineral. Petrol. 1997, 126, 275–291. [Google Scholar] [CrossRef]
  40. Goldstein, R.H.; Reynolds, T.J. Systematics of Fluid Inclusions in Diagenetic Minerals; SEPM (Society for Sedimentary Geology) Short Course: Tulsa, OK, USA, 1994; p. 213. [Google Scholar]
  41. Steele-MacInnis, M.; Bodnar, R.J.; Naden, J. Numerical model to determine the composition of H2O–NaCl–CaCl2 fluid inclusions based on microthermometric and microanalytical data. Geochim. Cosmochim. Acta 2022, 75, 21–40. [Google Scholar] [CrossRef]
  42. Bodnar, R.J. Revised equation and table for determining the freezing point depression of H2O-NaCl solutions. Geochim. Cosmochim. Acta 1993, 57, 683–684. [Google Scholar] [CrossRef]
  43. Parry, W.T. Estimation of XCO2, P and fluid inclusion volume from fluid inclusion temperature measurements in the system NaCL-CO2-H2O. Econ. Geol. 1986, 81, 1009–1013. [Google Scholar] [CrossRef]
  44. Matsuhira, Y.; Goldsmith, J.R.; Clayton, R.N. Oxygen isotopic fractionation in the system quartz-albite-anorthite-water. Geochim. Cosmochim. Acta 1979, 43, 1131–1140. [Google Scholar] [CrossRef]
  45. Ohmoto, H.; Rye, R.O. Isotopes of sulfur and carbon. In Geochemistry of Hydrothermal Ore Deposit, 3rd ed.; Barnes, H.L., Ed.; Wiley: Washington, DC, USA, 1979; pp. 509–561. [Google Scholar]
  46. Guimarães, S.B.; Klein, E.L. Geochemical and isotopic constraints on the host rocks of the magmatic-hydrothermal Coringa gold-silver (Cu-Pb-Zn) deposit of the Tapajós mineral province, Amazonia craton, Brazil. J. S. Am. Earth Sci. 2020, 103, 102726. [Google Scholar] [CrossRef]
  47. Monecke, T.; Monecke, J.; Reynolds, T.J.; Tsuruoka, S.; Bennett, M.M.; Skewes, W.B.; Palin, R.M. Quartz solubility in the H2O-NaCl system: A framework for understanding vein formation in porphyry copper deposits. Econ. Geol. 2018, 113, 1007–1046. [Google Scholar] [CrossRef]
  48. Baker, T. Emplacement depth and carbon dioxide-rich fluid inclusions in intrusion-related gold deposits. Ec. Geol. 2002, 97, 1111–1117. [Google Scholar] [CrossRef]
  49. Chiaradia, M. Gold endowments of porphyry deposits controlled by precipitation efficiency. Nat. Commun. 2020, 11, 248. [Google Scholar] [CrossRef]
  50. Reed, M.H. Hydrothermal alteration and its relationship to ore fluid composition. In Geochemistry of Hydrothermal Ore Deposits; Barnes, H.L., Ed.; John Wiley: New York, NY, USA, 1997; pp. 303–365. [Google Scholar]
  51. Shanks III, W.C. Stable isotope geochemistry of mineral deposits. In Treatise on Geochemistry; Elsevier: Amsterdam, The Netherlands, 2014; pp. 59–85. [Google Scholar] [CrossRef]
  52. Li, L.; Sun, F.; Bai, Y.; Wang, C.; Qian, Y.; Sun, Y.; Tan, S. Identification of hydrothermal alteration and mineralization in the Sancha magmatic Cu-Ni-Au sulfide deposit, NW China: Implications for timing and genesis of mineralization. Ore Geol. Rev. 2022, 143, 104770. [Google Scholar] [CrossRef]
  53. Sheppard, S.M.F. Characterization and isotopic variations in natural waters. In Stable Isotopes in High-Temperature Geological Processes; Valley, J.W., Taylor, H.P., Jr., O’Neil, J.R., Eds.; Walter de Gruyter GmbH & Co KG: Berlin, Germany, 1986; Volume 16, pp. 165–183. [Google Scholar]
  54. Zeng, G.; Xiang, W.; Zhang, Z.; Wang, J.; Jiang, J.; Wu, F. Fluid inclusions, H-O-S-Pb isotopes, and Rb-Sr geochronology of the Augaro gold deposit, West Eritrea, NE Africa: Implications for ore genesis. J. S. Am. Earth Sci. 2023, 206, 105029. [Google Scholar] [CrossRef]
  55. Zhang, Z.; Wang, Y.; Liu, j.; Lin, S.; Zhang, F.; Zhang, W.; Bo, Z.; Li, H. Sulfur isotope, fluid inclusions, and quartz solubility model decipher multistage hydrothermal fluids evolution and ore precipitation mechanism at the Nantai porphyry Mo deposit, Qinling, Central China. Chem. Geol. 2023, 617, 121273. [Google Scholar] [CrossRef]
  56. Craig, H. Isotopic variations in meteoric waters. Science 1961, 133, 1702–1703. [Google Scholar] [CrossRef] [PubMed]
  57. Fekete, S.; Weis, P.; Driesner, T.; Bouvier, A.S.; Baumgartner, L.; Heinrich, C.A. Contrasting hydrological processes of meteoric water incursion during magmatic-hydrothermal ore deposition: Na oxygen isotope study by ion microprobe. Earth Planet. Sci. Lett. 2016, 451, 263–271. [Google Scholar] [CrossRef]
  58. Wilkinson, J.J. Fluid inclusions in hydrothermal ore deposits. Lithos 2001, 55, 229–272. [Google Scholar] [CrossRef]
  59. Cooke, D.R.; Deyell, C.L.; Waters, P.J.; Gonzales, R.I.; Zaw, K. Evidence for magmatic-hydrothermal fluids and ore-forming processes in epithermal and porphyry deposits of the Baguio district, Philippines. Econ. Geol. 2011, 106, 1399–1424. [Google Scholar] [CrossRef]
  60. Xiong, S.F.; Gong, Y.J.; Jiang, S.Y.; Zhang, X.J.; Li, Q.; Zeng, G.P. Ore genesis of the Wusihe carbonate-hosted Zn-Pb deposit in the Dadu River Valley district, Yangtze Block, SW China: Evidence from ore geology, S-Pb isotopes, and sphalerite Rb-Sr dating. Miner. Deposita 2018, 53, 967–979. [Google Scholar] [CrossRef]
  61. Du, J.; Audétat, A. Early sulfide saturation is not detrimental to porphyry Cu-Au formation. Geology 2020, 48, 519–524. [Google Scholar] [CrossRef]
  62. Ohmoto, H.; Goldhabe, M. Sulfur and carbon isotopes. In Geochemistry of Hydrothermal Ore Deposits; Barnes, H., Ed.; Willey: New York, NY, USA, 1997; pp. 517–612. [Google Scholar]
  63. Sinclair, W. Porphyry deposits. In Mineral Deposits of Canada—A Synthesis of Major Deposit Types, District Metallogeny, the Evolution of Geological Provinces, and Exploration Methods; Goodfellow, W.D., Ed.; Special Publication; Geological Association of Canada, Mineral Deposits Division: St. Johns, NL, Canada, 2007; Volume 5, pp. 223–243. ISBN 978-1-897095-24-9. [Google Scholar]
  64. Wilson, A.J.; Cooke, D.R.; Harper, B.J.; Deyell, C.L. Sulfur isotopic zonation in the Cadia district, southeastern Australia: Exploration significance and implications for the genesis of alkalic porphyry gold–copper deposits. Miner. Depos. 2007, 42, 465–487. [Google Scholar] [CrossRef]
  65. Richards, J.P. Postsubduction porphyry cu-au and epithermal Au deposits: Products of remelting of subduction-modified lithosphere. Geology 2009, 37, 247–250. [Google Scholar] [CrossRef]
  66. Lambert-Smith, J.S.; Allibone, A.; Treloar, P.J.; Lawrence, D.M.; Boyce, A.J.; Fanning, M. Stable C.O.; Isotope, S. Record of Magmatic-Hydrothermal Interactions Between the Faleme Fe Skarn and the Loulo Au Systems in Western Mali. Econ. Geol. 2020, 115, 1537–1558. [Google Scholar] [CrossRef]
  67. Sillitoe, R.H. Porphyry copper systems. Econ. Geol. 2010, 105, 3–41. [Google Scholar] [CrossRef]
  68. Juliani, C.; Rye, R.O.; Nunes, C.M.; Snee, L.W.; Silva, R.H.C.; Monteiro, L.V.; Neto, A.A. Paleoproterozoic high-sulfidation mineralization in the Tapajós gold province, Amazonian Craton, Brazil: Geology, mineralogy, alunite argon age, and stable-isotope constraints. Chem. Geol. 2005, 215, 95–125. [Google Scholar] [CrossRef]
  69. Hoss, A.; Haase, K.M.; Keith, M.; Klemb, R.; Melfos, V.; Gerlach, L.; Pelloth, F.; Falkenberg, J.J.; Voudouris, P.; Strauss, H.; et al. Magmatic and hydrothermal evolution of the Skouries Au-Cu porphyry deposit, northern Greece. Ore Geol. Rev. 2024, 173, 1062332024. [Google Scholar] [CrossRef]
  70. Audétat, A.; Simon, A.C. Magmatic controls on porphyry copper genesis. Econ. Geol. 2012, 16, 553–572. [Google Scholar] [CrossRef]
  71. Assunção, R.F.S.; Klein, E.L. The Moreira Gomes deposit of the Cuiú-Cuiú goldfield: Fluid inclusions and stable isotope constraints and implications for the genesis of granite-hosted gold mineralization in the Tapajós Gold Province, Brazil. J. S. Am. Earth Sci. 2014, 49, 85–105. [Google Scholar] [CrossRef]
  72. Groves, D.I.; Bierlein, F.P. Geodynamic setting of mineral deposit systems. J. Geol. Society 2007, 164, 19–30. [Google Scholar] [CrossRef]
Figure 2. Raimunda deposit outcrops, Novo Mundo, Juruena Mineral Province, Brazil. (A,B) Photograph of old ore extraction pit area, highlighting the location of some of the drill holes; (C) Syenogranite block showing potassic feldspar phenocrysts; (D) Monzogranite block found around the area; (E) Mafic rocks blocks.
Minerals 14 01185 g002
Figure 3. Host rocks from the Raimunda deposit. (A) Monzonite, showing microclinization and veinlets composed of Cal, Chl, Qz and Ser with no preferred direction pattern; (B) Weakly microclinized monzogranite, cut by veinlets without preferential orientation of Qz + Chl + Ms + opaques; (C) Microclinized syenogranite, cut by venules of Cb, Qz, and Ms; (D) Microclinized granodiorite, cut by venules of Qz + Chl + Ms. Abbreviations: Cal: calcite; Chl: chlorite; Ms: muscovite; Qz: quartz.
Minerals 14 01185 g003
Figure 4. Hydrothermal alteration features in drill core samples from Raimunda gold deposit. (A) Monzonite micrographic texture, with portions of agglomerated and recrystallized quartz, along with Pl and Kfs, in addition to Ms, Chl, and opaque minerals; (B) Megacrystal of Qz strongly fractured in monzogranite rock, occurring in clusters of hydrothermal minerals containing Chl, Ser, and opaque minerals in zones of strong silicification; (C) Monzogranite alteration cluster containing Ms, Chl, Rt, and mafic minerals; (D) Monzogranite showing pervasive silicification, along with either monomineralic with only quartz or containing other phases; massive sulfide levels are observed by cutting the sample; (E) Granodiorite showing recrystallized Qz, Pl, and Kfs together with mafic minerals such as Amp, Bt, Chl, Ep, and mass of Ms; (F) Cluster of recrystallized minerals in alteration mass containing Pl, Qz, Fks, in addition to Ms, Chl in syenogranite sample; (G) Mass of hydrothermal minerals in syenogranite containing Ms, Qz, Rt lamellae, and opaque minerals. Abbreviations: Amp: amphibole; Bt: biotite; Chl: chlorite; Ep: epidote; Kfs: potassium feldspar; Ms: muscovite; Pl: plagioclase; Py: pyrite; Qz: quartz; Rt: rutile; Ser: sericite/fine muscovite.
Minerals 14 01185 g004
Figure 5. Hydrothermal alteration features and mineralized samples from the Raimunda Au (±Cu) deposit. (A) Drill hole sample with pervasive silicification, generalized sulfidation, chloritization, and sericitic alteration; (B) Polished thin of the yellow delimited field in (A); (C) photomicrograph showing strong silicification with recrystallized Qz surrounded by intense sericitic alteration; (D) Ms lamellae with recrystallized Qz, opaques, and sericitic alteration; (E) Drill hole sample highlighting pressure relief features, vuggy silica in quartz veins/veinlets, and levels of massive sulfide interspersed with monomineralic Qz veinlets; (F) Polished thin of the yellow delimited field in (E); (G) Massive sulfide levels showing Py crystals strongly fractured; (H) Sulfide veinlets, with Qz and Ms. Abbreviations: Ms: muscovite; Py: pyrite; Qz: quartz; Ser: sericite/fine muscovite.
Minerals 14 01185 g005
Figure 6. Ore mineral association in the Raimunda Au (±Cu) deposit, Novo Mundo, Juruena Mineral Province, Brazil. The images were obtained in reflected light and with parallel polarizers. (A) Massive sulfide texture, with anhedral and strongly fractured Py filled with Ccp, Cc, Bin, Au, and other copper sulfides; (BD) Strongly fractured pyrite filled by Au-Ccp-Cc-Bin and Cu sulfides association; (E) Au Included in Qz-Py association; (F) Au included in Py crystals strongly fractured and filled with other sulfides. Abbreviations: Au: gold; Bin: bismuthinite; Ccp: chalcopyrite; Cc: chalcocite; Qz: quartz; Py: pyrite.
Minerals 14 01185 g006
Figure 7. Classification diagrams of chlorite and muscovite. (A) Ternary diagram Mg, Al + □ (□ corresponds to the octahedral vacancy) and Fe, allocating the Fe-rich (chamosite) and Mg-rich (clinochlore) types; (B) Diagram showing the covariance between the Fe/(Fe + Mg) ratio and AlIV for the chlorites of the deposit; (C) FeAl vs. MgLi classification plot of muscovite by [35], placing the three mica species in solid solution. The samples fall into the muscovite field. Abbreviations: Ann: annite; Chl: chlorite; Ms: muscovite; Phl: phlogopite; Pol: polylithionite; Sid: siderophyllite.
Minerals 14 01185 g007
Figure 8. Fluid inclusions mapped in samples from the Raimunda deposit, Juruena Mineral Province, Brazil. (A) t1-a inclusions, primary liquid-rich aqueous and t2, primary, single-phase carbonic vapor-rich inclusions, occurring in clusters or isolated; (B) t2 inclusions, single-phase carbonic and two-phase aqueous-carbonic; (C) t1-a fluid inclusions occurring together with t2 fluid inclusions, two-phase and three-phase aqueous-carbonic; (D) tracks of secondary inclusions of type t3-b, three-phase (liquid, vapor and halite crystal– DM daughter mineral); (E) 4-b fluid inclusions, two-phase aqueous, and t3-b, three-phase aqueous inclusions; (F) t5 occurring in parallel tracks/lines and inclusions.
Minerals 14 01185 g008
Figure 9. Microthermometric histograms of H2O–NaCl aqueous fluid inclusions from the Raimunda deposit, Novo Mundo, Juruena Mineral Province. (A,B) Variation of Tmice vs. frequency of primary (t1-a and t4-a) and secondary (t1-b, t4-b and t5) inclusions; (C,D) Tht of primary (t1-a and t4-a) and secondary (t1-b, t4-b and t5) inclusions.
Minerals 14 01185 g009
Figure 10. (A) Fluid inclusions microthermometric TmCO2 histogram vs. frequency; (B) Ternary diagram showing the composition of t3 fluid inclusions (green square boxes) in terms of mass percent equivalent in NaCl and CaCl2 [41].
Minerals 14 01185 g010
Figure 11. (A) Diagram relating the δ18O values of the hydrothermal fluid vs. the homogenization temperature range of fluid inclusions related to the main stage of mineralization, based on [54]. The diagram shows green bars, representing the fluid obtained from quartz grains in paragenesis with sericitic alteration, and red bars, for quartz grains in paragenesis with sulfide stage (Py3-Au2-Ccp-Cc-Bin), considering the minimum and maximum temperature range of the main stage of mineralization of the deposit; (B) Diagram of salinity vs. homogenization temperature of fluid inclusions corresponding to the main stage of mineralization, in relation to the main magmatic-hydrothermal deposits. The Raimunda deposit analyses plotted in the porphyry field. The salinity-temperature curves and fields are based on [58].
Minerals 14 01185 g011
Figure 13. Graphic mineralization model showing the magmatic and hydrothermal periods of the Raimunda Au (±Cu) deposit, Juruena Mineral Province, Amazonian Craton. (A) The schematic representation of granite generation to Novo Mundo granites [24] during the evolution of the Paleoproterozoic Cuiú-Cuiú magmatic arc (2.03–1.96 Ga); (B) The hydrothermal and fluid evolution, indicating the main fluid stages, temperatures and isotope composition of Raimunda deposit. The zonation is only illustrative, as there is an overlap of stages in the Raimunda system.
Minerals 14 01185 g013
Table 1. Hydrothermal alteration stages and paragenetic evolution table of the Raimunda Au (±Cu) deposit, Juruena Mineral Province, Brazil.
EventPre-MineralizationMineralization StagesPost-Mineralization
Alteration
Stages
Na-MetassomatismMicroclinizationPropylitic AlterationSericitic Alteration
(Ms-Qz2-Chl2-Py2-Au1)
Silicification
(Qz3)
Sulfide Stage (Py3-Au2-Ccp-Cc-Bin)Carbonate Alteration
(Cal-Chl3-Qz4)
Mineral
Quartz 1 Minerals 14 01185 i001Minerals 14 01185 i002
Quartz 2 Minerals 14 01185 i003
Quartz 3 Minerals 14 01185 i004
Quartz 4 Minerals 14 01185 i005
K- Feldspar Minerals 14 01185 i006
AlbiteMinerals 14 01185 i007
Magnetite Minerals 14 01185 i008Minerals 14 01185 i009Minerals 14 01185 i010
Titanite Minerals 14 01185 i011
Rutile Minerals 14 01185 i012Minerals 14 01185 i013
Chlorite Minerals 14 01185 i014Minerals 14 01185 i015Minerals 14 01185 i016 Minerals 14 01185 i017
Muscovite Minerals 14 01185 i018Minerals 14 01185 i019Minerals 14 01185 i020 Minerals 14 01185 i021
Calcite Minerals 14 01185 i022Minerals 14 01185 i023 Minerals 14 01185 i024
Epidote Minerals 14 01185 i025
Pyrite 1 Minerals 14 01185 i026
Pyrite 2 Minerals 14 01185 i027
Pyrite 3 Minerals 14 01185 i028
Chalcopyrite Minerals 14 01185 i029 Minerals 14 01185 i030
Chalcocite Minerals 14 01185 i031
Larosite Minerals 14 01185 i032
Bismuthinite Minerals 14 01185 i033
Hodrushite/krupkaite/wittchenite Minerals 14 01185 i034
Gold Minerals 14 01185 i035 Minerals 14 01185 i036
Traces Minerals 14 01185 i037Minor Minerals 14 01185 i038Abundant Minerals 14 01185 i039
Temporal evolution Minerals 14 01185 i040
Table 2. Petrographic and microthermometric data of fluid inclusions from the Raimunda deposit, Juruena Mineral Province, Brazil. Abbreviations: L—liquid; V—vapor; S—daughter mineral (saturation solid); Ts—trapped solid. Te: eutectic temperature; Tmhh—hydrohalite melting temperature; Tmice—ice melting temperature; TmCO2—CO2 melting temperature; Tmcla—clathrate melting temperature; ThCO2—CO2 homogenization temperature; Tht—total homogenization temperature.
Fluid Inclusion TypeHost RockHydrothermal Alteration StageMineral AssociationPetrographic CharacteristicsMicrothermometric DataModel System
Type 1-a (L + V); n = 28Monzogranite; syenograniteSulfide stagePy3 + Ccp + Qz3 + Au2Primary; random; colorless; ellipsoidal, oval to irregularly shaped; 8–20 μm; F: 0.70–0.8Te = −24 to −21 °C; Tmice = −6.4 to −0.8 °C; Tht = 233.5 to 471.2 °C; salinity = 1.396–9.72 wt.% NaCl eq.; density; 0.409–0.895 g/cm3H2O-NaCl
Type 1-b (L + V);
n = 25
Monzogranite; syenograniteSericitic alteration Ms + Qz2 + Au1Secondary; planar grouping and trails; oblate; 3–12 μm; F: 0.7–0.8Tmice = −4.2 to −0.5 °C; Tht = 200.5 to 297 °C; salinity = 0.879–6.737 wt.% NaCl eq.; density = 0.715–0.918 g/cm3H2O-NaCl
Type 2 (V; L + V; L + L + V);
n = 40
MonzograniteSulfide stagePy3 + Ccp + Qz3 + Au2Primary; random distribution or in clusters; grayish; dark bubble; elongated and oval; 5–20 μm; F: 30–50TmCO2 = −57.3 to −56°C; Tmice = −3.8 to −2.9 °C; Tmcla = 6.2–8.5 °C; ThCO2 = 19–30.1 °C; Tht = 210 to 364.7 °C; salinity = 3.00–5.94 wt.% NaCl eq.; density = 0.87–0.88 g/cm3H2O-NaCl-CO2
Type 3-a (L + V; L + V + S); n = 3MonzograniteCarbonate alterationCal + Chl3 + Qz4Primary; random distribution; square-shaped, elongated, and sub-rounded; colorless or greenish; 8–22 μm; F: 60–70; with one cubic crystal (halite daughter mineral) Tmhh = −10.7 to −3.8 °C; Tht = 290.5 to 367.5 °C; salinity = 38.88–50.25 wt.% NaCl + CaCl2 eq.; density = 0.78–0.82 g/cm3H2O-NaCl-CaCl2
Type 3-b (L + V; L + V + S + Ts);
n = 19
MonzograniteSericitic alterationPy3 + Ccp + Qz3 + Au2Secondary; planar grouping and trails; oblate square-shaped, elongated, and sub-rounded; 3–12 μm; F: 60–80; with colorless cubic crystals (halite daughter mineral) and trapped solid locallyTe: −55 to −51.2 °C; Tmice = −43.2 to −37.8 °C; Tmhh = −10.6 to −1.1 °C; Tht = 100.6 to 251.5 °C; salinity = 33.02–38.21 wt.% NaCl + CaCl2 eq.; density = 0.87–0.97 g/cm3H2O-NaCl-CaCl2
Type 4-a (L + V);
n = 19
Monzogranite; syenograniteSilicification; Sulfide stagePy3 + Ccp + Qz3 + Au2Primary; clusters and isolated; colorless; 8–20 μm; F: 0.8–0.85 Tmice = −5.4 to −1.0 °C; Tht = 199.2 to 288 °C; salinity = 1.57–8.41 wt.% NaCl eq.; density = 0.74–0.92 g/cm3H2O-NaCl
Type 4-b (L + V); n = 41Monzogranite; syenograniteSericitic alterationMs + Qz2 + Au1Secondary; trails/aligned along micro-fractures in the quartz; 8–20 μm; F: 0.8–0.85 Tmice = −4.7 to −0.1 °C; Tht = 101 to 195 °C; salinity = 0.53–6.59 wt.% NaCl eq.; density = 0.87–0.97 g/cm3H2O-NaCl
Type 5 (L + V);
n = 8
Monzogranite; syenograniteSericitic alterationMs + Qz2 + Au1Secondary; irregular to sub-rounded shaped; colorless; 15 and 50 μm; F: 0.75–0.8Tmice = −4.2 to −0.8 °C; Tht = 98 to 190 °C; salinity = 1.39–6.74 wt.% NaCl eq.; density = 0.92–0.97 g/cm3H2O-NaCl
Type 6 (L; V)Monzogranite; syenograniteAll assemblages Colorless to greenish; rounded/oval to irregular; 4 and 20 μm; it occurs in all samples studied H2O-NaCl
Table 3. Isotopic composition of hydrothermal minerals and fluids from the Raimunda deposits, Novo Mundo granite, Juruena Mineral Province, Brazil.
SampleMineralHydrothermal Alteration Stageδ34SPy (‰)δ18OQz (‰)δ18O H2O (‰) [44]Estimated Isotopic Equilibrium Temperature (°C) from Fluid Inclusion Data
F75-05Qz2Sericitic alteration 93.11–3.99340–370
F70-02 9.63.72–4.59
F73-02 10.34.72–5.29
F70-03Py2−0.5
Qz2 11.55.62–6.50
F73-03Py3Sulfide stage0.1 325–380
Qz3 12.66.22–7.86
F48-A15Py3−1
Qz3 12.25.82–7.46
F70-01Py3−0.111.14.73–6.36
F78-05Py3−0.7
Qz3 11.65.23–6.85
F73-04Py3−1.4
Qz3 10.74.32–5.95
Disclaimer/Publisher’s Note: The statements, opinions and data contained in all publications are solely those of the individual author(s) and contributor(s) and not of MDPI and/or the editor(s). MDPI and/or the editor(s) disclaim responsibility for any injury to people or property resulting from any ideas, methods, instructions or products referred to in the content.

