Abstract
A cementitious paste fill (CPF) ensures the long-age stability of underground cavities. Recently, superplasticizers, specifically ones that are polycarboxylate ether-based, have been incorporated to enhance CPF performance, yet their long-term effects on permeability, mechanical properties, and microstructures remain unclear. This study investigates these effects with CPF samples containing varying superplasticizer dosages (0%, 1%, 3%, 5%) that have been cured for up to 150 days. Rheological assessments (slump cone, vane shear tests), unconfined compressive strength testing, microstructural characterization (MIP, SEM), and hydraulic conductivity measurements were performed alongside XRD and thermal analyses (TAns) on high w/c (2) cement paste samples. The results showed that superplasticizer addition reduced CPF water content by 23% and yield stress by six times, aiding slurry transport. Long-term strength was enhanced by up to 2.4 times compared to the control samples, indicating improved underground stability. Superplasticizers altered the CPF samples stress–strain responses, increasing their load-bearing capacity. TG/DTG and XRD analyses revealed that hydration product development increased and porosity decreased in the presence of a superplasticizer. Hydraulic conductivity and permeability also decreased significantly. SEM and MIP analyses showed that the superplasticizer enhanced denser microstructures with fewer pores and fractures. These findings offer promising implications for designing CPFs with improved strength, durability, and environmental sustainability.
1. Introduction
With the exhausting of ores deposited in underground/surface mines becoming a global concern, underground mining has emerged as a prevalent method for ore extraction [1]. However, this approach presents significant challenges, such as ground instability during mining operations and the management of mine waste post-extraction. Ensuring the stability of the surrounding area where the ore is located is crucial for the safe continuation of underground mining activities. To address this, the backfill technique has been widely employed for many years. Among the modern backfill techniques, cemented paste fill (CPF) has gained popularity due to its operational and environmental advantages [2,3,4]. This technique involves mixing waste generated from ore extraction or milling processes (tailings) with cement and water and subsequently depositing it into underground cavities [5,6]. Adopting this technique not only reduces waste disposal costs and environmental impacts but also proves attractive to miners due to these benefits.
In mining, CPFs require engineering and designing before being placed into the voids created by ore extraction, considering the mechanical and environmental performance and durability of the backfill [7,8,9]. This is because, once the CPFs are placed underground, they must have both environmental characteristics that do not harm the area where they are located and an assured load-bearing capacity to provide a safe underground working environment [6,10]. The most common measure of CPF performance mechanically is the unconfined compressive strength (UCS) experiment, which evaluates the deformation response and stiffness of CPF, which are critical for underground ground support. However, the stress–strain behavior of CPF is also crucial for the efficiency and safety of underground mine support systems. The stiffness and deformation response of CPF determines how it will perform as an underground mine ground support. Deficiencies in the performance of CPF can lead to serious consequences, such as production loss, labor issues, injuries, fatalities, and mine collapse [11,12].
Sulfur minerals contained in the tailings are used in the backfill, and, with their presence, the fill’s long-age stability is adversely proportional to the fill’s strength acquisition [13,14]. The oxidation of sulfur minerals causes acid/sulfate forms, which give rise to undesirable chemical reactions with CPF components. These reactions result in the breakdown of hydration products and the creation of expansive phases, reducing fill durability. The hydraulic conductivity (permeability) of CPF determines the affluence with which water and contaminants may enter and act via the CPF matrix [15]. High hydraulic conductivity accelerates chemical reactions within the CPF, reducing its durability [16,17]. The pore structure and cracks facilitate the ingress of oxygen and water into the CPF, increasing the oxidation of sulfur minerals. This adversely affects the durability of CPF and exposes the mine environment or groundwater to the risk of acid mine drainage (AMD) formation [13,14]. The potential for AMD production depends on the reactivity of the mine waste comprising the CPF matrix, particularly its oxidation potential [18,19,20]. This degree of reactivity is also influenced by the composition and quantities of sulfur minerals in the CPF system and is regulated by the permeability characteristics of CPF, which affect the transport properties of fluids (e.g., oxygen/water) within the backfill [13,15,21]. The most critical parameter negatively impacting the strength, durability, and environmental properties of CPF is the increasing water content, which leads to higher saturated hydraulic conductivity and changes in microstructure [12,15,22,23,24]. Reducing the amount of water within the fill mixture could result in decreased porosity, leading to a more compact or denser CPF mass [2,3,12].
Considering the aforementioned challenges and facts, researchers have increasingly focused on incorporating superplasticizers into CPF mixtures in recent years to reduce water content without compromising flowability [25,26,27]. However, most prior works have explored the impact of superplasticizers on fill’s fresh properties, such as water demand, workability, rheology, or its strength and microstructure at early ages. Noteworthy studies [28,29,30,31,32,33] explored the strength and rheological effects of superplasticizers on CPF, finding that their incorporation not only improved the flow properties of CPF but also positively impacted its strength while also pointedly reducing the water demand of CPF mixtures while maintaining a constant consistency. Despite the improvement demonstrated in early strength and flow features in prior studies, there exists a research gap regarding the appraisal of long-age effects of superplasticizers on fill’s strength, permeability, and pore structure. The novelty of this paper lies in examining the long-term effects of superplasticizers on the strength, permeability, and pore structure of CPF and illuminating aspects of these effects that have not previously been adequately addressed, demonstrating the potential of CPF to provide safe working conditions and improve environmental performance in underground mining. Thus, to end it, this study aims to scrutinize the changes in the long-age strength, stress–strain behavior, pore structure, and permeability of CPF with a full-range water-reducing admixture (next-generation polycarboxylate ether-based superplasticizers). In addition, this study delved into the superplasticizer effect on CPF’s flow features and water demand.
2. Materials and Methods
2.1. Materials
2.1.1. Cement and Silica Tailings
During the current examination, cement/synthetic silica tailing (ST) was employed as a solid material for CPFs. General-use Portland cement (GU) was selected as the binding agent for formulating CPF samples. GU is a widely utilized cement type in backfill practices. The choice of ST for backfill sample preparation was motivated by the complex chemical composition of natural tailings, which introduces uncertainties in interpreting test results, mostly concerning microstructures [34,35,36]. The ST used in this study chiefly consisted of silicon dioxide (SiO2 −99.8%). Table 1 demonstrates the chemistry of GU and ST.

Table 1.
Chemical components of the GU and ST.
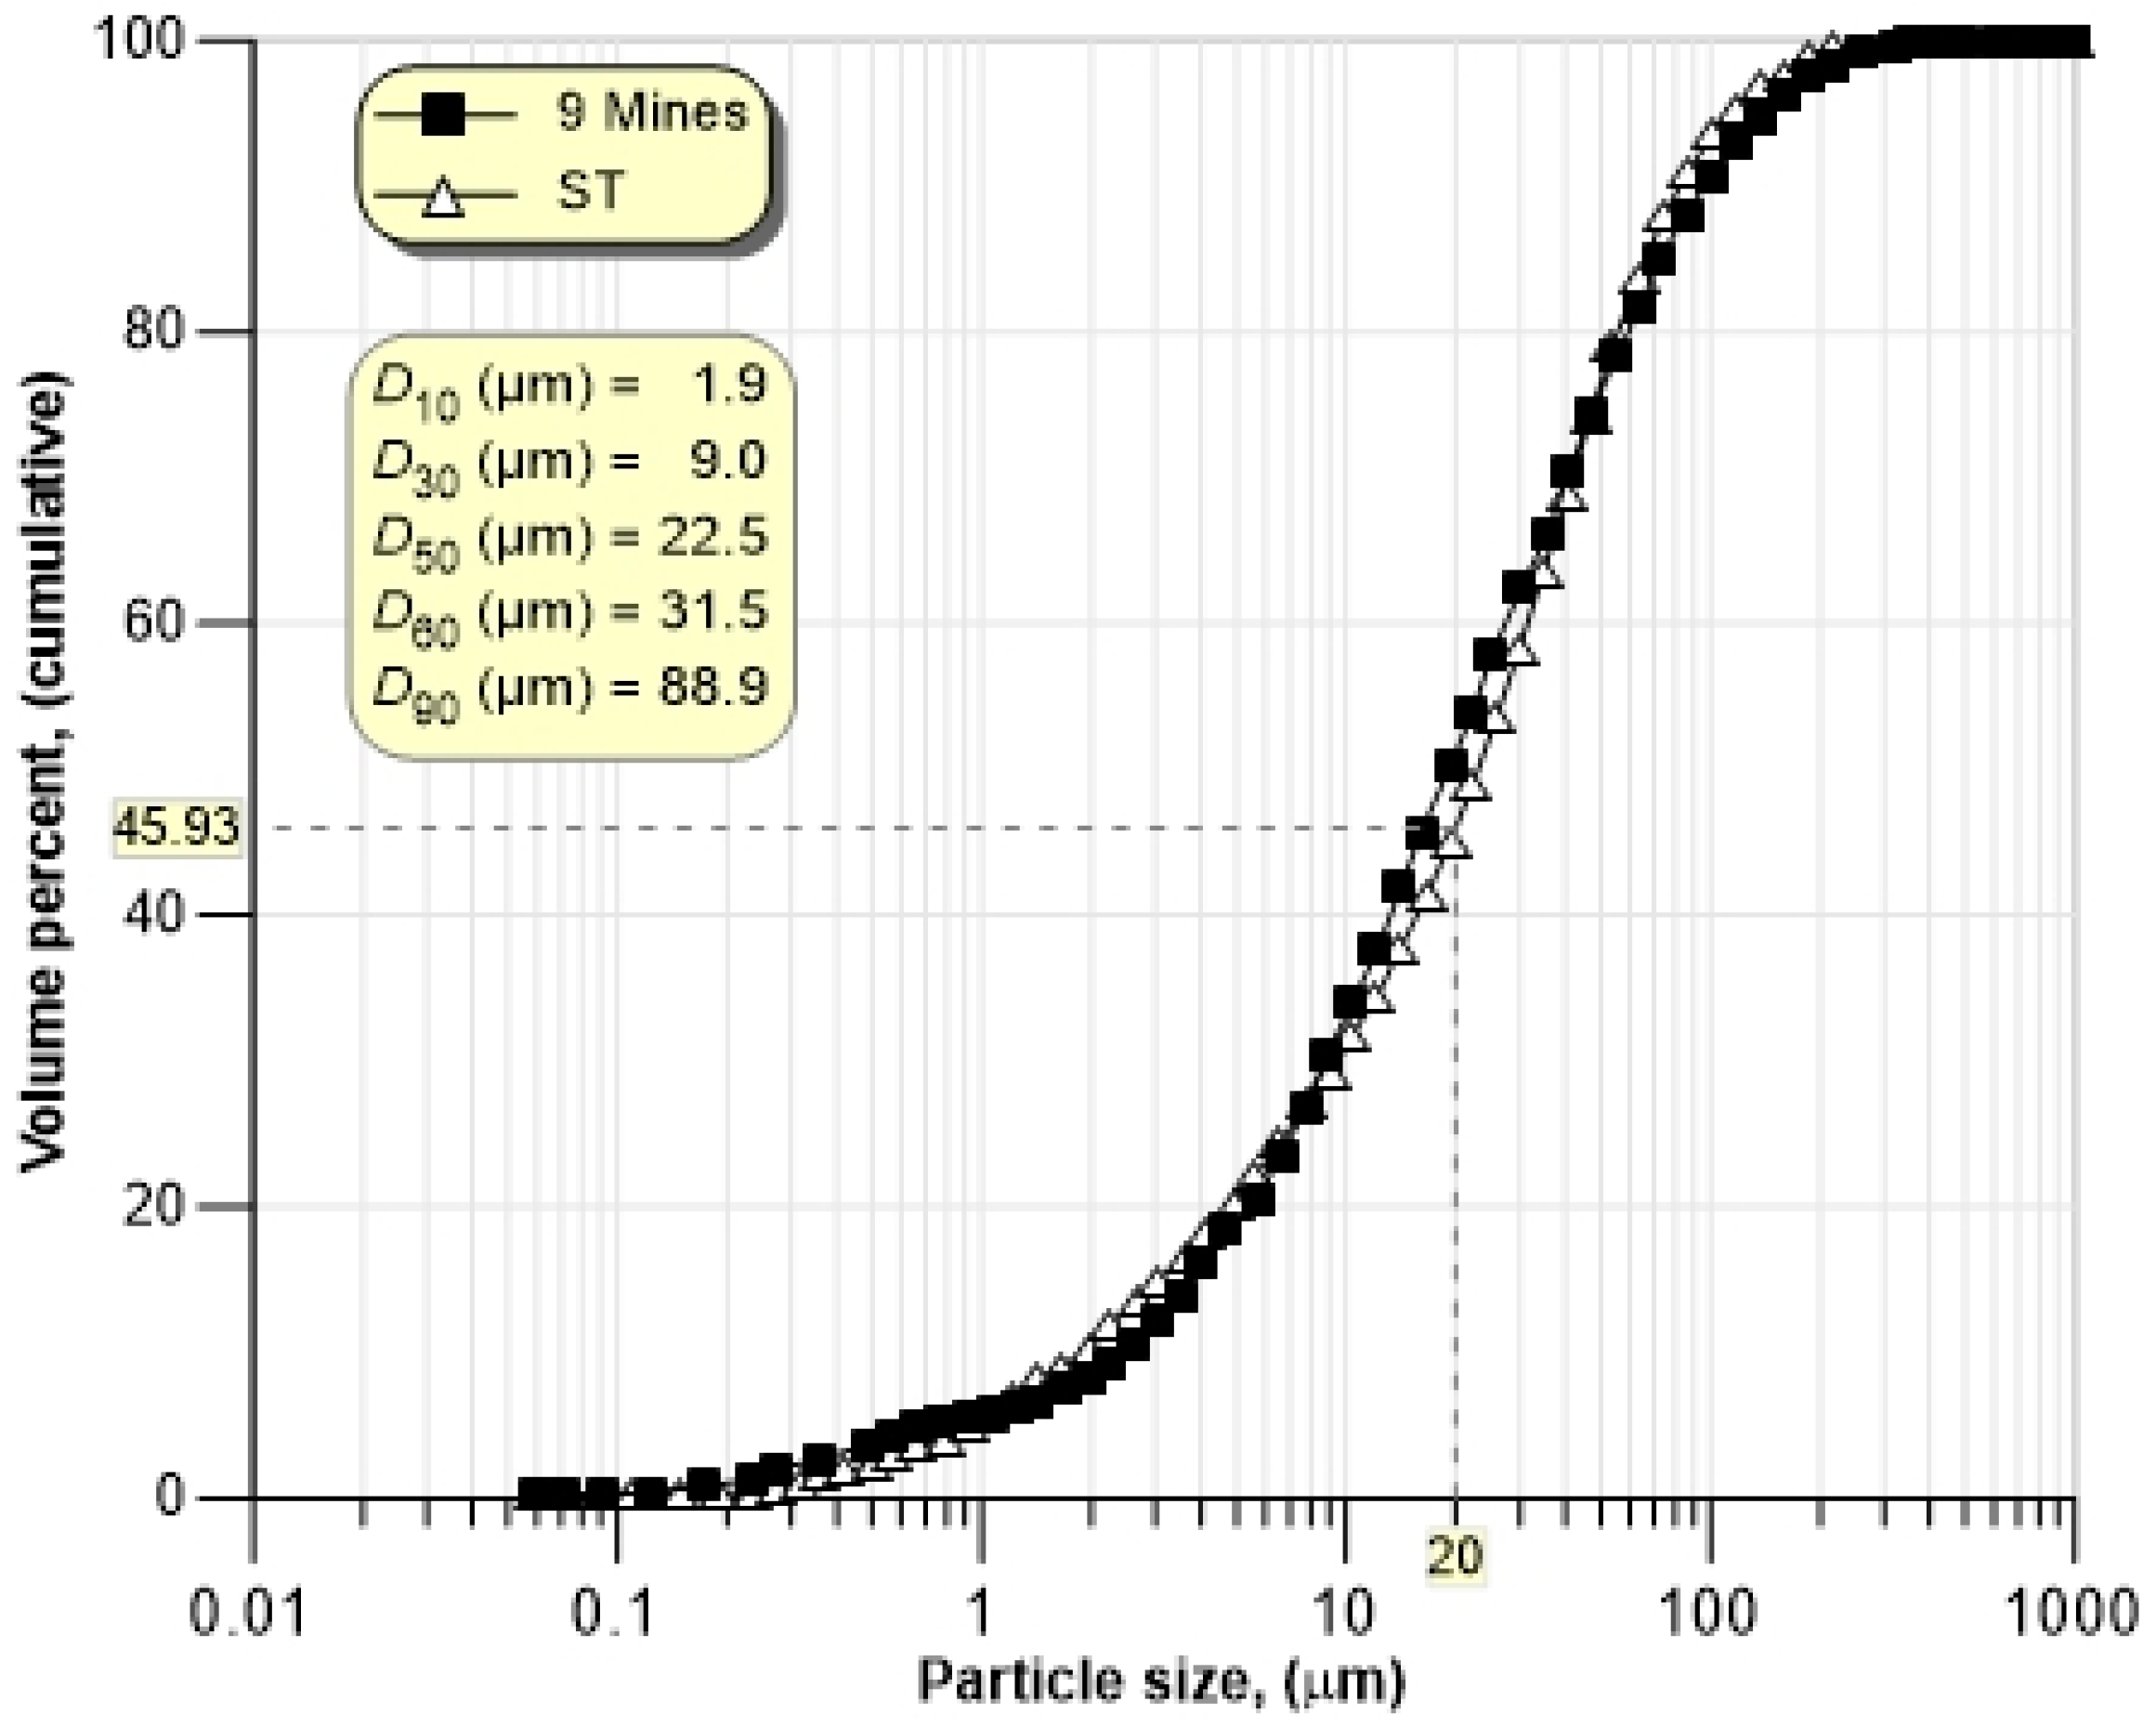
The distribution of particle sizes in tailing materials significantly influences the flow characteristics, mechanical properties, and microstructural behaviors of CPF. Prior works have verified that increasing the proportion of fine particles within the fill could result in decreased porosity and heightened strength [2,37,38]. However, the excessive use of fine-grained materials results in a larger surface area, necessitating a higher water requirement, which leads to the formation of a porous material. Therefore, it is crucial to determine the tailings’ particle size distribution (PSD).
Figure 1 depicts the PSD of ST and the mean PSD of nine Canadian mine tailings. One can comment that ST contains approximately 45 wt.% grains of less than 20 µm, suggesting their classification as medium-categorized tailings, as proposed by Landriault’s scheme [39]. This information suggests that ST can be employed as an auxiliary for tailings within CPF applications. Figure 1 shows the grading and physical properties of ST. The effective size (D10) was calculated as 1.9. Additional D(30,50,60,90) values of ST are calculated in Figure 1.
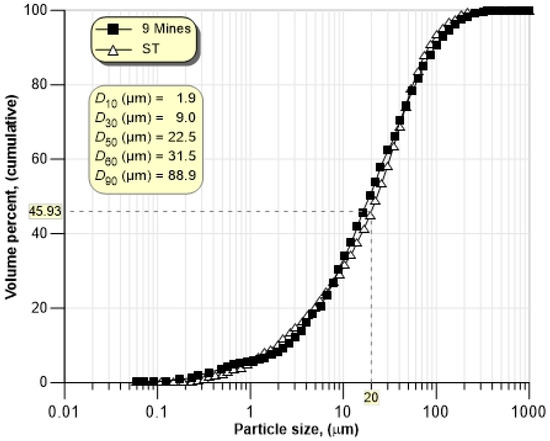
Figure 1.
Grain size and distributions of ST and nine Canadian mine tailings.
2.1.2. Admixture
The study utilized chemical admixture and tap water as liquid materials. The superplasticizer admixture, known as MasterGlenium 7500, belongs to the category of full-range water-reducing (FRWR) admixtures, leveraging the advanced polycarboxylate technology of the next generation. This superplasticizer meets the ASTM C494/C494M [40] conformity requests for categories A, F, water-reducing, and high-range water-reducing admixtures. Table 2 shows the principal features of the superplasticizer admixture.
Table 2.
Features of the superplasticizer (MasterGlenium 7500) employed in this study.
2.1.3. CPF Sample Preparation and Mixing Recipes
A total of 72 samples of CPF were prepared by blending cement, water, superplasticizer, and ST using mixer equipment. The proportion of cement in the CPF samples was selected to be 4.5% of the total solid, considering its importance in both strength and cost. Superplasticizer was included with different ratios of 1%, 3%, and 5% by mass of the cement, provided that it was within the recommended usage dosages. To match the consistency of paste fill used in practical applications, the samples were prepared with a target consistency of 20 cm. Table 3 offers a swift mixing recipe for experimental samples.
Table 3.
Mixing formulas used in the preparation of CBP samples.
To ensure the uniformity of the CPF samples, dry materials were initially pre-mixed. The chemical admixture was then added to the mixing water before being incorporated into the mixture, facilitating optimal penetration. Subsequently, all components were added to a blender with a 20 L capacity and mixed for 7 min to achieve homogeneity. Following blending, materials were cast in cylindrical molds measuring 5 cm (D) × 10 cm (H). Molds were sealed using lids and covered by tape. All molds were subjected to curing in a controlled environment with a temperature of 22 ± 2 °C and a relative humidity of at least 90% for a cure age of 7–150 days.
2.2. Testing of Samples
2.2.1. Fresh Fill Rheology
Fill rheology was thoroughly assessed through both slump and vane shear tests, facilitating a detailed examination of the impact of the admixture. The fills’ fresh consistency was evaluated by a slump cone. Fills were created to maintain a consistent slump height of 20 cm, a standard practice in the field. Initially, water and superplasticizers were covered in dry mix consisting of cement and silica. Subsequently, all ingredients were thoroughly blended in a mixer and the slump was measured. If the CPF did not attain the desired slump of 20 cm (ASTM C143 [41]), water was added gradually until the target slump was attained. The entire test procedure was replicated in three epochs to increase the results’ reliability. The blending durations for all the ingredients were provided in the preceding section.
A fill’s yield stress, denoting the minimum stress necessary to initiate flow, is established through a vane shear test, regularly referred to as the cup/vane process [42]. This test includes immersing a cylindrical vane into fill and applying a slow, controlled rotation. The resulting torque on the vane is then measured and correlated to the yield stress using established models or calibration data. In the method, a vane with the sizes of 25.4 mm (H) and 25.4 mm (D) and a cylindrical mold with the dimensions of 12 cm (H) and 10 cm (D) were used for the sample mold. Yield stress (τ) was calculated using Equation (1), where T represents dignified torque and K is a fixed vane value (Equation (2)), incorporating the vane’s dimensions [9]. Samples with varying admixture percentages and the control sample were tested, with the torque being measured at predetermined time intervals.
The control sample and samples prepared by adding 1%, 3%, and 5% admixtures were used for the vane shear test. Torque (T) measurements were logged at specified time breaks of 0, 25, 60, 120, and 240 min.
2.2.2. Hardened Fill Strengths
The UCS and elastic modulus (E) of CPFs were detected using uniaxial compression testing following the guidelines of ASTM C39 [43]. Three samples from each mixture were tested to ensure result reliability, and the mean value was calculated after excluding outliers exceeding ±10% standard deviation from the mean. The testing employed a computer-controlled press retaining a fixed distortion ratio of 1.14 mm/min. Stress/strain data, including compressive and axial deformation values, were automatically recorded by the LabView software (2012 version). This test not only measured the UCS at the point of sample failure but also captured the primary linear portion of the stress–strain curve, allowing for the calculation of the elastic modulus (E) using Equation (3);
where σe and εe represent the axial stress and strain, respectively.
2.2.3. Microstructural Test
The influence of superplasticizers on the long-term (28 days) hydration process of CPF was investigated using thermogravimetry (TG) and XRD analyses. Furthermore, MIP and SEM examinations were conducted to explore the fills’ pore structure features.
For thermal and XRD analyses, cement pastes were created with/without superplasticizer to simulate the fills’ high water content, maintaining a w/c ratio of 2. Following drying at 50 °C, which remained even until reaching a stabilized form at, typically, around 4 days, these samples underwent both analyses. Subsequently, the fills were superbly ground to meet test specifications. TG/DTG testing was performed by a TG analyzer (TA instruments Q500 (Ottawa, ON, Canada): 10 °C/min heating rate and a heat of 950 °C). XRD scanning of fills was performed by a Scintag XDS2000 diffractometer.
Lab-created fills with and without superplasticizer were exposed to MIP and SEM experiments to explore the superplasticizer effect on microstructures. Before introducing selected specimens to the MIP test device, they were dehydrated at 50 °C until they achieved the mass balance, which typically required approximately 4 days. Previous studies have demonstrated that drying at this temperature does not induce adverse effects on CPFs, such as cracking [15,35]. The MIP experiment was conducted with a Micromeritics AutoPore III 9420 apparatus (Anton Paar, Houston, TX, USA), and it was repeated three times to enhance the reliability of the findings. SEM was carried out utilizing a Hitachi S4800 FEG-SEM armed by an Energy Dispersive Spectrometry (EDS) attachment. The preparation of SEM samples followed the same procedure as that of MIP samples. Subsequently, the fills were coated with epoxy resin/hardener and then subjected to a vacuum space at a maximum of 20 mmHg for 1 h to ensure thorough epoxy coating. Moreover, before microscopic examination, the fills were C-coated to facilitate and enhance sample imaging. This SEM analysis was applied to two distinct types of samples: the CPF control sample and another sample with the addition of a superplasticizer. The goal was to compare and assess the pore structures of these two samples, shedding light on the superplasticizer addition effect on the fills’ microstructures.
2.2.4. Hydraulic Conductivity Test
A fill’s permeability (or hydraulic conductivity: [44]) quantifies the degree of water penetrability through the pore voids or fractures within the CPF structure. It is significantly influenced by its pore structure and crack state properties. Hence, saturated permeability assessments were performed on intact CPFs, with/without admixture, to evaluate the influence of superplasticizers on the fills’ permeability/pore structures at later stages of curing. Building on previous research suggesting the flexible wall technique’s suitability for long-cured samples [15,35], we followed ASTM D5084-16a [45] for constant-head testing. Samples with and without superplasticizers were cured for 28, 90, and 150 days, with three tests per sample and the average values being used for hydraulic conductivity determination.
3. Results and Discussion
3.1. Rheology of Fresh CPF
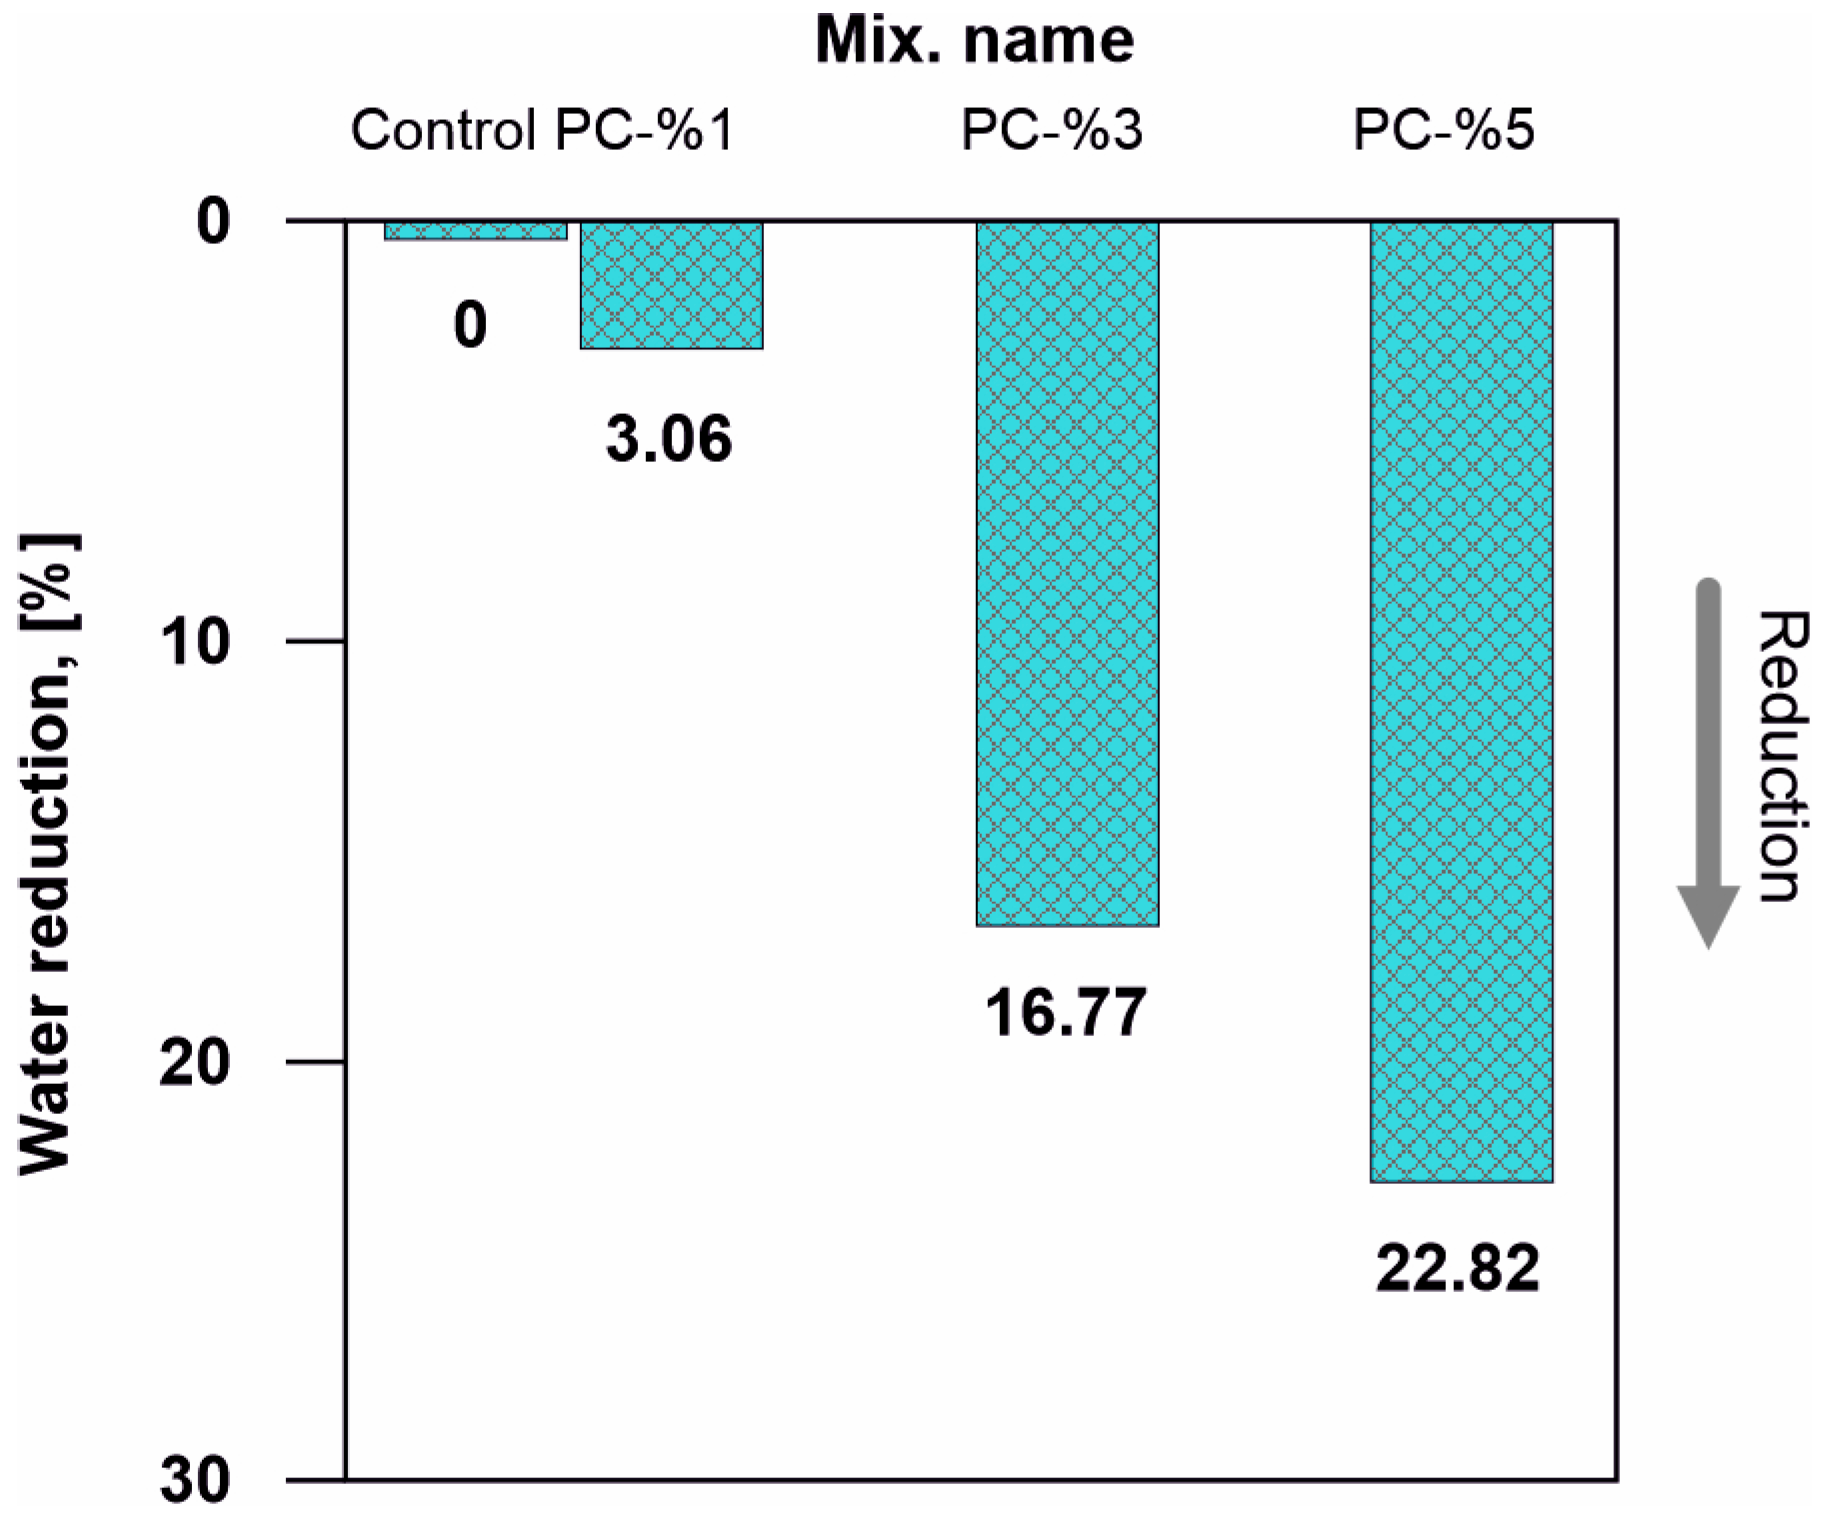
Figure 2 proves the influence of different superplasticizer dosages on the water demand reduction in regard to preparing CPF samples with a consistent slump of 20 cm. The results indicate that the addition of a superplasticizer and a rise in its dosage causes a major drop in water content, demonstrating a dosage-dependent relationship. As shown in Figure 2, the use of superplasticizers in CPF mixtures at rates of 1%, 3%, and 5% results in a reduction in water content by 3.1%, 16.8%, and 22.8%, respectively. It is credited by dispersing the impact of superplasticizers, which are high-range water-reducing admixtures, as documented by Haruna and Fall [33].

Figure 2.
Superplasticizer doses impact water reduction in CPFs at a 20 cm fixed slump.
Figure 3 shows that increasing the superplasticizer dosage from 0% to 5% raises the solids content from 76.2% to 80.6%. This indicates that adding superplasticizer pointedly reduces the amount of water within the fill without causing a loss of consistency, enabling the formulation of high-solid-content CPFs that require less water. Additionally, as shown in Figure 3, a rise in solid content results in a major drop in the water–cement (w/c) ratio from 7.24 to 5.64. It is known that low w/c ratios within CPFs contribute to increased strength, reduced permeability, improved durability, and the environmental behavior of CPF [2,15,26,28,31]. In regard to water risks, accessing water issues, and the negative impacts on environmental ecosystems in mining [46], the use of superplasticizers in CPF mixtures may present a potential technological solution to mitigate the pressures faced by mining operations.
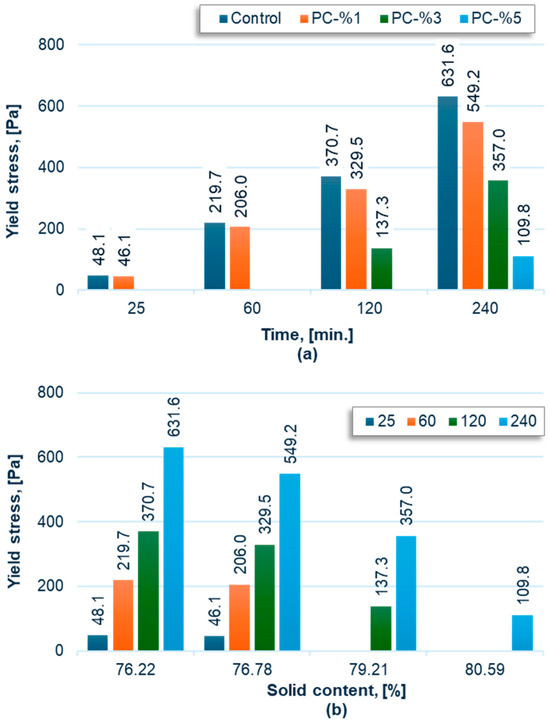
Figure 3.
Yield stress development of CPF samples: (a) time-dependent, (b) solid content-dependent.
To optimize the performance of CPFs in underground applications, a full examination of their rheological features throughout the entire backfilling process is vital. Essential rheological parameters, such as yield stress, offer invaluable insights into predicting deposition behavior, enhancing pipeline transport efficiency, and guiding the design of pumps and dewatering systems. Figure 3 shows the time-dependent yield stress development of fills with diverse superplasticizer doses and solid contents at room temperature. As depicted in Figure 3a, the fills’ yield stresses increase by curing duration, irrespective of admixture ratio. For example, the control sample had a yield stress of 48.1 Pa after 25 min, which increased to 631.6 Pa after 240 min. Similarly, the sample with 1% admixture had a yield stress of 46.1 Pa after 25 min, which increased to 549.2 Pa after 240 min. This indicates that the CPF gains strength (due to hydration) over time and becomes more resistant to shear stress. Figure 3a further illustrates that the yield stress of fills containing superplasticizers is less than one of the control specimens across all cure times. For example, after 240 min, the control specimen’s yield stress was 631.6 Pa, while that of the sample with 1% admixture was 549.2 Pa, that of the sample with 3% admixture was 357 Pa, and that of the sample with 5% admixture was 109.8 Pa. It was found that the fill’s yield stress decreased as the superplasticizer dose increased, with the lowest yield stress observed in the fill having the highest admixture ratio (PC-5%). In general, the vane shear test results decrease with increasing superplasticizer admixture content. This indicates that the superplasticizer increases the flowability of the paste backfill and makes it less resistant to shear stress.
The rheological behavior of paste samples with varying solid contents was investigated through yield stress measurements and illustrated in Figure 3b. The yield stress values were obtained at a hydration time of 240 min, providing insights into the paste samples’ stability and flow properties. The findings indicate a notable reduction in yield stress as the solid rate rises. For instance, the yield stress of the fill with 76.2% solid content was 631.6 Pa, while it decreased to 549.2 Pa for the sample with 76.78% solid content, 357 Pa for the sample with 79.21% solid content, and 109.8 Pa for the sample with a 80.59% solid rate. Previous works indicated that a fill’s yield stress rose with increasing the solids content [47,48]. Contrary to expectations, this investigation revealed that the fill’s yield stress declined as the solids rate rose (Figure 3b). The fill’s enhanced flowability, despite the fill’s solid rate, rose as a result of the water-reducing capability of a superplasticizer admixture close to 23%, and this is mainly attributed to the much more effective ability of the admixture to improve the inter-particle repulsive force through steric hindrance and electrostatic stabilization mechanisms. Superplasticizers enable a more homogeneous distribution and mixing of cement particles. This can lead to the cement paste obtaining a more consistent structure and a lower yield stress.
Results from the vane shear test indicate that the superplasticizer additive reduces the yield stress of a CPF by about six times within four hours while increasing its fluidity. This suggests that using superplasticizers in CPFs can facilitate the transfer of material into underground voids and potentially reduce transportation costs. Furthermore, the results show that superplasticizers can be used to maintain the fluidity of CPFs over time during transport to underground voids, reducing the risk of pipeline blockages. These findings are vital for appreciating fills’ rheological behaviors and optimizing their properties for various applications. Links between yield stress and the solids rate could be used to control the workability and stability of grout during the backfilling process, ensuring the desired final properties of the hardened material.
3.2. Superplasticizer Effect on a Fill’s Strength Growth and Stress–Strain Behavior
The influence of superplasticizers, of varying dosages, on fill strength, cured for diverse durations, is depicted in Figure 4. It is evident that adding a superplasticizer to CPF mixtures causes a major enhancement in regard to the fill strength, with the magnitude of improvement depending on the dosage of the superplasticizers. Additionally, curing duration plays a significant role in the strength development of CPF specimens by facilitating continued hydration processes over time. All samples containing superplasticizers exhibited higher UCS values at all cures compared to the reference specimen. Among the different dosages tested, the sample with a 5% superplasticizer dosage (PC-5%) demonstrated the highest strength values at each curing time. Moreover, it was observed that the sample with an upper dose of admixture exhibited a greater dose of strength improvement compared to samples with lower dosages of admixture. For instance, the addition of 5% superplasticizer (PC-5%) increased the strengths of reference mixtures from 1 MPa to 2.38 MPa at 28 days. Similarly, adding 1% (PC-1%) and 3% superplasticizer (PC-3%) increased the UCS values of the reference mixtures to 1.2 MPa and 1.78 MPa, respectively, at 28 days. Increasing the dosage of the superplasticizer in the CPF mixture from 0 to 5% resulted in a strength gain of 2.4 times during 28-day curing compared to the control sample. Adding superplasticizers improved the fill strength by 120%–240% at all curing times.
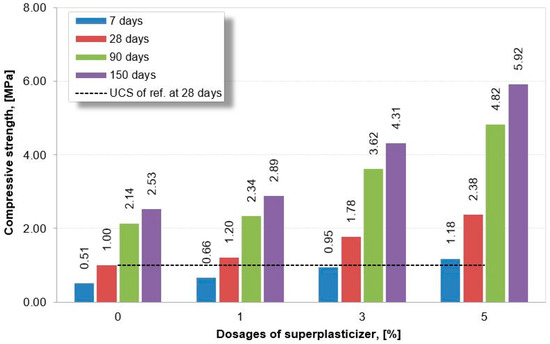
Figure 4.
Superplasticizer content effects on fill strength gaining.
The observed rise in CPF strength with the addition of superplasticizers can be largely attributed to the superplasticizers promoting cement hydration by encouraging particle dispersion and subsequently facilitating ionic diffusion. In other words, a drop in the amount of water within the fill due to the superplasticizers causes a rise in the volume of a solid phase (cement + tails), which facilitates the larger volume of the hydration materials. As evidenced in Section 3.4, the presence of superplasticizers in the samples causes the generation of a larger quantity of hydration crops. Consequently, this enhances cohesion within the CPF matrix and diminishes its porosity, thereby evidently correlating with an increase in strength [27,28,29,49]. Furthermore, the accumulation of a superplasticizer to backfilling reduces its w/c ratio for a given consistency, leading to a less porous and more compact or dense CPF matrix (as demonstrated apparently in Section 3.3), thus increasing its strength.
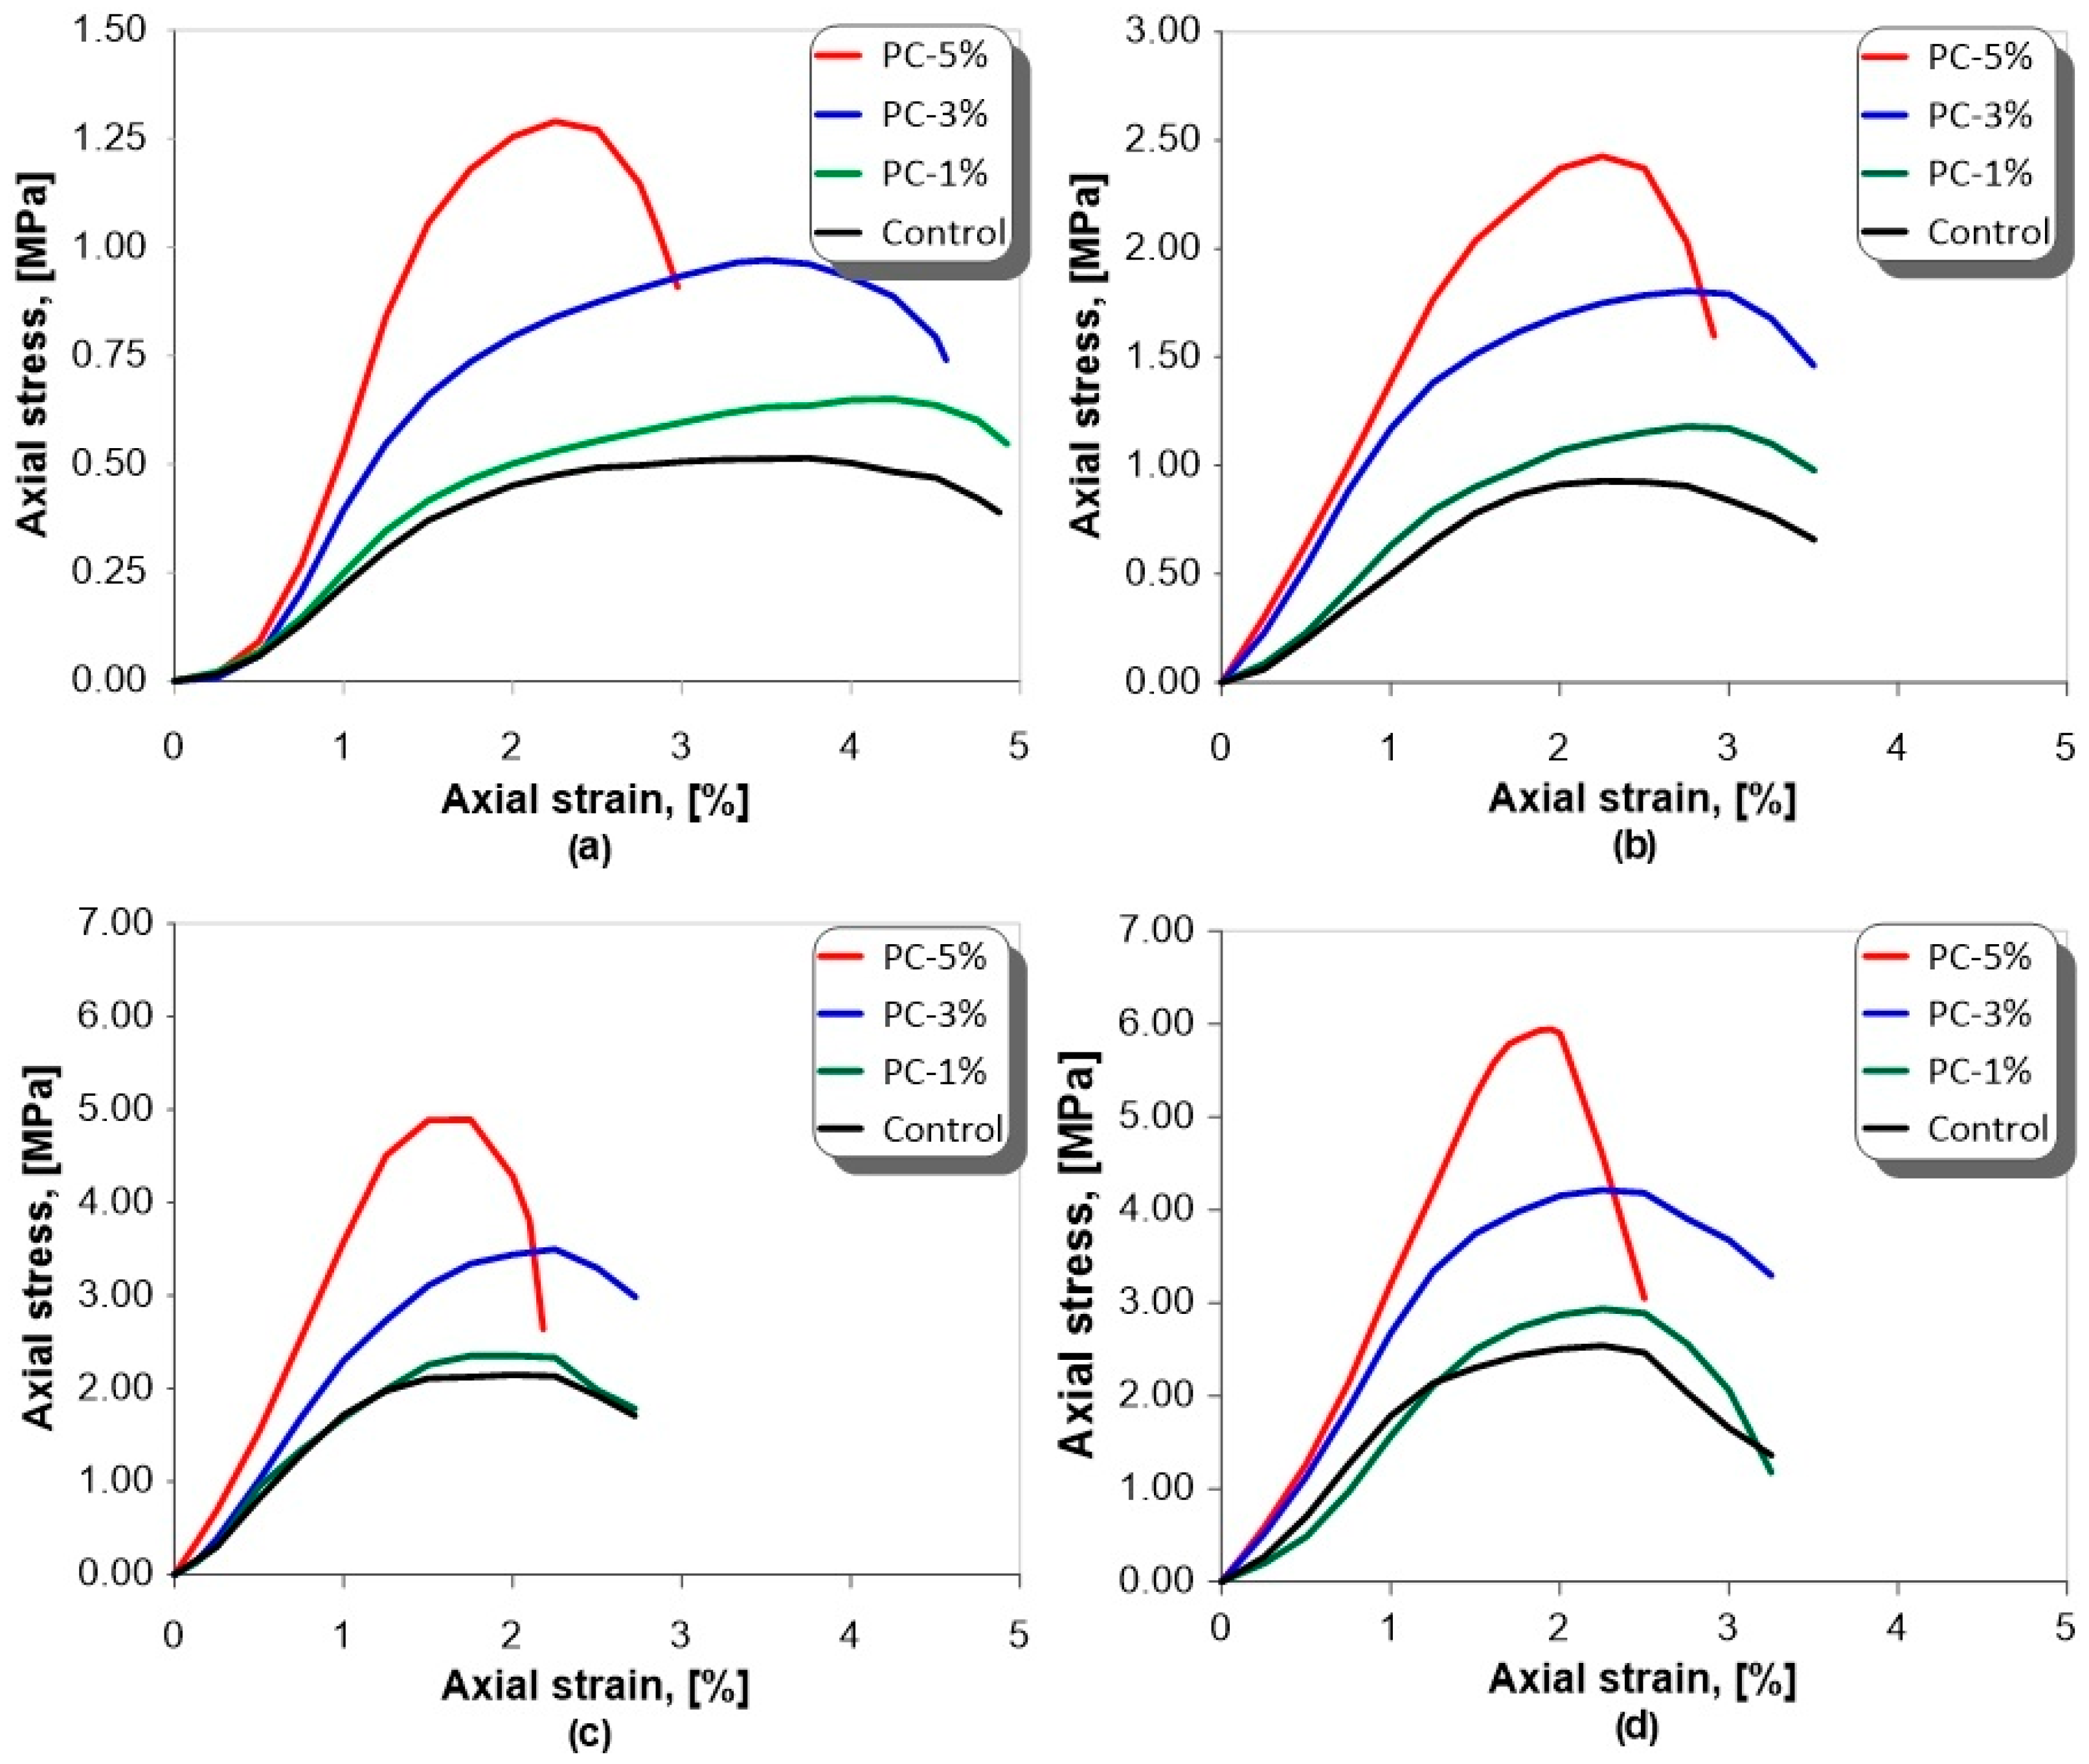
The fills’ stress–strain behavior and varying levels of superplasticizer (0%, 1%, 3%, and 5%) were analyzed under compression loading and at diverse cure durations (7–150 days) and are presented in Figure 5. Figure 5 demonstrates that, despite the superplasticizer dose and cure age, as stress approaches the peak region, the load–deformation curve of the CPFs exhibits an initial non-linear behavior. On the decreasing side of the curve, the stress level tends to decrease (albeit at a slower rate) with increasing deformations, primarily due to the expansion and growth of cracks within the CPF. In other words, this behavior is clarified by a complex interplay of factors such as the development of microcracks and the rearrangement of hydrated cementitious phases [8,12]. Interestingly, samples exhibiting higher compressive strength tend to demonstrate a more linear ascending branch, indicating a potential correlation between mechanical durableness and deformation characteristics. Moreover, the inclusion of a superplasticizer accentuates this trend, underscoring its role in enhancing the structural integrity of CPF samples.
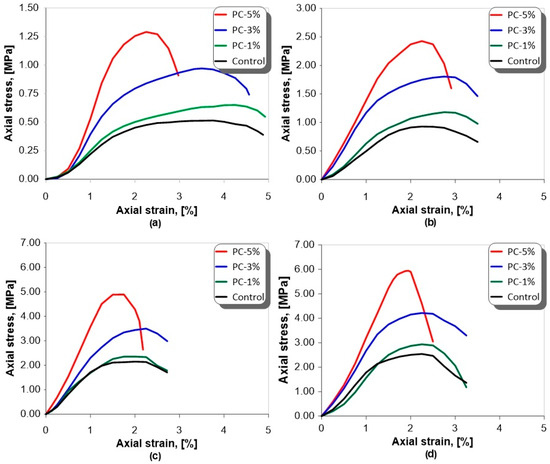
Figure 5.
Superplasticizer dose effect and cure age on the fills’ stress–strain curves; (a) 7-, (b) 28-, (c) 90- and (d) 150-day.
As depicted in Figure 5, adding a superplasticizer to fills leads to a major increase in the fill’s peak stress, and the extent of this phenomenon correlates with the dosage of the admixture. CPFs containing a superplasticizer exhibited more linear behavior in ascending branches compared to samples without a superplasticizer. Furthermore, an increase in the dosage of the superplasticizer from 0 to 5% led to a change in peak stress’s fracture mode. The fills’ descending curves displayed a steeper downward trend after achieving their peak value as the superplasticizer rates increased (especially in the sample with a 5% admixture). This can be explained by the addition of a superplasticizer that primarily influences the stress–strain curve by reducing the internal friction between particles, enabling enhanced packing and denser hydration product formation, leading to a more durable CPF material.
Figure 5 also displays links between the deformation value at the fills’ peak stress in terms of superplasticizer rate/cure age. In 7- and 28-day curing periods, the strain values at peak for the PC-5% sample ranged between 2% and 2.5%. However, these values decreased to below 2% during the 90- and 150-day curing periods. For the other three samples, the strain values at their peaks were initially between 3% and 5% in the course of the 7-day cure age, decreased below 3% within the 28-day cure age, and ultimately reached 2% and 2.5% in the 90- and 150-day curing periods. Thus, the verdicts obtained signpost that strain values at the peak decrease with increasing curing times and superplasticizer dosages. The reduction observed due to the higher dosage of superplasticizers can be accredited to the formation of a more compact pore structure and enhanced strength compared to the samples without a superplasticizer or with a lower dosage. This effect is a result of a drop in the w/c ratio as the superplasticizer content increases (see Figure 3) and the enhanced hydration process facilitated by the superplasticizer at later stages. As outlined apparently in Section 3.4, these consequences are within a generation of a better quantity of hydration crops.
The impact of the superplasticizer and diverse dosages on the Young’s modulus of the CPFs throughout the curing period is indicated in Figure 6. The verdicts demonstrate that both the superplasticizer and curing time significantly impact the Young’s modulus of the fills. Notably, decreasing the superplasticizer dose results in a lower Young’s modulus, whereas a rise in cure time causes a greater Young’s modulus. The witnessed impact could be clarified by the decreased porosity of the CPFs and the enhanced cohesion within the CPF matrix resulting from the addition of a superplasticizer and longer curing times [17] (refer to Section 3.3 and Section 3.4). The incorporation of the superplasticizer leads to a decrease in water content (w/c ratio) (Table 3) and promotes the formation of hydration products (see Section 3.4), thereby reducing the fills’ porosity and enhancing cementation the of tailings’ particles. Similarly, an extended curing period promotes the making of a greater amount of hydration crops, which enhances the binding of tailing grains and reduces fill porosity. As a result of these factors, the decrease in porosity and the increase in the cementation effect contribute to an enhanced modulus of elasticity in CPFs [8,12,13,36].
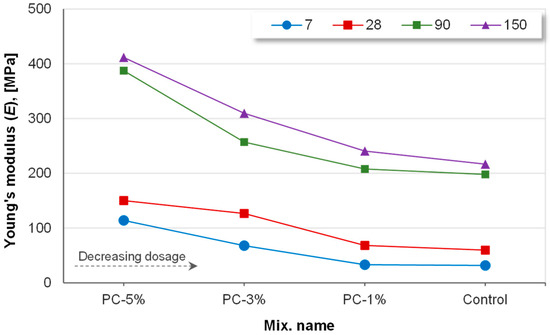
Figure 6.
The superplasticizer and cure age effects on the fills’ Young’s moduli.
All the results obtained have shown that, by adding a superplasticizer and an increased admixture ratio, CPF’s stress peak values and elastic moduli increase. The incorporation of a superplasticizer into a CPF formulation leads to a major rise in its stiffness and a corresponding drop in its elasticity. Superplasticizer admixtures increase the maximum stress capacity of a CPF, which makes it stronger and able to withstand higher loads, which is very important for safe production in underground applications. On the other hand, sufficient strength values of underground backfill voids can be provided with lower cement contents thanks to superplasticizer admixtures, which is an important opportunity for the mining economy.
3.3. Superplasticizer Impact on Fill Pore Structure
Figure 7 illustrates superplasticizer impact on the porosity/pore size distribution of 28-day-cured CPFs. Specifically, Figure 7a,b provide incremental and cumulative comparisons of porosity/pore size distribution between 28-day-cured PC-5% fills and control samples. Figure 7 reveals a significant decrease in the total porosity and mean pore grain of CPFs due to the incorporation of superplasticizers following the 28-day hydration period. Notably, the total porosity of the PC-5% sample is measured at 16.4% (n_tot), representing a pronounced reduction compared to the control sample’s 24.4% (n_tot) (Figure 7b). The pore structure of cementitious materials is mainly determined by the hydration process and the packing of fine particles. In the course of hydration, cement undergoes continuous reactions with water, which influence pore structure [17]. Once hydration progresses (hardening time increases), pore volume typically decreases. However, excess water beyond the hydration requirement leads to a more extensive pore structure that is characterized by increased porosity and coarser pores, ultimately compromising strength and increasing permeability. In this study, despite maintaining equal consistency, the sample containing a superplasticizer (w/c = 5.64) exhibited a lower pore volume compared to the one without (w/c = 7.25). This reduction can be attributed to the use of polycarboxylate ether-based superplasticizers, which effectively disperse cement particles, altering their packing behavior. This minimized entrapped water, leading to lower initial porosity. Additionally, superplasticizers can promote late-stage hydration, resulting in additional precipitation of hydration crops and pore structure refinement [17,28,29,49].
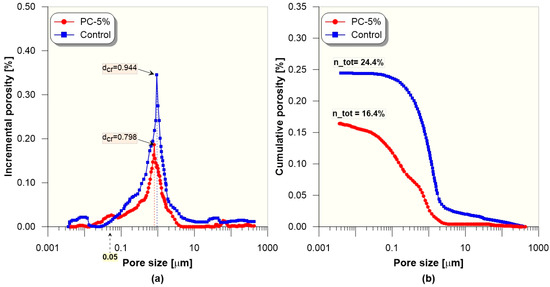
Figure 7.
Superplasticizer effect on fill pore structure: (a) incremental, (b) cumulative.
The critical pore grain agrees to a sphere grain that can freely traverse a porous medium. It serves as a key parameter that influences permeability and reflects the interconnectivity of pores within the material [32,50]. The critical pore diameter (dcr) of the CPFs, as measured from the MIP curve in Figure 7a, was 0.798 mm for the PC-5% sample and 0.944 mm for the control sample. As seen in Figure 7a, the critical pore size of the sample with superplasticizer is less than one of the control sample and is therefore interconnected with fewer pores. This proves the presence of fewer interconnected pores.
Pore size distribution, based on the intruded mercury volumes, provides valuable insight into the CPF properties. Mehta and Monteiro [51] suggested that pores larger than 0.05 mm (large capillaries) are primarily responsible for strength and permeability, while those smaller than 0.05 mm (medium capillaries) mainly affect drying shrinkage and creep [52,53]. As observed in Figure 7, significant differences in the large capillary range were found between the CPF samples. The sample with superplasticizer exhibited a considerably lower large capillary content compared to the control sample. In conclusion, these findings convincingly demonstrate the significant impact of the superplasticizer in reducing total porosity, mean pore diameter, and the critical pore size of CPFs after a 28-day curing period. This reduction in porosity contributes to improved features of hardened fills (e.g., increased strength/durability). Moreover, superplasticizers refine the CPF microstructures by significantly reducing their porosity, which in turn drastically hinders permeability (see Section 3.4). This dramatic permeability decrease limits moisture and oxygen ingress, effectively mitigating pyrite oxidation and the subsequent sulfate attack mechanism, as verified by Ercikdi et al. [25], Ouellet et al. [54], Aldhafeeri and Fall [55] and Aldhafeeri and Fall [56]. This is particularly effective in reducing long-term strength losses due to sulfur content and reduces the risk of subsidence for underground mines.
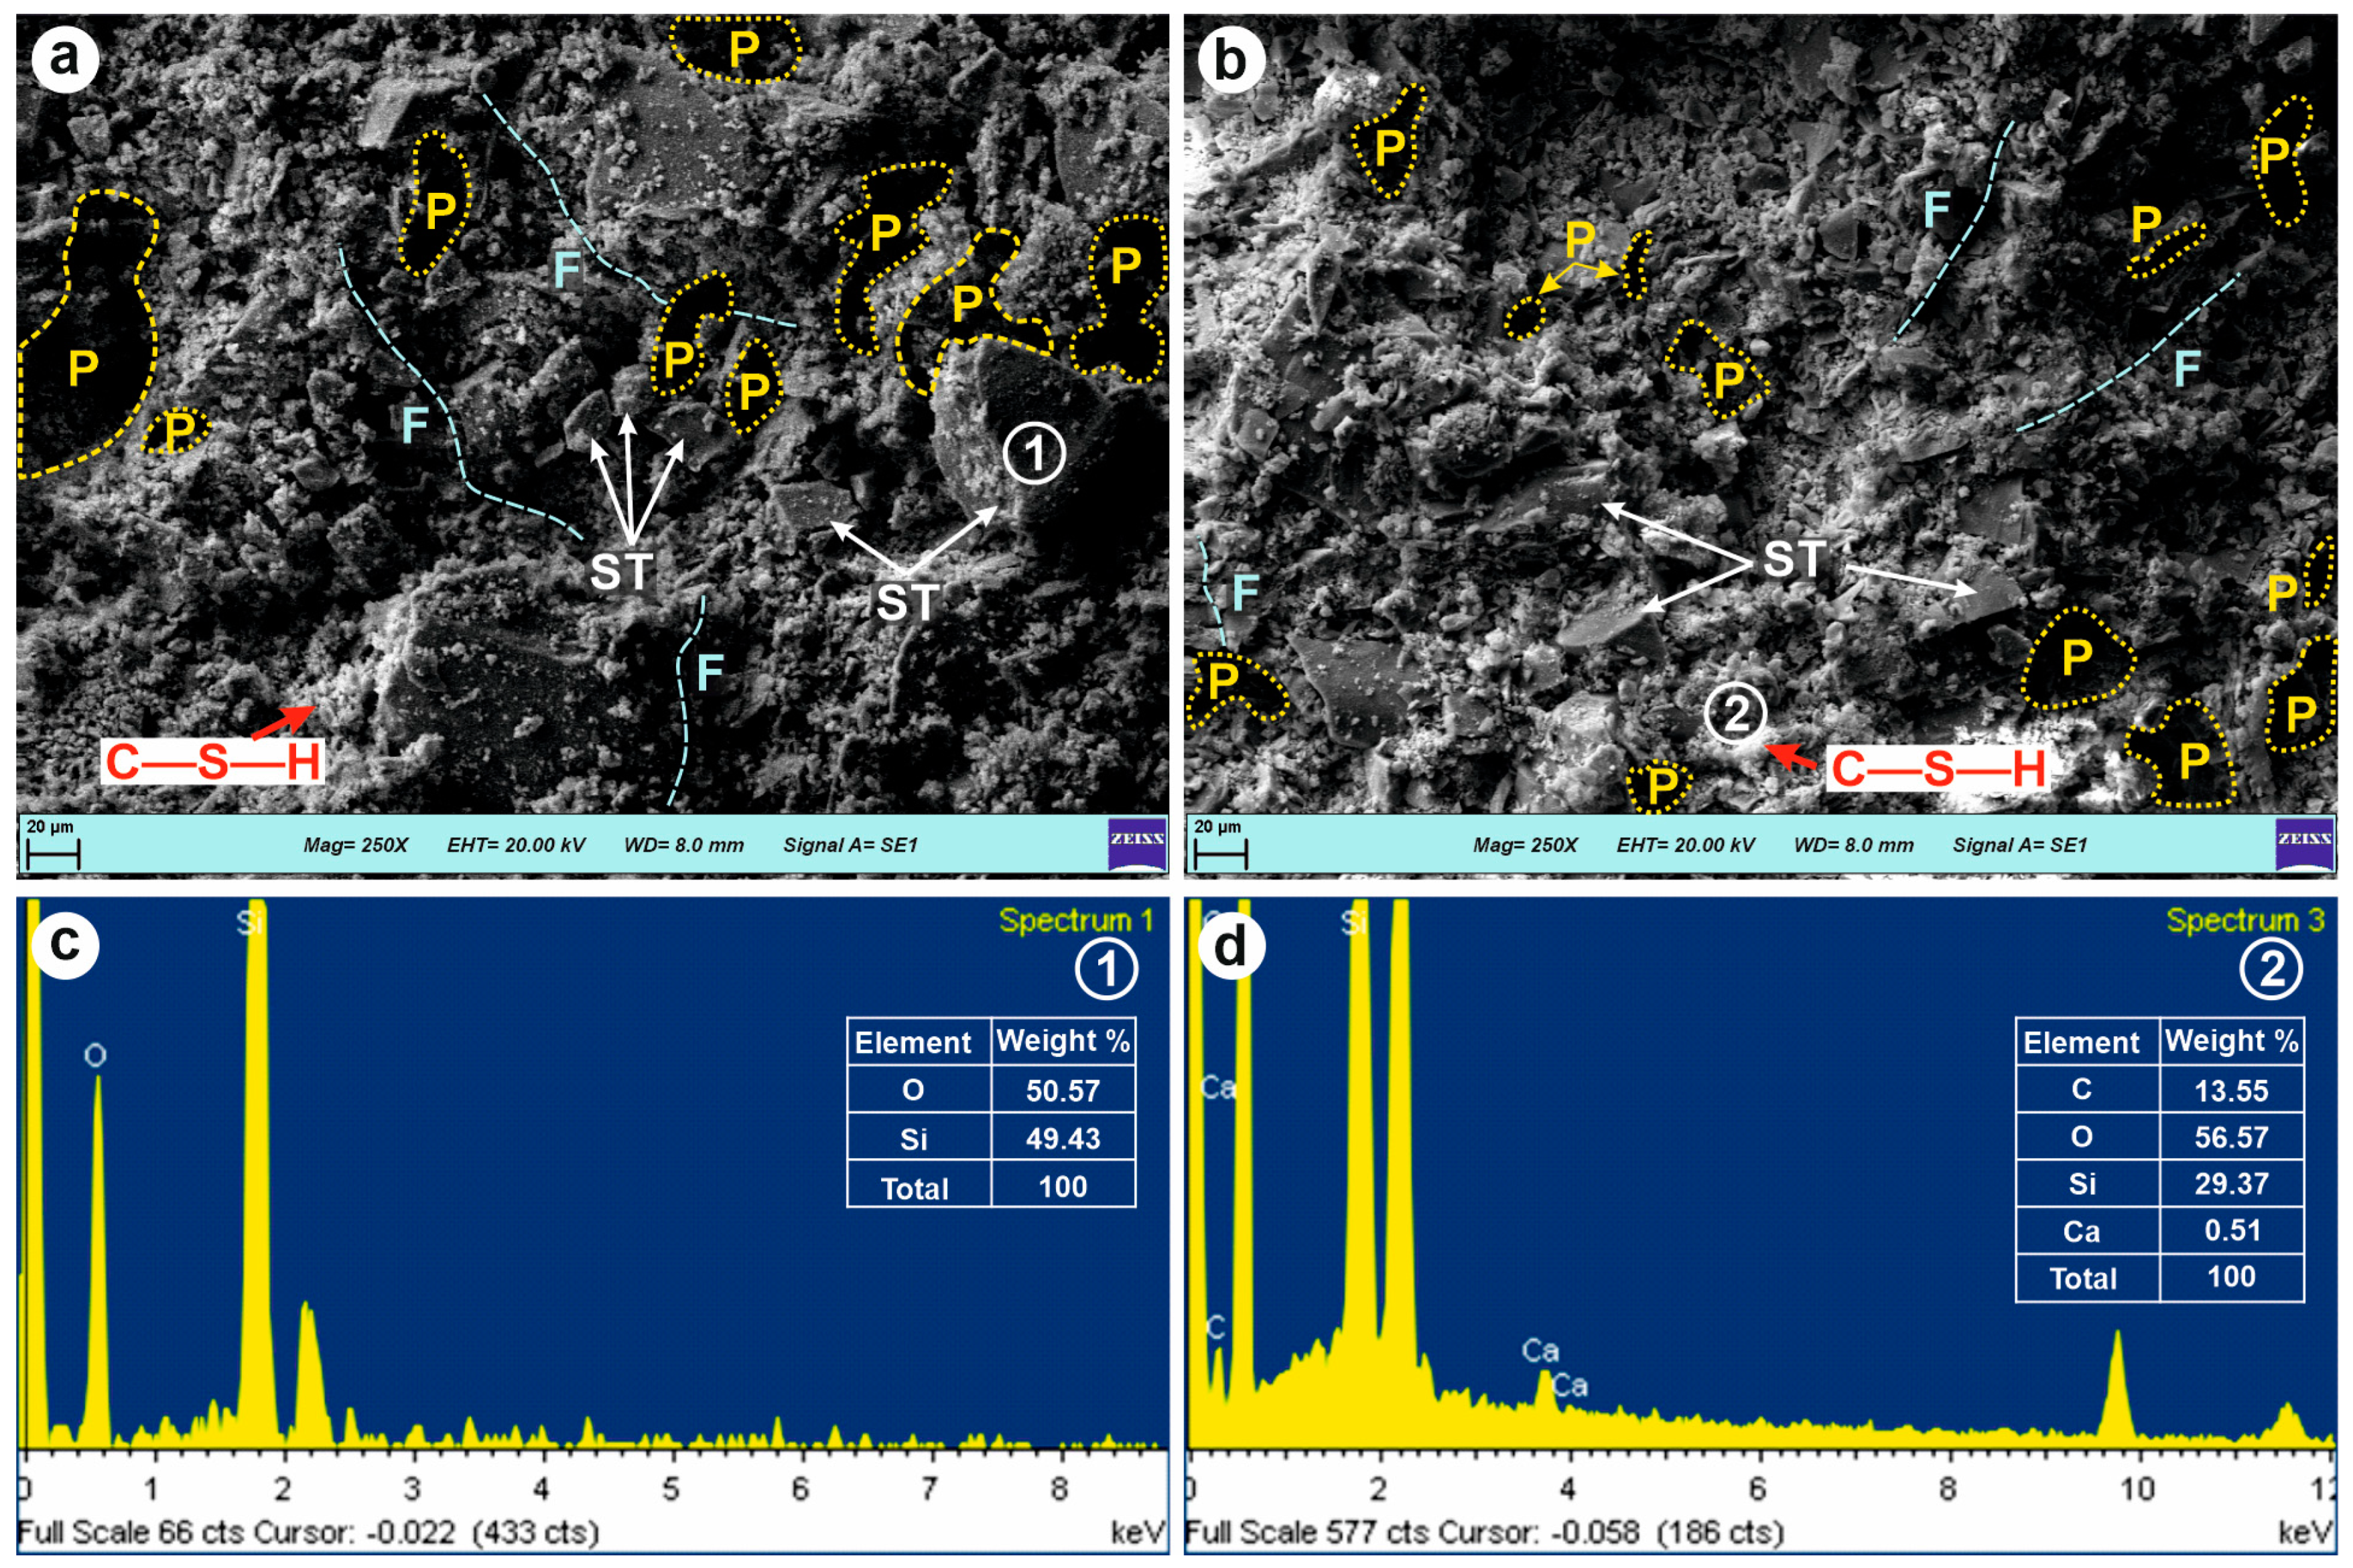
The mechanical characteristics of the hardened mortar depend not only on the hydrates formed during cement hydration but also on the pore structures and morphology of the hydration products. Figure 8 presents SEM images of CPFs with and without superplasticizers at a magnification of 250×. Adding a superplasticizer alters the fill morphology, the link between hydration products (C-S-H) and silica tailings (ST) particles, and the pore structure. The presence of higher ST grains on the surface of control sample in comparison with the sample with superplasticizer, has no apparent connection to hydration structures. Also, the figure reveals that SEM images showed that the sample with superplasticizer had a denser microstructure with fewer pores (Ps) and fractures (Fs) than the control sample. SEM images show that the superplasticizer more effectively disperses the cement particles and provides a more uniform hydration process. This is related to the fact that the superplasticizer optimizes the particle distribution, reducing the water content, allowing the cement grains to participate more effectively in the hydration process, and increasing the density of the mix by filling the pores.
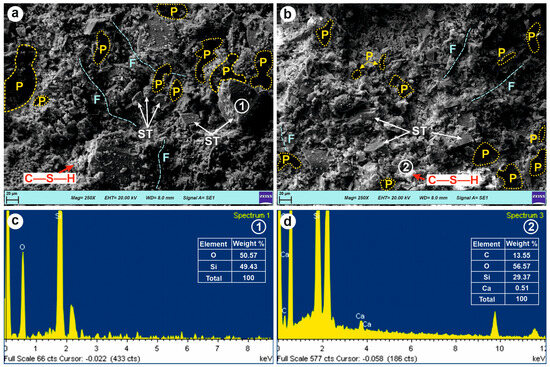
Figure 8.
SEM observations of control and sample with superplasticizers (PC-5%) cured for 28 days: (a) control, (b) PC-5%, (c) EDS for control sample, and (d) EDS for PC-5% sample (P: pore, F: fracture).
In conclusion, the SEM analysis of samples further elucidated a direct correlation between the textural properties and the ultimate strength development of CPFs at a specific curing age (28 days). The denser microstructure exhibited in CPF samples with superplasticizer, characterized by reduced porosity and finer pore structure, significantly contributed to the increase in their mechanical strength in comparison with control samples. The heightened compactness of the superplasticized matrix facilitated the formation of a more uniform and tightly packed cementitious matrix, thereby enhancing the load-bearing capacity and reducing microcracking.
3.4. Superplasticizer Effect on Fills’ Hydraulic Conductivity
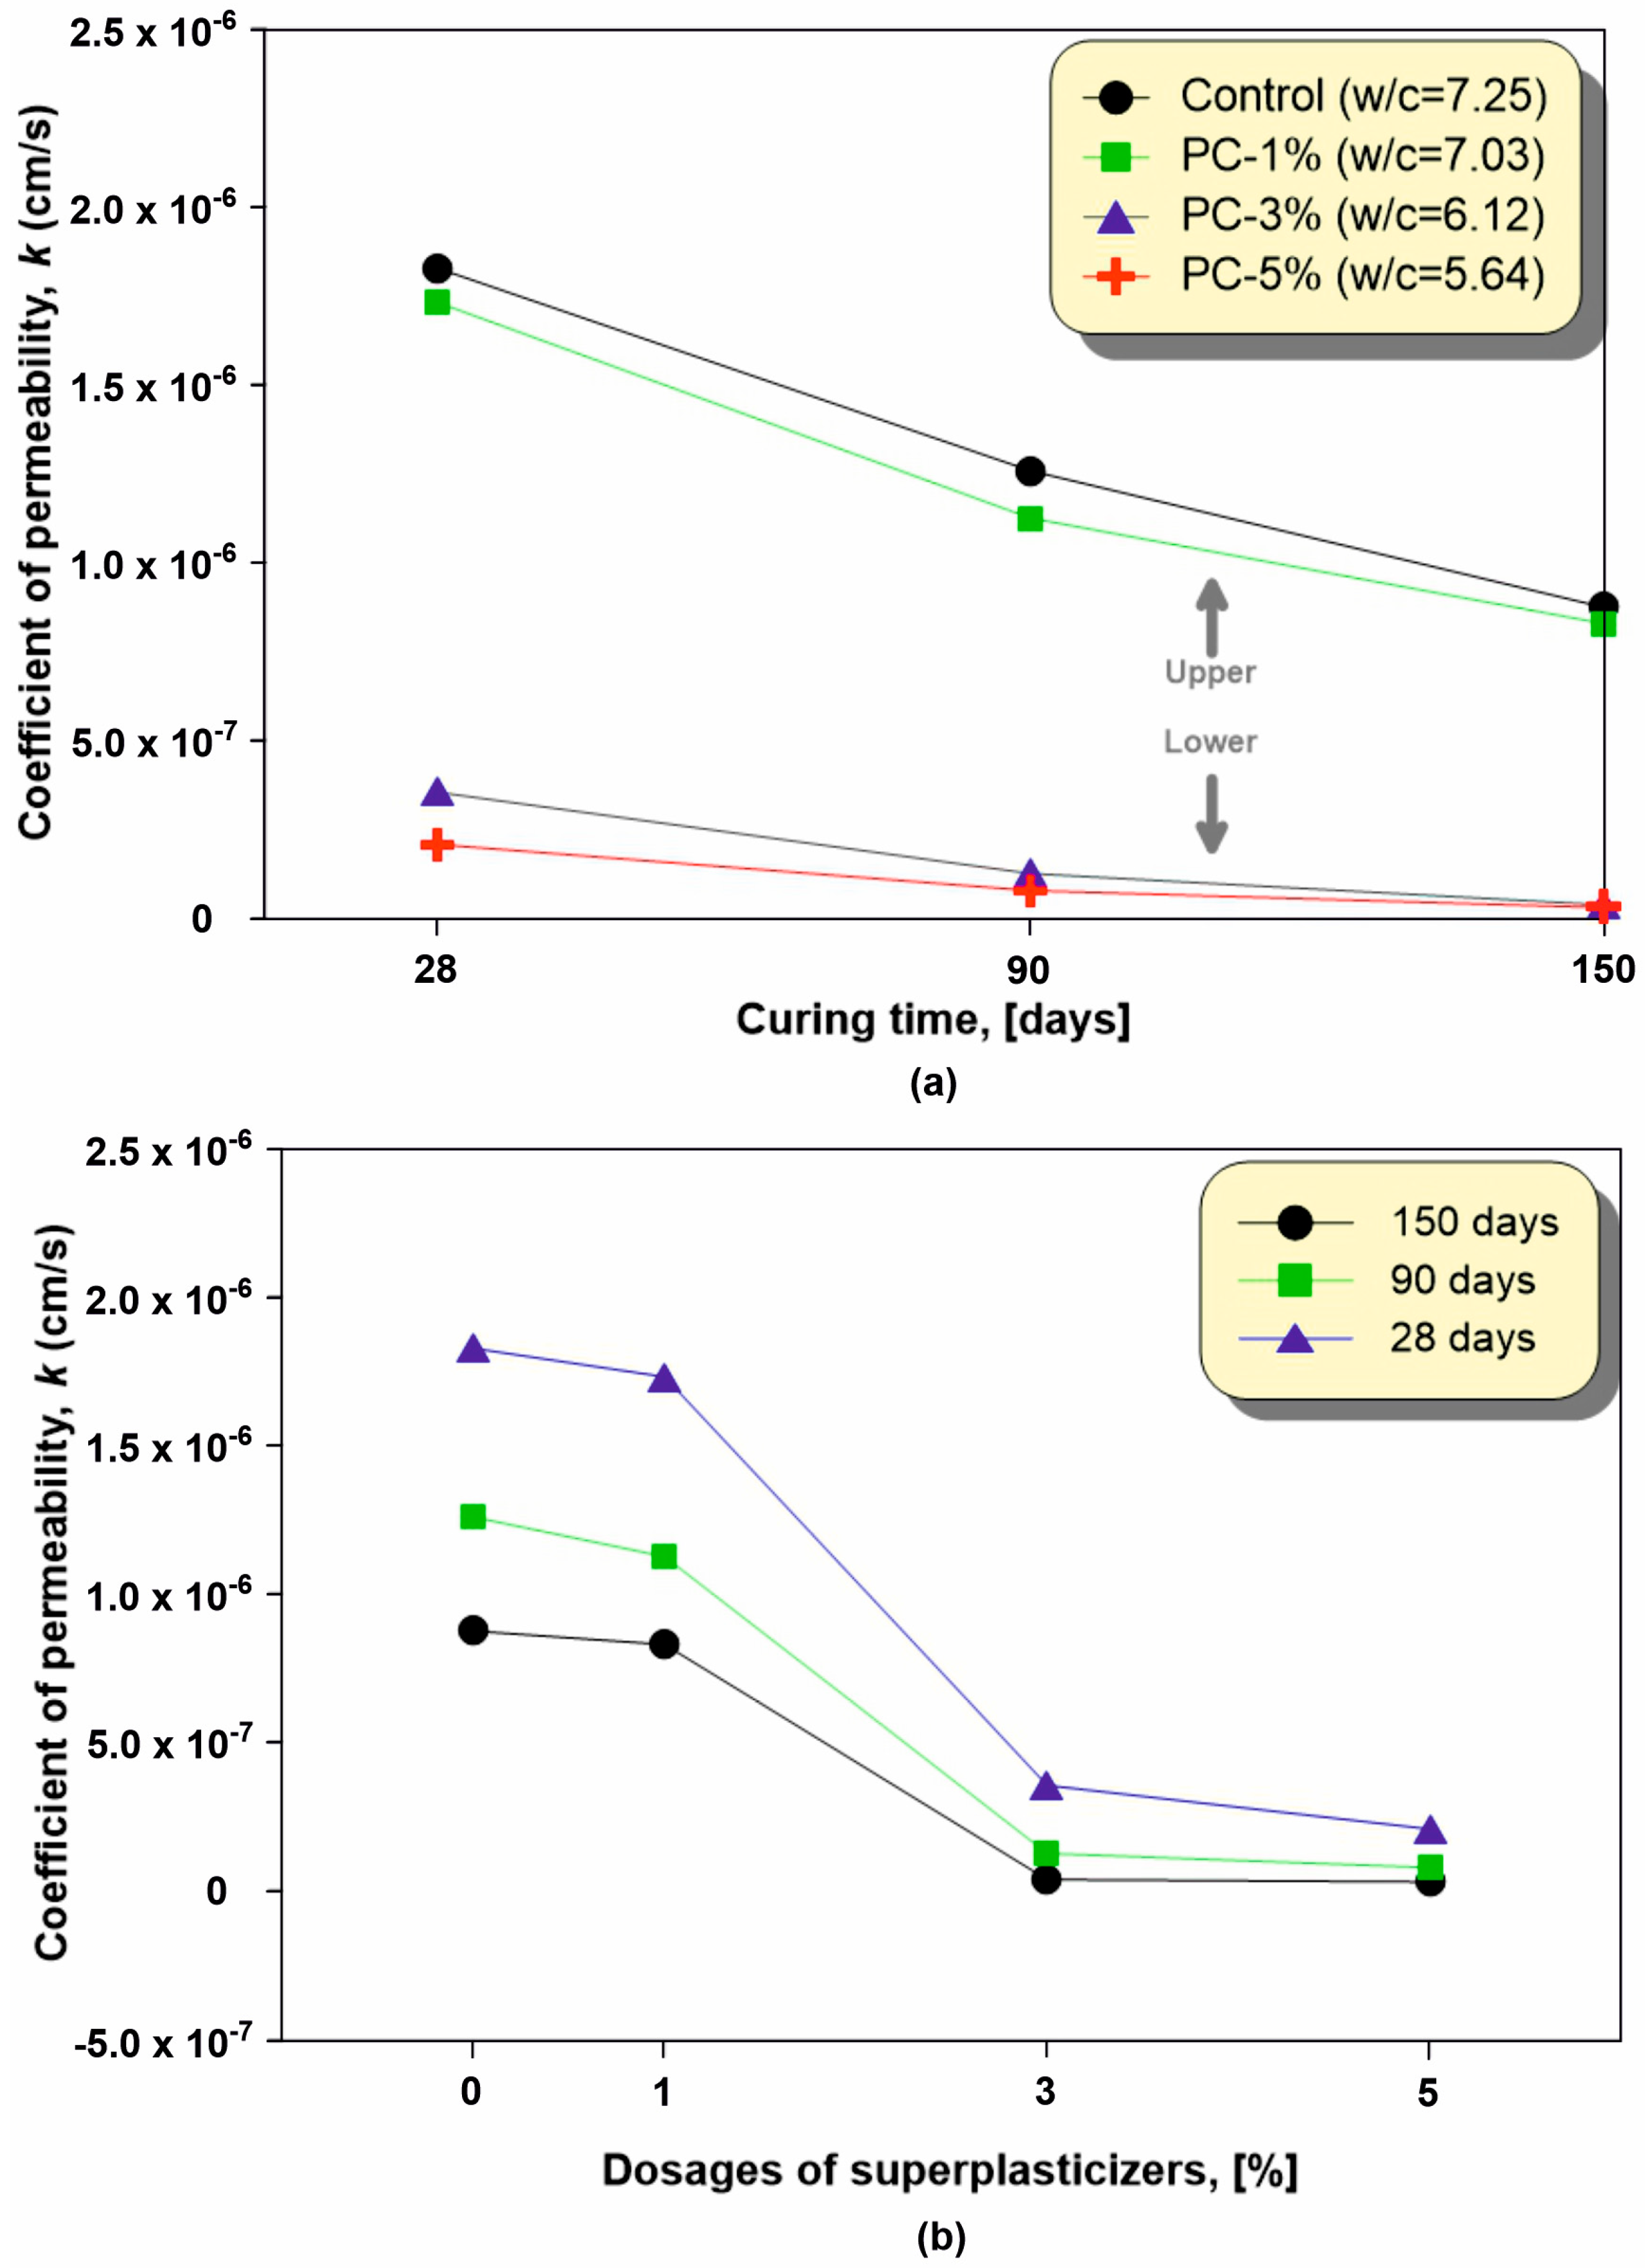
The superplasticizer dose effect and cure age effects on the fills’ hydraulic conductivity is depicted in Figure 9. A consistent decline in hydraulic conductivity is evident across all samples throughout the curing duration irrespective of the superplasticizer dosage. This pattern suggests that longer curing times result in decreased permeability in fills. A decrease in permeability could be clarified by cement hydration’s advancement, leading to the generation of additional hydration materials [12]. These products gradually occupy unified pores in a fill’s cementitious matrix, thereby reducing its overall porosity [9,10].
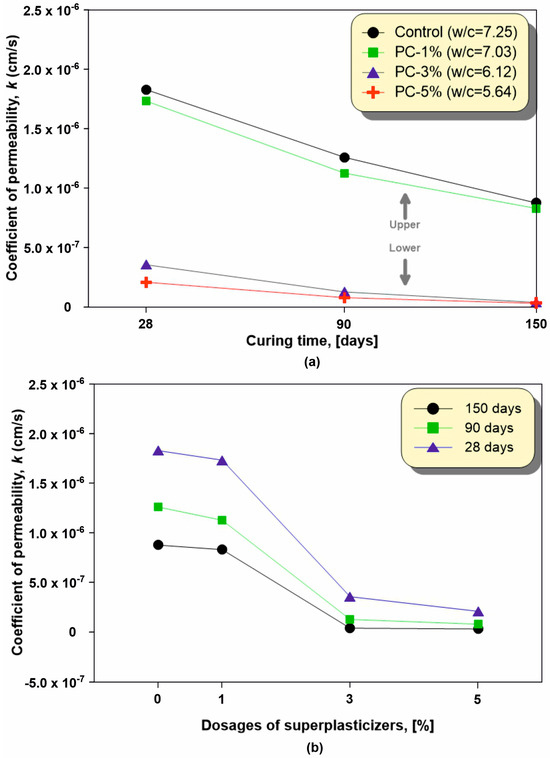
Figure 9.
Superplasticizer effect on the fills’ permeability: (a) time–, (b) dose–dependent.
Figure 9b highlights the notable impact of superplasticizer dose on fill’s permeability. Regardless of curing time, an elevation in the superplasticizer dosage reduces the fill’s permeability. Notably, the sample (PC-5%) with a superplasticizer dosage of 5% exhibits the lowest permeability among all samples. In other words, the sample with a higher admixture dosage demonstrates superior impermeability compared to those with lower admixture dosages and the control sample. At 150 days of curing time, the permeability of the specimen with a 5% admixture was calculated to be 2.96 × 10⁻⁸ cm/s, while it was 3.73 × 10⁻⁸ cm/s for the sample with a 3% admixture, 8.27 × 10⁻⁷ cm/s for the sample with a 1% admixture, and 8.73 × 10⁻⁷ cm/s for the sample without an admixture. The obtained hydraulic conductivity results exhibited a major reduction in the permeability of the fills; a superplasticizer was added and its dosage was increased, with the highest dosage (5%) resulting in a hydraulic conductivity of approximately 30 epochs less than that of the control specimen.
Figure 9a displays the division of samples into two distinct regions based on CPF permeability values: the upper region and the lower region. Samples with higher superplasticizer doses, such as PC-5% and PC-3%, fall into the lower region, while the control sample and sample with a low dosage of superplasticizer (PC-1%) are located in the upper region. The fills’ w/c ratios in the lower region are significantly lower compared to those in the upper region. Specifically, the w/c rates of PC-5% and PC-3% were 5.64 and 6.12, respectively, while the w/c rates of PC-1% and the control sample were 7.03 and 7.25. These verdicts specify that the w/c rate has a sizeable impact on CPF permeability, with the drops in w/c ratios corresponding to the decreases in permeability.
Prior works verified that a fill’s permeability or cement-based materials decrease as binder contents rise [15,16,17]. However, even when samples contain an equal amount of binder, various parameters can influence changes in permeability. Notably, the permeability of materials is closely associated with the pore structure and flocculation state of fine-grade materials, particularly in cement-based materials [57]. In this study, it was observed that the samples containing polycarboxylate ether-based chemical admixtures exhibited lower permeability compared to the samples without an admixture. The reduction in permeability, resulting from the addition of a superplasticizer or an increase in its dosage, is clarified with the effects of the following two limits. Firstly, the inclusion of polycarboxylate promotes improved dispersion of cement grains, thereby facilitating the formation of a finer porous network (see Figure 7 and Figure 8). A CPF’s flow resistance is improved by this finer porous network. Another factor contributing to the low permeability of a CPF is a drop in the w/c ratio resulting from adding a superplasticizer or an increase in its dosage in CPF mixtures. The findings are in line with previous studies, such as work conducted by Fall et al. [15], which observed a rise in permeability with a growing w/c ratio of CPFs at a fixed binder rate. A higher w/c rate tends to raise a fill’s workability, facilitating its placement and compaction. However, it also leads to a higher volume of water within the mix relative to the cement’s volume, resulting in increased segregation between tailings and cement particles and an increase in porosity. This, in turn, raises the void ratio and, consequently, the permeability of a CPF. Increased capillary porosity associated with a greater w/c rate, as established by MIP outcomes offered in Figure 7, contributes to this phenomenon.
Furthermore, the permeability of CPFs is influenced by the extent of hydration product formation during the curing period. Previous studies have demonstrated that the presence of a superplasticizer initially delays cement hydration reactions within a short period after blending but, over time, then promotes hydration by aiding ionic diffusion and hydrate nucleation [17,32]. In simpler terms, CPFs incorporating superplasticizers exhibit a greater volume of cement hydration products compared to samples without superplasticizers or with lower dosages. The increase facilitated by the admixture in hydration crops contributes to an improved porous material in CPF, leading to a decrease in its permeability.
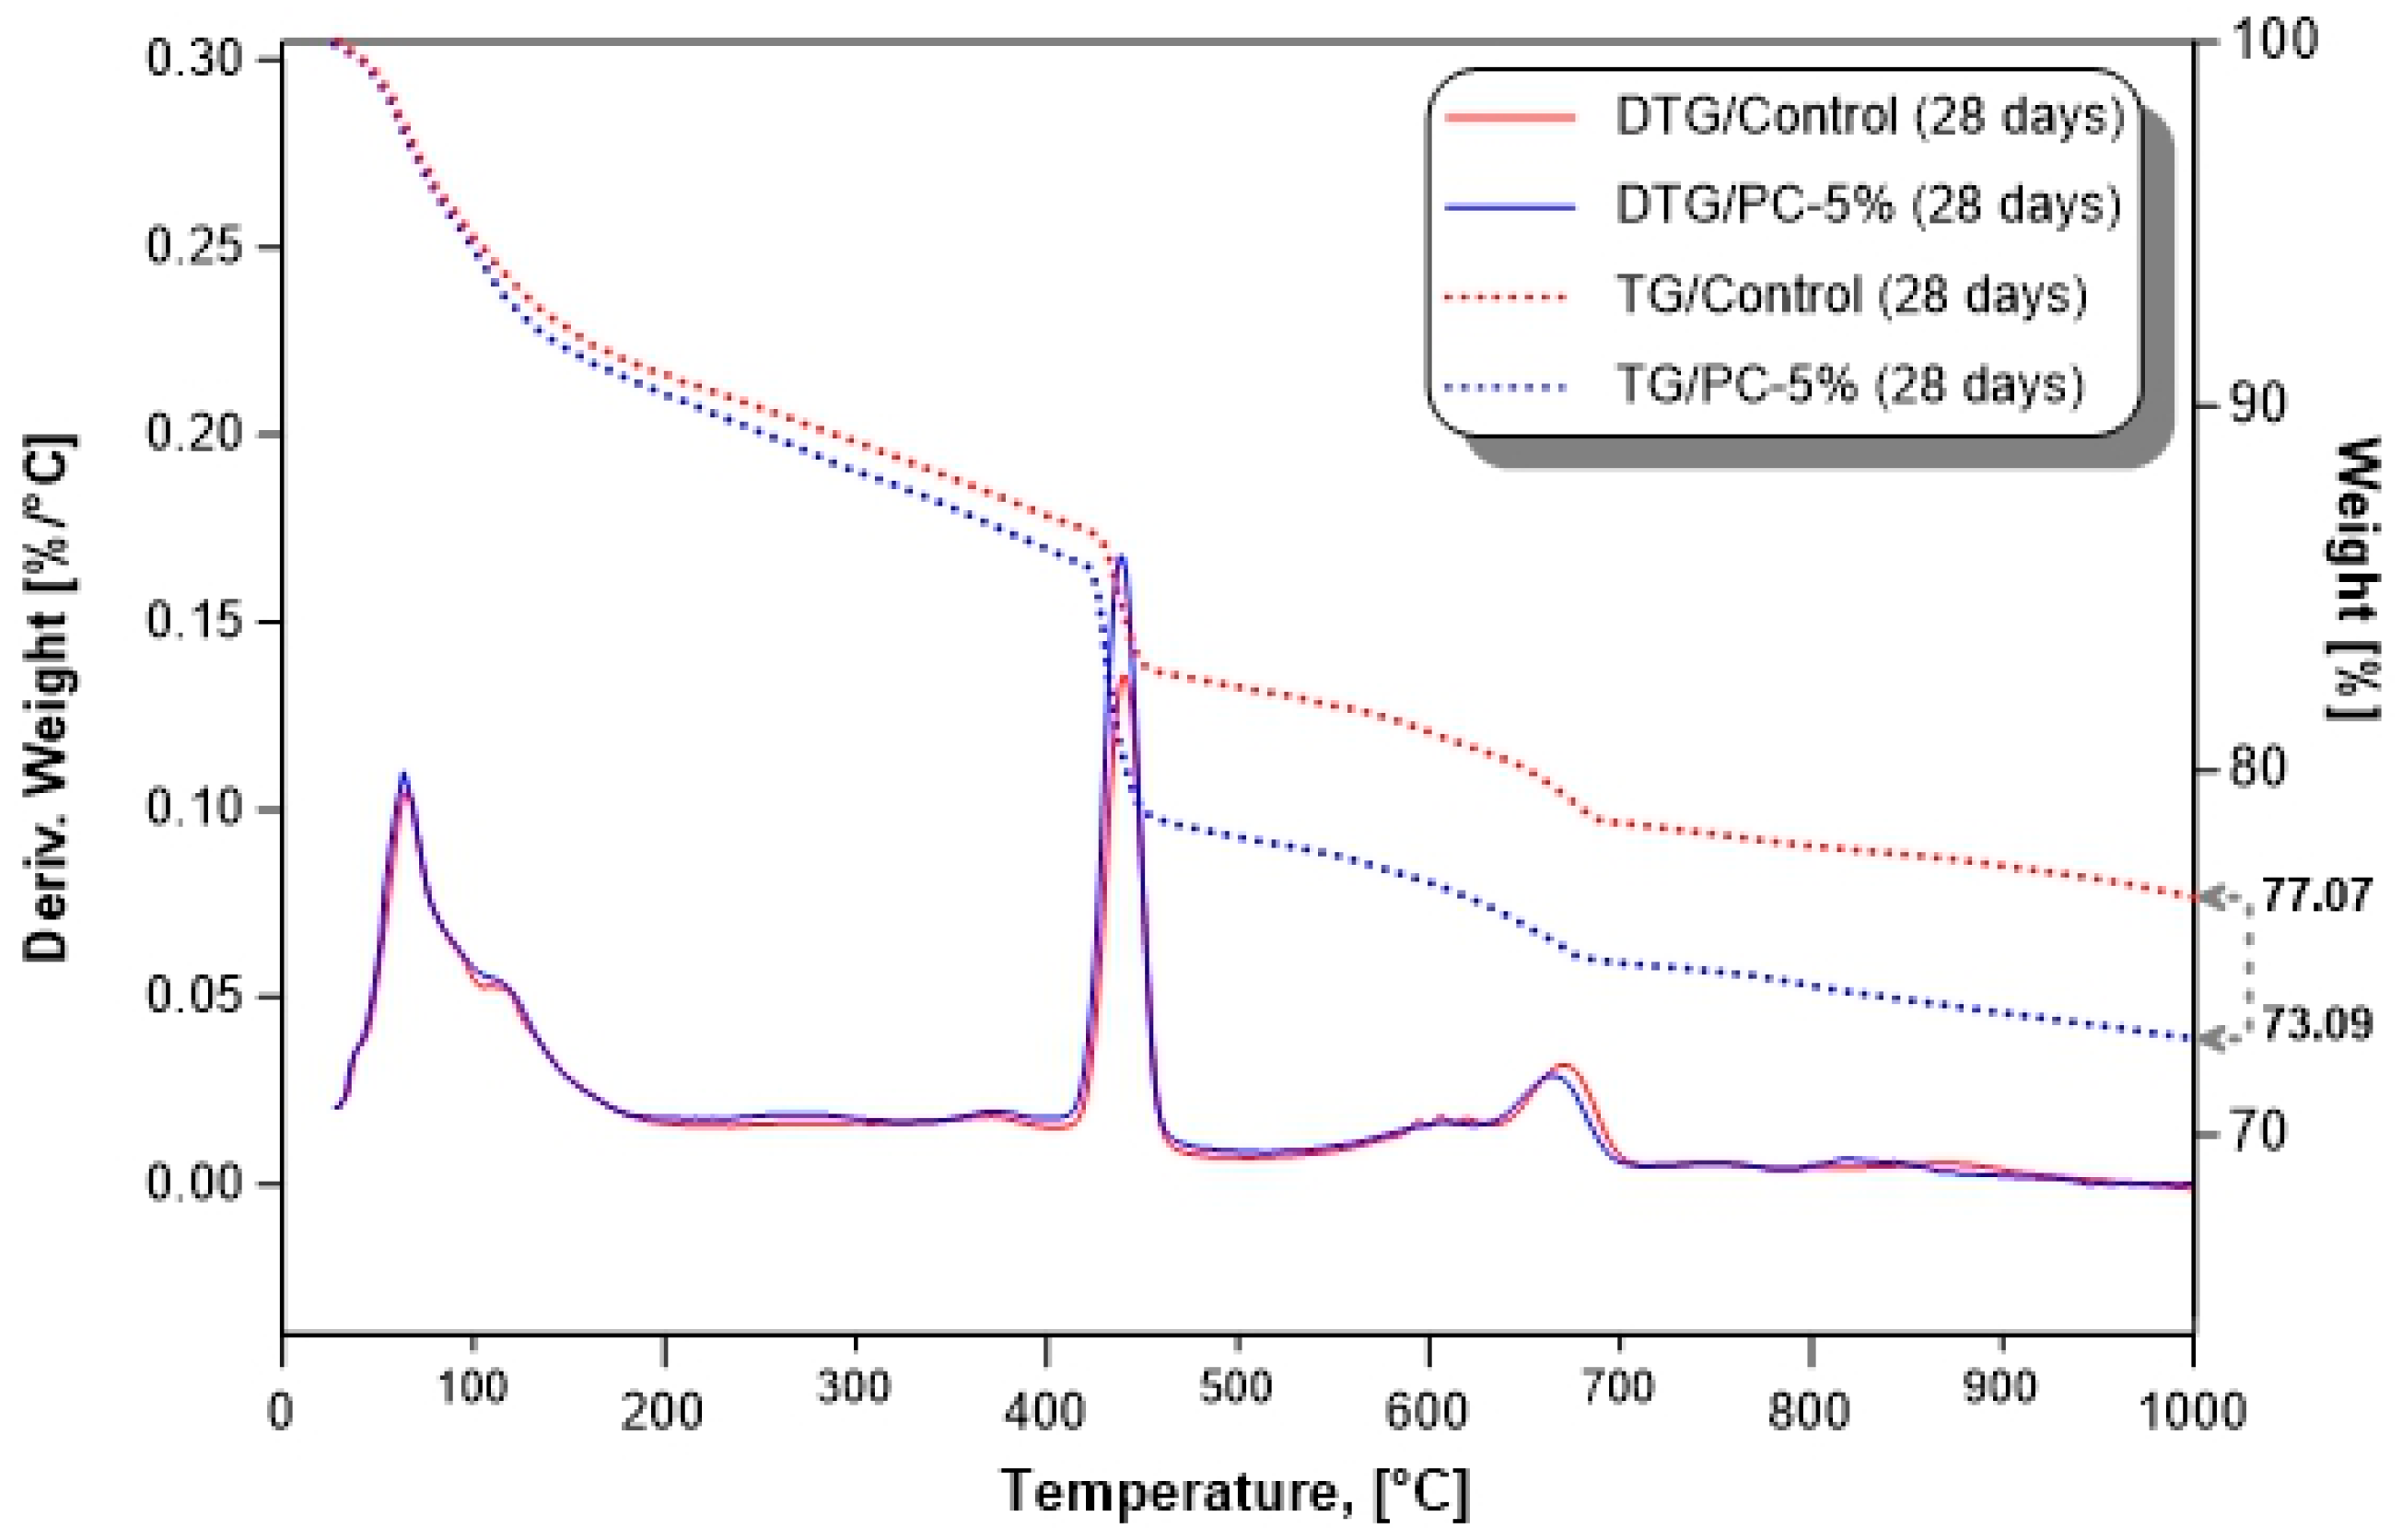
To verify the discrepancy in hydration crops between fills with/without superplasticizer, cement paste samples were subjected to a thermal analysis. Figure 10 depicts the TG/DTG diagrams of fills with and without superplasticizer following 28-day curing. The DTG plots exhibit the decomposition of hydration products within specific temperature intervals. Typically, the initial peak emerges between 100 °C and 150 °C and is attributed to dehydration of hydrates and calcium sulphoaluminates hydrates (ettringite and monosulphate). The second peak primarily stems from the dehydroxylation of portlandite (calcium hydroxide, Ca(OH)2) and is commonly observed between 450 and 520 °C. In conclusion, the third peak, occurring between 650 and 800 °C, arises from the decomposition of carbonate compounds and calcite [58,59,60].
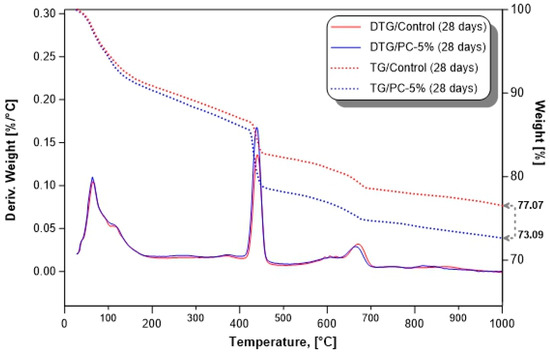
Figure 10.
TG/DTG views of cement pastes with/without a superplasticizer at 28 days.
The DTG graphs depicted in Figure 10 demonstrate that the cement paste containing superplasticizer and exposed to 28-day curing exhibited significantly higher quantities of hydration crops, predominantly CH, compared to cement paste without a superplasticizer. The TG plots in Figure 10 illustrate that, after reaching 1000 °C, roughly 73% of the sample weight corresponded to the portion with a superplasticizer admixture, while around 77% of the weight of the sample without an admixture (control) was reflected on the graph. These findings indicate that the samples containing the superplasticizer admixture experienced a higher degree of hydration compared to the control, thereby reducing the permeability of the CPF. These findings align with those reported in previous studies [17,61].
The TG analysis results obtained are reinforced by ab XRD analysis conducted on 28-day-cured cementing pastes. Figure 11 displays the XRD designs and mineralogy of cementing pastes with/without a superplasticizer. The presence of superplasticizer (PC-5%) in cement pastes leads to a greater concentration of hydration crops compared to the control specimen. Notably, the CH intensity peaks at 18° and 34° 2-theta in fills with a superplasticizer are notably higher than those of the control sample. Similarly, the C-S-H intensity peaks at 29° and 32° 2-theta in fills with a superplasticizer surpass that of the control sample.
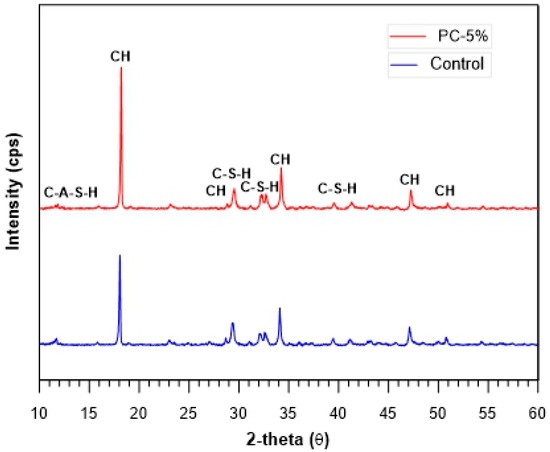
Figure 11.
XRD pattern of cementing pastes with/without a superplasticizer at 28 days.
TG/XRD studies reveal that a superplasticizer has a long-age impact on the cement hydration process. The findings of this study align with those of Haruna and Fall [17], Haruna and Fall [61], and Al-Moselly et al. [62], indicating that samples containing a superplasticizer display higher peaks, thus indicating a greater abundance of hydration products.
4. Conclusions
A full examination of the long-age (up to 150 days) impact of a superplasticizer on the rheological, mechanical, hydraulic, and microstructural properties of fills was undertaken. Fills with varying superplasticizer dosages of 0%, 1%, 3%, and 5% underwent a series of tests, including UCS, MIP, SEM, permeability, and rheological evaluations (slump cone, vane shear tests). Furthermore, to advance visions into admixture- and non-admixture-based fills’ microstructural changes, TG/DTG and XRD studies were conducted on cementing pastes featuring a w/c ratio of 2. The principal findings of the experimental program are below:
- The addition of a superplasticizer to fill mixtures at a dosage of 0% to 5% caused a major 23% drop in water demand and a remarkable 6-fold decrease in yield stress from 631.6 Pa to 109.8 Pa at 240 min. hydration time, leading to a more flowable and workable paste that can be easily transferred underground and reduce the risk of pipe blockages.
- The superplasticizer addition pointedly enhanced one fill sample’s long-aged strength, with a 2.4-fold increase at 5% dosage compared to the control. This strength improvement was accompanied by a notable shift in the stress–strain behavior, resulting in a sizeable rise in the fill’s elastic modulus and load–bearing capacity. Additionally, the incorporation of superplasticizer resulted in a drop of strain values at the fill’s peak stress, attributed to the prolonged curing time and increased dosage.
- Incorporating a superplasticizer in fills caused pore refinement, which manifested as a significant reduction in MIP n_tot porosity from 24.4% to 16.4%, representing a notable decrease of approximately 32%. SEM analysis further revealed that the samples with superplasticizers were more compact and denser, resulting in a more uniform hydration process, corroborating the observed reduction in porosity.
- Utilizing a superplasticizer in one fill mixture caused a significant drop in hydraulic conductivity, decreasing its permeability by almost 30 times. At 150-day curing, the fill’s hydraulic conductivity with a 5% superplasticizer addition decreased from 2.96 × 10⁻⁸ cm/s to 8.73 × 10⁻⁷ cm/s compared to the control sample.
- TG/DTG-XRD studies revealed that incorporating a superplasticizer enhanced the generation of hydration crops within a fill’s cement paste. Hydration crops increased by the admixture effectively filling the voids within the cement matrix, resulting in a significant decrease in porosity.
These conclusions suggest that superplasticizer utilization in CPFs greatly reduces water consumption, facilitating the disposal of larger quantities of solid waste to underground voids. Moreover, the enhanced durability of long-aged fills, attributed to lower w/c ratios and refined pore structures, translates to a major rise in their load-bearing capacities. Overall, our results suggest that the use of superplasticizers in CPFs enhances their mechanical stability, durability, and environmental views, promoting viable mining practices.
Funding
This research received no external funding.
Data Availability Statement
The data presented in this review are available within the manuscript.
Acknowledgments
We are grateful for the supplied material support of BASF Canada and Lafarge Canada, and we also thank M. Ali GUCER for his technical backing.
Conflicts of Interest
The author declares no conflicts of interest.
References
- Sun, Q.; Zhang, J.; Zhang, Q.; Yan, H. A case study of mining-induced impacts on the stability of multi-tunnels with the backfill mining method and controlling strategies. Environ. Earth. Sci. 2018, 77, 234. [Google Scholar] [CrossRef]
- Benzaazoua, M.; Fall, M.; Belem, T. A contribution to understanding the hardening process of cemented paste fill. Miner. Eng. 2004, 17, 141–152. [Google Scholar] [CrossRef]
- Fall, M.; Benzaazoua, M.; Saa, E.G. Mix proportioning of underground cemented tailings backfill. Tunn. Undergr. Space Technol. 2008, 23, 80–90. [Google Scholar] [CrossRef]
- Qi, C.; Fourie, A. Cemented paste backfill for mineral tailings management: Review and future perspectives. Miner. Eng. 2019, 144, 106025. [Google Scholar] [CrossRef]
- Thompson, B.D.; Bawden, W.F.; Grabinsky, M.W. In situ measurements of cemented paste backfill at the Cayeli Mine. Can. Geotech. J. 2012, 49, 755–772. [Google Scholar] [CrossRef]
- Yilmaz, E.; Belem, T.; Benzaazoua, M. Effects of curing and stress conditions on hydromechanical, geotechnical and geochemical properties of cemented paste backfill. Eng. Geol. 2014, 168, 23–37. [Google Scholar] [CrossRef]
- Belem, T.; Benzaazoua, M. Design and application of underground mine paste backfill technology. Geotech. Geol. Eng. 2008, 26, 147–174. [Google Scholar] [CrossRef]
- Fall, M.; Belem, T.; Samb, S.; Benzaazoua, M. Experimental characterization of the stress-strain behaviour of cemented paste backfill in compression. J. Mater. Sci. 2007, 42, 3914–3922. [Google Scholar] [CrossRef]
- Ghirian, A.; Fall, M. Coupled thermo-hydro-mechanical—Chemical behaviour of cemented paste backfill in column experiments. Part I: Physical, hydraulic and thermal processes and characteristics. Eng. Geol. 2013, 164, 195–207. [Google Scholar] [CrossRef]
- Ghirian, A.; Fall, M. Coupled thermo-hydro-mechanical–chemical behaviour of cemented paste backfill in column experiments: Part II: Mechanical, chemical and microstructural processes and characteristics. Eng. Geol. 2014, 170, 11–23. [Google Scholar] [CrossRef]
- Ercikdi, B.; Cihangir, F.; Kesimal, A.; Deveci, H. Practical importance of tailings for cemented paste backfill. In Paste Tailings Management; Yilmaz, E., Fall, M., Eds.; Springer International Publishing: Cham, Switzerland, 2017; pp. 7–32. [Google Scholar] [CrossRef]
- Ghirian, A.; Fall, M. Properties of cemented paste backfill. In Paste Tailings Management; Yilmaz, E., Fall, M., Eds.; Springer International Publishing: Cham, Switzerland, 2017; pp. 59–109. [Google Scholar] [CrossRef]
- Liu, J.; Sui, W.; Zhang, D.; Zhao, Q. Durability of water-affected paste backfill material and its clean use in coal mining. J. Clean. Prod. 2020, 250, 119576. [Google Scholar] [CrossRef]
- Wang, Y.; Cao, Y.; Cui, L.; Si, Z.; Wang, H. Effect of external sulfate attack on the mechanical behavior of cemented paste backfill. Constr. Build. Mater. 2020, 263, 120968. [Google Scholar] [CrossRef]
- Fall, M.; Adrien, D.; Célestin, J.C.; Pokharel, M.; Touré, M. Saturated hydraulic conductivity of cemented paste backfill. Miner. Eng. 2009, 22, 1307–1317. [Google Scholar] [CrossRef]
- Pokharel, M.; Fall, M. Combined influence of sulphate and temperature on the saturated hydraulic conductivity of hardened cemented paste backfill. Cem. Concr. Compos. 2013, 38, 21–28. [Google Scholar] [CrossRef]
- Haruna, S.; Fall, M. Insight into saturated hydraulic conductivity of cemented paste backfill containing polycarboxylate ether-based superplasticizer. Minerals 2022, 12, 93. [Google Scholar] [CrossRef]
- Akkaya, U.G.; Cinku, K.; Yilmaz, E. Characterization of strength and quality of cemented mine backfill made up of lead-zinc processing tailings. Front. Mater. 2021, 8, 740116. [Google Scholar] [CrossRef]
- Sari, M.; Yilmaz, E.; Kasap, T.; Guner, N.U. Strength and microstructure evolution in cemented mine backfill with low and high pH pyritic tailings: Effect of mineral admixtures. Constr. Build. Mater. 2022, 328, 127109. [Google Scholar] [CrossRef]
- Fang, K.; Zhang, J.; Cui, L.; Haruna, S.; Li, M. Cost optimization of cemented paste backfill: State-of-the-art review and future perspectives. Miner. Eng. 2023, 204, 108414. [Google Scholar] [CrossRef]
- Bull, A.J.; Fall, M. Curing temperature dependency of the release of arsenic from cemented paste backfill made with portland cement. J. Environ. Manag. 2020, 269, 110772. [Google Scholar] [CrossRef]
- Veenstra, R.; Grabinsky, M.; Bawden, W.; Thompson, B. A numerical analysis of how permeability affects the development of pore water pressure in early age cemented paste backfill in a backfilled stope. In Proceedings of the Eleventh International Symposium on Mining with Backfill, Australian Centre for Geomechanics, Perth, WA, Australia, 20–22 May 2014; pp. 83–95. [Google Scholar] [CrossRef]
- Cihangir, F.; Akyol, Y. Mechanical, hydrological and microstructural assessment of the durability of cemented paste backfill containing alkali-activated slag. Int. J. Min. Reclam. Environ. 2018, 32, 123–143. [Google Scholar] [CrossRef]
- Behera, S.K.; Mishra, D.P.; Singh, P.; Mishra, K.; Mandal, S.K.; Ghosh, C.N.; Kumar, R.; Mandal, P.K. Utilization of mill tailings, fly ash and slag as mine paste backfill material: Review and future perspective. Constr. Build. Mater. 2021, 309, 125120. [Google Scholar] [CrossRef]
- Ercikdi, B.; Cihangir, F.; Kesimal, A.; Deveci, H.; Alp, İ. Utilization of water-reducing admixtures in cemented paste backfill of sulphide-rich mill tailings. J. Hazard. Mater. 2010, 179, 940–946. [Google Scholar] [CrossRef] [PubMed]
- Ouattara, D.; Yahia, A.; Mbonimpa, M.; Belem, T. Effects of superplasticizer on rheological properties of cemented paste backfills. Int. J. Miner. Process. 2017, 161, 28–40. [Google Scholar] [CrossRef]
- Koohestani, B.; Darban, A.K.; Mokhtari, P. A comparison between the influence of superplasticizer and organosilanes on different properties of cemented paste backfill. Constr. Build. Mater. 2018, 173, 180–188. [Google Scholar] [CrossRef]
- Mangane, M.B.C.; Argane, R.; Trauchessec, R.; Lecomte, A.; Benzaazoua, M. Influence of superplasticizers on mechanical properties and workability of cemented paste backfill. Miner. Eng. 2018, 116, 3–14. [Google Scholar] [CrossRef]
- Ouattara, D.; Belem, T.; Mbonimpa, M.; Yahia, A. Effect of superplasticizers on the consistency and unconfined compressive strength of cemented paste backfills. Constr. Build. Mater. 2018, 181, 59–72. [Google Scholar] [CrossRef]
- Panchal, S.; Deb, D.; Sreenivas, T. Variability in rheology of cemented paste backfill with hydration age, binder and superplasticizer dosages. Adv. Powder Technol. 2018, 29, 2211–2220. [Google Scholar] [CrossRef]
- Yang, L.; Yilmaz, E.; Li, J.; Liu, H.; Jiang, H. Effect of superplasticizer type and dosage on fluidity and strength behavior of cemented tailings backfill with different solid contents. Constr. Build. Mater. 2018, 187, 290–298. [Google Scholar] [CrossRef]
- Cavusoglu, I.; Yilmaz, E.; Yilmaz, A.O. Additivity effect on properties of cemented coal fly ash backfill containing water-reducing admixtures. Constr. Build. Mater. 2021, 267, 121021. [Google Scholar] [CrossRef]
- Haruna, S.; Fall, M. Time- and temperature-dependent rheological properties of cemented paste backfill that contains superplasticizer. Powder. Technol. 2020, 360, 731–740. [Google Scholar] [CrossRef]
- Nasir, O.; Fall, M. Shear behaviour of cemented pastefill-rock interfaces. Eng. Geol. 2008, 101, 146–153. [Google Scholar] [CrossRef]
- Fall, M.; Pokharel, M. Coupled effects of sulphate and temperature on the strength development of cemented tailings backfills: Portland cement-paste backfill. Cem. Concr. Compos. 2010, 32, 819–828. [Google Scholar] [CrossRef]
- Fall, M.; Célestin, J.C.; Pokharel, M.; Touré, M. A contribution to understanding the effects of curing temperature on the mechanical properties of mine cemented tailings backfill. Eng. Geol. 2010, 114, 397–413. [Google Scholar] [CrossRef]
- Qiu, J.; Guo, Z.; Yang, L.; Jiang, H.; Zhao, Y. Effect of tailings fineness on flow, strength, ultrasonic and microstructure characteristics of cemented paste backfill. Constr. Build. Mater. 2020, 263, 120645. [Google Scholar] [CrossRef]
- Guo, Z.; Qiu, J.; Jiang, H.; Zhang, S.; Ding, H. Improving the performance of superfine-tailings cemented paste backfill with a new blended binder. Powder. Technol. 2021, 394, 149–160. [Google Scholar] [CrossRef]
- Landriault, D. Backfill in Underground Mining; SME, Society for Mining, Metallurgy, and Exploration (SME): Littleton, CO, USA, 2001; pp. 601–614. [Google Scholar]
- ASTM C494; Standard Specification for Chemical Admixtures for Concrete. ASTM International: West Conshohocken, PA, USA, 2015.
- ASTM C143/C143M; Standard Test Method for Slump of Hydraulic-Cement Concrete. ASTM International: West Conshohocken, PA, USA, 2015.
- Boger, D.; Scales, P.; Sofra, F. Rheological concepts. In Paste and Thickened Tailings—A Guide, 2nd ed.; Jewell, R.J., Fourie, A.B., Eds.; Australian Centre for Geomechanics: Perth, Australia, 2006; pp. 1–25. [Google Scholar]
- ASTM C39; Standard Test Method for Compressive Strength of Cylindrical Concrete Specimens. ASTM International: West Conshohocken, PA, USA, 2016.
- Ghirian, A.; Fall, M. Long-term coupled behaviour of cemented paste backfill in load cell experiments. Geomech. Geoeng. Int. J. 2016, 4, 237–251. [Google Scholar] [CrossRef]
- ASTM D5084-16a; Standard Test Methods for Measurement of Hydraulic Conductivity of Saturated Porous Materials Using a Flexible Wall Permeameter 1. ASTM International: West Conshohocken, PA, USA, 2016.
- Thomashausen, S.; Maennling, N.; Mebratu-Tsegaye, T. A comparative overview of legal frameworks governing water use and waste water discharge in the mining sector. Resour. Policy 2018, 55, 143–151. [Google Scholar] [CrossRef]
- Niroshan, N.; Sivakugan, N.; Veenstra, R.L. Flow characteristics of cemented paste backfill. Geotech. Geol. Eng. 2018, 36, 2261–2272. [Google Scholar] [CrossRef]
- Cao, S.; Yilmaz, E.; Song, W. Evaluation of viscosity, strength and microstructural properties of cemented tailings backfill. Minerals 2018, 8, 352. [Google Scholar] [CrossRef]
- Zhang, J.; Deng, H.; Taheri, A.; Deng, J.; Ke, B. Effects of Superplasticizer on the Hydration, Consistency, and Strength Development of Cemented Paste Backfill. Minerals 2018, 8, 381. [Google Scholar] [CrossRef]
- Cavusoglu, I.; Fall, M. Engineering properties of cemented paste backfill with full-range water-reducing admixture. Int. J. Civ. Eng. 2023, 21, 1567–1582. [Google Scholar] [CrossRef]
- Mehta, P.K.; Monteiro, P.J.M. Concrete: Microstructure, Properties, and Materials, 2nd ed.; Prentice Hall: Upper Saddle River, NJ, USA, 1993. [Google Scholar]
- Hong, S.; de Bruyn, K.; Bescher, E.; Ramseyer, C.; Kang, T.H.K. Porosimetric features of calcium sulfoaluminate and portland cement pastes: Testing protocols and data analysis. J. Struct. Integr. Maint. 2018, 3, 52–66. [Google Scholar] [CrossRef]
- Qian, X.; Yu, C.; Zhang, L.; Qian, K.; Fang, M.; Lai, J. Influence of superplasticizer type and dosage on early-age drying shrinkage of cement paste with consideration of pore size distribution and water loss. J. Wuhan. Univ. Technol.-Mat. Sci. Edit. 2020, 35, 758–767. [Google Scholar] [CrossRef]
- Ouellet, S.; Bussière, B.; Mbonimpa, M.; Benzaazoua, M.; Aubertin, M. Reactivity and mineralogical evolution of an underground mine sulphidic cemented paste backfill. Miner. Eng. 2006, 19, 407–419. [Google Scholar] [CrossRef]
- Aldhafeeri, Z.; Fall, M. Time and damage induced changes in the chemical reactivity of cemented paste backfill. J. Environ. Chem. Eng. 2016, 4, 4038–4049. [Google Scholar] [CrossRef]
- Aldhafeeri, Z.; Fall, M. Coupled effect of sulphate and temperature on the reactivity of cemented tailings backfill. Int. J. Min. Reclam. Environ. 2021, 35, 80–94. [Google Scholar] [CrossRef]
- Perrot, A.; Rangeard, D.; Picandet, V.; Mélinge, Y. Hydro-mechanical properties of fresh cement pastes containing polycarboxylate superplasticizer. Cem. Concr. Res. 2013, 53, 221–228. [Google Scholar] [CrossRef]
- Bhatty, J.I.; Reid, K.J. Use of thermal analysis in the hydration studies of a type 1 portland cement produced from mineral tailings. Thermochim. Acta 1985, 91, 95–105. [Google Scholar] [CrossRef]
- Lothenbach, B.; Durdziński, P.; Weerdt, K.D. Thermogravimetric analysis. In A Practical Guide to Microstructural Analysis of Cementitious Materials, 1st ed.; Scrivener, K., Snellings, R., Lothenbach, B., Eds.; CRC Press Taylor & Francis Group: London, UK, 2016; pp. 177–212. [Google Scholar] [CrossRef]
- Li, W.; Fall, M. Sulphate effect on the early age strength and self-desiccation of cemented paste backfill. Constr. Build. Mater. 2016, 106, 296–304. [Google Scholar] [CrossRef]
- Haruna, S.; Fall, M. Strength development of cemented tailings materials containing polycarboxylate ether-based superplasticizer: Experimental results on the effect of time and temperature. Can. J. Civ. Eng. 2021, 48, 429–442. [Google Scholar] [CrossRef]
- Al-Moselly, Z.; Fall, M.; Haruna, S. Further insight into the strength development of cemented paste backfill materials containing polycarboxylate ether-based superplasticizer. J. Build. Eng. 2022, 47, 103859. [Google Scholar] [CrossRef]


Disclaimer/Publisher’s Note: The statements, opinions and data contained in all publications are solely those of the individual author(s) and contributor(s) and not of MDPI and/or the editor(s). MDPI and/or the editor(s) disclaim responsibility for any injury to people or property resulting from any ideas, methods, instructions or products referred to in the content. |
© 2024 by the author. Licensee MDPI, Basel, Switzerland. This article is an open access article distributed under the terms and conditions of the Creative Commons Attribution (CC BY) license (https://creativecommons.org/licenses/by/4.0/).