Article

Hydrocarbon Accumulation and Overpressure Evolution of the Ordovician Carbonate Reservoirs in the Tahe Area, Tarim Basin, NW China

1
Key Laboratory of Tectonics and Petroleum Resources of Ministry of Education, China University of Geosciences, Wuhan 430074, China
2
School of Energy, China University of Geosciences, Beijing 100083, China
*
Author to whom correspondence should be addressed.
Minerals 2024, 14(12), 1250; https://doi.org/10.3390/min14121250
Submission received: 15 November 2024 / Revised: 2 December 2024 / Accepted: 5 December 2024 / Published: 9 December 2024
(This article belongs to the Section Mineral Exploration Methods and Applications)

Abstract

:
The recovery of reservoir paleo-pressure has been a key focus in hydrocarbon accumulation research. The evolution of paleo-pressure in carbonate reservoir rocks has long been a research challenge for researchers. Using the Tahe area in the Tarim Basin as a case study, this paper proposes an idea for studying the paleo-pressure evolution in carbonate rocks through fluid inclusions. A series of methods, including cathodoluminescence, fluid inclusion petrography, laser in situ U–Pb isotope dating, and microthermometry, were employed to determine the stages of hydrocarbon accumulation. Additionally, the paleo-pressure of oil inclusions from different stages has been restored, and the pressure evolution of the Ordovician carbonate reservoirs in the Tahe area was reconstructed. The study identifies four stages of oil charging in Ordovician carbonate reservoirs. The four oil-charging events occurred during the Caledonian (459–450 Ma), Hercynian (320–311 Ma), late Indosinian (227–213 Ma), and Yanshanian (134–117 Ma) periods. The overpressure evolution indicates that the Cambrian source rocks reached the first oil generation peak and started to expel hydrocarbons during the late Caledonian period. Oil mainly migrated vertically along strike-slip faults and accumulated in fracture-cavity karst reservoirs. At the same time, the reservoir pressure increased rapidly. Subsequent tectonic compression caused uplift and erosion, leading to the destruction of the oil reservoirs and a decrease in pressure. During the Hercynian period, hydrocarbons migrated and accumulated in reservoirs, leading to an increase in reservoir pressure. Subsequently, a slight formation uplift occurred, which caused a decrease in pressure. During the late Indosinian period, the third stage of oil accumulation led to an increase in reservoir pressure. Tectonic uplift during the Yanshanian period caused reservoir destruction and adjustment, resulting in a decrease in pressure. Reservoir pressure increased with oil charging during the Yanshanian period. Subsequently, a large number of faults developed in the study area, causing further destruction and re-adjustment of the oil reservoirs, which led to a decrease in pressure to the current state of normal pressure or weak overpressure.

1. Introduction

Paleo-pressure evolution in sedimentary basins is crucial for analyzing the hydrocarbon accumulation mechanism and process [1]. The Tahe Oilfield is the first super-large Paleozoic marine carbonate oilfield in China, characterized by deep karst reservoirs and complex reservoir structures. The primary hydrocarbon production formations are the Ordovician carbonates [2,3,4]. Previous research has focused on the accumulation period and timing of Ordovician reservoirs in the Tahe area. However, the recovery and evolution of the paleo-pressure in the study area remain unclear [5,6,7,8,9]. Currently, the most commonly used technique for paleo-pressure recovery is PVT simulation based on fluid inclusions, and Aplin was the first to propose a method for recovering reservoir fluid pressure by accurately measuring gas–liquid ratios of fluid inclusions using laser scanning confocal microscopy [10]. Due to the experimental conditions, it is difficult to obtain detailed information on the components of multi-stage oil inclusions effectively, which limits the accuracy of PVT simulation [11]. Therefore, based on a large dataset of known fluid inclusions, Ping et al. developed a fluid composition prediction model and a trapping pressure prediction model. They concluded that the average absolute deviation of trapping pressure for oil-bearing fluid inclusions that homogenize into the liquid phase is 8.2%–12.3%, which can accurately predict the trapping pressure [12]. The new prediction models provide faster and more accurate predictions of hydrocarbon fluid composition and trapping pressure, based on the gas–liquid ratio (Fv) and homogenization temperature (Th), and avoid the need for multi-stage inclusion components. Therefore, this method offers distinct advantages over the traditional fluid inclusion PVT simulation.
The reservoir space in the Ordovician carbonate reservoirs of the Tahe area consists primarily of paleokarst caves [13]. Karst caves in carbonate reservoirs are mainly a result of multiple tectonic movements in the Tahe area. The Ordovician carbonate rocks underwent several superimposed karstification processes under surface and near-surface conditions [14,15,16,17]. Drilling results indicate that some karst caves in the Ordovician carbonate reservoirs of the Tahe area have been filled, while others, which remain half-filled or completely unfilled, are still well preserved. In the northern Tahe area, the ratio of partially filled and unfilled karst caves is approximately 78.4%, while in the southern region, the ratio of unfilled karst caves is about 90.91%. Lei et al. concluded that overpressure fluid filling in the caves can counteract part of the weight of the overlying strata and support the roof and sidewalls of the caves, which is conducive to preserving them [14].
The formation and evolution of overpressure in sedimentary basins are closely linked to the generation, migration, accumulation, and preservation of oil and gas. Therefore, it is crucial to guide geological exploration to analyze the characteristics of fluid pressure evolution [18,19]. This paper took the Tahe area as its research object. Using methods such as cathodoluminescence, fluid inclusion petrography, laser in situ U–Pb isotope dating, and microthermometry, this paper established the reservoir pressure evolution and analyzed the factors influencing pressure changes in the Tahe area by (1) systematically analyzing fluid inclusions developed in calcite veins, (2) determining the charging time of multi-stage fluid inclusions, and (3) calculating trapping pressure using the new prediction model.

2. Geological Setting

The Tahe area is situated in the Akekule bulge slope zone, on the southern side of the Shaya uplift, in the northern Tarim Basin of China (Figure 1A) [20]. The Tahe Oilfield is a typical karst cave reservoir in the Tarim Basin, known for its rich hydrocarbon resources. The Ordovician formation is the primary hydrocarbon formation and is composed, from bottom to top, of the Penglaiba Formation (O1p), Yingshan Formation (O1–2y), Yijianfang Formation (O2yj), Qiaerbake Formation (O3q), Lianglitage Formation (O3l), and Sangtamu Formation (O3s). Among them, the Yijianfang Formation (O2yj) and the Yingshan Formation (O1–2y) are the primary karst reservoirs in the Tahe area and are composed of marine carbonates. The lithology of the Yijianfang Formation includes clastic limestone, biological limestone, oolitic limestone, micrite limestone, and micrite-crystal limestone. The lithology of the upper section of the Yingshan Formation is micrite limestone and biological limestone, while the lithology of the lower section of the Yingshan Formation is composed of micrite limestone, dolomitic limestone, and dolomite (Figure 1B) [21].
The reservoir spaces of the Ordovician karst reservoirs consist primarily of pores, fractures, and karst caves. Among these, pores are mainly secondary porosities, typically formed by selective dissolution of grainstone by meteoric fresh water. These include intragranular dissolution pores, moldic pores, intergranular dissolution pores, and others. These reservoirs, which provided the primary conditions for hydrocarbon accumulation, were formed through the superimposition of multiple tectonic movements and karstification [23,24]. Several large-scale tectonic movements occurred in the Tarim Basin during the late Caledonian, early Hercynian, late Hercynian, Indosinian, late Yanshanian, and late Himalayan periods. The Ordovician carbonates, influenced by multi-period tectonic movements, experienced multiple karst exposures. The karst reservoirs are significant for the development of carbonate reservoirs [25,26]. The late Caledonian and early Hercynian periods were the primary periods of karstification in the Tahe area [27]. The top surfaces of the Yijianfang Formation and the Lianglitage Formation experienced short-term karst exposures during the middle Caledonian Stage I and II. The Tahe area was uplifted during Stage Ⅲ, causing significant denudation of the Ordovician formations. These formations were uplifted and denuded again during the early Hercynian period, exposing the carbonate rocks of the Yajianfang Formation and the Yingshan Formation to karstification [13].

3. Samples and Methods

3.1. Samples Data

To recover the paleo-pressure of the Ordovician carbonate reservoirs in the Tahe area, 15 carbonate samples were collected from multiple wells, including Wells 1 through 6. The samples were primarily collected from the Yingshan Formation and the Yajianfang Formation carbonate reservoirs in the Tahe area. The locations of these wells are shown in Figure 1. Based on the petrography observations of calcite veins and fluid inclusions, seven typical samples with well-developed oil inclusions were selected and prepared as double-sided polished thin sections, with a thickness of 100 μm (Table 1). Techniques such as the cathodoluminescence of calcite veins, petrography of oil inclusions, microthermomery, and confocal laser scanning microscopy were employed to determine the stages and time of hydrocarbon accumulation and to recover the paleo-pressure.
Petrography observation of oil inclusions, fluorescence spectroscopy and microthermometry were conducted at the Key Laboratory of Tectonics and Petroleum Resources Ministry of Education, China University of Geosciences, Wuhan. Cathodoluminescence and confocal laser scanning microscopy were conducted at the Sinopec Petroleum Exploration and Production Research Institute.

3.2. Fluid Inclusions Analysis

The cathodoluminescence characteristics of the calcite veins were analyzed using a CLF-2 cathodoluminescence instrument, operating at a voltage of 10.5 kV, a current of 250 μA, and under a vacuum of 3 Pa. The Nikon Eclipse LV100N POL microscope was used to observe the petrography characterization of fluid inclusions in calcite veins, while the Nikon microscope, equipped with Maya200Pro fluorescence spectroscopy, was used to analyze the fluorescence spectroscopy characteristics. The homogenization temperature (Th) of the fluid inclusions was measured using a Linkam THMS600G heating and freezing microscope stage, with measurement errors of ±1 °C. When measuring the homogenization temperature, larger inclusions with clear boundaries were selected from the same inclusion group. During the measurement, the heating rate should not be too fast. As the homogenization temperature is approached, the heating rate should be reduced, and close attention should be paid to the temperature at which the bubble disappears. This temperature is defined as the homogenization temperature.

3.3. Measurement of Gas–Liquid Ratio

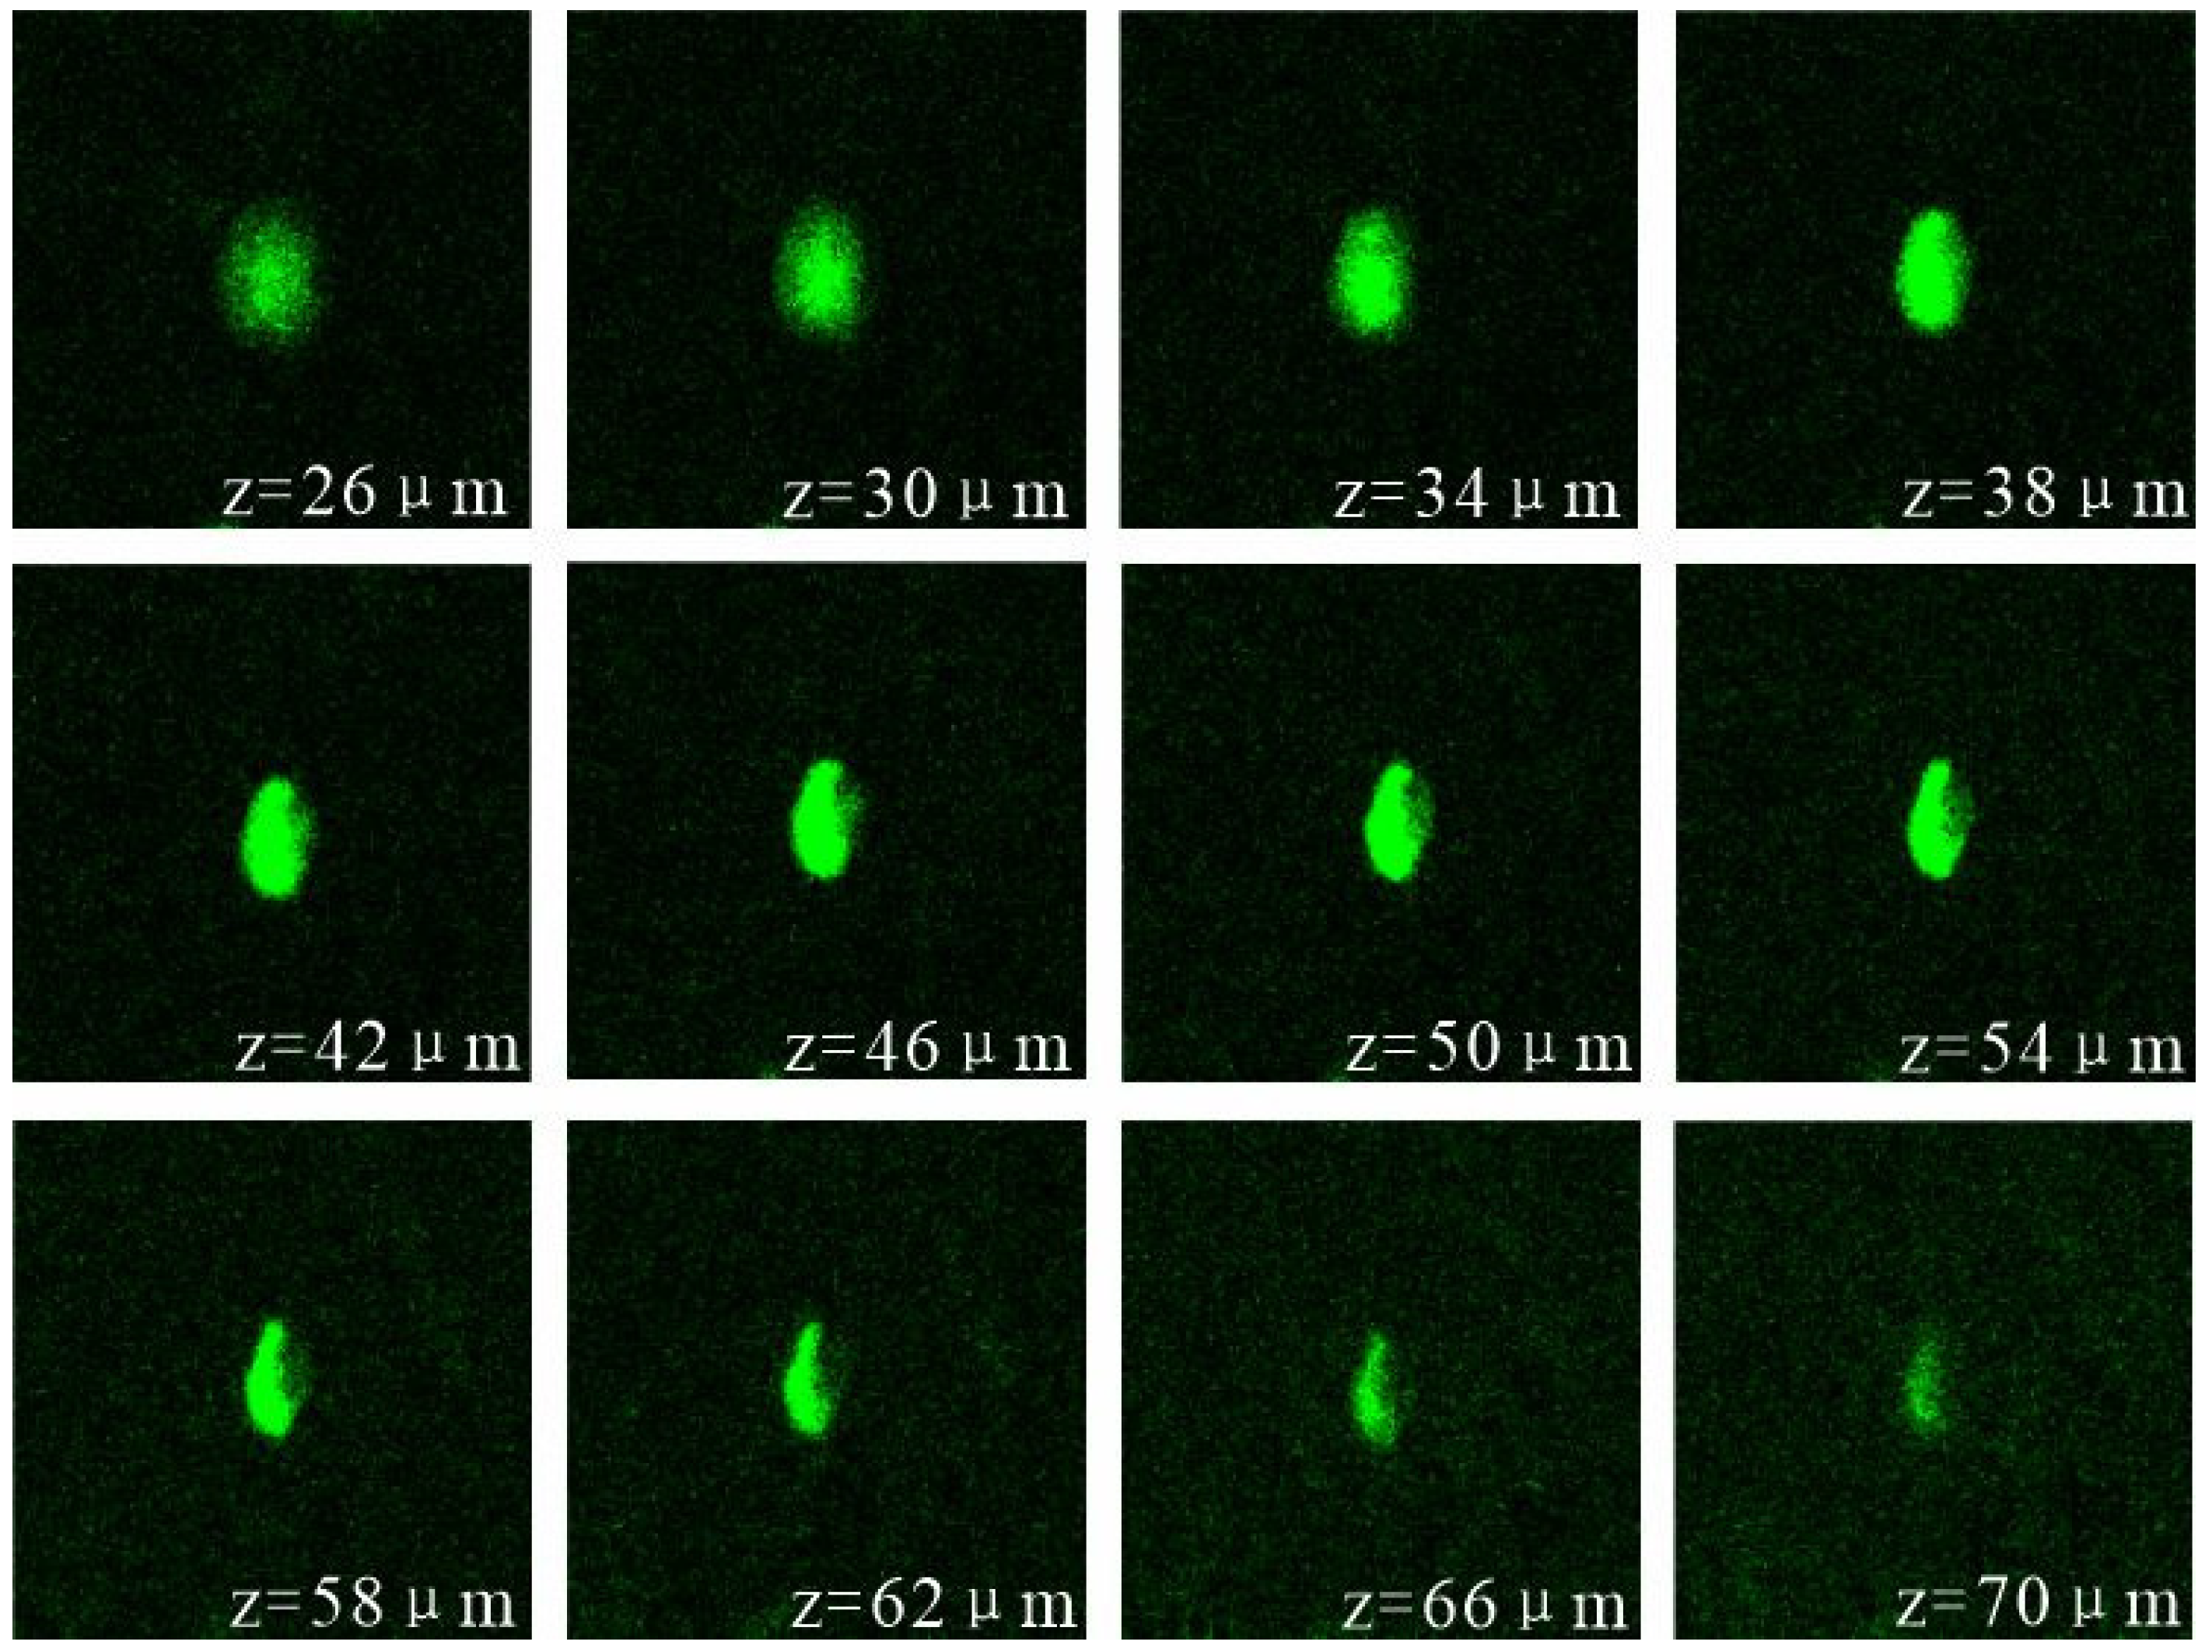
Laser scanning images were obtained using a Leica TCS SP8X SMO confocal laser scanning microscope. Confocal laser scanning microscopy is a non-destructive, multi-layer measurement technique. The principle is to use the confocal laser wavelength to scan organic matter, generating fluorescence without damaging the samples, thus performing the layered scanning of hydrocarbon inclusions [28,29]. It is crucial to select large and well-shaped inclusions for confocal laser scanning microscopy experiments because the gas–liquid ratio significantly affects the results of the thermodynamics. The target oil inclusions were initially observed under ultraviolet light, and the laser scanning images were captured using lasers with wavelengths of 405 nm and 470 nm. The computer defines the top and bottom interfaces of the target oil inclusions, where the fluorescence of the oil inclusions disappears when moving upward at the top interface and downward at the bottom interface. The vertical sampling interval is set at 1 μm to obtain 2D vertical slices [30]. Then, the acquired 2D images were processed using the image processing software Image J (https://imagej.net/ij/), and the total volume of the oil inclusions was accurately measured. The laser excites the organic matter in the oil inclusions and produces fluorescence, causing fluorescence at the edges and resulting in errors in bubble volume measurement. Therefore, photographs of the oil inclusions were obtained under transmitted light. The bubble diameters were measured, and the gas volume was calculated using the sphere volume formula. The total volume is subtracted from the gas volume to calculate the liquid volume, and the gas–liquid ratio of the oil inclusion is determined [28].

4. Results

4.1. Cathodoluminescence of Calcite Veins

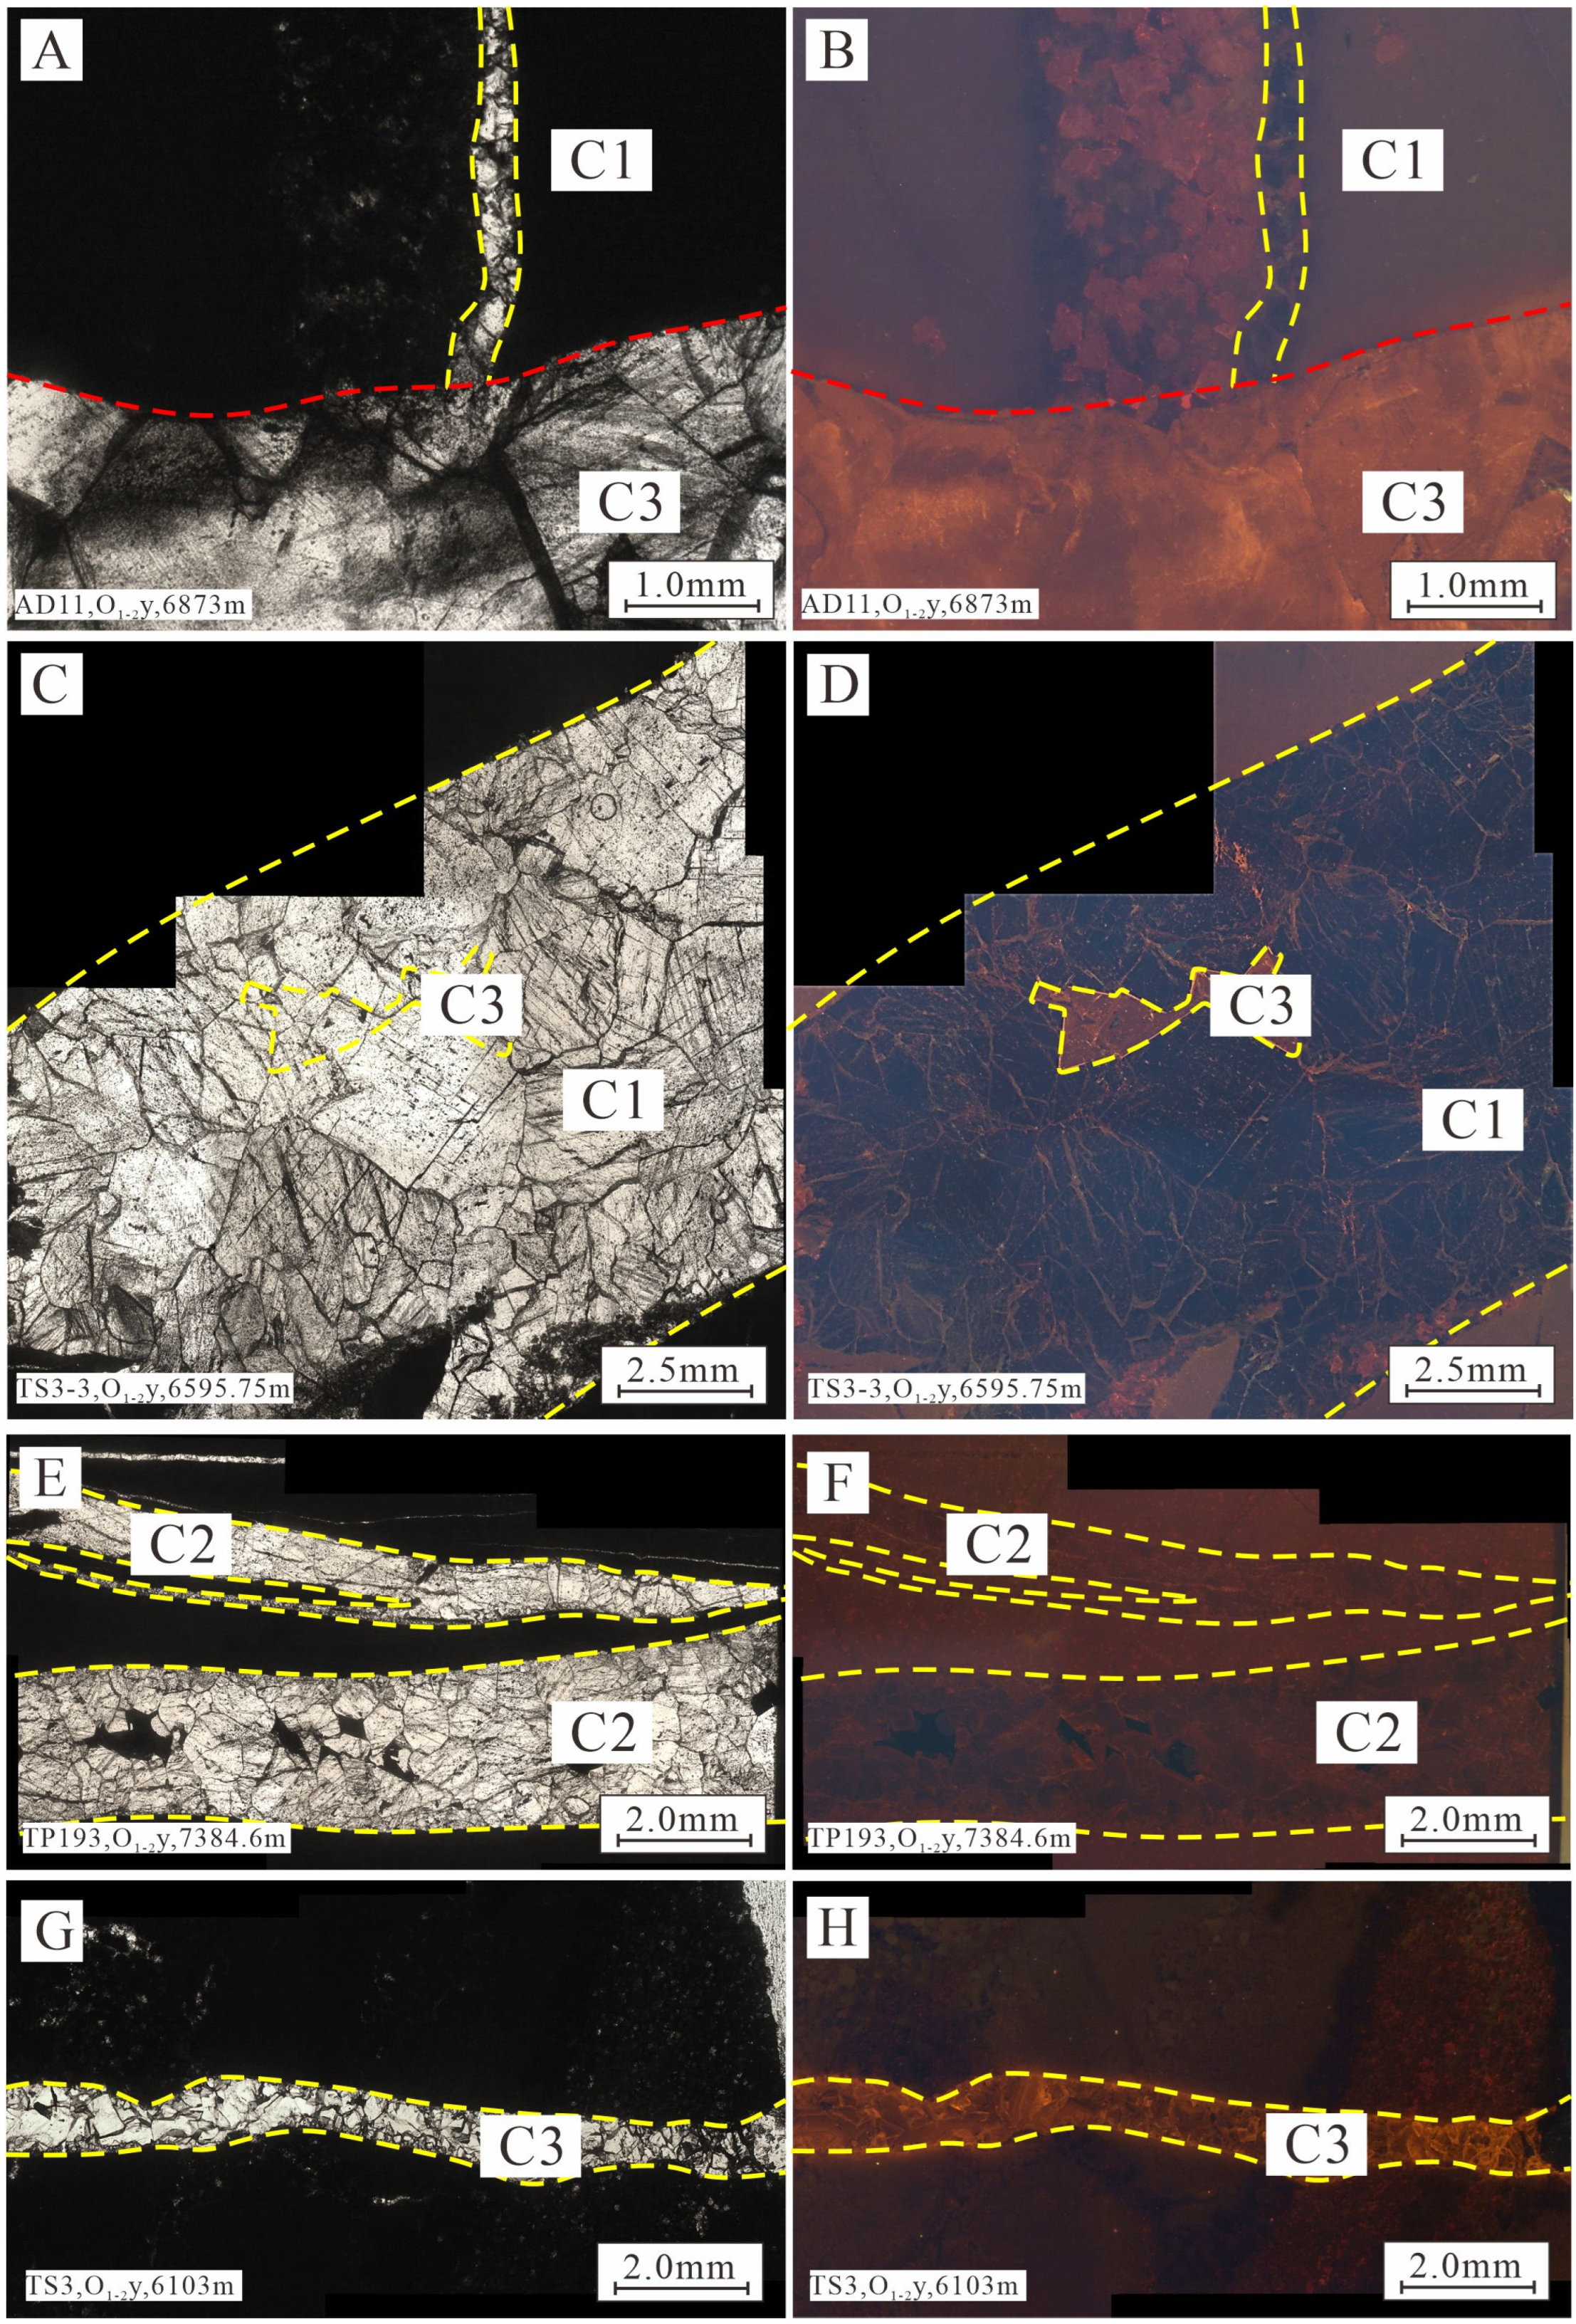
The morphology of calcite veins in the Ordovician carbonate reservoirs of the Tahe area are mainly near-vertical and cave-filled. Cathodoluminescence and transmitted-light observations were employed to determine the developmental stages of the calcite veins in the study area [31]. Petrographic observations and cathodoluminescence experiments demonstrate that the Ordovician carbonate reservoirs contain three stages of calcite veins. The cathodoluminescence characteristics of the three stages of calcite veins are as follows: The C1 calcite veins show no cathodoluminescence, the C2 calcite veins exhibit dark brown cathodoluminescence, and the C3 calcite veins display orange-red cathodoluminescence (Figure 2). Based on the cutting relationships of the veins, it is considered that the formation time of the C3 calcite vein is later than that of the C1 calcite vein. The contact relationship between the C2 calcite vein and the other two veins stages was not observed, so the formation period of the C2 calcite vein needs to be determined using the calcite U–Pb isotope dating.
Laser in situ U–Pb isotope dating is important because it can provide critical information about the calcite veins [32,33,34,35]. Laser in situ U–Pb isotope dating was conducted on three stages of calcite veins in Ordovician carbonate reservoirs of the Tahe area, and the results are shown in Figure 3. The in situ U–Pb isotope dating results indicate that the absolute formation ages are 458.6 ± 8.8 Ma for the C1 calcite vein, 320.4 ± 9.4 Ma for the C2 calcite vein, and 220.5 ± 9.1 Ma for the C3 calcite vein. The absolute ages are all within 3% of each other, which is within the acceptable margin of error. Petrography observations, cathodoluminescence data, and U–Pb isotope ages indicate that the C2 calcite vein formed between the C1 and C3 calcite veins.

4.2. Fluid Inclusion Petrography and Fluorescence

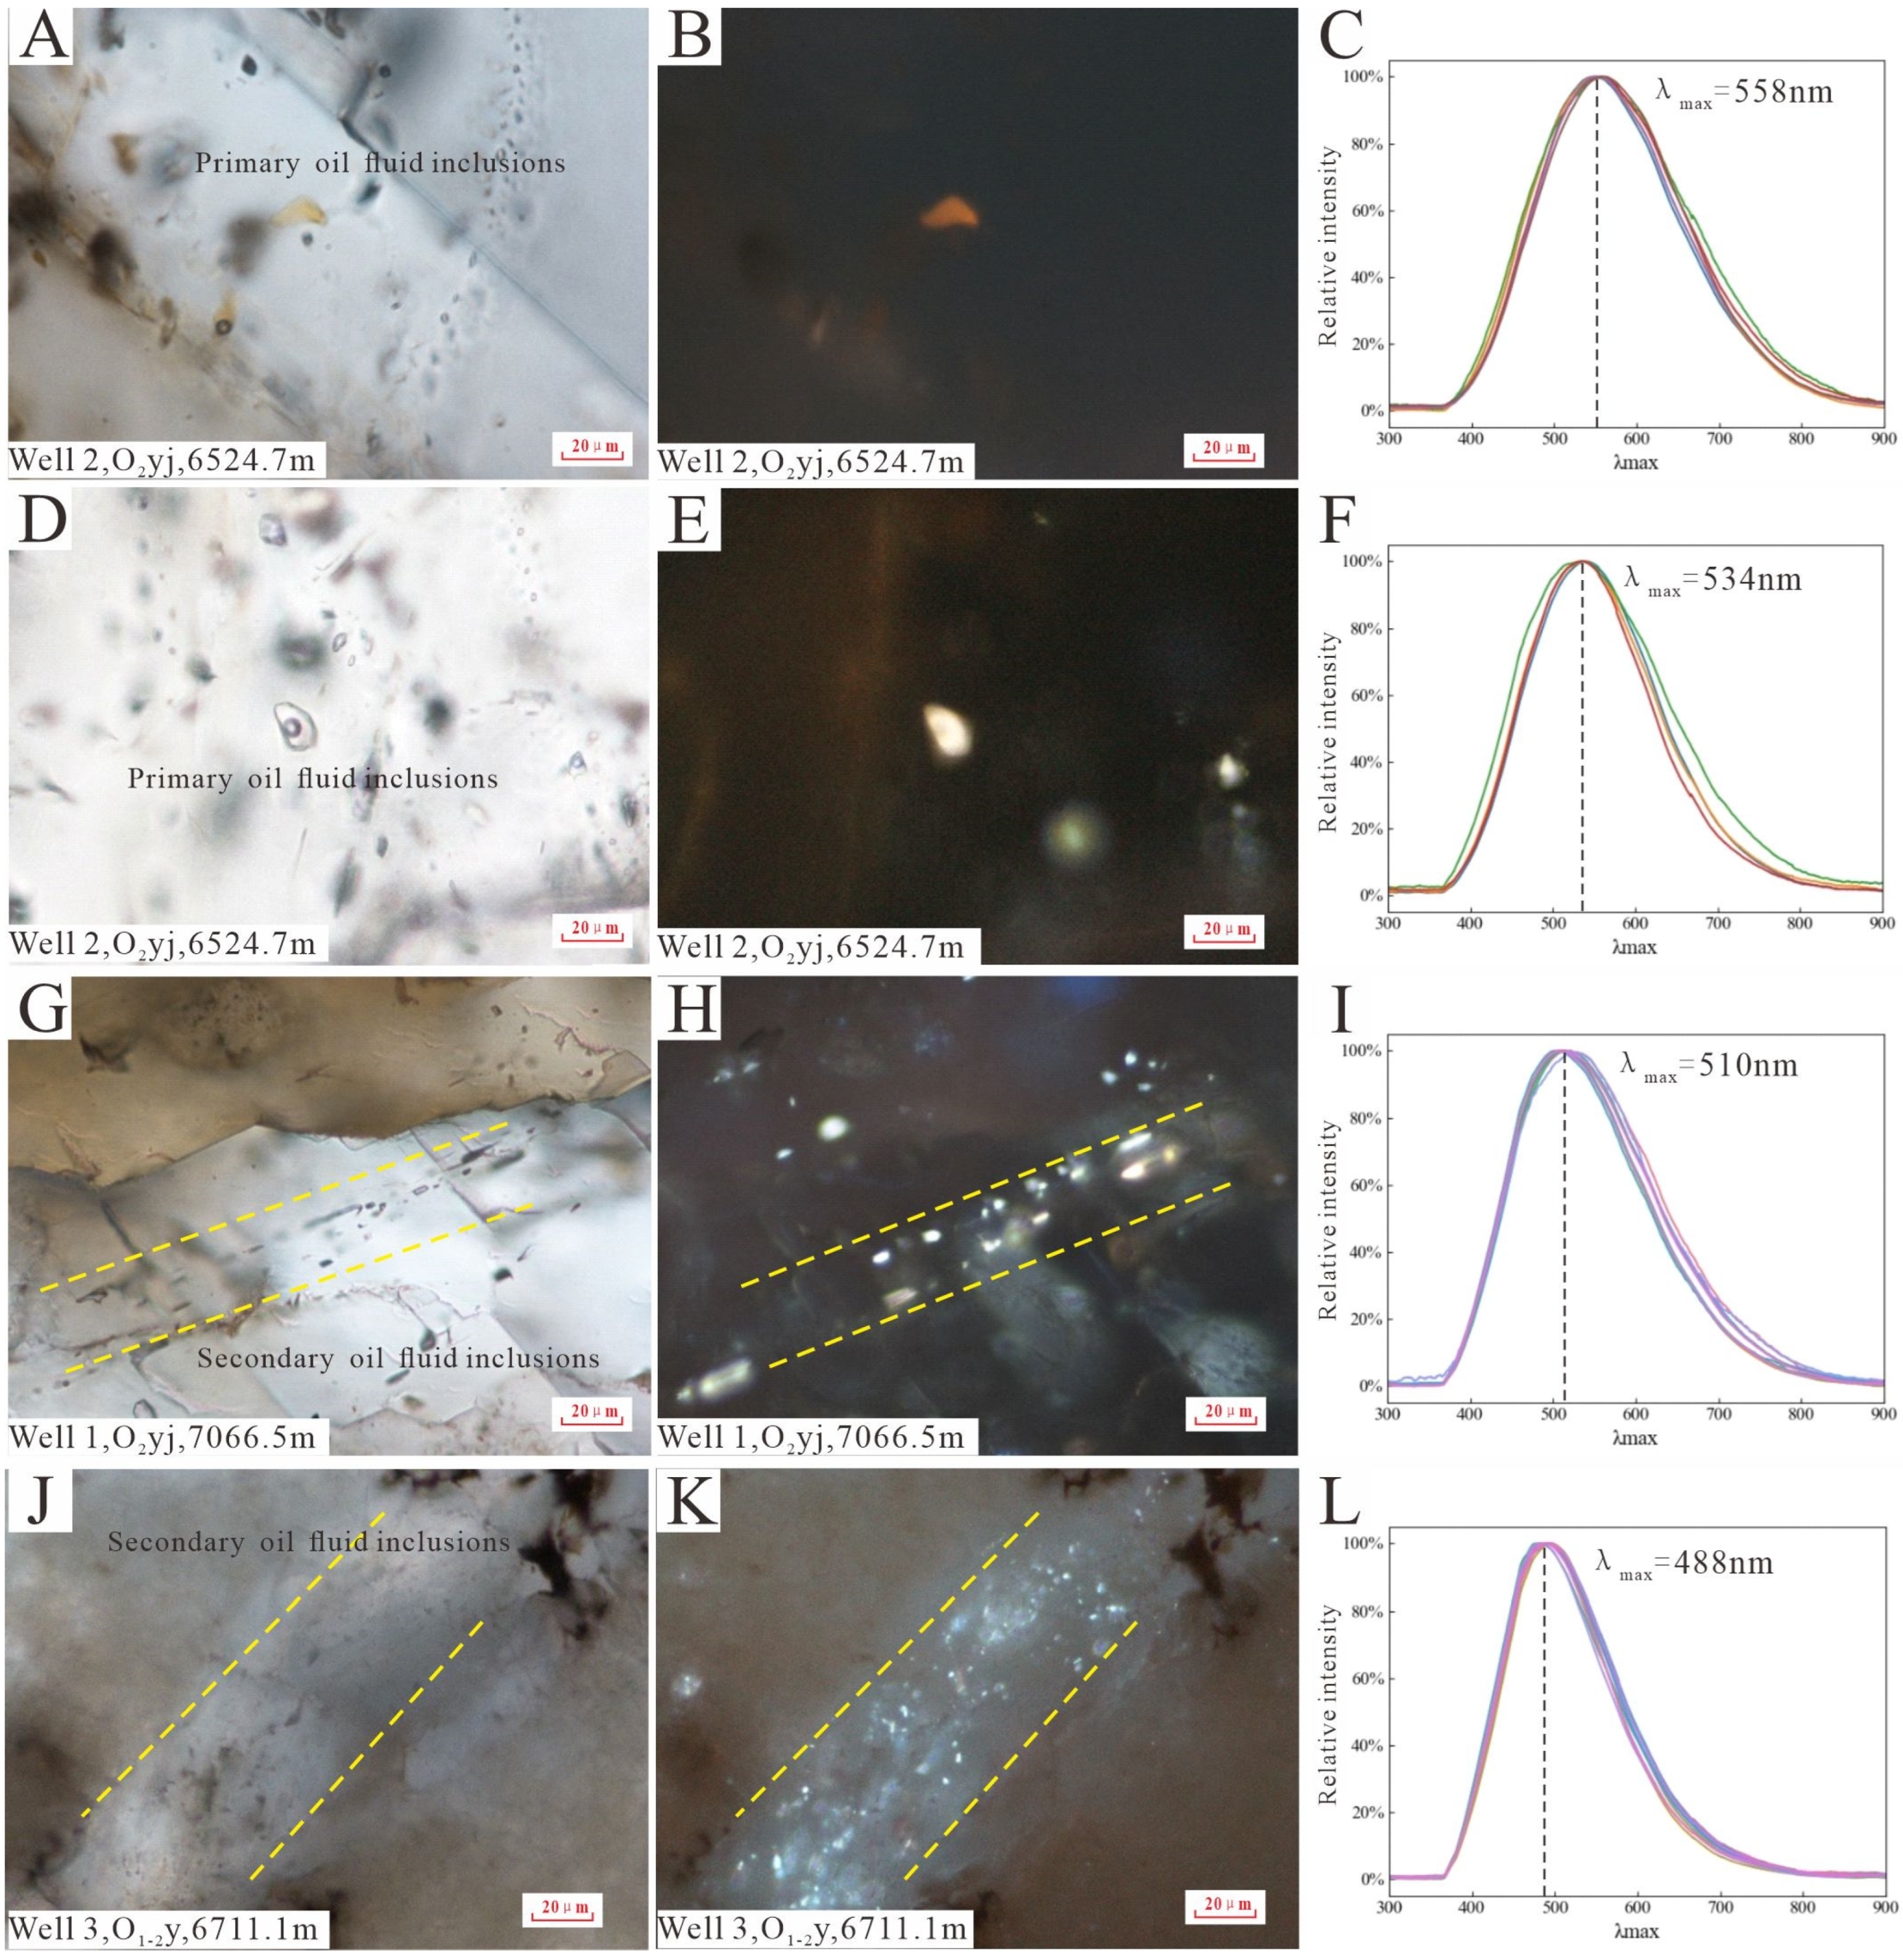
The oil inclusions in the calcite veins of the Ordovician carbonate reservoirs in the Tahe area are well-developed, exhibiting elliptical, elongated, and irregular shapes. Under transmitted light, the oil inclusions appear colorless, transparent, or brown. Most are gas–liquid two-phase inclusions, with a small amount of single-phase oil inclusions. The maximum diameter is approximately 20 μm. Microscopic fluorescence and fluorescence spectroscopy reveal four fluorescent colors in the oil inclusions of the calcite veins: golden, dark yellow, yellow-white, and blue (Figure 4).
The microscopic characteristics of the four types of oil inclusions are as follows. (1) golden fluorescence oil inclusions: These are primarily found in calcite particles in an isolated and sporadically distribution (Figure 4A,B). The inclusions are approximately 15μm in size, mostly elliptical or sub-circular, with a maximum primary peak wavelength (λmax) of about 558 nm (Figure 4C). (2) Dark yellow fluorescence oil inclusions: These are primarily found in calcite particles in an isolated distribution (Figure 4D,E). The inclusions range from 5 μm to15 μm in size, mostly elliptical or irregular, with a maximum primary peak wavelength (λmax) of about 541 nm (Figure 4F). (3) Yellow-white fluorescence oil inclusions: These are mostly found in calcite particles in an isolated distribution. Some are secondary oil inclusions and are found in calcite cracks with a bead-like distribution (Figure 4G,H). The inclusions range from 3 μm to10 μm in size, mostly elliptical and in strips, with a maximum primary peak wavelength (λmax) of about 521 nm (Figure 4I). (4) Blue fluorescence oil inclusions: These are primarily found in calcite cracks and across mineral boundaries in a bead-like distribution (Figure 4J,K). The inclusions are about 2–5 μm in size, mostly elliptical and sub-circular, with a maximum primary peak wavelength (λmax) of about 488 nm (Figure 4L).

4.3. Oil Inclusion Microthermometry

The most common method for determining the timing of hydrocarbon charging is to use the homogenization temperature of brine inclusions, which are contemporaneous with hydrocarbon inclusions, in conjunction with the reservoir burial and thermal evolution histories. It is generally accepted that the homogenization temperature of brine inclusions, captured simultaneously with hydrocarbon inclusions, represents the temperature at the time of hydrocarbon charging. Therefore, the homogenization temperature of brine inclusions serves as an important basis for determining the stage and timing of hydrocarbon accumulation [36]. The homogenization temperature of fluid inclusions after stretching, leakage, and re-equilibration will rise, resulting in a wide variation in the mean temperature of the brine inclusion over the same period, as well as a significant discrepancy in the determination of the timing of oil and gas charging. Therefore, it is more accurate to use the minimum homogenization temperature of the associated brine inclusions, combined with the burial history, to determine the hydrocarbon charging time [22].
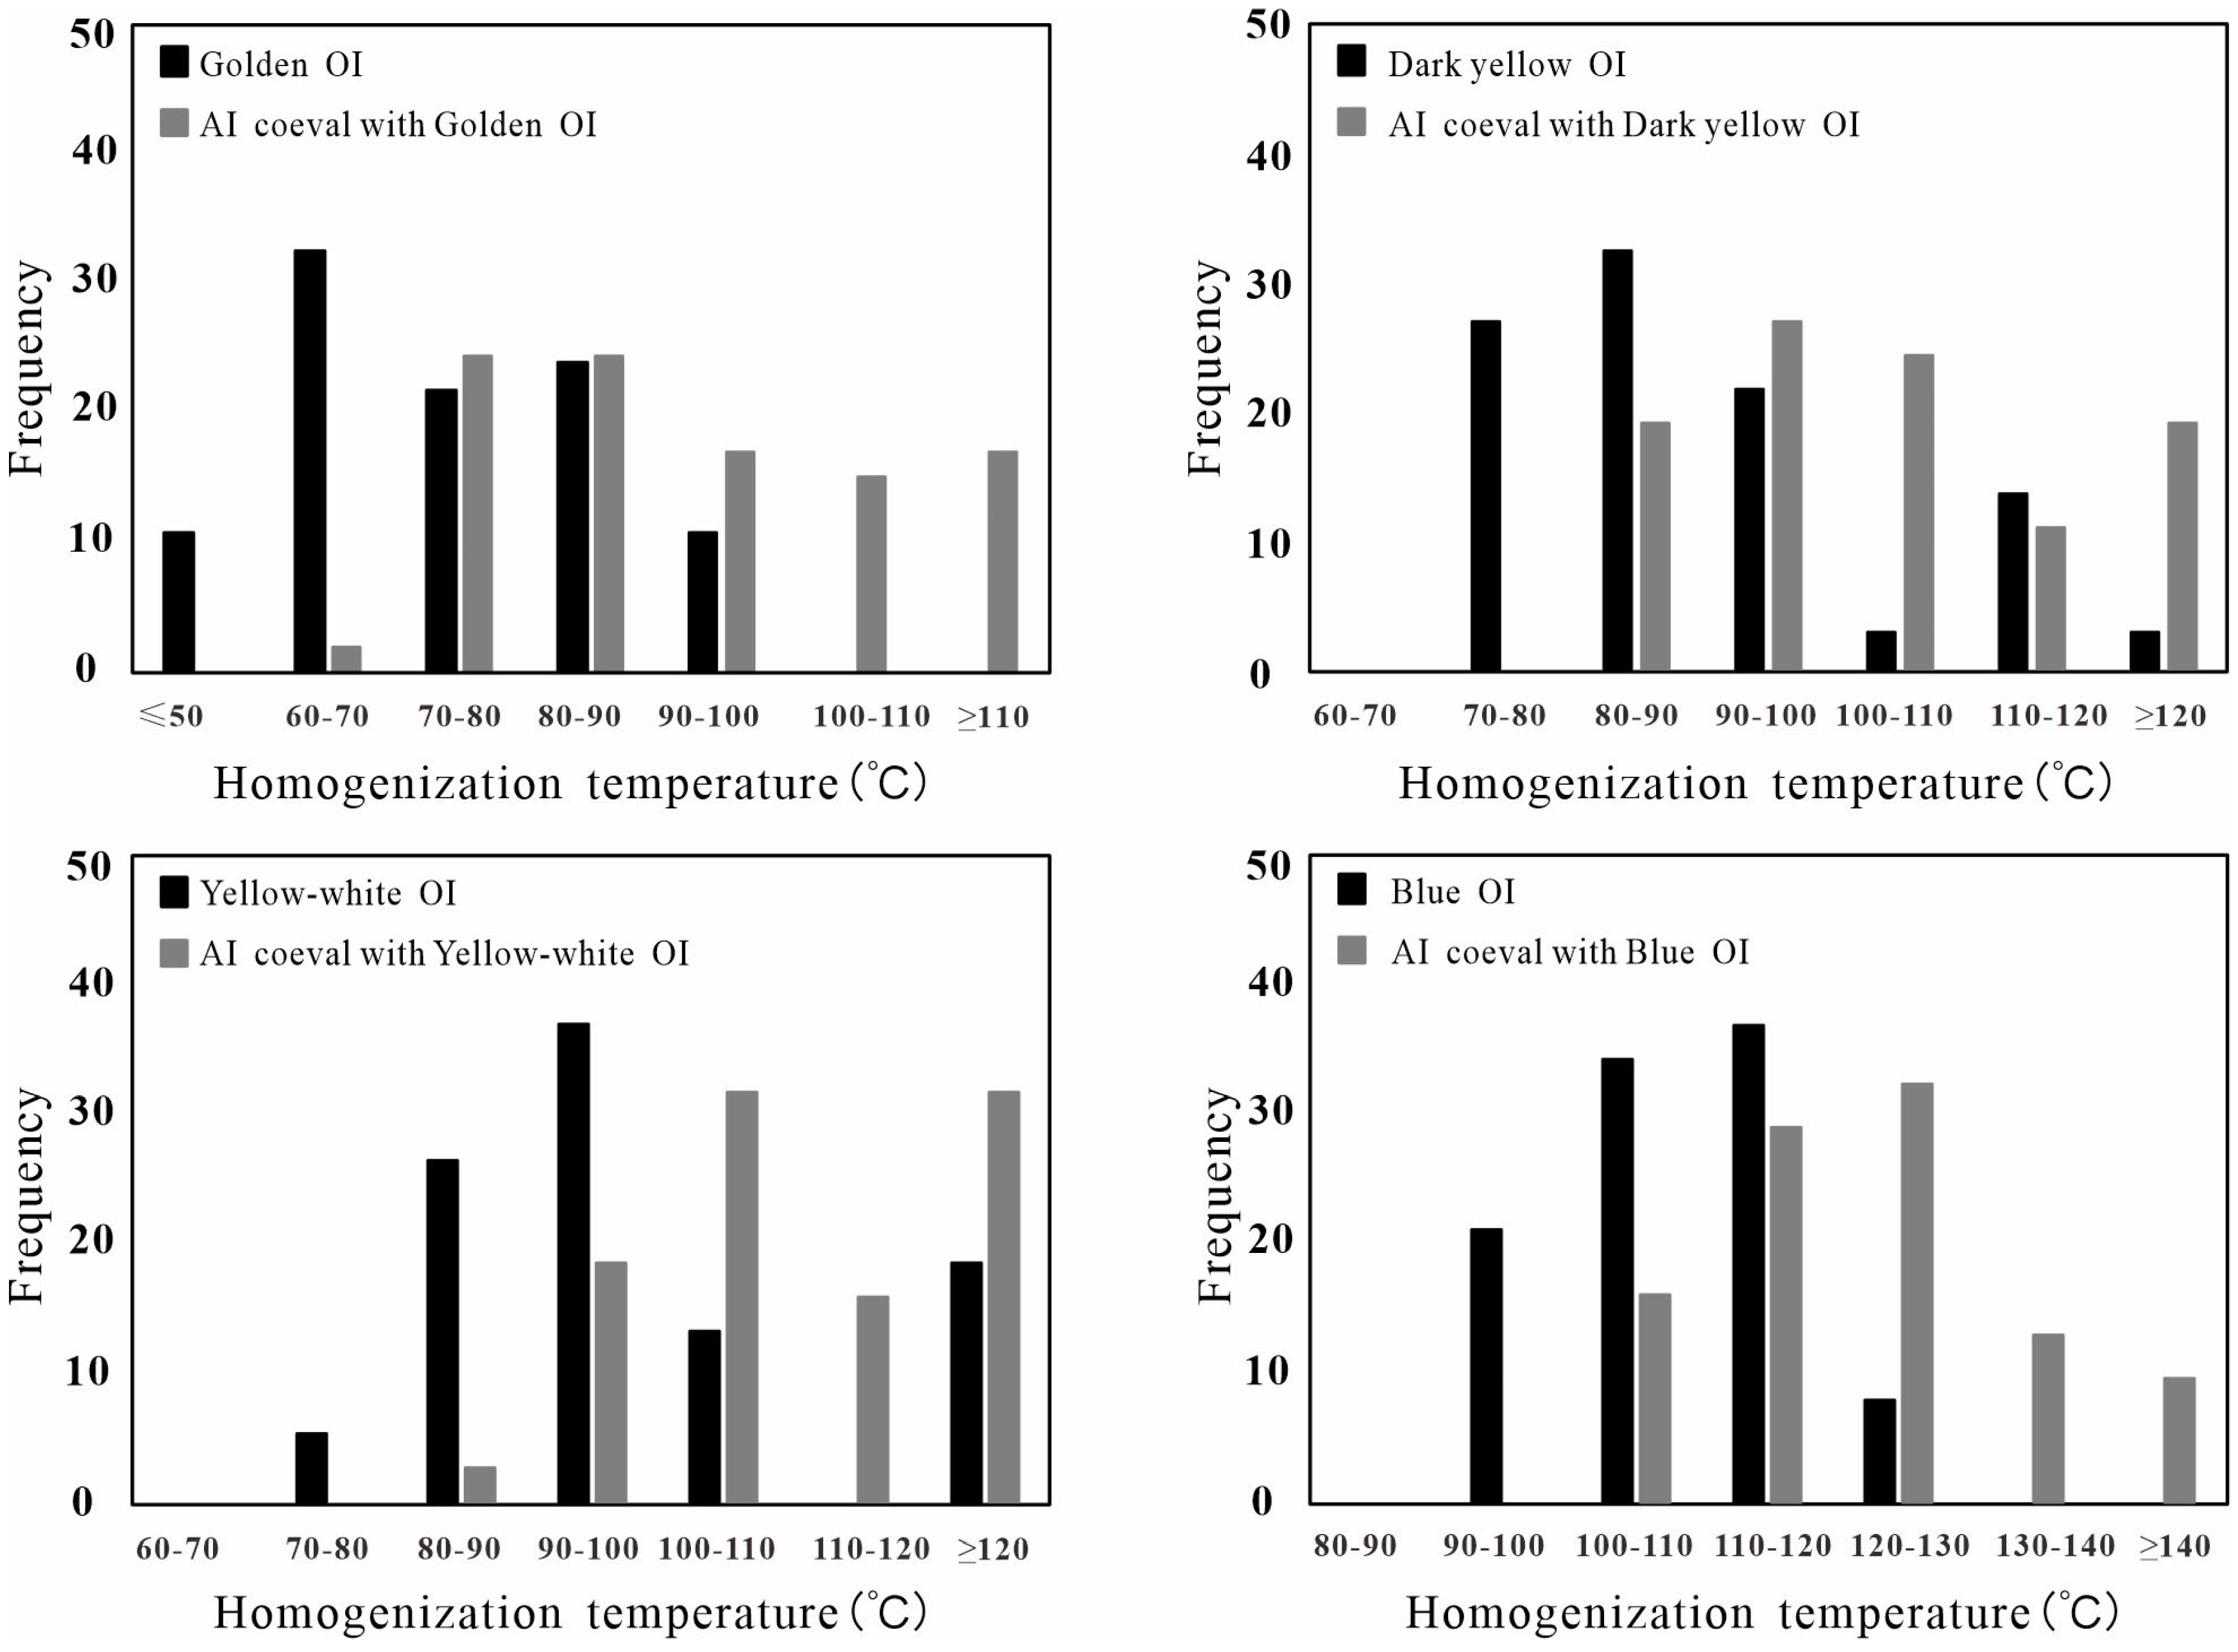
The homogenization temperatures of the four stages of oil inclusions and the associated brine inclusions in the Ordovician carbonate reservoirs were measured, and the distribution of the test is shown in Figure 5.
The results of the homogenization temperature test are as follows. (1) Golden fluorescence oil inclusions: the homogenization temperature primarily ranges from 54.5–96.7 °C, with the minimum homogenization temperature of brine inclusions associated with oil inclusions being 67.8 °C. (2) Dark yellow fluorescence oil inclusions: the homogenization temperature primarily ranges from 70.2–126.1 °C, with the minimum homogenization temperature of the brine inclusions associated with oil inclusions being 80.7 °C. (3) Yellow-white fluorescence oil inclusions: the homogenization temperature primarily ranges from 74.5–138 °C, with the minimum homogenization temperature of the brine inclusions associated with oil inclusions being 89.2 °C. (4) Blue fluorescence oil inclusions: the homogenization temperature primarily ranges from 93.8–129.5 °C, with the minimum homogenization temperature of the brine inclusions associated with oil inclusions being 108.3 °C.

4.4. Gas–Liquid Ratio of Oil Inclusion

In this study, confocal laser scanning microscopy was employed to analyze the four stages of oil inclusions. The confocal laser scanning microscopy slice images are shown in Figure 6.
The small size of the blue fluorescence oil inclusions makes measuring the gas–liquid ratio challenging, resulting in fewer measurements. Calculations indicate that the gas–liquid ratios of the four stages of oil inclusions in the Ordovician carbonate reservoirs of the Tahe area are as follows. (1) Golden fluorescence oil inclusions: the gas–liquid ratios are primarily concentrated within a range of 3.43% to 6.4%. (2) Dark yellow fluorescence oil inclusions: the gas–liquid ratios are primarily concentrated within a range of 2.5% to 5.9%. (3) Yellow-white fluorescence oil inclusions: the gas–liquid ratios are primarily concentrated within a range of 2.3% to 5.62%. (4) Blue fluorescence oil inclusions: the gas–liquid ratios are primarily concentrated within a range of 1.39% to 3.11% (Figure 7).

4.5. Paleo-Pressure Recovery

Lu et al. summarized the various methods for recovering paleo-pressure using fluid inclusions, including the isochoric graphical method, the density and isochoric formula, and PVT simulation [37]. In this study, the paleo-pressure during the hydrocarbon accumulation period is calculated using the trapping pressure prediction models developed by Ping et al. The calculations indicate significant overpressure in the Ordovician carbonate reservoirs of the Tahe area during the hydrocarbon accumulation period. Microscopic observation revealed the presence of single-phase golden oil inclusions, which provide evidence that the reservoir was in an overpressure state during hydrocarbon charging.
Based on the calculations, the trapping pressure distribution ranges for the four-stage oil inclusions are as follows. (1) Golden fluorescence oil inclusions: 18.82 MPa to 36.17 MPa; (2) dark yellow fluorescence oil inclusions: 27.52 MPa to 42.39 MPa; (3) yellow-white fluorescence oil inclusions: 35.00 MPa to 61.81 MPa; (4) blue fluorescence oil inclusions: 53.53 MPa to 74.25 MPa. Additionally, the trapping pressure shows a gradually increasing trend with the rise in homogenization temperature, indicating a clear relationship between temperature and pressure (Figure 8).

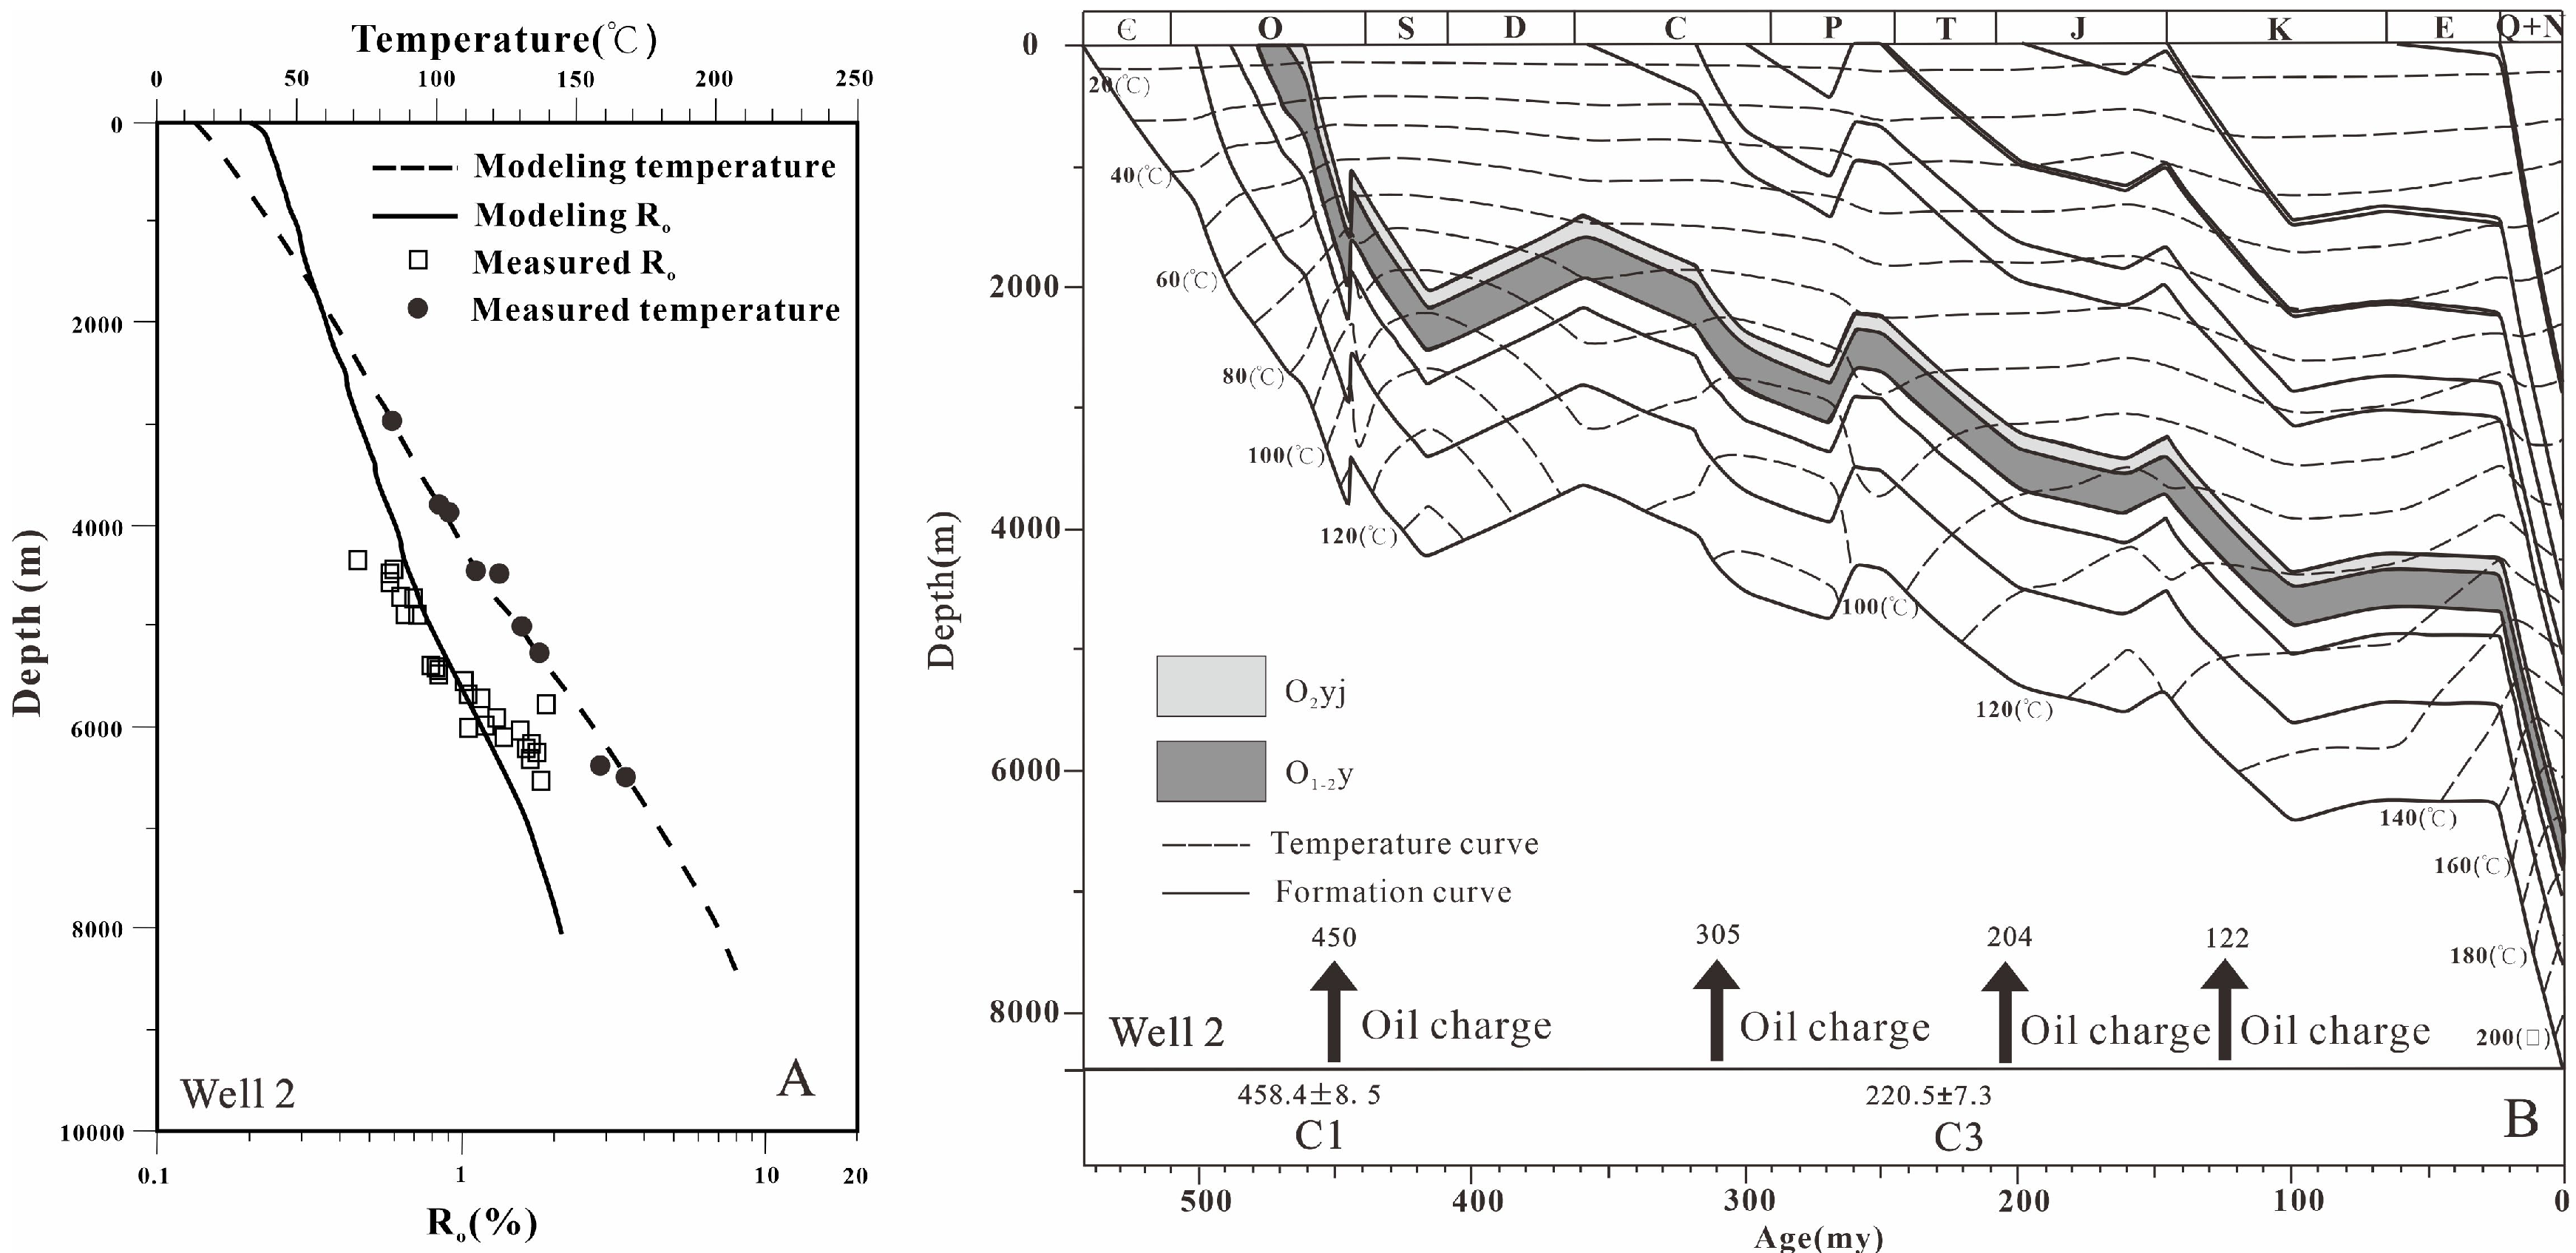
4.6. Burial and Thermal History Modeling

The burial and thermal history modeling of Well 2 were simulated using BasinMod software (Figure 9). An excellent correlation between the observed and calculated Ro values and temperature in Well 2 (Figure 9A) indicates that the model is suitable for the study area. The burial history simulation result shows that the Yingshan Formation (O1–2y) and the Yijianfang Formation (O2yj) experienced multiple tectonic uplifts during the sedimentary period (Figure 9B).
The burial history modeling results for Well 2 indicate that the Tahe area experienced multiple episodes of uplift during the geologic history period, including a rapid uplift event between 445 and 443 Ma; a prolonged uplift from the late Caledonian to the early Hercynian (415–359 Ma); another uplift during the late Hercynian (268–260 Ma); a minor uplift during the Yanshanian (159–145 Ma); and a long-lasting uplift from the late Yanshanian to the Himalayan periods (98–23 Ma).

5. Discussion

5.1. Hydrocarbon Accumulation Time

It is generally believed that when primary hydrocarbon inclusions form in calcite veins, their formation time is consistent with the formation time of the calcite veins. Therefore, the U–Pb isotope ages of the calcite veins constrain the timing of hydrocarbon accumulation and eliminate the variability of the hydrocarbon accumulation time [38]. The calcite veins contain multi-stage oil inclusions, but the sequence of these inclusions cannot be accurately determined based solely on their occurrence. Therefore, it is essential to analyze the periods of hydrocarbon charging in combination with the formation periods of the calcite veins and the relationship between the oil inclusions and the calcite veins. Cathodoluminescence and petrography observation of fluid inclusions reveal that primary oil inclusions with golden, dark yellow, and yellow-white fluorescence appear in the C1, C2, and C3 calcite veins, respectively. This indicates that the three-stage primary oil inclusions are contemporaneous with the formation of the three periods of calcite veins. Additionally, the blue secondary oil inclusions are present in all three calcite veins stages, indicating that they were trapped later than the time of formation of the calcite veins.
By integrating the inclusion of petrography, fluorescence spectroscopy, microthermometry, cathodoluminescence, and U–Pb isotope dating, the minimum homogenization temperatures of the brine inclusions associated with the four stages of oil inclusions were plotted on the burial history modeling to determine the hydrocarbon charging time of the Ordovician carbonate reservoirs. The results show that the first-stage crude oil charging occurred during the Caledonian period (459–450 Ma); the second-stage crude oil charging occurred in the Hercynian period (320–311 Ma); the third-stage crude oil charging took place in the late Indosinian period (227–213 Ma); and the fourth-stage crude oil charging occurred during the Yanshanian period (134–117 Ma).

5.2. Overpressure Evolution in Carbonate Reservoirs

Overpressure plays a crucial role in hydrocarbon accumulation [39]. Therefore, it is important to analyze the fluid pressure evolution characteristics in reservoirs within sedimentary basins to guide hydrocarbon geological exploration [18]. The calculations show that the overpressure of the golden fluorescence oil inclusions ranges from 2.6 to 16.08 MPa, with pressure coefficients from 1.14 to 1.8, suggesting that strong overpressure was evident in the reservoir during the initial oil charging. The overpressure of the dark yellow fluorescence oil inclusions ranges from 2.6 to 16.08 MPa, with pressure coefficients ranging from 1.32 to 1.93, reaching the maximum pressure coefficient. The overpressure of the yellow-white fluorescence oil inclusions ranges from 8.45 to 27 MPa, with pressure coefficients from 1.23 to 1.88. The overpressure of the blue fluorescence oil inclusions ranges from 16.18 to 34.03 MPa, with pressure coefficients ranging from 1.42 to 1.89. The Ordovician carbonate reservoirs in the Tahe area experienced significant overpressure during the hydrocarbon charging period. Therefore, the overpressure and pressure coefficient evolution diagrams were constructed using the current formation pressure as a constraint (Figure 10).
The evolution of overpressure and the pressure coefficient indicates that the Ordovician carbonate reservoirs in the Tahe area have undergone a process of “four increases and four decreases”. The analysis of overpressure evolution is provided below.
During the Caledonian period (459–450 Ma), the first stage of crude oil began to charge, and the reservoir pressure increased rapidly, with the maximum pressure coefficient reaching up to 1.8. However, due to the continuous tectonic uplift from the late Caledonian to the early Hercynian periods, the Ordovician carbonate rocks were exposed to the surface and underwent karstification, resulting in the destruction of the early oil reservoirs and a significant decrease in the reservoir pressure [40].
During the Hercynian period (320–311 Ma), the source rocks reached a new peak of oil generation, and the strike-slip faults provided vertical migration pathways for hydrocarbon, leading to an increase in reservoir pressure, with the maximum pressure coefficient reaching up to 1.93. However, during the late Hercynian period, the tectonic movements caused adjustments and destruction to the oil reservoirs, leading to a gradual reduction in pressure.
During the late Indosinian period (227–213 Ma), the third stage of oil charging occurred, and the reservoir pressure increased again, with the maximum pressure coefficient reaching up to 1.88. Due to the greater burial depth of the Ordovician karst reservoirs, the paleo-oil reservoirs were adjusted during this period, resulting in a slight decrease in pressure.
During the Yanshanian period (134–117 Ma), the reservoir pressure increased due to hydrocarbon charging in the study area, with the maximum pressure coefficient reaching up to 1.89. During the late Yanshanian to early Himalayan periods, deep faults and a large number of positive faults formed in the Tahe area. As a result, the oil reservoirs were adjusted, resulting in lower reservoir pressures. Due to the lack of hydrocarbon replenishment in the reservoir, the pressure has gradually decreased over time to the current pressure status of weak overpressure to normal pressure [8].
Pressure evolution in carbonate reservoirs is influenced by factors such as hydrocarbon charging, tectonic movement, complex diagenesis, and lithology. Previous research in the study area has indicated that hydrocarbon charging and tectonic compression are the primary causes of overpressure formation in Ordovician carbonate reservoirs. Based on the analysis of reservoir overpressure evolution, it is concluded that the hydrocarbon accumulation is closely related to the overpressure formation in the Tahe area, as the reservoir pressure increased significantly during oil charging. The Tahe area has undergone multiple phases of tectonic uplift, including the Caledonian, Hercynian, Yanshanian, and Himalayan periods, which led to the destruction and adjustment of the Ordovician oil reservoirs, ultimately resulting in a decrease in reservoir pressure.

6. Conclusions

(1) Multiple experiments on calcite veins and fluid inclusions identified four types of fluorescence oil inclusions in the study area, suggesting four stages of hydrocarbon charging. The timing of hydrocarbon accumulation was determined by combining the U–Pb isotope dating of calcite veins with the age inferred from the point projection of the minimum homogenization temperature of the burial history model. The results show that the Ordovician carbonate reservoir underwent four stages of oil charging in the Tahe area, in the following order: Caledonian (459–450 Ma), Hercynian (320–311 Ma), late Indosinian (227–213 Ma), and Yanshanian (134–117 Ma).
(2) The trapping pressure demonstrates a progressive increase with rising homogenization temperatures. The Ordovician carbonate reservoirs in the Tahe area experienced significant overpressure during the oil charging period, and the reservoir overpressure evolution exhibits a trend of “four increases and four decreases”. This trend suggests that the hydrocarbon accumulation was the primary cause of the reservoir overpressure. However, the multiple uplifts in the study area caused destruction or adjustment to the oil reservoirs, leading to a reduction in reservoir pressure. As a result, the current reservoir pressure has decreased to a level of normal pressure to weak overpressure.

Author Contributions

Writing—original draft preparation, X.J.; Conceptualization and Methodology, X.J. and X.G.; Software, Y.Z. and X.Z.; Data curation, J.C. and H.X.; Validation, T.L. All authors have read and agreed to the published version of the manuscript.

Funding

This work was funded by the National Natural Science Foundation of China (no. 92255302).

Data Availability Statement

The original contributions presented in this study are included in the article. Further inquiries can be directed to the corresponding author.

Conflicts of Interest

The authors declare no conflict of interest.

References

  1. Qiu, N.S.; Liu, Y.F.; Liu, W.; Jia, J.K. Quantitative reconstruction of formation paleo-pressure in sedimentary basins and case studies. Sci. Sin. Terrae 2020, 50, 793–806. [Google Scholar]
  2. Han, P.Y.; Ding, W.L.; Yang, D.B.; Deng, G.X.; Wang, Z.; Ma, H.L.; Lv, J.; Geng, T. Characteristics and main controlling factors of fracture development in the Ordovician carbonate reservoir, Tahe Oilfield. Earth Sci. Front. 2024, 31, 209–226. [Google Scholar]
  3. Li, Y.; Jin, Q.; Zhong, J.H.; Zhou, S.Z. Karst zonings and fracture-cave structure characteristics of Ordovician reservoirs in Tahe Oilfield, Tarim Basin. Acta Pet. Sin. 2016, 37, 289–298. [Google Scholar]
  4. Yue, Y.; Tian, J.C.; Huang, C.Y. Formation Mechanism of the Paleocene Basal Conglomerate, Southwest Tarim Basin. J. Earth Sci. 2024, 35, 1513–1526. [Google Scholar] [CrossRef]
  5. Chen, H.H.; Li, C.Q.; Zhang, X.M.; Chen, H.C.; Lin, Z.M. Determining the reservoir formation stages and main reservoir formation period of the Tahe Oilfield using fluid inclusions. Earth Sci. Front. 2003, 10, 190. [Google Scholar]
  6. Shi, W.J.; Jiang, H.; Xi, B.B. Application of the PVTX simulation of reservoir fluid inclusions to estimate petroleum charge stages: A case study in the Tuoputai area of Tarim Basin. Geol. J. China Univ. 2012, 18, 125–132. [Google Scholar]
  7. Chen, H.H.; Wu, Y.; Feng, Y.; Lu, Z.Y.; Hu, S.Z.; Yun, L.; Qi, L.X. Timing and chronology of hydrocarbon charging in the Ordovician of the Tahe Oilfield, Tarim Basin, NW China. Oil Gas Geol. 2014, 35, 806–819. [Google Scholar]
  8. Zhao, Y.Q.; Yun, L.; Wang, B.; Geng, F.; Li, H.Y.; Gu, Y.; Liu, Y.L. Main constraints and dynamic process of Ordovician hydrocarbon accumulation, central and western Tahe oil field, Tarim Basin. Pet. Exp. Geol. 2021, 43, 758–766. [Google Scholar]
  9. Chen, J.X.; Wang, B.; Guo, X.W.; Cao, Z.C.; Liu, Y.L.; Geng, F.; Zhang, X.Y.; Xu, H.; Zhao, J.X. Application of laser in-situ U-Pb dating of calcite to determination of the absolute time of hydrocarbon accumulation in polycyclic superimposed basins: A case study on Tahe Oilfield, Tarim Basin. Oil Gas Geol. 2021, 42, 1365–1375. [Google Scholar]
  10. Aplin, C.; Macleod, L.S.; Larter, S.R.; Pedersen, K.S.; Sorensen, H.; Booth, T. Combined use of Confocal Laser Microscopy and PVT simulation for estimating the composition and physical properties of petroleum in fluid inclusions. Mar. Pet. Geol. 1999, 16, 97–110. [Google Scholar] [CrossRef]
  11. Ping, H.W.; Chen, H.H.; Song, G.Q.; Thiéry, R. Individual oil inclusion composition prediction and its application in oil and gas accumulation studies. Earth Sci. 2012, 37, 815–824. [Google Scholar]
  12. Ping, H.W.; Thiéry, R.; Chen, H.H.; Liu, H.L. New methods to reconstruct paleo-oil and gas compositions and P-T trapping conditions of hydrocarbon fluid inclusions in sedimentary basins. Mar. Pet. Geol. 2023, 155, 106403. [Google Scholar] [CrossRef]
  13. Chen, X.; Liu, W.H.; Bao, D.; Zhang, L.P.; Chen, L.X.; Yang, M.; Zhang, J.; Li, Y.J.; Li, G.Y.; Jia, Y.F. Ordovician Palaeokarst caves in the Tahe Oilfield: Burial age of cave fills and its implications for hydrocarbon reservoirs. Earth Sci. Front. 2023, 30, 65–75. [Google Scholar]
  14. Lei, C.; Chen, H.H.; Su, A.; Han, S.M. Characteristics and preservation mechanism of the Ordovician deep burial karst caves in Tahe Area. Lithol. Reserv. 2014, 26, 27–31. [Google Scholar]
  15. Lu, X.B.; Cai, Z.Y. A study of the paleo-cavern system in fractured-vuggy carbonate reservoirs and oil/gas development-taking the reservoirs in Tahe Oilfield as an example. Oil Gas Geol. 2010, 31, 22–27. [Google Scholar]
  16. Qi, L.X.; Yun, L. Development characteristics and main controlling factors of the Ordovician carbonate karst in Tahe Oilfield. Oil Gas Geol. 2010, 31, 1–12. [Google Scholar]
  17. Zhang, Y.; Zhao, L.; Li, C.H.; Zhang, X.Z. Research Progress of paleokarst oil and gas reservoirs. Carsol. Sin. 2022, 41, 808–824. [Google Scholar]
  18. Cao, H.; Gong, J.J.; Wang, G.F. The cause of overpressure and its relationship with reservoir forming. Nat. Gas Geosci. 2006, 17, 422–425. [Google Scholar]
  19. Yang, T.Z.; Liu, C.L.; Tian, J.X.; Li, P.; Ran, Y.; Feng, D.H.; Li, G.X.; Wu, Y.P. Prediction and genesis of formation pressure in Dafengshan uplift, Qaidam Bain. Lithol. Reserv. 2023, 35, 96–107. [Google Scholar]
  20. Zhang, K. The discovery of Tahe Oilfield and its geologic implication. Oil Gas Geol. 1999, 20, 120–124, 132. [Google Scholar]
  21. Zhang, C.J.; Lv, Y.P.; Zhang, Z.Z. Features of middle-lower Ordovician Paleo-karst caves in the western slope area, Tahe oil field, Tarim Basin. Pet. Exp. Geol. 2022, 44, 1008–1017. [Google Scholar]
  22. Xu, H.; Guo, X.W.; Cao, Z.C.; Wang, B.; Liu, Y.L.; Chen, J.X.; Zhang, X.Y.; Luo, T. Application of minimum homogenization temperatures of aqueous inclusions in calcite veins to determine time of hydrocarbon accumulation in Ordovician of the Tahe Oilfield: Evidence from In-Situ calcite U-Pb dating by laser ablation. Earth Sci. 2021, 46, 3535–3548. [Google Scholar]
  23. Yun, L.; Zhai, X.X. Discussion on characteristics of the Cambrian reservoirs and hydrocarbon accumulation in Well Tashen-1, Tarim Basin. Oil Gas Geol. 2008, 29, 726–732. [Google Scholar]
  24. Li, Y.Q.; Sun, J.F.; Wei, H.H.; Song, S.H. Architectural features of fault-controlled karst reservoirs in the Tahe Oilfield. J. Pet. Sci. Eng. 2019, 181, 106208. [Google Scholar] [CrossRef]
  25. Yu, R.L.; Fu, H. Influence of tectonic movement on Ordovician carbonates of Tahe Oilfield. Nat. Gas Explor. Dev. 2006, 29, 1–6. [Google Scholar]
  26. Liu, C.; Chen, S.J.; Zhao, J.L.; Su, Z.; Rong, H. Geochemical Characteristics and Origin of Crude Oil and Natural Gas in the Southern Slope Zone, Kuqa Foreland Basin, NW China. J. Earth Sci. 2022, 33, 820–830. [Google Scholar] [CrossRef]
  27. Zhang, G.Y.; Zhao, W.Z.; Wang, H.J.; Li, H.H.; Liu, L. Multicycle tectonic evolution and composite petroleum systems in the Tarim Basin. Oil Gas Geol. 2007, 28, 653–663. [Google Scholar]
  28. Sun, X.D.; Suo, L.M.; Jiang, H.Q. Application of laser scanning confocal microscopy in petroleum geology. J. Electron. Microsc. 2004, 23, 517–518. [Google Scholar]
  29. Gao, J.H.; Chen, Y.; Xu, X.Y.; Li, P.; Wang, J.; Han, Y. Error correction of vapour/liquid ratio of hydrocarbon inclusions measured by confocal laser scanning microscope. Rock Miner. Anal. 2015, 34, 558–564. [Google Scholar]
  30. Wang, C.W.; Zou, H.Y.; Jiang, L.N.; Kuang, D.Q.; Jiang, L. The method study on the determination of gas and liquid ratio of fluid inclusion using laser confocal scanning microscope. Mod. Sci. Instrum. 2008, 1, 20–22. [Google Scholar]
  31. Liu, J.Q.; Li, Z.; Wang, X.; Jiang, L.; Feng, Y.X.; Wallace, M.W. Tectonic-fluid evolution of an ultra-deep carbonate reservoir in the southern Halahatang Oilfield area, Tarim Basin, NW Chian. Mar. Pet. Geol. 2022, 145, 105870. [Google Scholar] [CrossRef]
  32. Liu, E.T.; Zhao, J.X.; Pan, S.Q.; Yan, D.T.; Wang, H. In-situ U-Pb Dating of Quartz: A Preliminary Study. J. Earth Sci. 2024, 35, 726–728. [Google Scholar] [CrossRef]
  33. Li, H.; Wang, M.; Li, J.Q.; Tong, H.K.; Dong, J.X.; Tian, M.G.; Chen, X.L.; Li, L.G.; Xie, T.; Li, X.; et al. Geochemistry and Zircon U-Pb and Hf Isotopes of Early Devonian Hardawu Granites in the Eastern Segment of the Ultrahigh-Pressure Metamorphic Belt, Northern Qaidam Basin. J. Earth Sci. 2024, 35, 866–877. [Google Scholar] [CrossRef]
  34. Liu, P.W.; Ding, X.Z.; Liu, Y.X.; Zhang, J.B. Late Mesoproterozoic to Early Neoproterozoic Tectonic Evolution of the SW Yangtze Block, South China: Evidence from U-Pb Geochronology and Lu-Hf Isotopes of Detrital Zircons from Sedimentary Rocks. J. Earth Sci. 2024, 35, 817–827. [Google Scholar] [CrossRef]
  35. Cao, R.; Zhao, H.Q.; Lan, Z.W. Calcite U-Pb Geochronology Revealing Late Ediacaran–Early Paleozoic Hydrothermal Alteration in the Stenian-Tonian Carbonate of Northeastern North China Craton. J. Earth Sci. 2023, 34, 1724–1731. [Google Scholar] [CrossRef]
  36. Eadington, P.J.; Hamilton, P.J.; Bai, G.P. Fluid history analysis—A new concept for prospect evaluation. Aust. Pet. Prod. Explor. Assoc. J. 1991, 30, 282–294. [Google Scholar]
  37. Lu, H.Z.; Fan, H.R.; Ni, P.; Ou, G.X.; Shen, K.; Zhang, W.H. Fluid Inclusion; Science Press: Beijing, China, 2004; pp. 1–8. [Google Scholar]
  38. Guo, X.W.; Chen, J.X.; Yuan, S.Q.; He, S.; Zhao, J.X. Constraint of in-situ calcite U-Pb dating by laser ablation on geochronology of hydrocarbon accumulation in petroliferous basins: A case study of Dongying sag in the Bohai Bay Basin. Acta Pet. Sin. 2020, 41, 284–291. [Google Scholar]
  39. Liu, X.Y.; Chen, H.H.; Xiao, X.W.; Zhang, H.G.; Wang, Y.W.; Xu, T.W.; Shang, P.; Kong, L.T. Overpressure Evolution Recorded in Fluid Inclusions in the Dongpu Depression, Bohai Bay Basin, North China. J. Earth Sci. 2022, 33, 916–932. [Google Scholar] [CrossRef]
  40. Shang, P.; Chen, H.H.; Hu, S.Z.; Wang, B.; Cao, Z.C. Geochemical characteristics of crude oil and hydrocarbon accumulation in the Ordovician of Yuqixi area, Tarim Basin. Earth Sci. 2020, 45, 1013–1026. [Google Scholar]
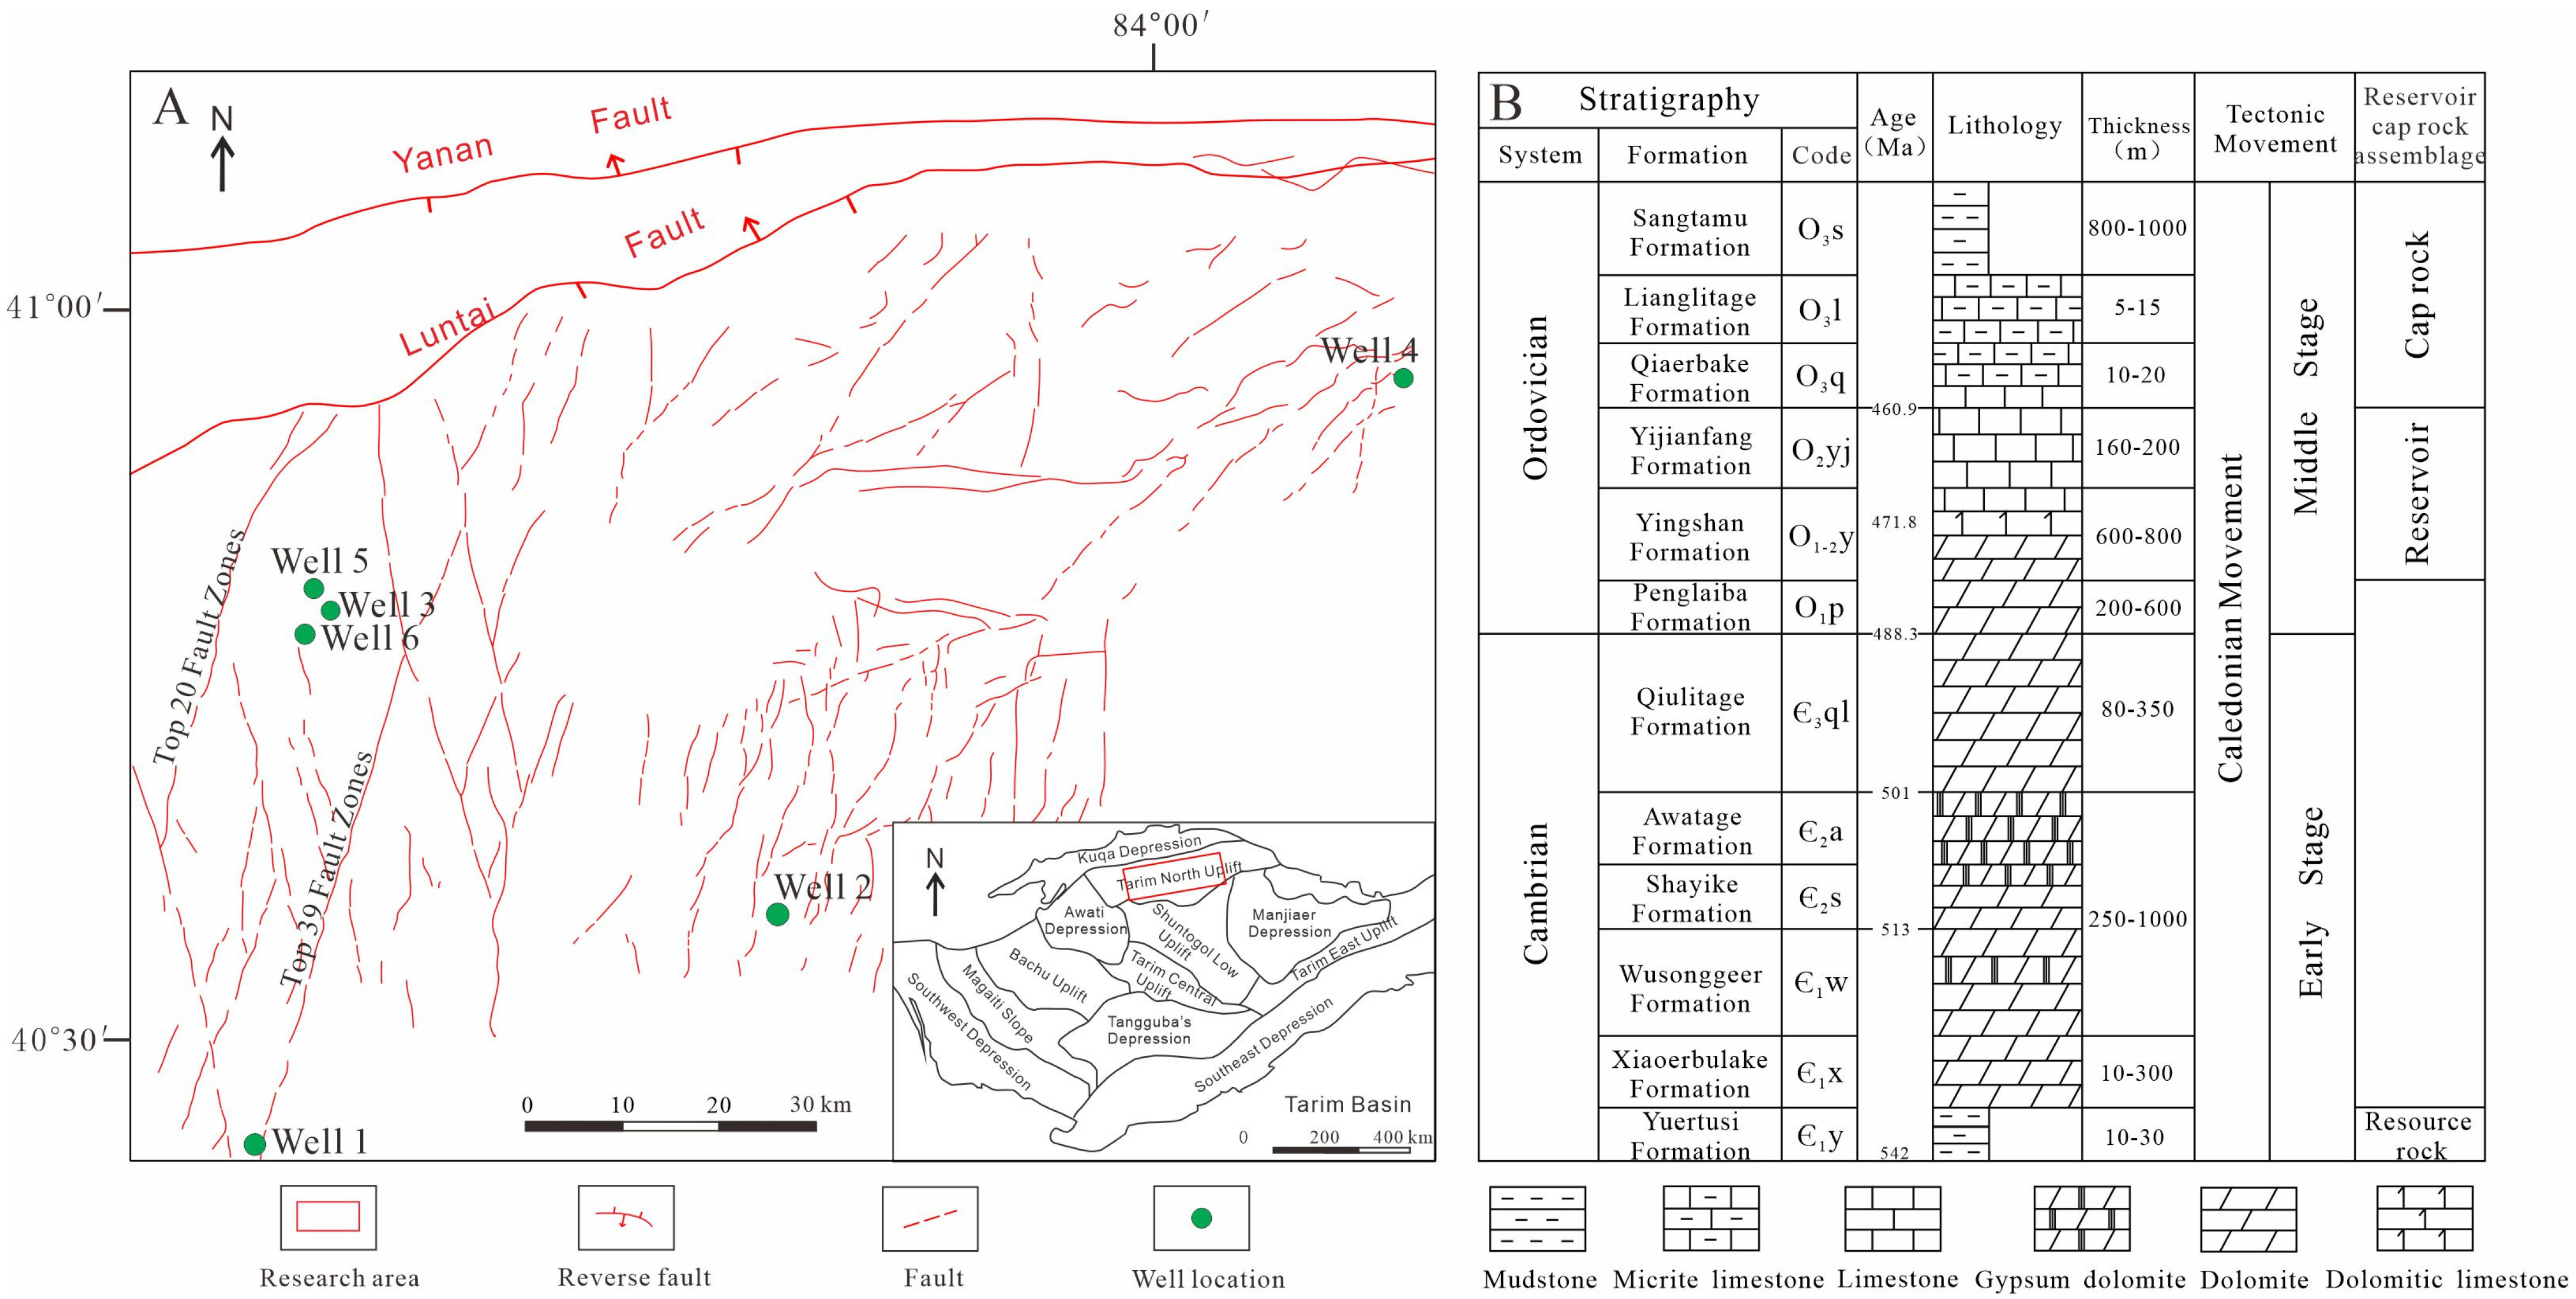
Figure 1. (A) Structure location and location of sampling wells in the Tahe area, Tarim Basin [22]; (B) stratigraphic column of the Tahe area.
Minerals 14 01250 g001
Figure 2. (A,B) Calcite vein images under transmitted light and cathodoluminescence of Well 3; (C,D) calcite vein images under transmitted light and cathodoluminescence of Well 6; (E,F) calcite vein images under transmitted light and cathodoluminescence of Well 1; (G,H) calcite vein images under transmitted light and cathodoluminescence of Well 2.
Minerals 14 01250 g002
Figure 3. In situ U–Pb isotope ages obtained by laser ablation in Ordovician carbonate reservoirs in the Teha area.
Minerals 14 01250 g003
Figure 4. (AC) Transmitted light photos, fluorescent photos, and fluorescence spectrum of golden fluorescence oil inclusions in Well 2; (DF) transmitted light photos, fluorescent photos, and fluorescence spectrum of dark yellow fluorescence oil inclusions in Well 2; (GI) transmitted light photos, fluorescent photos, and fluorescence spectrum of yellow-white fluorescence oil inclusions in Well 1; (JL) transmitted light photos, fluorescent photos, and fluorescence spectrum of blue fluorescence oil inclusions in Well 3.
Minerals 14 01250 g004
Figure 5. The homogenization temperature distribution of oil inclusions and associated brine inclusions in the Ordovician carbonate reservoirs in the Tahe area.
Minerals 14 01250 g005
Figure 6. Confocal laser scanning microscopy slice images of oil inclusions.
Minerals 14 01250 g006
Figure 7. Distribution of gas–liquid ratio of the four stages of oil inclusions.
Minerals 14 01250 g007
Figure 8. Relationship between homogenization temperature and trapping pressure.
Minerals 14 01250 g008
Figure 9. (A) Calibration of thermal and maturity models for Well 2; (B) burial and thermal history in Well 2 from the Tahe area.
Minerals 14 01250 g009
Figure 10. (A) Overpressure evolution of the Ordovician carbonate reservoirs in the Tahe area; (B) pressure coefficient evolution of the Ordovician carbonate reservoirs in the Tahe area.
Minerals 14 01250 g010
Table 1. Sampling list in Ordovician carbonate reservoirs in the Tahe area.
Sample No.WellFormationDepth/m
S5Well 1O2yj7066.5
S7Well 2O2yj6524.7
S13Well 3O1–2y6711.1
S14Well 4O1–2y6629
S22Well 3O1–2y6873
S24Well 5O1–2y6595.75
S27Well 6O1–2y6583.1
Disclaimer/Publisher’s Note: The statements, opinions and data contained in all publications are solely those of the individual author(s) and contributor(s) and not of MDPI and/or the editor(s). MDPI and/or the editor(s) disclaim responsibility for any injury to people or property resulting from any ideas, methods, instructions or products referred to in the content.