Article

Water Speciation and Storage Capacity of Olivine under the Reduced Fluid—Peridotite Interaction

V.S. Sobolev Institute of Geology and Mineralogy SB RAS, Koptyug Ave. 3, 630090 Novosibirsk, Russia
*
Author to whom correspondence should be addressed.
Minerals 2024, 14(2), 119; https://doi.org/10.3390/min14020119
Submission received: 12 December 2023 / Revised: 5 January 2024 / Accepted: 18 January 2024 / Published: 23 January 2024
(This article belongs to the Section Mineral Geochemistry and Geochronology)

Abstract

:
The key features of the interaction between peridotites of the continental lithospheric mantle and reduced hydrocarbon-rich fluids have been studied in experiments conducted at 5.5 GPa and 1200 °C. Under this interaction, the original harzburgite undergoes recrystallization while the composition of the fluid changes from CH4-H2O to H2O-rich with a small amount of CO2. The oxygen fugacity in the experiments varied from the iron-wustite (IW) to enstatite-magnesite-olivine-graphite/diamond (EMOG) buffers. Olivines recrystallized in the interaction between harzburgite and a fluid generated by the decomposition of stearic acid contain inclusions composed of graphite and methane with traces of ethane and hydrogen. The water content of such olivines slightly exceeds that of the original harzburgite. Redox metasomatism, which involves the oxidation of hydrocarbons in the fluid by reaction with magnesite-bearing peridotite, leads to the appearance of additional OH absorption bands in the infrared spectra of olivines. The water content of olivine in this case increases by approximately two times, reaching 160–180 wt. ppm. When hydrocarbons are oxidized by interaction with hematite-bearing peridotite, olivine captures Ca-Mg-Fe carbonates, which are products of carbonate melt quenching. This oxidative metasomatism is characterized by the appearance of specific OH absorption bands and a significant increase in the total water content in olivine of up to 500–600 wt. ppm. These findings contribute to the development of criteria for reconstructing metasomatic transformations in mantle rocks based on the infrared spectra and water content of olivines.

1. Introduction

Volatiles play a key role in the evolution of the deep interiors of the Earth and terrestrial planets. Olivine, capable of incorporating relatively large amounts of H2O as structurally bound hydroxyl (OH) groups [1,2,3], is the most common mineral in the upper mantle of the Earth and, for example, Mars. Therefore, the H2O storage capacity of olivine largely determines the ability of mantle rocks to retain water and controls the conditions for its release and the associated processes of formation of fluids or hydrous melts [4,5]. In particular, for the Earth’s mantle, it is olivine whose H2O storage capacity defines the position of the lithosphere–asthenosphere boundary [5]. The water content in olivine is governed by the pressure and temperature conditions and the activities of H2O, MgO, SiO2, and FeO in the crystallization environment [6,7,8,9,10,11,12,13,14]. A specific set of these parameters, characteristic of the mantle rocks of the terrestrial planets, determines the H2O storage capacity of olivine.
In depleted peridotite of the continental lithospheric mantle (CLM), water was introduced by fluids and melts during metasomatic events [15,16,17,18]. An increasing amount of evidence has emerged recently suggesting that both oxidized CO2-rich and reduced hydrocarbon-rich fluids could be involved in the metasomatic alteration of mantle rocks and the processes of deep mineral formation [19,20,21]. Hydrocarbons have been found in inclusions in diamonds and in deep-seated minerals from kimberlites of Yakutia (Russia), in diamonds from alluvial deposits in the Urals (Russia), and in ultra-deep diamonds from Juina (Brazil), as well as in CLIPPIR diamonds from Premier (South Africa) and Letseng (Lesotho) kimberlites [22,23,24,25,26]. One of the current models for natural diamond formation suggests that diamond crystallization in the subcratonic mantle could occur via the redox interaction between oxidized peridotites and hydrocarbon fluids uprising from the deep parts of the mantle [20,21]. Earlier experimental studies were mainly devoted to establishing the phase relations of peridotites at mantle P-T conditions and low oxygen fugacities (fO2s) [27,28]. The specific features and indicator phases of the interaction between the hydrocarbon fluid and peridotite, as well as the composition of the fluid produced in this process, are still controversial. Also debatable is the question of how such metasomatic processes could affect the water content of olivine. Previously, we have shown that the content and speciation of OH defects in olivines depend on the composition of reduced fluids in the system [29]. Matjuschkin et al. [30] showed that the interaction of a methane-rich fluid with lherzolite resulted in an increase in the H2O concentration in olivine. At the same time, an increase in CO2 concentration in the metasomatic agent may lead to a marked decrease in water-content olivine [31,32]. There are still no firm data on whether it is possible to determine what type of metasomatism (reducing or oxidative) the source peridotite was subjected to by analyzing the specific set of OH-related defects in peridotitic olivine from deep xenoliths.
The main objective of the present study was the investigation of the H2O storage capacity of olivine formed at 5.5 GPa and 1200 °C in experiments modeling the interaction of reduced water-hydrocarbon fluid and garnet peridotite oxidized to various degrees through the addition of MgCO3 and Fe2O3.

2. Materials and Methods

2.1. Starting Materials

As the starting material, we used a sample of coarse garnet peridotite xenolith Uv-419/09 from the Udachnaya-East kimberlite pipe (Yakutia), which was previously studied in detail by Doucet et al. [33] (Table 1). It was identified as harzburgite consisting of olivine (69.4%), orthopyroxene (21.5%), clinopyroxene (4.5%), and garnet (4.6%). Our analysis of the mineral composition (Table 2) additionally revealed accessory phlogopite in the xenolith sample we used. The determined chemical compositions of the constituting minerals (Table 3) were found to generally agree with the previous study [33] but showed a slight deviation in the iron content of olivine. Our analysis gives an Mg# (molar ratio, MgO/(MgO + FeO)) of olivine of 0.91, which is slightly higher than that found previously (0.89). For the experiments, the peridotite was ground into a fine powder (mostly < 30 µm).
Redox contrast reagents, including stearic acid (C18H36O2), as a source of hydrocarbons (as reducing agents) and, in some cases, carbonate (MgCO3) or hematite (Fe2O3), as oxidizing agents, were added to the peridotite powder. Stearic acid and hematite were chemical-grade reagents. Natural magnesite with the bulk composition of (Mg0.9Ca0.1)CO3 (Chelyabinsk region, Russia) was used as the starting carbonate. The composition of the quenched fluid formed during the decomposition of stearic acid was studied previously in experiments at 6.3 GPa, 1200 °C, and fH2 controlled by the Mo-MoO2 (MMO) buffer and without fH2 buffering [37]. In the first case, the composition was: H2O—41, CH4—37, C2H6—18, C3H8—2.7 rel.%; in the second case, the fluid contained fewer hydrocarbons: 93—H2O, CH4—2.6, C2H6—0.7, C3H8—0.4 rel.%. With the complete oxidation of stearic acid from 4 to 10 wt.%, H2O should be formed in the systems.
Homogenized mixtures of initial reagents were placed into Pt capsules with an outer diameter of 3.0 or 2.0 mm with graphite linings (the presence of graphite prevented the oxygen fugacity (fO2) in the samples from rising above the EMOG (enstatite-magnesite-olivine-graphite) buffer. The chemical composition of peridotite Uv-419/09 and the starting compositions of the experimental systems are given in Table 1. As follows from the presented data, most of the systems are quite similar in composition and the results obtained for them can be directly compared with each other. The exceptions are the experiments with the addition of Fe2O3, which show significantly higher iron contents. The capsules were arc-welded using a Lampert Werktechnik GmbH PUK-4U pulsed micro-welding device (Lampert Werktechnik GmbH, Werneck, Germany). To suppress the influx of hydrogen into Pt capsules from the surrounding details of the high-pressure cell, in several experiments, an external container made of Fe2O3 was employed. The experiments were 40 h long.
The parameters of the experiments and the phase compositions of the produced samples are given in Table 2. In accordance with the purpose of the work, the following sequence of operations was developed and carried out to prepare the samples for investigations: (1) the capsules were opened inside a capsule-piercing device for the gas-chromatography—mass-spectrometry analysis of quenched gases (details are given in Section 2.3) (as a result of piercing, the samples in the capsules were crushed into fragments); (2) fragments of the samples were extracted from the Pt capsules and large olivine crystals suitable for the infrared absorption measurements were picked up; (3) the largest fragments of the samples were embedded in epoxy resin to study the textural relationships and compositions of the solid phases.

2.2. High-Pressure Apparatus

Experiments were carried out at 5.5 GPa and 1200 °C using a split-sphere multi-anvil high-pressure apparatus [38]. The high-pressure cell was 21.1 × 21.1 × 25.4 mm in size, and the graphite heater was 12.2 mm in inner diameter and 18.8 mm high. Pressure was calibrated by recording the change in the resistance of Bi at 2.55 GPa and PbSe at 4.0 and 6.8 GPa at room temperature and at 1350 °C by bracketing the graphite–diamond equilibrium in the Ni0.7-Fe0.3-C system. Temperature was monitored in each run with a PtRh6/PtRh30 thermocouple calibrated at 6.3 GPa using the melting points of Al and Ag. Pressures and temperatures were measured with an accuracy of ±0.1 GPa and ±20 °C, respectively [38,39]. At the end of the runs, the samples were quenched at 150°/s under isobaric conditions.

2.3. Analytical Techniques

The composition of quenched fluid in the samples was determined by gas-chromatography—mass-spectrometry using a Focus GS/DSQ II system (Thermo Fischer Scientific, Waltham, MA, USA). After the experiments, the recovered capsules were cleaned, dried, and placed into a capsule-piercing device connected on-line to the gas chromatograph. The capsules were heated at 120–130 °C in a stream of a carrier gas (99.9999% pure He) for 90 min to clean adsorbed gases from the surfaces and to ensure the conversion of the quenched fluid components to the gas phase. Then, the capsules were pierced, and the released gas mixture was analyzed. Gas samples were not pyrolyzed, and the analysis was thus applied to an almost in situ gas mixture. Relative concentrations (%) of volatiles in the analyzed mixtures were obtained by normalization: the total areas of all chromatographic peaks were normalized to 100%, and the areas of individual components defined their proportions in the mixture. Trace amounts of poorly volatile components of the quenched fluids, especially heavy hydrocarbons (>C18), remained in the capsules. Analytical uncertainty was below 5% for C1–C4 alkanes and less than 10% for H2O, NH3, and CO2 (determined in the range from 12.5 pptv to 12.5 ppbv and expressed as precision), or even less than 5% in most cases. The GC-MS method for analyzing quenched fluids is described in detail in [37].
After GC-MS analysis, the Pt capsules were cut in half and solid run products were extracted. Parts of the samples were then embedded in epoxy resin by vacuum impregnation and polished under kerosene, without the use of water. The samples were examined on a Stemi 2000-C optical microscope (Carl Zeiss Microscopy, Jena, Germany) and a Tescan MIRA 3 LMU (Brno, Czech Republic) scanning electron microscope (SEM). The solid-phase compositions were analyzed in samples coated with 20 nm carbon, using a Tescan MIRA 3 LMU SEM microscope coupled to an INCA EDS 450 micro-analysis system with an Oxford Instruments liquid nitrogen-free large-area EDS X-Max-80 Silicon Drift Detector (High Wycombe, UK). The instrument was operated at an accelerating voltage of 20 kV, a beam current of 1 nA, and a spot diameter of ~10 µm; the counting time for spectra acquisition was 20 s. The EDS spectra were optimized for quantification using the standard XPP procedure built into the INCA Energy 450 software (INCA Suite v. 4.01, Oxford instruments, Oxford, UK).
The type and content of hydroxyl defects in olivines were determined by polarized Fourier Transform Infrared (FTIR) spectroscopy using a Bruker Vertex 70 spectrometer coupled to a Hyperion 2000 microscope (Bruker Optics, Ettlingen, Germany). Polarization of the infrared radiation was achieved using a holographic wire grid polarizer on a ZnSe substrate (Optometrics, Littleton, MA, USA). The spectra were acquired with a resolution of 2 cm−1 and averaging over 64–128 scans. Square apertures providing 50 × 50 µm2 sampling areas were used. Olivine grains were extracted from the starting garnet harzburgite and polished on two sides to provide flat surfaces. Olivine crystals with sizes of about 100 μm and greater were selected from the experiments. The crystals were first oriented optically, then embedded into Crystalbond 509 adhesive (Aremco Products, Valley Cottage, NY, USA) and polished using alumina-coated lapping films. The orientation of the samples was determined from the comparison of the recorded spectra in the silicate overtone region with the reference spectra measured for olivine crystals oriented along the principal crystallographic axes [40]. The recorded spectra were background corrected, normalized to 1 cm thickness, and integrated over the OH-stretching range. The error in determining the integral absorption was estimated to be 15–20%. To calculate H2O concentrations, we used a calibration factor of 0.119 ± 0.006 wt. ppm H2O/cm2 determined by Withers et al. [41].
Raman micro-spectroscopy was used for the identification of experimental phases and inclusions in olivines. Measurements were made over the spectral range of 100–4200 cm−1 on a confocal Raman spectrometer, the Horiba J.Y. LabRAM HR 800 (Horiba Jobin Yvon S.A.S., Lonjumeau, France). A diode-pumped solid-state laser emitting at 532 nm (Laser Quantum, Stockport, UK) was used as the excitation source. An Olympus 100 × (NA = 0.90) objective was used to focus the laser beam onto the sample and to collect the Raman signal. The spectra were measured with a spectral resolution of 2 cm−1. The spectrometer was calibrated by the emission lines of a neon gas-discharge lamp at 540.06 nm and 585.25 nm. The accuracy of the band positioning in the Raman spectra was approximately ±1 cm−1.

3. Results

3.1. Phase Relations

Most of the produced samples, both without additives and with the addition of MgCO3 or Fe2O3, consisted of the Ol-Opx-Cpx-Grt four-phase associations. In the samples with the addition of MgCO3, magnesite was detected after the experiments. It is important to note that no products of quenched melt were observed in any of the samples, except for HC-SA 7. Thus, in almost all the studied systems, solid silicate and carbonate phases coexisted with the fluid. The textures of the samples without the addition of oxidizing agents showed no signs of reactions between the silicate phases. Owing to the presence of Ca admixture in the starting magnesite (see Section 2 and Table 1), in samples with MgCO3 additives, traces of the replacement of Opx for Cpx (runs HC-SA 3 and HC-SA 5) or Ol and Opx for Cpx (run HC-SA 4) were detected (Figure 1). Moreover, the concentration of Cpx in these samples significantly exceeded the initial concentration in the xenolith. No iron oxides were found in the samples with the addition of Fe2O3. In sample HC-SA 7, no clinopyroxene but Mg-Ca-Fe carbonatitic melt was found in association with olivine, orthopyroxene, and garnet. Intergrain segregations of the quenched carbonatitic melt with sizes of up to 10 µm were detected in the sample.
Along with changing the mineral abundances, the interaction between the peridotite and fluid also influenced the chemical compositions of the main solid phases. The compositions of olivines recovered from runs without oxidizing additives (Mg#, molar ratio, MgO/(MgO + FeO), 0.92) and from runs with the addition of MgCO3 (Mg# 0.93–0.95) were either very close to those of olivines from the original xenolith (Mg# 0.91) or depleted in FeO (Table 3). The same holds for Opx; however, the Mg# variations of orthopyroxenes were noticeably higher, from 0.93 to 0.98 (with 0.93 in Opx from xenolith). In the silicate phases from the samples with the addition of Fe2O3, individual grains showed zoning in FeO concentration. For instance, with the average Mg# of olivines of 0.87, its variations in some grains reached the range from 0.82 to 0.89 (FeO content varied from 14 to 8 wt.%). The Ca# (molar ratio CaO/(CaO + MgO + FeO) of clinopyroxenes varied from 0.54 to 0.65, being far from that of clinopyroxenes from the original xenolith (Ca# 0.67). Garnets from the initial xenolith contained 7.8 and 7.0 wt.% of Cr2O3 and CaO, respectively. The compositions of garnets from the experimental samples varied markedly due to their zoning but did not significantly deviate from the compositions of the initial garnets. Only in experiment HC-SA 5, garnet cores were noticeably enriched in Cr2O3 (up to 14 wt.%). Melt detected in sample HC-SA 7 had Ca# 0.31 and deviated from the dolomitic composition towards a higher Mg content.
Under the peridotite–fluid interaction, the composition of the fluid changed markedly. It is important to note that since the second critical point for the peridotite-H2O-CO2 system lies above 7 GPa [42], the aqueous fluid formed in our experiments should be solute-poor (<30 wt.%). In this case, the composition of the quenched fluid, determined after the experiment by the GC-MS method, is representative.
In all of the experimental samples, water is the main component of the fluid, constituting from 55 to 87 rel.% (Table 4). In the sample without the addition of oxidizing agents and without the external HM container, the CH4 content reaches 31 rel.% (C2H6—5 rel.%). Even in the fluid from the samples with the addition of MgCO3 and Fe2O3, the presence of light alkanes is noticeable (from 2 to 14 rel.% in total). A characteristic feature of most fluids from such samples is an increased concentration of water and oxygen-containing organics (alcohols, esters, aldehydes, ketones, and carboxylic acids). The total content of components for these classes of organic compounds varies from about 1 to 7 rel.%. The CO2 concentration in the samples with the addition of MgCO3 and Fe2O3 does not exceed 14 rel.%. This, apparently, is due to the fact that the reaction of olivine carbonation buffered the CO2 activity at a low level.
The composition of the quenched fluid indicates that the redox conditions in the samples varied significantly (Table 2). The minimum fO2 was in sample HC-SA 1, where a mixture of harzburgite and stearic acid was used without external buffering. In this case, the ratio of H2O and CH4 (including light alkanes) components in the quenched fluid was close to unity (~0.7). Based on the results of thermodynamic modeling of carbon-rich C-O-H fluids [21,43], we can infer that the fO2 in sample HC-SA 1 was close to the Fe-FeO (IW) buffer values. The quenched fluid released from sample HC-SA 6 had a substantially aqueous composition with a small admixture of light alkanes (8 to 14 rel.%), suggesting that the fO2 in these experiments was close to the CW (carbon-saturated water maximum) [34]. In experiments HC-SA 3, HC-SA 4, and HC-SA 5, olivine, orthopyroxene, magnesite, and graphite were among the stable phases, indicating redox conditions controlled by the EMOG buffer. Apparently, the same redox conditions were in experiment HC-SA 7, in which an association of olivine, orthopyroxene, and Mg-Ca-Fe carbonatitic melt was found. It is important to note that, at such fO2, the samples contained fluid with up to 10 rel.% of light alkanes, primarily CH4. Previously, we recorded the presence of similar amounts of light alkanes and oxygen-containing organics in the fluid from carbonate-bearing lherzolite at similar P-T conditions [44]. A higher-than-expected stability of light alkanes and oxygen-containing organics in the peridotite system at relatively oxidized conditions set by the EMOG buffer requires additional investigations. It cannot be excluded that methane was formed during quenching from organic matter with a more complex composition. An almost purely aqueous fluid, without significant admixtures of CO2 and CH4, was recorded in experiment HC-SA 2. The absence of carbonate in this experiment does not allow us to estimate fO2 more precisely. Apparently, it was in the range from CW to EMOG.

3.2. FTIR Spectroscopy

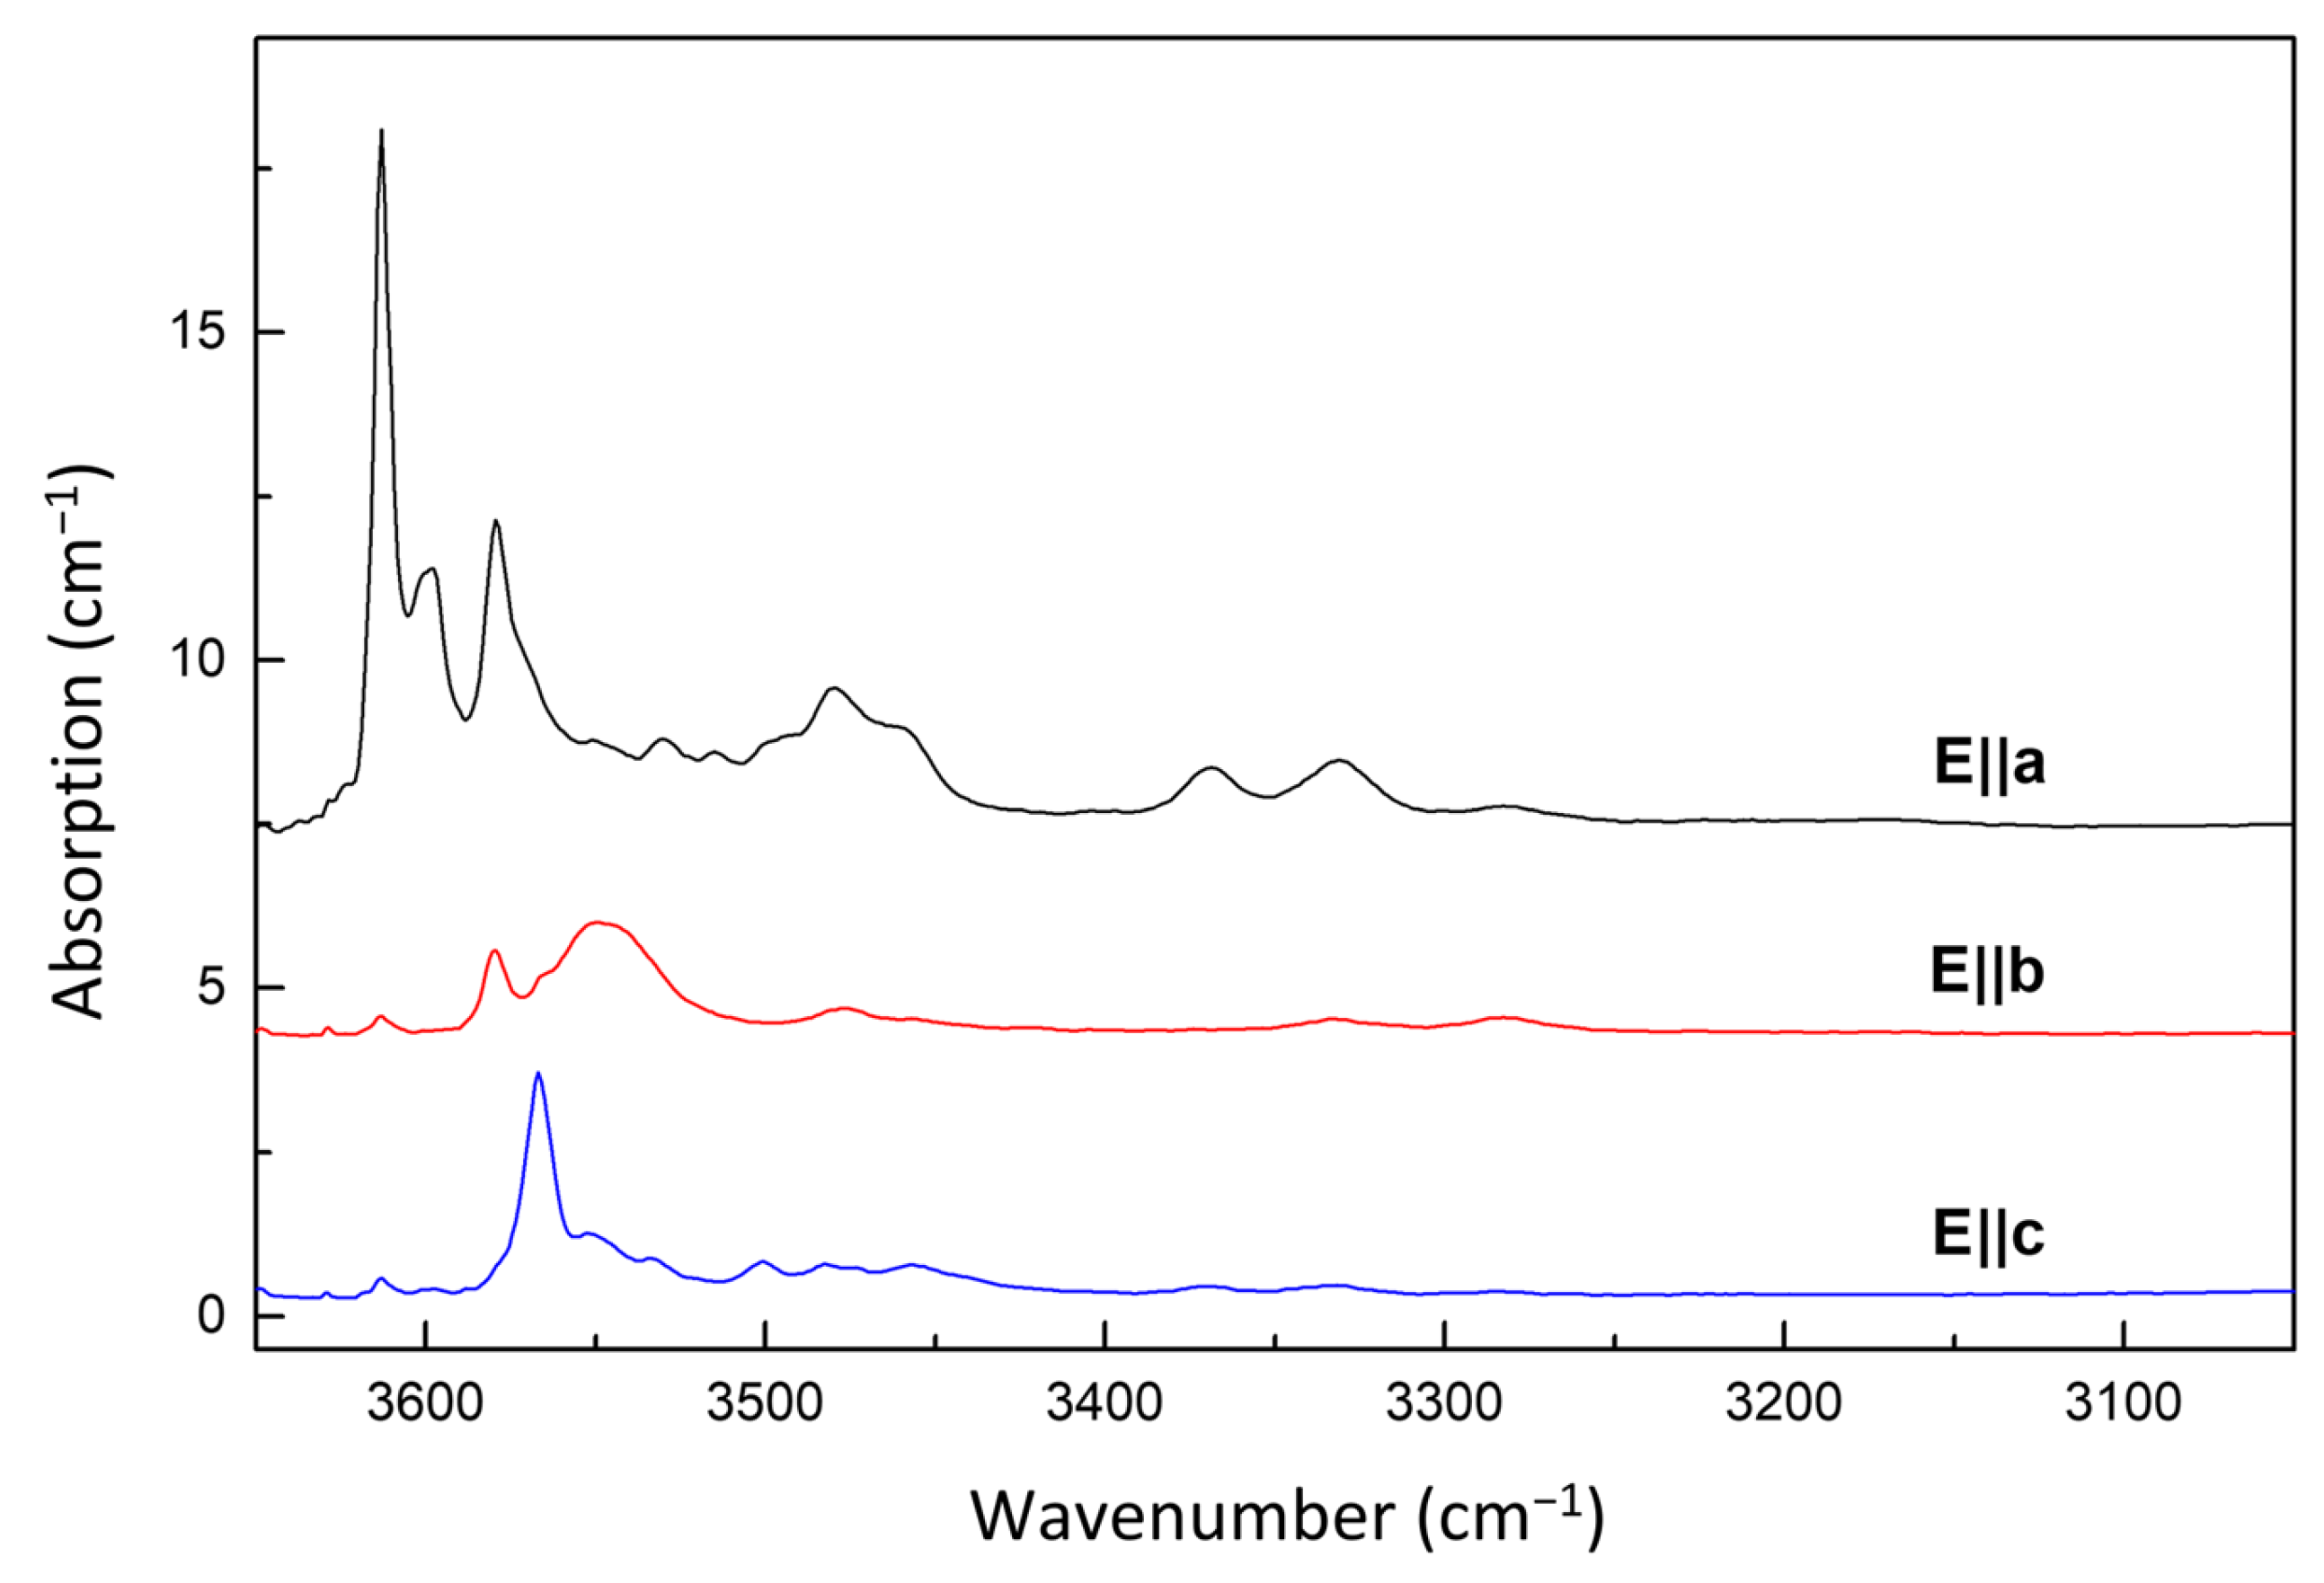
Figure 2 shows polarized IR absorption spectra measured along the principal crystallographic axes for olivines from the original harzburgite. Hydroxyl defects appear in the spectra as a series of absorption bands with maxima near 3613, 3600, 3579, 3567, 3480, 3460, 3370, and 3330 cm−1, the relative intensities of which depend on the crystallographic orientation of the samples and the direction of the electric field vector. The strongest bands are at 3613, 3579, and 3567 cm−1. According to the generally accepted model, these bands are associated with protonated silicon vacancies, (4H)Si [9,45]. The band with a maximum at about 3600 cm−1 is characteristic of OH-containing olivines and presumably associated with OH defects localized near iron ions [14]. Weaker bands in the region of 3400–3300 cm−1 are attributed to OH defects associated with trivalent cations (Fe3+, Al3+, and Cr3+) [46]. According to our estimates, the water content in the studied olivines from the original harzburgite is 60–80 wt. ppm.
Let us consider the results obtained for olivines produced in the experiments. Figure 3 shows typical IR spectra of the olivines recovered from run HC-SA 1, where the starting composition comprised stearic acid and harzburgite and no external buffering container was used. The dominating absorption lines in the OH absorption region are related to protonated silicon vacancies, (4H)Si. Absorption bands in the region of 3400–3300 cm−1 have a low intensity and virtually do not exceed the noise level. Spectra measured along the c axis reveal a very weak band with a maximum at about 3170 cm−1, which was not observed for olivines from the original harzburgite. According to the existing models, the band at 3170 cm−1 is due to protonated Mg vacancies, (2H)Mg [9,45,47]. Excluding the contribution of (2H)Mg defects, the water concentration in this case is calculated as 80–100 wt. ppm, which only slightly exceeds the water content in olivines from the original harzburgite. Estimation of the hydrogen/water concentration in the form of (2H)Mg defects is complicated by the fact that, currently, there are no experimentally confirmed calibrations for these defects. In natural and synthetic olivines used in the calibration works of Bell et al. [48] and Withers et al. [41], absorption in the low-frequency region of 3200–3000 cm−1 was either absent or negligible. Following the results reported by Kovacs et al. [49] and Balan et al. [50], for the 3107 cm−1 band, we used a molar extinction coefficient of 100,000 L mol−1 cm−2, which corresponds to a calibration factor of 0.055. Accordingly, for olivines from run HC-SA 1, our estimates give the water concentration in the form of (2H)Mg defects as no more than 10–15 ppm.
When magnesite was added to the starting composition as the oxidizing agent (runs HC-SA 3 and HC-SA 4), the following main changes were found to occur in the infrared spectra of synthesized olivines: (1) lines at 3613, 3579, and 3567 cm−1 due to (4H)Si defects increased in intensity; (2) relatively weak lines at 3636, 3624, 3591, and 3570 cm−1 appeared in the spectra; and (3) lines in the region of 3400–3300 cm−1 slightly increased in intensity. The calculated water content of olivines was 160–180 wt. ppm.
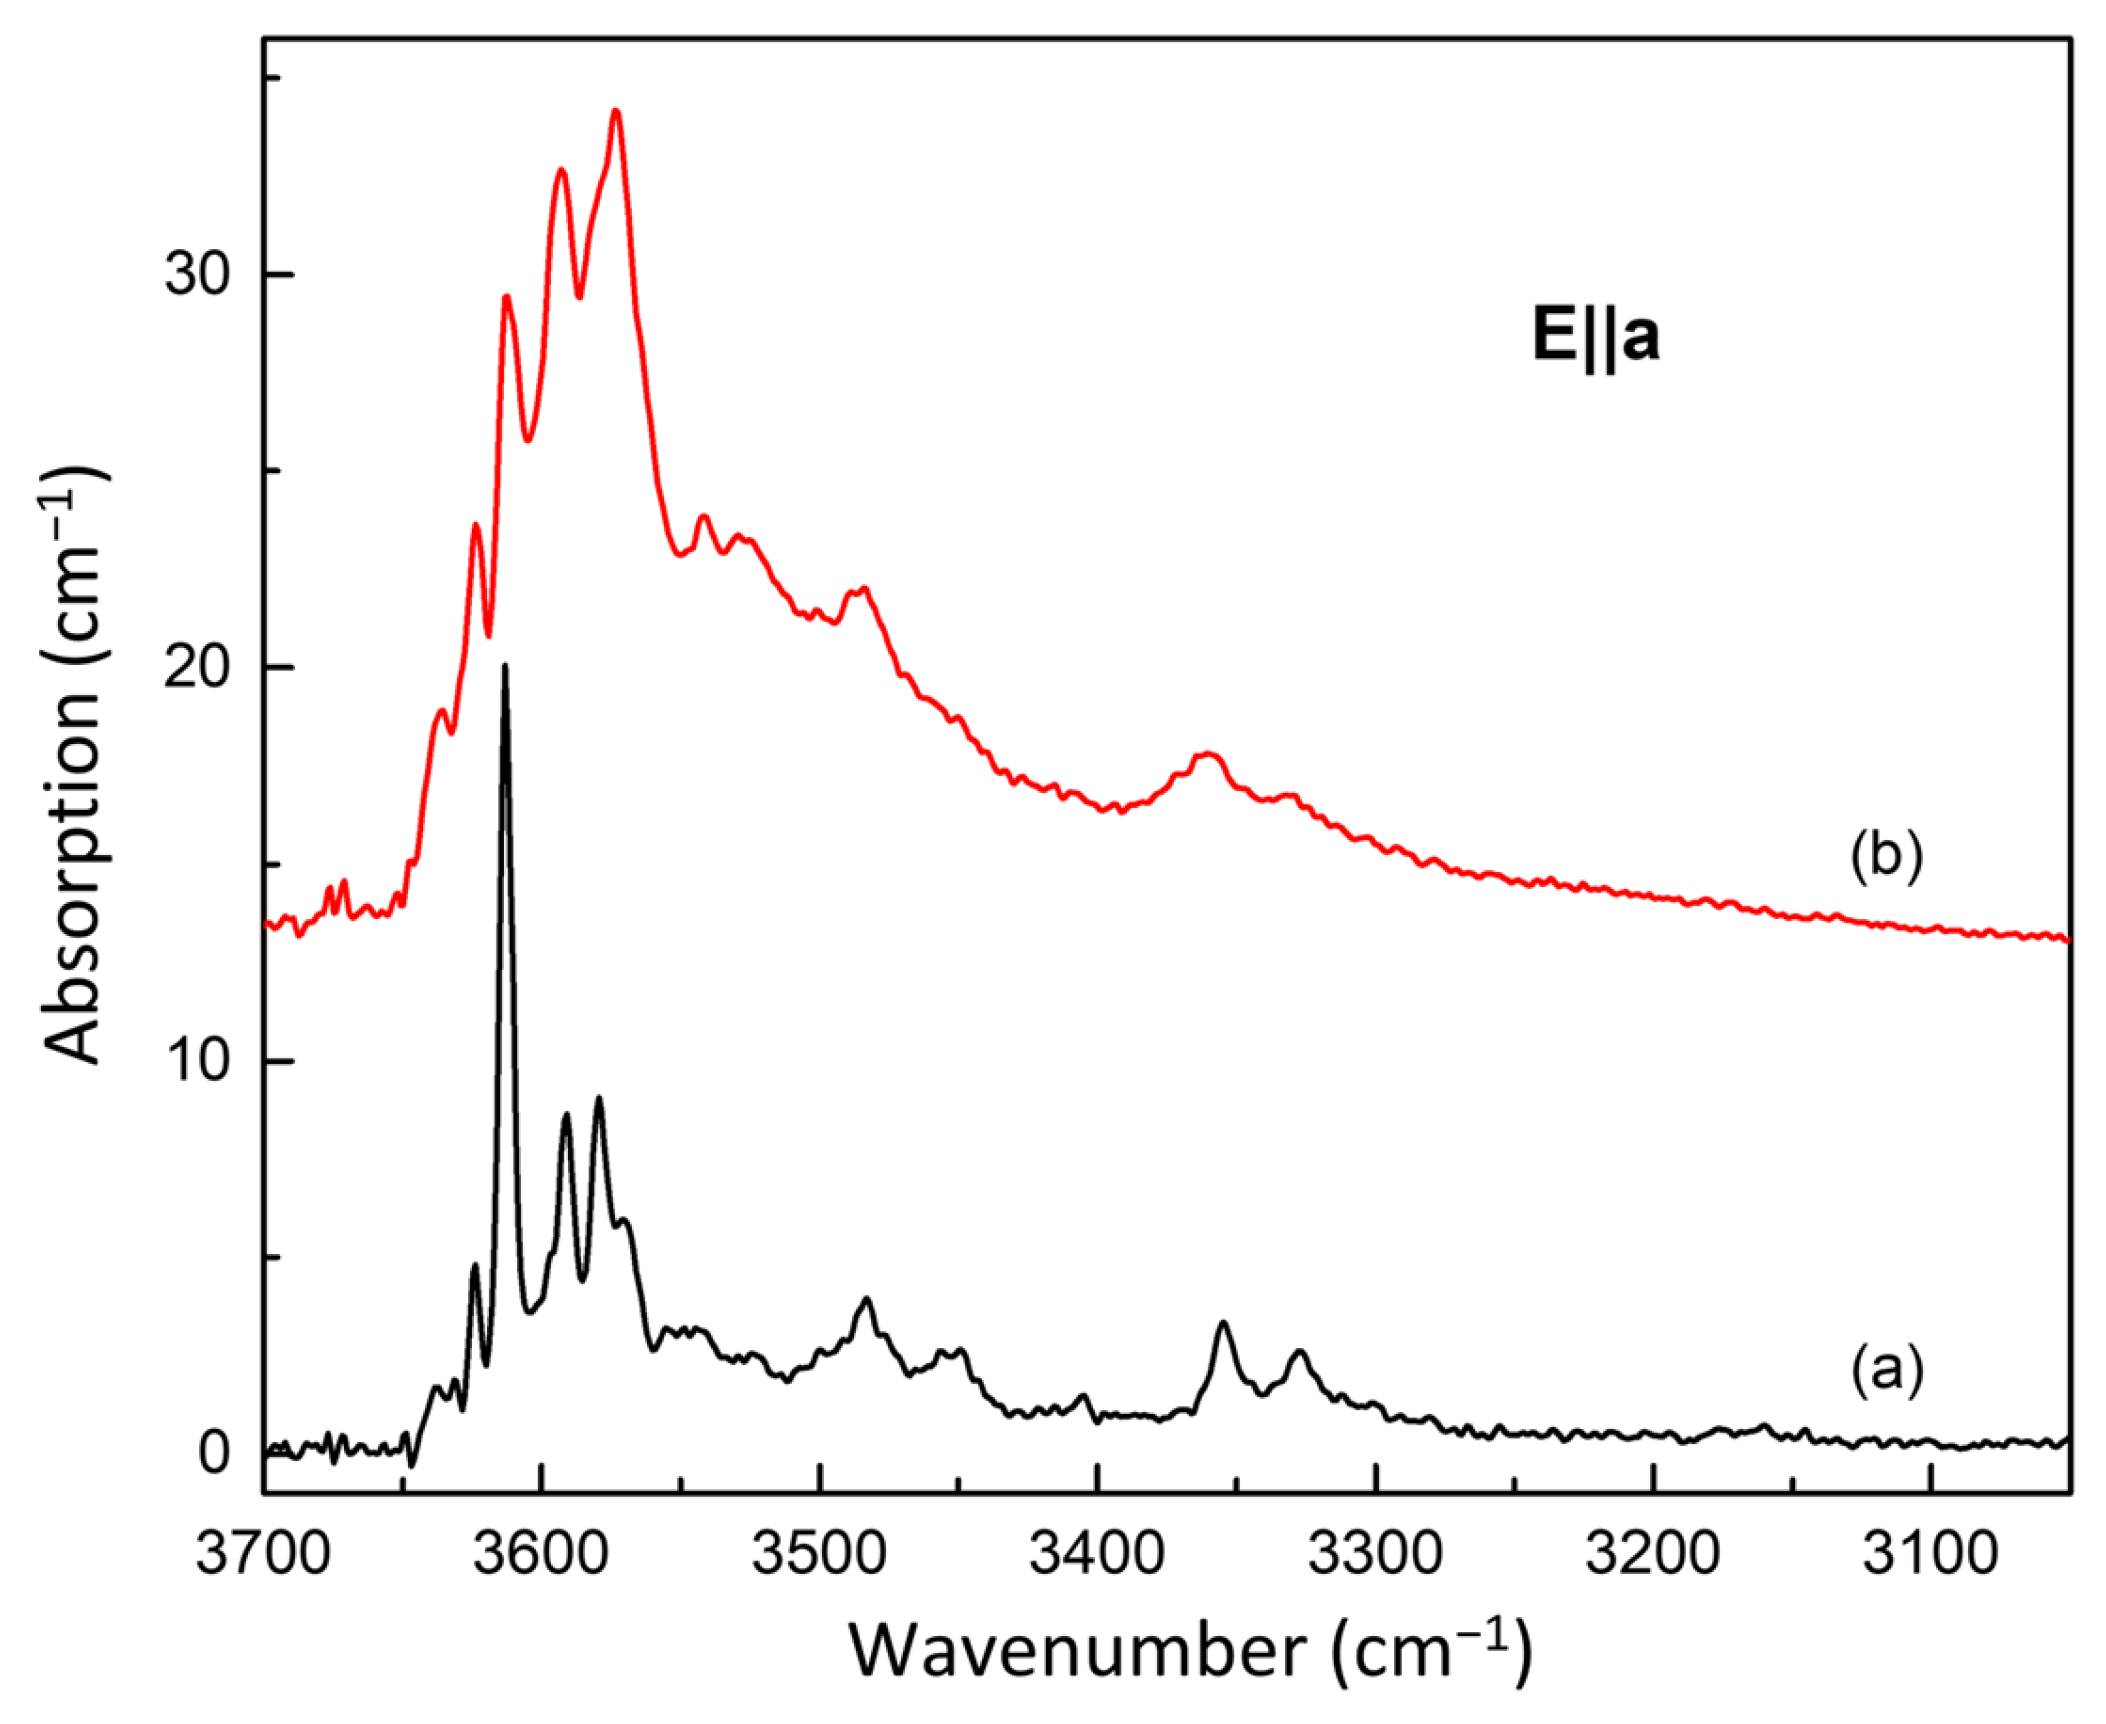
Olivine grains selected for the IR measurements from the experiments with the addition of hematite were either colorless or had a light yellow color. EDS analysis of the prepared polished plates showed that they differed in iron (FeO) content, which was 6–8 wt.% and 10–14 wt.% for the colorless and yellow olivines, respectively. In the IR spectra of colorless olivines, the absorption peaks at 3613, 3580, and 3567 cm−1 associated with hydrated silicon vacancies had the highest intensity. In addition, in comparison with olivines synthesized without additions of Fe2O3, the relative intensity of the bands in the region of 3400–3300 cm−1 slightly increased. The total water content was approximately 80–100 wt. ppm. Significant differences, both in the form of the IR spectra and in the intensity of the absorption bands of OH defects, were found for olivines with a yellow color. In this case, a series of broadened absorption bands in the range of 3640–3500 cm−1 were observed, among which one can distinguish lines related to protonated silicon vacancies (3613, 3579, and 3567 cm−1) and lines whose nature was not clear (3636, 3624, 3591, and 3570 cm−1) (Figure 4). Estimation of the water content for such olivines gave values of 500–600 wt. ppm. Concerning the occurrence of new unidentified OH absorption lines, it is necessary to note that lines with similar positions but with significantly lower intensities are found for olivines crystalized in experiments with the addition of magnesite. Common to the experiments with magnesite and hematite additives is a higher oxidation degree of fluid, in which olivine recrystallized and hydroxyl and other defects re-equilibrated. It should also be noted that similar absorption spectra of OH defects have been reported for natural olivines from kimberlites (see, for example, Figure 6 from ref. [51]). Taking into account the known data on the effect of iron on the storage capacity of water in olivine [12], it can be assumed that the increased water content in yellow olivines from experiments with hematite additions can be associated with both a higher degree of fluid oxidation and the higher iron content of these olivines.

3.3. Raman Micro-Spectroscopy

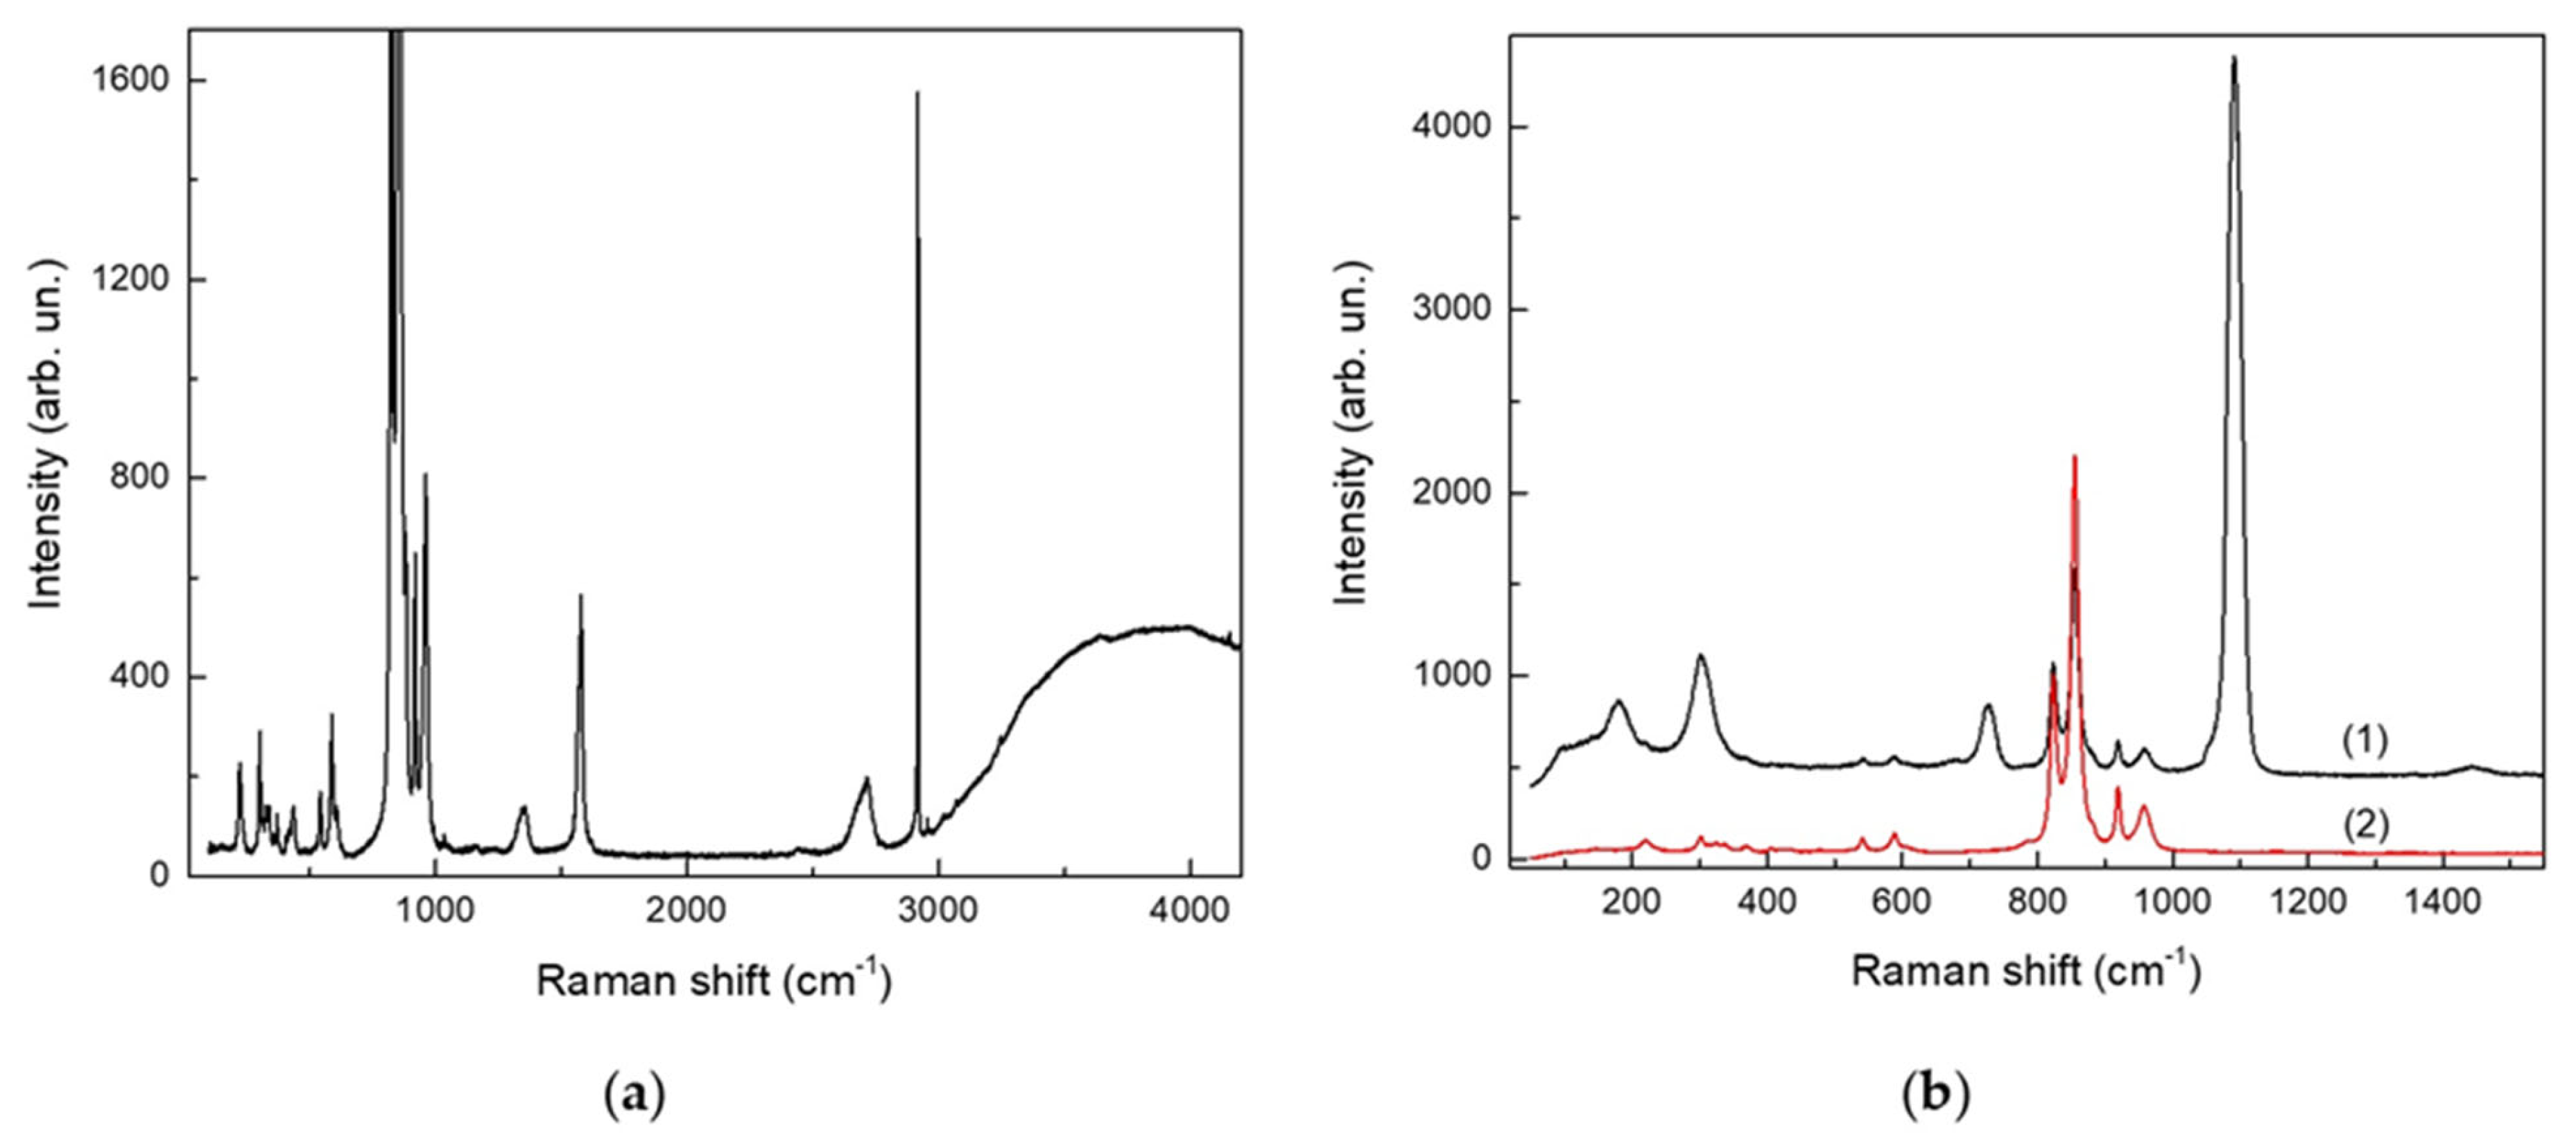
Raman micro-spectroscopy was employed to identify inclusions in crystallized olivines. We found that, in most cases, olivines recovered from the experiments contained only tiny inclusions, for which no reasonable Raman spectra could be acquired. Nevertheless, in several cases, we were able to detect clear Raman signals, allowing identification of the composition of corresponding inclusions. Figure 5a shows an optical microscopy image of inclusions detected in an olivine crystal from run HC-SA 1. Raman spectra recorded for these inclusions (Figure 6a) typically demonstrate a strong narrow band at 2917 cm−1 corresponding to ν1 vibrations of CH4 and broader bands at 1580 and 1350 cm−1 corresponding to G- and D-modes of graphite, respectively. Much weaker but still discernible are the peaks at 2955 cm−1 and 4156 cm−1, corresponding to C2H6 and H2, respectively. At wavenumbers greater than 3000 cm−1, most of the recorded spectra exhibited a broad band, which was most likely caused by fluorescence. The occurrence of this band prohibited the identification of the Raman signal caused by water, which is known to be relatively weak and spectrally broad [52]. Another example where we succeeded in the identification of inclusions by Raman micro-spectroscopy concerns olivines crystallized in experiments with the addition of hematite as the oxidizing agent. In this case, olivine crystals frequently contained relatively large inclusions (see Figure 5b), which were identified by Raman scattering as carbonate. Raman spectra recorded for inclusions and for olivine matrices are shown in Figure 6b. It is evident that the bands due to inclusions are those located at 179, 303, 726, 1091, and 1443 cm−1. Such a combination of Raman bands is characteristic of carbonates, and, based on the existing data in the literature [53,54], we conclude that the observed inclusions correspond to a series of complex Mg-Ca-Fe carbonates.

4. Discussion

An analysis of the obtained data shows that the experiments performed at a pressure of 5.5 GPa and a temperature of 1200 °C allowed us to simulate the processes of both reducing and oxidative metasomatism of peridotites of the subcratonic lithosphere. The addition of stearic acid to harzburgite samples reproduced the process of peridotite reduction with water-hydrocarbon fluid. The simultaneous introduction of stearic acid and magnesite or hematite into the samples made it possible to simulate the process of oxidation of a water-hydrocarbon fluid or its interaction with oxidized harzburgite or a counter flow of oxidized metasomatic agents, for example, carbonatite melts.
Our results indicate that the interaction between harzburgite and fluid was accompanied by recrystallization of its main solid phases. In the sample with stearic acid, but without the addition of oxidizing agents or an external oxidized HM container, a substantially water-methane fluid was formed with an fO2 close to the values of the Fe-FeO (IW) buffer (Table 2), the content of CH4 in which reaches 31 rel.% and that of C2H6, 5 rel.%. The texture of the sample did not show signs of a reaction between the silicate phases. However, the presence of inclusions in olivine, consisting of graphite and methane with an admixture of ethane (Figure 5a), clearly indicates its recrystallization with the capture of reduced fluid.
Oxidative metasomatism, modeled in experiments with the addition of Ca-bearing magnesite, was accompanied by phase recrystallization with an increase in the proportion of clinopyroxene due to the replacement of either only orthopyroxene or both orthopyroxene and olivine. In the quenched fluid from such samples, the proportion of hydrocarbons noticeably decreased and the proportion of water increased. The oxygen fugacity in these experiments was set by the Ol-Opx-Mgs + graphite association near the EMOG buffer (Table 2). In the sample with the addition of hematite, clinopyroxene disappeared as a result of the interaction and a Mg-Ca-Fe carbonatitic melt was formed. Moreover, during recrystallization, olivine captured inclusions of Mg-Ca-Fe carbonate (Figure 5b). Thus, redox conditions in these experiments should be close to the EMOG buffer. Since there was no carbonate in the starting composition, it obviously formed as a result of the oxidation of hydrocarbon fluid and/or graphite. The composition of the captured carbonate inclusion, which is different from stable magnesite in peridotite, suggests that the inclusion content is a product of carbonate melt quenching.
Thus, the silicate phases of the original harzburgite, including olivine, underwent recrystallization in the experiments. The data obtained allow us to relate the observed differences both in the general shape of the IR spectra and in the intensity of the absorption bands of OH defects in olivine with different types of redox metasomatism. During metasomatism by water-hydrocarbon fluids against the background of a decrease in fO2 to the IW buffer values, the crystallized olivines predominantly have OH defects associated with silicon vacancies. In addition, a very weak band caused by protonated magnesium vacancies, (2H)Mg, appeared in the spectra. The total water concentration slightly exceeds the water content of olivines from the original harzburgite, reaching 90–110 ppm. Oxidative metasomatism involving oxidation of hydrocarbons in the fluid can lead to the appearance in the IR spectra of olivines, in addition to the OH defect-defect lines associated with silicon vacancies, of characteristic absorption lines at 3636, 3624, 3591, and 3570 cm−1, the nature of which has not yet been clearly established. In addition, lines appear in the IR spectra in the region of 3400–3300 cm−1 associated with complex OH defects involving trivalent cations. The water content in olivine increases by approximately two times, reaching up to 160–180 wt. ppm. Oxidative metasomatism involving the addition of iron leads to the appearance in the IR spectra of olivine of a series of broadened absorption bands in the range of 3640–3500 cm−1, the nature of which is not identified (3636, 3624, 3591, and 3570 cm−1). A similar set of OH defects in natural olivines [51] may indicate their oxidation upon interaction with kimberlite melt. Oxidative metasomatism can lead to a significant increase in the total water content in olivine of up to 500–600 ppm.

5. Conclusions

The key features of the interaction between mantle peridotites oxidized to various degrees with reduced hydrocarbon-rich fluids have been modeled in experiments at 5.5 GPa and 1200 °C. During such oxidative interaction, the fluid composition changes from methane-water to significantly water-rich with the addition of oxygen-containing organic matter and a small amount of CO2. The original harzburgite undergoes recrystallization, during which olivine captures inclusions. When interacting with a fluid generated by the decomposition of stearic acid, the inclusions in olivine contain graphite and methane with traces of ethane and hydrogen. In the olivine itself, the total water concentration slightly exceeds the water content of olivines from the original harzburgite, reaching 90–110 ppm. Oxidative metasomatism involving the oxidation of hydrocarbons in the fluid by the addition of MgCO3 can lead to the appearance in the IR spectra of olivines, in addition to the peaks caused by protonated Si vacancies, features associated with complex OH defects involving trivalent cations. The water content in olivine increases by approximately two times, reaching up to 160–180 wt. ppm. When hydrocarbons are oxidized by interaction with hematite, olivine contains inclusions of Ca-Mg-Fe carbonates—a product of carbonatitic melt quenching. A fingerprint of such oxidative metasomatism is the appearance in the IR spectra of olivine of a series of broadened absorption bands in the range of 3640–3500 cm−1 (previously detected in olivines from kimberlites) and a significant increase in the total water content in olivine of up to 500–600 ppm.

Author Contributions

Conceptualization, A.G.S. and I.N.K.; methodology, I.N.K., A.G.S. and A.N.K.; formal analysis, I.N.K., A.G.S. and A.N.K.; investigation, I.N.K., A.G.S. and A.N.K.; writing—original draft preparation, I.N.K. and A.G.S.; writing—review and editing, I.N.K. and A.G.S. All authors have read and agreed to the published version of the manuscript.

Funding

This research was performed under the state assignment of IGM SB RAS (project 122041400159-3).

Data Availability Statement

The data presented in this article are available on request from the author due to internal policy and future research.

Acknowledgments

We thank Alexander Golovin (IGM SB RAS) for the provision of a sample of the xenolith Uv-419/09.

Conflicts of Interest

The authors declare no conflict of interest.

References

  1. Bai, Q.; Kohlstedt, D.L. Substantial hydrogen solubility in olivine and implications for water storage in the mantle. Nature 1992, 357, 672–674. [Google Scholar] [CrossRef]
  2. Kolhstedt, D.L.; Keppler, H.; Rubie, D.C. Solubility of water in the α, β and γ phases of (Mg,Fe)2SiO4. Contrib. Mineral. Petrol. 1996, 123, 345–357. [Google Scholar]
  3. Mosenfelder, J.L.; Deligne, N.I.; Asimow, P.D.; Rossman, G.R. Hydrogen incorporation in olivine from 2–12 GPa. Am. Mineral. 2006, 91, 285–294. [Google Scholar] [CrossRef]
  4. Hirschmann, M.M.; Tenner, T.; Aubaud, C.; Withers, A.C. Dehydration melting of nominally anhydrous mantle: The primacy of partitioning. Phys. Earth Planet. Inter. 2009, 176, 54–68. [Google Scholar] [CrossRef]
  5. Green, D.H.; Hibberson, W.O.; Kovács, I.; Rosenthal, A. Water and its influence on the lithosphere–asthenosphere boundary. Nature 2010, 467, 448. [Google Scholar] [CrossRef] [PubMed]
  6. Bali, E.; Bolfan-Casanova, N.; Koga, K.T. Pressure and temperature dependence of H solubility in forsterite: An implication to water activity in the Earth interior. Earth Planet. Sci. Lett. 2008, 268, 354–363. [Google Scholar] [CrossRef]
  7. Smyth, J.R.; Frost, D.J.; Nestola, F.; Holl, C.M.; Bromiley, G. Olivine hydration in the deep upper mantle: Effect of temperature and silica activity. Geophys. Res. Lett. 2006, 33, L153012006. [Google Scholar] [CrossRef]
  8. Matveev, S.; Portnyagin, M.; Ballhaus, C.; Brooker, R.A.; Geiger, C.A. FTIR spectrum of phenocryst olivine as an indicator of silica saturation in magmas. J. Petrol. 2005, 46, 603–614. [Google Scholar] [CrossRef]
  9. Lemaire, C.; Kohn, S.C.; Brooker, R.A. The effect of silica activity on the incorporation mechanisms of water in synthetic forsterite: A polarized infrared spectroscopic study. Contrib. Mineral. Petrol. 2004, 147, 48–57. [Google Scholar]
  10. Zhao, Y.H.; Ginsberg, S.B.; Kohlstedt, D.J. Solubility of hydrogen in olivine: Dependence on temperature and iron content. Contrib. Mineral. Petrol. 2004, 147, 155–161. [Google Scholar] [CrossRef]
  11. Withers, A.C.; Hirschmann, M.M. Influence of temperature, composition, silica activity and oxygen fugacity on the H2O storage capacity of olivine at 8 GPa. Contrib. Mineral. Petrol. 2008, 156, 595–605. [Google Scholar] [CrossRef]
  12. Withers, A.C.; Hirschmann, M.M.; Tenner, T.J. The effect of Fe on olivine H2O storage capacity: Consequences for H2O in the martian mantle. Am. Mineral. 2011, 96, 1039–1053. [Google Scholar] [CrossRef]
  13. Sokol, A.G.; Kupriyanov, I.N.; Palyanov, Y.N.; Kruk, A.N.; Sobolev, N.V. Melting experiments on the Udachnaya kimberlite at 6.3–7.5 GPa: Implications for the role of H2O in magma generation and formation of hydrous olivine. Geochim. Cosmochim. Acta. 2013, 101, 133–155. [Google Scholar] [CrossRef]
  14. Blanchard, M.; Ingrin, J.; Balan, E.; Kovacs, I.; Withers, A. Effect of iron and trivalent cations on OH defects in olivine. Am. Mineral. 2017, 102, 302–311. [Google Scholar] [CrossRef]
  15. Kelemen, P.B.; Dick, H.J.B.; Quick, J.E. Formation of harzburgite by pervasive melt/rock reaction in the upper mantle. Nature 1992, 358, 635–641. [Google Scholar] [CrossRef]
  16. Kesson, S.E.; Ringwood, A.E. Slab-mantle interactions: 2. The formation of diamonds. Chem. Geol. 1989, 78, 97–118. [Google Scholar] [CrossRef]
  17. Boyd, F.R.; Pokhilenko, N.P.; Pearson, D.G.; Mertzman, S.A.; Sobolev, N.V.; Finger, L.W. Composition of the Siberian cratonic mantle: Evidence from Udachnaya peridotite xenoliths. Contrib. Mineral. Petrol. 1997, 128, 228–246. [Google Scholar] [CrossRef]
  18. Pearson, D.G.; Wittig, N. The Formation and Evolution of Cratonic Mantle Lithosphere—Evidence from Mantle xenoliths. Treatise on Geochemistry, 2nd ed.; Elsevier: Amsterdam, The Netherlands, 2014; Volume 3, pp. 255–292. [Google Scholar]
  19. Creighton, S.; Stachel, T.; Matveev, S.; Hofer, H.; McCammon, C.; Luth, R.W. Oxidation of the Kaapvaal lithospheric mantle driven by metasomatism. Contrib. Mineral. Petrol. 2009, 157, 491–504. [Google Scholar] [CrossRef]
  20. Luth, R.W.; Stachel, T. The buffering capacity of lithospheric mantle: Implications for diamond formation. Contrib. Mineral. Petrol. 2014, 168, 1–12. [Google Scholar] [CrossRef]
  21. Stachel, T.; Luth, R.W. Diamond formation—Where, when and how? Lithos 2015, 220, 200–220. [Google Scholar] [CrossRef]
  22. Sobolev, N.V.; Logvinova, A.M.; Fedorova, E.N.; Luk’yanova, L.I.; Wirth, R.; Tomilenko, A.A.; Reutsky, V.N.; Efimova, E.S. Mineral and fluid inclusions in the diamonds from the Ural placers, Russia. In AGU Fall Meeting Abstracts; AGU: Washington, DC, USA, 2015; p. V11C–3073. [Google Scholar]
  23. Sobolev, N.V.; Tomilenko, A.A.; Bul’bak, T.A.; Logvinova, A.M. Composition of volatile components in the diamonds, associated garnet and olivine from diamondiferous peridotites from the Udachnaya pipe, Yakutia, Russia (by coupled gas chromatographic-mass spectrometric analysis). Engineering 2019, 5, 471–478. [Google Scholar] [CrossRef]
  24. Sobolev, N.V.; Logvinova, A.M.; Tomilenko, A.A.; Wirth, R.; Bul’bak, T.A.; Luk’yanova, L.I.; Fedorova, E.N.; Reutsky, V.N.; Efimova, E.S. Mineral and fluid inclusions in diamonds from the Urals placers, Russia: Evidence for solid molecular N2 and hydrocarbons in fluid inclusions. Geochim. Cosmochim. Acta 2019, 266, 197–219. [Google Scholar] [CrossRef]
  25. Navon, O.; Wirth, R.; Schmidt, C.; Jablon, B.M.; Schreiber, A.; Emmanuel, S. Solid molecular nitrogen (δ-N2) inclusions in Juina diamonds: Exsolution at the base of the transition zone. Earth Planet. Sci. Lett. 2017, 464, 237–247. [Google Scholar] [CrossRef]
  26. Smith, E.M.; Shirey, S.B.; Nestola, F.; Bullock, E.S.; Wang, J.; Richardson, S.H.; Wang, W. Large gem diamonds from metallic liquid in Earth’s deep mantle. Science 2016, 354, 1403–1405. [Google Scholar] [CrossRef] [PubMed]
  27. Taylor, W.R.; Green, D.H. Measurement of reduced peridotite-COH solidus and implications for redox melting of the mantle. Nature 1988, 332, 349–352. [Google Scholar] [CrossRef]
  28. Litasov, K.D.; Shatskiy, A.; Ohtani, E. Melting and subsolidus phase relations in peridotite and eclogite systems with reduced C-O-H fluid at 3–16 GPa. Earth Planet. Sci. Lett. 2014, 391, 87–99. [Google Scholar] [CrossRef]
  29. Sokol, A.G.; Kupriyanov, I.N.; Tomilenko, A.A.; Bul’bak, T.A.; Palyanov, Y.N.; Sobolev, N.V. Formation of water-bearing defects in olivine in the presence of water–hydrocarbon fluid at 6.3 GPa and 1200 °C. Dokl. Earth Sci. 2018, 483, 1451–1453. [Google Scholar] [CrossRef]
  30. Matjuschkin, V.; Woodland, A.B.; Frost, D.J.; Yaxley, G.M. Reduced methane-bearing fluids as a source for diamond. Sci. Rep. 2020, 10, 6961. [Google Scholar] [CrossRef]
  31. Sokol, A.G.; Kupriyanov, I.N.; Palyanov, Y.N. Partitioning of H2O between olivine and carbonate–silicate melts at 6.3 GPa and 1400 °C: Implications for kimberlite formation. Earth Planet. Sci. Lett. 2013, 383, 58–67. [Google Scholar] [CrossRef]
  32. Yang, X.; Liu, D.; Xia, Q. CO2-induced small water solubility in olivine and implications for properties of the shallow mantle. Earth Planet. Sci. Lett. 2014, 403, 37–47. [Google Scholar] [CrossRef]
  33. Doucet, L.S.; Ionov, D.A.; Golovin, A.V. The origin of coarse garnet peridotites in cratonic lithosphere: New data on xenoliths from the Udachnaya kimberlite, central Siberia. Contrib. Mineral. Petrol. 2013, 165, 1225–1242. [Google Scholar] [CrossRef]
  34. Ballhaus, C.; Berry, R.F.; Green, D.H. High pressure experimental calibration of the olivine-orthopyroxene-spinel oxygen geobarometer: Implications for the oxidation state of the upper mantle. Contrib. Mineral. Petrol. 1991, 107, 27–40. [Google Scholar] [CrossRef]
  35. Foley, S.F. A reappraisal of redox melting in the Earth’s mantle as a function of tectonic setting and time. J. Petrol. 2011, 52, 1363–1391. [Google Scholar] [CrossRef]
  36. Stagno, V.; Frost, D.J. Carbon speciation in the asthenosphere: Experimental measurements of the redox conditions at which carbonate-bearing melts coexist with graphite or diamond in peridotite assemblages. Earth Planet. Sci. Lett. 2010, 300, 72–84. [Google Scholar] [CrossRef]
  37. Sokol, A.G.; Tomilenko, A.A.; Bul’bak, T.A.; Palyanova, G.A.; Sokol, I.A.; Palyanov, Y.N. Carbon and nitrogen speciation in N-poor C-O-H-N fluids at 6.3 GPa and 1100–1400 °C. Sci. Rep. 2017, 7, 706. [Google Scholar] [CrossRef]
  38. Palyanov, Y.N.; Kupriyanov, I.N.; Khokhryakov, A.F.; Borzdov, Y.M. High-pressure crystallization and properties of diamond from magnesium-based catalysts. CrystEngComm 2017, 19, 4459–4475. [Google Scholar] [CrossRef]
  39. Sokol, A.G.; Borzdov, Y.M.; Palyanov, Y.N.; Khokhryakov, A.F. High-temperature calibration of a multi-anvil high-pressure apparatus. High Press. Res. 2015, 35, 139–147. [Google Scholar] [CrossRef]
  40. Asimow, P.D.; Stein, L.C.; Mosenfelder, J.L.; Rossman, G.R. Quantitative polarized infrared analysis of trace OH in populations of randomly oriented mineral grains. Am. Miner. 2006, 91, 278–284. [Google Scholar] [CrossRef]
  41. Withers, A.C.; Bureau, H.; Raepsaet, C.; Hirschmann, M.M. Calibration of infrared spectroscopy by elastic recoil detection analysis of H in synthetic olivine. Chem. Geol. 2012, 334, 92–98. [Google Scholar] [CrossRef]
  42. Wyllie, P.J.; Ryabchikov, I.D. Volatile components, magmas, and critical fluids in upwelling mantle. J. Petrol. 2000, 41, 1195–1206. [Google Scholar] [CrossRef]
  43. Huizenga, J.M.; Crossingham, A.; Viljoen, F. Diamond precipitation from ascending reduced fluids in the Kaapvaal lithosphere: Thermodynamic constraints. Compt. Rendus Geosci. 2012, 344, 67–76. [Google Scholar] [CrossRef]
  44. Sokol, A.G.; Tomilenko, A.A.; Bul’bak, T.A.; Kruk, A.N.; Sokol, I.A.; Palyanov, Y.N. Fate of fluids at the base of subcratonic lithosphere: Experimental constraints at 5.5–7.8 GPa and 1150–1350 °C. Lithos 2018, 318, 419–433. [Google Scholar] [CrossRef]
  45. Walker, A.M.; Hermann, J.; Berry, A.J.; O’Neill, H.S.C. Three water sites in upper mantle olivine and the role of titanium in the water weakening mechanism. J. Geophys. Res. Solid Earth 2007, 112, B052112007. [Google Scholar] [CrossRef]
  46. Berry, A.J.; O’Neill, H.S.C.; Hermann, J.; Scott, D.R. The infrared signature of water associated with trivalent cations in olivine. Earth Planet. Sci. Lett. 2007, 261, 134–142. [Google Scholar] [CrossRef]
  47. Berry, A.J.; Hermann, J.; O’Neill, H.S.; Foran, G.J. Fingerprinting the water site in mantle olivine. Geology 2005, 33, 869–872. [Google Scholar] [CrossRef]
  48. Bell, D.; Rossman, G.; Maldener, J.; Endisch, D.; Rauch, F. Hydroxide in olivine: A quantitative determination of the absolute amount and calibration of the IR spectrum. J. Geophys. Res. 2003, 108, 2105. [Google Scholar] [CrossRef]
  49. Kovacs, I.; O’Neill, H.S.; Hermann, J.; Hauri, E.H. Site-specific infrared O-H absorption coefficients for water substitution into olivine. Am. Miner. 2010, 95, 292–299. [Google Scholar] [CrossRef]
  50. Balan, E.; Ingrin, J.; Delattre, S.; Kovacs, I.; Blanchard, M. Theoretical infrared spectrum of OH-defects in forsterite. Eur. J. Miner. 2011, 23, 285–292. [Google Scholar] [CrossRef]
  51. Matveev, S.; Stachel, T. FTIR spectroscopy of OH in olivine: A new tool in kimberlite exploration. Geochim. Cosmochim. Acta 2007, 71, 5528–5543. [Google Scholar] [CrossRef]
  52. Burke, E.A.J. Raman microspectrometry of fluid inclusions. Lithos 2001, 55, 139–158. [Google Scholar] [CrossRef]
  53. Rutt, H.N.; Nicola, J.H. Raman-spectra of carbonates of calcite structure. J. Phys. C Solid State Phys. 1974, 7, 4522–4528. [Google Scholar] [CrossRef]
  54. Rividi, N.; van Zuilen, M.; Philippot, P.; Menez, B.; Godard, G.; Poidatz, E. Calibration of carbonate composition using micro-Raman analysis: Application to planetary surface exploration. Astrobiology 2010, 10, 293–309. [Google Scholar] [CrossRef] [PubMed]
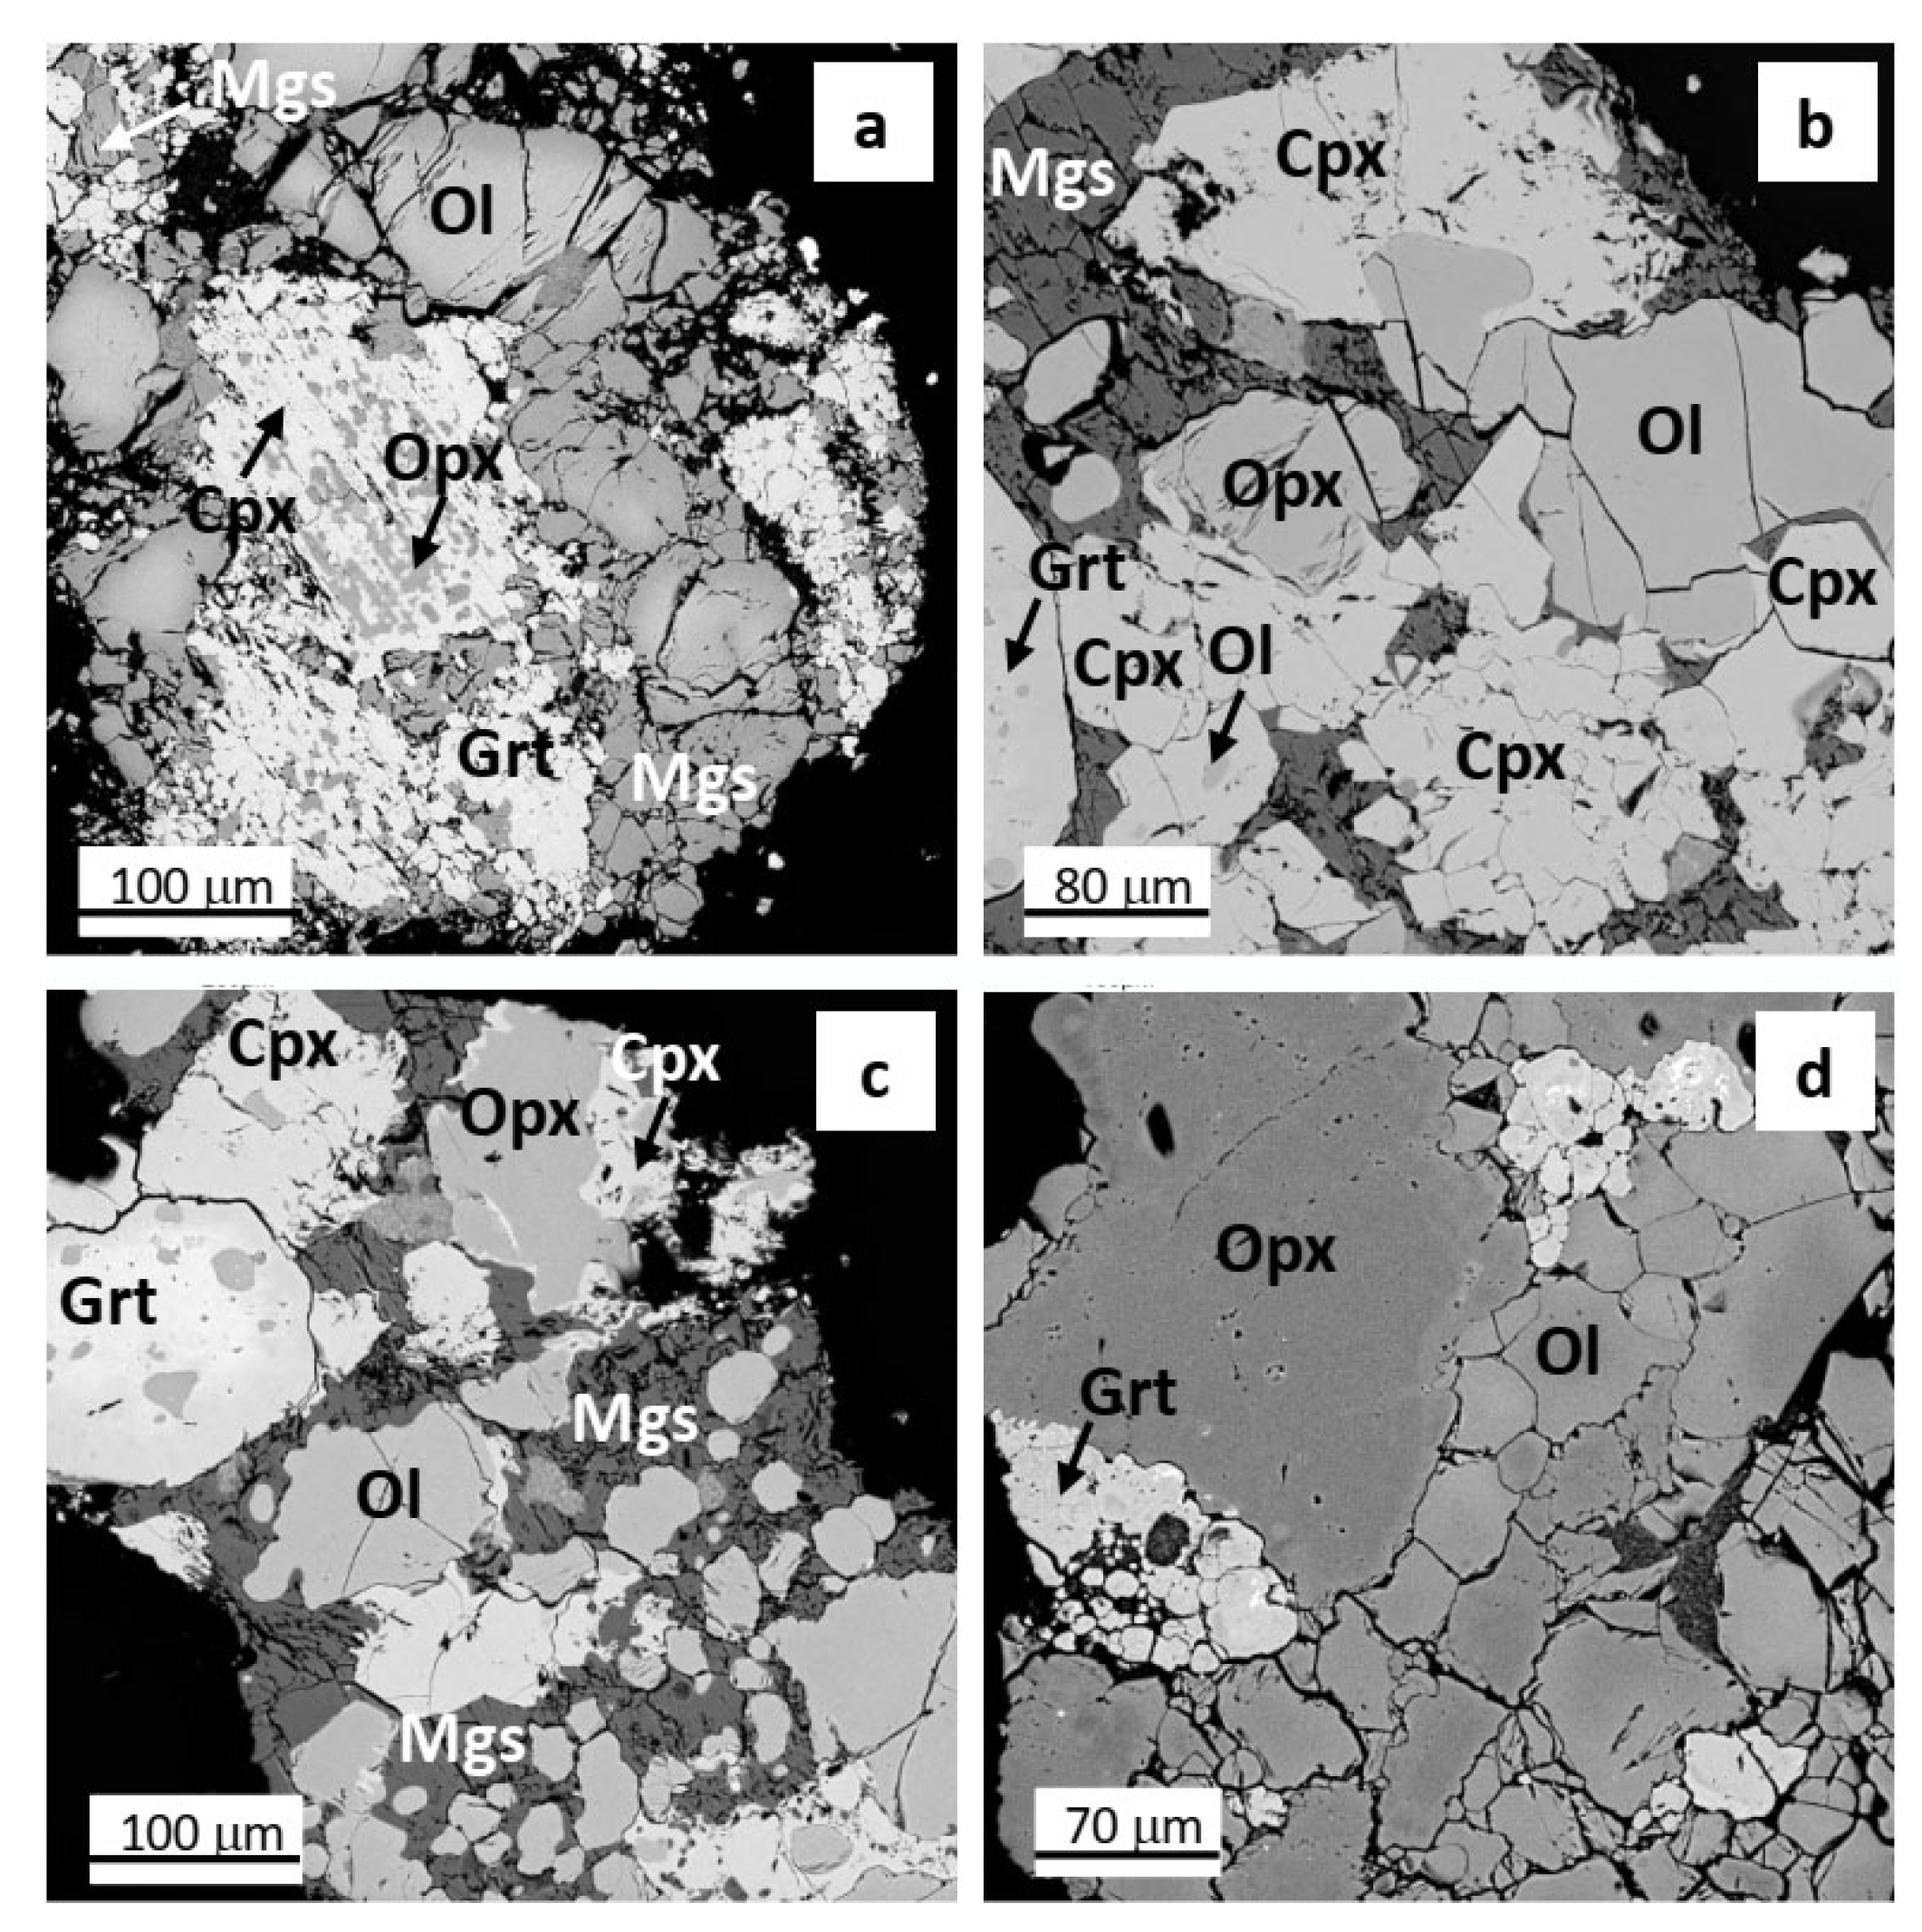
Figure 1. SEM images of the samples produced in the experiments: (a) HC-SA 3; (b) HC-SA 4; (c) HC-SA 5; (d) HC-SA 7.
Minerals 14 00119 g001
Figure 2. Polarized IR spectra recorded along principal axes for olivines from the original harzburgite, Uv419-09. The spectra are shifted vertically for clarity.
Minerals 14 00119 g002
Figure 3. Polarized IR spectra recorded along principal axes for olivines from run HC-SA 1. The spectra are shifted vertically for clarity.
Minerals 14 00119 g003
Figure 4. Polarized IR spectra recorded along the a axes for olivines recovered from the (a) HC-SA 3 (addition of MgCO3) and (b) HC-SA 7 (addition of Fe2O3) experiments. The spectra are shifted vertically for clarity.
Minerals 14 00119 g004
Figure 5. Optical micrographs of crystallized olivines demonstrating different types of inclusions. (a) Run HC-SA 1. (b) Run HC-SA 7.
Minerals 14 00119 g005
Figure 6. Raman spectra measured for inclusions in crystallized olivines. (a) Run HC-SA 1. (b) Run HC-SA 7; (1)—inclusion, (2)—olivine matrix.
Minerals 14 00119 g006
Table 1. The chemical composition of peridotite Uv-419/09 and the starting compositions of the experimental systems (wt.%).
Uv-419/09HC-SA 1HC-SA 2HC-SA 3HC-SA 4HC-SA 5HC-SA 6HC-SA 7
SiO245.141.2843.9235.2235.6441.3737.3239.99
TiO20.0450.040.040.040.040.040.040.04
Al2O310.920.970.780.790.920.830.89
Cr2O30.4090.370.40.320.320.380.340.36
FeO6.66.046.435.155.226.055.465.85
Fe2O3------9.487.12
MnO0.1120.10.110.090.090.10.090.1
MgO4440.2742.8542.0242.2942.1436.4139.02
CaO1.371.251.332.072.061.491.131.21
Na2O0.190.170.190.150.150.170.160.17
K2O0.390.360.380.30.310.360.320.35
NiO0.2980.270.290.230.240.270.250.026
P2O50.0110.010.010.010.010.010.010.01
Total99.591.0896.9286.3787.1593.3191.8495.37
C18H36O2-8.472.614.113.54.137.764.21
CO2---9.158.982.12--
Table 2. Starting compositions of experimental charges and phase compositions of the samples after experiments at 5.5 GPa and 1200 °C for 40 h.
Run No.Harzburgite,
mg
Stearic Acid, mgMgCO3,
mg
Fe2O3,
mg
Outer
Container
Run Products *Estimated ***
Δlog(FMQ)
HC-SA 110.81.0---Ol-Opx-Cpx-Grt−4.8
HC-SA 214.90.4--HM **Ol-Opx-Cpx-Grt−2.4
HC-SA 322.81.25.2-HMOl-Opx-Cpx-Grt-Mgs−1.7
HC-SA 411.30.52.5-HMOl-Opx-Cpx-Grt-Mgs−1.7
HC-SA 511.10.50.5-HMOl-Opx-Cpx-Grt-Mgs−1.7
HC-SA 69.60.9-1.1-Ol-Opx-Cpx-Grt−2.4
HC-SA 727.41.3-2.2-Ol-Opx-Grt + L−1.5
* Pt capsules with graphite linings were used in all experiments; therefore, graphite was present in all capsules. ** Fe2O3 from the outer container was partly reduced during experiments to Fe3O4. Association of Fe2O3 and Fe3O4 controlled fH2 around the Pt capsules at the level of the hematite-magnetite (HM) buffer. The presence of an external HM buffer completely blocked the influx of hydrogen through the walls of the Pt capsules from the outside but ensured its outflow from the samples. This led to a slight oxidation of the graphite and some increase in the concentration of CO2 in the system, which was involved in olivine carbonation. *** Estimations were made based on the phase composition of the samples and the composition of quenched fluid determined by GC-MS. FMQ and IW according to [34], carbon-saturated water maximum [35], and Ca-free- and Ca-bearing EMOG [36].
Table 3. Chemical composition of minerals from the original harzburgite, Uv-419/09, and mineral phases produced in the experiments.
Run No.PhasenSiO2TiO2Al2O3Cr2O3FeOMnONiOMgOCaONa2OK2OTotalMg#Ca#
Uv-419/09Ol741.4---9.20.30.350.0---101.10.91-
Opx858.2--0.24.7--36.90.4--100.30.930.1
Cpx956.80.5-0.72.3--16.522.91.0-100.90.930.67
Grt741.4-18.47.87.80.4-18.37.0--101.10.810.25
Phl643.30.58.10.97.0--26.2-0.310.496.80.87-
HC-SA 1Ol941.7---7.8-0.550.9---100.80.92-
Opx859.4--0.24.7--36.30.3--100.90.930.01
Cpx656.10.22.51.52.60.2-18.018.02.2-101.20.930.56
Grt1041.70.518.15.76.90.3-22.45.6--100.30.850.18
HC-SA 2Ol741.1--0.27.7-0.551.5---101.00.92-
Opx959.5--0.24.8--36.40.4--101.30.930.01
Cpx855.90.42.41.32.70.2-18.417.52.0-100.90.920.54
Grt641.30.418.07.57.30.40.319.16.9--101.10.820.25
HC-SA 3Ol742.0---5.40.10.352.20.2--100.30.95-
Opx558.3-0.70.51.5--38.50.8--100.30.980.02
Cpx855.1-0.80.90.8--18.823.70.2-100.10.980.65
Grt942.1-18.36.82.10.2-21.68.0--99.20.950.28
HC-SA 4Ol741.7---7.0-0.351.3---100.20.93-
Cpx755.7-0.70.62.1--19.422.10.4-100.90.940.61
Grt842.50.219.65.55.60.2-21.06.6--101.10.870.23
Mgs9----3.90.20.341.22.3--47.80.950.05
HC-SA 5Ol841.6---7.1-0.351.3 --100.30.93-
Opx759.0-0.60.33.7--36.40.8--100.70.950.02
Cpx756.5-0.80.52.3--19.220.50.4-100.10.940.58
Grt841.1-15.910.74.90.3-18.58.8--100.10.870.32
Mgs8----3.5--42.32.9--48.70.960.06
HC-SA 6Ol (w)541.4---7.6-0.550.5---100.00.92-
Ol (y)540.8---14.5-0.444.4---100.10.85-
Opx757.7-0.20.25.00.2-36.50.4--100.10.930.01
Cpx855.3-1.21.14.1--18.719.21.1-100.60.890.55
Grt940.90.318.66.48.80.3-19.06.7--101.00.790.23
HC-SA 7Ol (w)840.5---10.80.20.249.0---100.70.89-
Ol (y)640.4---14.0-0.145.4---100.00.85-
Opx859.0-0.30.44.7--36.20.4--101.00.930.01
Grt741.40.217.47.97.30.3-19.66.2--100.40.830.22
L *44.6-0.4-5.20.1-21.415.50.51.449.10.880.31
n—number of analyses; Mg# = molar MgO/(MgO + FeO); Ca# = molar CaO/(CaO + MgO + FeO). Ol (w) and Ol (y) denote, respectively, colorless and yellow-colored olivines recovered from experiments with the addition of Fe2O3. * Segregations of the quenched melt with sizes of up to 10 µm.
Table 4. Composition of quenched fluid according to GC-MS (rel.%).
HC-SA 1HC-SA 2HC-SA 3HC-SA 4HC-SA 5HC-SA 6HC-SA 7
Main components
H2O55.072.484.783.473.586.186.7
CO28.4-2.26.414.2-3.2
CH431.10.29.81.90.212.86.4
C2H65.1-1.5--0.91.6
H2O/(H2O + CO2)0.870.990.970.930.840.990.96
Speciation of organic components *
Alkanes36.53.311.62.91.913.88.1
Olefins-2.40.10.31.0-0.1
Arenas-0.4-0.20.2--
Furans-0.6-0.20.4--
Alcohols and esters-5.00.81.62.3-0.8
Aldehydes-7.00.31.73.0-0.7
Ketones-3.50.10.51.4-0.3
Carboxylic acids-5.40.22.72.3-0.1
* Total content from C1 to C18 is given for every type of organic compound.
Disclaimer/Publisher’s Note: The statements, opinions and data contained in all publications are solely those of the individual author(s) and contributor(s) and not of MDPI and/or the editor(s). MDPI and/or the editor(s) disclaim responsibility for any injury to people or property resulting from any ideas, methods, instructions or products referred to in the content.