Tailings Behavior Assessment Using Piezocone Penetration Test
Abstract
:1. Introduction
2. Materials and Methods
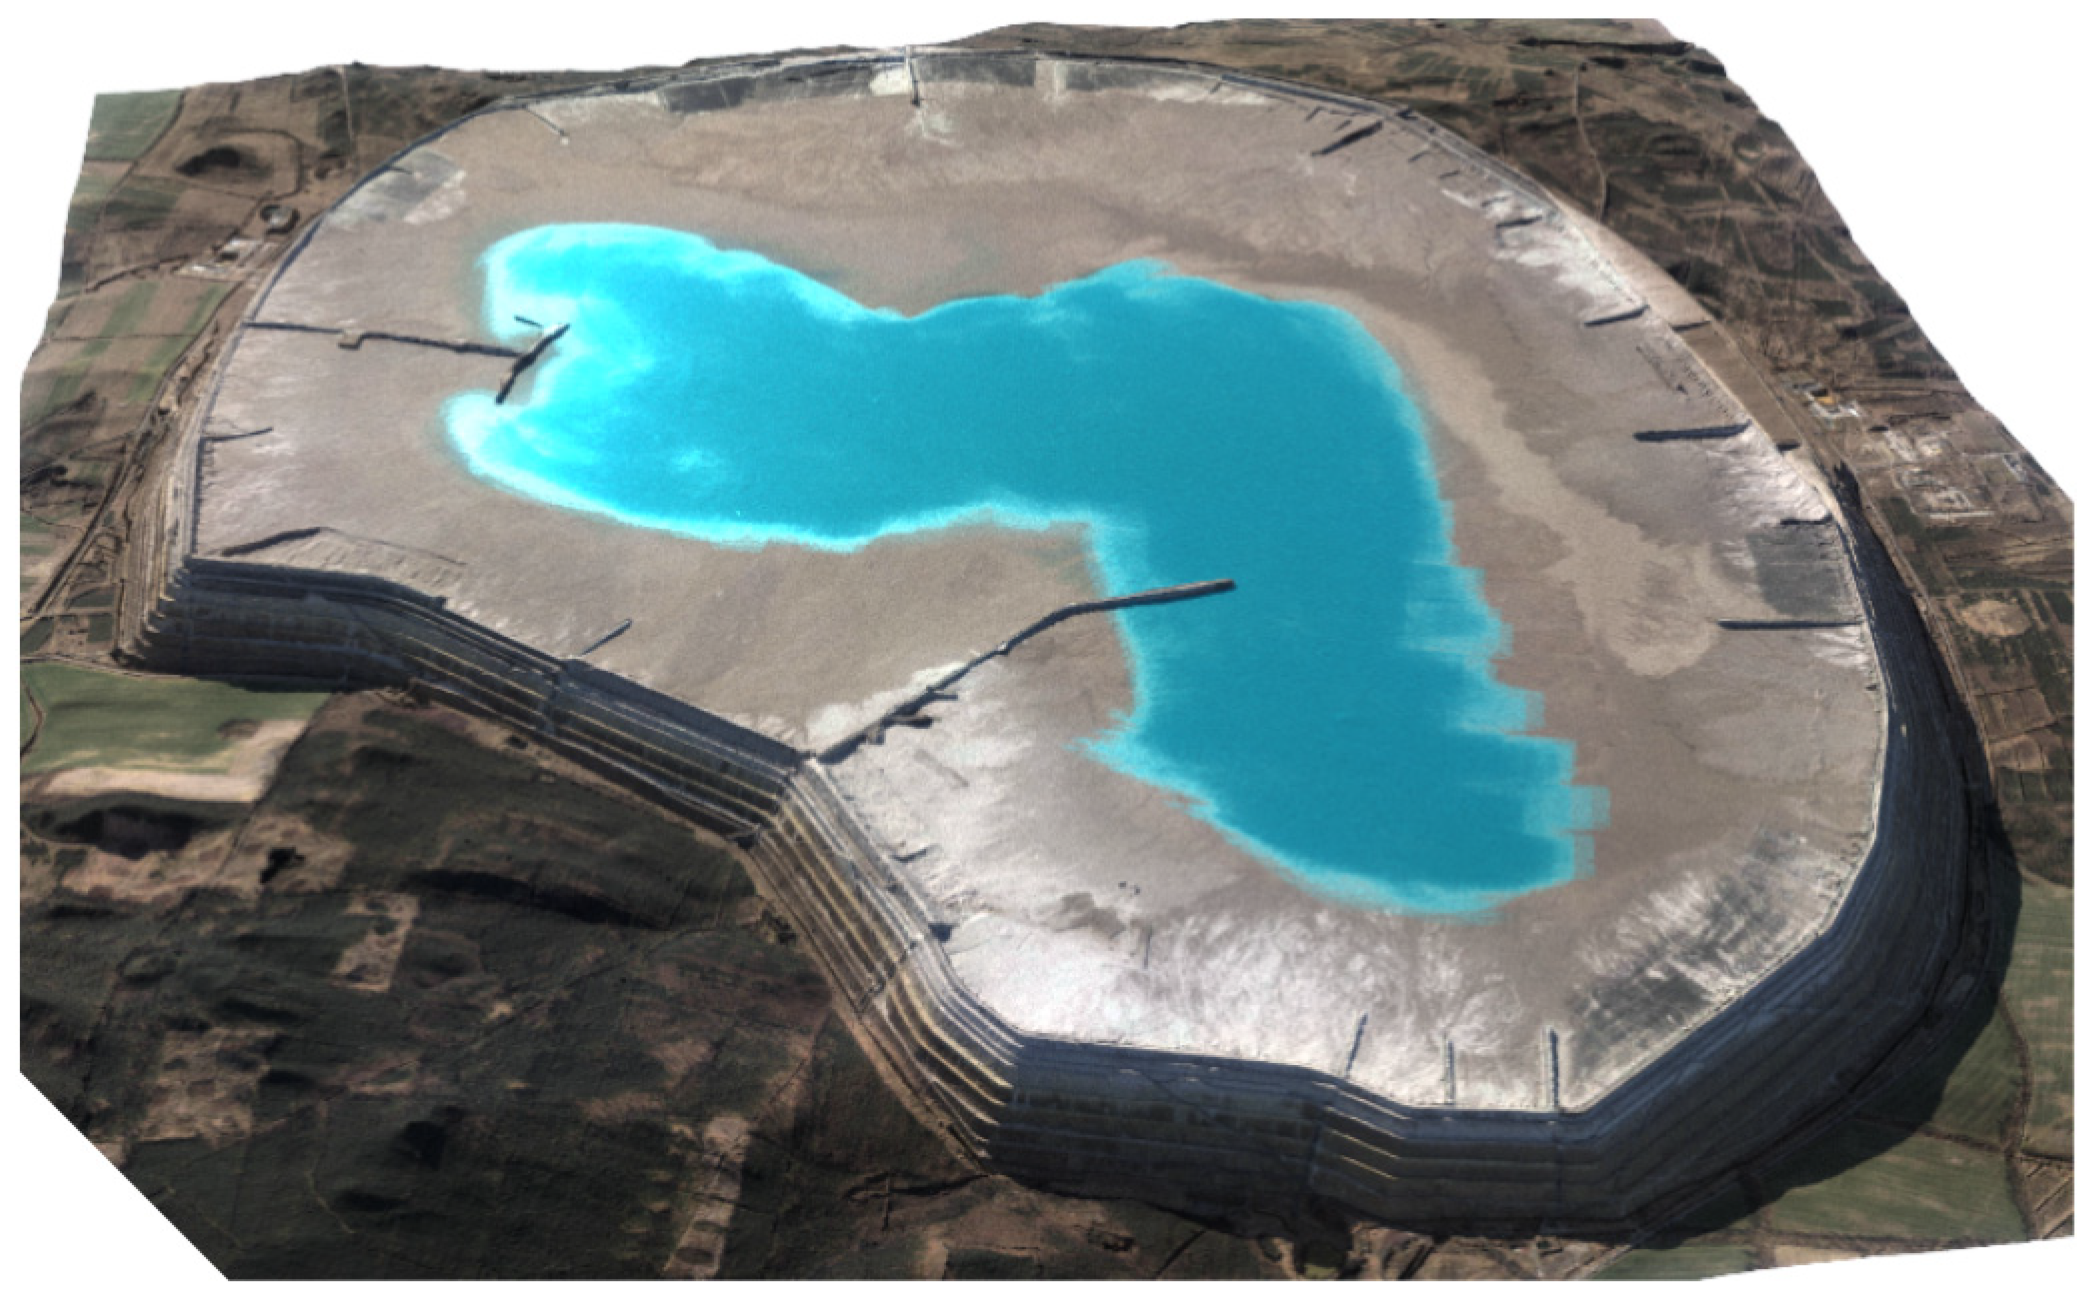
2.1. Study Site
2.2. Tailings Characteristics
2.3. Research Method
2.3.1. Cone Penetration Test
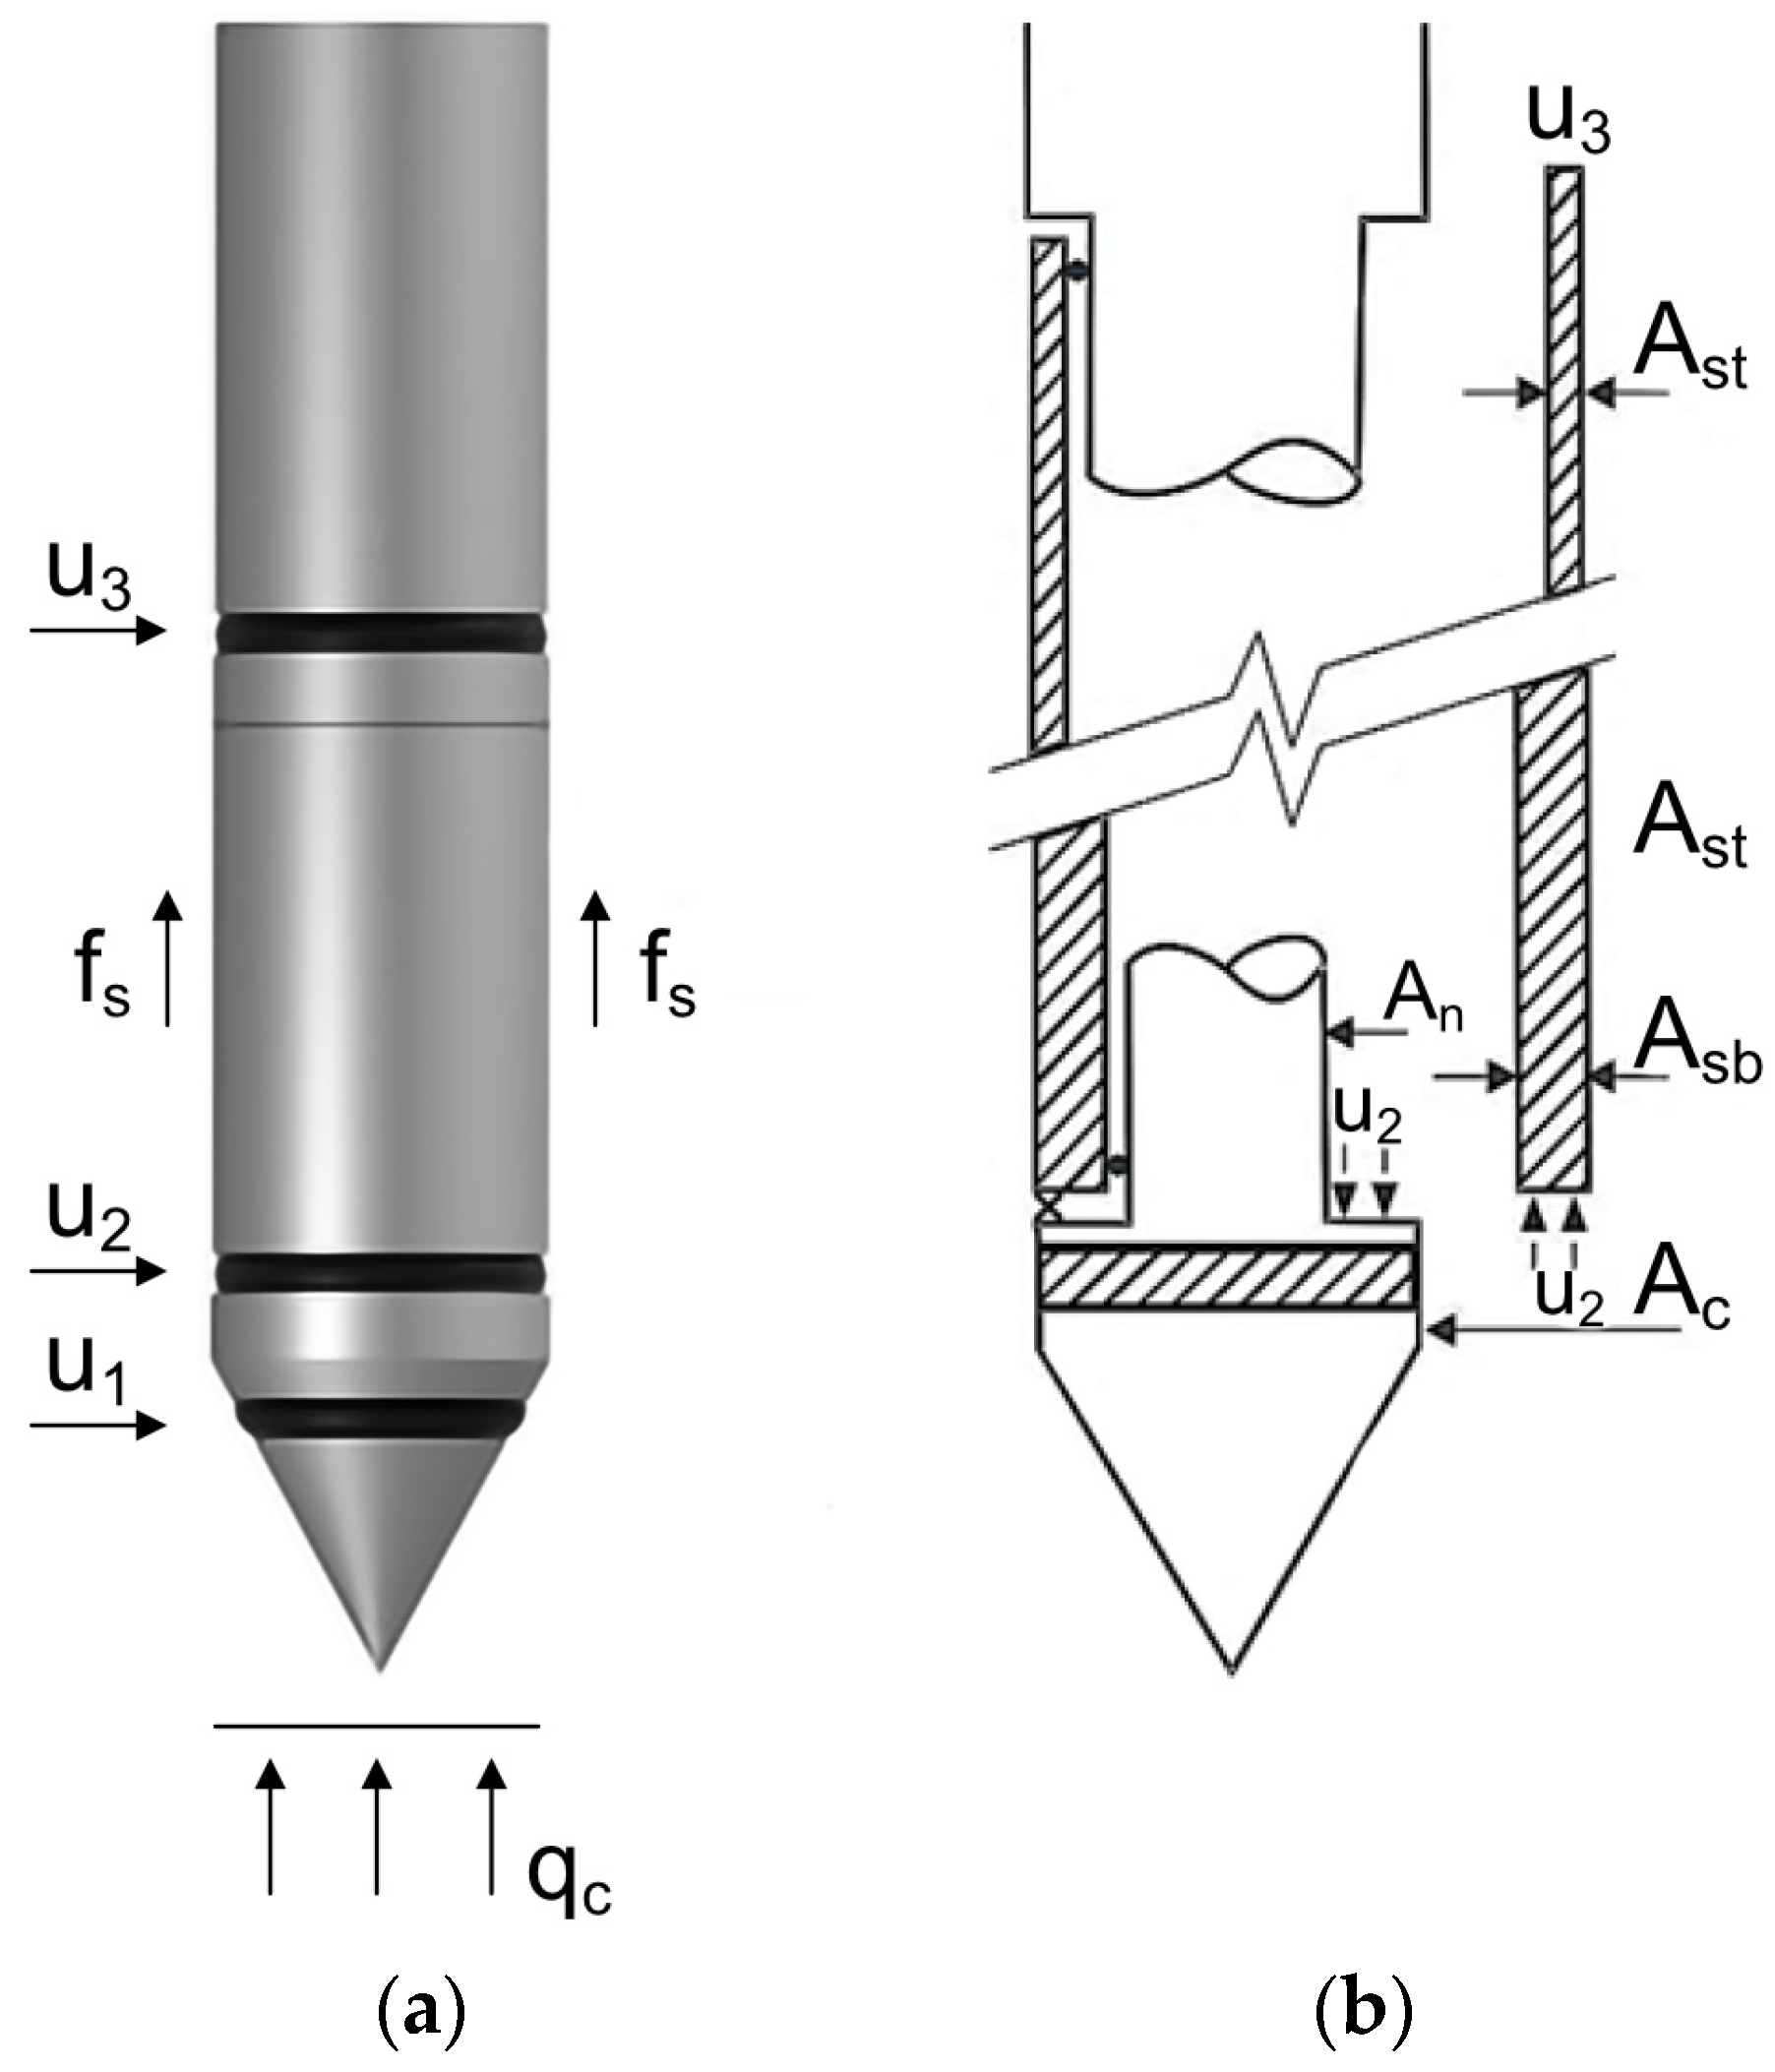
- Parameter recordingDuring the test, fundamental penetration characteristics are continuously recorded: measured cone resistance—qc and unit sleeve friction resistance—fs (Equations (1) and (2), Figure 4).– measured cone resistance qc = Qc/Acwhere: Qc—total force acting on the cone; Ac—cross-sectional area of the cone; Qs—total force acting on friction sleeve; As—friction sleeve surface area.– unit sleeve friction resistance fs = Qs/As
- 2.
- Correction of recorded parametersThe recorded parameters of the qc and fs tests are subject to correction, among other things, due to the cone design (Figure 4b) and its susceptibility to the influence of excess pore water pressure induced during penetration (Equations (3)–(5), Figure 4b) [5,8,23]. Another type of correction results from the stress state (Equation (7)) or a reduction in the parameters to the form of effective parameters (Equations (6) and (8)). The group of corrected parameters also includes the friction ratio—Rf (Equation (9)), which is used in the SBCS (Soil Behavior Classification System).– corrected cone resistance qt = qc + (1 − an) u2where: an = An/Ac,– corrected sleeve friction ft = fs − (u2·Asb − u3·Ast)/As– excess of pore water pressure Δu = uc − u0– net cone resistance qn = qt − σv0– effective cone resistance qe = qt − u2where: an—net area ratio of the cone, u0—in situ pore pressure, σv0—total overburden stress.– friction ratio Rf = (ft/qt) × 100%
- 3.
- Normalization of corrected parametersIn the next step of the interpretative procedure, the corrected parameters undergo normalization to obtain dimensionless coefficients. The normalizing parameter is usually the vertical component of effective or total geostatic stress (Equations (10)–(14)) or the hydrostatic pressure of groundwater (Equations (15) and (16)). Formally, this parameter can also be the reference pressure–atmospheric pressure (Equation (11)).– normalized cone resistance Qt = (qt − σv0) σ′v0– normalized cone resistance, dimensionless qc1 = (qc/pa)(pa/σ′v0)0.5– normalized friction ratio Fr = [fs/(qt − σv0)] × 100%– normalized pore water pressure ut = (uc − u0)/σ′v0– normalized, effective cone resistance Qe = (qt − uc)/σ′v0– pore pressure parameter Bq = (u2 − u0)/qnwhere: σ′v0—effective overburden stress, pa—reference stress (≈100 kPa).– normalized pore water pressure difference NPPD = (u1 − u2)/u0
2.3.2. Modified Cam Clay
3. Results
3.1. Preliminary Assumptions
3.2. Assessing the Settlements of Tailings Based on the Interpretation of CPTU Results.
- –
- Direct method: this involves assessing qualitative changes in penetration curves—graphical method,
- –
- Indirect method: this relies on the quantitative assessment of geotechnical parameters—analytical method.
3.2.1. Direct Method
3.2.2. Indirect Method
- qc
- qt
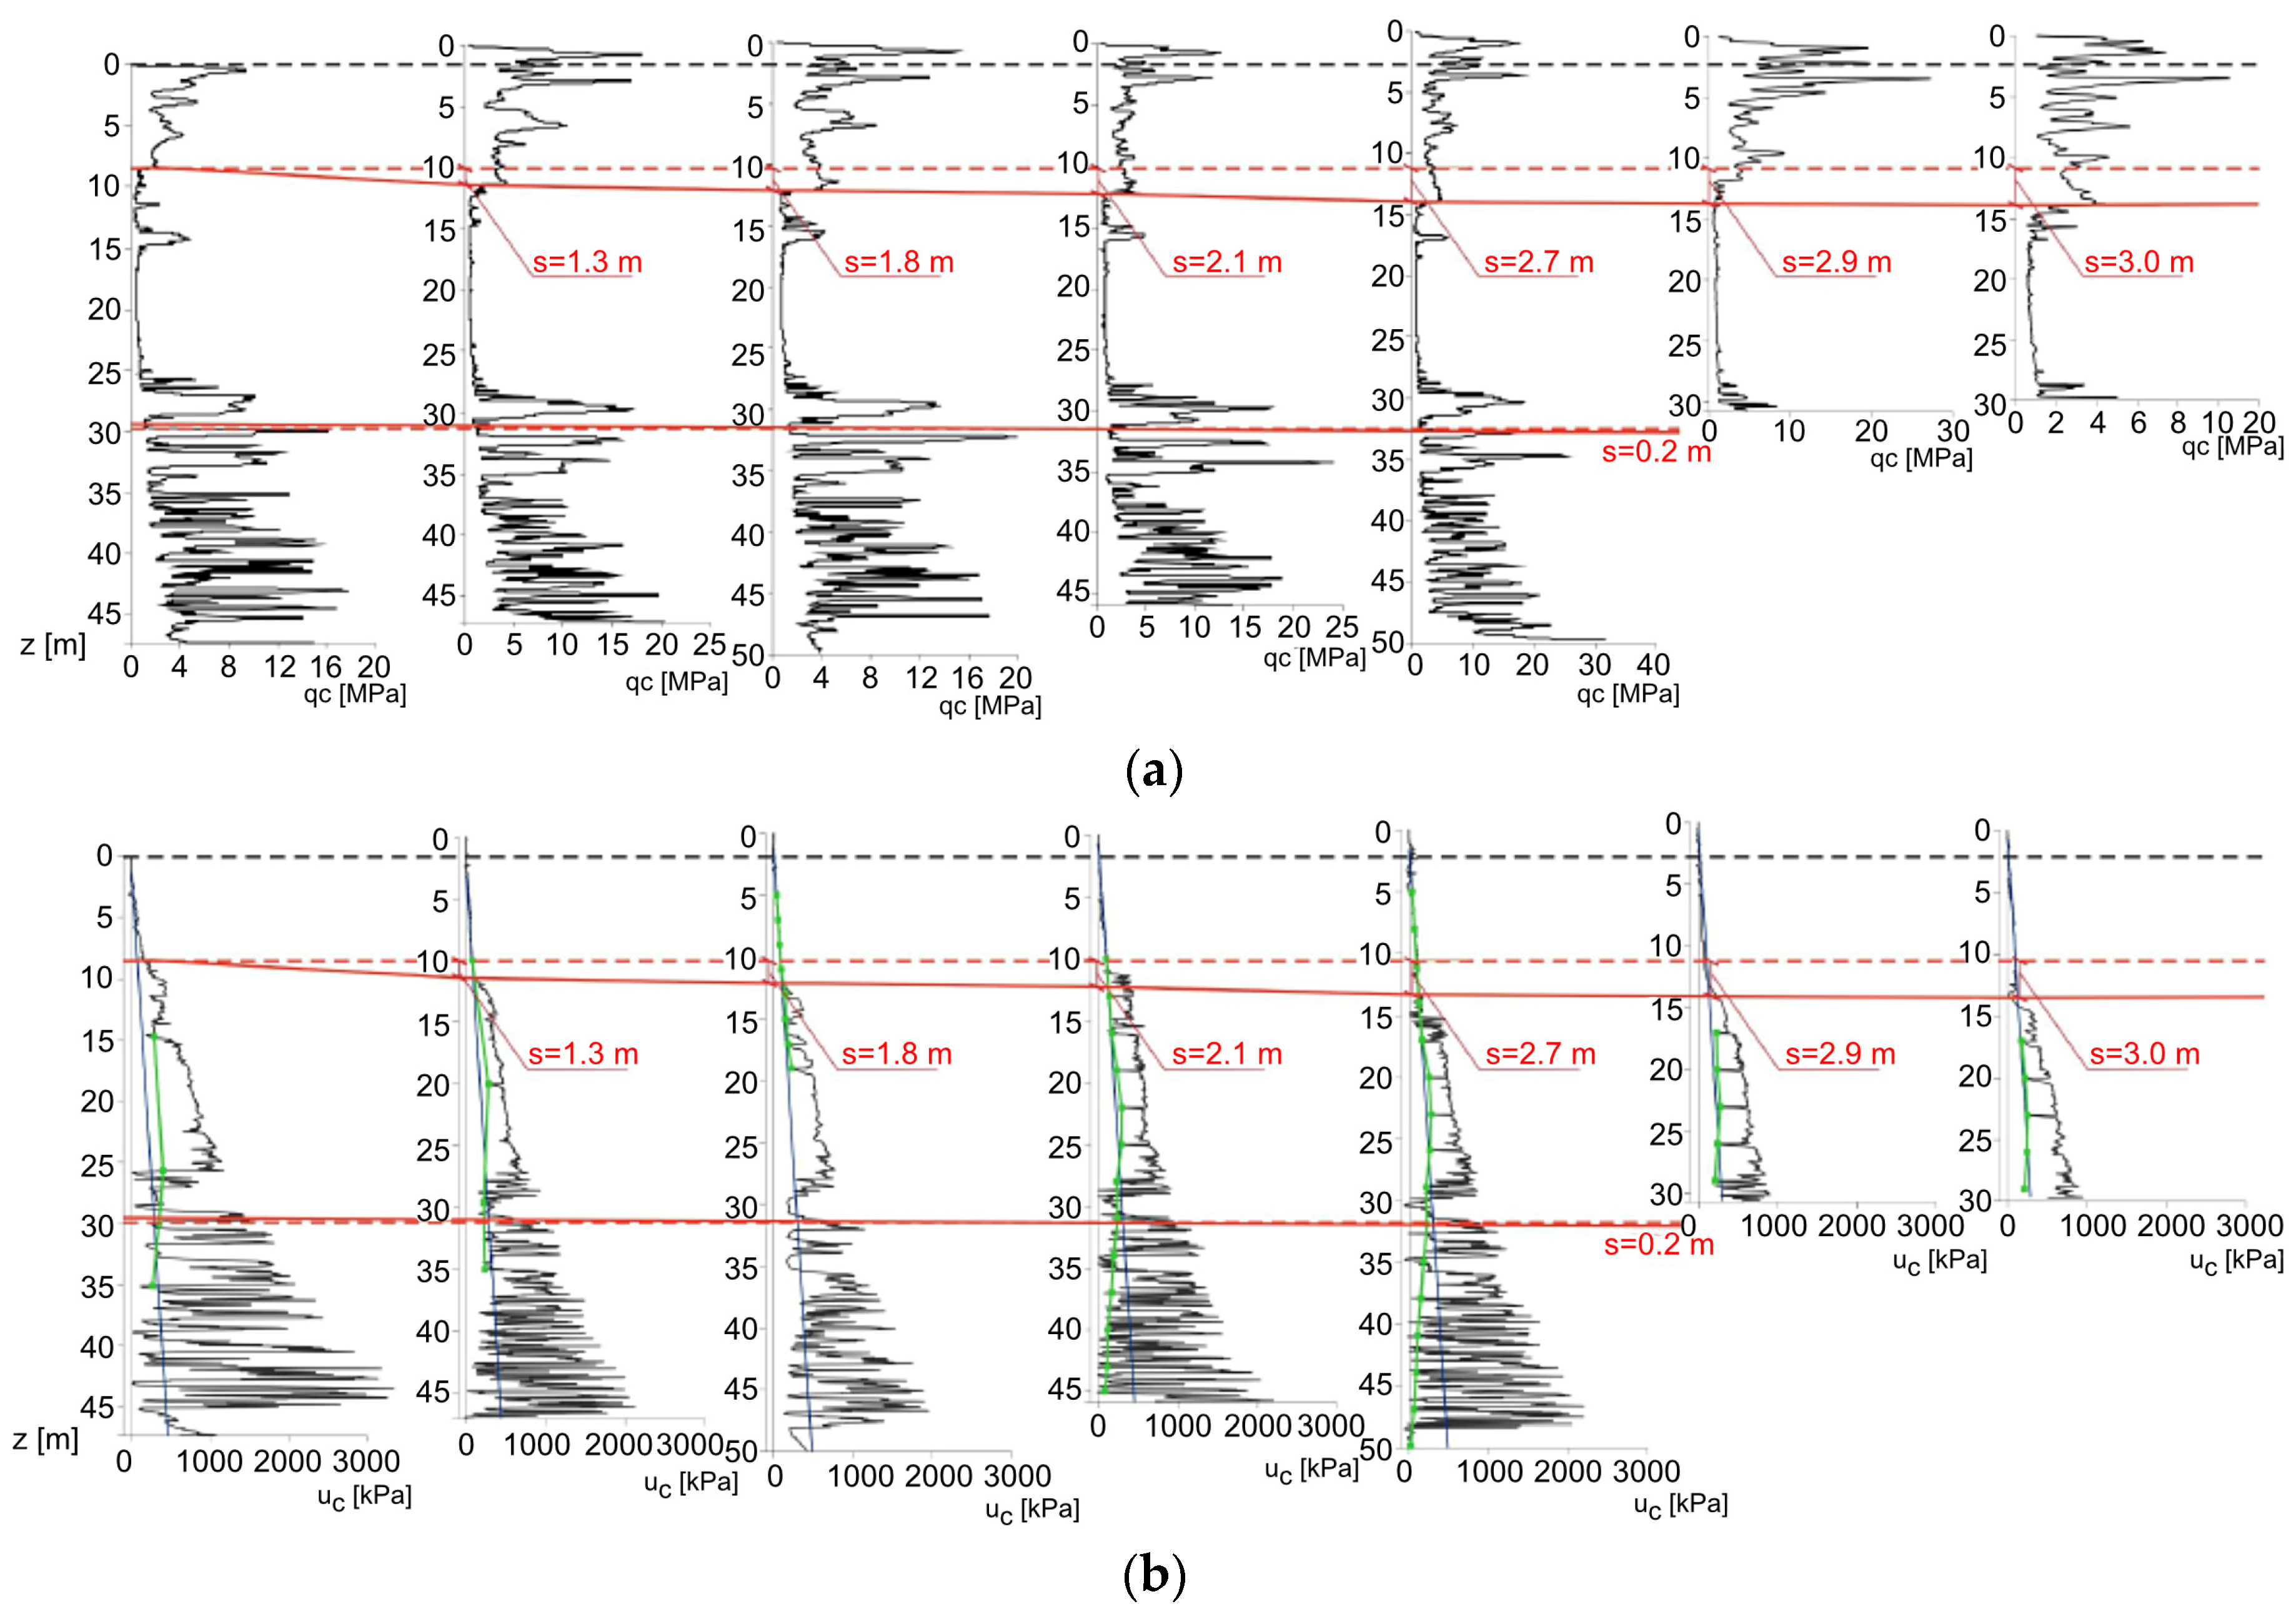
- qnThe next step involves considering two factors determining the cone characteristics: both the influence of the recorded excess of pore water pressure of the tailing on the measured value of cone resistance and the influence of the stress state in the subsoil on the cone resistance. This approach leads to the determination of a more complex but, at the same time, better-fitted relationship (Equation (22), Figure 9c, Table 3).
- ○
- qn > 200 kPaM = 5.03 qn + 1260.71
- ○
- qn < 200 kPaThe above results of linear regression analysis pertain to the part of the qn variable population, where qn > 200 kPa. However, in the range where 0 < qn < 200 kPa, the function takes the form presented by Equation (23) (Figure 9c).M = 160.34 qn0.5

| Intercept | b* | Standard Error b* | b | Standard Error b | t1 | p | |
|---|---|---|---|---|---|---|---|
| qc | - | - | 0.00 | 340.25 | 0.00 | 1.00 | |
| 0.88 | 0.06 | 4.97 | 0.35 | 13.95 | 0.00 | ||
| qt | - | - | 0.00 | 380.07 | 0.00 | 1.00 | |
| 0.86 | 0.07 | 4.24 | 0.33 | 12.54 | 0.00 | ||
| qn | - | - | 1260.71 | 252.71 | 4.99 | 0.00 | |
| 0.90 | 0.06 | 5.03 | 0.33 | 15.13 | 0.00 | ||
| Regression model is statistically significant at the p-level of α = 0.05 | |||||||
| qc | qt | qn | |||||
| Correlation coefficient R | 0.88 | 0.86 | 0.90 | ||||
| Coefficient of determination R2 | 0.78 | 0.74 | 0.81 | ||||
| Coefficient of determination (adjusted) R2 | 0.77 | 0.73 | 0.80 | ||||
| Standard error of estimation Se | ±1292 | ±1402 | ±1212 | ||||
3.3. Modified Cam Clay Verification Model
4. Discussion and Conclusions
- –
- Qualitative assessment, based on the analysis of penetration curve changes;
- –
- Quantitative assessment, parametric assessment.
- –
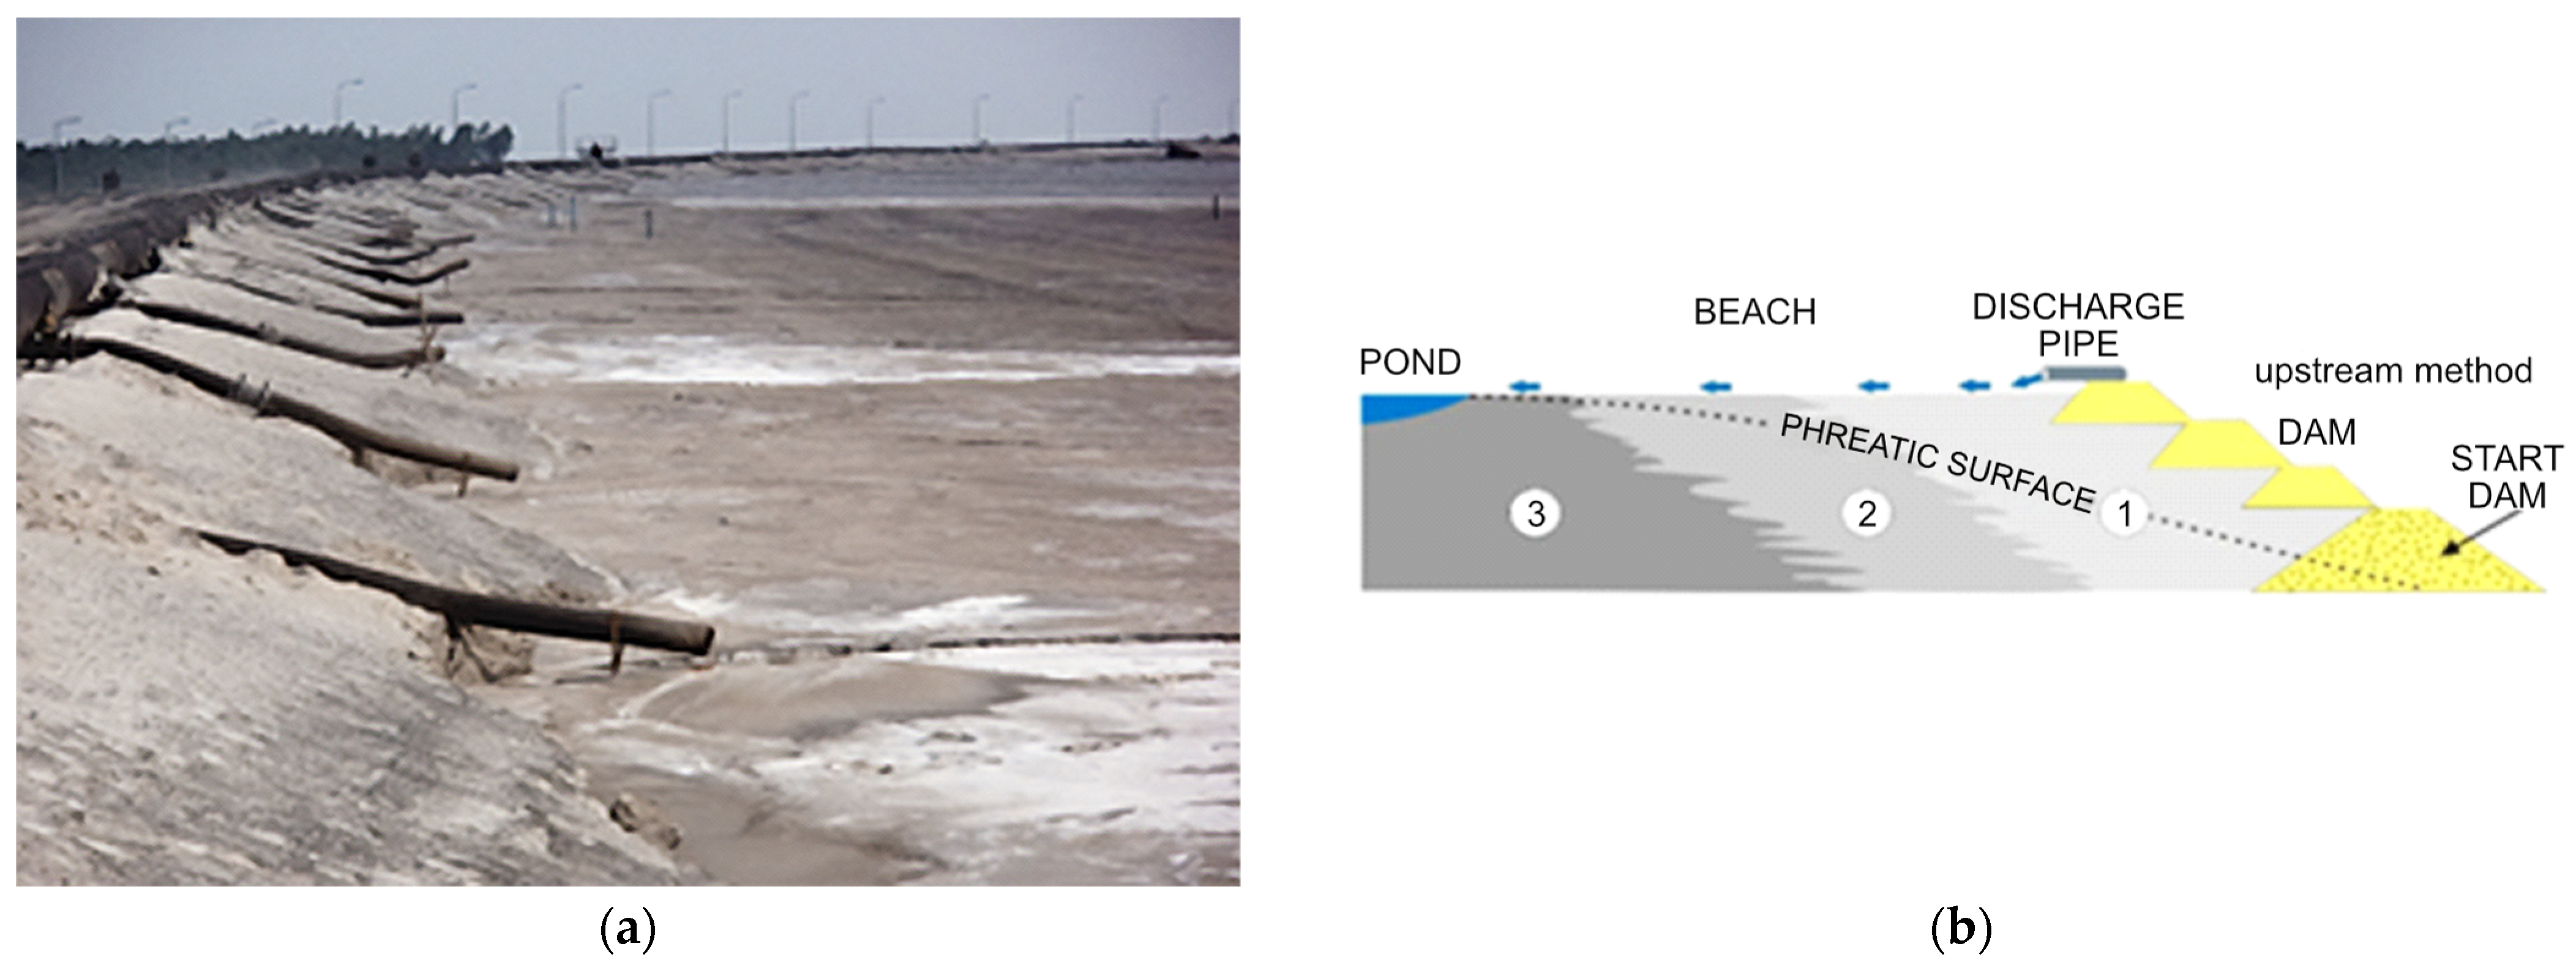
- The lack of a single, universal model for the tailings storage facility arises from (1) the zonal structure of the facility on a global scale and (2) the profile heterogeneity of post-flotation tailings on a local scale. It should be noted that there is no universal method for determining the behavior of tailings under variable conditions.
- –
- Interpretation procedures for the CPTU test are intended for analyzing the results of natural soil investigations. To enhance the validity of interpretative procedures, the distinct characteristics of post-flotation tailings, such as alternative correlational dependencies, should be considered.
- –
- The recommended method for identifying tailings in their disposal site may be the CPTU test; however, it is important to emphasize that this is not a universally applicable method.
- –
- Recommended methods for estimating tailings settlements include the following:
- –
- Based on penetration characteristics from CPTU testing for rigid tailings;
- –
- Using the direct method based on CPTU and numerical modeling for weak tailings. However, it should be noted that the direct method requires experience.
- –
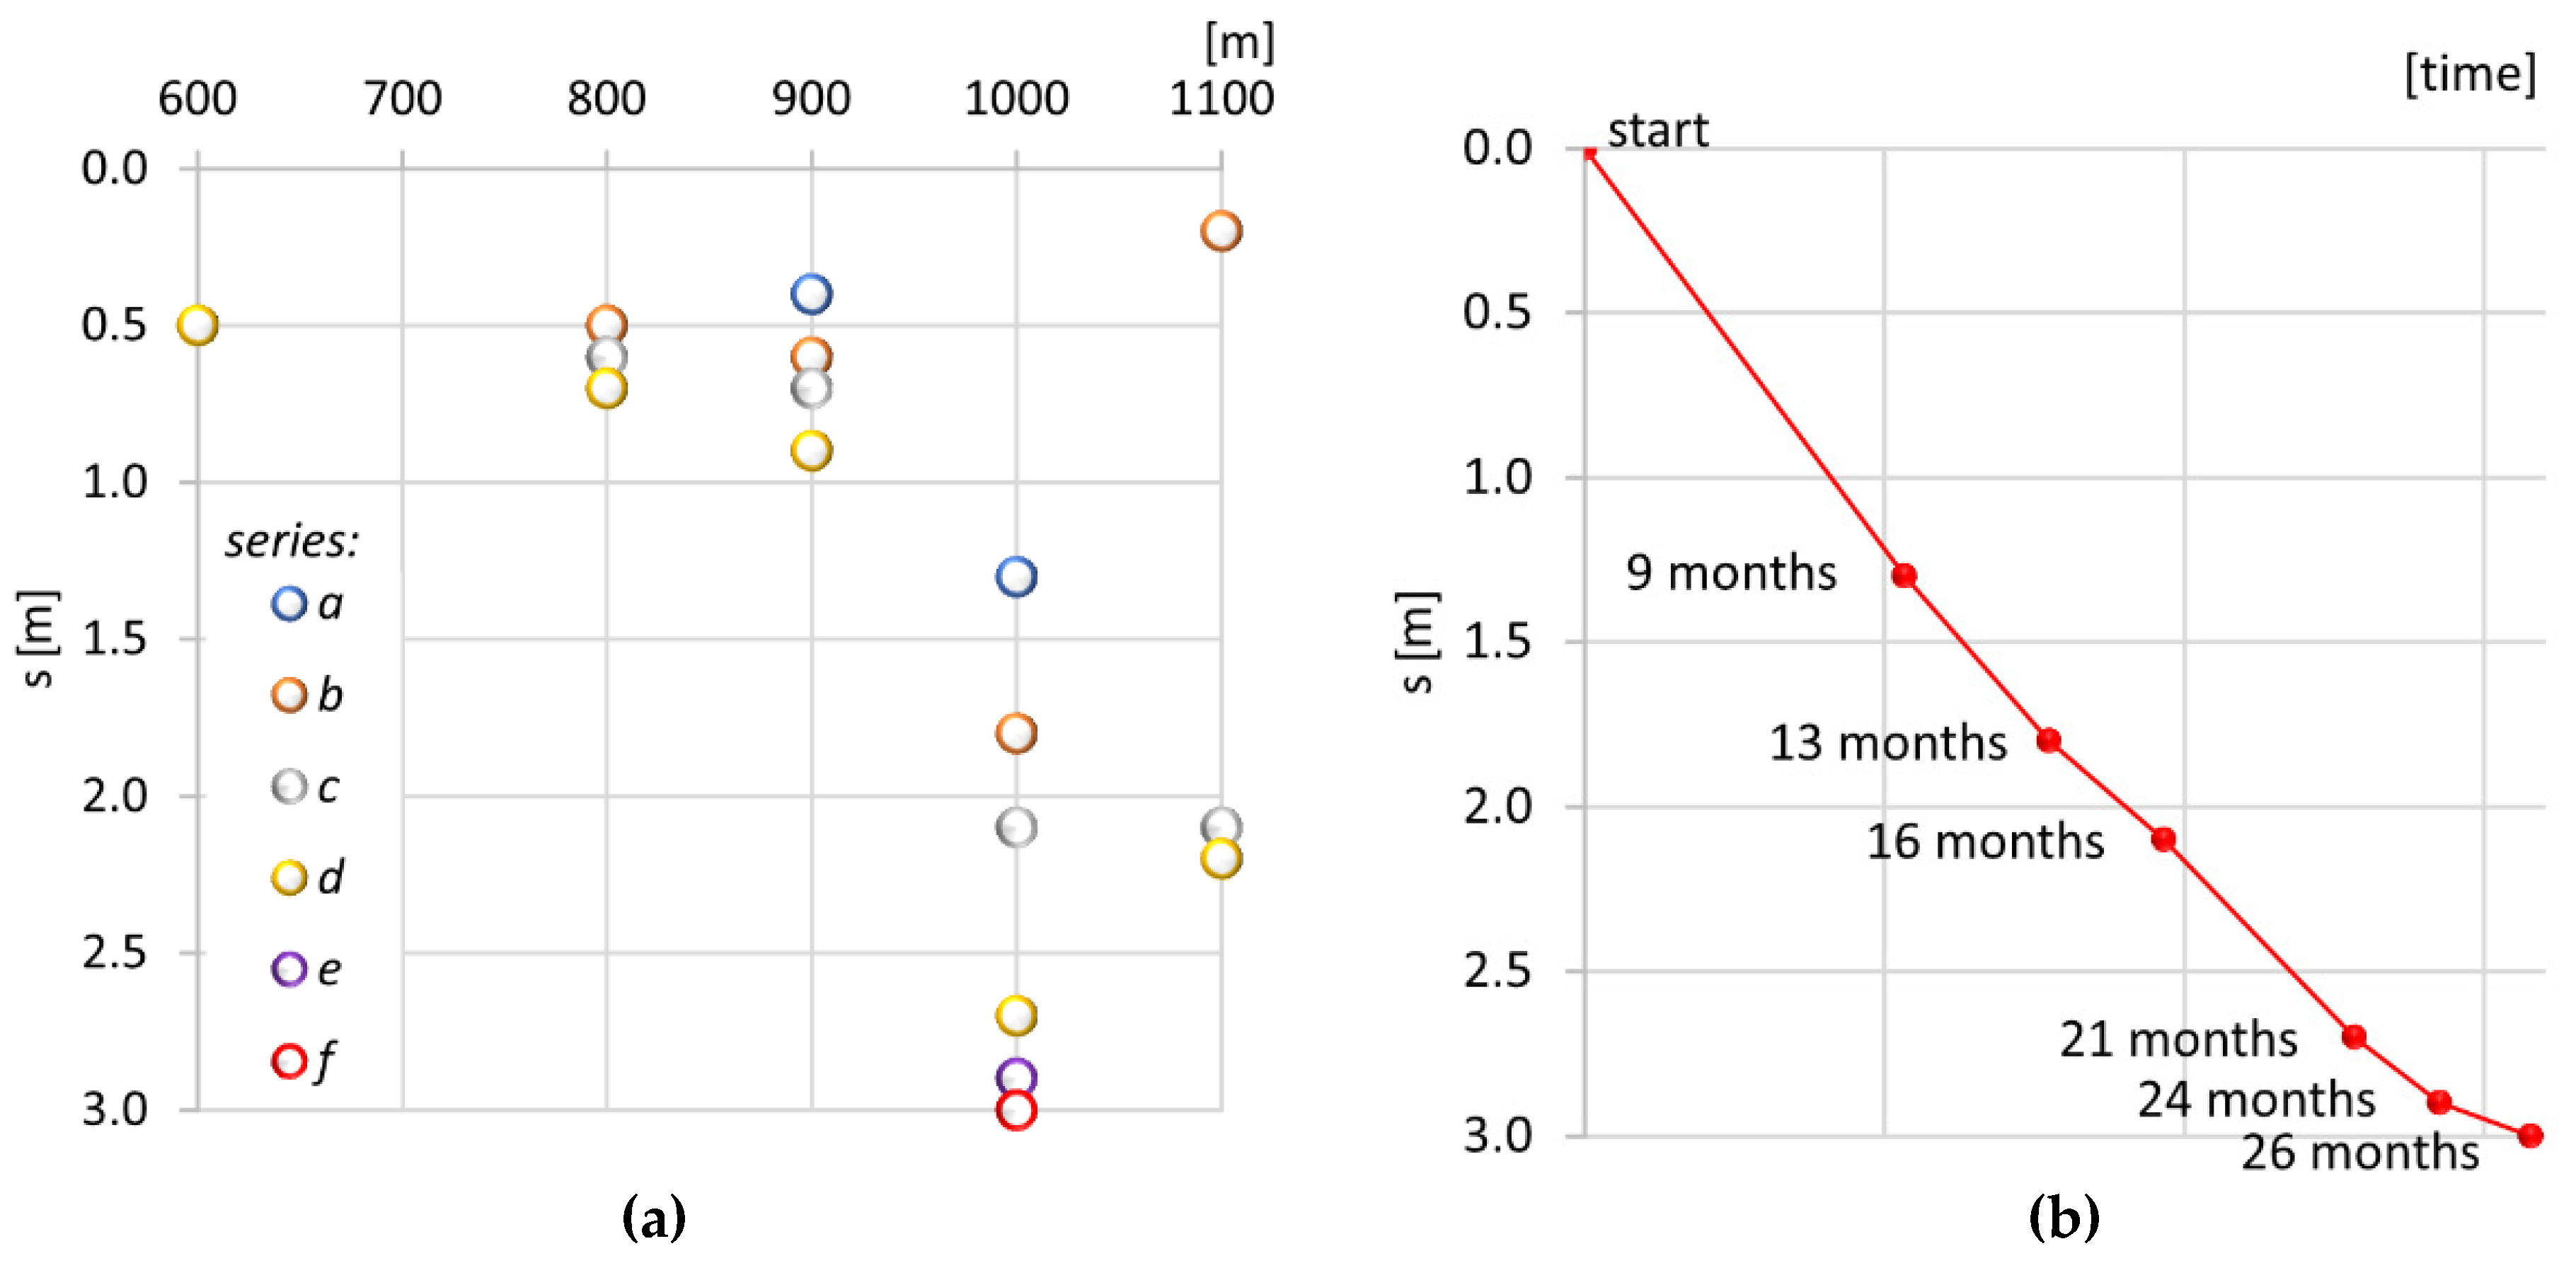
- It is crucial to consider the timeframe in which the tests were conducted. Firstly, the analysis requires specifying a specific period for conducting the research. Secondly, and more importantly, when conducting a comparative analysis, it is essential to standardize the lengths of the periods during which the tests and observations were carried out.
- –
- Future research directions may involve attempting to integrate the results of different, independent research methods, such as the outcomes of the CPTU test and the Marchetti Dilatometer test.
Funding
Data Availability Statement
Conflicts of Interest
References
- Stefaniak, K.; Wróżyńska, M. On possibilities of using global monitoring in effective prevention of tailings storage facilities failures. Environ. Sci. Pollut. Res. 2018, 25, 5280–5297. [Google Scholar] [CrossRef]
- Lin, S.-Q.; Wang, G.-J.; Liu, W.-L.; Zhao, B.; Shen, Y.-M.; Wang, M.-L.; Li, X.-S. Regional Distribution and Causes of Global Mine Tailings Dam Failures. Metals 2022, 12, 905. [Google Scholar] [CrossRef]
- Been, K.; Quiñonez, A.; Sancio, R.B. Interpretation of the CPT in engineering practices. In Proceedings of the 2nd International Symposium on Cone Penetration Testing, Huntington Beach, CA, USA, 9–11 May 2010; pp. 1–19. [Google Scholar]
- Robertson, P.K. Interpretation of cone penetration tests—A unified approach. Can. Geotech. J. 2009, 46, 1337–1355. [Google Scholar] [CrossRef]
- Robertson, P.K.; Cabal, K. Guide to Cone Penetration Testing, 7th ed.; Gregg Drilling LLC: Martinez, CA, USA, 2022; pp. 1–164. [Google Scholar]
- Sanglerat, G. The Penetrometer and Soil Exploration, 1st ed.; Elsevier Science: Amsterdam, The Netherland, 1982; Volume 1, pp. 1–464. [Google Scholar]
- Begemann, H.K. Improved method of determining resistance to adhesion by sounding through a loose sleeve placed behind the cone. In Proceedings of the 3rd ICSMFE, Zurich, Switzerland, 16–27 August 1953; Volume I, pp. 213–217. [Google Scholar]
- Lunne, T.; Robertson, P.K.; Powell, J. Cone Penetration Testing in Geotechnical Practice; Blackie Academic and Professional, CRC Press: London, UK, 1997. [Google Scholar]
- Duan, W.; Congress, S.S.C.; Cai, G.; Liu, S.; Dong, X.; Chen, R.; Liu, X. A hybrid GMDH neural network and logistic regression framework for state parameter–based liquefaction evaluation. Can. Geotech. J. 2021, 58, 12. [Google Scholar] [CrossRef]
- Duan, W.; Congress, S.S.C.; Cai, G.; Zhao, Z.; Pu, S.; Liu, S.; Dong, X.; Wu, M.; Chen, R. Characterizing the in-situ state of sandy soils for liquefaction analysis using resistivity piezocone penetration test. Soil Dyn. Earthq. Eng. 2023, 164, 107529. [Google Scholar] [CrossRef]
- Jamiolkowski, M.; Carrier, W.D.; Chandler, R.J.; Høeg, K.; Świerczyński, W.; Wolski, W. The geotechnical problems of the second world largest copper tailings pond at Zelazny Most, Poland. In Proceedings of the 17th SEAGC South East Asian Geotechnical Conference, Taipei, Taiwan, 10–13 May 2010; Volume 2, pp. 12–27. [Google Scholar]
- Jamiolkowski, M. Soil mechanics and the observational method: Challenges at the Zelazny Most copper tailings disposal facility. Geotechnique 2014, 64, 590–618. [Google Scholar] [CrossRef]
- Świdziński, W.; Tschuschke, W.; Świerczyński, W.; Wolski, W. Tailings Storage Facility Żelazny Most—Significant geotechnical challenge. Mar. Eng. Geotech. 2015, 36, 186–193. [Google Scholar]
- Kroll, M.; Stefaniak, K.; Walczak, M. Determination of efficiency of the circumferential drainage system. J. Ecol. Eng. 2015, 45, 68–74. [Google Scholar] [CrossRef] [PubMed]
- Leiva, E.; Cayazzo, M.; Dávila, L.; Torres, M.; Ledezma, C. Acid Mine Drainage Dynamics from a Paste Tailing Deposit: Effect of Sulfate Content on the Consistency and Chemical Stability after Storage. Metals 2021, 11, 860. [Google Scholar] [CrossRef]
- Tschuschke, W.; Gogolik, S.; Wróżyńska, M.; Kroll, M.; Stefanek, P. The Application of the Seismic Cone Penetration Test (SCPTU) in Tailings Water Conditions Monitoring. Water 2020, 12, 737. [Google Scholar] [CrossRef]
- Mazzanti, P.; Antonielli, B.; Sciortino, A.; Scancella, S.; Bozzano, F. Tracking Deformation Processes at the Legnica Glogow Copper District (Poland) by Satellite InSAR—II: Zelazny Most Tailings Dam. Land 2021, 10, 654. [Google Scholar] [CrossRef]
- Wróżyńska, M. Prediction of Postflotation Tailings Behavior in a Large Storage Facility. Minerals 2021, 11, 362. [Google Scholar] [CrossRef]
- Baran, A.; Śliwka, M.; Lis, M. Selected properties of flotation tailings wastes deposited in the Gilów and Żelazny Most waste reservoirs regarding their potential environmental management. Arch. Min. Sci. 2013, 58, 3. [Google Scholar] [CrossRef]
- Stefaniak, K.; Wróżyńska, M.; Kroll, M. Application of postflotation tailings in hydroengineering structures. J. Ecol. Eng. 2017, 18, 113–118. [Google Scholar] [CrossRef] [PubMed]
- Yu, L.; Zhang, Z.; Huang, X.; Jiao, B.; Li, D. Enhancement Experiment on Cementitious Activity of Copper-Mine Tailings in a Geopolymer System. Fibers 2017, 5, 47. [Google Scholar] [CrossRef]
- Segui, P.; Safhi, A.e.M.; Amrani, M.; Benzaazoua, M. Mining Wastes as Road Construction Material: A Review. Minerals 2023, 13, 90. [Google Scholar] [CrossRef]
- Tschuschke, W.; Wróżyńska, M.; Wierzbicki, J. Quality control for the construction of a tailings dam. Acta Geotech. Slov. 2017, 14, 3–9. [Google Scholar]
- Kaggwa, W.S.; Jha, R.K.; Jaksa, M.B. Use of Dilatometer and Cone Penetration Tests to Estimate Settlements of Footings on Calcareous Sand. In Proceedings of the 7th Australia New Zealand Conference on Geomechanics: Geomechanics in a Changing World, Adelaide, Australia, 1–5 July 1996; pp. 909–914. [Google Scholar]
- Tezcan, S.S.; Keceli, A.; Ozdemir, Z. Allowable bearing capacity of shallow foundations based on shear wave velocity. Geotech Geol. Eng. 2006, 24, 203–218. [Google Scholar] [CrossRef]
- Mayne, P.W. Georgia Institute of Technology. In Cone Penetration Testing State-of-Practice; NCHRP Project; Transportation Research Board, National Academies Press: Washington, DC, USA, 2007. [Google Scholar]
- Mayne, P.W. In-situ test calibrations for evaluating soil parameters. In Characterization and Engineering Properties of Natural Soils; Tan, T.S., Phoon, K.K., Hight, D.W., Leroueil, S., Eds.; Taylor & Francis Group: London, UK, 2007; Volume 3, pp. 1601–1652. [Google Scholar]
- Liu, S.; Cai, G.; Puppala, A.J.; Tu, Q. Prediction of embankment settlements over marine clay using piezocone penetration tests. Bull. Eng. Geol. Environ. 2011, 70, 401–409. [Google Scholar] [CrossRef]
- Omar, M.N.; Abbiss, C.P.; Taha, M.R.; Nayan, K.A.M. Prediction of long-term settlement on soft clay using shear wave velocity and damping characteristics. Eng. Geol. 2011, 123, 259–270. [Google Scholar] [CrossRef]
- L’Heureux, J.S.; Long, M.; Vanneste, M.; Sauvin, G.; Hansen, L.; Polom, U.; Lecomte, I.; Dehls, J.; Janbu, N. On the prediction of settlement from high-resolution shear-wave reflection seismic data: The Trondheim harbour case study, mid Norway. Eng. Geol. 2013, 167, 72–83. [Google Scholar] [CrossRef]
- Abbiss, C.P. Calculation of elasticities and settlements for long periods of time and high strains from seismic measurements. Geotechnique 2014, 33, 397–405. [Google Scholar] [CrossRef]
- Tonni, L.; Gottard, G. Assessing compressibility characteristics of silty soils from CPTU: Lessons learnt from the Treporti Test Site, Venetian Lagoon (Italy). AIMS Geosci. 2019, 5, 117–144. [Google Scholar] [CrossRef]
- Islam, M.N.; Gnanendran, C.T.; Sivakumar, S.T. Interpretation of Cone Penetration Test Data of an Embankment for Coupled Numerical Modeling. Appl. Mech. 2022, 3, 14–45. [Google Scholar] [CrossRef]
- Mihálik, J.; Gago, F.; Vlček, J.; Drusa, M. Evaluation of Methods Based on CPTu Testing for Prediction of the Bearing Capacity of CFA Piles. Appl. Sci. 2023, 13, 2931. [Google Scholar] [CrossRef]
- Lade, P.V. Triaxial Testing of Soils, 1st ed.; John Wiley & Sons, Ltd.: Chichester, UK, 2016. [Google Scholar]
- Nelson, J.; Chao, K.C.; Overton, D.; Nelson, E. Oedometer Testing. In Foundation Engineering for Expansive Soils; John Wiley & Sons, Inc: Hoboken, NJ, USA, 2015; pp. 127–151. [Google Scholar] [CrossRef]
- Robertson, P.K.; Campanella, R.G.; Gillespie, D.; Greig, J. Use of Piezometer Cone data. In Use of In-Situ Testing in Geotechnical Engineering; In-Situ’86, GSP 6; ASCE: Reston, VA, USA, 1986; pp. 1263–1280. [Google Scholar]
- Bastani, S.A.; Silver, G.P.; Atkinson, D.R. CPT based settlement prediction over California soft rock. In Proceedings of the 3rd International Symposium on Cone Penetrometer Testing, CPT’14, Las Vegas, NV, USA, 12–14 May 2014; pp. 1113–1120. [Google Scholar]
- Long, M.; Carrol, R. Application of CPTU and SDMT to the characterization of Irish silts. In Proceedings of the 5th International Workshop CPTU and DMT in Soft Clays and Organic Soils, Poznan, Poland, 22–23 September 2024; pp. 45–63. [Google Scholar]
- Shkodrani, N.; Anamali, E.; Dhimitri, L.; Gashi, S. In Situ Tests—Predicted vs. Observed Settlements: A Comparative Case Study. J. Civil Eng. Archit. 2014, 8, 824–832. [Google Scholar] [CrossRef]
- Tschuschke, W.; Kumor, M.K.; Walczak, M.; Tschuschke, M. Cone penetration test in assessment of soil stiffness. Geol. Q. 2015, 59, 419–425. [Google Scholar] [CrossRef]
- Li, Y.; Shen, Y.; Wang, X.; Li, S.; Li, T.; Zhao, Q. Theoretical Studies and Implementation on the Temporary Data Storage Method for Cone Penetration Test. Sensors 2021, 21, 575. [Google Scholar] [CrossRef]
- Lambrechts, J.R.; Leonards, G.A. Effects of stress history on deformation of sand. J. Geotech. Geoenviron. 1978, 104, 1371–1387. [Google Scholar] [CrossRef]
- Jamiolkowski, M.; Ghionna, V.; Lancellotta, R.; Pasqualini, E. New corrections of penetration tests for design practice. In Proceedings of the 1st International Symposium on Penetration Testing, ISOPT I, Orlando, FL, USA, 20–24 March 1988; Balkema: Orlando, FL, USA, 1988; Volume 1, pp. 263–296. [Google Scholar]
- Leonards, G.A.; Frost, J.D. Settlements of Shallow Foundations on Granular Soils. J. Geotech. Eng. 1988, 114, 791–809. [Google Scholar] [CrossRef]
- Arroyo, M.M.; Mateos, M.T.; Devincenzi, M.; Gómez-Escoubès, R.; Martínez, J.M. CPTu-DMT performance-based correlation for settlement design. In Proceedings of the 2nd International Conference on Geotechnical Site Characterization ISC’2, Porto, Portugal, 19–22 September 2004; pp. 1605–1611. [Google Scholar]






| Mining Plant | Lubin | Polkowice–Sieroszowice | Rudna |
|---|---|---|---|
| Type of rock and its content [%] | sandstones | ||
| 65–70 | 4–14 | 79 | |
| dolomites | |||
| 20–23 | 75–86 | 17 | |
| shales | |||
| 10–12 | 10–11 | 4 | |
| Average content of fraction [%] | sandy | ||
| 59 | 16 | 42 | |
| silty | |||
| 29 | 79 | 56 | |
| clay | |||
| 12 | 5 | 2 | |
| Point | 0+600 | 0+800 | 0+900 | 1+000 | 1+100 |
|---|---|---|---|---|---|
| Series | s [m] | ||||
| start | 0.0 | 0.0 | 0.0 | 0.0 | - |
| a | - | - | 0.4 | 1.3 | 0.0 |
| b | - | 0.5 | 0.6 | 1.8 | 0.2 |
| c | - | 0.6 | 0.7 | 2.1 | 2.1 |
| d | 0.5 | 0.7 | 0.9 | 2.7 | 2.2 |
| e | - | - | - | 2.9 | - |
| f | - | - | - | 3.0 | - |
| Point | Number of layers | σv [kPa] | s [cm] |  |
| 0+200 | 119 | 50 | 11.10 | |
| 0+300 | 152 | 50 | 12.05 | |
| 0+400 | 153 | 70 | 15.19 | |
| 0+500 | 148 | 75 | 26.18 | |
| 0+600 | 160 | 80 | 30.15 | |
| 0+700 | 187 | 75 | 40.19 | |
| 0+800 | 186 | 80 | 52.59 | |
| 0+900 | 181 | 85 | 58.57 | |
| 1+000 | 159 | 93 | 68.15 | |
| 1+100 | 85 | 115 | 46.87 |
| Layer No. | Layer: from-to [m] | Layer Thickness [m] | Soil Type | φ [°] | ψ [°] | c [kPa] | ν [-] | E [MPa] | βf [kPa] | ||
|---|---|---|---|---|---|---|---|---|---|---|---|
| 1 | 2 | 3 | 4 | 5 | 6 | 7 | 8 | 9 | 10 | ||
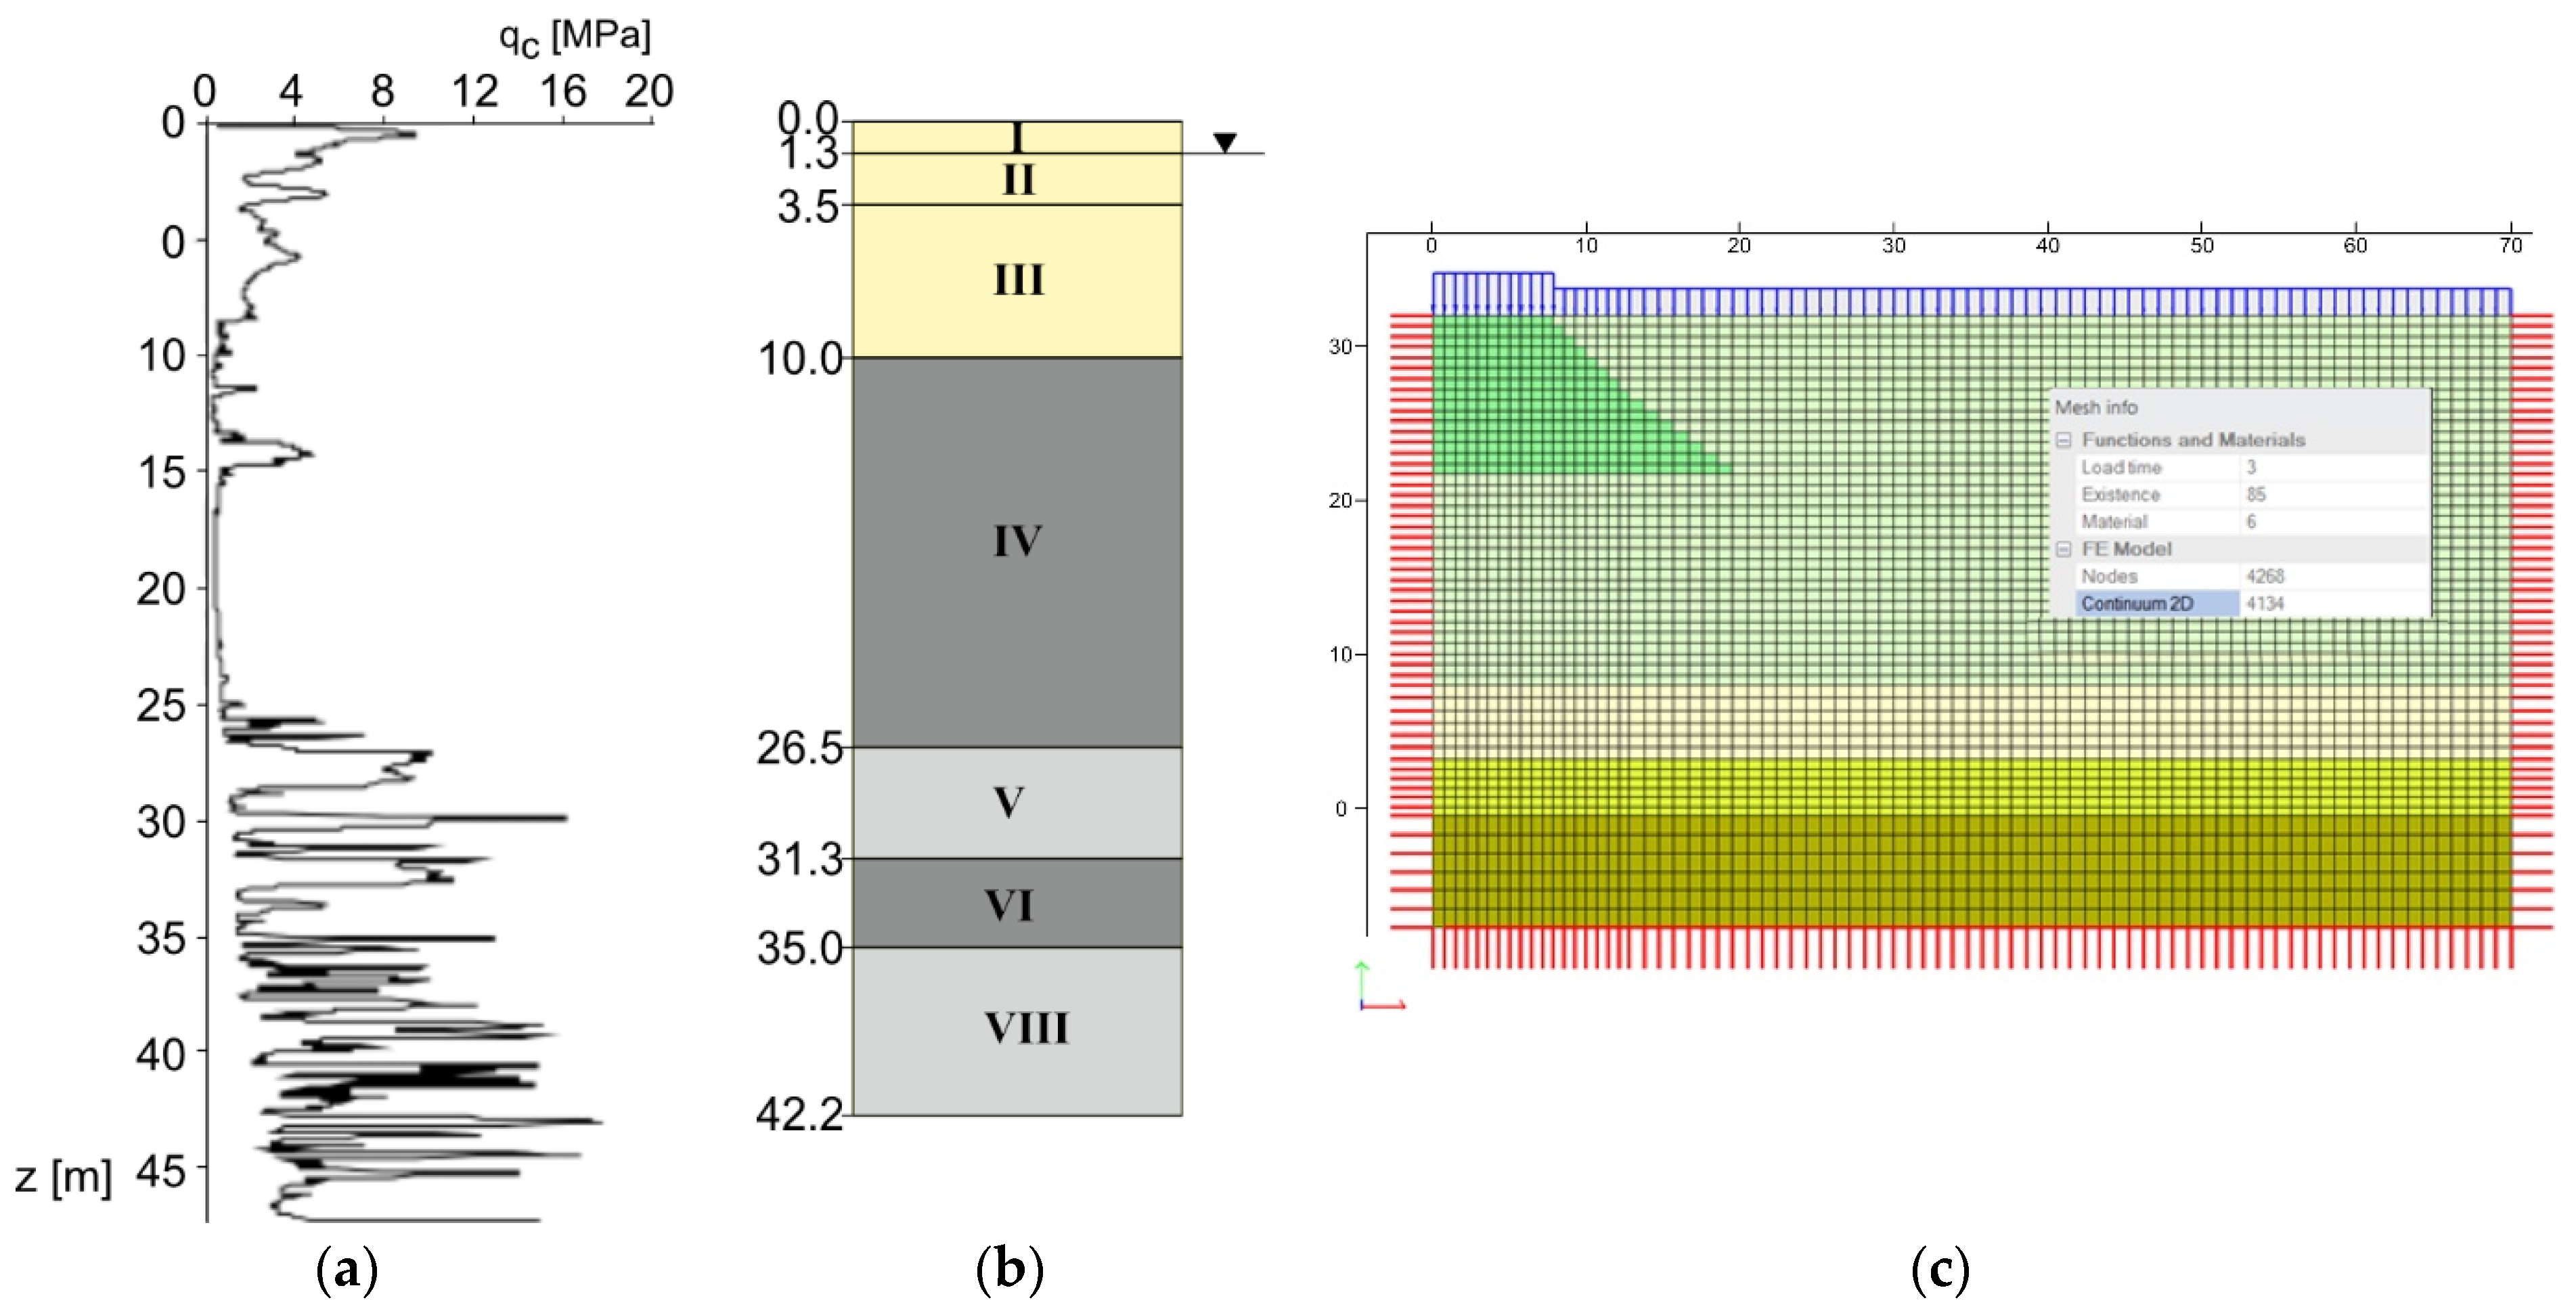
| I | 0.0–1.3 | 1.3 | Tailings: embankment | 41 | 18 | - | 0.22 | 65 | - | ||
| II | 1.3–3.5 | 2.2 | 35 | 9 | - | 0.24 | 32 | 2.2 × 10⁷ | |||
| III | 3.5–10.0 | 6.5 | 29 | 0 | - | 0.30 | 12 | ||||
| IV | 10.0–26.5 | 16.5 | Tailings: subsoil | 10 | 0 | 5 | 0.25 | 1.9 | |||
| V | 26.5–31.3 | 4.8 | 30 | 5 | - | 0.25 | 35 | ||||
| VI | 31.3–35.0 | 3.7 | 19 | 0 | 7 | 0.22 | 14 | ||||
| VII | 35.0–42.2 | 7.2 | 34 | 8 | - | 0.24 | 50 | ||||
| Layer No. | kx [m/s] | ky [m/s] | Sr [-] | α [m−1] | ρ [g/cm3] | ρd [g/cm3] | e [-] | λ [-] | κ [-] | Mc [-] | |
| 1 | 11 | 12 | 13 | 14 | 15 | 16 | 17 | 18 | 19 | 20 | |
| I | 0.9 × 10⁻⁵ | 0.9 × 10⁻⁵ | 0.14 | 12.5 | 1.86 | 1.68 | 0.59 | 0.021 | 0.001 | 1.68 | |
| II | 1.2 × 10⁻⁵ | 1.1 × 10⁻⁵ | 0.09 | 10.2 | 1.90 | 1.53 | 0.75 | 0.027 | 0.002 | 1.42 | |
| III | 2.1 × 10⁻⁶ | 2.5 × 10⁻⁶ | 0.07 | 8.5 | 1.86 | 1.48 | 0.81 | 0.033 | 0.003 | 1.16 | |
| IV | 3.1 × 10⁻⁹ | 4.7 × 10⁻⁹ | 0.19 | 0.5 | 1.95 | 1.44 | 0.90 | 0.200 | 0.015 | 0.37 | |
| V | 2.6 × 10⁻⁶ | 7.5 × 10⁻⁷ | 0.09 | 6.8 | 1.89 | 1.53 | 0.74 | 0.056 | 0.004 | 1.20 | |
| VI | 1.1 × 10⁻⁸ | 9.1 × 10⁻⁸ | 0.15 | 1.0 | 2.08 | 1.63 | 0.66 | 0.100 | 0.008 | 0.49 | |
| VII | 2.2 × 10⁻⁶ | 8.8 × 10⁻⁷ | 0.10 | 7.0 | 1.91 | 1.57 | 0.69 | 0.046 | 0.003 | 1.37 | |
| Point | CPTU Methods | MCC | Settlement Ratio | |||
|---|---|---|---|---|---|---|
| Indirect | Direct | |||||
| s [cm] | sindirect/sdirect | sindirect/sMCC | sdirect/sMCC | |||
| 0+600 | 30 | 50 | - | 0.60 | - | - |
| 0+800 | 53 | 70 | - | 0.76 | - | - |
| 0+900 | 59 | 90 | - | 0.66 | - | - |
| 1+000 | 68 | 300 | 326 | 0.23 | 0.21 | 0.92 |
| 1+100 | 47 | 220 | - | 0.21 | - | - |
Disclaimer/Publisher’s Note: The statements, opinions and data contained in all publications are solely those of the individual author(s) and contributor(s) and not of MDPI and/or the editor(s). MDPI and/or the editor(s) disclaim responsibility for any injury to people or property resulting from any ideas, methods, instructions or products referred to in the content. |
© 2024 by the author. Licensee MDPI, Basel, Switzerland. This article is an open access article distributed under the terms and conditions of the Creative Commons Attribution (CC BY) license (https://creativecommons.org/licenses/by/4.0/).
Share and Cite
Wróżyńska, M. Tailings Behavior Assessment Using Piezocone Penetration Test. Minerals 2024, 14, 208. https://doi.org/10.3390/min14020208
Wróżyńska M. Tailings Behavior Assessment Using Piezocone Penetration Test. Minerals. 2024; 14(2):208. https://doi.org/10.3390/min14020208
Chicago/Turabian StyleWróżyńska, Magdalena. 2024. "Tailings Behavior Assessment Using Piezocone Penetration Test" Minerals 14, no. 2: 208. https://doi.org/10.3390/min14020208
APA StyleWróżyńska, M. (2024). Tailings Behavior Assessment Using Piezocone Penetration Test. Minerals, 14(2), 208. https://doi.org/10.3390/min14020208


