Article

Effect of Low Viscosity Contrast between Quartz and Plagioclase on Creep Behavior of the Mid-Crustal Shear Zone

by
Hiroto Endo
1,
Katsuyoshi Michibayashi
2,3,*,
Takamoto Okudaira
4 and
David Mainprice
5
1
Department of Science, Graduate School of Integrated Science and Technology, Shizuoka University, Shizuoka 422-8529, Japan
2
Department of Earth and Planetary Sciences, Graduate School of Environmental Studies, Nagoya University, Nagoya 464-8601, Japan
3
Volcanoes and Earth’s Interior Research Center, Research Institute for Marine Geodynamics, Japan Agency for Marine-Earth Science and Technology, Yokosuka 237-0061, Japan
4
Department of Geosciences, Osaka Metropolitan University, Osaka 558-8585, Japan
5
Géoscience, Université de Montpellier 2, CNRS, CEDEX 05, 34095 Montpellier, France
*
Author to whom correspondence should be addressed.
Minerals 2024, 14(3), 229; https://doi.org/10.3390/min14030229
Submission received: 26 January 2024 / Revised: 20 February 2024 / Accepted: 22 February 2024 / Published: 24 February 2024

Abstract

:
Ultramylonites are among the most extreme fault rocks that commonly occur in the mid-crustal brittle–plastic transition and are mainly characterized by intensely sheared fine-grained microstructures and well-mixed mineral phases. Although the deformation mechanism of ultramylonites is key to understanding the rheological behavior of the mid-crustal shear zone, their microstructural development is still controversial owing to their intensely fine-grained textures. To investigate the possible crustal deformation mechanisms, we studied 13 mylonites obtained from the Kashio shear zone along the Median Tectonic Line that is the largest strike-slip fault in Japan. In particular, we investigated various mixed quartz–plagioclase layers developed within tonalitic mylonite, which are representative of the common mean grain size and crystal fabric of quartz among the studied samples. A high-quality phase-orientation map obtained by electron backscattered diffraction showed not only a wide range of quartz–plagioclase mixing (10%–80% in quartz modal composition) but also revealed a correlation between grain size reduction and crystal fabric weakening in quartz, indicating a change in the deformation mechanism from dislocation creep to grain-size-sensitive creep in the mixed quartz-plagioclase layers. In contrast, plagioclase showed an almost consistent fine grain size and weak to random crystal fabrics regardless of modal composition, indicating that grain size-sensitive creep is dominant. Combined with laboratory-determined flow laws, our results show that the Kashio shear zone could have developed under deformation mechanisms in which the viscosities of quartz and plagioclase are nearly comparable, effectively within 1017–1019 Pa·s, thereby possibly enabling extensive shearing along the Median Tectonic Line.

1. Introduction

As quartz and plagioclase are the most abundant minerals in the continental crust, the strength and rheology of the middle crust depend on their deformation mechanisms (e.g., [1,2]). Mineral deformation mechanisms are commonly divided into two regimes: grain-size-insensitive creep (dislocation creep) and grain-size-sensitive (GSS) creep (diffusion creep and grain-boundary sliding) (e.g., [3,4,5,6,7,8]). In GSS creep, crustal strength (i.e., effective viscosity) is reduced with decreasing grain size (e.g., [9,10,11]). Therefore, the transition from dislocation creep to GSS creep is important for rheological weakening in the continental crust (e.g., [2]).
Mineral-phase intermixing, along with grain size reduction during mylonitization, is commonly invoked as a mechanism for maintaining weakness over long geological timescales, resulting from the suppression of normal grain growth owing to the presence of secondary phases at the first-phase grain boundaries (e.g., [12,13]). However, there remains continued discussion over the precise mechanisms responsible for grain-scale phase mixing (e.g., [14,15,16,17]). More recently, Cross et al. [18] has proposed that the ideal conditions for mechanical phase mixing under wet middle- to lower-crust conditions are 400–800 °C, 10–100 MPa stress, and 10–100 µm grain size, where the quartz-plagioclase viscosity contrast is minimized to <10. Here, we attempted to assess whether these conditions apply to natural rocks, such as ultramylonite, in a shear zone.
In this study, we evaluated the effective viscosities during the formation of highly strained mylonites in a crustal-scale shear zone by the combination of stress estimated by piezometric relations and strain rate estimated by constitutive flow laws (e.g., [19]), assuming a field boundary between GSS and grain-size-insensitive creep (e.g., [20]). In these evaluations, at least one constituent mineral (e.g., quartz and/or plagioclase) should be deformed by grain-size-insensitive dislocation creep. However, because almost all constituent minerals would be deformed by GSS creep owing to the very small grain size of the minerals in the most-strained parts of the shear zones, it is difficult to evaluate the effective viscosity of the highly strained zones on the basis of previous methods such as Okudaira and Shigematsu [20].
Here, we studied a series of mylonites, which consist predominantly of quartz and plagioclase, collected from the Kashio shear zone in the Urakawa area, Shizuoka Prefecture, central Honshu Island, Japan (Figure 1a; e.g., [21]). We examined mylonite consisting of fine-grained compositional layers (quartz-rich, plagioclase-rich, and quartz–plagioclase mixed layers) to determine quantitatively its detailed microstructure and the apparent influence of phase mixing. We have documented the microstructural variation and crystal fabrics in relation to the mineral-phase mixing developed in mylonite. We discuss the deformation mechanism during mylonitization and propose that the viscosity contrast between quartz and feldspar is an important factor in the development of a large-scale shear zone in mid-continental crust.

2. Geological Setting

The Kashio shear zone (Figure 1a) lies within the Cretaceous low-P/high-T Ryoke metamorphic complex along the Median Tectonic Line (MTL) that is the largest onshore strike-slip fault (>1000 km) in central Honshu Island, Japan (e.g., [22,23,24,25,26,27,28,29]). Mylonites within the Kashio shear zone (i.e., Kashio mylonite) in central Honshu Island have been deformed by a sinistral strike-slip or subhorizontal mid-crustal (~10 km depth) shearing (e.g., [22,23,27,28,30,31,32,33]) and have recently been recognized as a remnant of an old tectonic plate boundary [29]. In addition, it has been suggested that the Kashio shear zone along the MTL has been bent by collision with the Izu-Bonin-Mariana arc associated with the opening of the Japan Sea [34,35].
The Kashio mylonites, originally called the Kashio gneiss [36], mainly occur near the MTL and are characterized by feldspar and amphibole porphyroclasts in a fine-grained matrix containing quartz and phyllosilicate aggregates [26,27,37,38]. The Kashio mylonite is mostly derived from tonalite [39,40].
In the Urakawa area (Figure 1b), the MTL is topographically expressed as a NE–SW-trending high-angle fault scarp [21,39,41]. In this area, a fracture zone of the MTL has developed several hundred meters in width, which is thicker than those in the other areas of the central Honshu [42]. The low-P/high-T metamorphic complex and Tenryukyo granite were outcropped along the MTL. Foliations of the Kashio mylonite strike NE-SW, dipping at a high angle to northwest ([21,39,43]; Figure 1b).
Notably, xenoliths of granitic mylonites have been found within the Tenryukyo granite [21]. The CHIME (Chemical U-Th Total Pb Isochron Method) monazite ages of Tenryukyo granite are 89.7 ± 7.7 and 91.2 ± 3.5 Ma [44]. Therefore, a mylonitic event must have occurred in the ca. 90 Ma before or during solidification of the Tenryukyo granite [21].

3. Methods

3.1. Microstructures and Textural Analysis

Using polarizing microscopes and thin sections, we analyzed the microstructures oriented perpendicular to foliation and parallel to lineation. We used crystallographic orientation maps for microstructural observations such as grain sizes and shapes, which were obtained from polished thin sections using a scanning electron microscope (Hitachi S-3400 N, Hitachi, Japan) equipped for electron backscatter diffraction (EBSD) (Oxford Instruments HKL-Channel 5 System, Abingdon, UK). The analytical conditions consisted of a 20-kV acceleration voltage, a 28-mm working distance, and 1-µm grid spacing, and the specimens were tilted 70° in low-vacuum mode. The total grid dimensions of the mapped area were 180 × 160 pixels. The Kikuchi diffraction pattern was automatically processed using Oxford Instruments HKL-Channel 5 System, and crystallographic orientation maps (e.g., [45]) were subsequently generated using the MTEX 5.7.0 toolbox (https://mtex-toolbox.github.io/, accessed on 3 August 2021) developed in MATLAB® [46]. We removed noise from the data, such as isolated points that had been incorrectly indexed (Wild Spikes) and zero solutions that were surrounded by at least six neighboring pixels. The critical grain boundary misorientation angle was set at 10° [47]. We created both inverse-pole figure (IPF) and band-contrast maps to identify the relationships between textures and crystal orientations by color.
To analyze quartz and plagioclase grain sizes, we traced the outlines of grains in monomineralic aggregates using optical microscope photomicrographs. For quartz and plagioclase grains that were too small to trace their grain boundaries using this method, band-contrast maps were used for grain size measurement. The area (A) of each grain was measured using Scion Image software (http://www.scioncorp.com/, accessed on 4 April 2015). Subsequently, grain size was calculated as the equivalent circular diameter of the grain ( D = 2 A / π ) (e.g., [22]).
In this study, we also investigated detailed microstructures within a part of a mylonite thin section (sample UK04-1) by EBSD using a CamScan X500FE CrystalProbe (Cambridge, UK) equipped with an Oxford Instruments Nordlys Nano digital camera (a charge-coupled device) at Géosciences Montpellier (CNRS-Université de Montpellier 2, Montpellier, France). The analytical conditions during EBSD acquisition were optimized using low vacuum (4 Pa) in a nitrogen atmosphere to prevent charging. This allowed working on uncoated samples and hence, recording high-quality EBSD patterns at operating conditions of 15 kV and 3.5 nA, at a working distance of 25 mm. We used a 2-µm grid spacing, resulting in a mapped area of total grid dimensions 2294 × 1184 pixels. Indexed Kikuchi diffraction patterns for quartz, plagioclase, K-feldspar, biotite, muscovite, calcite, chlorite, and hornblende were automatically processed using Oxford Instruments AZTec software (Abingdon, UK). We further analyzed the EBSD map by dividing it into 20 subdomains. Pole-figure plotting, and grain-size and fabric-intensity (J and M index) measurements were performed using the MTEX toolbox developed for MATLAB® [46,48].

3.2. Crystal-Fabric Analysis

To measure the average crystallographic preferred orientations (CPOs) of quartz from the shores of the Ohchise River and Shippei-sawa, we manually measured more than 200 crystal orientations of randomly selected quartz grains per sample throughout the entire thin section using the EBSD system. The computerized indexing of the Kikuchi pattern was visually checked for each orientation using Oxford Instrument AZTec software. The crystal orientation results are plotted on the equal-area lower hemisphere in the XZ structural reference frame.
The CPOs for quartz and plagioclase in one sample (UK04-1), which was chosen among all the mylonite samples as described later, were measured based on the high-resolution EBSD orientation map obtained by EBSD at Géosciences Montpellier (CNRS-Université de Montpellier 2, France).

4. Results

4.1. Microstructures and Crystallographic Preferred Orientations of Quartz

We studied 13 samples collected along the shores of Ohchise River and Shippei-sawa (Figure 1b). The samples were tentatively classified into three types based on their mylonitic textures and visually determined mineral compositions: protomylonite, mylonite, and ultramylonite (Figure 1c). The spatial distribution of each type was not systematic (Figure 1b).
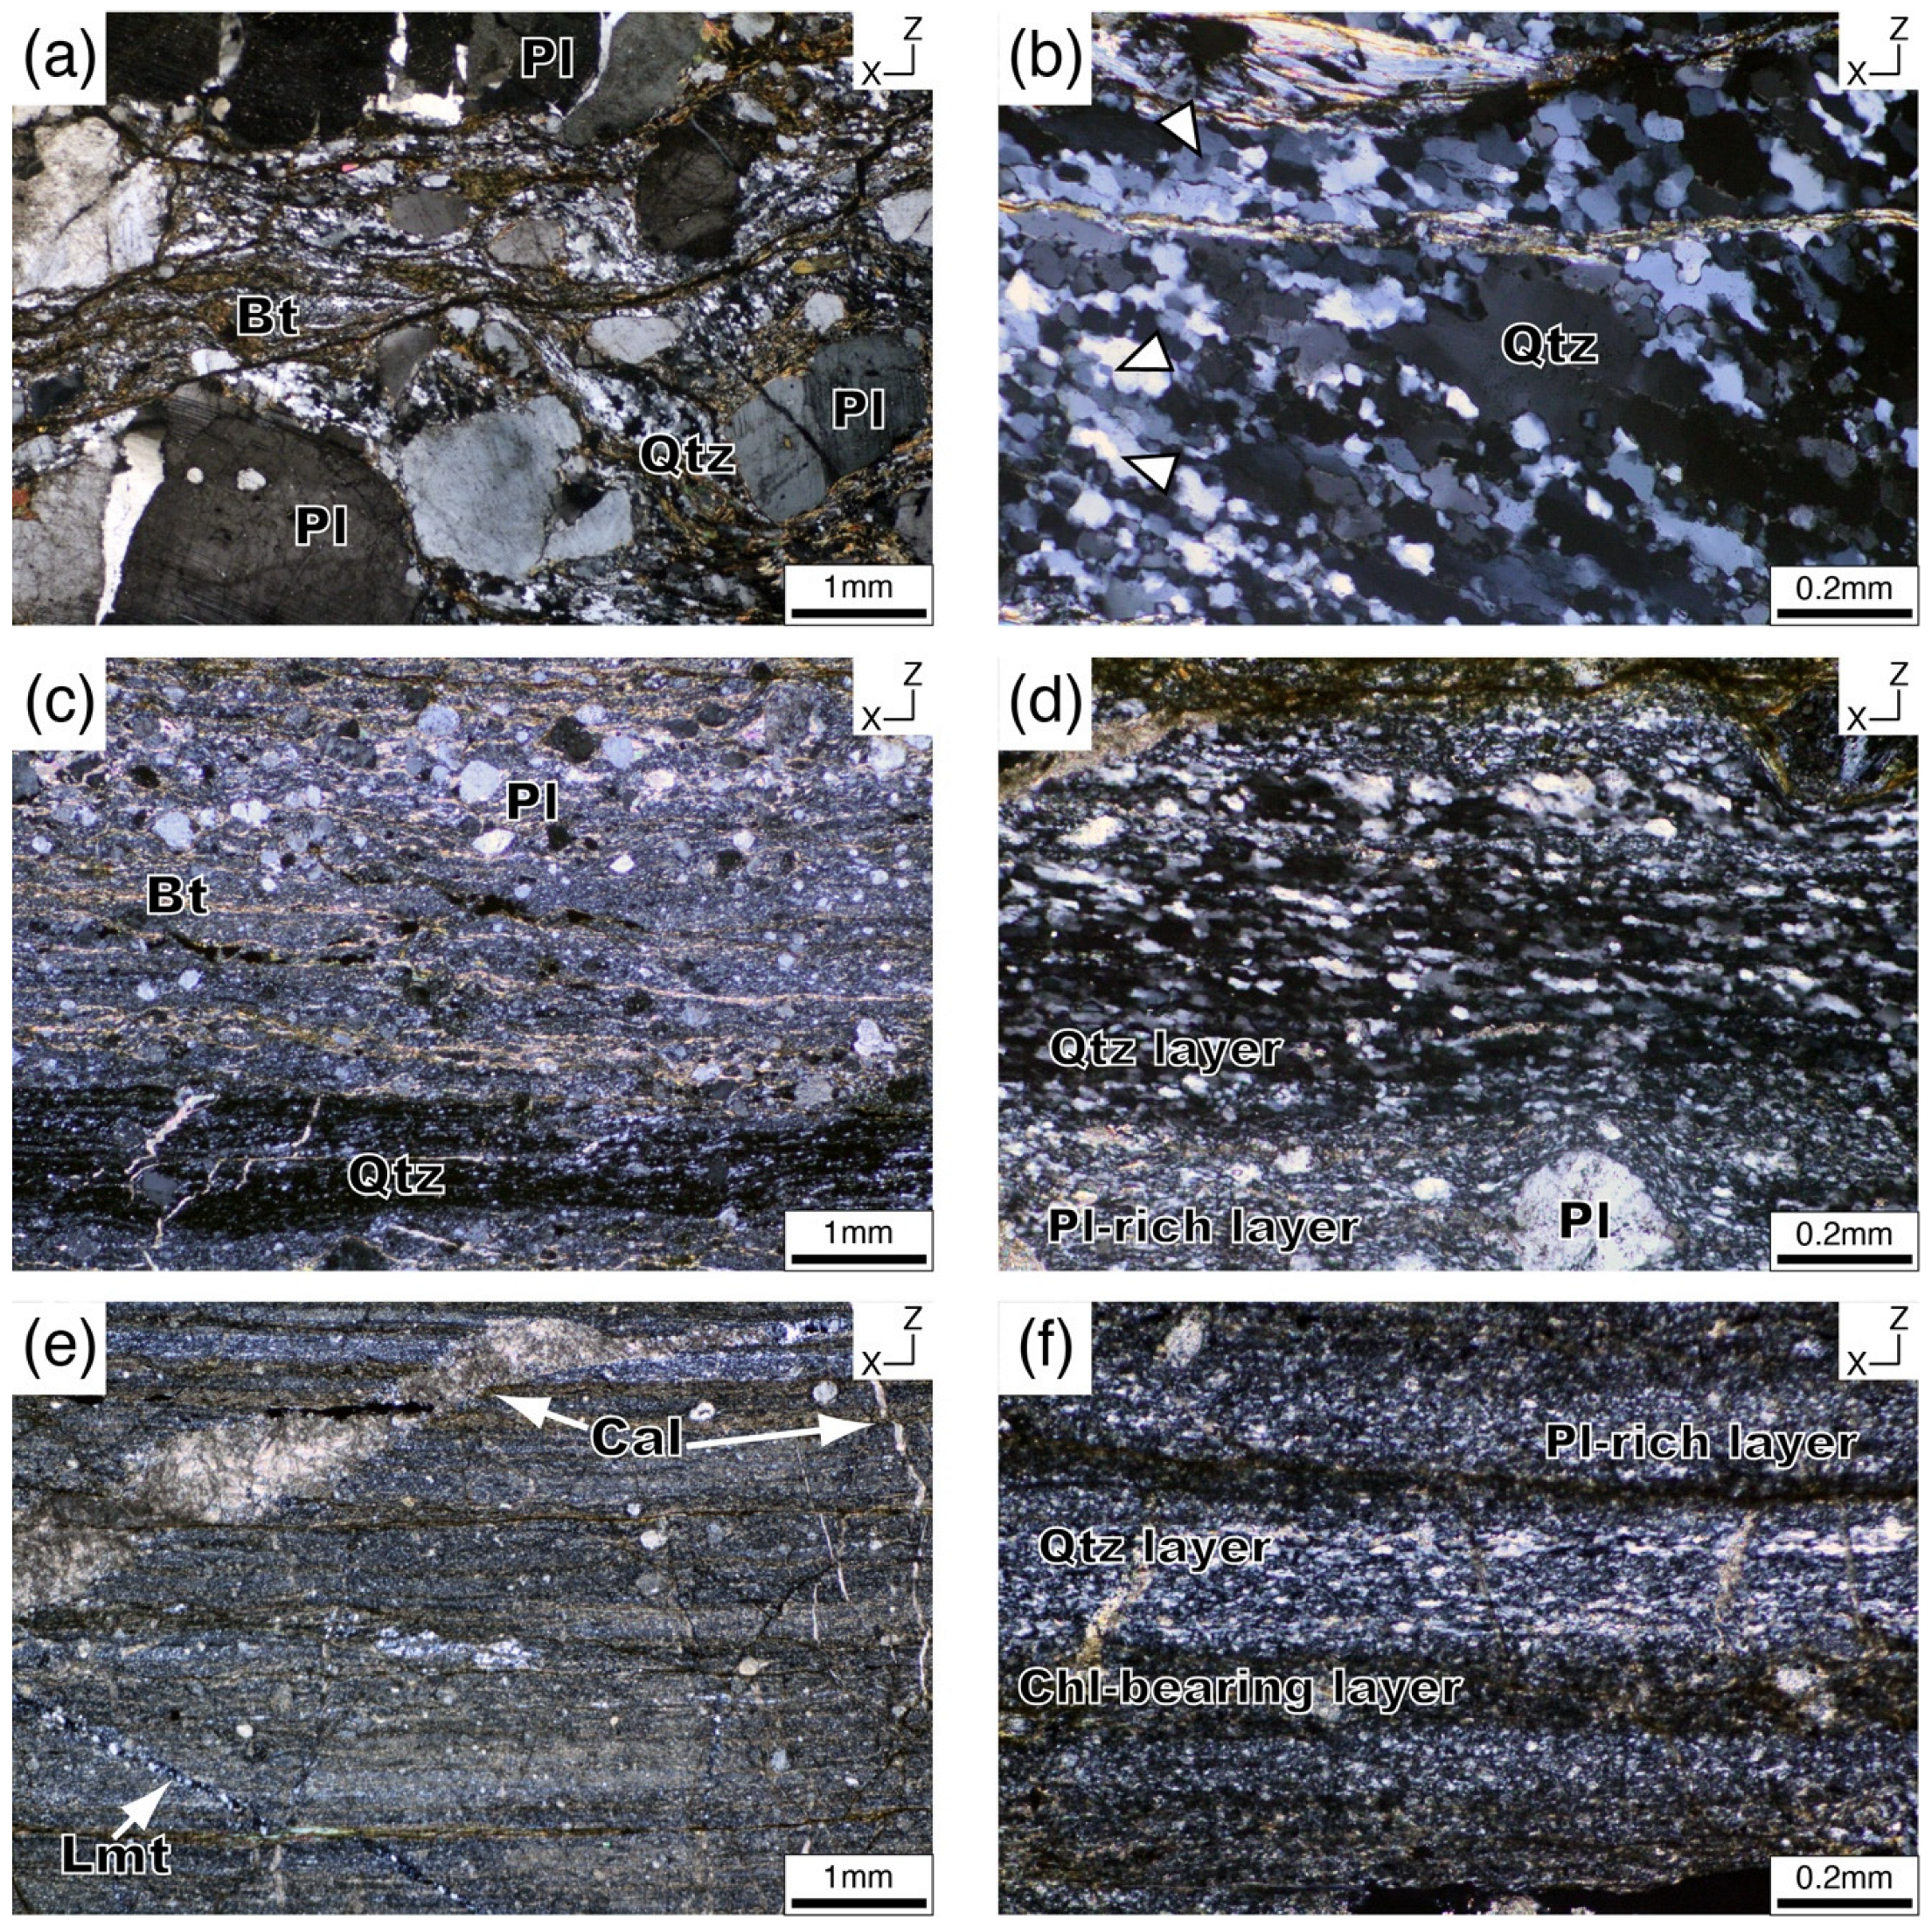
The protomylonites are categorized by the presence of remarkably coarse-grained (several millimeters in one dimension) plagioclase porphyroclasts (Figure 1c) and are predominantly found along the shores of Shippei-sawa (Figure 1b). In these samples, quartz, plagioclase, K-feldspar, biotite, and minor hornblende were the main constituent minerals. Hornblende and biotite were partially or mostly altered to chlorite. From dynamic recrystallization, quartz grains formed aggregates that exhibited undulose extinction and oblique foliation (Figure 2a,b). Some quartz grains in these aggregates have irregular boundaries indicating grain boundary migration and some contain subgrains (Figure 2b). Fractured plagioclase porphyroclasts (a few millimeters in one dimension) (Figure 2a) have cracks filled with quartz (Figure 2a). Myrmekite occurs around the K-feldspar porphyroclasts.
Mylonites and ultramylonites occur predominantly along the banks of the Ohchise River (Figure 1b). The mylonites include layers that alternate between fine-grained quartz layers and plagioclase-rich layers containing plagioclase mostly smaller than 1 mm in the fine-grained matrix (Figure 1c and Figure 2c). Muscovite and chlorite commonly occur in the matrix and are aligned parallel to foliation. The recrystallized quartz grains in the fine-grained quartz layers exhibited oblique foliation (Figure 2d and Figure 3). Plagioclase porphyroclasts exhibited undulose extinction and tended to be somewhat fractured. The plagioclase-rich layers are characterized by fine-grained plagioclase with a patchy quartz distribution. The grain sizes of the fine-grained (<10 μm) plagioclase layers were smaller than those of the quartz in the fine-grained quartz layers (Figure 2d).
The ultramylonites consist of thin layers and small amounts of plagioclase porphyroclasts (Figure 1c and Figure 2e). The thin layers consisted of quartz-rich, chlorite-rich, and plagioclase-rich layers. The quartz-rich layers contained secondary phases, such as plagioclase, muscovite, and chlorite (Figure 2f). Calcite and laumontite were commonly observed in the thin veins (Figure 2e). Ultramylonites are commonly fractured because of the later stage of brittle deformation associated with the activity of the Median Tectonic Line above the brittle-plastic transition.
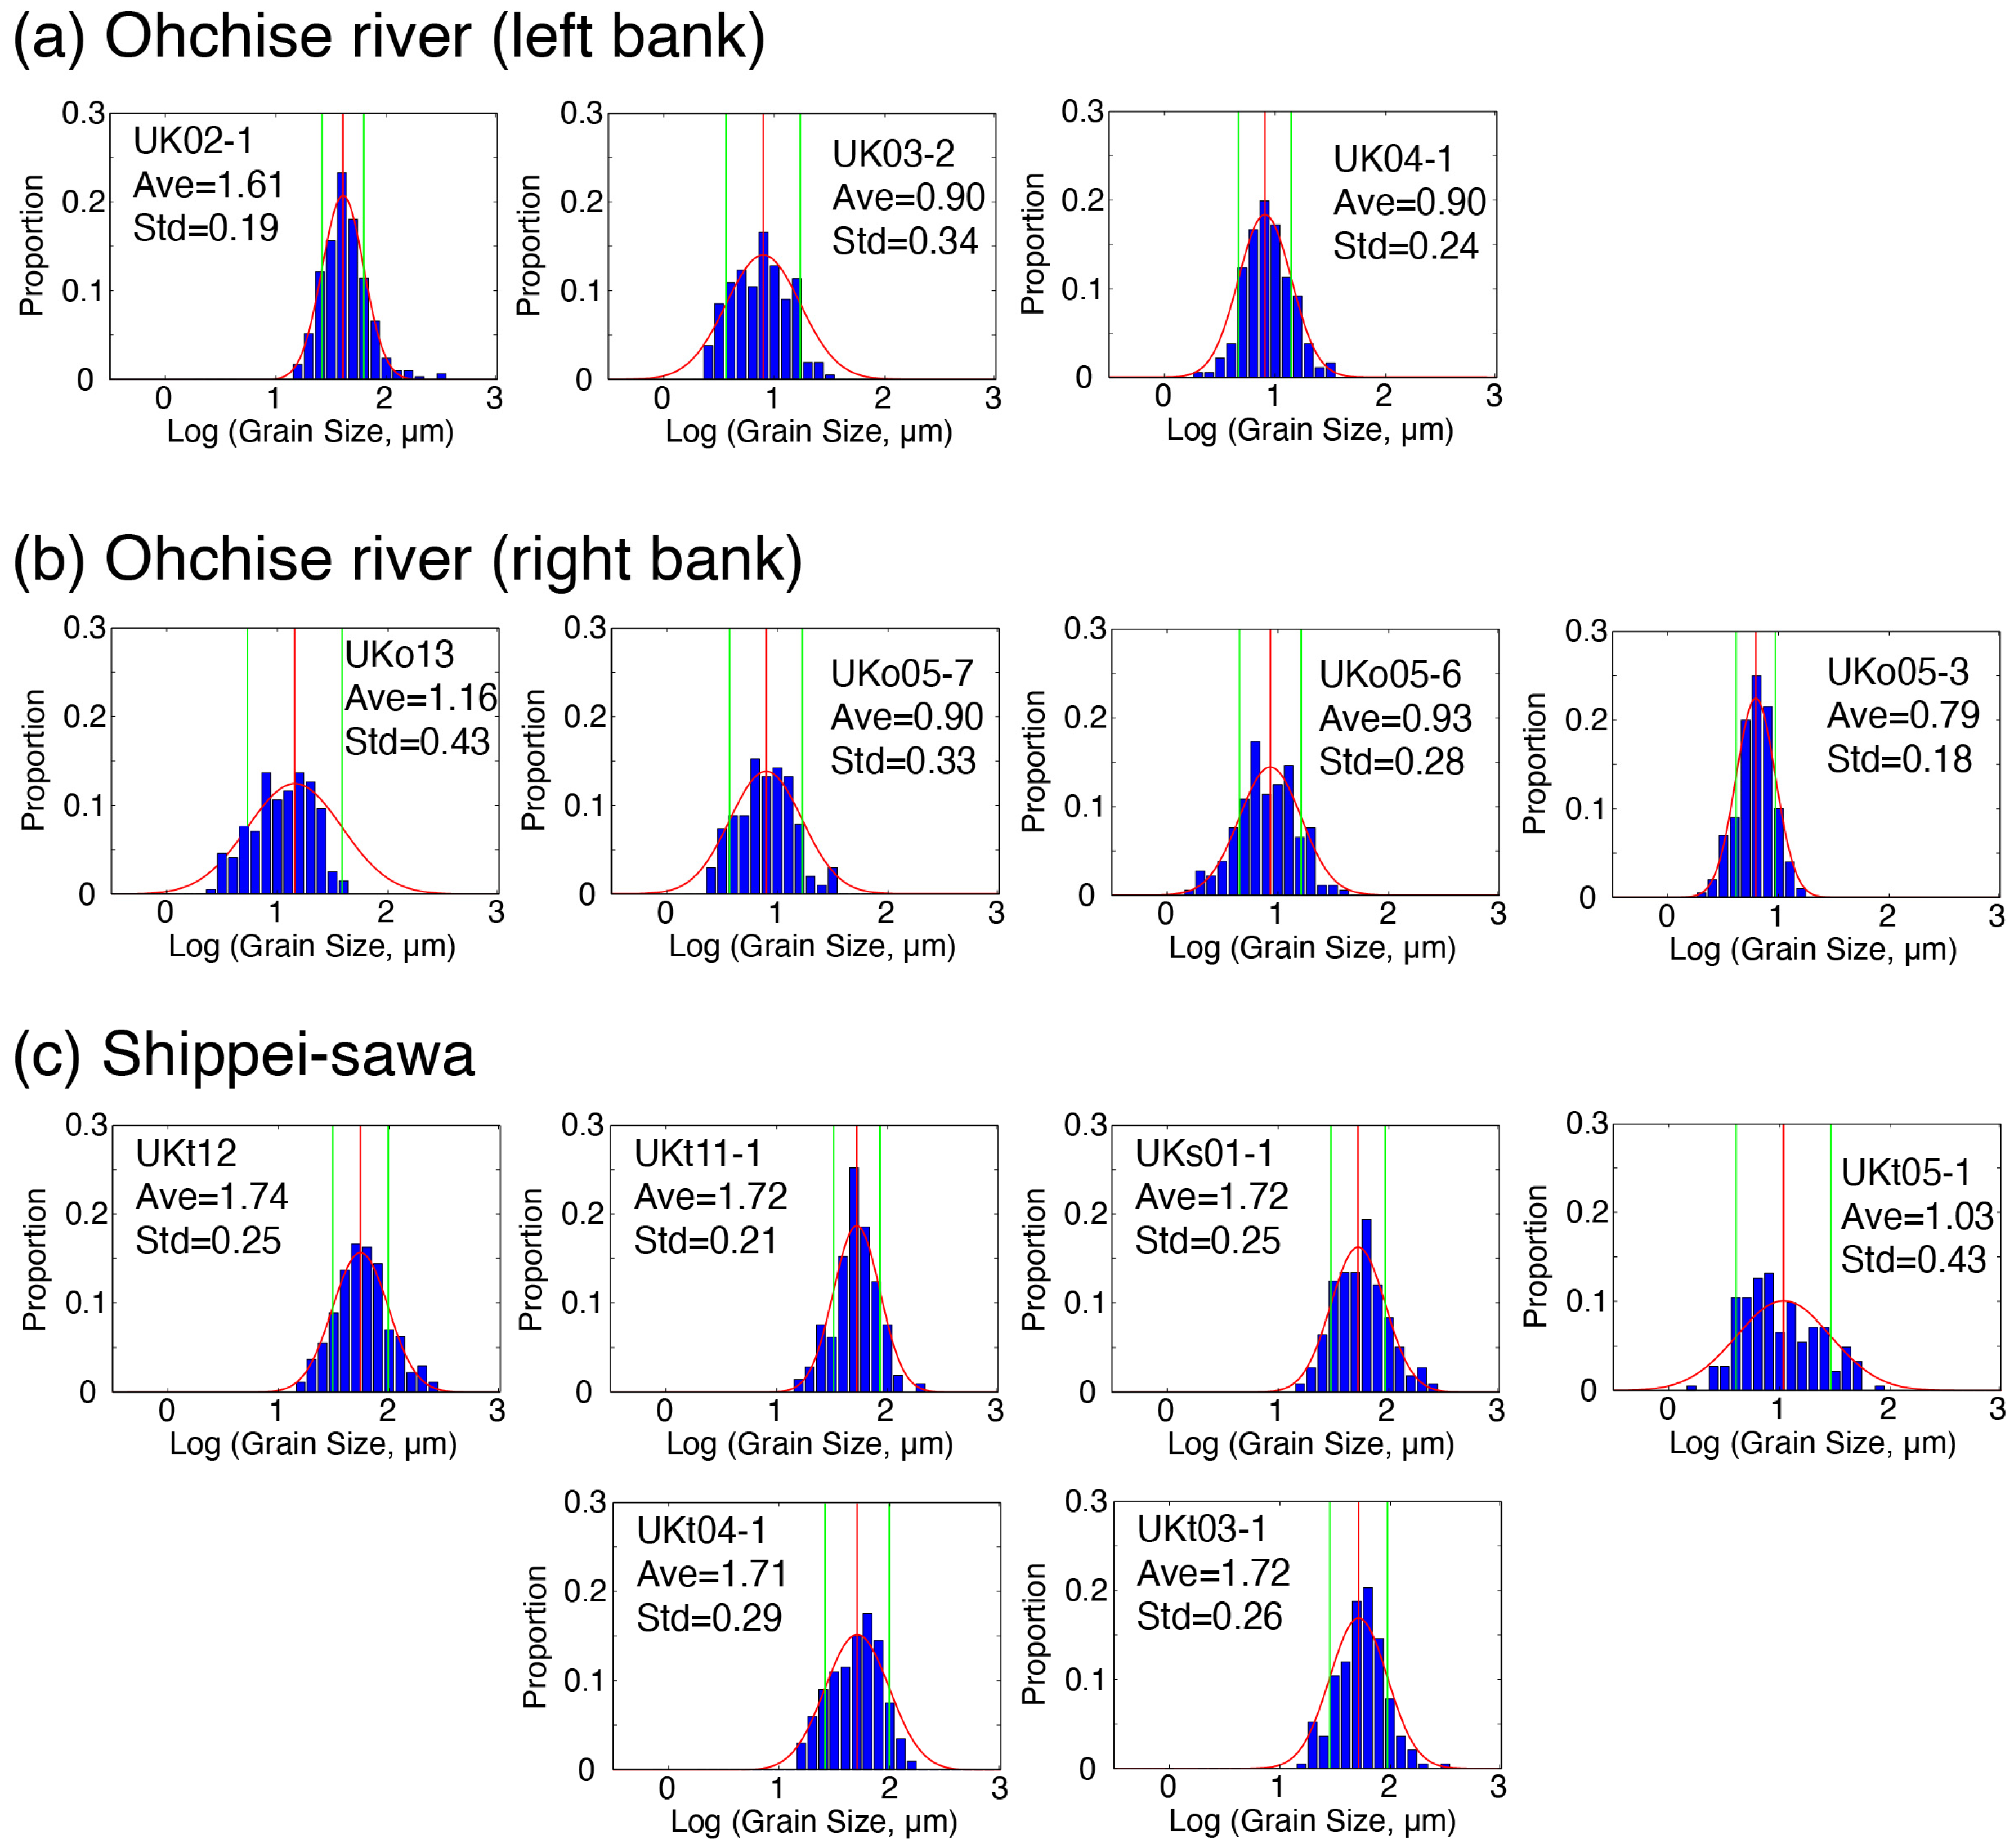
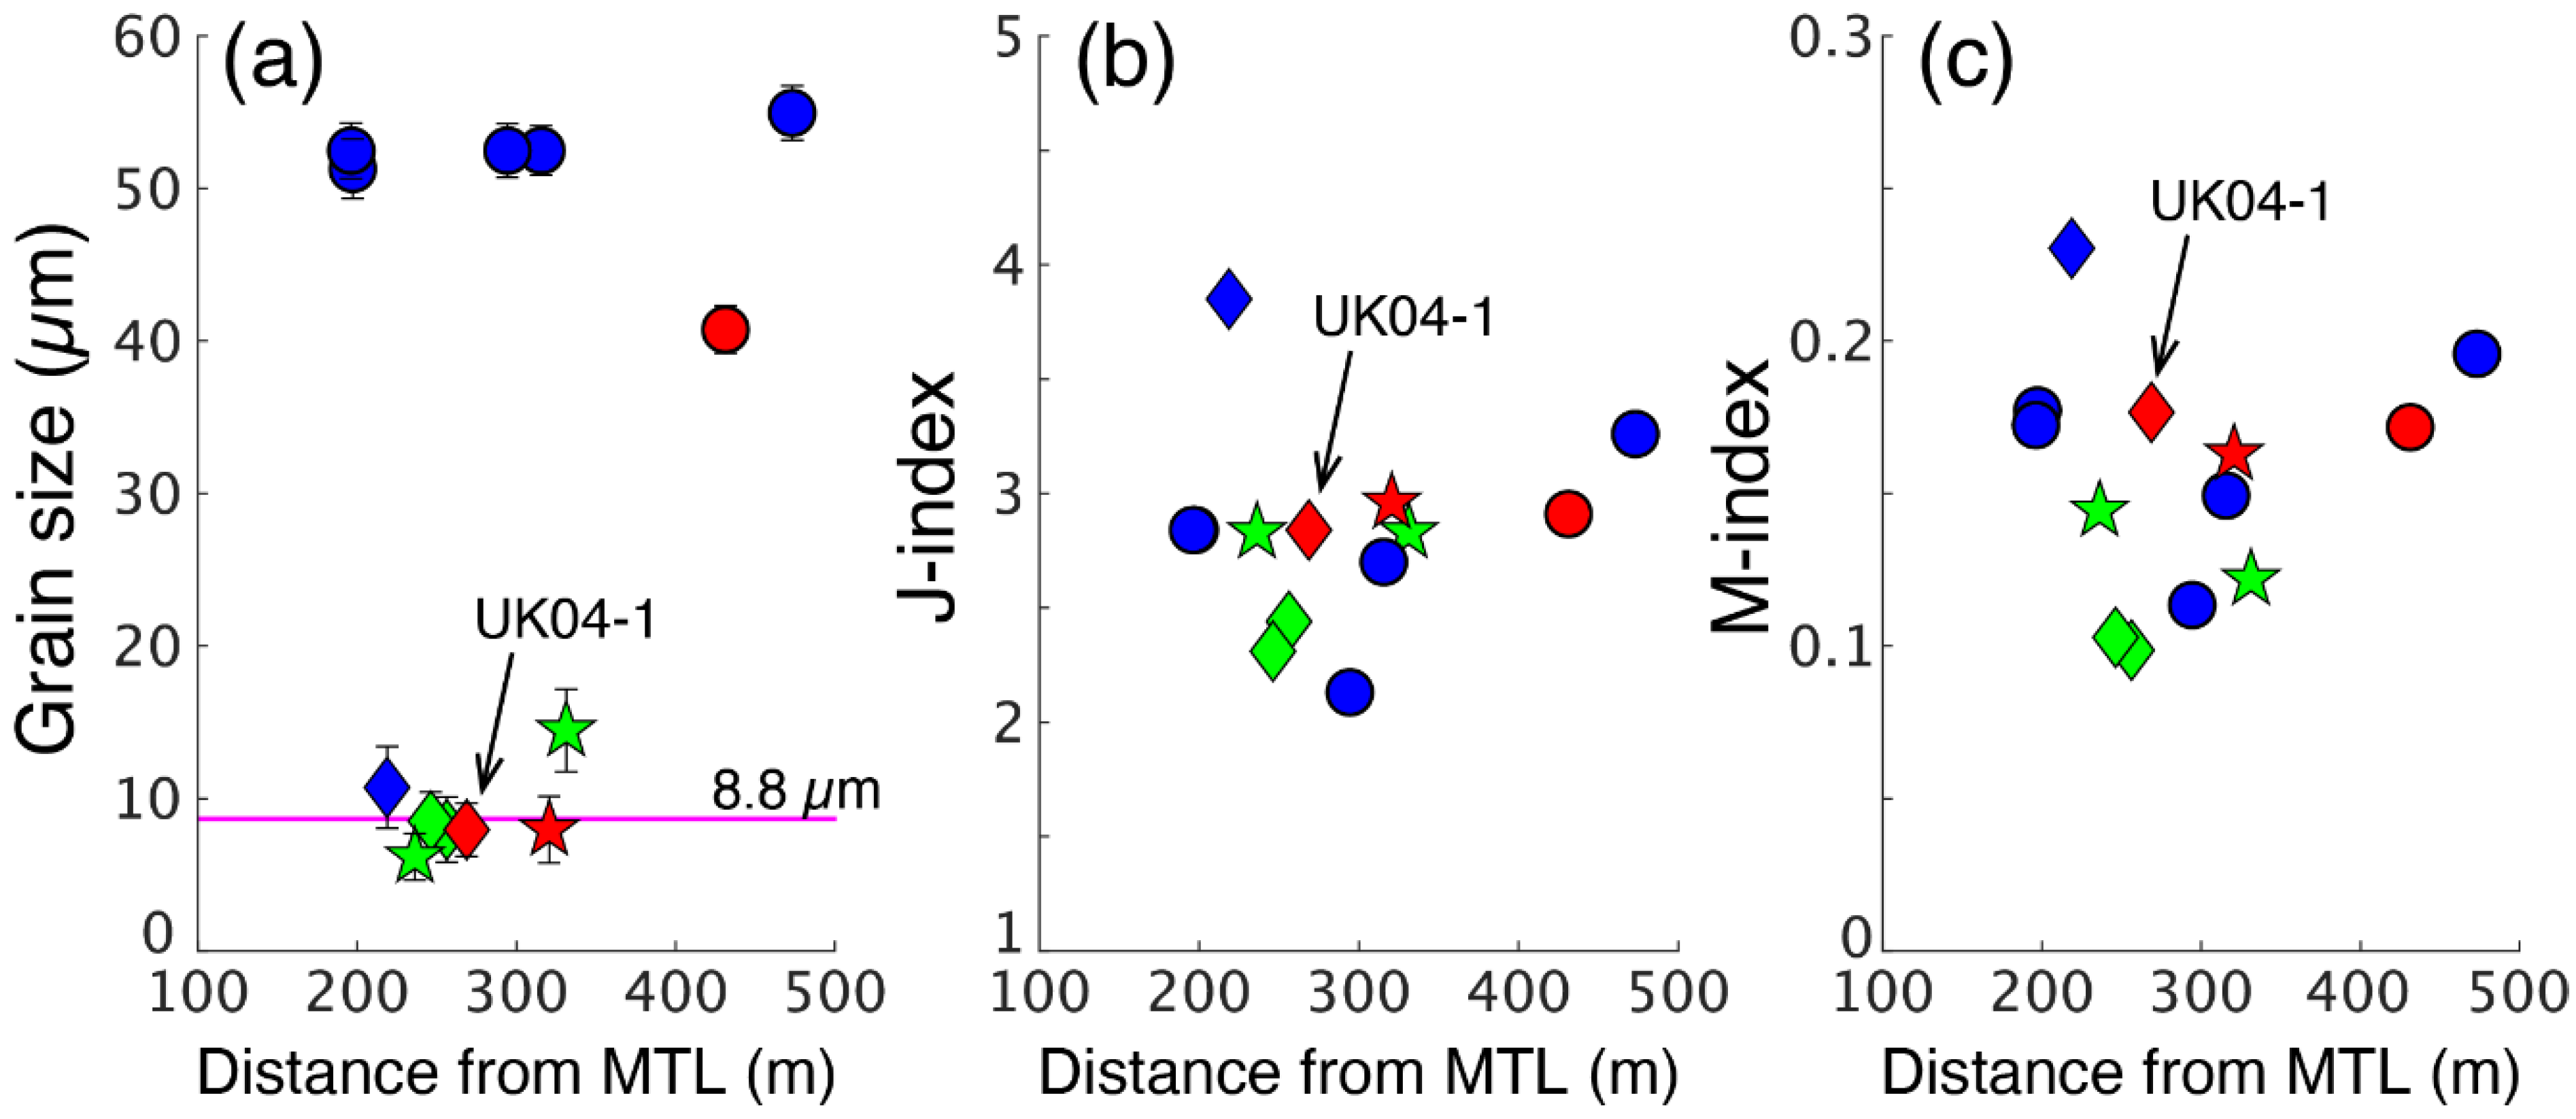
The grain size distributions of the recrystallized quartz aggregates were log-normal (Figure 4). The arithmetic mean grain sizes for Ohchise River samples are 40.7 µm for the protomylonite, 7.9–8.5 µm for the mylonites, and 6.2–14.5 µm for the ultramylonites (Figure 4 and Figure 5a). The mean grain sizes of samples from the shores of Shippei-sawa are in the range 50–55 µm for the protomylonites and average 10.7 μm for the mylonite (Figure 4 and Figure 5a).
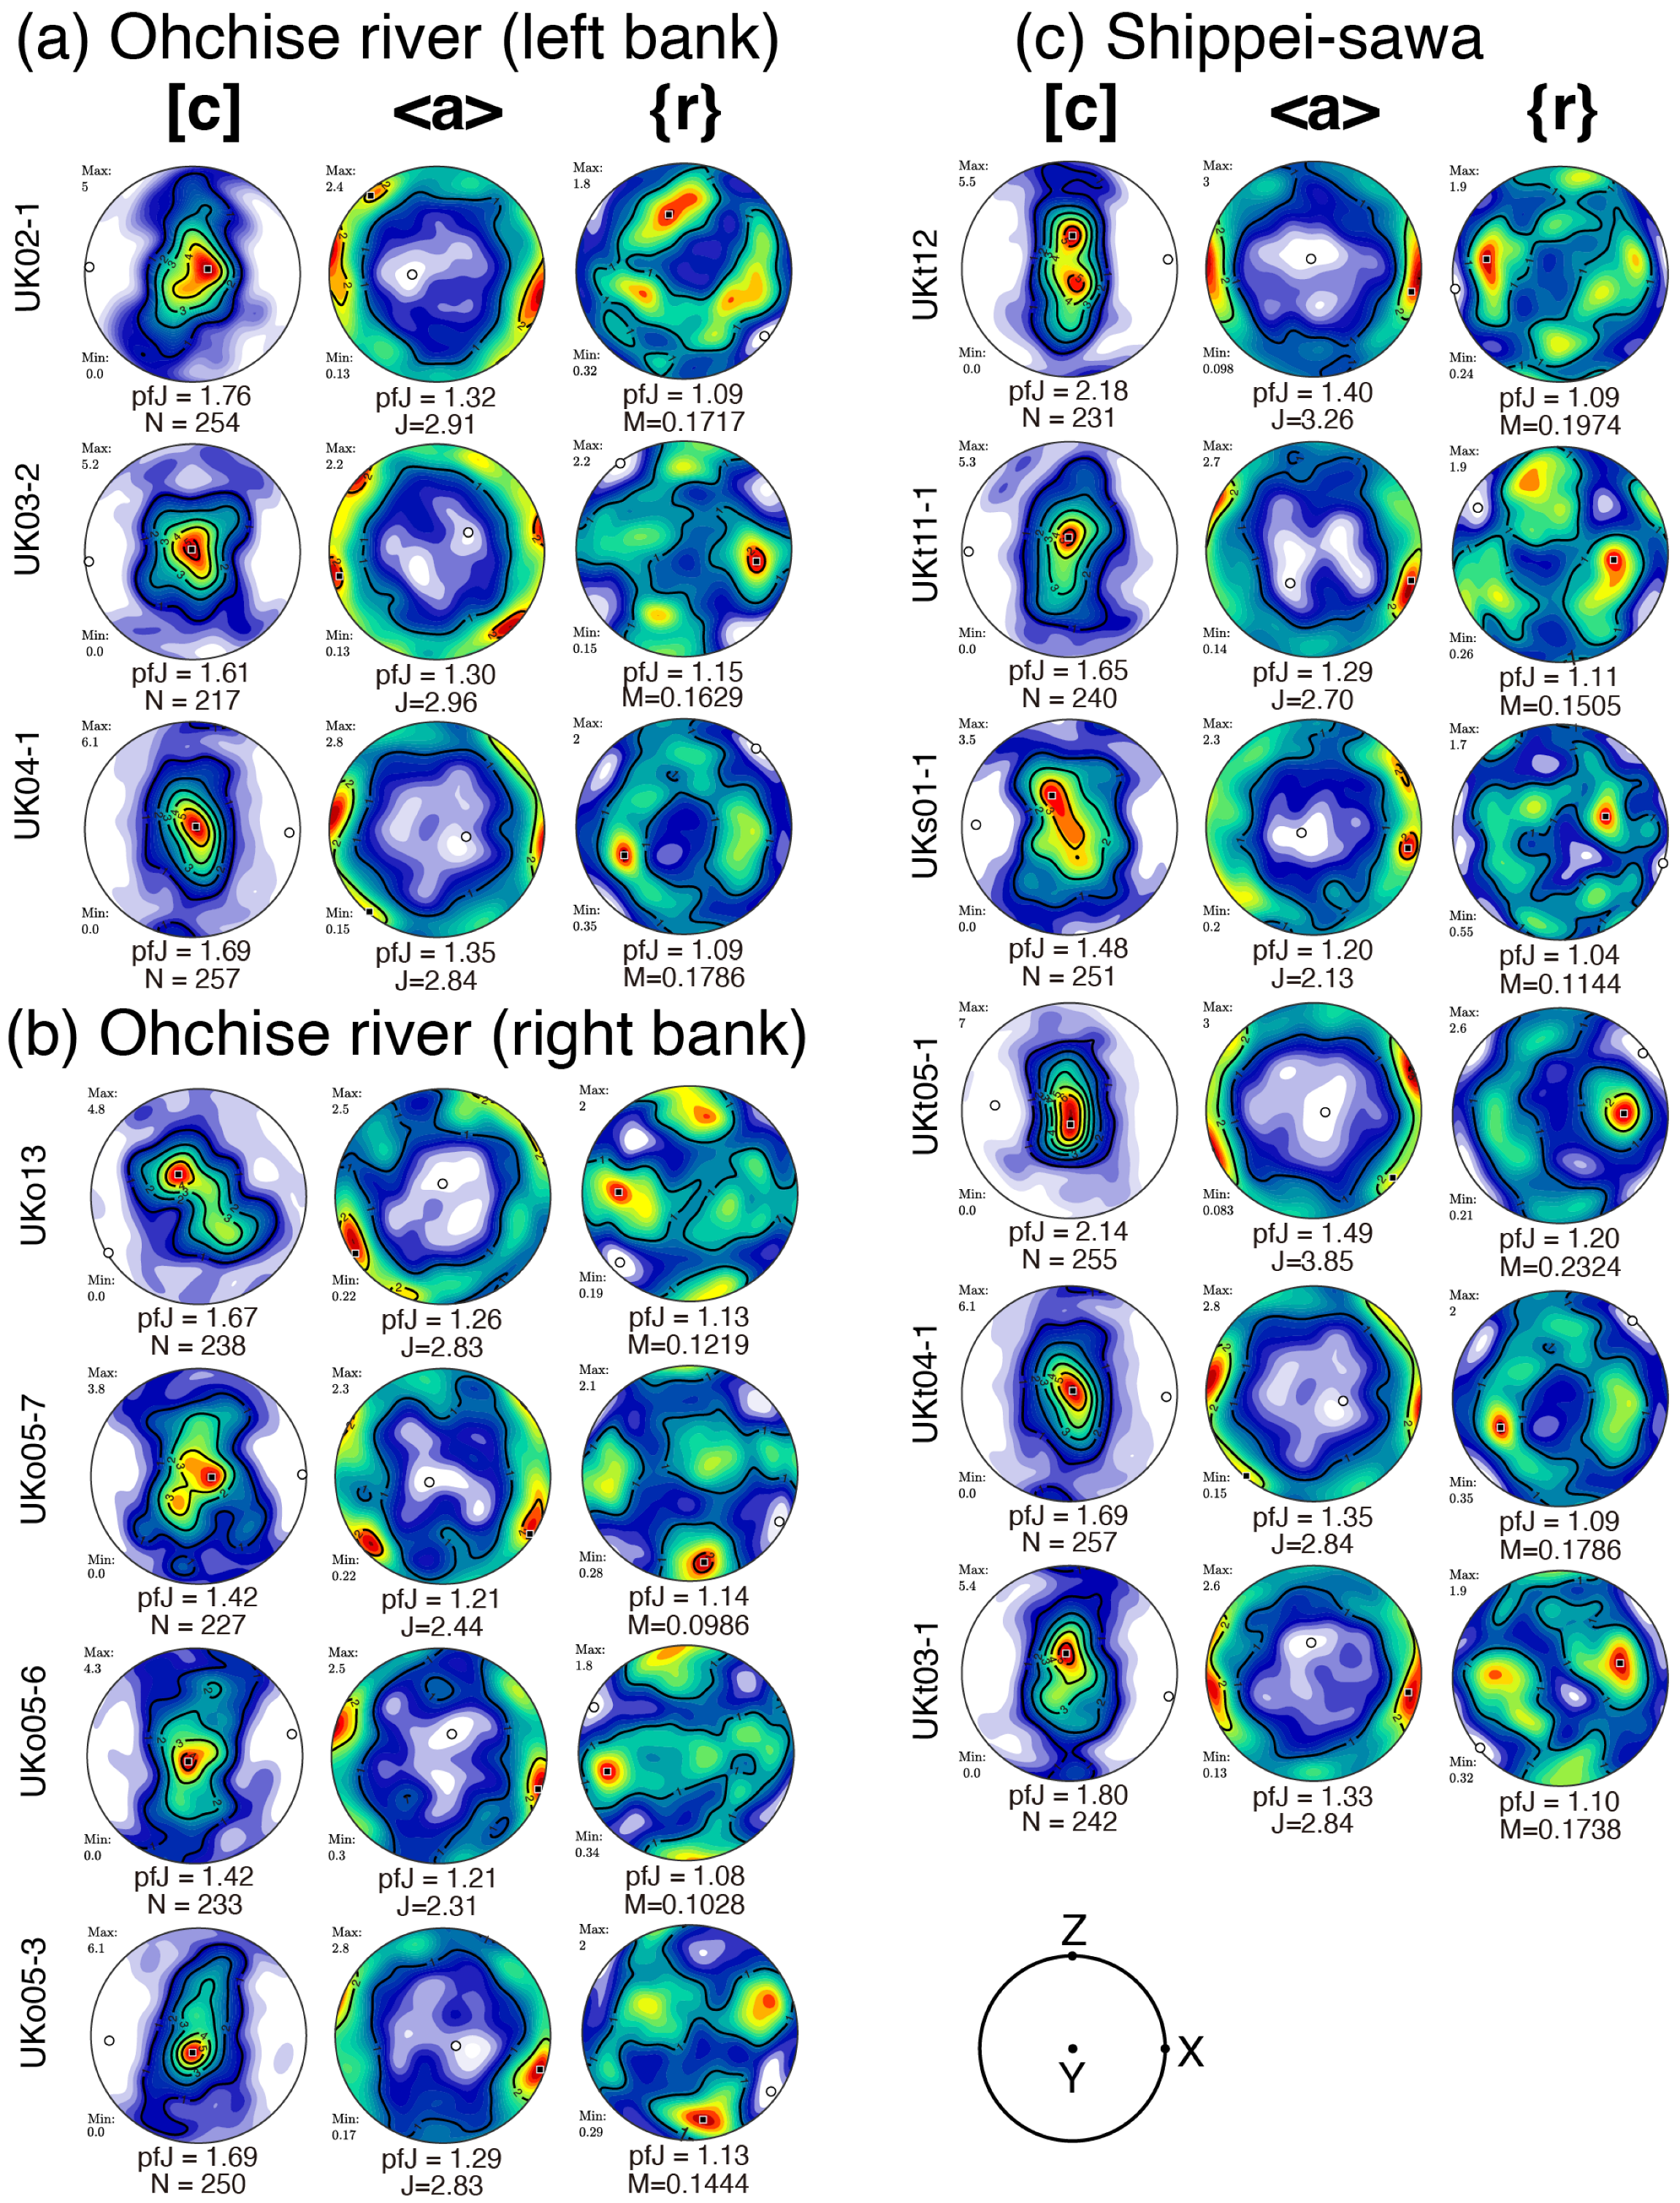
Among the quartz crystal fabrics with crystallographic axes [c], <a>, and {r} (Figure 6), most have c-axes closely aligned with the Y-axis, whereas a few c-axes are weakly aligned with the Z-axis. For fabric intensities, we found J- and M-index values ranged between 2.31–3.85 and 0.0986–0.2324, respectively (Figure 5 and Figure 6). Although one mylonite sample (UKt05-1) had notably high J- and M-index values, the others were found to have similar fabric intensities regardless of both textural type and mean grain size (Figure 4, Figure 5 and Figure 6).

4.2. Microstructures and Crystallographic Preferred Orientations for UK04-1 Mylonite

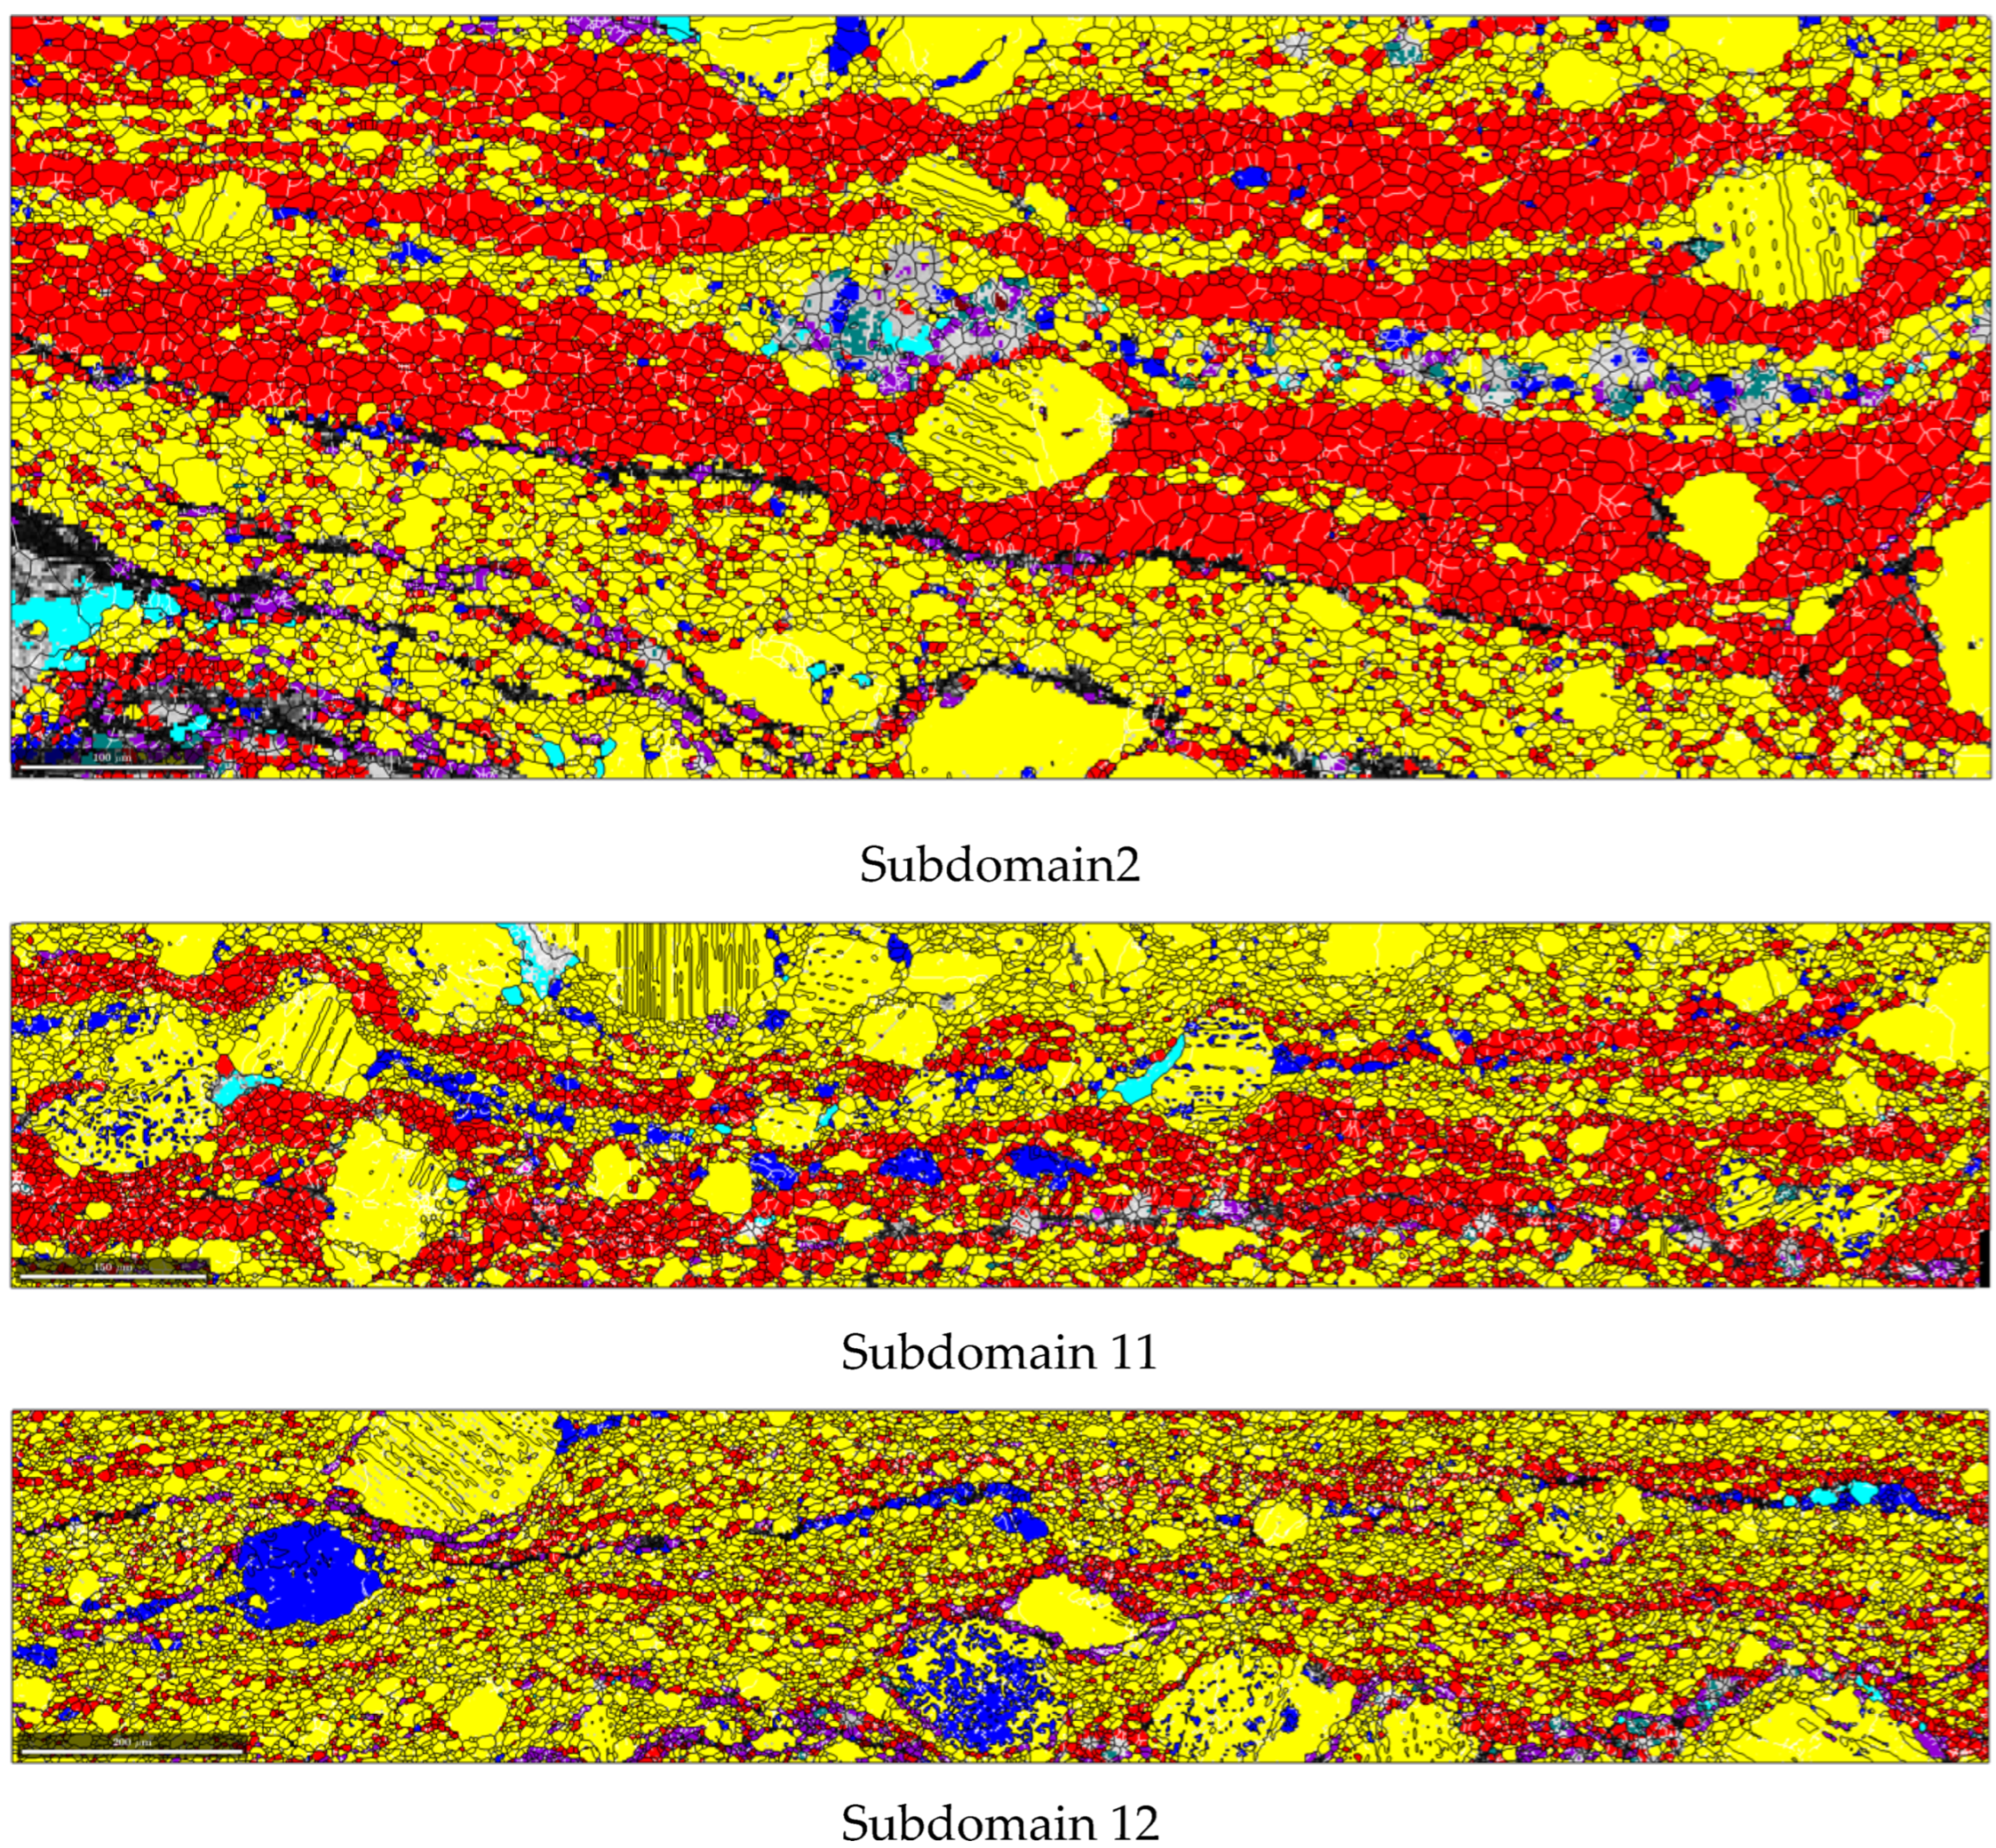
UK04-1 mylonite was chosen to examine the mixing of quartz and plagioclase composites, as it represents the common mean grain size and crystal fabric of quartz (Figure 5) with no cataclastic overprinting. We mapped a rectangular domain rich in fine-grained plagioclase in the UK04-1 mylonite (Figure 7). The EBSD phase map revealed that the UK04-1 mylonite consists predominantly of quartz and plagioclase with small amounts of other minerals (Figure 7b). Within this domain, we recognized a compositional-layering structure consisting of fine-grained quartz-rich layers, fine-grained plagioclase-rich layers, and mixed quartz-plagioclase layers (Figure 7b). In the quartz–plagioclase mixed layers, some isolated quartz grains occurred in the plagioclase matrix, and vice versa. Some entrained grains developed parallel to mylonitic foliation. These observations suggest that the compositional layers became severely attenuated and eventually disaggregated to form mixed aggregates [18]. To characterize each compositional layer, we used an EBSD map to select 20 subdomains (Figure 7b and Figure 8; see also Figures S1 and S2 for all subdomains), for which we calculated the mineral modes of quartz and plagioclase, as well as their grain sizes and CPOs (Figure 9 and Figure 10; see also Figures S3–S6 for all the subdomains).
The modal quartz ranges from ~9.5% to 81%, which roughly corresponds to the range of the modal plagioclase at 7.0% to 78% (Figure 10a). Quartz grain sizes decrease from 7.9 to 4.9 µm with decreasing modal quartz, whereas plagioclase grain sizes were almost constant at ~5.5 µm but slightly increased with decreasing modal quartz (Figure 10b). The quartz J-index also decreases from 2.91 to 1.12 (i.e., almost random fabric) with decreasing modal quartz, whereas the plagioclase J-index tentatively decreases from 1.59 to 1.18 (i.e., nearly random fabric) with a few higher J-index values, such as 3.13, with decreasing modal quartz (Figure 10c).

5. Interpretation and Discussion

5.1. Grain Sizes of Recrystallized Quartz Aggregates in the Kashio Shear Zone

Because dynamic recrystallization is one of the key mechanisms of grain size reduction in shear zones, quartz is generally thought to approach a steady-state microstructure by such a mechanism, thereby reflecting the flow stresses in dislocation creep (e.g., [49,50]). Therefore, microstructural characterization has been studied extensively in the Kashio shear zone, particularly the average grain size of quartz (e.g., [20,22,27,28,29,33,51,52,53]). In the Urakawa area, grain sizes of dynamically recrystallized quartz in mylonites and ultramylonites range within 6.2–14.5 µm and average 8.8 µm (Figure 5a). Although this is much smaller than the previous estimate of 37 µm for the steady-state grain size [53], the application of the more recent, sophisticated EBSD method revealed that finer grain sizes of quartz are more common in the Kashio shear zone. For instance, Okudaira and Shigematsu [20] reported mean grain sizes of 2.5–3.1 µm in mylonite and ultramylonite in the Matsusaka–Iitaka area (Mie Prefecture), and Nakamura et al. [29] found the mean grain sizes in mylonite and ultramylonites close to the MTL at Ohshika area (Nagano Prefecture) to be in the range 8.6–11.8 µm. The mean grain sizes of quartz aggregates vary laterally along the MTL; this variation could result from various exhumation and erosion levels (e.g., [29]) or a different stress level in the Kashio shear zone.

5.2. Crystal Fabrics of Quartz in the Kashio Shear Zone

Quartz CPOs are generally classified into four types: crossed girdle, single girdle, Y-maxima, and X-maxima (e.g., [5,54]). Crossed-girdle fabrics are divided into Types I and II [54,55]. Schmid and Casey [54] thought single-girdle fabric developed with increasing strain from Type I crossed-girdle fabric. The development of these fabrics is presumed to vary depending on the temperature, as dominant slip systems are very sensitive to temperature (e.g., [56]). In general, the temperature dependence for the formation of fabric patterns is considered as follows: low temperature (~300–450 °C) for both crossed-girdle and single-girdle patterns, medium temperature (450–600 °C) for Y-maxima patterns, and high temperature (≥600 °C) for X-maxima patterns [5,57,58,59].
In this study, the c-axis fabrics showed Type I crossed-girdle, single-girdle, and Y-maxima fabric patterns (Figure 6), although both Type I and single-girdle fabrics tended to have a concentration of c-axes in the Y-axis. These fabrics indicate basal <a>, rhombic <a>, and prismatic <a> activation [54,58]. The combination of these slip systems suggests that the deformation could have resulted in lower greenschist facies under low-temperature conditions (~300–450 °C) [5,57,58], whereas Y-maxima fabrics formed by prism <a> slip systems appear to have formed under intermediate temperature conditions (450–600 °C) [54,58].
Moreover, Muto et al. [60] concluded that Y-maxima fabrics developed under increasing shear strain, based on their shear-deformation experiment applied to a single crystal. They also suggested that the development of fabrics with maximum Y-axis causes geometrical softening. In the IPF maps, reddish grains facing toward the Y-axis show straight grain boundaries, and their morphology is similar to that of the elongated ribbon grains (Figure 3). This texture implies that originally elongated grains within the Y-maxima fabrics cause geometrical softening, selectively activating prism <a> slip during subsequent deformation. This implies that the reddish grains in the IPF maps may not only preserve a part of high-temperature fabrics, such as Y-maxima, even during subsequent low-temperature deformation, but also that originally elongated grains may have been reworked during subsequent deformation. Nonetheless, based on the c-axis fabrics, we assume that the quartz-deformation mechanism is dislocation creep, which possibly developed at temperatures in the range of 400–500 °C. This is also supported by the coexistence of biotite and chlorite in the mylonites and greenschist-facies metamorphic minerals that form in this temperature range [61].

5.3. Deformation in the Quartz–Plagioclase Composite

5.3.1. Grain Size and Crystal Fabric

We set out to confirm the deformation mechanism of the variable plagioclase-rich layers found in the quartz–plagioclase composites (Figure 2 and Figure 7). Although our subdomains contain inhomogeneous microstructures (Figure 8; see also Figures S1 and S2 for all subdomains), there was a remarkably clear correlation between the quartz and plagioclase modes (Figure 10a). We found that the quartz grain size decreased to ~5 µm where the quartz mode was <60% (Figure 10b). In contrast, the plagioclase grain sizes were nearly constant at ~5 µm, except in the vicinity of the lowest quartz mode (Figure 10b), where the modal plagioclase was >60% (Figure 10a). Where the quartz mode is the lowest, plagioclase porphyroclasts and larger disaggregated pieces are present, and these layers are stronger. Thus, the strain was absorbed by weaker quartz-rich layers. Moreover, the presence of larger quartz grains where there is less plagioclase indicates mobile grain boundaries, which could be dynamic grain boundary migration, rather than normal grain growth.
The grain sizes can be compared with the crystal-fabric intensities (J-indices) of both quartz and plagioclase (Figure 10c). For quartz crystal fabrics, the J-index is >2.5 for higher quartz modes (>60%), whereas the J-index values are notably lower closer to a random fabric (i.e., J-index = 1) as quartz modes decrease (Figure 10c). Accordingly, the deformation mechanism of quartz is inferred to change from dislocation creep in the higher quartz mode to a GSS creep in the lower quartz mode. For plagioclase crystal fabrics, the J-index tends to decrease as the quartz modes decrease (while the plagioclase modes increase) (Figure 10c). Finer grain sizes had to develop before GSS creep occurred. The presence of porphyroclasts with recrystallized tails and fine-scale plagioclase grains, some with subgrain size/shape and the irregular/sutured grain boundaries, suggests that dislocation and/or fracturing deformation drove dynamic recrystallization to develop small grain size, then deformation could change to GSS creep (Figure 7). In fact, given that there are two subdomains where the J-index of plagioclase is >2 (Figure 10c), dislocation creep might be locally active at the subdomain level, although the grain sizes are comparable across all subdomains (Figure 10b).

5.3.2. Viscosity Contrast Estimate

Microstructural analyses of mylonite (sample UK04-1) revealed that the weakening of the crystal fabrics and concurrent grain-size reduction appeared to be correlated with the quartz–plagioclase modal composition (Figure 9 and Figure 10). Myrmekite nucleation results in grain size reduction and anti-clustered phase mixing by the heterogeneous nucleation of quartz and plagioclase (e.g., [62]). The mylonite samples studied here were derived from tonalites, with minor K-feldspar. The formation of myrmekite may be limited and negligible in the formation of the quartz-plagioclase mixtures. In fact, plagioclase-rich layers that laterally developed into plagioclase porphyroclasts do not contain many quartz grains (middle part of Figure 7b).
As quartz–plagioclase phase mixing is likely in Figure 8 and Figure S2, we calculated the viscosity contrast as a function of stress, grain size, and temperature for the quartz–plagioclase composites under wet conditions, as proposed by Cross et al. [18] (Figure 11). The viscosities of the quartz- and plagioclase-rich layers were calculated using laboratory-derived flow laws for wet quartz [11,63,64] and wet plagioclase (Ab100) ([65] (Table 1). Fukuda et al.’s [63] quartz-flow law depends on grain size with a small exponent (0.51 ± 0.13) and may result from a combination of intracrystalline and grain-boundary processes. Therefore, their quartz-flow law is not for pure diffusion creep, but rather for mixed diffusion and dislocation creep near the field boundary between diffusion and dislocation creep. The values of the J-index for the quartz CPOs in the subdomains with a quartz modal abundance of <~30% are almost unity (Figure 10c), suggesting a random distribution and the interpretation of deformation of quartz aggregates as an effective grain-boundary process. In this study, we also applied Fukuda et al.’s [63] quartz flow law to evaluate the stress and strain rates of quartz near the field boundary between diffusion and dislocation creep (Figure S7). Water fugacities were calculated as a function of temperature and pressure, after Shinevar et al. [66]. We assumed isostress conditions for the layered mylonites, following Cross et al. [18]. We set the deformation temperature to 400–500 °C. According to Yamamoto [28], the depth of the subhorizontal Kashio mylonite zone may be ~10 km; thus, we assumed the pressure condition for mylonitization to be 300 MPa.
As a result, the field boundaries of dislocation and diffusion creep, plagioclase–quartz viscosity contrast ratios, and strain rates can be drawn in the grain size and stress space (Figure 11). The four deformation domains can be identified as: (1) dislocation creep of quartz and plagioclase, (2) dislocation creep of quartz and diffusion creep of plagioclase, (3) diffusion creep of quartz and plagioclase, and (4) diffusion creep of quartz and dislocation creep of plagioclase. The fourth deformation domain is recognizable among the Fukuda et al.’s [63] flow-law cases (Figure S7). We also compared the piezometric relations for quartz and plagioclase according to Twiss [67] (Figure 11).
The piezometric relation for quartz is within the dislocation field or near the field boundary between diffusion and dislocation creep (Figure 11), suggesting that the grain-size reduction process of quartz was dynamic recrystallization, and the estimated field boundary for quartz was valid, although the piezometric relations may depend on temperature (e.g., [50,68,69]). The quartz grain sizes in the subdomains of a two-phase mixture are smaller than those in the subdomains with almost a single phase (Figure 10b), implying that the former is not equilibrated with applied stress owing to second-phase suppression.
In contrast, the piezometric relation for plagioclase was within the diffusion creep field (Figure 11), suggesting that dynamic recrystallization reduced the grain size and subsequent deformation caused by GSS creep. Thus, the deformation mechanisms of the quartz- and plagioclase-rich layers can be interpreted as the grain-size-insensitive dislocation creep and GSS creep, respectively. Accordingly, the viscosity of quartz-rich layers does not depend on their grain size, unlike that of plagioclase-rich layers. The plagioclase grain sizes of plagioclase-rich (>70%) layers are within 5–6 µm, and given that the viscosity contrast of plagioclase to quartz is 1, the stress can be estimated to be 100–120 MPa (Figure 11), which is comparable to the stress estimated by the piezometric relation for dynamically recrystallized quartz grains that are 8.8 µm in size (Figure 11). Although these stresses are independently estimated using different methods, they nonetheless correspond to each other. At the assumed stress level, the strain rates at the viscosity contrast of 1 were 10−11 s−1 at 400 °C and 10−9 s−1 at 500 °C (Figure 11), implying an effective viscosity of ~1017–1019 Pa·s. This suggests that both quartz- and plagioclase-rich layers in the studied mylonite (UK04-1) (Figure 2 and Figure 7) could be nearly equally developed during the progressive retrogression under low viscosity contrast between quartz and plagioclase (Figure 12) and thus the ultramylonites are homogeneously and totally weakened. In addition, it is likely that although the deformation mechanism map of quartz is within the field of dislocation creep (Figure 11), a change of the deformation mechanism to GSS creep occurred in the quartz of the plagioclase-rich layer.

5.4. Low Viscosity Contrast Enhancing the Mylonitic Foliations

We propose that well-developed layering within both the monophase (i.e., quartz- and plagioclase-rich layers) and polyphase domains in the Kashio mylonite could result from deformation under the low-viscosity contrast between quartz and plagioclase, whereby the deformation mechanisms of quartz and plagioclase are dislocation creep and GSS diffusion creep, respectively. Our findings are consistent with Cross et al.’s [18] prediction of the deformation mechanisms of quartz and plagioclase. Our research strongly suggests that dominantly isoviscous behavior could also be characteristic of the center of the shear zones, given that our results, such as grain size reduction and microstructural development, commonly characterize many other natural shear zones [14]. It is noted that this isoviscous behavior occurred at the late stage of mylonitization once the plagioclase grain sizes were reduced and GSS creep commenced, while there were undoubtedly higher viscosity contrasts early in deformation history.
In general, the dislocation creep of plagioclase is assumed to develop at high temperatures (>500–600 °C), whereas at lower temperatures, plagioclase acts as a rigid mineral and deforms mainly by fracturing [70]. We conclude that the GSS creep of plagioclase occurred under middle crustal conditions, inferred based on the low fabric intensity of plagioclase CPOs in the granitic mylonites developed near the MTL. The GSS creep (i.e., granular flow or grain boundary sliding) of fine-grained plagioclase aggregates has frequently been reported in studies of lower crustal gabbros (e.g., [12,71,72]), and the GSS creep of plagioclase has also been observed in upper crustal rocks (e.g., [73,74,75]). These observations imply that the GSS creep of fine-grained plagioclase-rich aggregates developed in highly strained shear zones throughout the continental crust. Because the effective viscosity of plagioclase aggregates deformed by GSS creep is significantly lower than that of dislocation creep, this implies that the development of GSS creep of plagioclase in continental middle crust rocks is essential to consider the crustal-rheology model or crustal-strength profile.

6. Conclusions

To investigate the possible crustal deformation mechanisms, we studied 13 mylonites and ultramylonites obtained from the Kashio shear zone along the MTL, which is the largest strike-slip fault in Japan. Grain sizes of dynamically recrystallized quartz in the mylonites and ultramylonites range within 6.2–14.5 µm and average 8.8 µm. The c-axis fabrics showed Type I crossed-girdle, single-girdle, and Y-maxima fabric patterns, although both Type I crossed-girdle and single-girdle fabrics tended to have a concentration of c-axes in the Y-axis. These fabrics indicate basal <a>, rhomb <a>, and prism <a> activation. Based on the c-axis fabrics, the quartz-deformation mechanism could be dislocation creep, which possibly developed at temperatures in the range of 400–500 °C.
A high-quality phase-orientation map obtained by EBSD for UK04-1 mylonite, which represents the common mean grain size and crystal fabric of quartz among the studied samples, showed a wide modal range of the quartz–plagioclase mixing, including quartz modes ranging from 10% to 80%. The map also reveals that quartz shows grain-size reduction and crystal fabric weakening, indicating a change in the deformation mechanism from dislocation creep to GSS creep with decreasing modal quartz. In contrast, plagioclase shows an almost constant grain size and weak to random crystal fabrics, regardless of the modal composition, indicating that GSS creep is consistently dominant in plagioclase in the fine-grained matrix. Combined with laboratory-derived flow laws, our results show that the Kashio shear zone may have developed under conditions where viscosity contrasts between quartz and plagioclase are nearly comparable at the late stage of mylonitization once the plagioclase grain sizes were reduced and GSS creep commenced, with effective viscosity on the order of 1017–1019 Pa·s, thereby possibly enabling a large amount of shearing associated with the Median Tectonic Line.

Supplementary Materials

The following supporting information can be downloaded at: https://www.mdpi.com/article/10.3390/min14030229/s1, Figure S1: Crystallographic orientation maps, Figure S2: Phase maps of all subdomains, Figure S3: Grain size distributions of quartz in all subdomains, Figure S4: CPOs of quartz in all subdomains, Figure S5: Grain size distributions of plagioclase in all subdomains, Figure S6: CPOs of plagioclase in all subdomains, Figure S7: Viscosity contrast maps for wet quartz-plagioclase composite.

Author Contributions

Conceptualization, K.M. and T.O.; methodology, K.M.; software, K.M. and T.O.; validation, K.M. and T.O.; formal analysis, H.E. and K.M.; investigation, H.E. and K.M.; resources, K.M. and T.O.; data curation, H.E., K.M. and D.M.; writing—original draft preparation, H.E. and K.M.; writing—review and editing, K.M. and T.O.; visualization, H.E., K.M. and T.O.; supervision, K.M.; funding acquisition, K.M. All authors have read and agreed to the published version of the manuscript.

Funding

This work was supported by research grants awarded by the Japan Society of the Promotion of Science to K.M. (Kiban-A 22244062, Kiban-S 16H06347, Kiban-B 20H02005, Kiban-B 23H01272) and to T.O. (Kiban-C 20K04087 and Kiban-C 23K03531).

Data Availability Statement

Data will be made available on request.

Acknowledgments

We would like to thank Toshiaki Masuda, Hidemi Ishibashi, Kenichi Hirauchi, and the members of Rock and Mineral Laboratory in Nagoya University for fruitful discussions, Fabrice Barou for supporting EBSD analysis in Montpellier, and three anonymous reviewers for their thoughtful comments.

Conflicts of Interest

The authors declare no conflicts of interest.

References

  1. Kohlstedt, D.L.; Evans, B.; Mackwell, S.J. Strength of the lithosphere: Constraints imposed by laboratory experiments. J. Geophys. Res. 1995, 100, 17587–17602. [Google Scholar] [CrossRef]
  2. Bürgmann, R.; Dresen, G. Rheology of the lower crust and upper mantle: Evidence from rock mechanics, geodesy, and field observations. Annu. Rev. Earth Planet. Sci. 2008, 36, 531–567. [Google Scholar] [CrossRef]
  3. Poirier, J.P. Creep of Crystals; Cambridge University Press: Cambridge, UK, 1985; 260p. [Google Scholar] [CrossRef]
  4. Hirth, G.; Tullis, J. Dislocation creep regimes in quartz aggregates. J. Struct. Geol. 1992, 14, 145–159. [Google Scholar] [CrossRef]
  5. Passchier, C.W.; Trouw, R.A.J. Microtectonics, 2nd ed.; Springer: Berlin/Heidelberg, Germany, 2005; 106p. [Google Scholar] [CrossRef]
  6. Kanagawa, K.; Shimano, H.; Hiroi, Y. Mylonitic deformation of gabbro in the lower crust: A case study from the Pankenushi gabbro in the Hidaka metamorphic belt of central Hokkaido, Japan. J. Struct. Geol. 2008, 30, 1150–1166. [Google Scholar] [CrossRef]
  7. Hiraga, T.; Miyazaki, T.; Tasaka, M.; Yoshida, H. Mantle superplasticity and its self-made demise. Nature 2010, 468, 1091–1094. [Google Scholar] [CrossRef] [PubMed]
  8. Karato, S. Deformation of Earth Materials; Cambridge University Press: New York, NY, USA, 2012; 482p. [Google Scholar] [CrossRef]
  9. Coble, R.L. A model for grain-boundary controlled creep in polycrystalline materials. J. Appl. Phys. 1963, 34, 31–63. [Google Scholar] [CrossRef]
  10. Gifkins, R.C. Grain boundary sliding and its accommodation during creep and superplasticity. Metall. Trans. A 1976, 7, 1225–1232. [Google Scholar] [CrossRef]
  11. Rutter, E.H.; Brodie, K.H. Experimental grain size-sensitive flow of hot-pressed Brazilian quartz aggregates. J. Struct. Geol. 2004, 26, 2011–2023. [Google Scholar] [CrossRef]
  12. Kruse, R.; Stünitz, H. Deformation mechanisms and phase distribution in mafic high-temperature mylonites from the Jotun Nappe, southern Norway. Tectonophysics 1999, 303, 223–249. [Google Scholar] [CrossRef]
  13. Mulyukova, E.; Bercovici, D. The generation of plate tectonics from grains to global scales: A brief review. Tectonics 2019, 38, 4058–4076. [Google Scholar] [CrossRef]
  14. Cross, A.J.; Skemer, P. Ultramylonite generation via phase mixing in high-strain experiments. J. Geophys. Res. Solid Earth 2017, 122, 1744–1759. [Google Scholar] [CrossRef]
  15. Bercovici, D.; Skemer, P. Grain damage, phase mixing and plate-boundary formation. J. Geodyn. 2017, 108, 40–55. [Google Scholar] [CrossRef]
  16. Tasaka, M.; Hiraga, T.; Michibayashi, K. Influence of mineral fraction on the rheological properties of forsterite + enstatite during grain size sensitive creep: 3. Application of grain growth and flow laws on peridotite ultramylonite. J. Geophys. Res. Solid Earth 2014, 119, 840–857. [Google Scholar] [CrossRef]
  17. Gilgannon, J.; Fusseis, F.; Menegon, L.; Regenauer-Lieb, K.; Buckman, J. Hierarchical creep cavity formation in an ultramylonite and implications for phase mixing. Solid Earth 2017, 8, 1193–1209. [Google Scholar] [CrossRef]
  18. Cross, A.J.; Olree, E.; Couvy, H.; Skemer, P. How does viscosity contrast influence phase mixing and strain localization? J. Geophys. Res. Solid Earth 2020, 125, e2020JB020323. [Google Scholar] [CrossRef]
  19. Hacker, B.R.; Yin, A.; Christie, J.M.; Davis, G.A. Stress magnitude, strain rate, and rheology of extended middle continental crust inferred from quartz grain sizes in the Whipple Mountains, California. Tectonics 1992, 11, 36–46. [Google Scholar] [CrossRef]
  20. Okudaira, T.; Shigematsu, N. Estimates of stress and strain rate in mylonites based on the boundary between the fields of grain-size sensitive and insensitive creep. J. Geophys. Res. 2012, 117, B03210. [Google Scholar] [CrossRef]
  21. Michibayashi, K.; Makino, T.; Yoshida, S. ‘Xenolith windows’: Intensely deformed mylonites entrained in the Tenryukyo granite, the Ryoke belt, central Honshu, Japan. J. Geol. Soc. Jpn. 1997, 103, 1053–1064. [Google Scholar] [CrossRef]
  22. Michibayashi, K.; Masuda, T. Shearing during progressive retrogression in granitoids: Abrupt grain size reduction of quartz at the plastic-brittle transition for feldspar. J. Struct. Geol. 1993, 15, 1421–1432. [Google Scholar] [CrossRef]
  23. Hara, I.; Shyoji, K.; Sakurai, Y.; Yokoyama, S.; Hide, K. Origin of the Median Tectonic Line and its initial shape. Mem. Geol. Soc. Jpn. 1980, 18, 27–49. [Google Scholar]
  24. Hayama, Y.; Yamada, T. Median Tectonic Line at the stage of its origin in relation to plutonism and mylonitization in the Ryoke belt. Mem. Geol. Soc. Jpn. 1980, 18, 5–26. [Google Scholar]
  25. Ichikawa, K. Geohistory of the Median Tectonic Line of southwest Japan. Mem. Geol. Soc. Jpn. 1980, 18, 187–212. [Google Scholar]
  26. Takagi, H. Mylonitic rocks along the Median Tectonic Line in Takato-Ichinose area, Nagano Prefecture. J. Geol. Soc. Jpn. 1984, 90, 81–100, (In Japanese with English abstract). [Google Scholar] [CrossRef]
  27. Takagi, H. Implications of mylonitic microstructures for the geotectonic evolution of the Median Tectonic Line, central Japan. J. Struct. Geol. 1986, 8, 3–14. [Google Scholar] [CrossRef]
  28. Yamamoto, H. Kinematics of mylonitic rocks along the Median Tectonic Line, Akaishi Range, central Japan. J. Struct. Geol. 1994, 16, 61–70. [Google Scholar] [CrossRef]
  29. Nakamura, Y.; Miyazaki, K.; Takahashi, Y.; Iwano, H.; Danhara, T.; Hirata, T. Amalgamation of the Ryoke and Sanbagawa metamorphic belts at the subduction interface: New insights from the Kashio mylonite along the Median Tectonic Line, Nagano, Japan. J. Metamorph. Geol. 2022, 40, 389–422. [Google Scholar] [CrossRef]
  30. Michibayashi, K.; Murooka, K.; Yasui, I. Mylonites in the Ryoke metamorphic belt drilled at 100 m away from the Median Tectonic Line, Misakubo, central Honshu, Japan. J. Geol. Soc. Jpn. 1999, 105, 200–207, (In Japanese with English abstract). [Google Scholar] [CrossRef]
  31. Hara, I.; Yamada, T.; Yokoyama, S.; Arita, M.; Hiraga, Y. Study on the southern marginal shear belt of the Ryoke metamorphic terrain-initial movement picture of the Median Tectonic Line. Chikyu Kagaku 1977, 31, 204–207, (In Japanese with English abstract). [Google Scholar]
  32. Masuda, T.; Yamamoto, H.; Michibayashi, K.; Ban, M. Re-examination of the location of the Median Tectonic Line at Misakubo, northwest Shizuoka Prefecture. Geosci. Rep. Shizuoka Univ. 1990, 16, 49–65, (In Japanese with English abstract). [Google Scholar]
  33. Yamamoto, H.; Masuda, T. Sub-horizontal ductile shearing in mylonites of the Ryoke belt in the Misakubo district, northwest Shizuoka Prefecture. Geosci. Rep. Shizuoka Univ. 1990, 16, 25–47, (In Japanese with English abstract). [Google Scholar]
  34. Kano, K.; Matsushima, N. The Shimanto Belt in the Akaishi Mountains, eastern part of SW Japan. Mod. Geol. 1988, 12, 97–126. [Google Scholar]
  35. Matsushima, N. New interpretation of Median tectonic line of the Akaishi mountain lands, in Japan. Iida City Mus. 1994, 4, 113–124. (In Japanese) [Google Scholar]
  36. Harada, T. Die Japanischen Inseln, Eine Topographische-Geologishe Ubersicht; Verlag von Paul Parey: Berlin, Germany, 1890; 142p, Available online: https://archive.org/details/diejapanischenin01hara/page/n137/mode/2up (accessed on 21 February 2024).
  37. Takagi, H. Ductile shear zones: Microstructures of mylonites. In Rheology of Solids and of the Earth; Karato, S., Toriumi, M., Eds.; Oxford University Press: London, UK, 1989; pp. 338–350. [Google Scholar]
  38. Takagi, H. Development of composite planar fabric in mylonites along the Median Tectonic Line, southwest Japan. Isl. Arc 1992, 1, 92–102. [Google Scholar] [CrossRef]
  39. Ohtomo, Y. Origin of the Median Tectonic Line. J. Sci. Hiroshima Univ. 1993, 9, 611–669. [Google Scholar]
  40. Makino, T.; Michibayashi, K. Whole-rock major element composition of the mylonites along the Median Tectonic Line, central Japan. Geosci. Rep. Shizuoka Univ. 1997, 24, 1–13, (In Japanese with English abstract). [Google Scholar]
  41. Michibayashi, K.; Ohtomo, Y. Mylonitic rocks along the Median Tectonic Line in the vicinity of Urakawa. Excursion Guide book. In Proceedings of the 110th Annual Meeting of the Geological Society of Japan, Shizuoka, Japan, 19–21 April 2003; Geological Society of Japan: Tokyo, Japan, 2003; pp. 11–20. (In Japanese). [Google Scholar]
  42. Okusa, S. Geology between Sakuma dam and Ikeda, central Japan -with special reference to the fault and joint system along the so-called Median Tectonic Line-. Assoc. Geol. Collab. Jpn. 1964, 74, 17–21, (In Japanese with English abstract). [Google Scholar]
  43. Ui, H.; Arata, S.; Furuichi, S.; Nishida, S. Mylonitic rocks along the Median Tectonic Line near the Aichi-Shizuoka Prefecture border -Quartz crystallinity index and observation by SEM-. J. Tecton. Res. Group Jpn. 1988, 33, 39–57. [Google Scholar]
  44. Nakai, Y.; Suzuki, K. CHIME monazite ages of the Kamihara Tonalite and Tenryukyo Granodiorite in the eastern Ryoke belt of central Japan. J. Geol. Soc. Jpn. 1996, 102, 431–439. [Google Scholar] [CrossRef]
  45. Asano, K.; Michibayashi, K.; Takebayashi, T. Rheological contrast between quartz and coesite generates strain localization in deeply subducted continental crust. Minerals 2021, 11, 842. [Google Scholar] [CrossRef]
  46. Mainprice, D.; Bachmann, F.; Hielscher, R.; Schaeben, H. Descriptive tools for the analysis of texture projects with large datasets using MTEX: Strength, symmetry, and components. Geol. Soc. Lond. Spec. Publ. 2014, 409, 223–249. [Google Scholar] [CrossRef]
  47. White, S. Geological significance of recovery and recrystallization processes in quartz. Tectonophysics 1977, 39, 143–170. [Google Scholar] [CrossRef]
  48. Skemer, P.; Katayama, I.; Jiang, Z.; Karato, S. The misorientation index: Development of a new method for calculating the strength of lattice-preferred orientation. Tectonophysics 2005, 411, 157–167. [Google Scholar] [CrossRef]
  49. Stipp, M.; Tullis, J. The recrystallized grain size piezometer for quartz. Geophys. Res. Lett. 2003, 30, 2088. [Google Scholar] [CrossRef]
  50. Shimizu, I. Theories and applicability of grainsize piezometers: The role of dynamic recrystallization mechanisms. J. Struct. Geol. 2008, 30, 899–917. [Google Scholar] [CrossRef]
  51. Hayashi, M.; Takagi, H. Shape fabric of recrystallized quartz in the mylonites along the Median Tectonic Line, southern Nagano Prefecture. J. Geol. Soc. Jpn. 1987, 93, 349–359, (In Japanese with English abstract). [Google Scholar] [CrossRef]
  52. Takagi, H.; Ito, M. The use of asymmetric pressure shadows in mylonites to determine the sense of shear. J. Struct. Geol. 1988, 10, 347–360. [Google Scholar] [CrossRef]
  53. Michibayashi, K. Syntectonic development of a strain-independent steady-state grain size during mylonitization. Tectonophysics 1993, 222, 151–164. [Google Scholar] [CrossRef]
  54. Schmid, S.M.; Casey, M. Complete fabric analysis of some commonly observed quartz C-axis patterns. Geophys. Monogr. 1986, 36, 263–286. [Google Scholar] [CrossRef]
  55. Lister, G.S.; Hobbs, B.E. The simulation of fabric development during plastic deformation and its application to quartzite: The influence of deformation history. J. Struct. Geol. 1980, 2, 355–370. [Google Scholar] [CrossRef]
  56. Tullis, J.; Christie, J.M.; Griggs, D.T. Microstructure and preferred orientation of experimentally deformed quartzites. Geol. Soc. Am. Bull. 1973, 86, 632–638. [Google Scholar] [CrossRef]
  57. Takeshita, T. Dynamic evolution of deformation microstructures in rocks. Physical conditions for deformation. Estimate of the physical conditions for deformation based on c-axis fabric transitions in naturally deformed quartzite. J. Geol. Soc. Jpn. 1996, 102, 211–222, (In Japanese with English abstract). [Google Scholar] [CrossRef]
  58. Toy, V.G.; Prior, D.J.; Norris, R.J. Quartz fabrics in the Alpine Fault mylonites: Influence of pre-existing preferred orientations on fabric development during progressive uplift. J. Struct. Geol. 2008, 30, 602–621. [Google Scholar] [CrossRef]
  59. Law, R.D. Deformation thermometry based on quartz c-axis fabrics and recrystallization microstructures: A review. J. Struct. Geol. 2014, 66, 129–161. [Google Scholar] [CrossRef]
  60. Muto, J.; Hirth, G.; Heilbronner, R.; Tullis, J. Plastic anisotropy and fabric evolution in sheared and recrystallized quartz single crystals. J. Geophys. Res. 2011, 116, B02206. [Google Scholar] [CrossRef]
  61. Nakamura, D. Comparison and interpretation of graphitization in contact and regional metamorphic rocks. Isl. Arc 1995, 4, 112–127. [Google Scholar] [CrossRef]
  62. Ceccato, A.; Menegon, L.; Pennacchioni, G.; Morales, L.F.G. Myrmekite and strain weakening in granitoid mylonites. Solid Earth 2017, 9, 1399–1419. [Google Scholar] [CrossRef]
  63. Fukuda, J.; Holyoke, C.W.; Kronenberg, A.K. Deformation of fine-grained quartz aggregates by mixed diffusion and dislocation creep. J. Geophys. Res. Solid Earth 2018, 123, 4676–4696. [Google Scholar] [CrossRef]
  64. Tokle, L.; Hirth, G.; Behr, W.M. Flow laws and fabric transitions in wet quartzite. Earth Planet. Sci. Lett. 2019, 505, 152–161. [Google Scholar] [CrossRef]
  65. Rybacki, E.; Dresen, G. Deformation mechanism maps for feldspar rocks. Tectonophysics 2004, 372, 215–233. [Google Scholar] [CrossRef]
  66. Shinevar, W.J.; Behn, M.D.; Hirth, G. Compositional dependence of lower crustal viscosity. Geophys. Res. Lett. 2015, 42, 8333–8340. [Google Scholar] [CrossRef]
  67. Twiss, R.J. Theory and applicability of a recrystallized grain size paleopiezometer. Pure Appl. Geophys. 1977, 115, 227–244. [Google Scholar] [CrossRef]
  68. De Bresser, J.H.P.; Ter Heege, J.H.; Spiers, C.J. Grain size reduction by dynamic recrystallization: Can it result in major rheological weakening? Int. J. Earth Sci. 2001, 90, 28–45. [Google Scholar] [CrossRef]
  69. Austin, N.J.; Evans, B. Paleowattmeters: A scaling relation for dynamically recrystallized grain size. Geology 2007, 35, 343–346. [Google Scholar] [CrossRef]
  70. Allard, M.; Ildefonse, B.; Oliot, É.; Barou, F. Plastic deformation of plagioclase in oceanic gabbro accreted at a slow-spreading ridge (Hole U1473A, Atlantis Bank, Southwest Indian Ridge). J. Geophys. Res. Solid Earth 2021, 126, e2021. [Google Scholar] [CrossRef]
  71. Okudaira, T.; Jerábek, P.; Stünitz, H.; Fusseis, F. High-temperature fracturing and subsequent grain-size-sensitive creep in lower crustal gabbros: Evidence for coseismic loading followed by creep during decaying stress in the lower crust? J. Geophys. Res. Solid Earth 2015, 120, 3119–3141. [Google Scholar] [CrossRef]
  72. Okudaira, T.; Shigematsu, N.; Harigane, Y.; Yoshida, K. Grain size reduction due to fracturing and subsequent grain-size-sensitive creep in a lower crustal shear zone in the presence of a CO2-bearing fluid. J. Struct. Geol. 2017, 95, 171–187. [Google Scholar] [CrossRef]
  73. Stünitz, H.; Gerald, J.D.F. Deformation of granitoids at low metamorphic grade. II: Granular flow in albite-rich mylonites. Tectonophysics 1993, 221, 299–324. [Google Scholar] [CrossRef]
  74. Ree, J.H.; Kim, H.S.; Han, R.; Jung, H. Grain-size reduction of feldspars by fracturing and neocrystallization in a low-grade granitic mylonite and its rheological effect. Tectonophysics 2005, 407, 227–237. [Google Scholar] [CrossRef]
  75. Fukuda, J.; Okudaira, T. Grain-size-sensitive creep of plagioclase accompanied by solution-precipitation and mass transfer under mid-crustal conditions. J. Struct. Geol. 2013, 51, 61–73. [Google Scholar] [CrossRef]
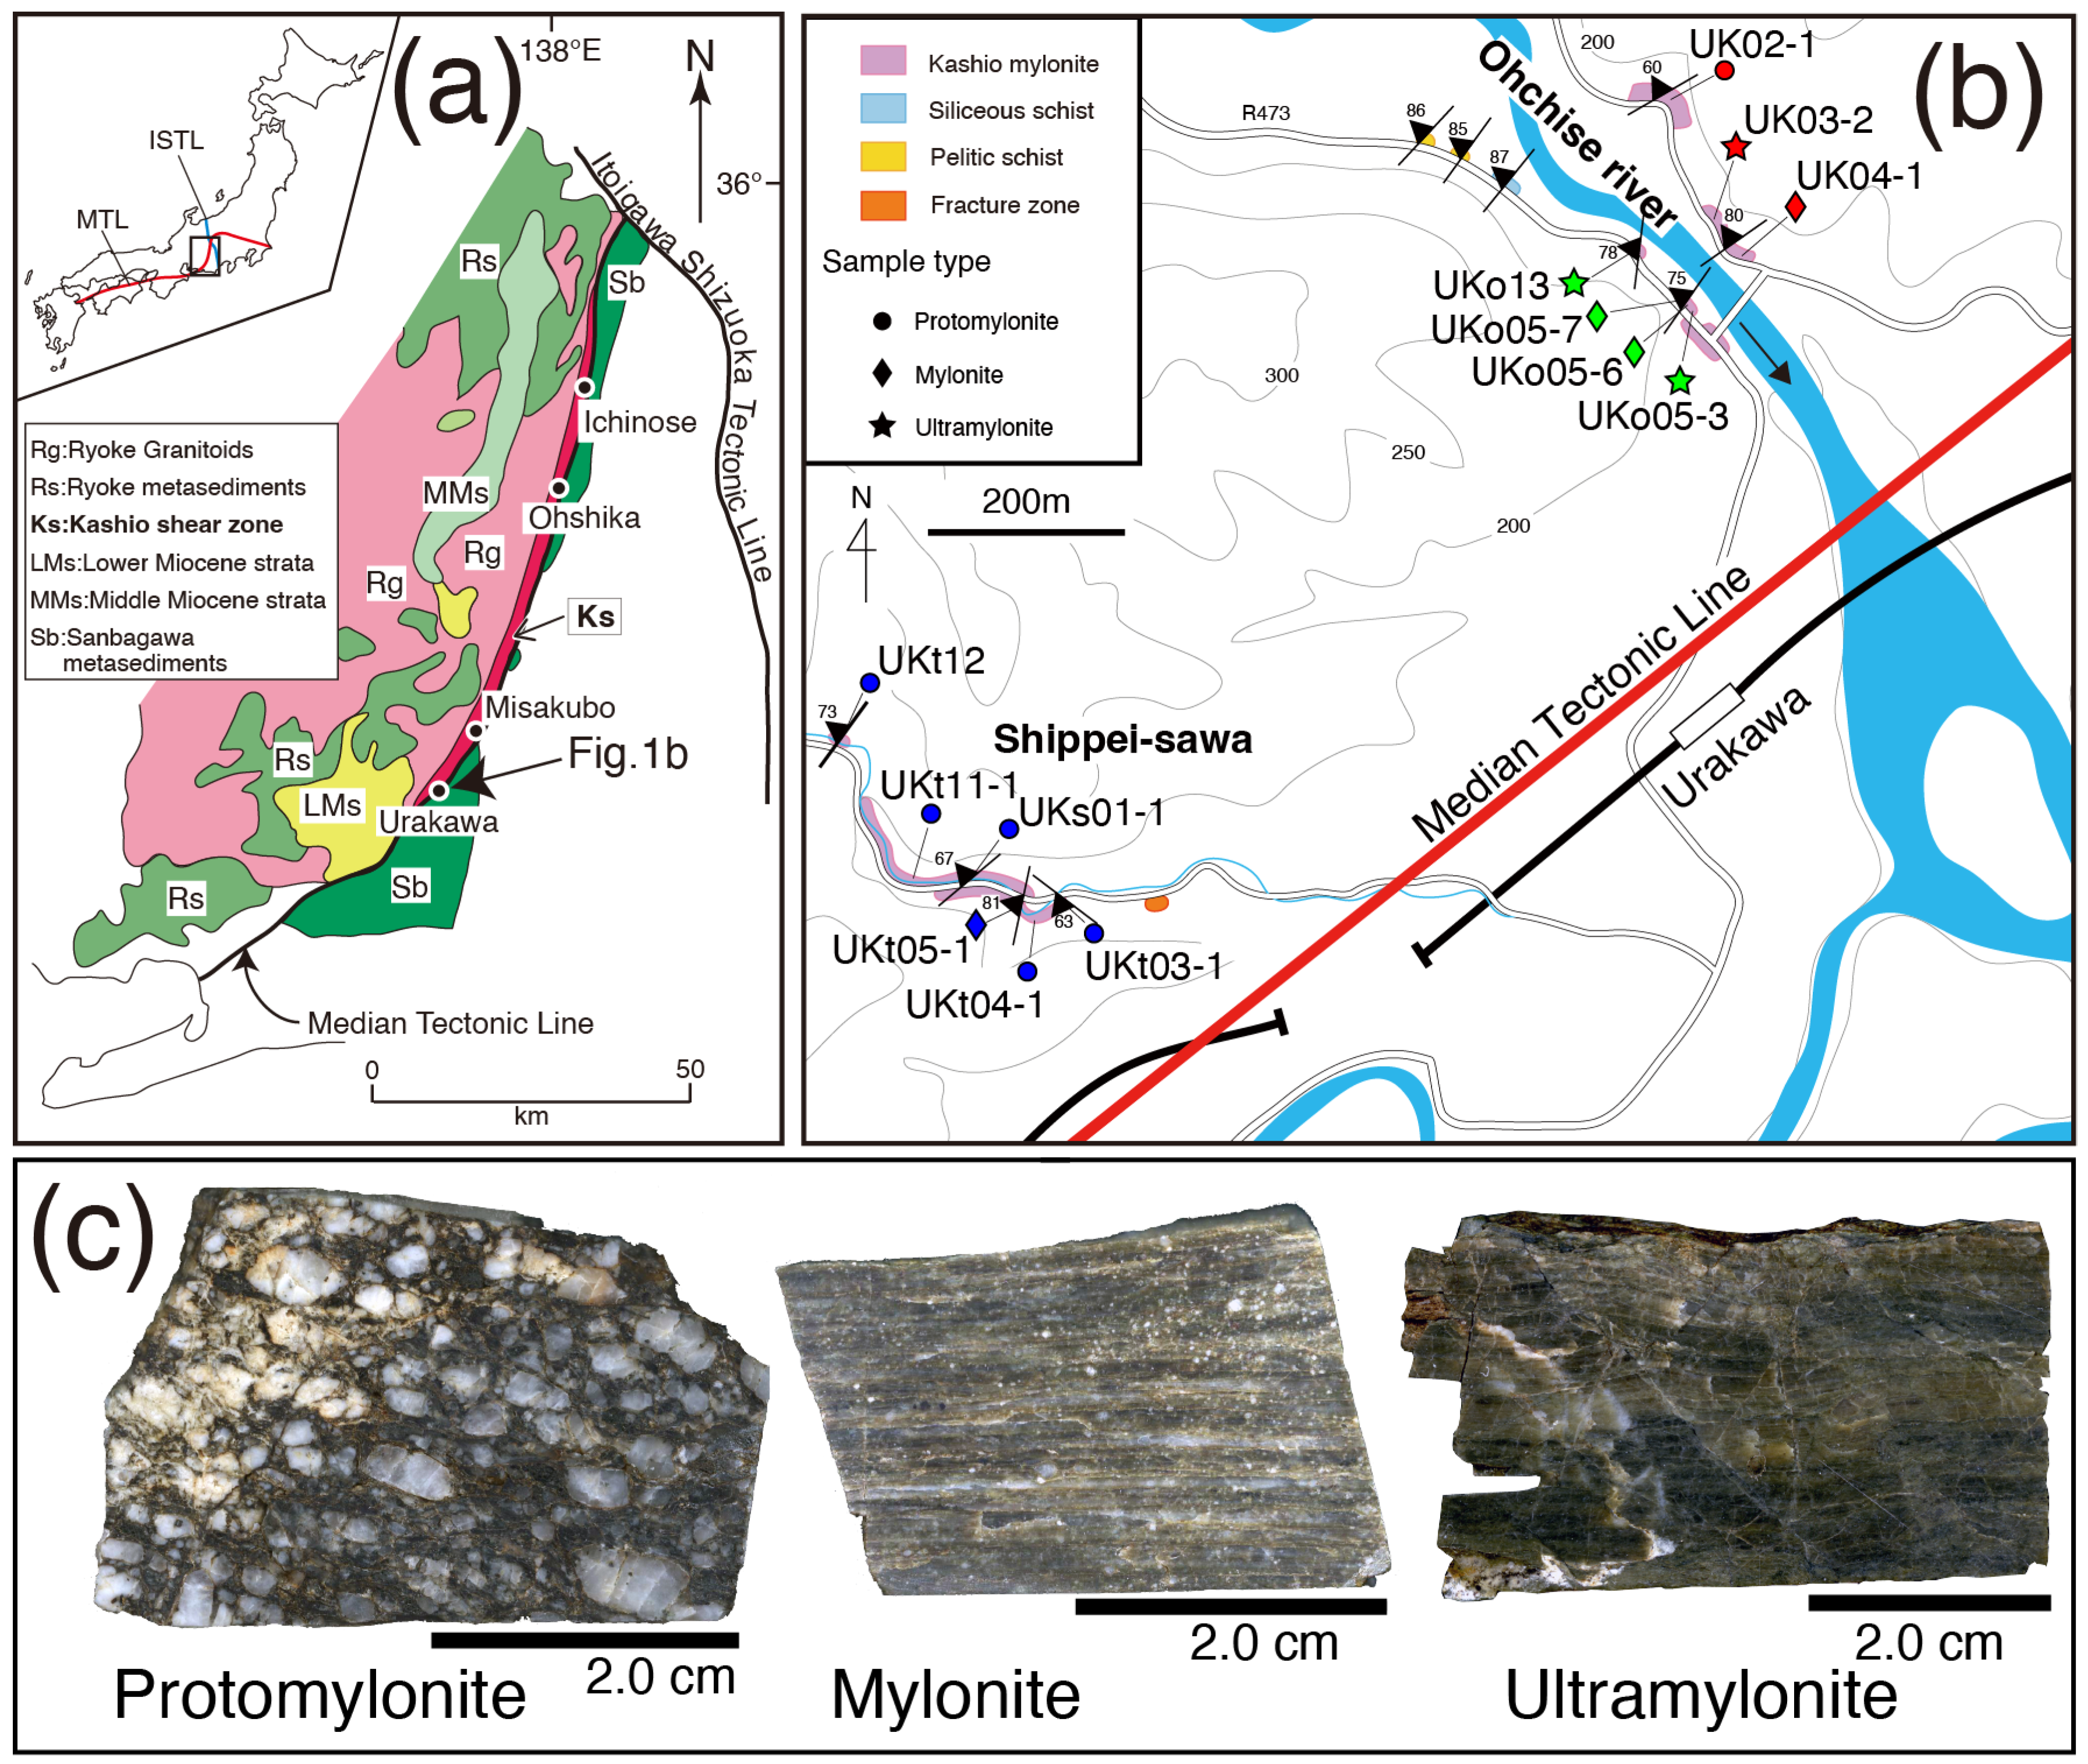
Figure 1. Geological maps and the three types of Kashio mylonite. (a) Simplified geological map of central Honshu Island, Japan (modified after [22]). MTL: Median Tectonic Line; ISTL: Itoigawa-Shizuoka Tectonic Line. (b) Route map for the Ohchise River and Shippei-sawa sections, showing strikes (symbols) and dips (numbers) of mylonitic foliations. Red: samples of the left bank of the Ohchise river facing downriver; Green: samples of the right bank of the Ohchise river facing downriver; Blue: samples of Shippei-sawa. (c) Scanned images of the three types of Kashio mylonites: protomylonite (UKs01-1), featuring plagioclase porphyroclasts (white phases); mylonite (UK04-1), featuring a patchy distribution of plagioclase porphyroclasts (white phases); and ultramylonite (UKo05-3), dense and greenish, lacking porphyroclasts but cut by mineral veins (white lines).
Minerals 14 00229 g001
Figure 2. Optical images of Kashio mylonites. (a,b) Protomylonite (UK02-1) (cross-polarized light); white arrows indicate subgrains developed in quartz aggregates. (c,d) Mylonite (UK04-1) (cross-polarized light). (e,f) Ultramylonite (UKo05-3) (cross-polarized light); white arrows indicate mineral veins. [Bt, biotite; Cal, calcite; Chl, chlorite; Lmt, laumontite; Pl, plagioclase, Qtz, quartz].
Minerals 14 00229 g002
Figure 3. IPF map of quartz aggregates measuring grain size distributions. Grain boundaries rendered as black lines indicate boundaries with >10° misorientation between any two adjacent points, whereas white lines indicate subgrain boundaries with <10° misorientation between any two adjacent points. (a) Three samples of the left bank of Ohchise river facing downriver as in Figure 1b. (b) Four samples of the right bank of Ohchise river facing downriver as in Figure 1b.
Minerals 14 00229 g003
Figure 4. Grain size distributions of quartz in Kashio mylonites along the three routes. A gaussian curve (red) with 1 sigma (green lines) is shown in each histogram for the average grain size (Ave; red line) and its standard deviation (Std). (a) Three samples of the left bank of Ohchise river facing downriver as in Figure 1b. (b) Four samples of the right bank of Ohchise river facing downriver as in Figure 1b. (c) Six samples of Shippei-sawa. The mean grain sizes are shown in Figure 5a.
Minerals 14 00229 g004
Figure 5. Graphs of microstructures and crystal-fabric intensities. (a) Mean grain sizes of quartz aggregates, (b) J-index, and (c) M-index with respect to the distance from the Median Tectonic Line (MTL). Symbol shapes and colors are as in Figure 1b. Plot of UK04-1 mylonite is shown in each subfigure.
Minerals 14 00229 g005
Figure 6. Crystal-preferred orientations of quartz in Kashio mylonites along the three routes projected on equal-area, lower-hemisphere stereonets. The foliation is horizontal (XY plane) and the lineation is E–W (X-axis). Contours are multiples of uniform density. Max: maximum density, Min: minimum density, N: number of grains, J: J-index, M: M-index, pfJ: pfJ-index. (a) Three samples of the left bank of Ohchise river facing downriver. (b) Four samples of the right bank of Ohchise river facing downriver. (c) Six samples of Shippei-sawa. Fabric intensities (J-index and M-index) are shown in Figure 5b,c.
Minerals 14 00229 g006
Figure 7. (a) Mylonite microstructure (UK04-1). (b) Electron-backscatter diffraction phase map of UK04-1 mylonite. Grain boundaries rendered as black lines indicate boundaries with >10° misorientation between any two adjacent points, whereas white lines indicate subgrain boundaries with <10° misorientation between any two adjacent points. Twenty subdomains shown as rectangles with numbers were selected to calculate the mineral modes of quartz and plagioclase, as well as their grain sizes and CPOs (see also Figure S1).
Minerals 14 00229 g007
Figure 8. Three examples of subdomains enlarging the electron-backscatter diffraction phase map shown in Figure 7 (see also Figure S2 for all subdomains). Red: quartz; Yellow: plagioclase; Blue: K-feldspar; Purple: muscovite; Brown: Biotite; Magenta: hornblende; Dark green: chlorite; Cyan: calcite.
Minerals 14 00229 g008
Figure 9. CPOs of quartz and plagioclase obtained from five representative subdomains among twenty subdomains projected on equal-area, lower-hemisphere stereonets (See also Figures S4 and S6 for all subdomains). Modes of quartz and plagioclase are shown along with subdomain numbers on the left side. The foliation is horizontal (XY plane) and the lineation is E–W (X-axis), as shown in Figure 6. Contours are multiples of uniform density. Max: maximum density, Min: minimum density, N: number of grains, J: J-index, M: M-index, pfJ: pfJ-index.
Minerals 14 00229 g009
Figure 10. Relationships between quartz and plagioclase grains in the UK04-1 mylonite by subdomain. (a) Modal composition. (b) Grain size and (c) J-index in relation to quartz mode, in which star symbols indicate the values of the UK04-1 mylonite shown in Figure 5.
Minerals 14 00229 g010
Figure 11. (1) Deformation mechanism maps for wet quartz, as a function of stress and grain size at 400 °C (a1) and 500 °C (b1) at 300 MPa pressure (For flow parameters used, see Table 1). The line between ‘Qz dis’ and ‘Qz dif’ is the boundary between dislocation creep and diffusion creep in quartz. The black broken line represents piezometric relation for quartz [67]. Solid red circle symbols indicate the intersection point between the mean grain size of quartz (Qz) and quartz piezometer, where horizontal lines represent estimated stress value for quartz (σqz). (2) Deformation mechanism maps for plagioclase, as a function of stress and grain size at 400 °C (a2) and 500 °C (b2) at 300 MPa pressure (For flow parameters used, see Table 1). The line between ‘Pl dis’ and ‘Pl dif’ is the boundary between dislocation creep and diffusion creep in plagioclase. The black broken line represents piezometric relation for plagioclase [67]. Solid green diamond symbols indicate the intersection point between the mean grain size of plagioclase (Pl) and plagioclase piezometer, where horizontal lines represent estimated stress value for plagioclase (σpl). (3) Viscosity contrast maps for wet quartz–plagioclase composite, as a function of stress and grain size at 400 °C (a3) and 500 °C (b3) at 300 MPa pressure, after Cross et al. [18]. The two broken lines represent piezometric relations for quartz and plagioclase [67]. Open diamond symbols indicate the intersection between the mean grain size of plagioclase (Pl) and the isoviscosity line (ηplqz = 1), where horizontal lines represent estimated stress values for plagioclase (σ’pl).
Minerals 14 00229 g011
Figure 12. Effect of viscosity contrast between quartz and plagioclase on creep behavior during shearing. Deformation is localized in the quartz-rich layer under high viscosity contrast (ηplqz >> 1), whereas deformation occurs homogeneously in both layers under the condition of isoviscosity (ηplqz = 1). Circles in plagioclase-rich layer stand for porphyroclasts.
Minerals 14 00229 g012
Table 1. Flow parameters for viscosity contrast maps.
MechanismA anMrQ
[kJ/mol]
Reference
Plagioclase
Wet dislocation102.630356[65]
Wet diffusion101.713170[65]
Quartz
Wet dislocation1.75 × 10−12401125[64]
Wet diffusion b0.01121220[11]
Wet diffusion c10−2.971.70.511183[63]
a For stress in MPa, water fugacity in MPa, and grain size in µm; b Modified according to Cross et al. [18]; c For quartz aggregates deformed by a combination of intracrystalline and grain boundary process.
Disclaimer/Publisher’s Note: The statements, opinions and data contained in all publications are solely those of the individual author(s) and contributor(s) and not of MDPI and/or the editor(s). MDPI and/or the editor(s) disclaim responsibility for any injury to people or property resulting from any ideas, methods, instructions or products referred to in the content.