Article

Heat Treatment at 1000 °C under Reducing Atmosphere of Commercial Vermiculites

1
Department de Geología, Facultad de Geología, Universidad de Oviedo, C/. Jesús Arias de Velasco s/n, 33005 Oviedo, Spain
2
Department de Física de Materiales M-04, Facultad de Ciencias, Universidad Autónoma de Madrid, Cantoblanco, 28049 Madrid, Spain
*
Author to whom correspondence should be addressed.
Minerals 2024, 14(3), 232; https://doi.org/10.3390/min14030232
Submission received: 30 November 2023 / Revised: 20 February 2024 / Accepted: 23 February 2024 / Published: 25 February 2024
(This article belongs to the Section Clays and Engineered Mineral Materials)

Abstract

:
With the purpose of obtaining synthetic materials from other natural sources for industrial and technological applications, a thermal alteration study was carried out with commercial vermiculites of different purity and origin. For this objective, samples were subjected to 1000 °C in a furnace both at ambient and reduced (N2/Ar) atmospheres. The thermal behavior and physicochemical properties of the different vermiculites were investigated by X-ray diffraction (XRD), thermal analysis (TG and DTG), and scanning electron microscopy (SEM), and their textural parameters were analyzed by BET treatment. The transformations undergone by the investigated commercial vermiculites subjected to heating treatments caused textural and structural changes in them. There was a decrease in the specific surface area, adsorption capacity, and pore volume values for the samples treated with in situ heating at 1000 °C, both at ambient and reduced atmospheres, and the samples were treated with ex situ abrupt heating at 1000 °C at ambient conditions. There was a decrease in the specific surface area, adsorption capacity, and pore volume values for the samples treated with in situ heating at 1000 °C, both in ambient and reduced atmospheres, which was not observed in the samples treated with an ex situ abrupt heating at 1000 °C at ambient conditions. This corroborated with our findings that the expansion in the first type of thermal treatment produced less separation of the exfoliation sheets than the expansion in the second type of thermal treatment. These textural changes, together with the structural ones, could play a fundamental role in the choice of industrial and technological applications for which these materials could be used.

1. Introduction

Vermiculite is a silicate mineral of the phyllosilicate subclass. Its appearance is similar to that of micas at the macroscopic level, and it shows varied colors (green and yellow to brown), leafy habit, a hardness of around 2, and a density between 2.4 and 2.7 g/cm3. Its structure corresponds to that of the 2:1 group [1], which is composed of two T-O-T layers joined by an interlayer. The T-O-T layer is composed of an octahedral (O) sheet of Mg2+ located between two tetrahedral sheets (T) of Si4+. The interlayer contains water molecules and exchangeable cations, mainly Mg2+ ions. Isomorphic substitutions, especially in the tetrahedral sheets of Si4+ to Al3+, are very common. Vermiculite can undergo hydration-dehydration processes due to the presence of water and OH groups that depend on various factors such as temperature, pressure, particle size, relative humidity, and chemical composition [1,2,3,4,5,6,7,8,9,10,11,12,13,14,15,16,17].
The materials of this research are commercial vermiculites of different origins and properties. Vermiculite, a low-cost mineral with abundant reserves, easy exfoliation, high porosity, and specific surface area [18,19,20,21], makes it a CO2 substrate, like amines [22] or calcium oxide [23]. Due to its particular physicochemical properties (mainly related to its thermal resistance and exfoliation capacity), vermiculite offers multiple industrial and technological applications. Vermiculite is widely employed in the construction industry mainly for its insulating and lightweight characteristics (i.e., concrete production, plasters, renders, fireproof, and thermal screeds) [24,25]. Furthermore, the particle size and intrinsic porosity of vermiculite are also advantageous properties for numerous technological uses, such as chemical process catalysts and fluid filtration supports [26,27,28]. A recent study has also shown how the structural features of vermiculites give them even further potential applications in biomedical engineering (i.e., cancer theranostics) [29]. Overall, these technological applications highlight the versatility of vermiculite, as its properties can be modified by physical, chemical, or mechanical treatments depending on the requirements of each industry and application.
Vermiculite is characterized by its unique thermal expansion properties and is of considerable usefulness for the technological and industrial applications described above. This mineral property can vary depending on factors such as the specific type of vermiculite (related to its composition) and the temperature and heating condition to which it is exposed.
This study was carried out by heating at 1000 °C three different commercial vermiculites both at ambient and reduced atmospheres in order to obtain other materials with industrial and technological applications. The response of the investigated vermiculites to the mentioned thermal treatment was studied by X-ray diffraction, thermal analysis, and scanning electron microscopy, and their adsorption capacity was analyzing variations in textural parameters (i.e., BET-specific surface area and porosity), using nitrogen adsorption/desorption tests.

2. Materials and Methods

2.1. Materials

The materials investigated in this paper were vermiculites; one vermiculite came from Uganda and was supplied by the company Vermiculita y Derivados S.L. (Gijón, Spain); it was labeled as U. The other vermiculites came from China, and they were supplied by China National Non-Metallic Minerals Industrial Import & Export Corporation (CNMIEC) (Beijing, China); they were labeled as CHS and CHGO, respectively. The particle size of all vermiculites is <5 mm in diameter, and the thickness varies from 0.5 to 1 mm. With respect to their appearance, The Ugandan vermiculite and the Chinese CHGO are golden in color, and the Chinese vermiculite CHS is silver in color (Figure 1).

2.2. Experiments

Experiments at high temperatures were conducted using the raw vermiculites without previous treatment in order to preserve their natural characteristics as much as possible.
The experiments were carried out using the Carbolite Gero EZS 1200 Ltd. (Sheffield, UK) furnace under ambient atmosphere and reducing atmosphere. Once the samples were placed in the sample holders, the furnace was programmed to 1000 °C at 20 °C/min steps. After reaching the programmed temperature, the samples were kept for 1 h and then cooled. The experiments with reduced atmosphere were carried out under controlled atmospheres of H2 and Ar: (a) 100% H2, (b) 100% Ar, and (c) 5% H2 and 95% Ar. The gas flow rate was 100 sccm in each experiment. Vermiculites were weighed before and after each heat treatment. These experiments are hereafter referred to as in situ heating at 1000 °C in ambient atmosphere and in situ heating at 1000 °C in reduced atmosphere.
The samples were labeled as shown in Table 1.
For the purposes of comparison of certain results to be shown below, high-temperature thermal experiments in the ambient atmosphere were also carried out using the Carbolite CWF 12/23 type furnace. The furnace was first stabilized at a temperature of 1000 °C. Then, the vermiculite samples were introduced and heated for 1 min, after which it was removed and allowed to cool at room temperature. These experiments are hereafter referred to as ex situ abrupt heating at 1000 °C in ambient atmosphere.

2.3. Sample Characterizations

Raw and treated vermiculites were subjected to characterization of the elemental composition using X-ray fluorescence, identification of the mineral composition by X-ray diffraction (XRD), thermal behavior using thermal gravimetric (TG and DTG), and analysis of textural parameters with BET treatment.
The chemical composition of the raw vermiculites was determined using an X-ray fluorescence spectrometer PHILIPS PW2404 and Automatic Charger PW2540 (Malvern Panalytical B, Madrid, Spain) equipped with a rhodium anode (Rh) tube with 4 kW of power, five analyzer crystals (Fli 200, Fli 220, Pe, Ge, and Px1), and three detectors: xenon sealing, scintillation, and gas flow. In the quantitative analysis, a calibration for geological samples was available, with international reference standards. The major elements determined were Al2O3, P2O5, K2O, CaO, SiO2, TiO2, MnO, Fe2O3, MgO, and Na2O. To analyze the major elements, beads from the samples were prepared by fusion with a Quielab pearl.
Images of the treated samples with in situ heating at 1000 °C in H2 atmosphere were taken with the JEOL 5600 scanning electron microscope equipped with a tungsten electron gun. Images of the treated samples with ex situ abrupt heating at 1000 °C in ambient atmosphere were taken with the JEOL-6610LV scanning electron microscope at 20 kV. The samples were coated with gold.
XRD patterns of the samples, previously ground with an agate mortar, were taken with a PANalyticalX’pert Pro (Malvern Panalytical, Malvern, UK) diffractometer. The setting conditions were 40 mA and 45 kV (Cu-Kα radiation; λ = 1.5418 Å), 2θ range of 5–70 degrees (in which the most important phases are reflected), 2θ step scans of 0.007°, and a counting time of 1 s per step. The standard reference material used was 660a NIST LaB6 with Full Width at Half Maximum (FWHM) of 0.06° for 2θ = 21.36°. Changes in the intensity and position of the basal reflections were used to indicate changes in the structural order and hydration states.
The thermal gravimetric analyses were made between 25 and 1100 °C on the samples. The equipment was a Mettler Toledo Stare System Thermobalance (Mettler Toledo, Columbus, OH, USA) with an alumina crucible, a heating rate of 10 °C/min, and flowing oxygen at 50 mL/min. The total mass loss was determined gravimetrically by heating the samples in air at 1000 °C.
Textural parameters of the powdered samples were determined using the ASAP 2020 equipment (Iberfluid Instruments, Barcelona, Spain) under the following conditions: nitrogen adsorption at −195.8 K, with σm (N2) of 0.162 nm2; unrestricted evacuation of 30.0 mm Hg; vacuum pressure of 10 μm Hg; evacuation time of 1 h; and temperature of sample evacuation prior to N2 adsorption measurements of 22 °C. The data were recorded with equilibration times (p/p0 ranging from 0.001 and 1.000) between 50 and 25 s and a minimum equilibrium delay of 600 s at p/p0 ≥ 0.995. Specific surface area and pore size data were determined using a mathematical description of the adsorption isotherms with the software of the equipment.

3. Results

3.1. Chemical Analyses

The chemical analyses of the Ugandan sample and the Chinese samples are in Table 2. The percentage of K2O for CHS-20 and CHGO-20 was 4.80% and 5.08%, respectively, and is greater than 0.33%, indicating that they are “commercial vermiculite”; while the Ugandan vermiculite, with 0.36% of K2O, is a rather pure sample [30,31].

3.2. Loss Mass and Expansion with In Situ Heating at 1000 °C in Ambient and Reduced Atmosphere
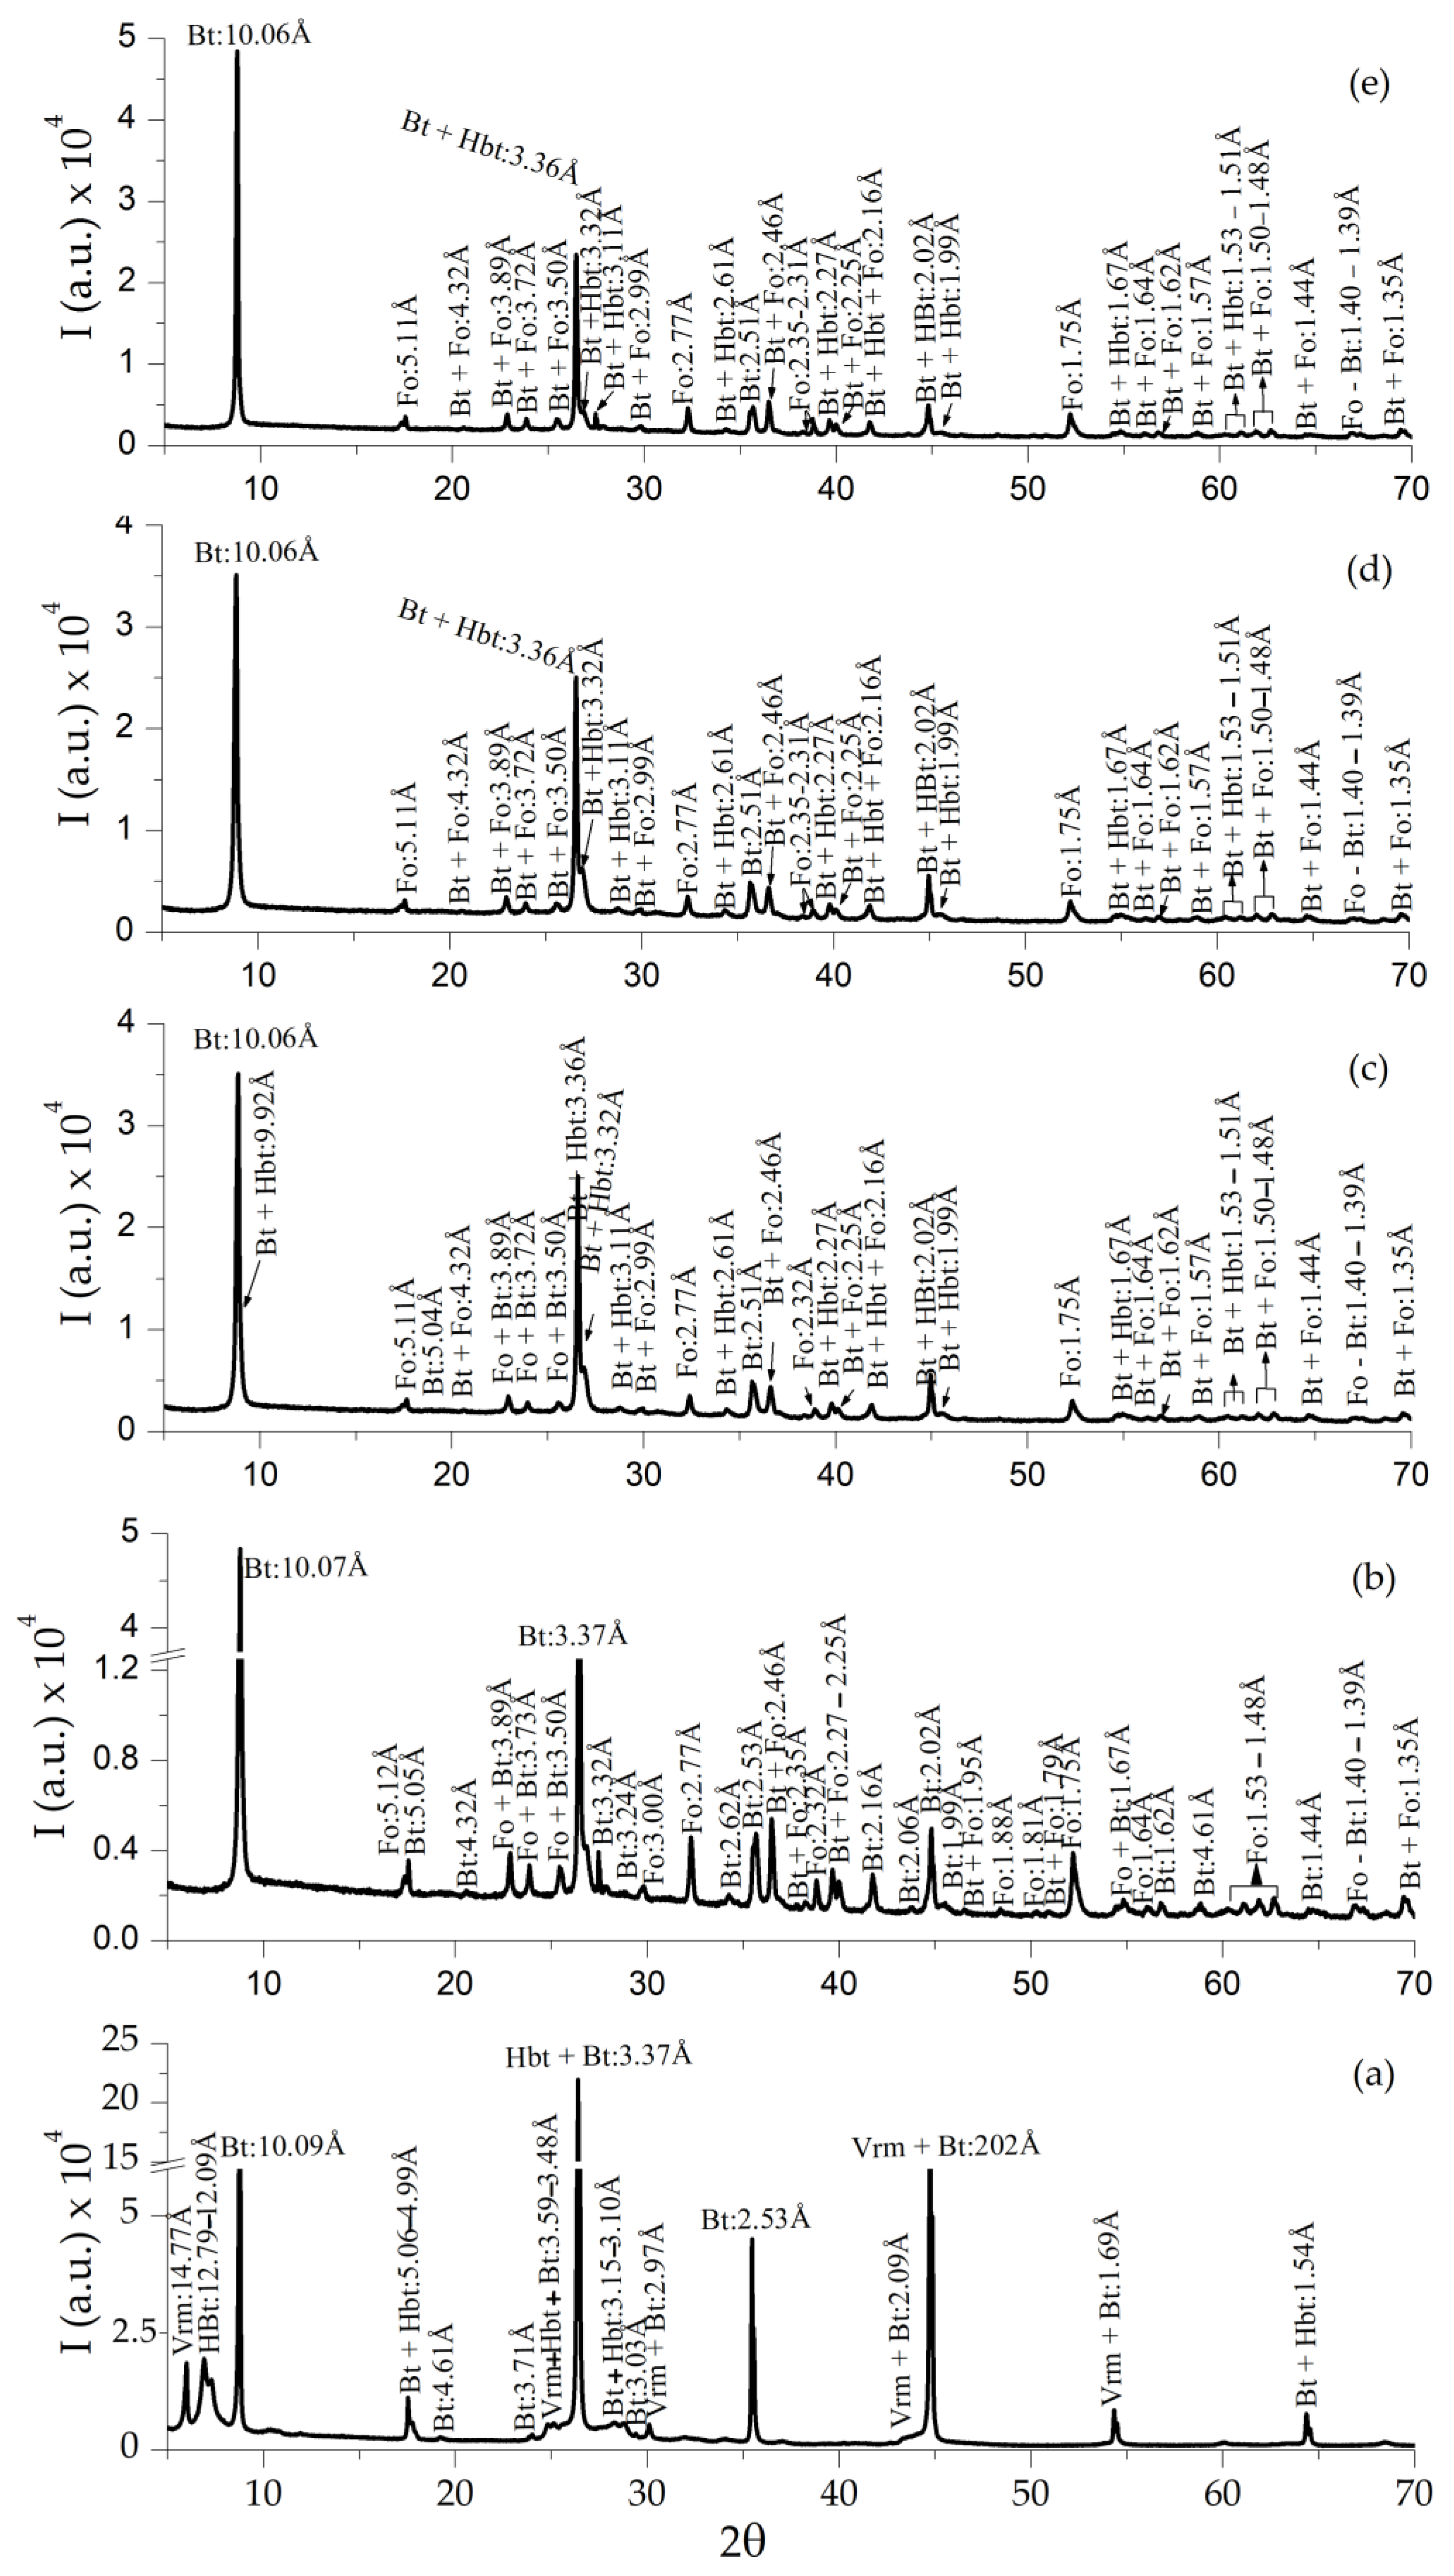
The loss mass (wt. %) of the samples treated with in situ heating at 1000 °C in ambient and reduced atmosphere is presented in Table 3. The mass loss after in situ heating at 1000 °C in ambient atmosphere in the purest vermiculite was almost twice that of vermiculites from China. In these samples, the mass loss after in situ heating at 1000 °C in reduced atmosphere was lower than the loss after in situ heating at 1000 °C in ambient atmosphere. The percentage of mass lost by samples treated with in situ heating at 1000 °C in reduced atmosphere of Ar or H2 was similar but lower than the percentage lost when samples were treated with in situ heating at 1000 °C in reduced atmosphere of Ar and a small amount of H2.
In situ heating at 1000 °C in both ambient and reduced atmospheres caused the expansion of the vermiculites and a change in their color, toasted in the first case, gray in reduced atmosphere of Ar and in a reduced H2 atmosphere is slightly darker than that of the first sample (Figure 2, Figure 3 and Figure 4). The color and appearance of the vermiculites from Uganda and China treated with ex situ abrupt heating at 1000 °C in ambient atmosphere were similar. The appearance of the expansion with SEM observations for the vermiculites U, CHS, and CHGO treated with in situ heating at 1000 °C in H2 atmosphere, as an example of the images obtained under reduced atmosphere, and for the same samples treated with ex situ heating at 1000 °C in ambient atmosphere can be seen in Figure 5, Figure 6, and Figure 7, respectively. The expansion occurred at right angles to the exfoliation, but as can be seen in Figure 5a, Figure 6a, and Figure 7a, corresponding to the vermiculites heated under a reducing atmosphere, the spread apart of the sheets in the typical accordion-like structure that occurs in this heating process was smaller than in abruptly heated samples (Figure 5b, Figure 6b, and Figure 7b).

3.3. XRD Analyses

The XRD spectrum of the starting sample U (Figure 8a) consists of practically pure vermiculite (JCPDS-ICCD card 16-613). After in situ heating at 1000 °C in ambient and reduced atmosphere (Figure 8b–e), the XRD spectra of the purest vermiculite U showed a noticeable decrease in the intensity of the reflections in relation to the raw sample. In addition, vermiculite transformed to mica phlogopite (JCPDS card 16-352) and enstatite (JCPDS card 19-768) (Figure 8b), U-1000 also showed forsterite (JCPDS card 21-1257) and under Ar/H2 atmosphere hematite (JCPDS 24-0072) appeared.
The mineral composition of the raw sample CHS consists of vermiculite (JCPDS-ICCD card 16-613), hydrobiotite (JCPDS card 13-466) and mica biotite (JCPDS card 46-1409) (Figure 9a); after heating at 1000 °C in both air and reduced atmosphere (Figure 9b–e), the vermiculite disappeared and forsterite (JCPDS card 21-1257) appeared (Figure 9b), the reflections intensity decreased in relation to the raw sample.
The XRD spectrum of the starting sample CHGO showed vermiculite (JCPDS-ICCD card No. 16-613), hydrobiotite (JCPDS card 13-466) and mica phlogopite (JCPDS card 16-352) (Figure 10a), after in situ heating at 1000 °C in air and reduced atmosphere (Figure 10b–e) vermiculite and hydrobiotite disappeared and enstatite (JCPDS card 19-768) forsterite (JCPDS card 21-1257) and iron crystalline phases (iron oxide–JCPDS 26-1136; hematite–JCPDS 24-0072) appeared; the reflections intensity increased in relation to the raw sample.

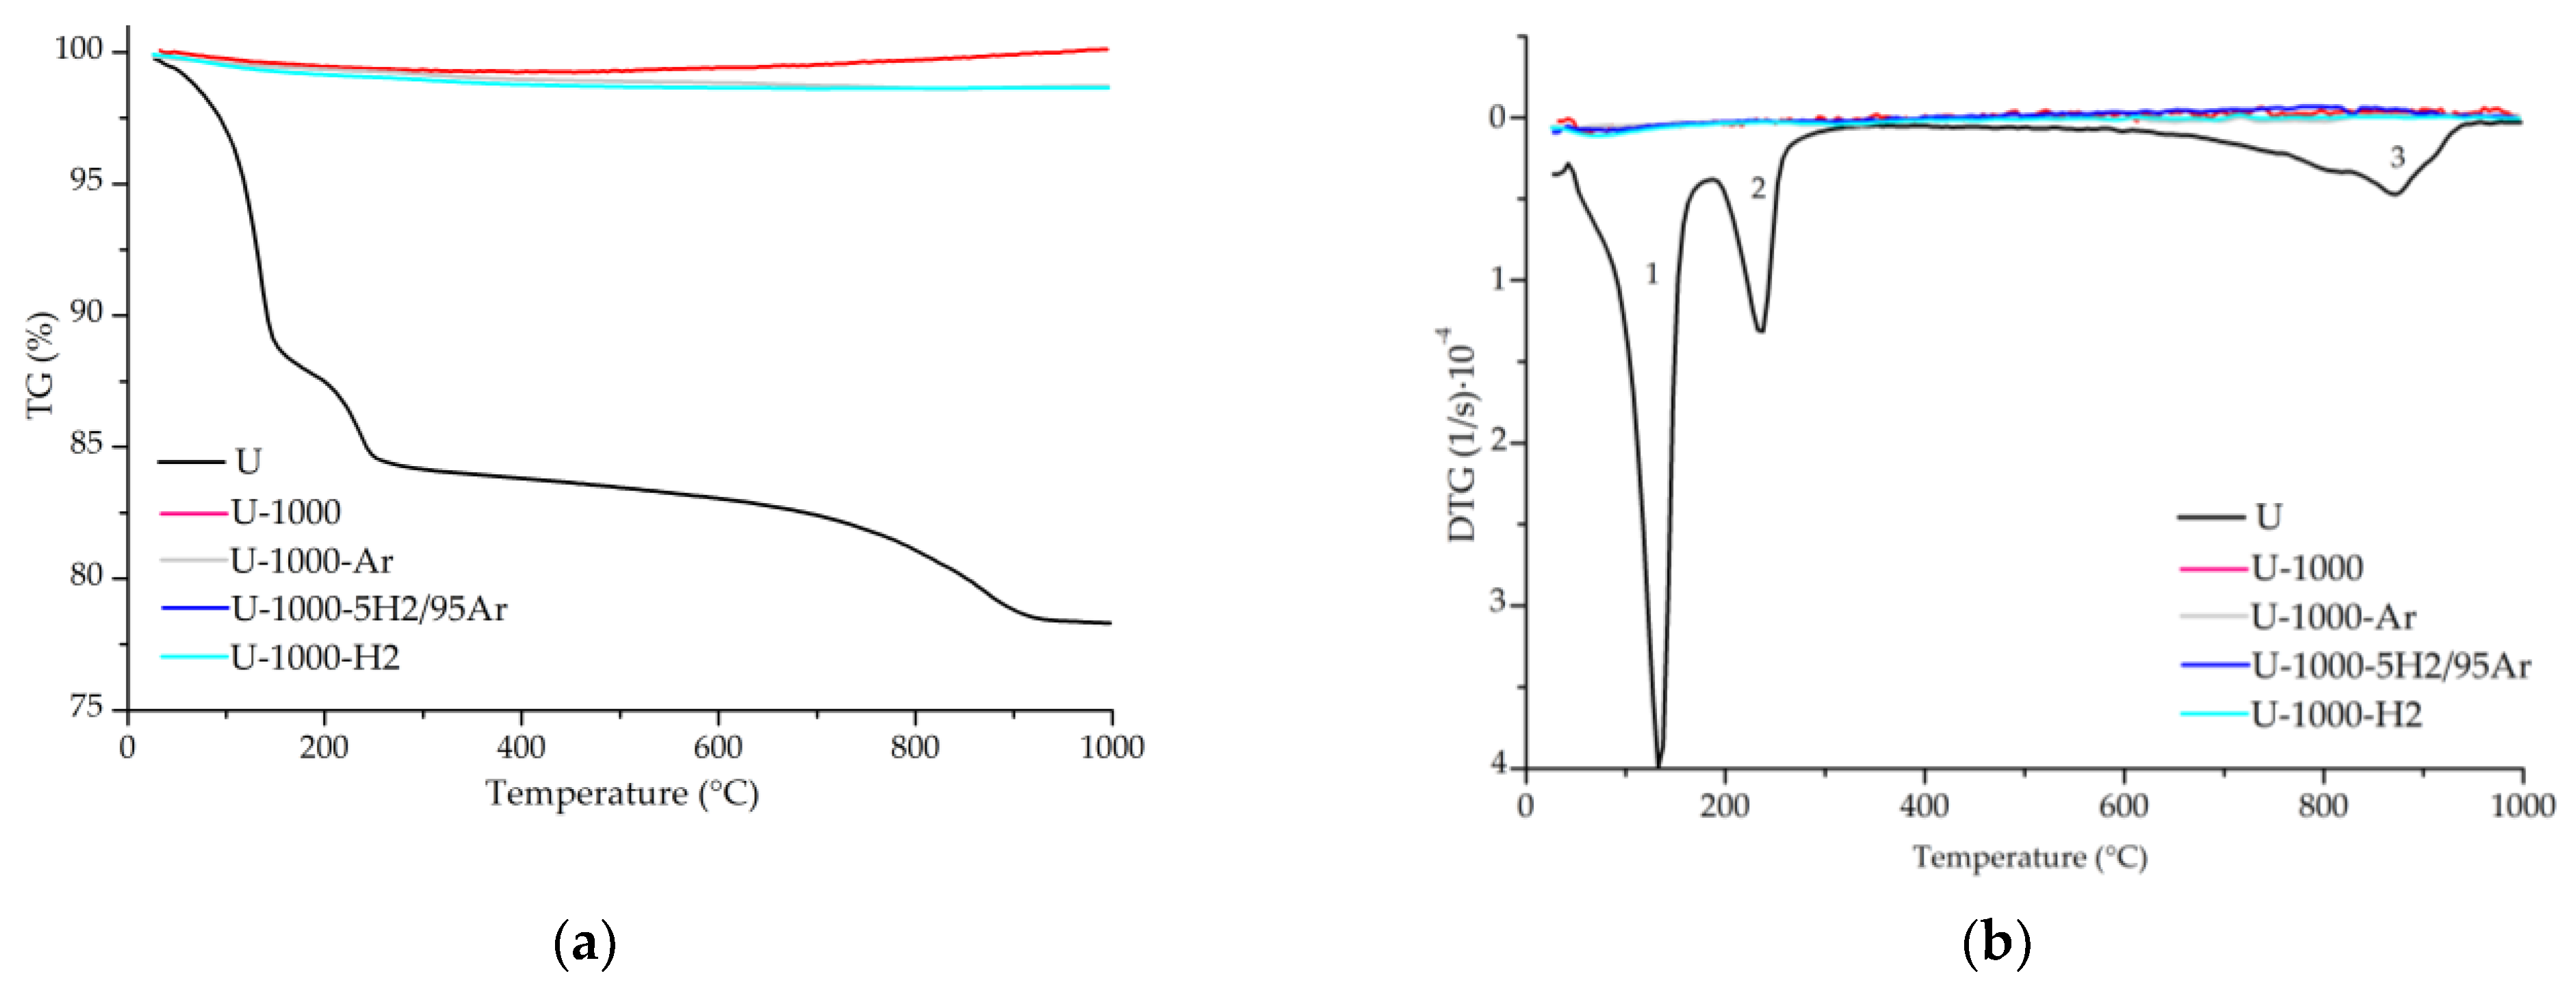
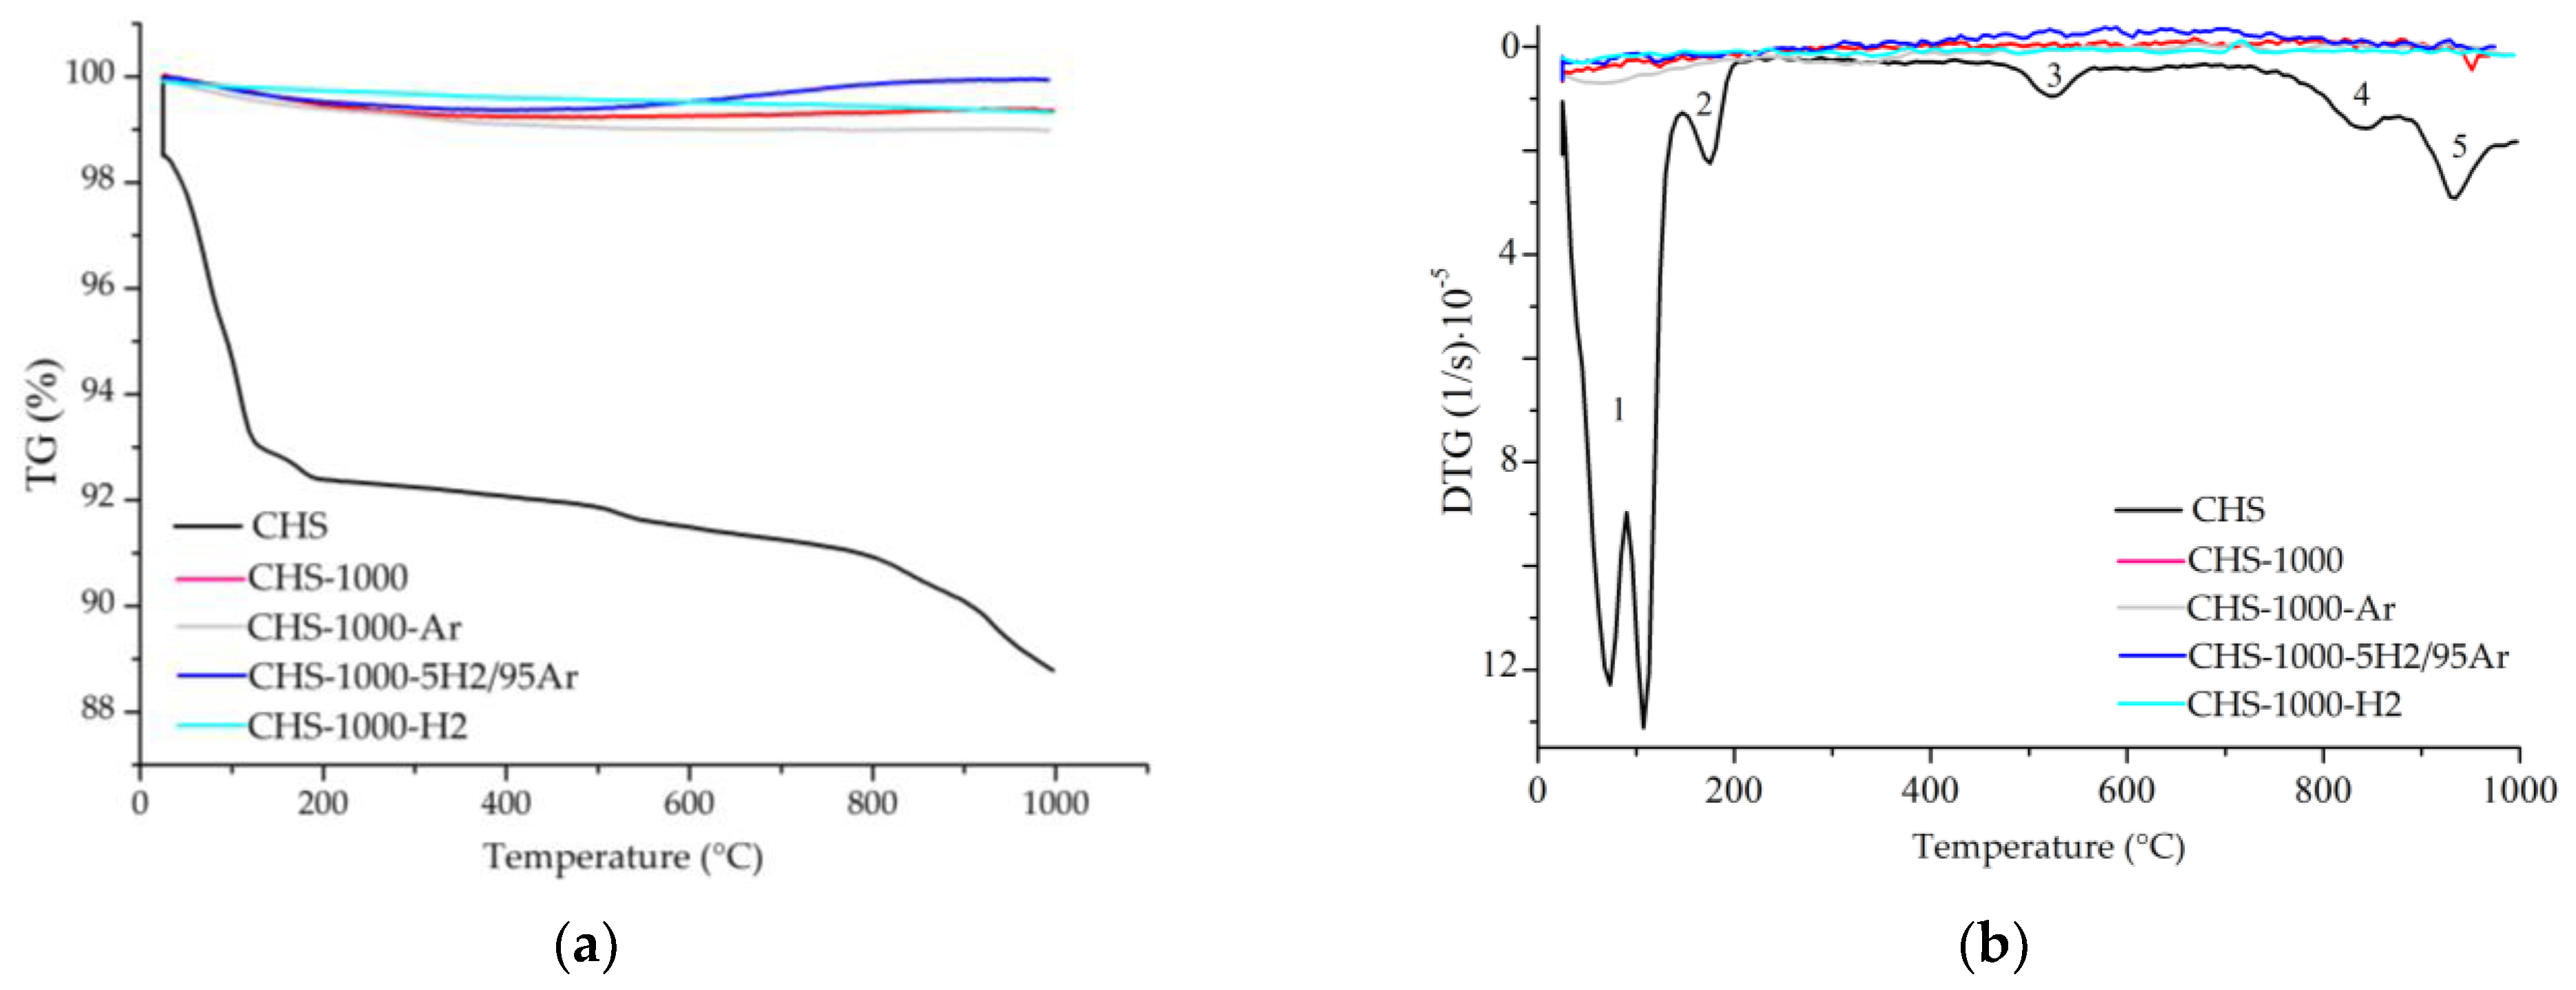
3.4. Thermogravimetric Analyses

The TG curves of the starting and heat-treated samples U, CHS, and CHGO, in both ambient and reduced atmosphere, are presented in Figure 11a, Figure 12a, and Figure 13a, respectively, from which the mass loss and/or mass gain was calculated (Table 4).
The mass loss, mainly due to water loss, in the two starting samples from China is similar and almost half that of the starting sample from Uganda. In the samples heated to 1000 °C under ambient and reduced atmosphere, there was first a slight loss of mass and then, from 800–1000 °C approximately, a slight gain of mass, except in CHGO-1000.
The DTG curves of the starting and heat-treated samples U, CHS, and CHGO, in both ambient and reduced atmosphere, are presented in Figure 11b, Figure 12b, and Figure 13b, respectively. Three different steps can be observed in the DTG curve of the raw sample U and five in the raw samples CHS and CHGO. The step ranging from approximately 50 °C to 150 °C, is due to the loss of surface adsorbed water. At temperatures above 200 °C, a loss of the interlayer water and water bound to the interlayer cations is observed. The step at temperatures between 550 °C and 650 °C is due to the loss of hydroxyls. The penultimate step in the raw samples CHS and CHGO is due to CO2 decomposition [23,33], and the last step, at temperatures above 800 °C, is due to phase recrystallization. The response of samples treated with in situ heating at 1000 °C in ambient and reduced atmosphere is practically linear for U and CHS samples. The appearance of the step at about 1000 °C in sample CHGO-1000-H2 could correspond to the appearance of a new crystalline phase.

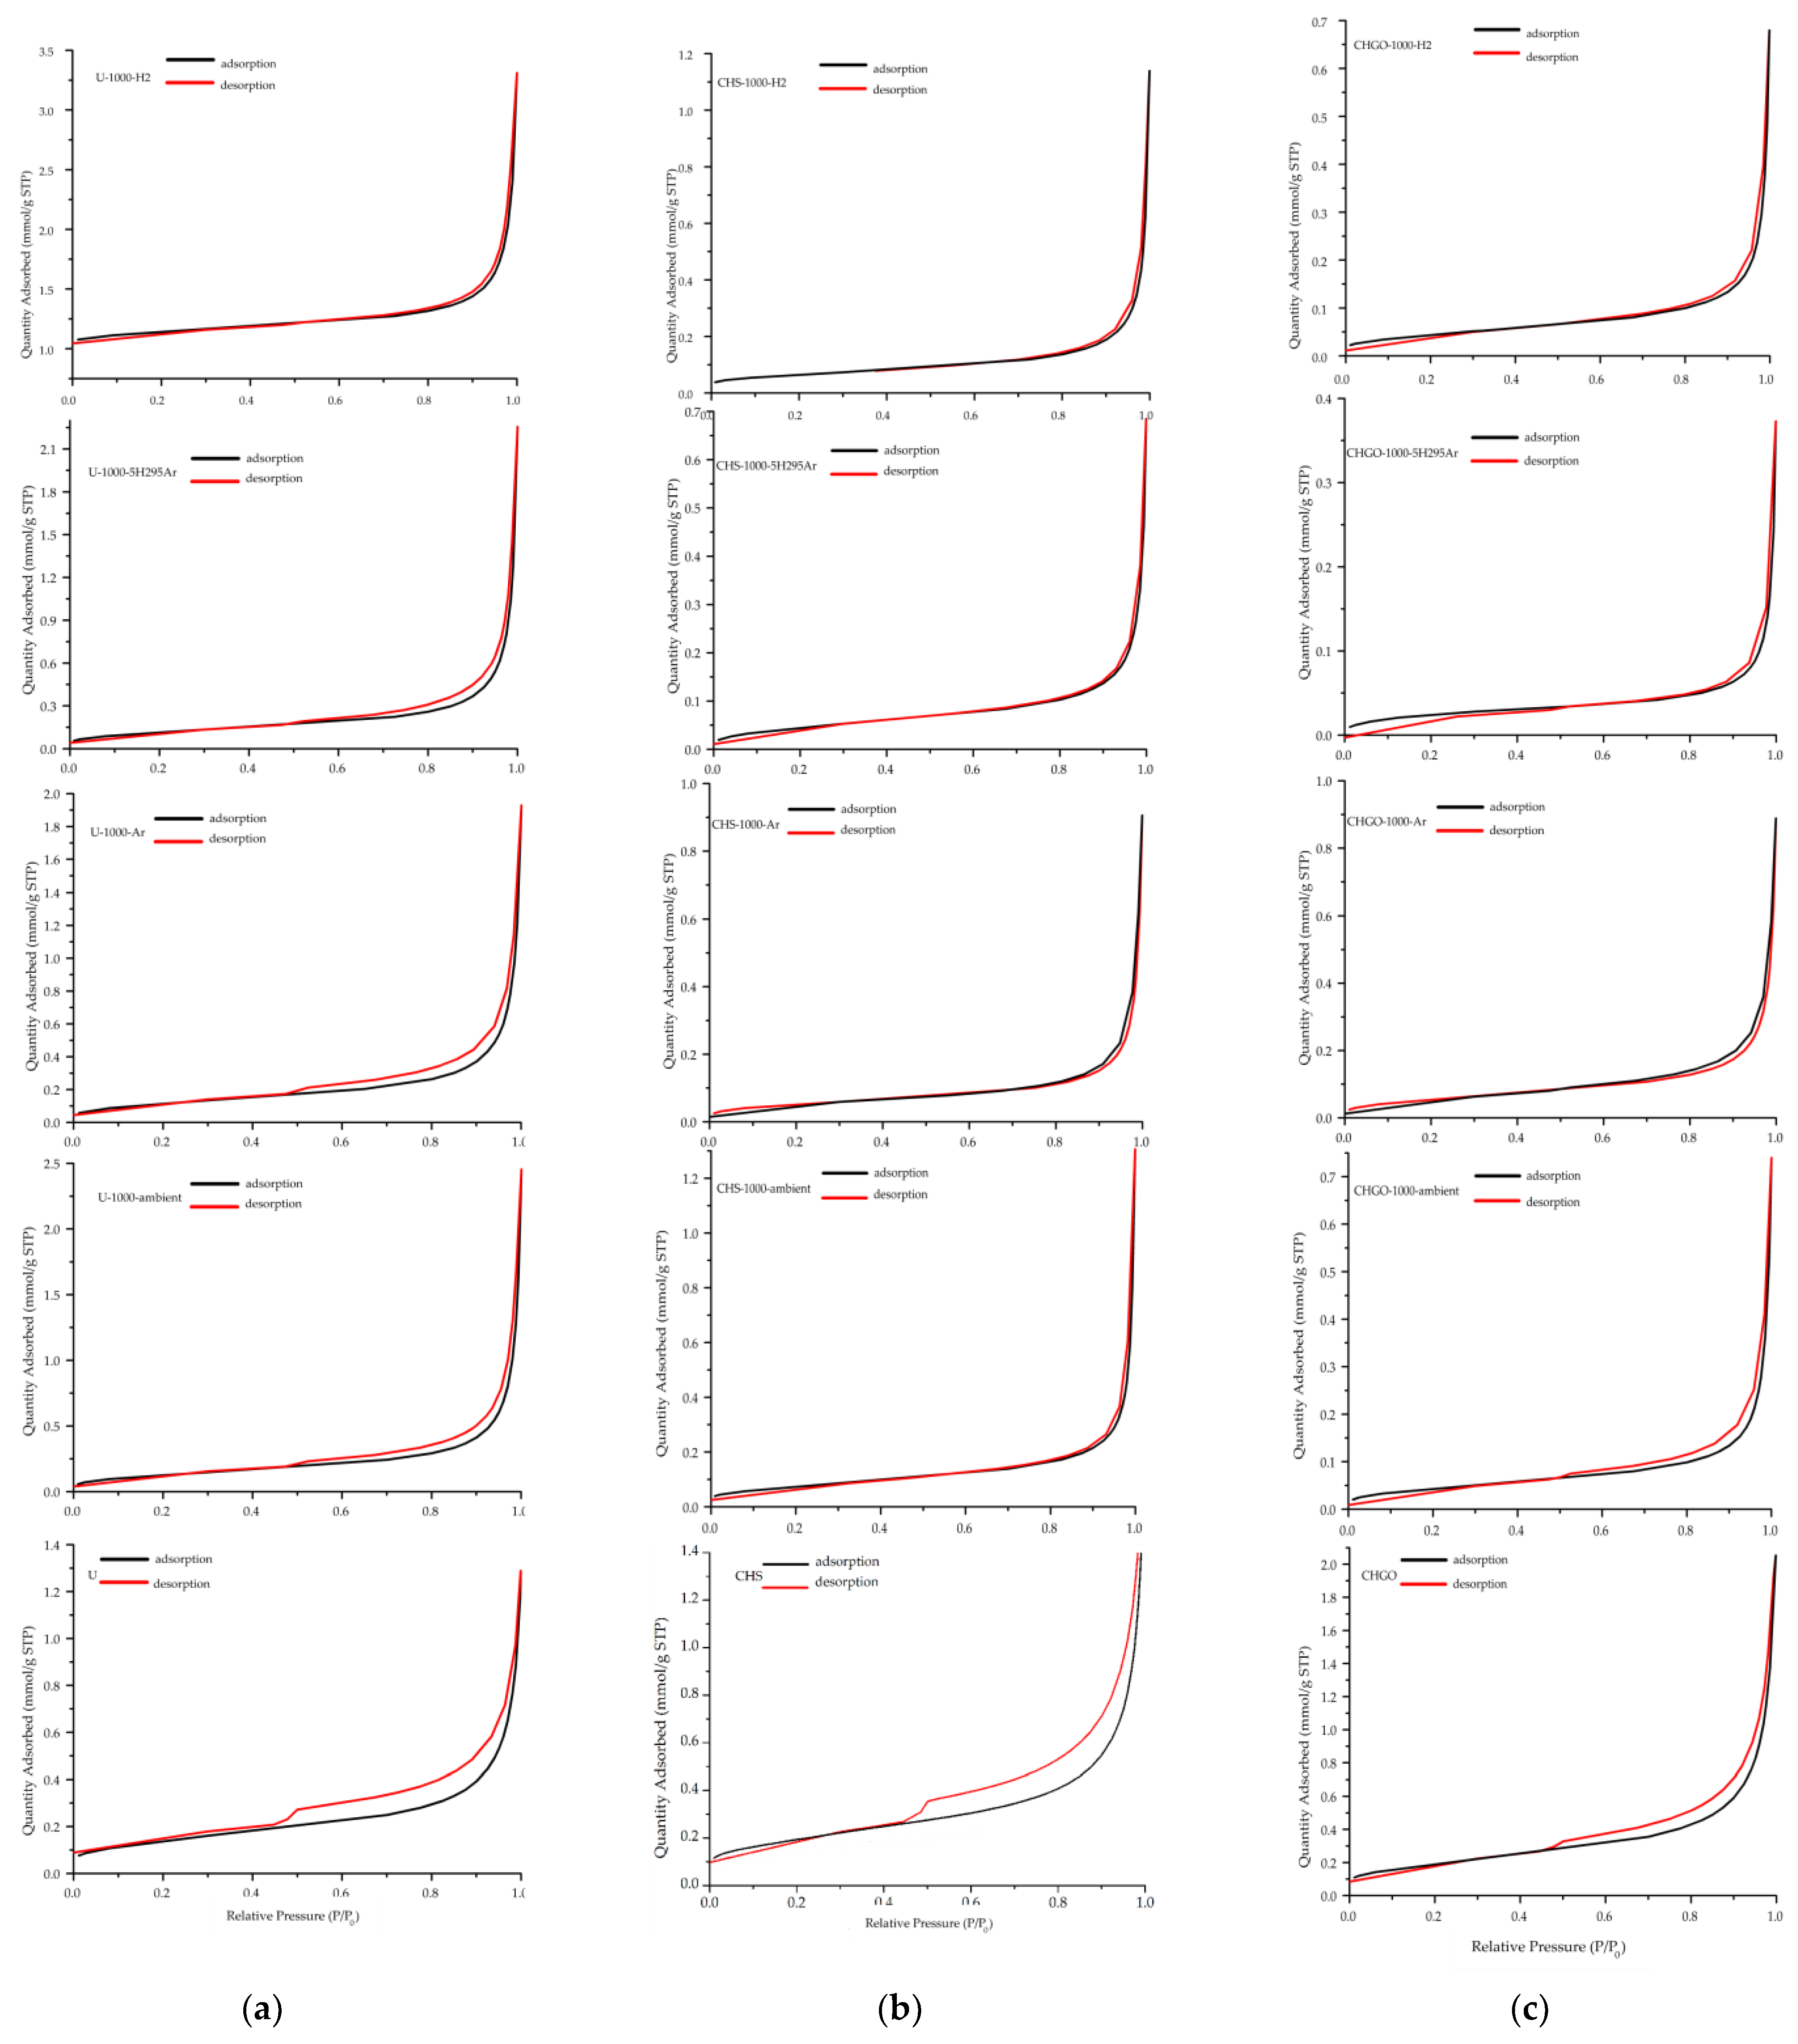
3.5. Textural Parameters Analyses

The nitrogen adsorption–desorption isotherms from Uganda vermiculite U and China vermiculites CHS and CHGO are shown in Figure 14a, Figure 14b, and Figure 14c, respectively. The nitrogen adsorption–desorption isotherms of the untreated and treated vermiculites from Uganda and China correspond to type IV, based on IUPAC classification, showing characteristics of mesoporous solids [34]. The slight H3 hysteresis exhibited by the raw samples is characteristic of layered particles, such as phyllosilicate group minerals, including vermiculite [18]. Hysteresis decreased with heat treatment in situ, regardless of the type of atmosphere, i.e., the adsorption–desorption isotherm gains reversibility, indicating that the materials resulting from the thermal treatment in situ lose porosity; the decrease is greater in Chinese vermiculites than in Ugandan vermiculite. The specific surface area (SBET), adsorption capacity (Qm), total pore volume (Vp), pore size (nm), BET constant (C), and correlation coefficient (R2) values obtained from the adsorption–desorption experiments are shown in Table 5. The specific surface area (SBET) was measured using the BET mathematical model. The total pore volume (Vp) refers to the volume occupied by the adsorbate within the adsorbent at a given pressure (usually close to p/p0 = 1). The Vp expresses the volume occupied by the pores in a unit mass of solid and is expressed as mmol/g. The model used for the pore size calculation has been the Barrett–Joyner–Halenda (BJH) model [35], which is applied only to type IV isotherms, considering the Faass correction [36], which adjusts for the change in thickness of the multilayer during the intervals in which the cores are not emptied. The C values of the investigated untreated and treated samples, ranging between 44 and 156, confirmed the validity of the BET method. The C values higher up to 150 are generally associated either with adsorption on high-energy surface sites or the filling of narrow micropores. The C values lower than 50 indicate there is an appreciable overlap of monolayer and multilayer adsorption, and the precise interpretation of nm is questionable [19]. The R2 values above 0.999 indicate the high correlation of the data.
The SBET and Qm values of the samples from Uganda and China samples treated with in situ heating at 1000 °C in ambient and reduced atmosphere are lower than those of the starting sample being these differences are greater for the Chinese vermiculites. The lowest SBET and Qm values were provided by samples treated with in situ heating at 1000 °C in a reduced atmosphere with 5% H2 and 95% Ar. The Vp value was also reduced in samples treated with in situ heating at 1000 °C in ambient and reduced atmospheres; this reduction was greater in the CHGO samples. In relation to pore size, it seems that the thermal treatment did not affect the pore size appreciably.

4. Discussion

The response of vermiculites treated with in situ heating at 1000 °C in ambient and reduced atmospheres was the transformation of its surface and volumetric properties, color appearance, and crystalline structure due to dehydration. The main differences in the physical transformation of the investigated vermiculites due to in situ heating at 1000 °C in ambient and reduced atmospheres, in relation to the ex situ abrupt heating at 1000 °C [8], are the apparent color change and the expansion that produced less separation of the exfoliation sheets. The structural transformation was greater in the purest vermiculite from Uganda and less in the most micaceous ones, corresponding to the China vermiculites. In the Ugandan vermiculite, both in ambient and reduced atmosphere, vermiculite disappeared, and phlogopite began to appear, in addition to enstatite and forsterite. With pure Ar atmosphere, forsterite disappeared, and the intensity of the reflections decreased slightly; with the mixture of Ar and a very small percentage of H2, the phlogopite and enstatite phases were maintained, and a small amount of hematite appeared; finally, with pure H2, heating caused a loss of phlogopite with a gain of enstatite. Similarly, in the case of the in situ heating treatment described by Marcos et al. [8], a very pure phase such as Santa Olalla vermiculite, with characteristics similar to those of Uganda, the reflection with d-spacing of 10 Å, due to muscovite or dehydrated vermiculite, appeared at 400 °C and was maintained until 800 °C but disappeared at 1000 °C. In the current study, the Ugandan vermiculite treated with ex situ abrupt heating at 1000 °C in ambient atmosphere showed dehydration and transformation into enstatite [8,37]. With the heating methodology used in this study, in both samples, CHS and CHGO mica (biotite and phlogopite, respectively) remained, while vermiculite disappeared and forsterite and/or enstatite appeared; in addition, iron oxides appeared in the CHGO sample as hematite, due to its higher iron content. For the CHS sample, the same transformation is maintained during heating in ambient and reduced atmospheres; the reflection intensity decreased under ambient and reduced atmosphere and hydrobiotite remained under reducing conditions. In the CHGO sample, the forsterite disappeared, and the intensity of the reflections of the new phases increased, as did the crystallinity and structural order. Correspondingly, with the in situ heating treatment described by Marcos et al. [8], in the structure of the CHS sample, small crystallites of mica coexisted with vermiculite with different hydration states at 1000 °C [8]. In the CHGO sample, above 300 °C up to 1000 °C, a micaceous phase with a d-spacing of 10–10.2 Å would be present (related to phlogopite presence). The ex situ abrupt heating at 1000 °C in ambient atmosphere of the samples from China caused its transformation to mica and enstatite in the case of the CHS sample and only to mica in the case of the CHGO sample [8].
Such structural transformations are a dynamic process that depends on particle composition, size and shape, relative humidity, process conditions (i.e., in situ or ex situ heating) [8], and type of atmosphere during heating (i.e., ambient or reducing).
The presence of phases, such as enstatite and forsterite, is due to the chemical composition of the vermiculite, which satisfies the compositional parameters of the SiO2–Al2O3–MgO phase diagram [38].
The increase or decrease in the intensity of the reflections shown by heat-treated vermiculites appears to be related to the phases present in the starting samples and the resulting phases after treatment, i.e., it depends on the energy required for one or the other mineral transformation to occur.
The difference between the very slight mass loss shown in the thermogravimetric analyses of samples treated with in situ heating at 1000 °C in ambient and reduced atmosphere versus a much larger mass loss of such samples treated with ex situ abrupt heating at 1000 °C in ambient atmosphere (10.0% for U, 18.1% for CHS, and 6.6% for CHGO) is due exclusively to the heating conditions, regardless of the type of atmosphere. The mass gain shown in the thermogravimetric analyses of the samples treated with in situ heating at 1000 °C in ambient and reduced atmospheres could be due to adsorption by the samples of the gas used in the said analyses at high temperature, as a consequence of their textural and structural transformation due to the heat treatment conditions to which they were exposed. The analyses were run under oxygen and nitrogen atmospheres, and the results were similar. On the other hand, the different steps observed in the DTG curves, besides water loss, are related to the different mineral transformations (i.e., loss of hydroxyls, decomposition of CO2, and recrystallization processes) observed in the heated samples.
The transformation of the vermiculites due to physical treatments by heating at high temperatures in ambient and reducing atmosphere is the cause of the differences in the BET results in the investigated samples. Comparing the results of the textural parameters obtained in this investigation of the vermiculites from Uganda and China treated with in situ heating at 1000 °C in ambient atmosphere with those obtained for the same samples treated with ex situ heating at 1000 °C in ambient atmosphere (Table 6), it can be stated that the SBET, Qm, and Vp values of the first samples are lower, although the pore size is generally higher. Therefore, the decrease in these values corroborates the observations of the SEM images that show how the expansion produced less separation of the sheets.
In summary, the specific applications of commercial heat-treated vermiculite may vary depending on the textural parameters (surface area and porosity), degree of sheet spread apart achieved, and other characteristics related to their mineral compositions at the end of the thermal process. These properties of raw vermiculites can be modulated by using different types of heat treatment (in situ and ex situ) and atmosphere (ambient and reduced), here described in the current study, in order to adapt them to the final industrial and technological purpose.

5. Conclusions

To the authors’ knowledge, this is the first time that results of vermiculites treated with in situ heating at 1000 °C in a reducing atmosphere have been presented.
The response of different commercial vermiculites to in situ heating at 1000 °C in ambient and reduced atmosphere was the transformation of its surface and volumetric properties, color appearance, and crystalline structure due to dehydration and mineral alteration processes.
In situ heating at 1000 °C in the Ar and/or H2 atmosphere produced a lower percentage of mass loss, practically related to water content, than heating in the ambient atmosphere. The very slight mass loss shown in the thermogravimetric analyses of samples treated with in situ heating at 1000 °C in the conditions presented in this study seems to be due exclusively to the heating conditions, regardless of the type of atmosphere.
The decrease in the specific surface area, adsorption capacity, and pore volume values of the samples treated with in situ heating at 1000 °C in ambient and reduced atmosphere related to those values obtained for the samples treated with ex situ abrupt heating at 1000 °C in ambient atmosphere corroborated that the expansion in the first type of thermal treatment produced less separation of the exfoliation sheets that the expansion of the samples in the second type of thermal treatment.
These textural changes, together with the structural ones, could play a fundamental role in the choice of industrial and technological applications for which these materials could be used.
Finally, it can be concluded that the properties of raw vermiculites can be modulated using different types of heat treatment (in situ and ex situ) and atmosphere (ambient and reduced) for the purpose of adapting them to the final industrial and technological application.

Author Contributions

Conceptualization, C.M.; methodology, C.M., A.L., P.Á.-L. and F.L.; software, C.M., A.L., P.Á.-L. and F.L.; validation, C.M.; formal analysis, C.M., A.L. and P.Á.-L.; investigation, C.M., A.L., P.Á.-L. and F.L.; resources, C.M., A.L., P.Á.-L. and F.L.; data curation, C.M.; writing—original draft preparation, C.M., A.L. and P.Á.-L.; writing—review and editing, C.M.; visualization, C.M.; supervision, C.M. and P.Á.-L.; funding acquisition, P.Á.-L. and F.L. All authors have read and agreed to the published version of the manuscript.

Funding

This research was funded by the Ministry of Science and Innovation, Spain, projects PCI2019–111931-2 and PID2021-126098OB-I00/701AEI/FEDER10.13039/501100011033, and the European Regional Development Fund (ERDF)-Next Generation/EU program.

Data Availability Statement

No new data were created.

Acknowledgments

The authors would like to acknowledge the technical assistance provided at the Scientific-Technical Services, University of Oviedo, Spain, executing X-ray diffraction, fluorescence analyses, thermal gravimetric analyses, and textural parameters.

Conflicts of Interest

The authors declare no conflicts of interest.

References

  1. Mathieson, A.M.; Walker, G.F. Crystal structure of magnesium-vermiculite. Am. Min. 1954, 39, 231–255. [Google Scholar]
  2. Vali, H.; Hesse, R. Identification of vermiculite by transmission electron microscopy and x-ray diffraction. Clay Miner. 1992, 27, 185–192. [Google Scholar] [CrossRef]
  3. Collins, D.R.; Fitch, A.N.; Catlow, R.A. Dehydration of vermiculites and montmorillonites: A time-resolved powder neutron diffraction study. J. Mater. Chem. 1992, 8, 865–873. [Google Scholar] [CrossRef]
  4. Reichenbach, H.G.; Beyer, J. Dehydration and rehydration of vermiculites: IV. Arrangements of interlayer components in the 1.43 nm and 1.38 nm hydrates of Mg-vermiculite. Clay Miner. 1994, 29, 327–340. [Google Scholar]
  5. Reichenbach, H.G.; Beyer, J. Dehydration and rehydration of vermiculites: II. Phlogopitic Ca-vermiculite. Clay Miner. 1995, 30, 273–286. [Google Scholar] [CrossRef]
  6. Reichenbach, H.G.; Beyer, J. Dehydration and rehydration of vermiculites: III. Phlogopitic Sr. and Ba-vermiculite. Clay Miner. 1997, 32, 573–586. [Google Scholar] [CrossRef]
  7. Marcos, C.; Argüelles, A.; Ruíz-Conde, A.; Sánchez-Soto, P.J.; Blanco, J.A. Study of the dehydration process of vermiculites by applying a vacuum pressure: Formation of interstratified phases. Mineral. Mag. 2003, 67, 1253–1268. [Google Scholar] [CrossRef]
  8. Marcos, C.; Arango, Y.C.; Rodríguez, I. X-ray diffraction studies of the thermal behaviour of commercial vermiculites. Appl. Clay Sci. 2009, 42, 368–378. [Google Scholar] [CrossRef]
  9. Valášková, M.; Martynková, G.S. Vermiculite: Structural properties and examples of the use. In Clay Minerals in Nature—Their Characterization, Modification and Application; Valášková, M., Martynková, G.S., Eds.; IntechOpen: London, UK, 2012. [Google Scholar] [CrossRef]
  10. Suzuki, M.; Suzuki, I.S. Superparamagnetic behavior in a Ni vermiculite intercalation compound. Phys. Rev. B 2001, 64, 104418. [Google Scholar] [CrossRef]
  11. Hindman, J.R. Vermiculite. In Industrial Minerals and Rocks: Commodities, Markets, and Uses; Kogel, J.E., Trivedi, N.C., Krukowsky, S.T., Eds.; Society for Mining, Metallurgy, and Exploration: Englewood, CO, USA, 2006; pp. 1015–1027. [Google Scholar]
  12. Bergaya, F.; Theng, B.K.G.; Lagaly, G. (Eds.) Developments in Clay Science. In Handbook of Clay Science, 2nd ed.; Elsevier Ltd.: Amsterdam, The Netherlands, 2006; Volume 5. [Google Scholar]
  13. Klein, C.; Dutrow, B. Manual of Mineral Science, 23rd ed.; Wiley: New York, NY, USA, 2007; p. 716. [Google Scholar]
  14. Abollino, O.; Giacomino, A.; Malandrino, M.; Mentasti, E. Interaction of metal ions with montmorillonite and vermiculite. Appl. Clay Sci. 2008, 38, 227–236. [Google Scholar] [CrossRef]
  15. Zhang, K.; Xu, J.; Wang, K.Y.; Cheng, L.; Wang, J.; Liu, B. Preparation and characterization of chitosan nanocomposites with vermiculite of different modification. Polym. Degrad. Stab. 2009, 94, 2121–2127. [Google Scholar] [CrossRef]
  16. Marcos, C.; Argüelles, A.; Khainakov, S.A.; Rodríguez- Fernández, J.; Blanco, J.A. Spin-glass freezing in Ni-vermiculite intercalation compound. J. Condens. Matter. Phys. 2012, 24, 346001–346010. [Google Scholar] [CrossRef]
  17. Marcos Pascual, C.; Argüelles, A.; Leoni, M.; Blanco, J.A. Location of Ni2+ in nickel-intercalated vermiculites. Appl. Clay Sci. 2014, 91–92, 79–86. [Google Scholar] [CrossRef]
  18. Midgley, H.G.; Midgley, C.M. The mineralogy of some commercial vermiculites. Clay Miner. 1960, 4, 142–150. [Google Scholar] [CrossRef]
  19. Couderc, P.; Douillet, P. Les Vermiculites industrielles: Exfoliation, caractéristiques mineralogiques et chimiques. Bull. Soc. Franc. Céram. 1973, 99, 51–59. [Google Scholar]
  20. Hillier, S.; Marwa, E.M.M.; Rice, C.M. On the mechanism of exfoliation of “Vermiculite”. Clay Miner. 2013, 48, 563–582. [Google Scholar] [CrossRef]
  21. Marcos, C. Structural changes in vermiculites induced by temperature, pressure, irradiation, and chemical treatments. In Clay Science and Technology; Nascimento, G.M.D., Ed.; IntechOpen: London, UK, 2020. [Google Scholar] [CrossRef]
  22. Zhang, Y.; Chen, M.; Li, G.; Shi, C.; Wang, B.; Ling, Z. Exfoliated vermiculite nanosheets supporting tetraethylenepentamine for CO2 capture. Results Mater. 2020, 7, 100–102. [Google Scholar] [CrossRef]
  23. Pereira, M.H.S.; dos Santos, C.G.; de Lima, G.M.; Oliveira-Bruziquesi, C.G.; de Alvarenga-Oliveira, V. Capture of CO2 by vermiculite impregnated with CaO. Carbon Manag. 2022, 13, 117–126. [Google Scholar] [CrossRef]
  24. Abidi, S.; Nait-Ali, B.; Joliff, Y.; Favotto, C. Impact of perlite, vermiculite and cement on the thermal conductivity of a plaster composite material: Experimental and numerical approaches. Compos. B Eng. 2015, 68, 392–400. [Google Scholar] [CrossRef]
  25. Mo, K.H.; Lee, H.J.; Liu, M.Y.J.; Ling, T.-C. Incorporation of expanded vermiculite lightweight aggregate in cement mortar. Constr. Build Mater. 2018, 179, 302–306. [Google Scholar] [CrossRef]
  26. Alsaman, A.S.; Ibrahim, E.M.M.; Ahmed, M.S.; Askalany, A.A. Composite adsorbent materials for desalination and cooling applications: A state of the art. Int. J. Energy Res. 2022, 46, 10345–10371. [Google Scholar] [CrossRef]
  27. Cvejn, D.; Martausová, I.; Martaus, A.; Prech, J.; Vesely, O.; Cejka, J.; Lacny, Z.; Nedoma, J.; Martínek, R. Vermiculites catalyze unusual benzaldehyde and dioxane reactivity. Catal. Today 2021, 366, 218–226. [Google Scholar] [CrossRef]
  28. Katsou, E.; Malamis, S.; Loizidou, M. Performance of a membrane bioreactor used for the treatment of wastewater contaminated with heavy metals. Bioresour. Technol. 2011, 102, 4325–4332. [Google Scholar] [CrossRef] [PubMed]
  29. Ji, X.; Ge, L.; Liu, C.; Tang, Z.; Xiao, Y.; Chen, W.; Lei, Z.; Gao, W.; Blake, S.; De, D.; et al. Capturing functional two-dimensional nano sheets from sandwich-structure vermiculite for cancer theranostics. Nat. Commun. 2021, 12, 1124. [Google Scholar] [CrossRef] [PubMed]
  30. Marcos, C.; Rodríguez, I. Exfoliation of vermiculites with chemical treatment using hydrogen peroxide and thermal treatment using microwaves. Appl. Clay Sci. 2014, 87, 219–227. [Google Scholar] [CrossRef]
  31. Velde, B. High temperature or metamorphic vermiculites. Contrib. Miner. Petrol. 1978, 66, 319–323. [Google Scholar] [CrossRef]
  32. Whitney, D.L.; Evans, B.W. Abbreviations for names of rock-forming minerals. Am. Mineral. 2010, 95, 185–187. [Google Scholar] [CrossRef]
  33. Inguanzo, M.; Menéndez, J.A.; Fuente, E.; Pis, J.J. Reactivity of pyrolyzed sewage sludge in air and CO2. J. Anal. Appl. Pyrolysis 2001, 58–59, 943–954. [Google Scholar] [CrossRef]
  34. Thommes, M.; Kaneko, K.; Neimark, A.V.; Olivier, J.P.; Rodriguez-Reinoso, F.; Rouquerol, J.; Sing, K.S.W. Physisorption of gases, with special reference to the evaluation of surface area and pore size distribution (IUPAC Technical Report). Pure Appl. Chem. 2015, 87, 1051–1069. [Google Scholar] [CrossRef]
  35. Barrett, E.P.; Joyner, L.G.; Halenda, P.P. The determination of pore volume and area distributions in porous substances. I. computations from nitrogen isotherms. J. Am. Chem. Soc. 1951, 73, 373–380. [Google Scholar] [CrossRef]
  36. Faass, G.S. Correlation of Gas Adsorption, Mercury Intrusion, and Electron Microscopy Pore Property Data for Porous Glasses; Georgia Institute of Technology: Atlanta, GA, USA, 1981; p. 260. [Google Scholar]
  37. Marcos, C.; Lahchich, A.; Álvarez-Lloret, P. Hydrothermally treated vermiculites: Ability to support products for CO2 adsorption and geological implications. Appl. Clay Sci. 2023, 232, 106791. [Google Scholar] [CrossRef]
  38. Stoch, L. Thermal analysis and thermochemistry of vitreous into crystalline state transition. J. Therm. Anal. Calorim. 2004, 77, 7–16. [Google Scholar] [CrossRef]
Figure 1. Appearance of the investigated vermiculites in hand sample: (a) U, (b) CHS, (c) CHGO.
Minerals 14 00232 g001
Figure 2. Appearance in hand sample of the vermiculites U treated in situ at 1000 °C and (a) in ambient atmosphere, (b) in reduced atmosphere of 5%H2 and 95%Ar, and (c) in reduced atmosphere of 100% H2.
Minerals 14 00232 g002
Figure 3. Appearance in hand sample of the vermiculites CHS treated in situ at 1000 °C and (a) in ambient atmosphere, (b) in reduced atmosphere of 5%H2 and 95%Ar, and (c) in reduced atmosphere of 100% H2.
Minerals 14 00232 g003
Figure 4. Appearance in hand sample of the vermiculites CHGO treated in situ at 1000 °C and (a) in ambient atmosphere, (b) in reduced atmosphere of 5%H2 and 95%Ar, and (c) in reduced atmosphere of 100% H2.
Minerals 14 00232 g004
Figure 5. Appearance with SEM observations of the expansion in the vermiculites U: (a) with in situ heating at 1000 °C in H2 atmosphere; (b) with ex situ heating at 1000 °C in ambient atmosphere.
Minerals 14 00232 g005
Figure 6. Appearance with SEM observations of the expansion in the vermiculites CHS: (a) with in situ heating at 1000 °C in H2 atmosphere; (b) with ex situ heating at 1000 °C in ambient atmosphere.
Minerals 14 00232 g006
Figure 7. Appearance with SEM observations of the expansion in the vermiculites CHGO: (a) with in situ heating at 1000 °C in H2 atmosphere; (b) with ex situ heating at 1000 °C in ambient atmosphere.
Minerals 14 00232 g007
Figure 8. XRD of raw U sample (a), expanded sample under ambient atmosphere U-1000 (b), and expanded samples under reduced atmosphere U-1000-Ar (c), U-1000-5H2/95Ar (d), and U-1000-H2 (e). Note: Phl = phlogopite, En = enstatite, Fo = forsterite, and Hem = hematite [32].
Minerals 14 00232 g008
Figure 9. XRD of raw CHS sample (a), expanded sample under ambient atmosphere CHS-1000 (b), and expanded samples under reduced atmosphere CHS-1000-Ar (c), CHS-1000-5H2/95Ar (d), and CHS-1000-H2 (e). Note: Vrm = vermiculite, Bt = biotite, Hbt = hydrobiotite, and Fo = forsterite [32].
Minerals 14 00232 g009
Figure 10. XRD of CHGO sample (a), expanded sample under ambient atmosphere CHGO-1000 (b), and expanded samples under reduced atmosphere CHGO-1000-Ar (c), CHGO-1000-5H2/95Ar (d), and CHGO-1000-H2 (e). Note: Vrm = vermiculite, Phl = phlogopite, Hbt = hydrobiotite, Fo = forsterite, En = enstatite, Hem = hematite, and I = iron oxide [32].
Minerals 14 00232 g010
Figure 11. TG (a) and DTG (b) curves for the samples U, U-1000, U-1000-Ar, U-1000-5H2/95Ar, and U-1000-H2. Note: 1—adsorbed surface water loss; 2—interlayer water loss and interlayer cation-bound water; 3—recrystallization.
Minerals 14 00232 g011
Figure 12. TG (a) and DTG (b) curves for the samples CHS, CHS-1000, CHS-1000-5H2/95Ar, CHS-1000-Ar, and CHS-1000-H2. Note: 1—adsorbed surface water loss; 2—interlayer water loss and interlayer cation-bound water; 3—loss of hydroxyls; 4—decomposition of CO2; 5—recrystallization.
Minerals 14 00232 g012
Figure 13. TG (a) and DTG (b) curves for the samples CHGO, CHGO-1000, CHGO-1000-5H2/95Ar, CHGO-1000-Ar, and CHGO-1000-H2. Note: 1—adsorbed surface water loss; 2—interlayer water loss and interlayer cation-bound water; 3—loss of hydroxyls; 4—decomposition of CO2; 5—recrystallization.
Minerals 14 00232 g013
Figure 14. BET isotherms for raw samples and samples treated with in situ heating at 1000 °C in ambient and reduced atmosphere from Uganda (a) and China: CHS (b) and China: CHGO (c). Relative pressure (P/P0).
Minerals 14 00232 g014
Table 1. Labels of the high-temperature heated vermiculite samples.
High-Temperature Thermal Treatment
Ambient100% Ar5% H2/95% Ar100% H2
U-1000U-1000-ArU-1000-5H2/95ArU-1000-H2
CHS-1000CHS-1000-ArCHS-1000-5H2/95ArCHS-1000-H2
CHGO-1000CHGO-1000-ArCHGO-1000-5H2/95ArCHGO-1000-H2
Table 2. Percentages of the oxides of the main elements in the analyzed samples.
Element Oxideswt. %
UCHSCHGO
SiO234.9637.8837.20
Al2O312.0512.0813.62
Fe2O38.385.2918.39
MnO0.110.040.16
MgO21.5223.1510.04
CaO0.361.161.39
Na2O0.141.510.30
K2O0.364.805.08
TiO21.421.252.50
P2O50.110.010.10
L.O.I.20.5211.8711.11
TOTAL99.9299.0599.88
Table 3. Loss mass (wt. %) of the investigated samples after in situ heating at 1000 °C at ambient and reduced atmosphere.
SamplesMass Loss (wt %)
U-100023.5
U-1000-Ar19.5
U-1000-5H2/95Ar20.6
U-1000-H218.3
CHS-100012.7
CHS-1000-Ar9.4
CHS-1000-5H2/95Ar12.3
CHS-1000-H210.4
CHGO-100011.4
CHGO-1000-Ar10.6
CHGO-1000-5H2/95Ar13.2
CHGO-1000-H210.5
Table 4. Loss and gain mass (%) of the investigated samples.
Mass Loss (%)Gain Loss (%)
U20.000.00
U-10000.790.83
U-1000-Ar0.530.08
U-1000-5H2/95Ar0.831.08
U-1000-H20.920.01
CHS9.020.00
CHS-10000.780.14
CHS-1000-Ar0.600.01
CHS-1000-5H2/95Ar0.640.57
CHS-1000-H20.220.12
CHGO9.200.00
CHGO-10000.600.00
CHGO-1000-Ar1.040.01
CHGO-1000-5H2/95Ar0.352.77
CHGO-1000-H20.203.17
Table 5. Specific surface area (SBET), adsorption capacity (Qm), pore volume (Vp), BET constant (C), and correlation coefficient (R2) of nitrogen adsorption–desorption measurements for raw and treated vermiculites.
SampleSBET
(m2/g)
Qm
(mmol/g STP)
Vp
(mmol/g STP)
Pore Size
(nm)
CR2
U11.70 ± 0.10.120.0052.9355.10.9999
U-100010.63 ± 0.10.110.0032.9456.90.9995
U-1000-Ar9.53 ± 0.10.100.0022.9058.40.9996
U-1000-5H2/95Ar9.40 ± 0.10.100.0032.9569.70.9996
U-1000-H211.48 ± 0.10.120.0042.9380.30.9997
CHS15.40 ± 0.10.160.0032.95137.50.9998
CHS-10005.98 ± 0.030.060.0022.9287.40.9997
CHS-1000-Ar4.23 ± 0.020.040.0012.9280.40.9999
CHS-1000-5H2/95Ar3.80 ± 0.030.040.0012.5245.20.9994
CHS-1000-H24.94 ± 0.040.050.0023.24231.90.9998
CHGO12.10 ± 0.10.160.0072.52155.60.9996
CHGO-10003.59 ± 0.020.040.0012.9363.00.9997
CHGO-1000-Ar4.54 ± 0.040.050.0012.5255.90.9994
CHGO-1000-5H2/95Ar2.06 ± 0.020.020.0012.9544.00.9994
CHGO-1000-H23.60 ± 0.030.040.0012.9368.80.9995
Table 6. Specific surface area (SBET), adsorption capacity (Qm), pore volume (Vp), BET constant (C), and correlation coefficient (R2) of nitrogen adsorption–desorption measurements for vermiculites heated at 1000 °C in ambient atmosphere for 1 min.
SampleSBET
(m2/g)
Qm
(mmol/g STP)
Vp
(mmol/g STP)
Pore Size
(nm)
CR2
U-100013.2 ± 0.00.140.062.52184.70.9999
CHS-10008.33 ± 0.10.090.0062.5186.20.9996
CHGO-10009.04 ± 0.10.090.0062.64135.10.9998
Disclaimer/Publisher’s Note: The statements, opinions and data contained in all publications are solely those of the individual author(s) and contributor(s) and not of MDPI and/or the editor(s). MDPI and/or the editor(s) disclaim responsibility for any injury to people or property resulting from any ideas, methods, instructions or products referred to in the content.

