Article

A New Perspective on the Applicability of Diffuse Reflectance Spectroscopy for Determining the Hematite Content of Fe-Rich Soils in the Tropical Margins of China

1
Key Laboratory for Humid Subtropical Eco-Geographical Processes of the Ministry of Education, Fujian Normal University, Fuzhou 350117, China
2
Institute of Geography, Fujian Normal University, Fuzhou 350117, China
3
Ministry of Education Key Laboratory of Western China’s Environmental Systems, College of Earth and Environmental Sciences, Lanzhou University, Lanzhou 730000, China
*
Author to whom correspondence should be addressed.
Minerals 2024, 14(3), 242; https://doi.org/10.3390/min14030242
Submission received: 9 January 2024 / Revised: 21 February 2024 / Accepted: 26 February 2024 / Published: 27 February 2024

Abstract

:
Hematite and goethite are widely occurring chromogenic iron oxides in soils and sediments that are sensitive to climatic dry/wet shifts. However, only by accurately quantifying the content or ratio of hematite and goethite can they be applied reliably to palaeoclimate reconstruction. Compared to the Loess Plateau of China, hematite in the soils of southern China has not been sufficiently studied. We used diffuse reflectance spectroscopy (abbreviation DRS, including the first-derivative curves and the second-derivative curves of the Kubelka–Munk remission functions), combined with ignition at 950 °C, and X-ray fluorescence (XRF) to quantify the hematite content of four tropical-margin iron-rich soil profiles with different matrix compositions in the Leizhou Peninsula, China. We also examined the application of hematite quantification parameters in soils with different matrix compositions under the same climatic conditions. Our main findings are as follows: (i) DRS first-derivative curves can reflect the presence of goethite and hematite in soils, and their relative contents can be compared within the same profile. (ii) The second-derivative curve of the Kubelka–Munk remission functions can reflect the relative proportions of goethite and hematite and provide information about the degree of Al substitution. (iii) Combined with calibration equations, soil redness can reliably quantify the hematite content, but it is necessary to consider the effect of mucilage envelopes in the process of hematite formation. Additionally, we summarize various methods used for quantifying hematite, and the influence of soil matrix compositions, with the aim of providing a reference for hematite quantification elsewhere. We also propose a new indicator (ΔHmRed/HmRed) to help detect iron hydroxide/iron oxide changes in soils.

1. Introduction

Iron oxides and hydroxides are common in almost all Earth environments [1,2,3]. In response to changing ambient conditions, the various Fe oxide/hydroxide phases can transform into each other [3]. Hematite (α-Fe2O3) is usually the final member in the transformation process of iron oxides, often coexisting with goethite (α-FeOOH), and it is an important chromogenic and magnetic mineralogical component of soils and sediments [4,5,6]. Due to the sensitivity of goethite and hematite to environmental changes, together with their specific magnetic properties [5], both minerals are often used for palaeoclimate reconstruction in marine [7,8] and terrestrial [9,10,11,12] environments.
Quantifying hematite or determining the hematite to goethite ratio is a prerequisite for the interpretation of iron mineralogy in palaeoclimate studies. Multi-proxies used in combination can help reduce ambiguities in hematite quantification in natural samples [13]. There is also a need for breakthroughs in quantitative methods of spectroscopy. Diffuse reflectance spectroscopy (DRS) has been used over the last century to determine the contents of these two minerals, with the unique crystal field band position (521–565 nm) of hematite distinguishing it from other minerals so it can be studied quantitatively in the visible band without the need to extend to the near-infrared [14]. Three important points can be made about the application of DRS to studying hematite in soils. (i) The first derivatives of diffuse reflectance spectral curves have been used to semi-quantitatively determine the amount of hematite in soil [15]. (ii) The application of the second-derivative curve of the Kubelka–Munk (K-M) remission functions has greatly reduced the detection limit of hematite [16]. Thus, DRS is superior to other methods such as Raman spectra and X-ray diffraction for quantifying hematite. Additionally, DRS has the advantages of being economical, rapid, and non-destructive, and it can be combined with the standard citrate-bicarbonate-dithionite (CBD) treatment to accurately quantify the hematite and goethite contents of soils and sediments [14]. However, influences such as cation substitution need to be considered when using DRS for the accurate quantification of these minerals [17,18,19]. (iii) Previous studies on the redness indices of soils have shown a high correlation between the Munsell color equation parameters and the hematite content in both synthetic and natural samples, as well as with the CIE standard colorimetric system [4,20]. The calibration equation for the visible band established by Ji et al. [21] can also accurately quantify hematite. Long et al. [6] accurately estimated the content of natural hematite using an equation based on the reflectance percentage of the red band, eliminating the need for time-consuming CBD treatment. Additionally, spectral experiments with a wider range of wavelengths (400–2400 nm) have been applied to loess [22], and, recently, Meng et al. [23] proposed a new method for determining the ratio of goethite to hematite that avoids the influence of soil matrix compositions and applied it to the Luochuan loess sequence. Different soil matrices represent different mineral categories and contents of non-measured target minerals. This affects the DRS measurement results [9,15].
The degree of Al substitution in hematite in the eolian loess-palaeosols of northern China is lower than in the soils of southern China [17]. Both magnetic measurements [24] and DRS [18,25,26,27,28] have been applied to determine the degree of Al substitution. In recent years, there has been an increased number of studies on soil hematite in southern China, such as of the red earth sediments of the Sichuan Basin [29,30], the lateritic soils of the Guangxi Zhuang Autonomous Region [31,32], and the Latosols of Fujian [33,34], Guangdong [35,36], and Hainan [6,37,38].
In the tropical and subtropical regions of southern China, intense weathering occurs during periods of heavy rainfall and elevated temperatures. Compared to loess in northern China, Latosols in southern China contain significantly higher levels of free Fe. Hematite, being the pedogenic end-stage and stable secondary Fe oxide, is also present in abundance due to numerous factors. Hematite to goethite ratio has been demonstrated to be a considerable potential index of precipitation [39]. However, the calculation and analysis of this parameter is still debated [40].
Soil development is affected by the five principal soil-forming factors (climate, parent material, topography, biology, and time), which raises the issue of the impact of the parent material on the formation and measurement of hematite in soils. To complement previous studies of hematite in different soil forming environments in the warm areas of several continents [41,42,43,44,45], we selected tropical iron-rich soils in the southern margin of China which developed under the same climate but with different parent materials, including granite, sandstone, unconsolidated sediments, and basalt. Our investigation focused on hematite content changes and the associated influencing factors in soil profiles developed from various parent materials. Although both goethite and hematite are essential, research on hematite in tropical regions is more mature [6], and it is difficult to accurately quantify natural goethite, with only a small amount of research on artificial goethite [3,18,46]. So, a semi-quantitative discussion was conducted on goethite. We used the first- and second-derivative curves of the Kubelka–Munk remission functions, soil redness calibration equations, and high-temperature ignition (at 950℃, where the various polymorphs of FeOOH or ferrihydrite dehydrate completely and transform into hematite). The samples were subjected to various analytical procedures before and after ignition, providing a more comprehensive assessment than commonly used loss-on-ignition (LOI) measurements. We also used X-ray fluorescence (XRF) to quantify the total Fe content and constrain hematite content. Considering the strong Al substitution of hematite in tropical soils and the substantial differences in soil matrix compositions, we did not use the method of Scheinost et al. [14] for quantifying hematite; but we used the more convenient redness-based calibration method. Our overall objectives were to integrate various analytical methods to maximize the application of hematite in palaeoclimate studies, and to achieve a more reliable quantification across soil profiles developed on different parent materials.

2. Materials and Methods

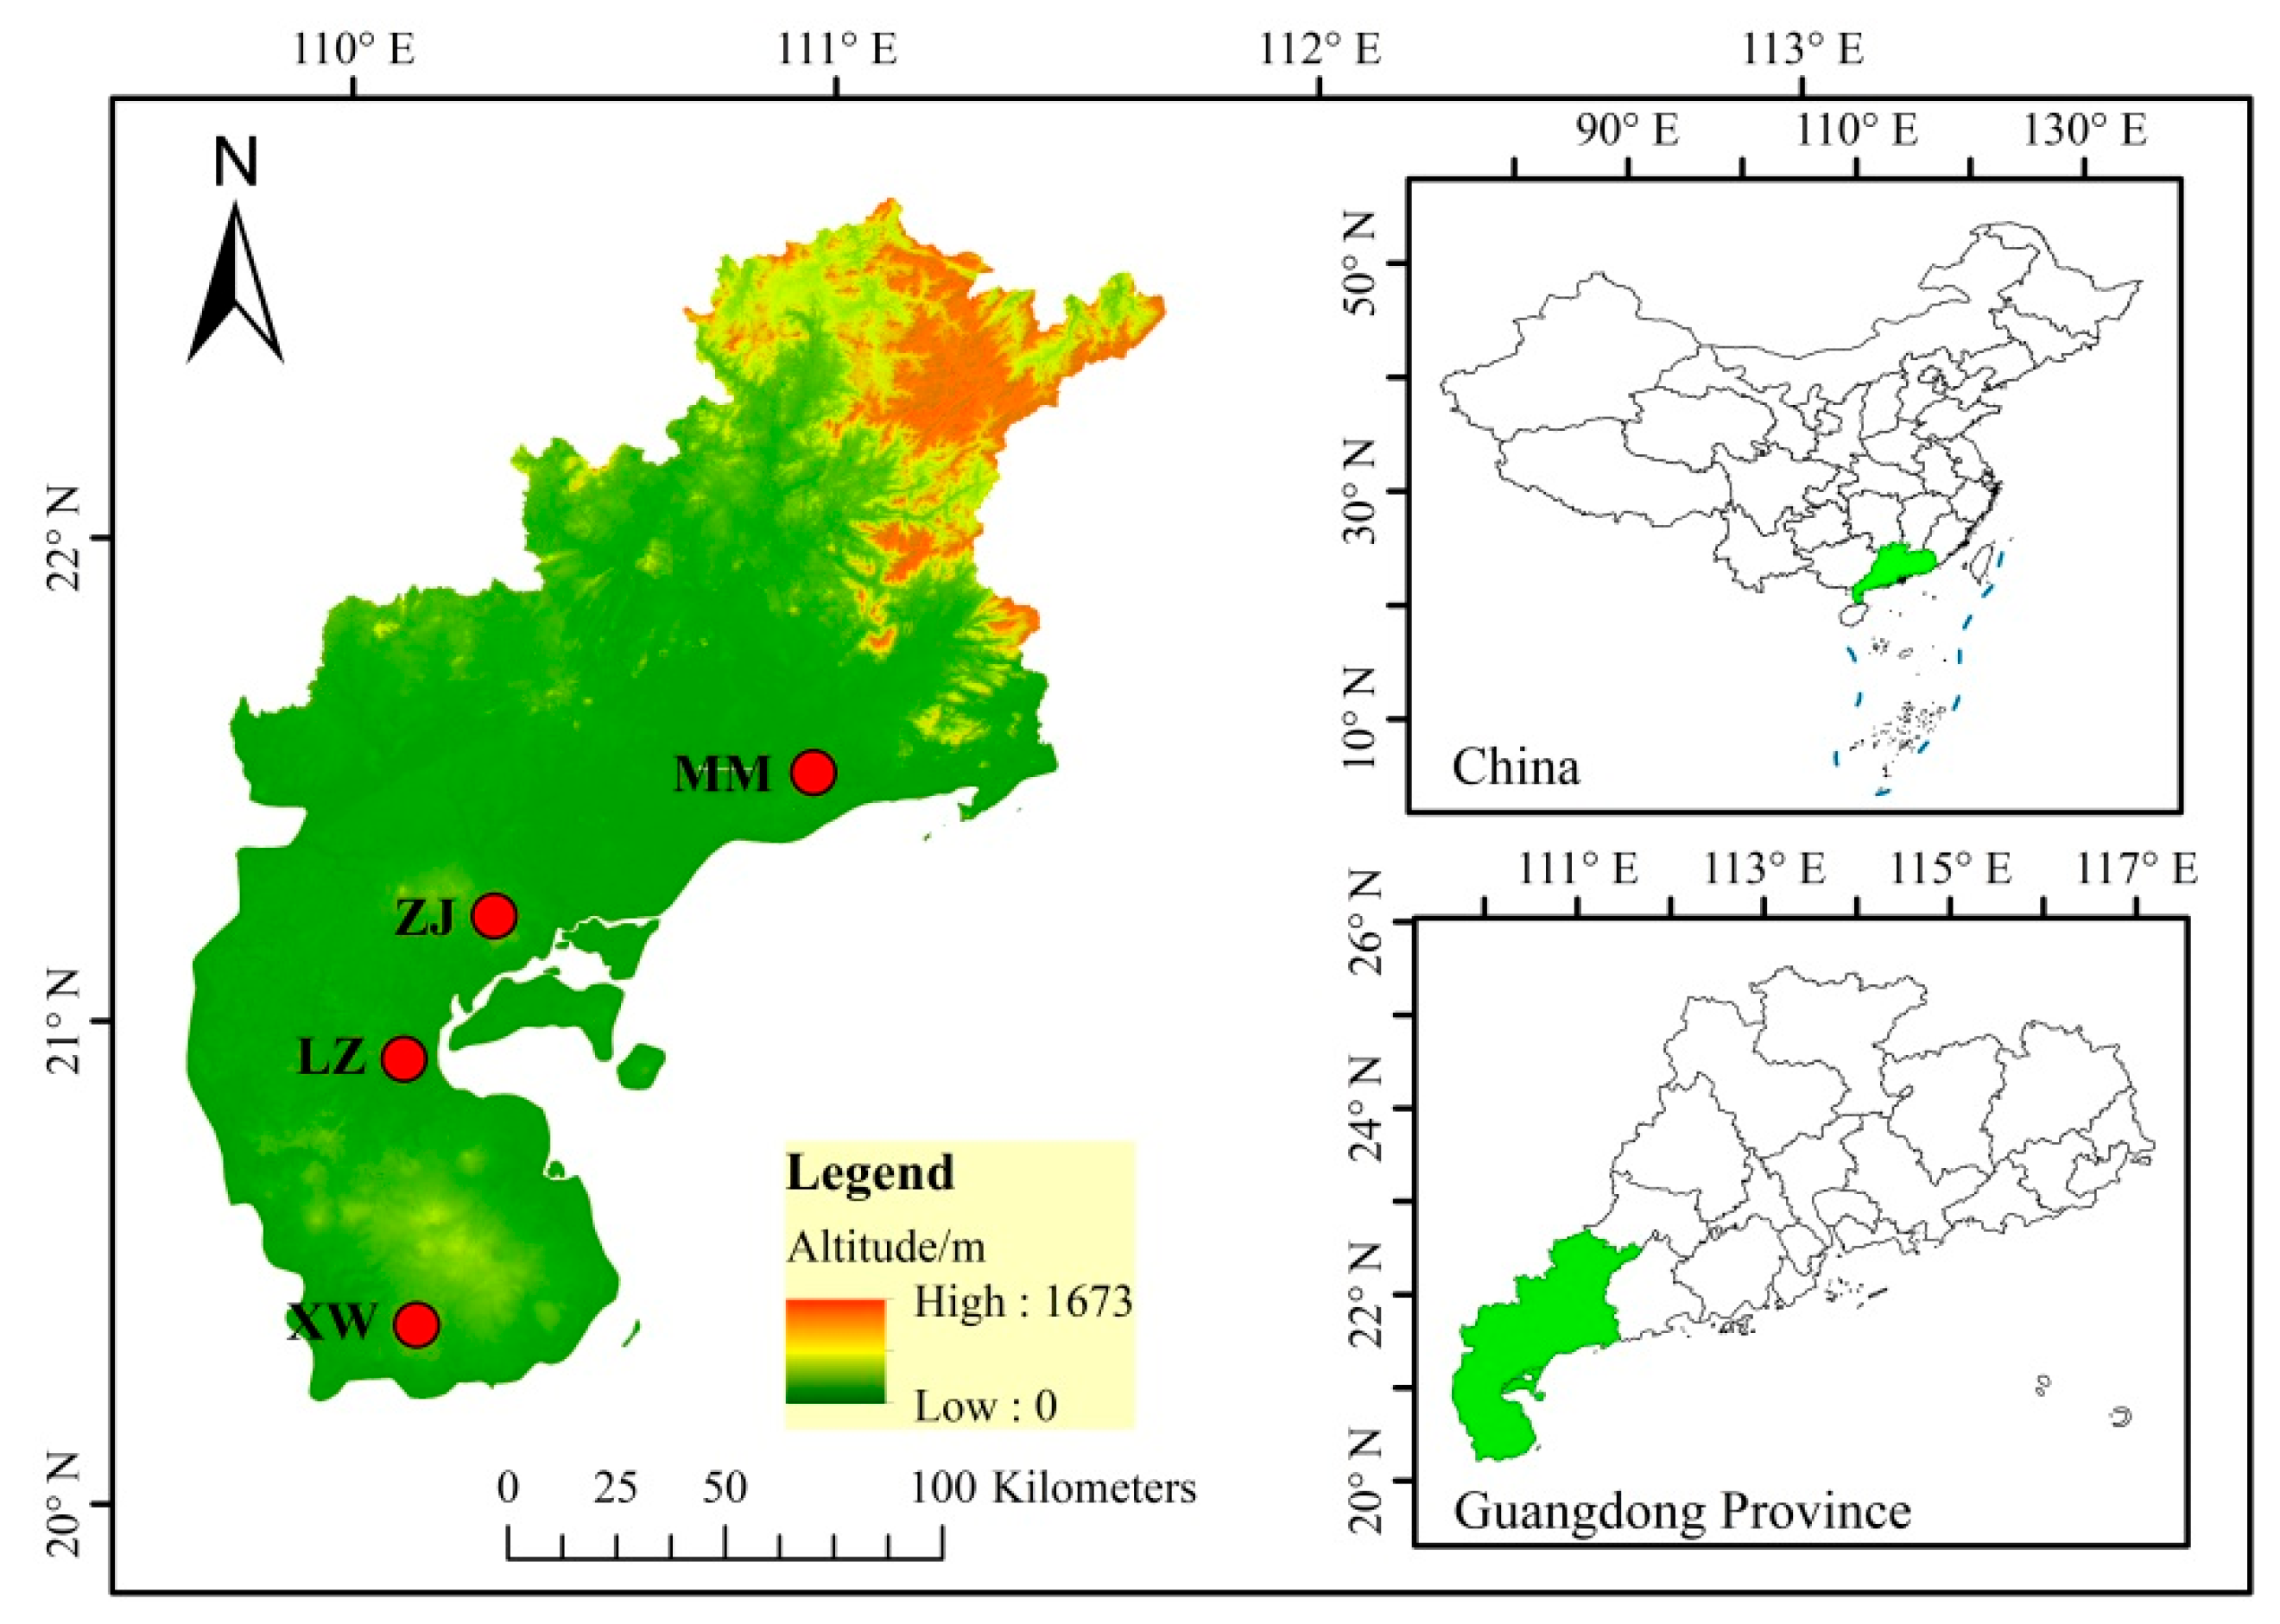
2.1. Study Area and Sampling

The Leizhou Peninsula, which is located on the margin of the tropical region of China, has a hot and humid climate with concentrated summer precipitation. This region is characterized by the widespread occurrence of Quaternary basalts [47], which contribute to the development of typical zonal Latosols [34,48]. Four representative soil profiles composed of the southern weathering crust in Guangdong Province were selected (Figure 1 and Table 1). The four profiles were distributed within a relatively small area under similar climatic conditions, and all profiles were located on well-drained slopes to avoid the influence of water retention and a reducing soil environment. The profiles, from north to south, include Maoming (MM), Zhanjiang (ZJ), Leizhou (LZ), and Xuwen (XW), which are characterized by differences in genetic conditions (Table 1 and Table 2).
All profiles were sampled at 10 cm intervals. We collected 42, 18, 41, and 26 samples in MM, ZJ, LZ, and XW, respectively, for a total of 127 samples. The samples were weighed before and after air drying, and the water-holding capacity (WHC) was calculated [(wet weight-dry weight)/wet weight × 100]. More information, such as terrain, is given by Tang et al. [35].

2.2. Laboratory Procedures and Measurements

Visible DRS measurements were taken with a UV–2600 + ISR–2600PLUS ultraviolet/visible spectrophotometer, Shimadzu (China) Co. (Beijing, China), with a wavelength range of 380–720 nm and measurement interval of 1 nm. Baseline correction was performed using barium sulfate (white plate) before starting measurements. Visible plant roots were removed, and air-dried samples were ground to pass 200 meshes (Approximately 74 μm) using an agate mortar. The sample powder was added to fill approximately half the capacity of the holder frame.
According to Long et al. [6], redness was calculated, and the hematite content (HmRed) was determined as a percentage using Equation (1), R2 = 0.97, as below.
HmRed(%) = 0.0012 × exp0.196×Redness.
The Kubelka–Munk theory was used to convert the original wavelength and reflectance curves into K-M remission functions, as discussed by Scheinost et al. [14]. The second derivative and curve smoothing were calculated and implemented using the UV-Probe 2.61 software. A convolution function with 17 data points was used for smoothing and derivative calculations. The ‘differential wavelength difference’ in this software can be thought of as the number of smoothing points. The larger the value, the smaller the noise, but the resolution of resulting spectra is also reduced. Therefore, the smallest value of ‘10’ was chosen there. Spectral experiments were conducted before and after samples were heated to 950 °C for 5 h in a muffle furnace. The heating experiment used 1 g of the sample and a scale with a precision of one ten-thousandth. A small sample content is conducive to the full transformation of minerals (Table 3).
Major element compositions of the soil samples were analyzed using X-ray fluorescence (XRF) with a Thermo ARL PERFORM’X spectrometer (Thermo Fisher Scientific Inc., Waltham, MA, USA). An appropriate amount of sample and boric acid was pressed under a 30t pressure to a disc with a diameter of 3.2 cm. A quantitative analysis of standard samples was conducted using XRF spectrometry. The results are expressed as weight percentages of the element oxide. The Chemical Index of Alteration (CIA) and the Index of Weathering and Leaching (Ba Index) were calculated from the results. The CIA was calculated as follows: CIA = Al2O3/(Al2O3 + CaO* + Na2O + K2O) × 100, where CaO* represents the calcium content of silicates, which reflects the degree of weathering of feldspar minerals into clay minerals. The CIA is often taken to indicate the degree of chemical weathering in the source area. CIA values of 50–65 indicate weak chemical weathering under a dry and cold climate; values of 65–85 indicate moderate chemical weathering; and values of 85–100 indicate strong chemical weathering, typically under the hot and humid conditions of tropical regions [49]. The Ba Index is the ratio of the soluble alkali component and alkaline earth metal elements to relatively stable Al2O3 and was calculated as follows: Ba Index = (K2O + Na2O + CaO + MgO)/Al2O3. The lower the Ba Index, the stronger the degree of weathering [50].
Original and ignited samples were ground into powder (without damaging the original soil particles) and placed in an 8 cm3 transparent plastic box. Low-frequency magnetic susceptibility measurements were taken with a Bartington Instruments MS2B Magnetic Susceptibility Meter at a frequency of 470 Hz.

3. Results

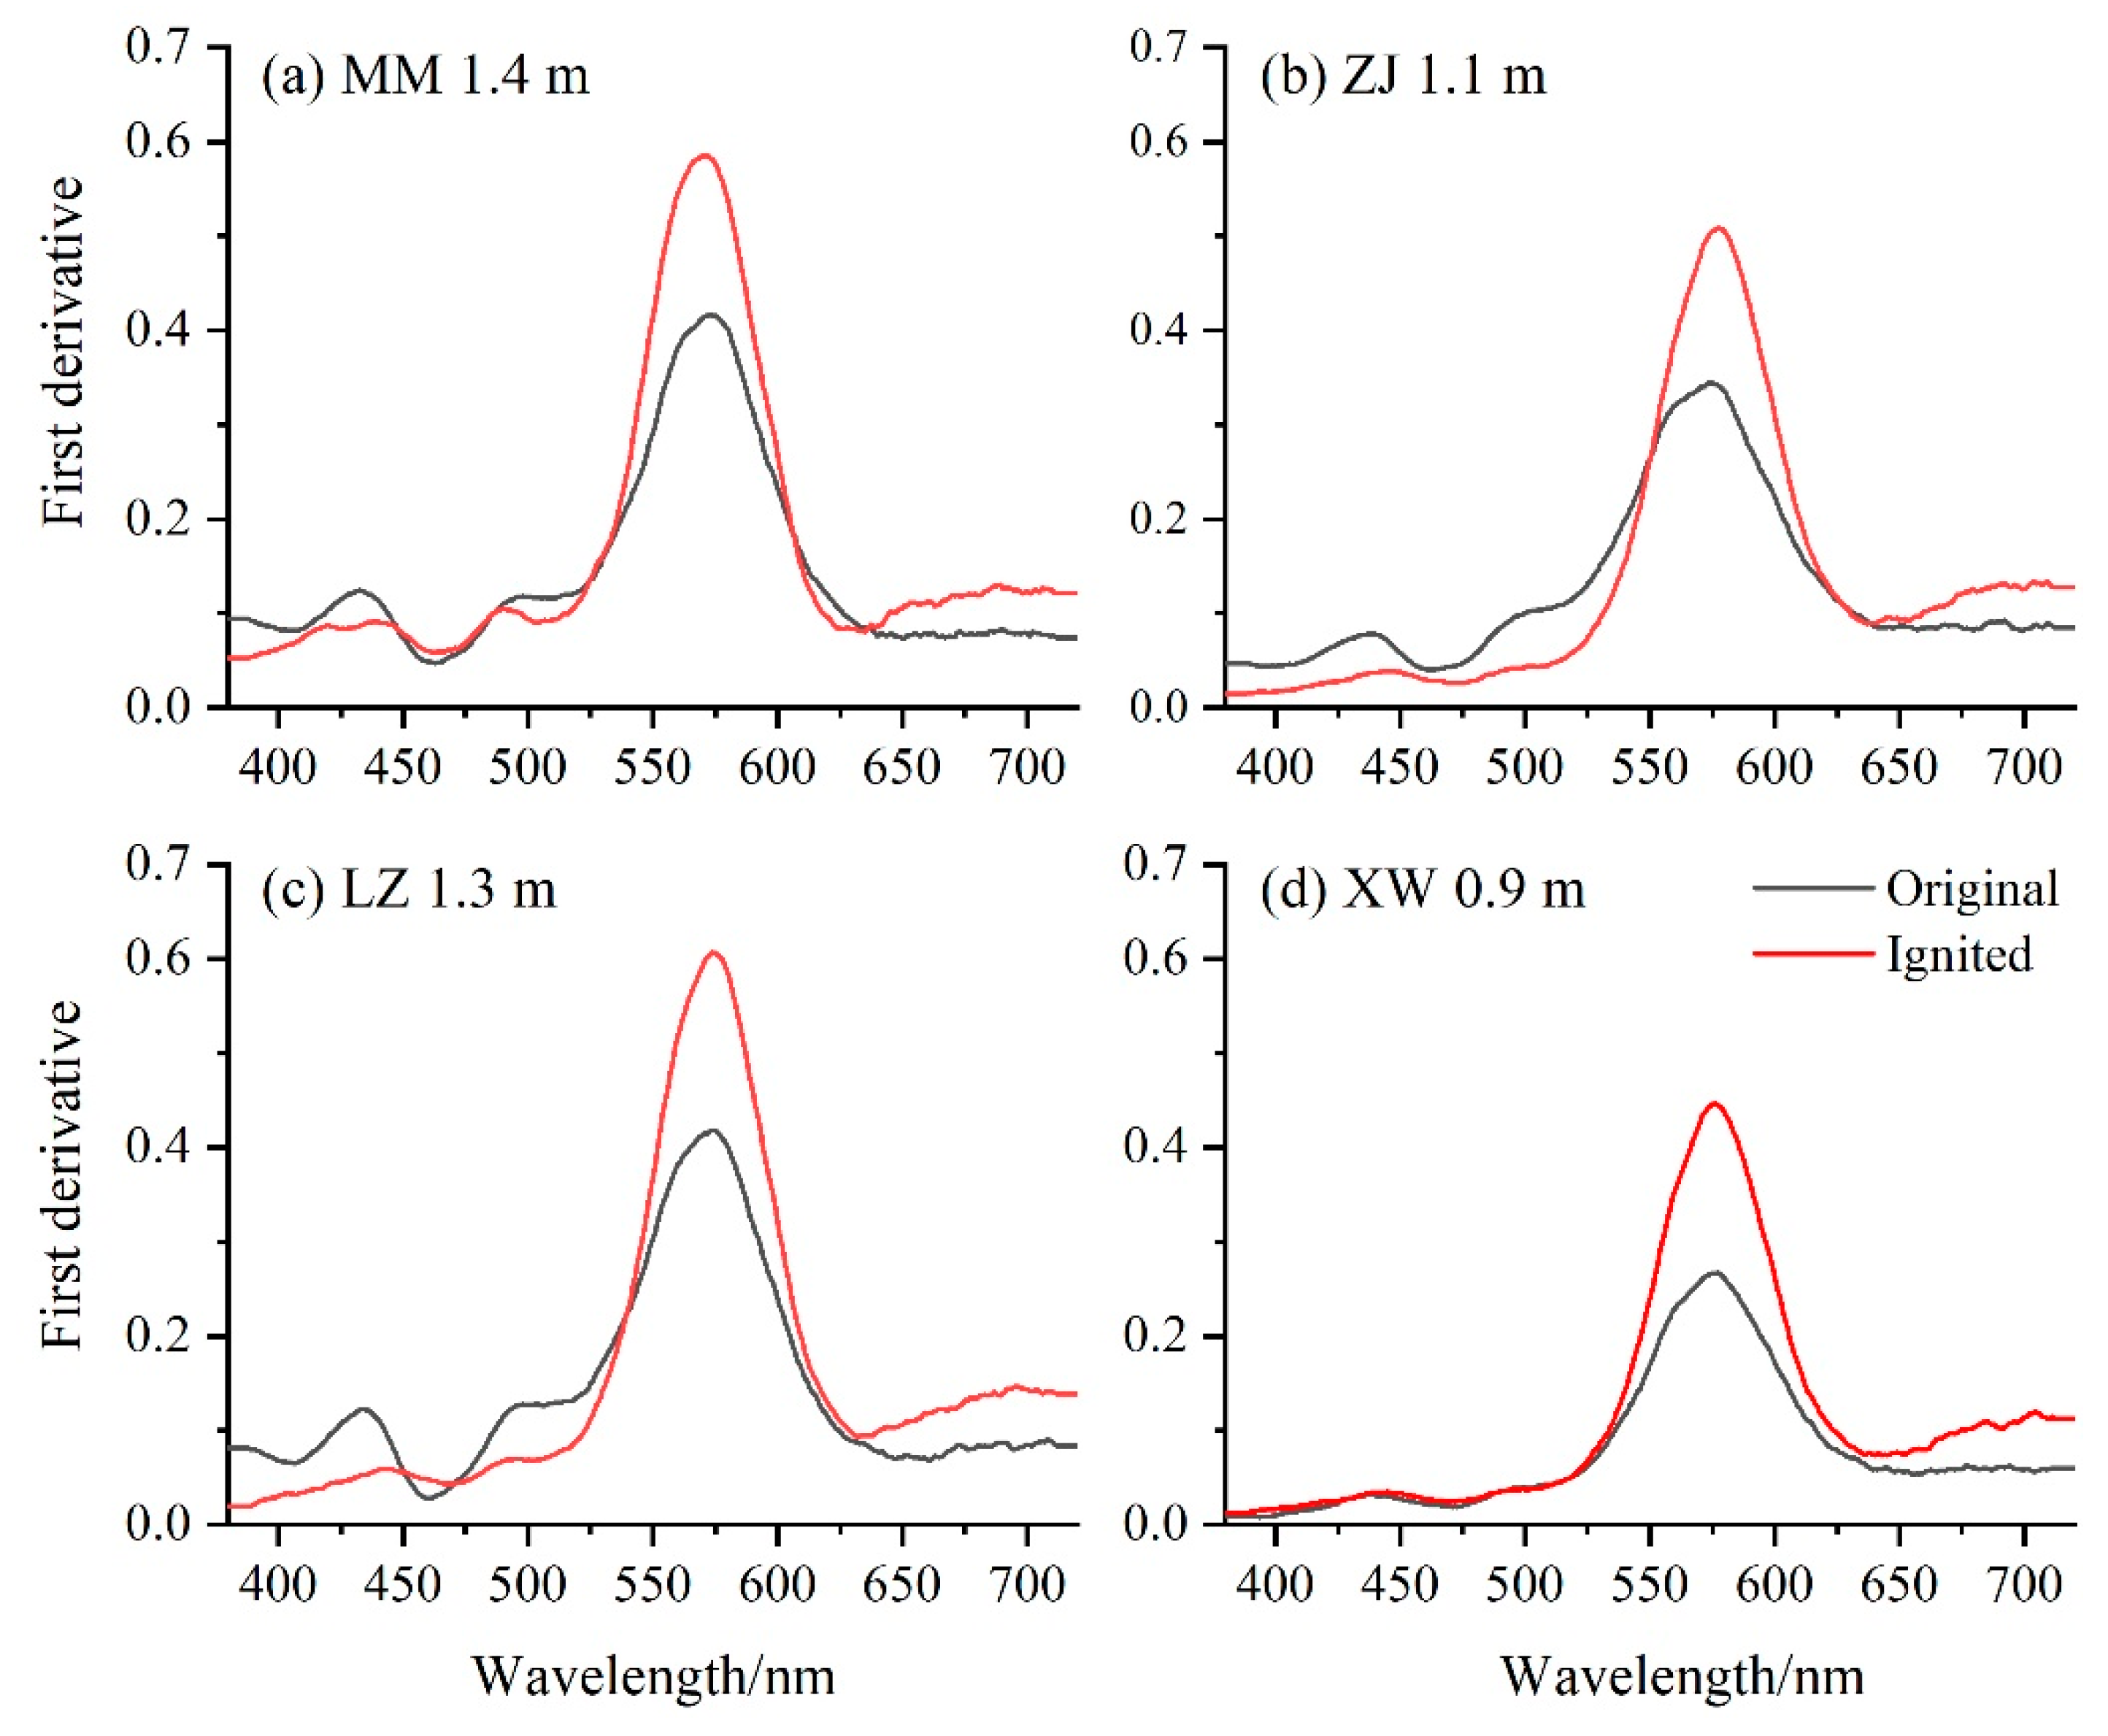
3.1. Characteristics of the First Derivative of DRS Curves before and after Ignition

First-derivative curves of DRS before and after ignition are shown in Figure 2. In unheated samples, a goethite peak occurs at 435 nm and a hematite peak at 575 nm. After heating at 950 °C, the peak at 425–450 nm shifts significantly; there is only a subduct peak at 435 nm; and the peak intensity at 575 nm increases—indicating that goethite is dehydrated and transformed into hematite. Samples from the XW profile are different: the 425–450 nm peaks have minimal changes after ignition, while the peak for hematite increases significantly. This difference is likely due to the higher concentration of hematite compared to goethite.

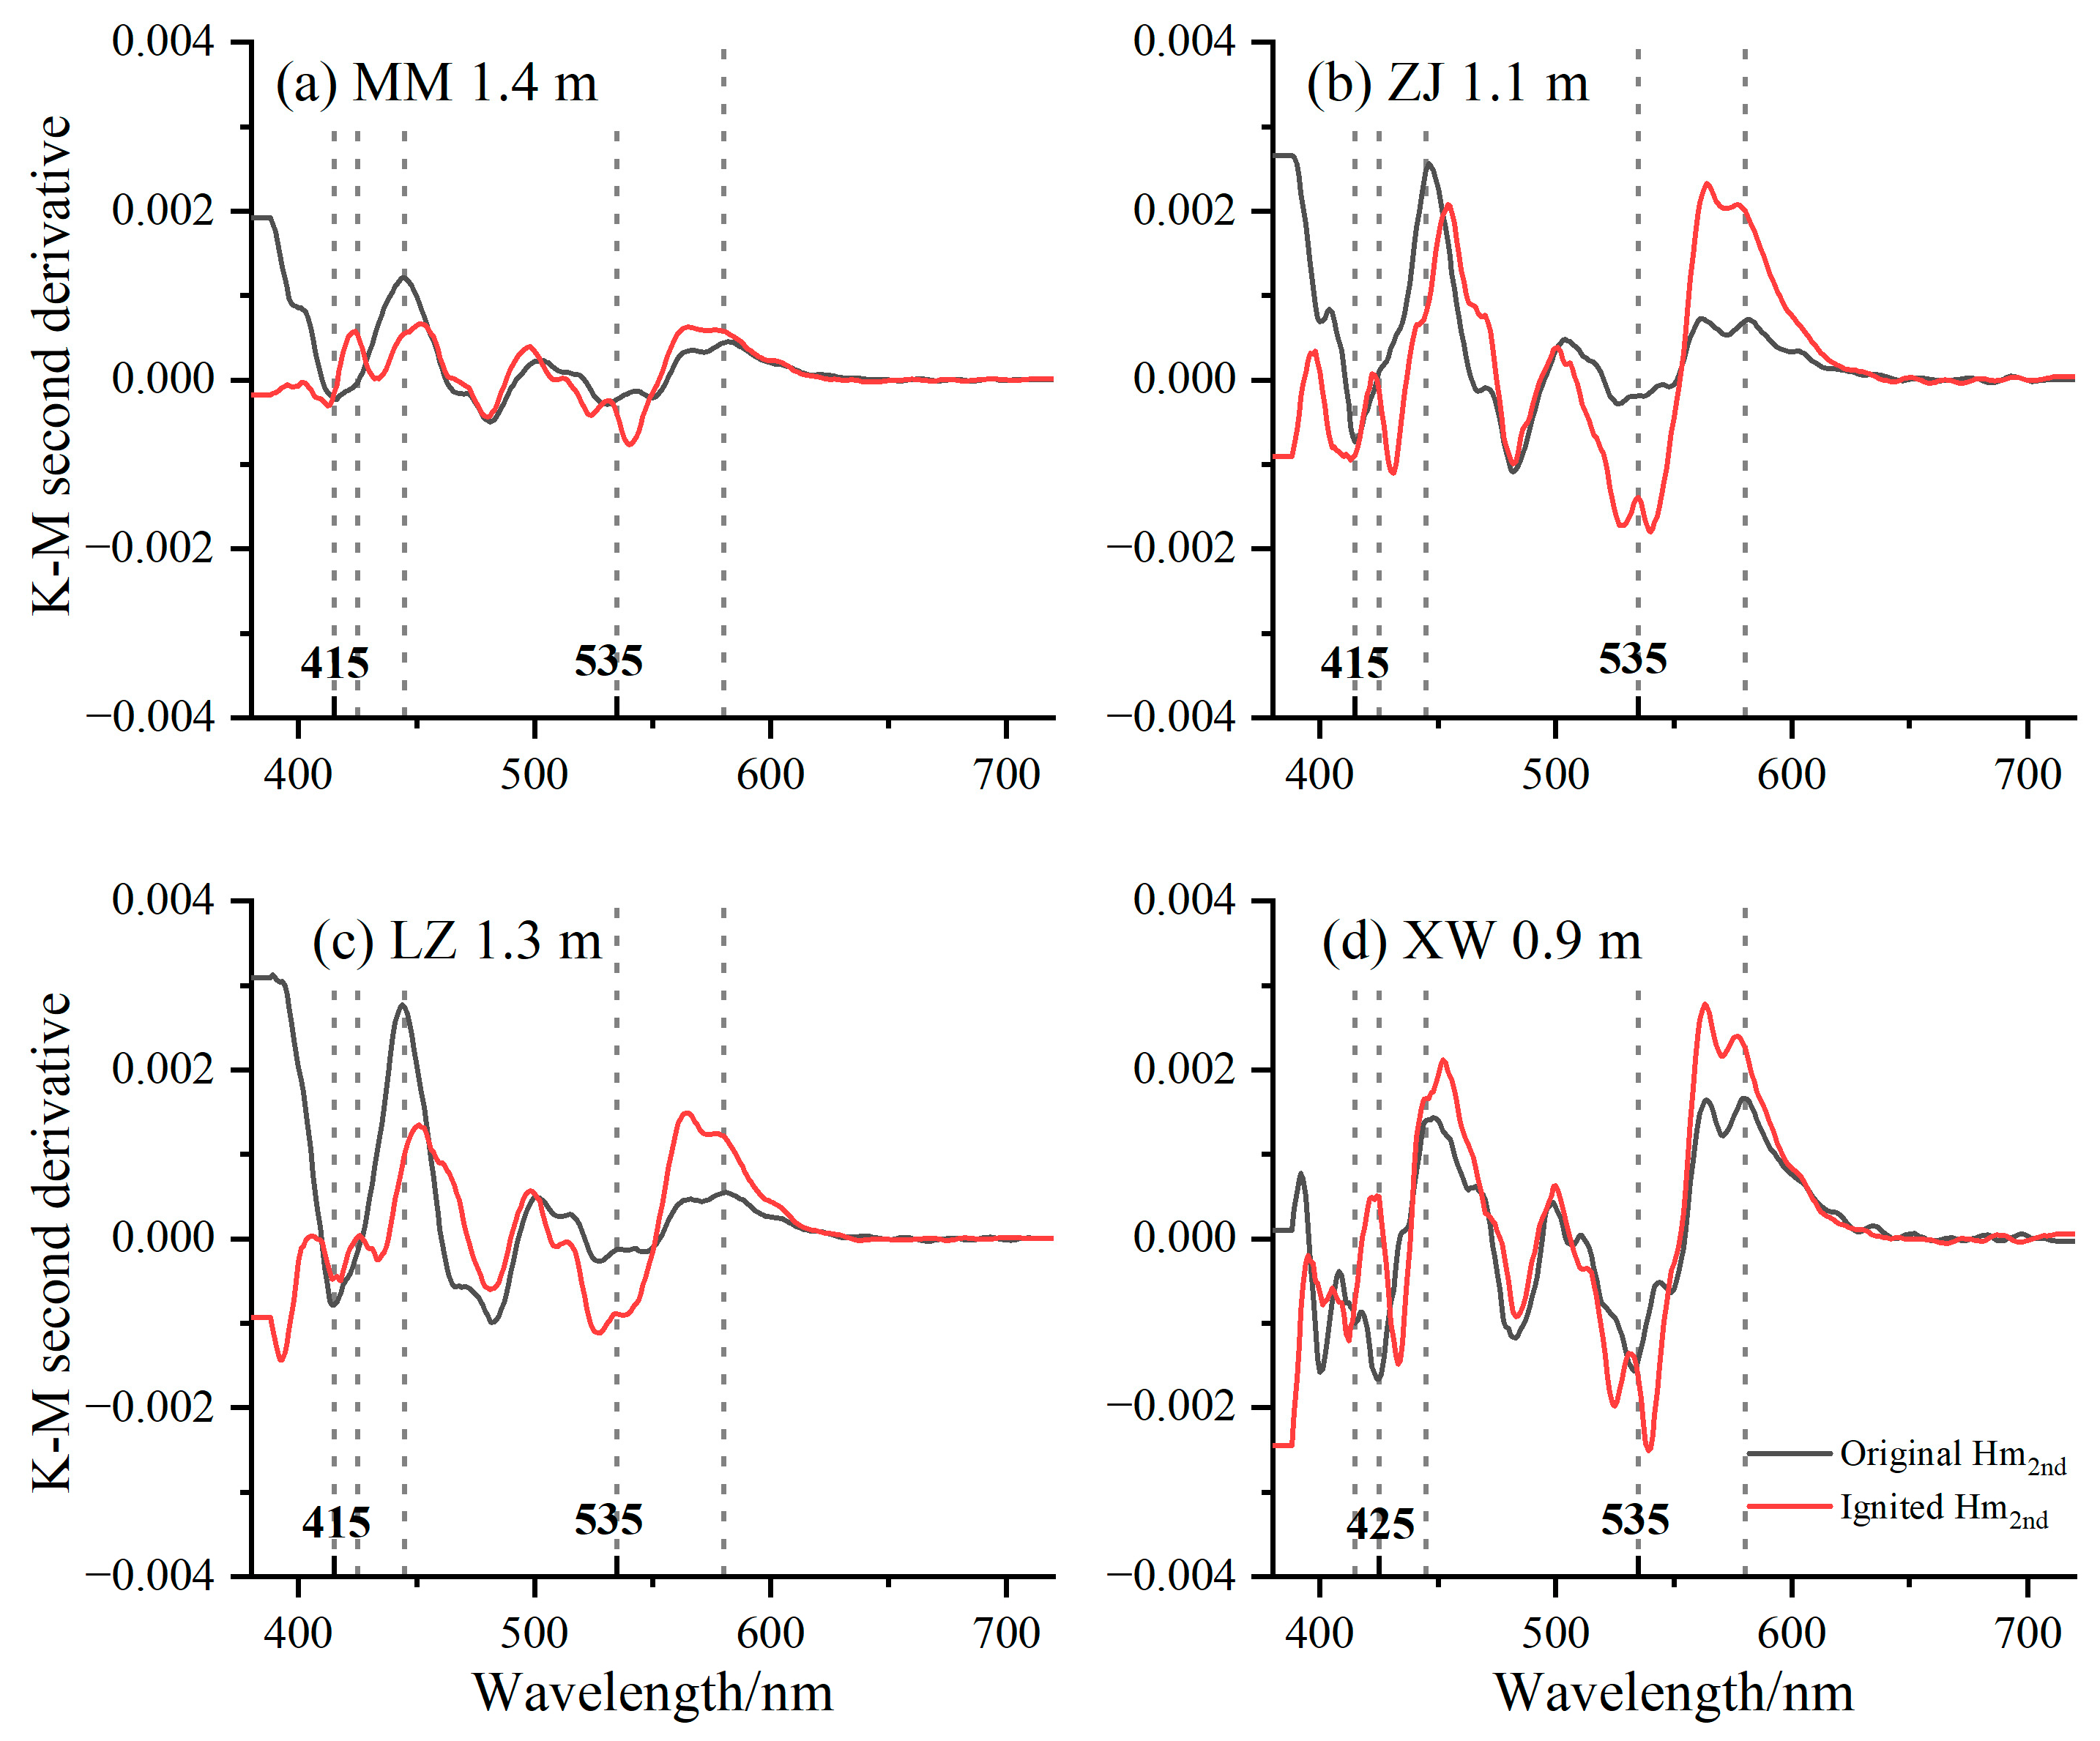
3.2. Characteristics of the Second Derivative of the DRS K-M Remission Functions before and after Ignition at 950 °C

Although the DRS K-M second-derivative curves contain a large amount of information, they are influenced by several external factors. Silva et al. [44] considered the amplitude ratios at 535–580 nm and 415–445 nm to reflect the ratio of hematite to goethite. This approach was intended to avoid matrix composition effects caused by differences in soil composition and degree of weathering. They also identified 425 nm as the minimum for the goethite band (the above bands are labeled in Figure 3). There are differences in the soil matrix, such as mineral composition, content, and Al substitution, between different profiles and even between different layers within the same profile. In calculating Hm2nd, the effect of this factor on the position of the minimum for hematite or goethite of the second derivatives of the DRS K-M remission functions needs to be taken into account, especially in soils with a strong Al substitution in southern China. As a consequence, we used the amplitudes of the 535–590 nm and 405–450 nm peaks in the second derivative curves of the K-M remission functions as proxies for hematite and goethite, respectively.
According to Liu et al. [17], Al substitution causes the characteristic peak of goethite to shift to a shorter wavelength and the characteristic amplitude to decrease. A reference to Figure 3 reveals a small minimum to the left of 535 nm, with the minimum for the characteristic goethite band in the XW profile located at 425 nm, while for the remaining three profiles, it is at 415 nm. This suggests the occurrence of Al substitution.
After heating to 950 °C, the amplitude of the hematite (signed Hm2nd) increased significantly, which indicates an increased hematite content. A reduction in the amplitude of the goethite (signed Gt2nd) suggests a goethite content decrease (Figure 3).

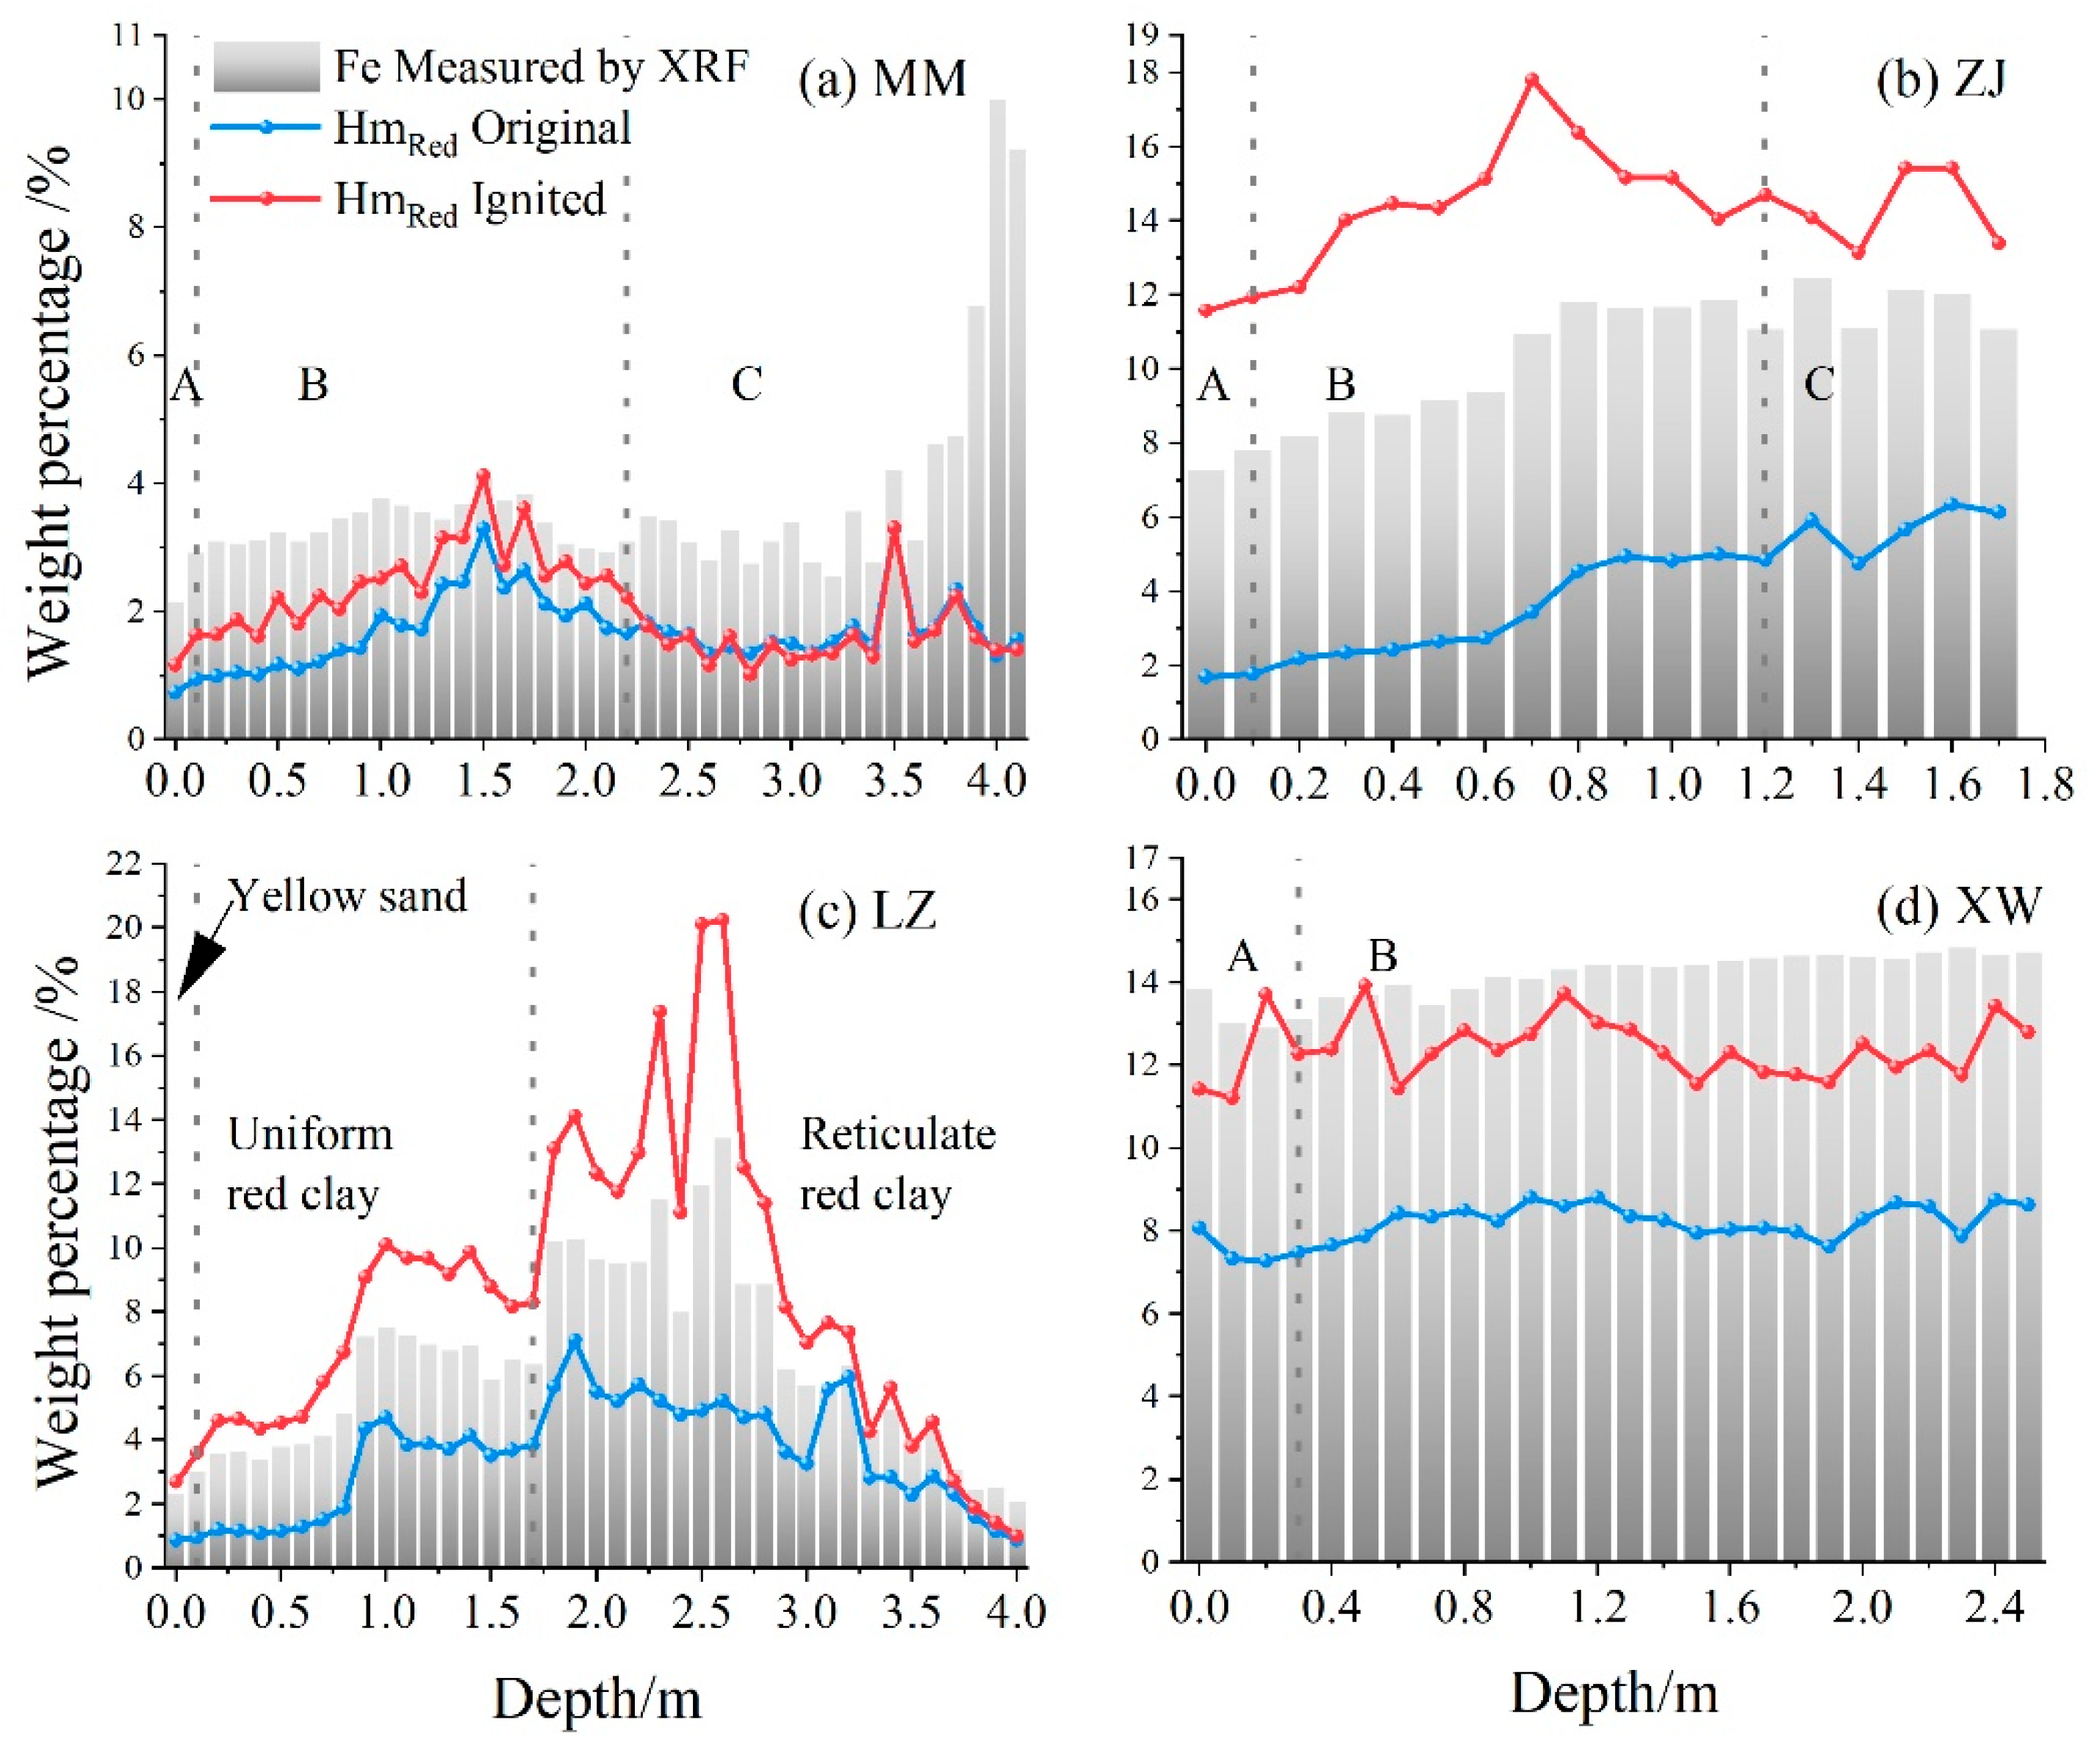
3.3. Comparison of the Hematite Content Estimated by Redness before and after Ignition at 950 °C

To estimate the amount of hematite in the soil before and after ignition, we used the DRS Redness reflectance data and Equation (1) (as shown in Figure 4). The original Fe2O3/% is also shown. The blue curves indicate the hematite content of the unheated soil; the red curves represent the hematite content in the soil after heating at 950 °C; the gray bar charts represent the total iron content in unheated soil (measured using XRF). The iron content remains the same before and after heating. The hematite content being higher than the total iron content indicates that the calculated hematite content is incorrect. To avoid overestimating the hematite content, we corrected the values of HmRed ignited.
HmRed ignited (%) calibrated = [(weight of the heated sample) × (HmRed ignited from DRS and Equation (1))]/(weight of the unheated sample).
Due to the loss of external or structural water during heating, it is not reasonable to directly compare HmRed ignited with HmRed unignited. Experiments showed that high-temperature heating causes the sample to redden and the hematite content to increase. The HmRed ignited for the ZJ and LZ profiles is incorrect (Figure 4).
Soil XW in basaltic regolith had the highest magnetic susceptibility, followed by soil ZJ in fine sandstone regolith, and soil MM in granite regolith had the lowest magnetic susceptibility (Table 4). Ignition resulted in a significant magnetic susceptibility loss, particularly in XW and ZJ.

4. Discussion

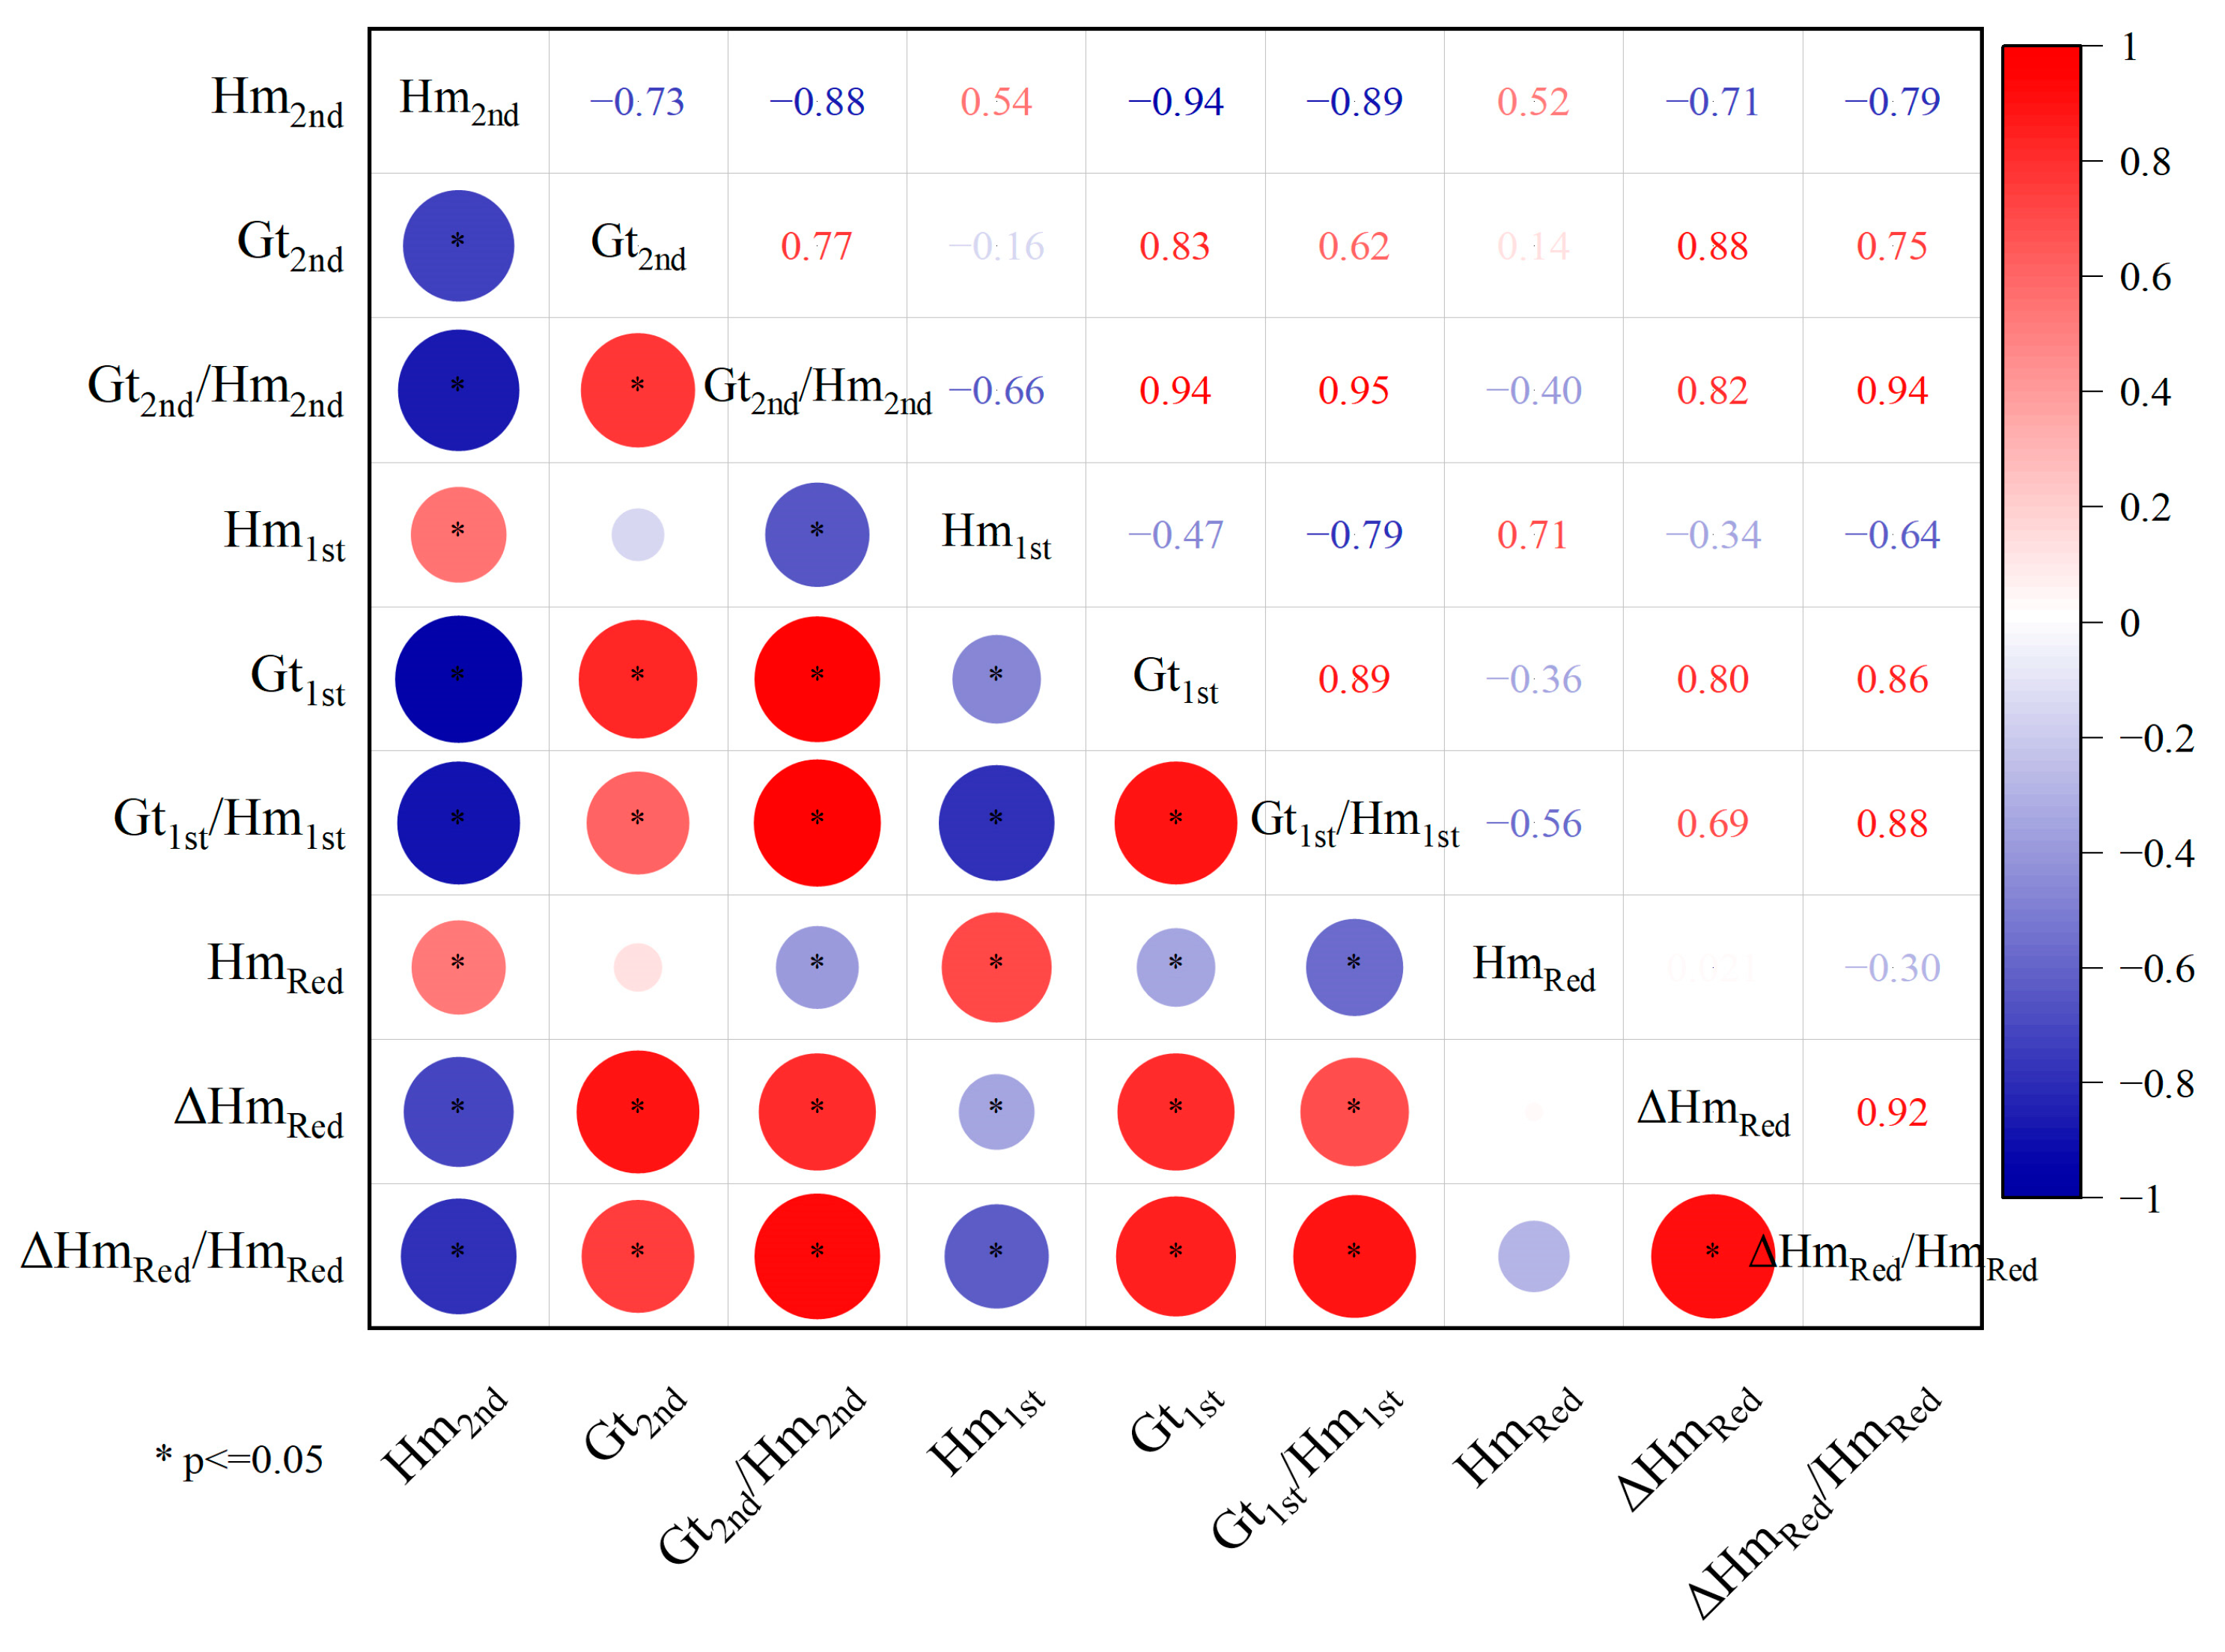
4.1. Relationships between DRS Parameters

A comparison of the colors of the different soil profiles indicates that the XW profile has a stronger red color throughout. This reddish hue is proportional to the hematite content [4]. The hematite content in the XW profile is approximately 8%, which is higher than for the other profiles (Figure 4, blue curves). Additionally, in Figure 2, the peak at 575 nm in the unheated curve of the XW profile which is smaller than in the other profiles indicates that the different soil matrix has a different effect on the first-derivative curve. Therefore, it is inappropriate to directly compare the hematite content of different profiles based on the first-derivative curve peaks. This observation is consistent with the findings of Jiang and Liu [19], and it is mainly the result of variations in parent material and pedogenic environment. Therefore, it is not possible to compare hematite contents based on the first derivative of DRS curves of different soil horizons where significant matrix composition differences occur within the same profile.
A change in the goethite-to-hematite ratio could potentially overcome this limitation. Su et al. [51] applied the Hm1st-to-(Hm1st + Gt1st) ratio to soil profiles developed on granodiorite and basalt. This ratio reflects different soil conditions of two soil profiles within the subtropical zone. Due to the relatively low average annual rainfall and the difference in weathering resistance of the parent rock, the basalt profile had a higher value [51].
Figure 2, Figure 3 and Figure 4 indicate a goethite decrease and a hematite increase after heating. The characteristic goethite peak in Figure 2d changes slightly before and after heating, possibly due to the relatively small amount of goethite in the XW profile compared to hematite. However, the characteristic hematite peak undergoes significant modification. The distinctive χlf decrease of the sample after heating indicates an obvious loss of strong magnetic minerals (Table 4); we infer that maghemite was converted into hematite during heating. Hematite is the terminal product of iron oxide conversion, while ferrihydrite and lepidocrocite are transition products [3]. In marginal tropical climate conditions, there is little or no ferrihydrite in soil profiles. It can, thus, be inferred that XW contains little goethite and even less ferrihydrite.
The second derivative of the K-M curve provides more dependable information which is not accurate hematite content than the first derivative of the original reflectance curve. The hematite amplitude of the second-derivative curve of the K-M remission functions is related to the HmRed value, which is different from the first derivative of the original reflectance curve (Table 5). In the absence of Al substitution, the relative hematite contents of soils with different matrix compositions can be compared.
There is a stronger correlation between Hm1st and HmRed in the MM and XW profiles, whereas there is a stronger correlation between Hm2nd and HmRed in the ZJ and LZ profiles (Figure 5, SI Figures S1 and S2). Unlike the other parameters, HmRed is the only parameter in the correlation analysis that specifies the percentage of hematite content.
We now introduce a new parameter ΔHmRed/HmRed. We observe a positive correlation between Gt2nd/Hm2nd and ΔHmRed/HmRed that was stronger in the MM and LZ profiles. The ZJ profile has a strong correlation between various derivative results and ΔHmRed/Hm Red. However, correlations among the parameters for the XW profile are poor (Figure 6), which can be attributed to a significant degree of Al substitution, which results in larger errors in Hm2nd and Gt2nd. Additionally, there is a stronger correlation between Gt1st/Hm1st and ΔHmRed/HmRed compared to Gt2nd/Hm2nd and ΔHmRed/HmRed. The first-derivative curves of DRS data are more robust [52], and for this reason the first-derivative curve is widely applied in studies of marine and terrestrial sediments [12,41].
In general, correlations among the various parameters for the XW profile are low. It appears that DRS parameters for the XW profile may be influenced by other factors, such as the greater degree of Al substitution. Studies have shown that the aluminum substitution rate for goethite in tropical soils (bauxites and saprolites) is as high as 32% [2,18]. The soil in the XW profile is highly developed, with an Al substitution rate of >8% for hematite. Thus, Hm2nd does not reflect the relative hematite content. Soils developed on basaltic weathering crusts are characterized by less SiO2 and more cation migrations compared to soils developed on granite, as well as being richer in Al and Fe [48]. Additionally, the degree of Al substitution in hematite is directly proportional to the quantity of Al present [17].

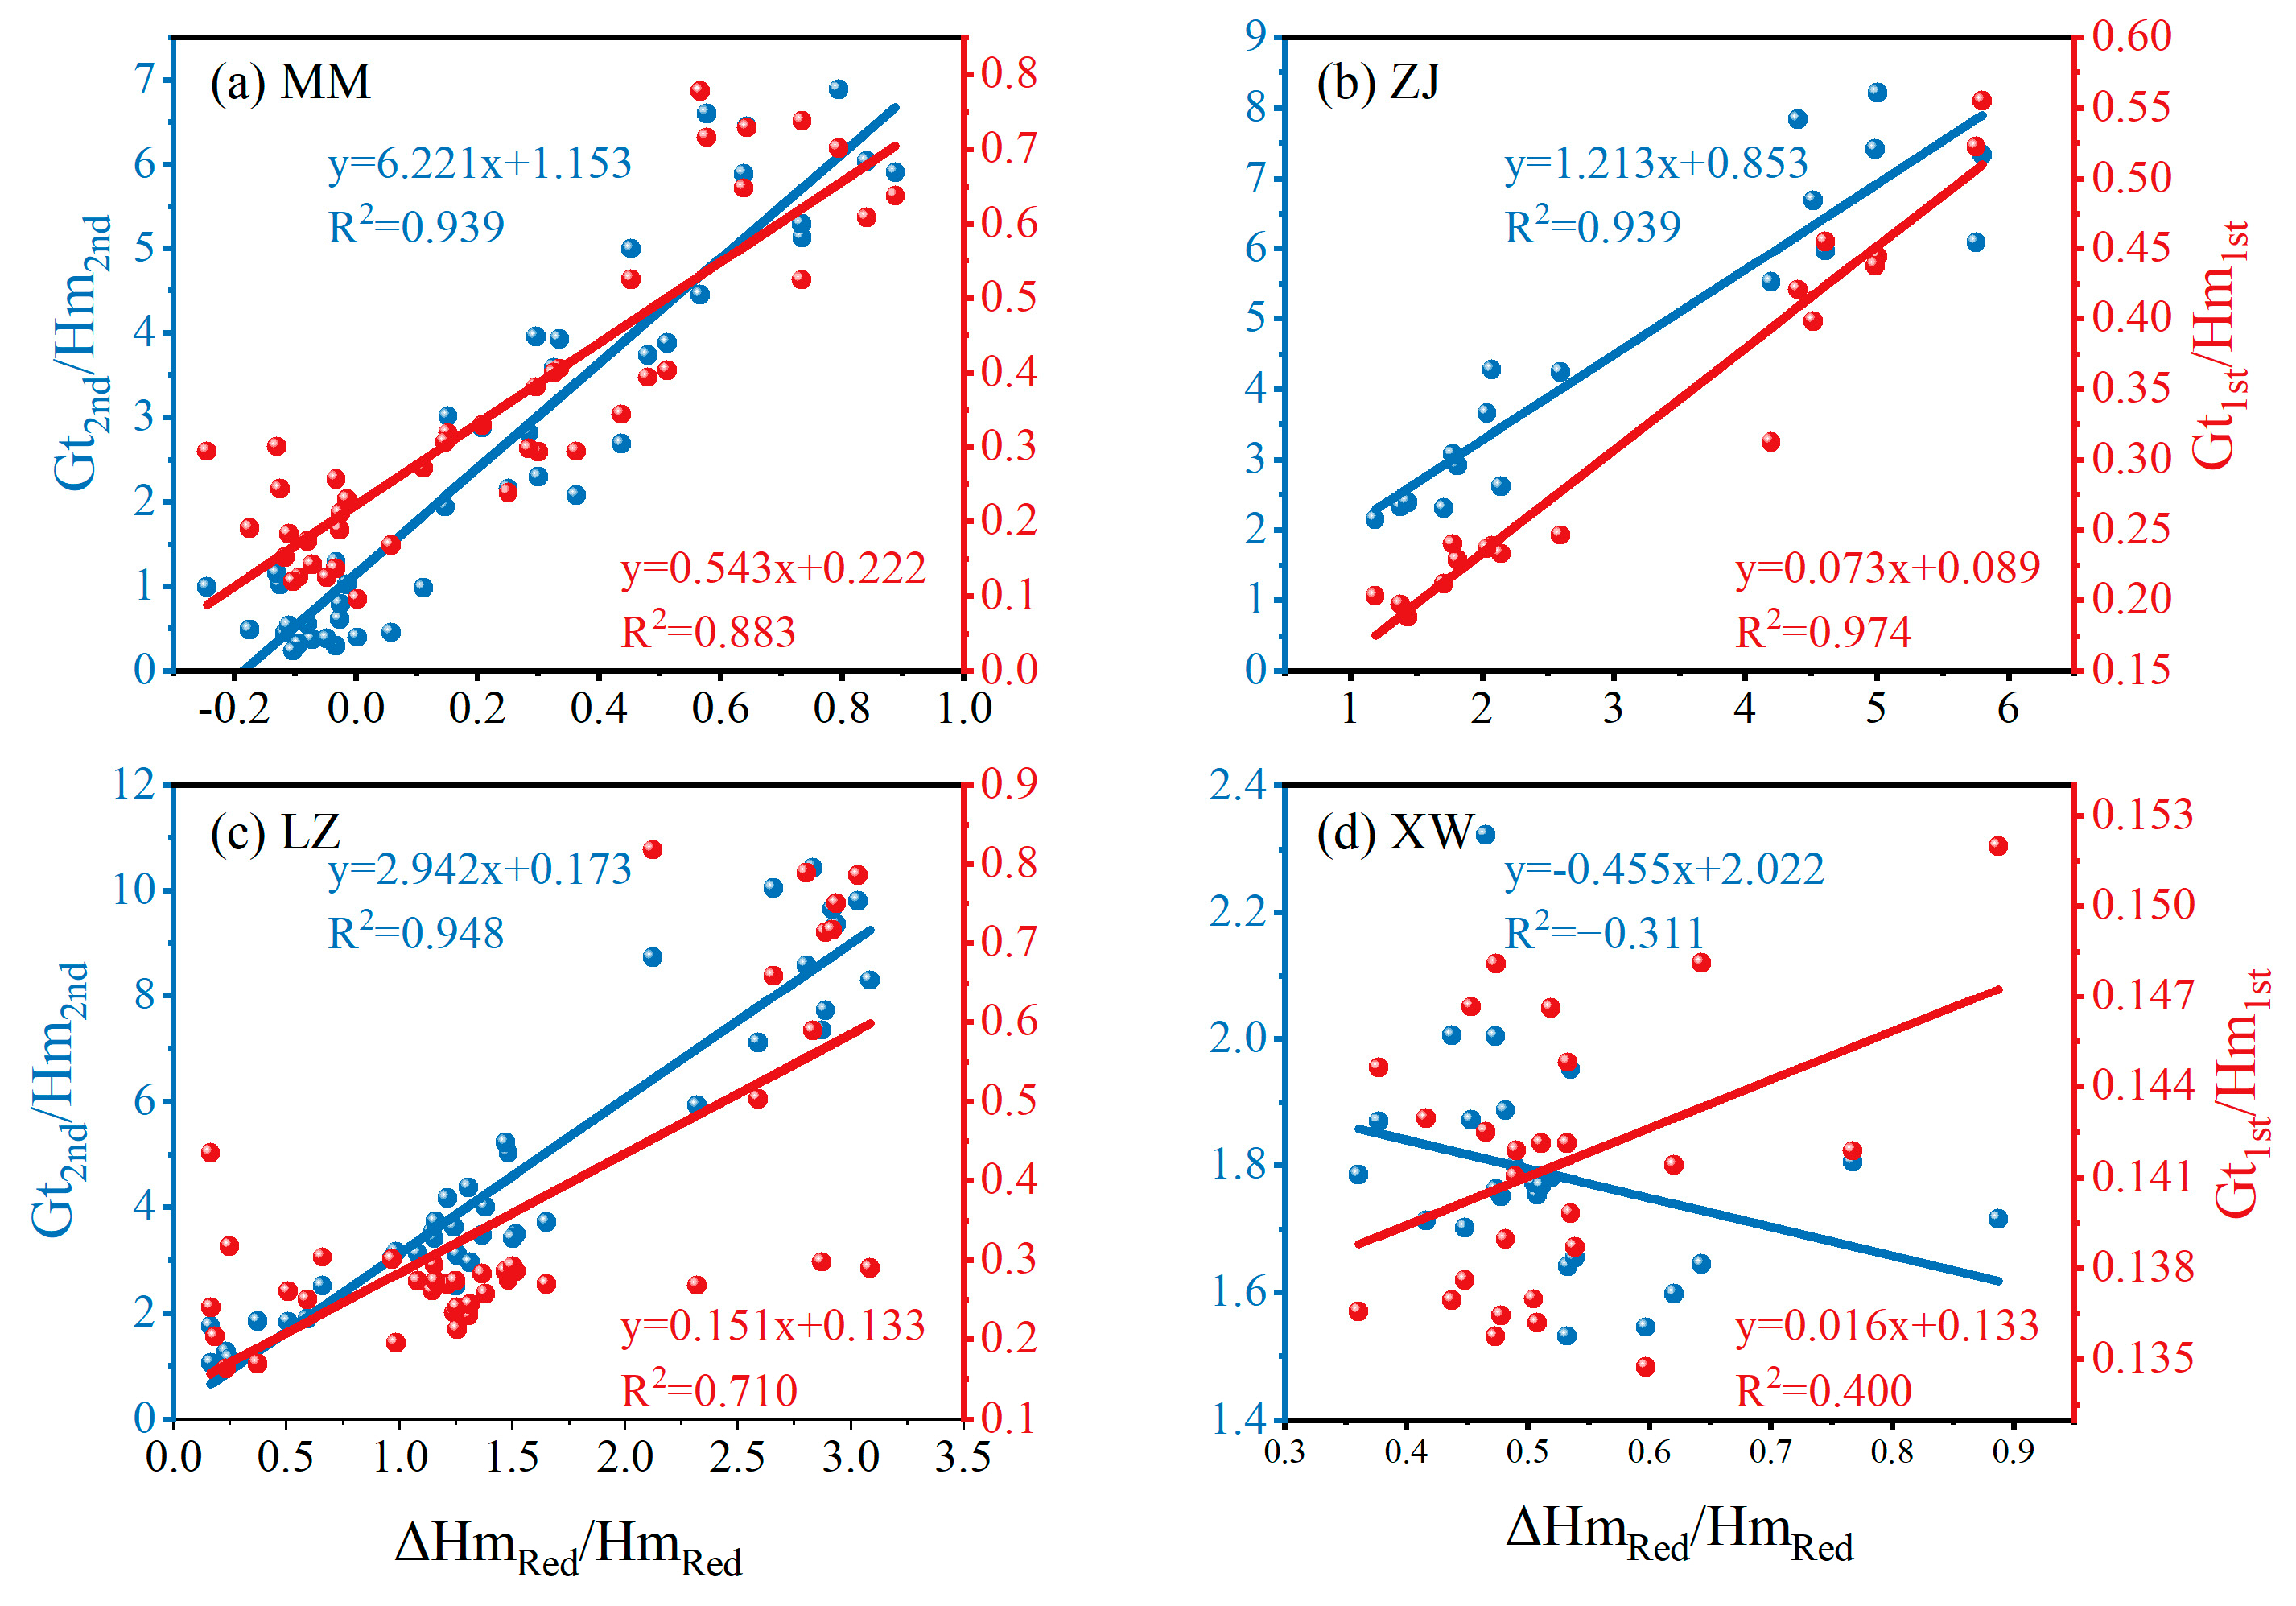
4.2. Applicability of the Various Indices in Soils Developed on Different Parent Materials

The four soil profiles are located within relatively close proximity and have similar topographic and climatic conditions. According to the CIA and Ba Index, all studied profiles experienced strong chemical weathering under a hot and humid climate (Table 5), with the profiles ordered by the degree of weathering as follows: XW > ZJ > LZ > MM. Based on these observations, we now explore the influence of parent material on the hematite content and the hematite quantification method used.
Parent material determines the amount of primary minerals in a soil, and together with any sediments introduced from outside the area, it directly influences the soil Fe content. Soils developed on different parent rock types undergo different weathering processes. For example, red earth soils developed on basalt have significant Fe enrichment, while weathered granite forms silica and alumina-rich weathered crusts [48]. These two factors together generate significant variations in Fe2O3/% within the studied profiles. For example, the XW profile, developed on basalt, has a much higher Fe2O3 content compared to the MM profile, which developed on granite (Figure 2).
The reliability of the quantitative HmRed results is confirmed by the results in Table 5. The average values of the various indices (CIA, Ba Index, Fe2O3/%, Hm2nd, Hm1st) in Table 5 enable the profiles to be grouped in the following order: XW > ZJ > LZ > MM. Next, we analyze the results before and after ignition at 950 °C.
Zou et al. [53] studied the response of natural goethite to heating. They found that natural goethite gradually transformed into hematite at 154.5 °C, and that its acicular morphology became cylindrical at 900 °C. Our soil samples were heated to 950 °C for 5 h, after which goethite transformed completely into hematite. We compared HmRed values for samples before and after heating to obtain the parameter ΔHmRed. These parameters correlate well with the DRS parameters characterizing goethite (Figure 5, SI Figures S1 and S2). Taking the LZ profile as an example, the R2 of the relationship between ΔHmRed and Gt2nd is 0.96, and for the MM profile, R2 = 0.88. However, these parameters are only moderately correlated in the ZJ profile and are poorly correlated in the XW profile, which suggests that the use of DRS K-M remission functions may not be applicable to the XW profile. Furthermore, some amount of maghemite, less magnetite, and a little ferrihydrite were also transformed into hematite. Ferrihydrite is a transition product in the formation of common iron oxides [3], and it exists for a short time, especially in environments such as the XW profile.
If the hematite concentration estimated from HmRed exceeds Fe2O3/%, then this indicates that an unreliable quantification has been obtained. Unheated samples have lower HmRed values than Fe2O3/% (Figure 4), which indicates a significant relationship between the two, thereby testing whether the hematite quantification is incorrect. After heating, HmRed values for the ZJ and LZ profiles were greater than Fe2O3/%, which may be due to the following reasons. First, hematite formation during the goethite transition led to development of a mucilage envelope, resulting in an overestimation of the hematite content based on the redness calibration equations applied to the DRS data. During the hematite formation process in natural environments, goethite dehydration led to the attachment of hematite to other minerals, such as red eolian sand on the coast of South China [54]. Second, Fe in other minerals may also participate in Fe oxide/hydroxide transformations. Third, saturation of the red soil coloration influences quantitative estimates using DRS [44]. Therefore, caution should be exercised when using redness calibration equations to quantify soil hematite contents on sandy parent materials.
The methods used to quantify hematite or the proportion of goethite and hematite under different environmental conditions should be adjusted according to the specific methods used together with environmental factors. Numerous factors influence hematite quantification, including parent material, soil temperature, soil moisture, cation substitution, organic matter, pH, and topography [5]. We selected profiles developed from different parent materials under similar climatic conditions, uniform topography, and good drainage to investigate the influence of soil matrix compositions. In this study, we used samples from the B-horizon, which has a lower organic matter content than the A horizon (Figure 3). The four profiles have similar climates but different soil parent materials (Table 1 and Table 2), which significantly affect the content of hematite, as discussed later.
Previous studies have shown that soils developed from different parent materials can be ordered in terms of their hematite content as follows: basite (basalt) > acidite (granite) > sedimentary rocks (sandstone and limestone) [44,55]. The study of Wiriyakitnateekul et al. [55] on soils developed on granite, basalt, sandstone, and limestone revealed minimal differences in hematite crystal size among the different parent materials, and they found that, on average, hematite particle sizes are larger than those of goethite.
The degree of Al substitution in goethite is influenced by parent material. For example, Singh and Gilkes [45] found that, in terms of the median Al substitution values of goethite, soils developed from different parent materials can be ordered as follows: acidite > basite > alluvial material. Goethite in soils derived from basalt has a lower degree of Al substitution [55]. However, for the hematite derived from different parent materials, the degree of Al substitution has an opposite sequence to that for goethite. Additionally, the degree of Al substitution for hematite was around half of that for goethite [45].
Changes in the goethite-to-hematite ratio in soils and sedimentary sequences have been used for monsoon reconstruction [29,56]. Therefore, changes in the ratio of these two minerals caused by parent material differences cannot be ignored when interpreting results. The goethite/(goethite + hematite) ratio varies in soils developed from different parent materials and can be ordered as follows: acidic rocks > alluvial rocks and basic rocks [45]. The hematite/(goethite + hematite) ratio is equally important.
The HmRed values obtained here are generally consistent with previous results and are consistent with the fundamental principle that parent material influences the hematite distribution within soils. However, it is necessary to reevaluate the K-M second-derivative remission functions of the XW profile and to reconsider the use of HmRed due to Al substitution and redness saturation. Additionally, by reference to Table 5, the Hm1st/(Gt1st + Hm1st) ratio provides more valuable insights than the Hm2nd/(Gt2nd + Hm2nd) see Supplementary Material, although both are influenced by Al substitution.

5. Conclusions

We used various metrics derived from a DRS analysis to quantify the hematite content of four Fe-rich soils on the Leizhou Peninsula, which is on the margin of the tropical region of China, developed under similar climatic conditions but with different soil matrix composition characteristics. Our findings indicate the following: (i) first derivative of DRS curves reflect the presence of goethite and hematite in these soils and enables a comparison of the relative contents of these minerals within the same profile. (ii) Second-derivative curves of the DRS K-M remission functions provide information about the relative proportions of goethite and hematite, as well as about the degree of Al substitution. (iii) Redness calibration equations can provide a reasonable estimate of the hematite content; however, it is important to consider the influence of the mucilage envelope during hematite formation, as well as the development of clay particle envelopes. (iv) We define a new indicator (ΔHmRed/HmRed) which represents the ratio of (ferrihydrite + FeOOH)/hematite and can be used to indicate goethite to hematite ratio in dry soil environments where the ferrihydrite proportion is relatively low. The DRS method and new indicators are not suitable for the quantitative analysis of hematite in weathered sandstone crustal soils or red eolian sand, as secondary hematite in such soils can encapsulate minerals such as quartz, leading to an overestimation of the hematite content. Overall, we show that the combined use of multiple metrics derived from a DRS analysis enables a more accurate quantification of the hematite content, with implications for palaeoclimate studies.

Supplementary Materials

The following supporting information can be downloaded at: https://www.mdpi.com/article/10.3390/min14030242/s1, Figure S1: Correlation charts of relationships between DRS parameters for ZJ profile; Figure S2: Correlation charts of relationships between DRS parameters for LZ profile; Figure S3: Correlation charts of relationships between DRS parameters for XW profile; Table S1: The data used for the correlation analysis in this paper.

Author Contributions

J.L.: performed the experiments and data analysis and wrote the manuscript. B.L.: contributed to the conception of the study and revision of the manuscript. T.C.: contributed to the data analysis. X.L.: participated in field work and experiments. J.T.: helped perform the analysis. H.Y.: helped perform the experiments. All authors have read and agreed to the published version of the manuscript.

Funding

This research was funded by the National Natural Science Foundation of China (Grant No. 42277442; Grant No. 41877435).

Data Availability Statement

The data presented in this study are available in Supplementary Material.

Acknowledgments

The authors thank Jan Bloemendal (University of Liverpool) for providing language help; Andrew P. Roberts (Australian National University) for constructive suggestions and guidance; four anonymous reviewers and editors for their valuable suggestions and effective assistance.

Conflicts of Interest

The author declares no conflict of interest.

References

  1. Barrón, V.; Torrent, J. Evidence for a simple pathway to maghemite in Earth and Mars soils. Geochim. Cosmochim. Acta 2002, 66, 2801–2806. [Google Scholar] [CrossRef]
  2. Cornell, R.M.; Schwertmann, U. The Iron Oxides: Structure, Properties, Reactions, Occurences and Uses; John Wiley & Sons: Hoboken, NJ, USA, 2003. [Google Scholar]
  3. Jiang, Z.; Liu, Q.; Roberts, A.P.; Dekkers, M.J.; Barrón, V.; Torrent, J.; Li, S. The magnetic and color reflectance properties of hematite: From Earth to Mars. Rev. Geophys. 2022, 60, e2020RG000698. [Google Scholar] [CrossRef]
  4. Torrent, J.; Schwertmann, U.; Fechter, H.; Alferez, F. Quantitative relationships between soil color and hematite content. Soil Sci. 1983, 136, 354–358. [Google Scholar] [CrossRef]
  5. Stucki, J.W.; Goodman, B.A.; Schwertmann, U. Iron in Soils and Clay Minerals; Springer: Dordrecht, The Netherlands, 1988. [Google Scholar]
  6. Long, X.; Ji, J.; Balsam, W. Rainfall-dependent transformations of iron oxides in a tropical saprolite transect of Hainan Island, South China: Spectral and magnetic measurements. J. Geophys. Res. Earth Surf. 2011, 116, F03015. [Google Scholar] [CrossRef]
  7. Zhang, Y.G.; Ji, J.; Balsam, W.L.; Liu, L.; Chen, J. High resolution hematite and goethite records from ODP 1143, South China Sea: Co-evolution of monsoonal precipitation and El Niño over the past 600,000 years. Earth Planet. Sci. Lett. 2007, 264, 136–150. [Google Scholar] [CrossRef]
  8. Pan, H.-J.; Yu, P.-S.; Chen, M.-T. A marine sediment component interpretation based on diffuse reflectance spectrophotometry from northern South China Sea sediment core MD972148. Quat. Int. 2014, 333, 20–25. [Google Scholar] [CrossRef]
  9. Ji, J.; Balsam, W.; Chen, J. Mineralogic and climatic interpretations of the Luochuan loess section (China) based on diffuse reflectance spectrophotometry. Quat. Res. 2001, 56, 23–30. [Google Scholar] [CrossRef]
  10. Meng, Y.; Liu, X. Millennial-scale climate oscillations inferred from visible spectroscopy of a sediment core in Qarhan Salt Lake of Qaidam Basin between 40 and 10 cal ka BP. Quat. Int. 2018, 464, 336–342. [Google Scholar] [CrossRef]
  11. Lepre, C.J.; Olsen, P.E. Hematite reconstruction of Late Triassic hydroclimate over the Colorado Plateau. Proc. Natl. Acad. Sci. USA 2021, 118, e2004343118. [Google Scholar] [CrossRef] [PubMed]
  12. Zan, J.; Maher, B.A.; Yamazaki, T.; Fang, X.; Han, W.; Kang, J.; Hu, Z. Mid-Pleistocene links between Asian dust, Tibetan glaciers, and Pacific iron fertilization. Proc. Natl. Acad. Sci. USA 2023, 120, e2304773120. [Google Scholar] [CrossRef] [PubMed]
  13. Roberts, A.P.; Zhao, X.; Heslop, D.; Abrajevitch, A.; Chen, Y.-H.; Hu, P.; Jiang, Z.; Liu, Q.; Pillans, B.J. Hematite (α-Fe2O3) quantification in sedimentary magnetism: Limitations of existing proxies and ways forward. Geosci. Lett. 2020, 7, 8. [Google Scholar] [CrossRef]
  14. Scheinost, A.C.; Chavernas, A.; Barron, V.; Torrent, J. Use and limitations of second-derivative diffuse reflectance spectroscopy in the visible to near-infrared range to identify and quantify Fe oxide minerals in soils. Clays Clay Miner. 1998, 46, 528–536. [Google Scholar] [CrossRef]
  15. Deaton, B.C.; Balsam, W.L. Visible spectroscopy—A rapid method for determining hematite and goethite concentration in geological materials. J. Sediment. Res. 1991, 61, 628–632. [Google Scholar] [CrossRef]
  16. Cao, W.; Jiang, Z.; Gai, C.; Barrón, V.; Torrent, J.; Zhong, Y.; Liu, Q. Re-Visiting the Quantification of Hematite by Diffuse Reflectance Spectroscopy. Minerals 2022, 12, 872. [Google Scholar] [CrossRef]
  17. Liu, Q.S.; Torrent, J.; Barrón, V.; Duan, Z.Q.; Bloemendal, J. Quantification of hematite from the visible diffuse reflectance spectrum: Effects of aluminium substitution and grain morphology. Clay Miner. 2011, 46, 137–147. [Google Scholar] [CrossRef]
  18. Hu, P.; Jiang, Z.; Liu, Q.; Heslop, D.; Roberts, A.P.; Torrent, J.; Barrón, V. Estimating the concentration of aluminum-substituted hematite and goethite using diffuse reflectance spectrometry and rock magnetism: Feasibility and limitations. J. Geophys. Res. Solid Earth 2016, 121, 4180–4194. [Google Scholar] [CrossRef]
  19. Jiang, Z.; Liu, Q. Quantification of hematite and its climatic significances. Quat. Sci. 2016, 36, 676–689. [Google Scholar]
  20. Torrent, J.; Barrón, V. The visible diffuse reflectance spectrum in relation to the color and crystal properties of hematite. Clays Clay Miner. 2003, 51, 309–317. [Google Scholar] [CrossRef]
  21. Ji, J.; Chen, J.; Balsam, W.; Liu, L.; Chen, Y.; Zhao, L.; Zhou, W. Quantitative analysis of hematite and goethite in the Chines loess-paleosol sequences and its implication for dry and humid variability. Quat. Sci. 2007, 27, 221–229. [Google Scholar]
  22. Smith, M.J.; Stevens, T.; MacArthur, A.; Malthus, T.J.; Lu, H. Characterising Chinese loess stratigraphy and past monsoon variation using field spectroscopy. Quat. Int. 2011, 234, 146–158. [Google Scholar] [CrossRef]
  23. Meng, X.; Li, G.K.; Long, X.; Li, S.; Ji, J. Quantifying soil goethite/hematite ratios: A new method based on diffuse reflectance spectra. Geophys. Res. Lett. 2023, 50, e2022GL102280. [Google Scholar] [CrossRef]
  24. Liu, Q.; Roberts, A.P.; Torrent, J.; Horng, C.-S.; Larrasoaña, J.C. What do the HIRM and S-ratio really measure in environmental magnetism? Geochem. Geophys. Geosyst. 2007, 8, Q09011. [Google Scholar] [CrossRef]
  25. Hao, Q.; Oldfield, F.; Bloemendal, J.; Torrent, J.; Guo, Z. The record of changing hematite and goethite accumulation over the past 22 Myr on the Chinese Loess Plateau from magnetic measurements and diffuse reflectance spectroscopy. J. Geophys. Res. Solid Earth 2009, 114, B12101. [Google Scholar] [CrossRef]
  26. Hu, P.; Liu, Q.; Torrent, J.; Barrón, V.; Jin, C. Characterizing and quantifying iron oxides in Chinese loess/paleosols: Implications for pedogenesis. Earth Planet. Sci. Lett. 2013, 369–370, 271–283. [Google Scholar] [CrossRef]
  27. Szeberényi, J.; Kovács, J.; Bradák, B.; Barta, G.; Csonka, D.; Medveďová, A.; Roštínský, P.; Kiss, K.; Varga, G. Experiencing new perspectives in the application of reflectance spectroscopy in loess research. Quat. Int. 2020, 552, 36–49. [Google Scholar] [CrossRef]
  28. Torrent, J.; Barrón, V.; Liu, Q. Magnetic enhancement is linked to and precedes hematite formation in aerobic soil. Geophys. Res. Lett. 2006, 33, L02401. [Google Scholar] [CrossRef]
  29. Zhao, L.; Hong, H.; Fang, Q.; Yin, K.; Wang, C.; Li, Z.; Torrent, J.; Cheng, F.; Algeo, T.J. Monsoonal climate evolution in southern China since 1.2 Ma: New constraints from Fe-oxide records in red earth sediments from the Shengli section, Chengdu Basin. Palaeogeogr. Palaeoclimatol. Palaeoecol. 2017, 473, 1–15. [Google Scholar] [CrossRef]
  30. Zhao, L.; Hong, H.; Fang, Q.; Algeo, T.J.; Wang, C.; Li, M.; Yin, K. Potential of VNIR spectroscopy for prediction of clay mineralogy and magnetic properties, and its paleoclimatic application to two contrasting Quaternary soil deposits. Catena 2020, 184, 104239. [Google Scholar] [CrossRef]
  31. Liu, C.; Dupont-Nivet, G.; Wang, W.; Deng, C. Magnetic response to pedogenesis in aerobic soils of different weathering degree. Palaeogeogr. Palaeoclimatol. Palaeoecol. 2021, 567, 110240. [Google Scholar] [CrossRef]
  32. Liu, C.; Qin, H.; Ferré, E.C.; Wang, W.; He, K.; Deng, C. Importance of hematite self-reversal in Al-rich soils magnetostratigraphy: Revisiting the Damei red soil sequence in the Bose basin, Southern China. J. Geophys. Res. Solid Earth 2022, 127, e2021JB023165. [Google Scholar] [CrossRef]
  33. Guo, S.; Cai, Y.; Ren, J.; Guan, Y.; Xin, D.; Long, X. Formation and migration of magnetic particles associated with iron oxide transformation at a hillslope scale. Catena 2021, 197, 104944. [Google Scholar] [CrossRef]
  34. Lü, B.; Liu, X. Magnetic properties of latosols from Zhangpu County, Fujian Province and their environmental significance. J. Earth Environ. 2021, 12, 19–31. [Google Scholar]
  35. Tang, J.; Lü, B.; Liu, X.; Du, J.; Chen, T.; Li, J. Chromaticity characteristics of soil profiles in the coastal areas of Fujian and Guangdong, southern China and their climatic significance. Quat. Int. 2023, 649, 38–45. [Google Scholar] [CrossRef]
  36. Zhu, M.; Lü, B.; Guo, Y. Comparison of hematite and goethite contents in aeolian deposits in different climate zones based on diffuse reflectance spectroscopy and chromaticity methods. Spectrosc. Spect. Anal. 2022, 42, 1684–1690. [Google Scholar]
  37. Hu, X.-F.; Du, Y.; Liu, X.-J.; Zhang, G.-L.; Jiang, Y.; Xue, Y. Polypedogenic case of loess overlying red clay as a response to the Last Glacial–Interglacial cycle in mid-subtropical Southeast China. Aeolian Res. 2015, 16, 125–142. [Google Scholar] [CrossRef]
  38. Lu, J.; Long, X.; Li, X.; Ji, J.; Qiang, X.; Song, Y. Topography-dependent formation and transformation of lithogenic and pedogenic iron oxides on a volcano under a tropical monsoon climate. Catena 2022, 217, 106521. [Google Scholar] [CrossRef]
  39. Hyland, E.; Sheldon, N.; Van Der Voo, R.; Badgley, C.; Abrajevitch, A. A new paleoprecipitation proxy based on soil magnetic properties: Implications for expanding paleoclimate reconstructions. GSA Bull. 2015, 127, 975–981. [Google Scholar] [CrossRef]
  40. Maxbauer, D.P.; Feinberg, J.M.; Fox, D.L. Magnetic mineral assemblages in soils and paleosols as the basis for paleoprecipitation proxies: A review of magnetic methods and challenges. Earth Sci. Rev. 2016, 155, 28–48. [Google Scholar] [CrossRef]
  41. Barranco, F.T.; Balsam, W.L.; Deaton, B.C. Quantitative reassessment of brick red lutites: Evidence from reflectance spectrophotometry. Mar. Geol. 1989, 89, 299–314. [Google Scholar] [CrossRef]
  42. Canton, L.C.; Souza Júnior, I.G.; Silva, L.S.; Marques Júnior, J.; Costa, A.C.S. Identification and quantification of iron oxides by diffuse reflectance spectroscopy with Praying Mantis accessory and integration sphere. Catena 2021, 196, 104899. [Google Scholar] [CrossRef]
  43. Schwertmann, U. Occurrence and formation of iron oxides in various pedoenvironments. In Iron in Soils and Clay Minerals; Stucki, J.W., Goodman, B., Schwertmann, U., Eds.; Springer: Dordrecht, The Netherlands, 1988; pp. 267–308. [Google Scholar]
  44. Silva, L.S.; Marques Júnior, J.; Barrón, V.; Gomes, R.P.; Bortoli Teixeira, D.; Siqueira, D.S.; Vasconcelos, V. Spatial variability of iron oxides in soils from Brazilian sandstone and basalt. Catena 2020, 185, 104258. [Google Scholar] [CrossRef]
  45. Singh, B.; Gilkes, R.J. Properties and distribution of iron oxides and their association with minor elements in the soils of south-western Australia. J. Soil Sci. 1992, 43, 77–98. [Google Scholar] [CrossRef]
  46. Jiang, Z.; Liu, Q.; Colombo, C.; Barrón, V.; Torrent, J.; Hu, P. Quantification of Al-goethite from diffuse reflectance spectroscopy and magnetic methods. Geophys. J. Int. 2014, 196, 131–144. [Google Scholar] [CrossRef]
  47. Wang, M.; Lu, H. Age, geochemical composition and their paleoclimatic implications of the basalt in Leizhou Peninsula, Southern China. Quat. Sci. 2019, 39, 1071–1082. [Google Scholar]
  48. Zhu, H.J.; Chen, J.F.; Chen, S.L. Soli Geography; Higher Education Press: Beijing, China, 2019. [Google Scholar]
  49. Nesbitt, H.W.; Young, G.W. Early Proterozoic climates and plate motions inferred from major element chemistry of lutites. Nature 1982, 299, 715–717. [Google Scholar] [CrossRef]
  50. Fu, H.-J.; Jian, X.; Liang, H.-H. Research progress of sediment indicators and methods for evaluation of silicate chemical weathering intensity. J. Palaeogeogr. 2021, 23, 1192–1209. [Google Scholar]
  51. Su, N.; Yang, S.-Y.; Wang, X.-D.; Bi, L.; Yang, C.F. Magnetic parameters indicate the intensity of chemical weathering developed on igneous rocks in China. Catena 2015, 133, 328–341. [Google Scholar] [CrossRef]
  52. Bou-Orm, N.; AlRomaithi, A.A.; Elrmeithi, M.; Ali, F.M.; Nazzal, Y.; Howari, F.M.; Al Aydaroos, F.A. Advantages of first-derivative reflectance spectroscopy in the VNIR-SWIR for the quantification of olivine and hematite. Planet. Space Sci. 2020, 188, 104957. [Google Scholar] [CrossRef]
  53. Zou, X.; Chen, T.; Zhang, P.; Chen, D.; Liu, H.; Qing, C. Structural characteristic of natural goethite by thermal treatment. J. Chin. Ceram. Soc. 2013, 41, 1442–1446. [Google Scholar]
  54. Yu, M.; Wang, X. A discussion on color change mechanism of red aeolian sand in Pingtan Island, Fujian Province. J. Subtrop. Resour. Environ. 2018, 13, 1–8. [Google Scholar]
  55. Wiriyakitnateekul, W.; Suddhiprakarn, A.; Kheoruenromne, I.; Smirk, M.N.; Gilkes, R.J. Iron oxides in tropical soils on various parent materials. Clay Miner. 2007, 42, 437–451. [Google Scholar] [CrossRef]
  56. Hao, Q.; Guo, Z. Quantitative measurements on the paleo-weathering intensity of the loess-soil sequences and implication on paleomonsoon. Sci. China Ser. D Earth Sci. 2001, 44, 566–576. [Google Scholar] [CrossRef]
Figure 1. Location of the study area within Guangdong Province, China, and locations of sampled soil profiles.
Minerals 14 00242 g001
Figure 2. First derivative curves of soil samples (a) MM 1.4 m, (b) ZJ 1.1 m, (c) LZ 1.3 m, and (d) XW 0.9 m. Black/red curves are the results before/after ignition at 950 °C.
Minerals 14 00242 g002
Figure 3. Second-derivative curves of K-M functions for samples (a) MM 1.4 m, (b) ZJ 1.1 m, (c) LZ 1.3 m, and (d) XW 0.9 m before (black curves) and after ignition at 950 °C (red curves). Dashed lines correspond to 415 nm, 425 nm, 445 nm, 535 nm, and 580 nm.
Minerals 14 00242 g003
Figure 4. HmRed curves before and after ignition and the original Fe2O3/%. Soil genetic horizons (A, B, C) are divided by the gray dashed lines.
Minerals 14 00242 g004
Figure 5. Correlation charts of relationships between DRS parameters for MM soil profiles. Please refer to Table 3.
Minerals 14 00242 g005
Figure 6. Scatterplots of DRS parameters for soil profiles (a) MM, (b) ZJ, (c) LZ, and (d) XW. Linear regression lines are included.
Minerals 14 00242 g006
Table 1. Soil profile characteristics.
ProfileHorizonDepth/mMunsell Color ChartQuartz ParticlesTexture
MMA0–0.17.5YR4/6Fine, FewerLoose
B0.1–2.22.5YR4/8Coarse, AbundantSticky
C2.3–4.15R5/6Coarse, AbundantSticky
ZJA0–0.15YR3/3FewerLoose
B0.1–1.25YR4/6FewerSticky
C1.3–1.72.5YR4/8FewerSticky
LZYellow Sand0–0.110YR6/8FewerLoose
Uniform Red Clay0.1–1.72.5YR4/8FewerSticky
Reticulate Red Clay1.7–42.5YR5/8; 2.5YR8/4FewerSticky (1.7–3.2 m)
Loose (3.2–4 m)
XWA0–0.35YR3/4FewerSticky
B0.3–2.52.5YR3/4FewerSticky
Table 2. Information about the studied soil profiles.
ProfileLatitude/°Longitude/°Parent MaterialAltitude/mThickness/mMAT/°CMAP/mm
MM21.540110.929Granite34.74.123.51762.2
ZJ21.208110.287Fine sandstone43.81.723.51731.4
LZ20.948110.091Unconsolidated sediment43.04.023.21623.9
XW20.409110.139Basalt75.22.523.81428.4
MAT is the mean annual temperature, and MAP is the mean annual precipitation.
Table 3. List of abbreviations.
ParametersAbbreviation
Peak height of the first-order derivative curve at 575 nmHm1st
Peak height of the first-order derivative curve at 435 nmGt1st
Amplitude of the second-order derivative curve of the Kubelka–Munk remission functions at wavelengths of 535–590 nmHm2nd
Amplitude of the second-order derivative curves of the Kubelka–Munk remission functions at wavelengths of 405–450 nmGt2nd
Percentage of red band (630–700 nm) in the visible light band (400–700 nm)Redness
Hematite content determined using calibration Equation (1)HmRed
Weight percentage of Fe2O3 measured using X-ray fluorescence (XRF) relative to the total Fe contentFe2O3/%
Hematite content indicated by the HmRed difference value before and after ignitionΔHmRed
Table 4. Mean low-frequency magnetic susceptibility of different soil layers before and after heating (unit: 10−8 m3/kg).
ProfileMMZJLZXW
HorizonABCABCYellow sandUniform red clayReticulate red clayAB
Original χ12.3013.827.64175.60178.12150.0018.3021.567.55880.67549.23
Ignited χ−0.540.081.893.685.976.26−1.070.763.6512.1612.91
χ in Table 4 is the average value for each horizon. All of the original samples were measured. A fraction of the heated sample was selected for measurement. Odd numbered samples from ZJ and XW were measured, considering the lower χ of MM and LZ; 1/3 of samples were measured.
Table 5. Average values of DRS and geochemical parameters for the studied soil profiles.
ProfileCIABa IndexFe2O3/%Hm2ndHm1stHmRedHm2nd/(Gt2nd + Hm2nd)Hm1st/(Hm1st + Gt1st)
MM88.3180.9173.7140.000710.3801.7020.4000.756
LZ86.3820.1216.2850.000790.4003.4380.2270.748
ZJ90.1300.07610.4110.000840.3004.0100.2010.763
XW97.5520.02114.1680.002820.2638.1720.3600.876
Disclaimer/Publisher’s Note: The statements, opinions and data contained in all publications are solely those of the individual author(s) and contributor(s) and not of MDPI and/or the editor(s). MDPI and/or the editor(s) disclaim responsibility for any injury to people or property resulting from any ideas, methods, instructions or products referred to in the content.

