Article

Trace Silicon Determination in Biological Samples by Inductively Coupled Plasma Mass Spectrometry (ICP-MS): Insight into the Volatility of Silicon Species in Hydrofluoric Acid Digests for Optimal Sample Preparation and Introduction to ICP-MS

U.S. Geological Survey, Denver Federal Center, Denver, CO 80225, USA
*
Author to whom correspondence should be addressed.
Minerals 2024, 14(3), 299; https://doi.org/10.3390/min14030299
Submission received: 9 January 2024 / Revised: 8 March 2024 / Accepted: 11 March 2024 / Published: 12 March 2024
(This article belongs to the Special Issue Mineralogic Analysis of Respirable Dust)

Abstract

:
A method for the determination of trace levels of silicon from biological materials by inductively coupled plasma mass spectrometry (ICP-MS) has been developed. The volatility of water-soluble silicon species, hexafluorosilicic acid (H2SiF6), and sodium metasilicate (Na2SiO3) was investigated by evaporating respective solutions (50 µg/mL silicon) in nitric acid (HNO3), nitric acid + hydrochloric acid (HNO3 + HCl), and nitric acid + hydrochloric acid + hydrofluoric acid (HNO3 + HCl + HF) at 120 °C on a hot-block to near dryness. The loss of silicon from H2SiF6 solutions was substantial (>99%) regardless of the digestion medium. Losses were also substantial (>98%) for metasilicate solutions heated in HNO3 + HCl + HF, while no significant loss occurred in HNO3 or HNO3 + HCl. These results show that H2SiF6 species were highly volatile and potential losses could confound accuracy at trace level determinations by ICP-MS if digestates prepared in HF are heated to eliminate HF. Among the various matrices comprising major elements, sodium appeared to be effective in reducing silicon loss from H2SiF6 solutions. Excess sodium chloride (NaCl) matrix provided better stability, improving silicon recoveries by up to about 80% in evaporated HF digestates of soil and mine waste samples, but losses could not be fully prevented. To safely remove excess acids and circumvent the adverse effects of excess HF (e.g., risk of high Si background signals), a two-step digestion scheme was adopted for the preparation of biological samples containing trace silicon levels. A closed-vessel digestion was performed either in 4 mL of concentrated HNO3 and 1 mL of concentrated HCl or 4 mL of concentrated HNO3, 1 mL of concentrated HCl and 1 mL of concentrated HClO4 on a hot plate at 140 °C. Digestates were then evaporated to incipient dryness at 120 °C to remove the acids. A second closed-vessel digestion was carried out to dissolve silicates in 0.5 mL of concentrated HNO3 and 0.5 mL of concentrated HF at 130 °C. After digestion, digestates were diluted to 10 mL. The solution containing about 5% HNO3 and 5% HF was directly analyzed by ICP-MS equipped with an HF-inert sample introduction system. The limit of detection was about 110 µg/L for 28Si when using the Kinetic Energy Discrimination (KED) mode. The method was used to determine silicon in various plant and tissue certified reference materials. Data were acquired for 28Si using KED and standard (STD) modes, and 74Ge and 103Rh as internal standard elements. There was not any significant difference between the accuracy and precision of the results obtained with 74Ge and 103Rh within the same measurement mode. Precision, calculated as relative standard deviation for four replicate analyses, varied from 5.3 (tomato leaves) to 21% (peach leaves) for plant and from 2.2 (oyster tissue) to 33% (bovine liver) for tissue SRM/CRMs. Poor precision was attributed to material heterogeneity and the large particle size distribution. An analysis of lung tissue samples from those with occupational exposure to silica dust revealed that tissues possessed substantial levels of water-soluble silicates, but the most silicon was present in the particulate matter fraction.

Graphical Abstract

1. Introduction

Silicon (Si) is a ubiquitous element that represents a major fraction of the Earths’ crust, mostly in the form of various silicate minerals [1]. It is an essential element to all biological systems [1,2,3,4,5,6]. Water-soluble forms of Si are referred to as silicic acid and include ortho (mono), meta, di, and tri-silicates, which are present in natural waters. Orthosilicic acid (H4SiO4) is the smallest unit that is bioavailable to living organisms owing to its small molecular size and lack of charge. Silicon is required for normal cell growth in diatoms, corals, and some sponges. It enhances nutrient availability in soils for root uptake, and reduces biotic and abiotic stresses in many plant species [2,3,4]. In humans, Si plays an important role in bone formation, enhancing bone calcification, connective tissue health, and immune system health, and reducing the risk of atherosclerosis and metal accumulation in Alzheimer’s disease [5,6]. In addition, the dietary uptake of water-insoluble silicates such as silicon dioxide (SiO2) and diatomaceous earth are reported to lower blood cholesterol in rats and humans, respectively [7,8].
Despite the health benefits, silicon and silicates do show adverse effects for humans that are ascribed to exposure, via inhalation, to insoluble silicates, such as asbestos and coal dust [9,10,11,12,13]. In particular, the inhalation of crystalline silica dust is associated with an increased risk for silicosis, tuberculosis, chronic bronchitis, chronic obstructive pulmonary disease (COPD), lung cancer, chronic kidney disease, and various autoimmune diseases, including rheumatoid arthritis, systemic lupus erythematosus, and systemic sclerosis (scleroderma) [11]. Amorphous silica is considered less hazardous [9,10], although evidence from toxicological studies on animals suggests that amorphous silica nanoparticles in food additives could pose health risks [14]. Furthermore, in a recent report, the increased kidney dysfunction observed among sugarcane workers in Guatemala was attributed to chronic exposure to ash and particulate matter (PM2.5), of which about 17% was amorphous silica from the burning of dead foliage in sugarcane fields [13].
The determination of trace levels of Si in biological samples with atomic spectroscopy techniques has been difficult due to the challenges associated with sample preparation, spectral and matrix interferences, contamination, analyte loss via volatilization or incomplete recovery, and a lack of suitable quality control materials (e.g., standard reference materials (SRMs) or certified reference materials (CRMs)) [15,16,17]. The latter has been a long-standing hurdle in testing the accuracy of silicon measurements in biological samples. Often, quality control CRM has relied on determining the silicon content of surrogate SRMs that are certified for other elements [18]. To date, various analytical techniques and approaches have been used for the determination of Si in biological materials, including colorimetry [19,20], X-ray fluorescence (XRF) spectroscopy [21], near infrared reflectance spectroscopy (NIRS) [22], radiochemical neutron activation analysis (RNAA) [17], epithermal instrumental neutron activation analysis (EINAA) [21,23], laser-induced breakdown spectroscopy (LIBS) [24], electrothermal atomic absorption spectroscopy (ETAAS) [25,26], inductively coupled plasma optical emission spectroscopy (ICP-OES) [27,28,29], and inductively coupled plasma mass spectrometry (ICP-MS) [18,30,31,32,33,34]. Colorimetric methods suffer from interference due to the phosphorus (P) that is found abundantly in biological samples [19,20]. Among the non-destructive techniques, XRF lacks the sensitivity or limit of detection (LOD) for low-level determinations (LOD ~ 100 µg/g) and has poor precision associated with particle heterogeneity and size variation [21]. Neutron activation analysis (EINAA and RNAA) can measure levels as low as 10 µg/g Si but can only be performed at nuclear reactor facilities. In addition, NAA determinations suffer from the radiochemical interferences of coexisting phosphorus (P) and aluminum (Al) that require the complex chemical separation of Si prior to measurement [17]. LIBS and NIRS are reported to afford lower LODs: 0.16 µg/g for LIBS [24] and 0.24 µg/g for NIRS [22]). However, calibration has been difficult due to the lack of suitable standards and their applications are currently experimental, pending the establishment of appropriate calibration strategies/models. Likewise, ETAAS offers high sensitivity for the analysis of slurries (LOD ~ 0.2 µg/g) [25] and solid samples (LOD ~ 0.03 µg/g), with minimal sample treatment [26]. Unfortunately, furnace atomization is susceptible to the loss of volatile organic Si species, in addition to its narrow dynamic range, which requires the close control of sample size for accurate measurements. At present, the use of ETAAS in trace analysis is scarce, as they have been virtually replaced by more advanced ICP-OES and ICP-MS instrumentation.
ICP-MS has become the standard in trace element analysis owing to its high sensitivity, large linear dynamic range (6–7 orders of magnitude), and multi-element analysis capability. A number of high-temperature alkaline fusion methods with sodium carbonate [28] and lithium borates (LiBO2 and Li2B4O7) [29] were reported for the dissolution of silicates in biological samples for ICP-OES determination. Such methods, however, are not suitable for ICP-MS due to the increased salt content of sample solutions. Moreover, fusion methods risk contamination from high amounts of flux material, as well as the loss of volatile Si species during ashing. Alternatively, closed-vessel wet digestion methods are employed with and without hydrofluoric acid (HF) and strong acids, such as nitric acid (HNO3) [18,27,31,34]. Tetramethylammonium hydroxide was used for digesting tissue samples in a high-pressure autoclave system for ICP-OES analysis. A limit of detection of 2 µg/g was reported [27]. Hydrofluoric acid is a highly toxic acid that is also highly detrimental to the glass/quartz components of ICP-OES and ICP-MS instruments, which include a nebulizer, spray chamber, torch, and injector. In earlier studies, the HF-resistant sample introduction components, including a Ryton spray chamber, alumina injector, and PEEK nebulizer, were used to alleviate the effects of HF [29,31]. Boric acid (H3BO3) is often added to solutions to bind with excess HF to produce HBF4. However, the evidence suggests that adding H3BO3 is not sufficient to completely mask excess fluoride [29]. A mixture of tertiary amines had to be added to H3BO3-treated solutions to deactivate excess HF prior to analysis of food samples by ICP-OES [29]. The limit of detection was around 1.5 µg/mL for H3BO3-treated solutions and 0.075 µg/mL when the amine mixture was added to H3BO3-treated solutions [29]. In a follow-up ICP-MS analysis, the addition of tertiary amine mixture to solutions yielded unreliable results for a suite of elements, including Si, due to interference from carbon-based tertiary amines [31].
Despite the progress over the last three decades, the determination of trace amounts of Si in food and biological samples is still extremely challenging, as highlighted by the large variation in the reported results in an inter-laboratory comparison study [16]. Acid digestion/dissolution methods appear to be most suitable for total Si determinations by ICP-MS, provided that the difficulties associated with the use of HF in sample preparation and introduction to the ICP-MS instrument are resolved. In this study, we examined the volatility of Si species in HF solutions, the chemical/physical and instrumental conditions for optimal sample preparation, and the introduction of HF solutions to the ICP-MS for the determination of Si from biological samples. To avoid analyte losses and minimize HF concentrations in analysis solutions, a two-step digestion procedure was developed. A closed-vessel digestion was performed in a mixture of HNO3, HCl, and/or HClO4 on a digestion block. After evaporating the digestates to incipient dryness, a second closed-vessel digestion in HNO3 and HF was carried out to dissolve silicates. Finally, the digestates were diluted to volume with deionized water and directly analyzed by ICP-MS. The method that was developed was validated by the determination of Si in a number of different plant and tissue SRMs or CRMs, then used for Si determination in lung biopsy tissue samples from coal miners and military veterans.

2. Materials and Methods

2.1. Reagents and Chemicals

Trace metal grade acids, including nitric acid (HNO3, Lot# 1119120, Fisher Scientific), Pittsburg, PA, USA), hydrochloric acid (HCl, Lot# 188200, Thermo Scientific), perchloric acid (HClO4, Lot# T50588, J.T. Baker, St. Paul, MN, USA), and hydrofluoric acid (HF, Lot# 5118051, Fisher Scientific, Pittsburg, PA, USA), and ultra-pure water with a resistivity of 18.2 MΩ·cm were used throughout the study. In-house deionized water passed through a 4-stage Barnstead™ E-Pure water-purification system (Model D4641, Thermo Fisher Scientific, Waltham, MA, USA) was used to produce high-purity water. All concentrations for the acid solutions used in the preparation of standard and sample solutions are the volumetric dilution (v/v) of their commercial concentrated solutions in deionized water.
Two forms of silicon standards were used for method development—sodium metasilicate (Na2SiO3, 1000 µg/mL Si in water, Lot# K323-33, LabChem, Zelienople, PA, USA) and hexafluorosilicic acid (H2SiF6, 10,000 µg/mL Si in 1% HNO3 and 1.4% HF, Lot# P2SI675610, BDH Chemicals VWR, Radnor, PA, USA). Silicon hexafluoride (H2SiF6) stock was also used for preparing all instrument calibration standards. A set of secondary multi-element stock standard solutions were prepared from commercial 1000 µg/mL or 10,000 µg/mL single-element standard solutions (BDH Chemicals, VWR, Radnor, PA, USA). The first multi-element stock solution (Stock A) contained 10 µg/mL of Al, Ag, As, B, Ba, Be, Cd, Ca, Co, Cr, Cs, Cu, Fe, Ga, K, Li, Mg, Mn, Na, Ni, Pb, Rb, Se, Sr, Te, Tl, V, and Zn, and 1.0 µg/mL of rare earth elements (REEs) (Ce, Dy, Er, Eu, Gd, Ho, La, Lu, Nd, Pr, Sm, Th, Tm, U, Y, and Yb) in 2% HNO3. Another 10 µg/mL multielement stock solution (Stock B) contained Hf, Mo, Nb, P, S, Sb, Si, Sn, Ta, Ti, W, and Zr in 2% HNO3, and trace HF (0.1%). A third multielement stock solution (Stock C) of 100 µg/mL Al, Ca, Fe, K, Mg, Na, P, S, Si, and Ti was prepared in 5% HNO3 and trace HF (0.1%). External calibrators and all other working solutions were prepared using these stock solutions via volumetric dilution. An internal standard solution of Ge, In, Rh, and Re (10 µg/mL) was prepared from 1000 µg/mL single-element standards (BDH, VWR) of the elements in 2% HNO3.

2.2. Instrumentation

A Perkin Elmer NexION 2000B ICP-MS instrument (Perkin Elmer, Norwalk, CT, USA) was used for all analyses. Argon gas was ultra-high purity (99.999%). The instrument was equipped with a dynamic reaction cell (DRC) utilizing helium (He, 99.999%), oxygen (O2, 99.999%) and anhydrous ammonia (NH3, reagent grade) gases, a PFA-cyclonic spray chamber with a 9 mm OD baffled exit port (Savillex, Eden Prairie, MN, USA), an Ari-mist Teflon nebulizer (Texas Scientific Products, Justin, TX, USA), a quartz torch with removable sapphire injector, and standard nickel sampler and skimmer cones. The instrument operating performance was monitored/optimized daily using Syngistix v2.5 software package by aspirating 1.0 µg/L tuning solution for relative sensitivities and oxide (CeO+/Ce+ < 4%) and doubly charged ion (Ce++/Ce+ < 3%) ratios. Solutions were introduced to the instrument via an ESI SC-4 DX autosampler (Elemental Scientific, Omaha, NE, USA). Operating conditions for the ICP-MS instrument are summarized below in Table 1.

2.3. Calibration and Quality Control

Plastic-ware and Teflon-ware used for the preparation of samples and standards were soaked in 10% HNO3 for at least 12 h and rinsed with deionized water prior to use. Eleven aqueous multi-element standard solutions were prepared in 2% HNO3 to calibrate the ICP-MS instrument. The first seven calibrators contained all elements from Stocks A and B at 0.5, 1, 3, 10, 30, 100, and 250 µg/L, along with 10-fold lower concentrations for REEs. The last four standards contained the elements from Stock C at 1, 3, 5, 10, and 25 µg/mL in 2% HNO3. The internal standards were added on-line. A running internal standard solution of 10 µg/L In, Rh, and Re, and 100 µg/L Ge in 2% HNO3 was mixed continuously with calibration standards via a tee prior to nebulization. Both 74Ge and 103Rh were used as internal standard elements for Si during determinations. Data were acquired using 28Si isotope. Calibration coefficients (r2) for 28Si varied between 0997 and 0.999 within the calibration range. Quality control/assurance for the instrumental determinations was carried out using several USGS T-series (available at https://bqs.usgs.gov/srs/index.html, accessed on 8 March 2024) and National Institute of Standard Technology (NIST) natural water reference materials. These include T-215, T-221, T-239, and NIST SRM 1640 (Trace Elements in Natural Water). Sub-samples of the reference materials were analyzed by ICP-MS. Method blanks were also prepared and analyzed for digestion procedures. Instrumental concentrations were corrected for method blanks to calculate Si concentrations in the unknown samples.

2.4. Biological Standard Materials and Tissue Samples

A number of plant and tissue standard/certified reference materials (SRMs or CRMs) from NIST and National Research Council Canada (NRCC) were used in this work for method development and validation. SRMs from NIST included tomato leaves (SRM 1573a), pine needles (SRM 1575), peach leaves (SRM 1547), citrus leaves (SRM 1572), oyster tissue (SRM 1566b) and bovine liver (SRM 1577b). CRMs from NRCC include dogfish liver (DOLT-3 and DOLT-4) and lobster hepatopancreas (TORT-1). With informed consent, lung tissue obtained from formalin-fixed, paraffin-embedded surgical lung tissue blocks was provided by investigators at National Jewish Health (Denver, CO, USA). Three samples were from military personnel who underwent diagnostic evaluation for respiratory symptoms following deployment to Southwest Asia and Afghanistan between 2001 and 2017, and six samples were from coal miners with severe coal worker’s pneumoconiosis [35,36,37]. All microtome-cut samples were 50 µm thick.

2.5. Methods Development

The experimental processes described here, and the resulting data are available in a USGS data release [38]. A series of experiments were conducted using Na2SiO3 and H2SiF6 standard solutions to examine the volatility of Si species (50 µg/mL Si) under different evaporation conditions and to elucidate the extent of losses from HF digestions. Three different evaporation schemes were implemented that included heating in concentrated solutions of HNO3, HNO3 + HCl and HNO3 + HCl + HF mixtures. In a typical test, 0.5 mL of 1000 µg/mL Si as Na2SiO3 or 50 µL of 10,000 µg/mL Si as H2SiF6 was added to 30 mL Teflon vessels (n = 5) from their stock solutions, along with 0.5 mL of a multielement Stock C (without Si) and 100 µL of 10 µg/mL multielement stock A. A volume of concentrated solutions of 1 mL HNO3, 1 mL HNO3 + 0.5 mL HCl or 1 mL HNO3 + 0.5 mL HCl + 0.25 mL HF was added into the vessels for HNO3, HNO3 + HCl and HNO3 + HCl + HF schemes, respectively. The vessels were heated on a 30-well hot block (Analab, Hœnheim, France) at 130 °C and contents were evaporated to incipient dryness (ca. 0.1 mL liquid remained in vessels). At this stage, 1 mL of 10% HNO3 was added to each vessel; the contents were heated briefly and then transferred to 15 mL plastic tubes and completed to 10 mL with deionized water for ICP-MS analysis. The solutions were expected to contain 50 µg/mL Si, 5 µg/mL Al, Ca, Fe, K, Mg, Na, P, and S, and 100 µg/L of the trace elements in Stock A in 2% HNO3.
In a similar experiment, after evaporating test solutions of sodium metasilicate (Na2SiO3) to incipient dryness, the residue was reheated in 4 mL of 10% HNO3 and 0.5 mL HF in closed vessels at 120 °C for about 30 min, and then transferred to 15 mL tubes and completed to 5 mL. This experiment was conducted to verify whether Si losses were due to evaporative loss or the formation of insoluble Si species (e.g., SiO2).

2.5.1. Examining Volatility/Stability of H2SiF6 under Partial Evaporation

In a third experiment, the effect of partial heating was investigated for test solutions (n = 5) prepared similarly as described above from H2SiF6 stock in an acid matrix composed of 1 mL of concentrated HNO3, 0.5 mL of concentrated HCl, and 0.25 mL of concentrated HF. Test solutions were heated at 120 °C on a hot block until about 0.6 to 0.7 mL of liquid remained in the vessels. They were then removed from the heating block, re-acidified with 1 mL of 10% HNO3, and diluted to 5 mL in 15 mL tubes for ICP-MS analysis.

2.5.2. Examining Effects of Sample Matrix on Stability of H2SiF6 in Solution

For ICP-MS determinations, the elimination of HF from solutions via evaporation is a simple approach to circumvent its adverse effects, provided that Si species (e.g., H2SiF6) are stable during evaporation. Attempts were made to use matrix combinations to stabilize H2SiF6 species against evaporative losses. To achieve this, sub-samples (n = 3) of pure silica (SiO2, 99.95% Alfa Aesar, Ward Hill, MA, USA, Lot# F15Y038) were spiked with a matrix of abundant elements found in silicate samples, including Al, Ca, Mg, Fe, K, and Na, prior to digestion. JLs-1 (Limestone, 55% CaO and 0.6% MgO) and JDo-1 (Dolomite, 33.9% CaO and 18.6% MgO) SRMs were used for producing the Ca and Ca + Mg matrix, respectively. About 20 mg of JLs-1 or JDo-1 was spiked into about 20 mg pure SiO2. The spiked samples were digested in 2 mL of concentrated HNO3, 0.5 mL of concentrated HCl, and 1 mL of concentrated HF in Teflon vessels (closed-vessel digestion) at 130 °C for 3 h on a hot block. The JLs-1 spike was equivalent to about 8 mg Ca matrix, while that of JDo-1 introduced about 4.8 mg Ca and 2.2 mg Mg to 20 mg SiO2 (~8 mg Si). To examine the effects of Na, K, Fe, and Al, 5 mg of each element was spiked via the addition of 0.5 mL from their 10 mg/mL solutions (BDH Chemicals, VWR) to a mixture (n = 3) of 20 mg SiO2 and 20 mg Dolomite (JDo-1). Digestions were performed similarly and all digestates were transferred to 15 mL tubes and diluted to 10 mL with water. For evaporation, 5 mL from each digestate was pipetted and heated in Teflon vessels at 120 °C to incipient dryness. The residue was then redissolved in 2 mL of 10% HNO3 and diluted to 5 mL in 15-mL tubes. A set of control samples (20 mg SiO2, n = 5) were digested at the same time as the test samples and similarly evaporated to incipient dryness. Both unevaporated and evaporated solutions were analyzed in 10-fold diluted solutions by ICP-MS to determine the stabilization efficacy of sample matrix or matrix ions on silicon.
In a follow-up experiment, about 50 mg sub-samples (n = 3) of NIST SRM 2709 (San Joaquin Soil) and SRM 2780a (Hard Rock Mine Waste) were spiked with about 0.1 g high-purity sodium chloride (NaCl, 99.999%, Sigma Aldrich, St. Louis, MO, USA, Lot# 11107TC) and digested in 4 mL concentrated HNO3 and 1 mL concentrated HF in Teflon vessels at 130 °C for 4 h on a hot block, and then diluted to 10 mL in 15 mL plastic tubes. Similarly, 5 mL of the digestates were evaporated to incipient dryness at 120 °C. The residue was redissolved in 1 mL HNO3, gently heated, and then diluted to 5 mL in 15 mL plastic tubes. Silicon determinations for these samples were carried out in 100-fold diluted solutions. No adverse effects (e.g., suppression) were noted from NaCl during the analysis of diluted solutions.

2.6. Sample Digestion Procedure

2.6.1. Digestion of Plant and Tissue SRM/CRMs

All digestions were performed on a 30-well hot block digestor equipped with a digital temperature controller (Analab, France). About 0.1 g sub-samples (n = 4) of the plant and tissue SRM/CRMs and 0.3 g of SRM 1577b (Bovine Liver) were weighed into 30 mL Teflon vessels (Savillex) and digested either in a mixture of 4 mL of concentrated HNO3 + 1 mL of concentrated HCl + 0.5 mL of concentrated HF or 4 mL of concentrated HNO3 + 1 mL of concentrated HCl +1 mL of concentrated HclO4 + 0.5 mL of concentrated HF. Single-step digestion in closed-vessels is perceived to be most viable approach to prevent potential silicon loss. Nevertheless, closed-vessel digestion using the indicated volumes of concentrated acids yields solutions with about 40% HNO3, 10% HCl, 10% HclO4, and 5% HF in 10 mL volume. The introduction of such highly acidic solutions is not practical as it is detrimental to ICP-MS sample introduction components (e.g., pump tubing and sampling cones). A dilution could be made if the silicon concentration is sufficiently high to reduce acid content. However, in this study, most tissue SRM/CRMs possessed a low level of silicon. Further, lung biopsy tissue samples were expected to possess even lower silicon levels due to their small sample mass, meaning that dilution would not be a feasible approach for silicon determination. Thus, digestion was carried out in two steps to produce sample solutions that could be directly analyzed by ICP-MS in concentrated solutions/digestates. In the first step, 4 mL of concentrated HNO3 and 1 mL of concentrated HCl were added to all vessels. Foaming/overboiling occurs when the HNO3 + HCl mixture is heated immediately. To avoid this, samples were allowed to digest at room temperature for about 20 min until foaming subsided. Then, they were heated gently at 120 °C on the hot block. Once foaming completely ceased, screw-lids were tightly closed, and the contents were digested at 140 °C for 5 h. For those digested in HNO3 + HCl +HClO4 + HF, 1 mL of concentrated HClO4 was added after foaming ceased and was similarly digested. After the first digestion, lids were removed, and digestates were evaporated to incipient dryness at 130 °C. The second step involved HNO3 + HF digestion to dissolve the silicates. With the residue at incipient dryness, 0.5 mL of concentrated HNO3 and 0.5 mL of concentrated HF were added, lids were closed tightly, and the contents were heated at 130 °C for 2 h. At the end, vessels were removed from the hot block, cooled to room temperature and the digestates were diluted to 15 mL with deionized water in 15-mL test tubes. Procedural blanks (n = 6) were prepared similarly.

2.6.2. Digestion of Surgical Lung Tissue Samples

The tissue mass in paraffin embedded surgical lung tissue scrolls was low, ranging between 2 and 3 mg. Thus, the lung tissue samples were digested with a modified procedure to determine soluble and insoluble silicates contained in the tissue. First, paraffin-embedded tissue scrolls, along with three procedural blanks, were placed in 2 mL xylene in 4 mL Teflon tubes (Savillex) for 15 min to dissolve/remove the paraffin layer. Then, 2 mL of hydrogen peroxide (H2O2, ≥30% w/w, ultra-trace grade, Sigma Aldrich, St. Louis, MO, USA, Lot# BCC0535) was added to each tube to enhance the separation of tissue and soluble species into the aqueous phase. Approximately 15 min later, the xylene layer was removed via pipetting, and the tubes were screw-capped and heated on a block digestor (DigiPrep Cube, SCP Science, Baie-d’Urfé, QC, Canada) for 2 h at 40 °C. The temperature was then raised to 90 °C and held for about 2 h until all tissue was solubilized. The tubes were then cooled to room temperature, an additional 1 mL of H2O2 was added, and each sample was reheated at 90 °C for 2 h. After cooling to room temperature, the contents in the tubes were sonicated for 30 min in an ultrasonic bath. A volume of 400 µL was taken for microscopy analysis.

Digestion of H2O2 Solubilized Tissue Extracts

The remaining H2O2 extracts in 4 mL Teflon tubes were first evaporated slowly at 100 °C on the hot block digestor until about 1 mL of liquid remained in the vials. The contents were then transferred to 2 mL microcentrifuge tubes. Teflon tubes were vigorously rinsed with deionized water into the centrifuge tubes. Volume was completed to 2 mL with deionized water, and then samples were centrifuged at 13,000 rpm (16.2 g) for 30 min to settle insoluble particulate matter. The supernatant was gently transferred into 30 mL Teflon vials. A volume of 0.25 mL concentrated HNO3 was added, and the contents were digested at 130 °C for 1 h (closed-vessel digestion). After digestion, the contents were transferred to 15 mL polypropylene test tubes and diluted to 5 mL with deionized water. Procedural blanks (n = 3) were prepared similarly.

Digestion of Particulate Matter from Tissue Extracts

A volume of 1 mL concentrated HNO3 and 0.5 mL of concentrated HCl was added to the microcentrifuge tubes containing undigested particles from above section (Digestion of H2O2 Solubilized Tissue Extracts). Contents were shaken gently to suspend the particulate matter and allowed to react/dissolve for 30 min, then poured into their original 4 mL Teflon tubes from Section 2.6.2 for digestion. A volume of 0.5 mL concentrated HClO4 was also added to the tubes, and the contents were digested at 120 °C for 2 h on the Digi-Prep Cube hot block digestor. After digestion, contents were evaporated to incipient dryness at 120 °C to eliminate the excess acids. At this stage, 0.25 mL of concentrated HNO3 and 0.25 mL of concentrated HF were added to the tubes. Lids were closed and contents were digested at 120 °C for 2 h. At the end of the test, digestates were cooled to room temperature and transferred to 15 mL polypropylene test tubes. Volumes were completed to 5 mL with deionized water. Procedural blanks (n = 3) were prepared similarly.

2.7. Statistical Analysis

The data acquired for replicate measurements were recorded as mean and standard deviation. t-tests were performed for paired comparisons. One way analysis of variance (ANOVA) with Tukey’s and Dunnett’s (if controls were available) were used to detect significant differences among the different experimental conditions and groups. Statistical calculations were performed with Minitab software package (v. 19.2020.1). A p-value < 0.05 was considered statistically significant.

3. Results and Discussion

Silicon is a ubiquitous element, and thus contamination could readily occur from the sample introduction setup of an ICP-MS instrument if quartz components are exposed to HF or its vapors. This phenomenon was investigated at the beginning of the experiments by aspirating dilute HF solutions through both fully HF-compatible and partly incompatible sample introduction setups. The former consisted of a perfluoroalkoxy (PFA) spray chamber, a Teflon nebulizer, and a quartz torch with a removable sapphire injector. In the latter, the sapphire injector was replaced with a quartz injector. Background silicon concentrations were relatively low for the HF-compatible setup, varying between 68 and 98 µg/L from nebulization of 1, 2, 5, 10, and 20% HF solutions. In the HF-incompatible setup, the impact of HF on quartz surfaces was remarkable. The silicon background was around 2.3 µg/mL for 1% HF (about four orders of magnitude higher than that for HF-compatible setup) and increased to 9.2, 23 and 40 µg/mL for 2, 5, and 10% HF solutions, respectively. It should be noted that the injector unit is located at the end of the sample introduction system, which is exposed to small mist of HF from nebulization, while most aspirated solution (ca. 90%) is lost to waste. These results clearly show that, even in the presence 1% HF, accurate determinations would not be feasible without a fully HF-inert sample introduction system, since the high silicon background signals could overwhelm the analytical signals at low parts per million levels (µg/mL) from plant and tissue digestates containing much higher levels of HF.

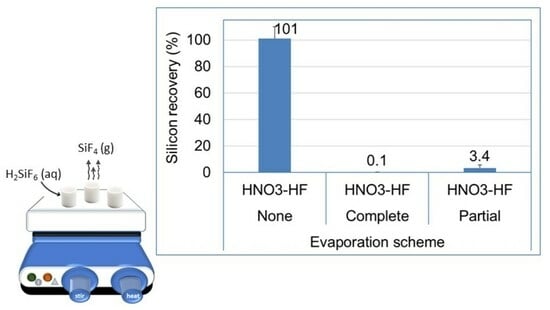
3.1. Effect of HF on Volatility of Silicon Species

As a proof of concept, Table 2 summarizes Si recoveries after the evaporation of various acid digestion treatments of sodium metasilicate (Na2SiO3) and hexafluorosilicic acid (H2SiF6) solutions (n = 5). Control samples contained the same concentrations of Si in 2% HNO3 as the experimental samples but were not heated. For H2SiF6, Si was lost almost completely to evaporation, regardless of the digestion medium. This result was expected since Si was already present as a hexafluoride complex, which is converted to gaseous silicon tetrafluoride (SiF4) upon heating to dryness [18,39,40]. Interestingly, losses were also noted for Na2SiO3 solutions in all schemes. As expected, SiO32− would be converted to SiF62− in the HNO3 + HCl + HF medium and consequently lost as gaseous SiF4 under heating. Contrary to this, losses in HNO3 and HNO3 + HCl were thought to occur due to the formation of silicon dioxide (SiO2) when Na2SiO3 (e.g., H2SiO3 in acidic medium) was heated to dryness (H2SiO3 → SiO2 (s) + H2O). The low recoveries for the silicon point could be due to the fact that the resulting SiO2 residue adhered to the surfaces of Teflon vessels and could not be transferred to analysis tubes during redissolution with 2 mL of 10% HNO3. The results of the follow-up experiment verified this conclusion. When the SiO2 residue from the evaporation of metasilicate solution (50 µg/mL Si) was heated in closed vessels in 0.5 mL concentrated HF and 4 mL of 10% HNO3, the Si recoveries for both the HNO3 and HNO3 + HCl schemes were 112% and 110%, respectively (see Table 2). An additional set of metasilicate solutions (n = 5) in 1 mL HNO3 was dried completely at 130 °C and kept dry for about 10 min. The recovery was also similar, indicating that metasilicate species were stable during evaporation in HNO3 and HNO3 + HCl media, but care should be taken for the effective redissolution of the SiO2 residue to avoid inaccuracies in determinations.

3.2. Volatility/Stability of H2SiF6 under Partial Evaporation

Our initial results were consistent with the literature that indicates that gaseous SiF4 forms largely when solutions of H2SiF6 are evaporated to dryness [18,33,39]. Nonetheless, there are no concrete data to date regarding the extent of volatility or stability of H2SiF6 (boiling point, 108.5 °C) in heated solutions. As a result, silicon in HF digestates (i.e., H2SiF6) has long been perceived to be largely stable during evaporative heating unless solutions are completely dried. In this study, we investigated the stability of H2SiF6 species under partial evaporation by heating a set of H2SiF6 solutions (50 µg/mL Si, n = 5) in 1 mL of concentrated HNO3 + 0.5 mL of concentrated HCl + 0.25 mL of concentrated HF at 120 °C. Evaporation was carried out until about 0.5–0.7 mL of the liquid remained in Teflon vessels. The results are provided in Table 2 (last row). More than 96% of Si was lost, most likely as H2SiF6 vapor. This clearly demonstrates the high volatility of H2SiF6 and that digestions with HF must be carried out in closed vessels to prevent potential losses.

3.3. Effects of Sample Matrix on Stability of H2SiF6 against Heating

The results for pure SiO2 digested with HNO3 + HCl + HF in the presence of common matrix elements (Al, Ca, Fe, Mg, K, and Na) are summarized in Table 3. Digestates were split. One split was evaporated in a Teflon vessel to incipient dryness, redissolved in 2 mL of 10% HNO3 and made up to volume. The other split was not evaporated, for which recoveries varied between 82.6 and 93.0% (forth column). Losses were substantial for the evaporated solutions of all matrix combinations (third column). The concentration of Ca matrix in digestates was calculated to be about 800 µg/mL from the addition of 20 mg limestone (JLs-1). Spikes in 20 mg dolomite (JDo-1) introduced about 480 µg/mL Ca and 220 µg/mL Mg in 10 mL digestates, but neither Ca nor Ca + Mg matrices exhibited any stabilizing action on H2SiF6 during heating. Similarly, total loss occurred in dolomite + K (500 µg/mL) and dolomite + Al (500 µg/mL) matrices. Some stability was noted when Na (500 µg/mL) was present along with dolomite (~22.4% recovery). The recoveries for dolomite + Na, K, Al (12.0%) and dolomite + Na, K, Al, Fe (13.9%) were relatively lower than those with dolomite + Na, but the results supported the idea that H2SiF6 was stabilized to some extent in the presence of Na, perhaps via the formation of insoluble sodium fluorosilicate or complex sodium fluorosilicates.
The stabilization observed in the presence of Na was further examined with SRM 2709—San Joaquin Soil (26.66% Si by mass) and SRM 2780a—Hard Rock Mine Waste (24.1% Si by mass). The results for the SRM samples digested with 0.1 g NaCl matrix are summarized in Table 4, along with those digested without the NaCl matrix. Recoveries for unevaporated solutions were quantitative, ranging between 90.9 and 98.8%. Silicon loss was substantial (>99%) for the evaporated SRM digestates that did not contain any NaCl. The presence of NaCl matrix (0.1 g) greatly improved the recoveries (>78%), which were significantly higher than those for SiO2 samples spiked with dolomite + Na (~12.0–22.4%, with or without K, Al, Fe). These results are also in agreement with those in our previous work [39], where recoveries for Si ranged between 72 and 83% when soil and sediment digestates in NaCl matrix were evaporated to dryness at a much higher temperature of 200 °C.
Sodium fluorosilicate (Na2SiF6) forms when the solutions of H2SiF6 species are evaporated in the presence of NaCl according to the following reaction: H2SiF6 (aq) + NaCl (aq) → Na2SiF6 (aq) + HCl (aq) + heat → Na2SiF6 (s) + NaCl (excess). Obviously, the improved recoveries for Si in SRM digestates were largely due to the effective formation and/or stabilization of Na2SiF6 by the excess Na matrix. The sodium concentration from 0.1 g NaCl was about 3900 µg/mL (ca. 0.170 mole/L), which was about 3.1- and 3.8-fold higher than the Si concentrations for SRM 2709 (0.054 mole/L) and SRM 2780a (0.045 mole/L), respectively. In contrast, the Na/Si molar ratio for the SiO2 digestates spiked with dolomite and Na was about 0.64, which was stoichiometrically insufficient to convert all H2SiF6 to nonvolatile Na2SiF6 (Table 3). Despite the improved stabilization achieved with the NaCl addition, Si loss was still substantial (ca. 20%) in SRM solutions. This loss was attributed to the evaporation of the remaining H2SiF6 that had not been converted to Na2SiF6. To completely prevent Si loss during evaporation from solutions containing HF, all H2SiF6 species must completely be converted to Na2SiF6. Refining this approach was beyond the scope of this study and requires additional research. Thus, we opted for a two-step procedure for digesting plant and tissue samples, as described in Section 2.5, to achieve the direct analysis of digestates in HNO3 and HF medium by ICP-MS.

3.4. Analysis Tissue and Plant SRM/CRMs

The results for the Si concentrations determined in the plant and tissue SRMs are presented in Table 5 and Table 6, respectively, along with the values reported in the literature. Data were acquired for the most abundant 28Si isotope with KED and standard modes. The limit of detection (LOD) was about 110 µg/L for KED mode and 62 µg/L for the standard mode. For plant SRMs, values were mostly in good agreement with those reported previously, especially with those of EINAA, which is more sensitive (LOD ~ 10 µg/g) and interference-free than XRF (LOD ~ 100 µg/g). Variability (%RSD) for replicate measurements was 5.3%–5.7% for tomato leaves (SRM 1573a) but was higher for pine needles (SRM 1575b, 13%–17%), peach leaves (SRM 1547, 18%–21%), and citrus leaves (SRM 1572, 21%–22%). This variability is also reflected in some of the XRF and EINAA determinations [21] and was attributed to their material heterogeneity and large particle size distribution. Our results for pine needles (SRM 1575b) and peach leaves (SRM 1547) were more consistent with the XRF results reported by Landsberger et al. [23], who utilized Compton suppression and cadmium filters to reduce spectral interference at 1267.8 keV from 28Al γ-line on 29Al 1273.4 keV.
For the tissue SRMs, the literature values for Si are limited to a handful of reference materials from determinations by atomic spectroscopy and mass spectrometry techniques, including ETAAS, ICP-OES, and ICP-MS [26,27,29,31]. Likewise, the results in Table 6 for oyster tissue (SRM 1566b) and lobster hepatopancreases (TORT-1) showed good agreement with the reported values for ICP-OES determinations [28,30]. The precision for four replicate measurements (%RSD) was better for SRM 1566b (2.1%–5.6%) and DOLT-3 (9%–11%) but was poor for SRM 1577b (33%), DOLT-4 (18%–21%) and TORT-1 (24%–28%), which could be indicative of potential material heterogeneity for the sample size that was used. The results for bovine liver (SRM 1577b) were higher than those reported in the literature (2.1 to 5.6 µg/g) [16,25,26,30]. The large discrepancy is thought to be due to the very low Si concentration in SRM 1577b solutions, which was about 3–4 times more than the LOD values. The ICP-MS results reported by Krushevska et al. [31] for 1577b and TORT-1 do exhibit a large bias and variation, which also supports the fact that low-level Si determination by ICP-MS is a challenging task and accuracy could substantially degrade as the concentrations approach LODs.
The data in Table 5 and Table 6 also summarize the silicon concentrations acquired by using two different internal standard elements, 74Ge (7.89 eV) and 103Rh (7.45 eV). Technically, 74Ge is best-suited for use as the internal standard for 28Si (8.15 eV) since it is closer in ionization potential and m/z ratio. The results indicate that both Ge and Rh are equally suitable as an internal standard for Si determinations. Within same measurement mode (KED or standard mode), the values determined using 74Ge and 103Rh were not significantly different (t-test p > 0.05). In general, results for standard mode were lower than those for KED mode, and were significantly lower (ANOVA, p < 0.05) for some samples, including SRM 1573a, SRM 1572, and SRM 1566b. However, the results obtained with the standard mode for SRM 1572 were more consistent with the reported values [21], while those for SRM 1573a and 1566b were much lower than the literature values [23,29,31]. It is difficult to delineate the sources of this discrepancy because of the limited data. It could be related to an over-correction in standard mode for potential molecular ion interferences of carbon (12C) and oxygen (16O) or ion transport efficiency differences at m/z 28 between KED and the standard modes associated with the sample matrix.
Citrus leaves (SRM 1572) and dogfish liver (DOLT-4) were digested with a four-acid procedure of HNO3 + HCl + HClO4 + HF, in addition to the three-acid procedure (HNO3 + HCl + HF). The results are presented in Table 5 and Table 6 for SRM 1572 and DOLT-4, respectively. No statistical differences were detected between these two digestion procedures (ANOVA, Tukey’s post hoc test, p > 0.05). Perchloric acid (HClO4) is often utilized in combination with HNO3 for the effective digestion of plant and tissue samples. However, the results indicate that effective digestion/dissolution could be achieved with a three-acid procedure without HClO4. This is advantageous for reduced acid consumption and the elimination of ICP-MS interferences associated with perchlorates.

3.5. Analysis of Surgical Lung Tissue Samples

The silicon concentrations determined in lung tissue samples are presented in Table 7. Values are reported for 28Si isotope using KED mode and 74Ge as the internal standard. Of the ten samples, one was from a healthy person (control), six were from coal miners, and three were from military deployers. For all samples, the differences between the soluble fraction and insoluble fractions were significant (paired t-test, p < 0.005). The levels of water-soluble Si and silicates were substantial; however, most Si was present in the particulate matter (insoluble) fraction. The mean Si concentration in particulate matter was higher by a factor of 4.6 and 2.8 for coal miners and deployers, respectively. Mean Si concentrations in both water-soluble and insoluble fractions were higher in deployers than in coal miners. However, ANOVA did not detect any significant differences among the groups (Dunnet’s post hoc test, p > 0.05) due to the large within-group variation in a small set of samples, particularly controls. More conclusive results could be obtained from an analysis of larger numbers of lung tissue samples which, along with mineralogical and morphological particle characterization, may provide a powerful tool to understand the health risks from exposure to silica dust and similar particulate matter in a variety of occupational settings.

4. Conclusions

This study investigated the issues associated with ICP-MS analysis of Si in HF digestions to determine the trace levels of Si from plant and tissue samples obtained by ICP-MS. It is concluded that the use of a fully HF-inert sample introduction system is essential to minimize the Si background to determine low levels of silicon. The results clearly demonstrate that the hexafluorosilicates that form in HF-based digestions are highly volatile. Even partial or gentle evaporation procedures to eliminate excess HF and other acids (e.g., HNO3, and HCl) result in significant Si losses. The addition of Na to HF digests resulted in the formation of sodium hexafluorosilicate and provided some stabilization of Si during evaporation but was not fully effective. A two-step, closed-vessels digestion procedure starting with HNO3 + HCl and followed by HNO3 + HF dissolution was optimal for digesting biological samples to avoid losses and minimize acids in analysis solutions.
Silicon determinations were performed with both KED mode and standard mode using 28Si. Both approaches are equally suitable for Si determination, but care must be taken to minimize increased background and potential interferences in standard mode. Both Ge and Rh are equally suitable internal standard elements for Si, but it should be noted that Ge has a number of isotopes that could be prone to molecular ion interferences (e.g., 72Ge from 40Ar32S) in plant and tissue samples. In this work, such hurdles were circumvented by using a higher concentration of Ge (100 µg/L) in the internal standard solution. The results from the analysis of several plant and tissue reference materials were in good agreement with those available from the literature, suggesting that the developed digestion/sample introduction approach offers accurate determinations. The next steps would be to further stabilize silicon as a sodium fluorosilicate and to completely eliminate HF from digests for ICP-MS analysis. It is expected that better LODs could be achieved to determine the low of levels of Si in samples like bovine liver.

Author Contributions

Conceptualization, Z.A.; methodology, Z.A.; validation, Z.A.; formal analysis, Z.A. and H.L.; investigation, Z.A. and H.L.; resources, Z.A. and H.L. writing—original draft preparation, Z.A.; writing—review and editing, Z.A. and H.L. All authors have read and agreed to the published version of the manuscript.

Funding

This work was supported by the Office of the Assistant Secretary of Defense for Health Affairs, through the Peer Reviewed Medical Research Program under Award No. W81XWH-16-2-0018. Supported was also provided by U.S. Geological Survey (USGS) Mineral Resources Program (MRP) Research Chemistry project (RK00M2C) and Alpha Foundation for the Improvement of Mine Safety and Health grant (AFC417-1). Opinions, interpretations, conclusions, and recommendations are those of the authors and are not necessarily endorsed by the Department of Defense. The findings and conclusions in this report are those of the authors and do not necessarily represent the Alpha Foundation for the Improvement of Mine Safety and Health, Inc. This journal article has been peer reviewed and approved for publication consistent with USGS Fundamental Science Practices (https://pubs.usgs.gov/circ/1367/, accessed on 08 March 2204).

Data Availability Statement

The data presented in this study are openly available in USG ScienceBase-Catalog at https://doi.org/10.5066/P9VLL9VJ, reference number [38].

Acknowledgments

We gratefully acknowledge the intellectual contributions and provision of lung tissue samples from National Jewish Health investigators Cecile Rose and Lauren Zell-Baran. Any use of trade, firm, or product names is for descriptive purposes only and does not imply endorsement by the U.S. Government.

Conflicts of Interest

The authors declare no conflicts of interest.

References

  1. Greenwood, N.N.; Earnshaw, A. (Eds.) Silicon. In Chemistry of the Elements; Butterworth-Heinemann: Oxford, UK, 1997; pp. 328–366. ISBN 978-0-7506-3365-9. [Google Scholar]
  2. Pavlovic, J.; Kostic, L.; Bosnic, P.; Kirkby, E.A.; Nikolic, M. Interactions of Silicon With Essential and Beneficial Elements in Plants. Front. Plant Sci. 2021, 12, 697592. [Google Scholar] [CrossRef] [PubMed]
  3. Farooq, M.A.; Dietz, K.J. Silicon as Versatile Player in Plant and Human Biology: Overlooked and Poorly Understood. Front. Plant Sci. 2015, 6, 994. [Google Scholar] [CrossRef]
  4. Neu, S.; Schaller, J.; Dudel, E.G. Silicon Availability Modifies Nutrient Use Efficiency and Content, C:N:P Stoichiometry, and Productivity of Winter Wheat (Triticum aestivum L.). Sci. Rep. 2017, 7, 40829. [Google Scholar] [CrossRef] [PubMed]
  5. Martin, K.R. The Chemistry of Silica and Its Potential Health Benefits. J. Nutr. Health Aging 2007, 11, 94–97. [Google Scholar] [PubMed]
  6. Martin, K.R. Silicon: The Health Benefits of a Metalloid. Met. Ions Life Sci. 2013, 13, 451–473. [Google Scholar] [CrossRef]
  7. Peluso, M.R.; Schneeman, B.O. A Food-Grade Silicon Dioxide Is Hypocholesterolemic in the Diet of Cholesterol-Fed Rats. J. Nutr. 1994, 124, 853–860. [Google Scholar] [CrossRef]
  8. Wachter, H.; Lechleitner, M.; Artner-Dworzak, E.; Hausen, A.; Jarosch, E.; Widner, B.; Patsch, J.; Pfeiffer, K.; Fuchs, D. Diatomaceous Earth Lowers Blood Cholesterol Concentrations. Eur. J. Med. Res. 1998, 3, 211–215. [Google Scholar]
  9. Ding, M.; Chen, F.; Shi, X.; Yucesoy, B.; Mossman, B.; Vallyathan, V. Diseases Caused by Silica: Mechanisms of Injury and Disease Development. Int. Immunopharmacol. 2002, 2, 173–182. [Google Scholar] [CrossRef]
  10. Merget, R.; Bauer, T.; Küpper, H.; Philippou, S.; Bauer, H.; Breitstadt, R.; Bruening, T. Health Hazards Due to the Inhalation of Amorphous Silica. Arch. Toxicol. 2002, 75, 625–634. [Google Scholar] [CrossRef]
  11. Sellamuthu, R.; Umbright, C.; Li, S.; Kashon, M.; Joseph, P. Mechanisms of Crystalline Silica-Induced Pulmonary Toxicity Revealed by Global Gene Expression Profiling. Inhal. Toxicol. 2011, 23, 927–937. [Google Scholar] [CrossRef]
  12. Jones, D.G.; Wilbur, S.B.; Roney, N.; Faroon, O.; Williams, M.; Williams, R.; Klotzbach, J.M.; Zaccaria, K.; Kawa, M. Toxicological Profile for Silica; Center for Disease Control and Prevention (CDC): Atlanta, GA, USA, 2019; Volume 349.
  13. Schaeffer, J.W.; Adgate, J.L.; Reynolds, S.J.; Butler-Dawson, J.; Krisher, L.; Dally, M.; Johnson, R.J.; James, K.A.; Jaramillo, D.; Newman, L.S. A Pilot Study to Assess Inhalation Exposures among Sugarcane Workers in Guatemala: Implications for Chronic Kidney Disease of Unknown Origin. Int. J. Environ. Res. Public Health 2020, 17, 5708. [Google Scholar] [CrossRef]
  14. van Kesteren, P.C.E.; Cubadda, F.; Bouwmeester, H.; van Eijkeren, J.C.H.; Dekkers, S.; de Jong, W.H.; Oomen, A.G. Novel Insights into the Risk Assessment of the Nanomaterial Synthetic Amorphous Silica, Additive E551, in Food. Nanotoxicology 2015, 9, 442–452. [Google Scholar] [CrossRef]
  15. Lugowski, S.J.; Smith, D.C.; Lugowski, J.Z.; Walter, P.; John, S. A Review of Silicon and Silicone Determination in Tissue and Body Fluids—A Need for Standard Reference Materials. Fresenius J. Anal. Chem. J Anal. Chem. 1998, 360, 486–488. [Google Scholar] [CrossRef]
  16. Van Dyck, K.; Robberecht, H.; Van Cauwenbergh, R.; Deelstra, H.; Arnaud, J.; Willemyns, L.; Benijts, F.; Centeno, J.A.; Taylor, H.; Soares, M.E.; et al. Spectrometric Determination of Silicon in Food and Biological Samples: An Interlaboratory Trial. J. Anal. At. Spectrom. 2000, 15, 735–741. [Google Scholar] [CrossRef]
  17. Kuera, J.; Zeisler, R. Low-Level Determination of Silicon in Biological Materials Using Radiochemical Neutron Activation Analysis. J. Radioanal. Nucl. Chem. 2005, 263, 811–816. [Google Scholar] [CrossRef]
  18. Arslan, Z.; Ertas, N.; Tyson, J.F.; Uden, P.C.; Denoyer, E.R. Determination of Trace Elements in Marine Plankton by Inductively Coupled Plasma Mass Spectrometry (ICP-MS). Fresenius J. Anal. Chem. 2000, 366, 272–282. [Google Scholar] [CrossRef] [PubMed]
  19. Bell, P.F.; Simmons, T.F. Silicon Concentrations of Biological Standards. Soil Sci. Soc. Am. J. 1997, 61, 321–322. [Google Scholar] [CrossRef]
  20. Elliott, C.L.; Snyder, G.H. Autoclave-Induced Digestion for the Colorimetric Determination of Silicon in Rice Straw. J. Agric. Food Chem. 1991, 39, 1118–1119. [Google Scholar] [CrossRef]
  21. Gladney, E.S.; Neifert, P.E.; Bower, N.W. Determination of Silicon in National Institute of Standards and Technology Biological Standard Reference Materials by Instrumental Epithermal Neutron Activation and X-ray Fluorescence Spectrometry. Anal. Chem. 1989, 61, 1834–1836. [Google Scholar] [CrossRef]
  22. Smis, A.; Ancin Murguzur, F.J.; Struyf, E.; Soininen, E.M.; Herranz Jusdado, J.G.; Meire, P.; Bråthen, K.A. Determination of Plant Silicon Content with near Infrared Reflectance Spectroscopy. Front. Plant Sci. 2014, 5, 496. [Google Scholar] [CrossRef]
  23. Landsberger, S.; Peshev, S.; Becker, D.A. Determination of Silicon in Biological and Botanical Reference Materials by Epithermal INAA and Compton Suppression. Nucl. Instrum. Methods Phys. Res. A 1994, 353, 601–605. [Google Scholar] [CrossRef]
  24. De Souza, P.F.; Santos, D.J.; De Carvalho, G.G.A.; Nunes, L.C.; Da Silva Gomes, M.; Guerra, M.B.B.; Krug, F.J. Determination of Silicon in Plant Materials by Laser-Induced Breakdown Spectroscopy. Spectrochim. Acta Part B At. Spectrosc. 2013, 83–84, 61–65. [Google Scholar] [CrossRef]
  25. Hornung, M.; Krivan, V. Determination of Silicon in Biological Tissue by Electrothermal Atomic Absorption Spectrometry Using Slurry Sampling of Original and Pre-Ashed Samples. J. Anal. At. Spectrom. 1997, 12, 1123–1130. [Google Scholar] [CrossRef]
  26. Huang, M.D.; Krivan, V. A Direct Solid Sampling Electrothermal Atomic Absorption Spectrometry Method for the Determination of Silicon in Biological Materials. Spectrochim. Acta Part B At. Spectrosc. 2007, 62, 297–303. [Google Scholar] [CrossRef]
  27. Hauptkorn, S.; Pavel, J.; Seltner, H. Determination of Silicon in Biological Samples by ICP-OES after Non-Oxidative Decomposition under Alkaline Conditions. Fresenius J. Anal. Chem. 2001, 370, 246–250. [Google Scholar] [CrossRef] [PubMed]
  28. Lichte, F.E.; Hopper, S.; Osborn, T.W. Determination of Silicon and Aluminum in Biological Matrices by Inductively Coupled Plasma Emission Spectrometry. Anal. Chem. 1980, 52, 120–124. [Google Scholar] [CrossRef]
  29. Krushevska, A.P.; Barnes, R.M. Determination of Low Silicon Concentrations in Food and Coral Soil by Inductively Coupled Plasma Atomic Emission Spectrometry. J. Anal. At. Spectrom. 1994, 9, 981–984. [Google Scholar] [CrossRef]
  30. Fridlund, S.; Littlefield, S.; Rivers, J. The Use of Modified Microwave Digestion/Dissolution for the Quantitative Determination of Aluminum, Silicon, and Iron in Biological Materials by Inductively Coupled Plasma Spectrometry. Commun. Soil Sci. Plant Anal. 1994, 25, 933–941. [Google Scholar] [CrossRef]
  31. Krushevska, A.; Lasztity, A.; Kotrebai, M.; Barnes, R.M. Addition of Tertiary Amines in the Semiquantitative, Multi-Element Inductively Coupled Plasma Mass Spectrometric Analysis of Biological Materials. J. Anal. At. Spectrom. 1996, 11, 343–352. [Google Scholar] [CrossRef]
  32. Klemens, P.; Heumann, K.G. Development of an ICP-HRIDMS Method for Accurate Determination of Traces of Silicon in Biological and Clinical Samples. Anal. Bioanal. Chem. 2001, 371, 758–763. [Google Scholar] [CrossRef]
  33. Taber, H.G.; Shogren, D.; Gang, L. Extraction of Silicon from Plant Tissue with Dilute HCl and HF and Measurement by Modified Inductive Coupled Argon Plasma Procedures. Commun. Soil Sci. Plant Anal. 2002, 33, 1661–1670. [Google Scholar] [CrossRef]
  34. Aureli, F.; Ciprotti, M.; D’amato, M.; da Silva, E.D.N.; Nisi, S.; Passeri, D.; Sorbo, A.; Raggi, A.; Rossi, M.; Cubadda, F. Determination of Total Silicon and SiO2 Particles Using an ICP-MS Based Analytical Platform for Toxicokinetic Studies of Synthetic Amorphous Silica. Nanomaterials 2020, 10, 888. [Google Scholar] [CrossRef]
  35. Rose, C.S.; Moore, C.M.; Zell-Baran, L.M.; Krefft, S.; Wolff, J.; Pang, K.; Parr, J.; Cool, C. Small Airways and Airspace Inflammation and Injury Distinguish Lung Histopathology in Deployed Military Personnel from Healthy and Diseased Lungs. Hum. Pathol. 2022, 124, 56–66. [Google Scholar] [CrossRef]
  36. Cohen, R.A.; Rose, C.S.; Go, L.H.T.; Zell-Baran, L.M.; Almberg, K.S.; Sarver, E.A.; Lowers, H.A.; Iwaniuk, C.; Clingerman, S.M.; Richardson, D.L.; et al. Pathology and Mineralogy Demonstrate Respirable Crystalline Silica Is a Major Cause of Severe Pneumoconiosis in U.S. Coal Miners. Ann. Am. Thorac. Soc. 2022, 19, 1469–1478. [Google Scholar] [CrossRef] [PubMed]
  37. Lowers, H.; Zell-Baran, L.; Arslan, Z.; Moore, C.M.; Rose, C. Particle Morphology and Elemental Analysis of Lung Tissue from Post-9/11 Military Personnel with Biopsy-Proven Lung Disease. Int. J. Environ. Res. Public Health 2024, 21, 91. [Google Scholar] [CrossRef] [PubMed]
  38. Arslan, Z.; Lowers, H.A. Method Development for Determination of Trace Amounts of Silicon in Hydrofluoric Acid Digests of Biological Samples and Lung Biopsy Tissues by ICP-MS. U.S. Geological Survey Data Release. 2024. Available online: https://doi.org/10.5066/P9VLL9VJ (accessed on 8 March 2024).
  39. Arslan, Z.; Tyson, J.F. Determination of Trace Elements in Siliceous Samples by ICP-MS after Precipitation of Silicon as Sodium Fluorosilicate. Microchim. Acta 2008, 160, 219–225. [Google Scholar] [CrossRef]
  40. Quevauviller, P.; Vercoutere, K.; Muntau, H.; Griepink, B. Certified Reference Material (CRM 414) for the Quality Control of Trace Element Analysis in Plankton. Fresenius. J. Anal. Chem. 1993, 345, 12–17. [Google Scholar] [CrossRef]
Table 1. NexION 2000B ICP-MS instrument operating conditions.
RF Power1500 W
Plasma argon flow13.0 L/min
Auxiliary argon flow 0.85 L/min
Nebulizer argon flow0.86 L/min
Sample flow rate0.5 L/min
Scan modePeak hopping
Dwell time30 ms
Points/peak1
Scans/peak2
Scans/replicate5
Measurement modesKinetic Energy Discrimination (KED) and Standard
KED cell gas/flow rateHelium/5 mL/min
Table 2. Volatility/stability of hexafluorosilicic acid (H2SiF6) and sodium metasilicate (Na2SiO3) under different evaporation schemes. Values are mean ± standard deviation (n = 5). Values in parenthesis are mean recoveries (%).
Silicon SpeciesSilicon Concentration (µg/mL)Remarks
ControlTreatment/Medium
HNO3HNO3 + HClHNO3 + HCl +HF
H2SiF650.5 ± 3.1
(103)
0.04 ± 0.10
(0.1)
NdndAfter evaporation, residue redissolved in 10% HNO3
Na2SiO352.1 + 1.4
(106)
14.6 ± 2.3
(29.9)
12.9 ± 1.4
(26.4)
0.62 ± 0.92
(1.3)
After evaporation, residue redissolved in 10% HNO3
Na2SiO354.5 + 4.1
(111)
54.7 ± 3.0
(112)
53.9 ± 2.8
(110)
3.0 ± 2.7
(6.2)
After evaporation, residue redissolved by heating in closed vessels in HF and 10% HNO3
H2SiF650.4 ± 4.6
(103)
n/an/a1.7 ± 3.4
(3.5)
Partially evaporated and reacidified with 10% HNO3
nd: not detected. n/a: no experiment performed.
Table 3. Effect of sample matrix on stability of Si during the evaporation of digestates of SiO2 with HNO3 + HCl + HF. Na, K, Al, and Fe were added as nitrates. Expected silicon concentration was approximately 950 µg/mL in 10 mL solution from the digestion of about 20 mg pure SiO2.
MatrixMatrix Element (Concentration, µg/mL)Si Recovery (%)
EvaporatedUnevaporated
None (SiO2 only)None0.26 ± 0.0692.7 ± 3.8
Limestone (JLs-1)Ca (800)0.31 ± 0.2382.6 ± 4.5
Dolomite (JDo-1)Ca (480) and Mg (220)0.39 ± 0.1487.2 ± 3.8
Dolomite + KCa, Mg + K (500)0.28 ± 0.0793.0 ± 3.2
Dolomite + AlCa, Mg + Al (500)0.11 ± 0.0290.5 ± 2.3
Dolomite + NaCa, Mg + Na (500)22.4 ± 2.688.7 ± 4.0
Dolomite + Na, K, AlCa, Mg + Na, K, Al (500 each)12.0 ± 1.992.0 ± 1.3
Dolomite + Na, K, Al, FeCa, Mg + Na, K, Al, Fe (500 each)13.9 ± 4.691.2 ± 3.3
Table 4. Effect of the NaCl matrix on the stability of silicon in soil and rock digestates. Mean silicon concentration (n = 3) is around 1500 µg/mL (0.054 mole/L) for SRM 2709 and 1270 µg/mL (0.045 mole/L) for SRM 2780a in 10 mL solution for a sample size of about 50 mg.
SampleSilicon Recovery (%)
Digested without NaCl MatrixDigested with 0.1 g NaCl Matrix
EvaporatedUnevaporatedEvaporated Unevaporated
SRM 2709
San Joaquin Soil
0.03 ± 0.00490.9 ± 1.778.3 ± 9.6102 ± 3.7
SRM 2780a
Hard Rock
Mine Waste
0.06 ± 0.0598.8 ± 3.982.6 ± 9.996.5 ± 6.4
Table 5. Silicon concentrations (µg/g) measured in HF digestates of plant certified reference materials by ICP-MS. Values are mean ± standard deviation of four replicate analyses (n = 4).
SampleThis StudyLiterature
Internal
Standard
KED
Mode
Standard ModeReported ValueTechniqueReference
SRM 1573a
Tomato Leaves
74Ge2966 ± 1582391 ± 1363120 ± 106EINAA[22]
103Rh3111 ± 1792541 ± 137
SRM 1575
Pine Needles
74Ge1758 ± 2831550 ± 2011630 ± 37EINAA[22]
1310 ± 200XRF[20]
103Rh1813 ± 3081576 ± 2151300 ± 200EINAA[20]
1410 ± 139Colorimetry[18]
SRM 1547
Peach Leaves
74Ge950 ± 198750 ± 1361067 ± 20EINAA[22]
103Rh1012 ± 216792 ± 1452160 ± 293Colorimetry[18]
SRM 1572
Citrus Leaves
74Ge2346 ± 1981855 ± 2331900 ± 400XRF[20]
103Rh2495 ± 1731957 ± 2222100 ± 400EINAA[20]
SRM 1572
Citrus Leaves *
74Ge2120 ± 7531680 ± 4031900 ± 400XRF[20]
103Rh2283 ± 8001803 ± 4252100 ± 400EINAA[20]
* Digestion was performed with HNO3 + HCl + HClO4 + HF.
Table 6. Silicon concentrations (µg/g) determined in HF digestates of tissue certified reference materials by ICP-MS. Values are mean ± standard deviation of four replicate analyses (n = 4).
Tissue SRM/CRMThis StudyLiterature
Internal
Standard
KED
Mode
Standard
Mode
Reported ValueTechniqueReference
SRM 1566b
Oyster Tissue
74Ge1014 ± 23769 ± 441110 ± 71
1100 ± 20
1300 ± 10
ICP-OES
ICP-MS
ICP-OES
[28]
[30]
[30]
103Rh1054 ± 22796 ± 37
SRM 1577b Bovine Liver 74Ge13.9 ± 4.613.5 ± 4.5BDL, nd
2.1 ± 0.3
5.6 ± 0.5
3.9 ± 0.3
4.8 ± 0.2
520 ± 260
EINAA
RNAA
ETAA
ICP-OES
ICP-OES
ICP-MS
[22]
[16]
[25]
[26]
[30]
[30]
103Rh16.4 ± 4.915.1 ± 4.9
DOLT-4 Dogfish Liver 74Ge1102 ± 217795 ± 164
103Rh1172 ± 219845 ± 167
DOLT-4 * Dogfish Liver 74Ge1062 ± 223998 ± 216
103Rh1103 ± 2221015 ± 188
TORT-1 * Lobster Hepatopancreas 74Ge258 ± 70218 ± 62252 ± 13
1250 ± 866
ICP-OES
ICP-MS
[30]
[30]
103Rh267 ± 65221± 56
DOLT-3 Dogfish Liver *74Ge154 ± 17151 ± 13
103Rh162 ± 18159 ± 16
* Digestion was performed with HNO3 + HCl + HClO4 + HF. BDL = below detection limit; nd = not detected.
Table 7. Silicon concentration in lung tissue samples obtained from healthy control, coal miners (n = 6), and military deployers (n = 3). Concentrations (µg/mL) are for tissue volume and are shown as mean ± standard deviation. Values in parenthesis are concentration ranges.
Lung Tissue SourceTissue Silicon Concentration (µg/mL)
Soluble Silicon
(H2O2 Extract)
Insoluble Silicon
(Particulate Matter)
Control (n = 1)256387
Coal miners (n = 6)309 ± 102
(207–437)
1417 ± 1090
(482–1497)
Military deployers (n = 3)724 ± 289
(413–983)
2077 ± 1084
(1355–3323)
Disclaimer/Publisher’s Note: The statements, opinions and data contained in all publications are solely those of the individual author(s) and contributor(s) and not of MDPI and/or the editor(s). MDPI and/or the editor(s) disclaim responsibility for any injury to people or property resulting from any ideas, methods, instructions or products referred to in the content.

