Article

Linear Correlations of Gibbs Free Energy of REE Phosphates (Monazite, Xenotime, and Rhabdophane) and Internally Consistent Binary Mixing Properties

1
Department of Earth and Atmospheric Sciences, Indiana University, Bloomington, IN 47405, USA
2
New Mexico Bureau of Geology and Mineral Resources, New Mexico Institute of Mining and Technology, Socorro, NM 87801, USA
3
Department of Earth and Environmental Science, New Mexico Institute of Mining and Technology, Socorro, NM 87801, USA
4
Los Alamos National Laboratory, Earth and Environmental Sciences Division, Los Alamos, NM 87545, USA
*
Authors to whom correspondence should be addressed.
Minerals 2024, 14(3), 305; https://doi.org/10.3390/min14030305
Submission received: 20 February 2024 / Revised: 7 March 2024 / Accepted: 13 March 2024 / Published: 14 March 2024
(This article belongs to the Section Mineral Geochemistry and Geochronology)

Abstract

:
Rare Earth Elements (REE) phosphates (monazite, xenotime, and rhabdophane) are critical REE-bearing minerals typically formed in hydrothermal and magmatic ore deposits. The thermodynamic properties of those REE minerals are crucial to understanding the solubility, speciation, and transport of REE complexes. However, the standard-state Gibbs free energy of formation (∆G°f) values reported for these minerals in the literature vary by up to 25 kJ mol−1. Here, we present linear free energy relationships that allow the evaluation and estimation of the ∆G°f values at 25 °C and 1 bar for the three minerals from the ionic radius (rREE3+) and the non-solvation Gibbs free energy contribution to the REE3+ aqua ion (∆G°n, REE3+): ∆G°f,monazite − 399.71 rREE3+ = 1.0059 ∆G°n,REE3+ − 2522.51; ∆G°f,xenotime − 344.08 rREE3+ = 0.9909 ∆G°n,REE3+ − 2451.53; and ∆G°f,rhabdophane − 416.17 rREE3+ = 1.0067 ∆G°n, REE3+ − 2688.86. Moreover, based on the new dataset derived for REE end-members, we re-fitted the binary Margules parameter (W) from previous theoretical calculations into linear correlations: W + 0.00204 ∆G°n,monazite = 39.3549 ∆V + 0.0641; W + 0.00255 ∆G°n,xenotime = 25.4885 ∆V − 0.0062. The internally consistent thermodynamic properties of these REE phosphates are incorporated into the computer program Supcrtbl, which is available online at Zhu’s research website.

1. Introduction

Rare Earth Elements (REE) are critical metals used for renewable energy, and they are essential for developing a green economy [1,2]. REE phosphates (e.g., monazite, xenotime, and rhabdophane) are some of the most common REE-bearing minerals typically formed in hydrothermal and magmatic ore deposits under crustal conditions, but their production and distribution on the Earth’s surface are scarce and unequal [3,4,5,6]. Accurate thermodynamic properties of those REE phosphate minerals will enhance our understanding of the geological and chemical processes related to the formation of these REE minerals [7,8,9,10,11,12,13], including the exploration, extraction, processing, and recycling processes involved. Gibbs free energies of formation (∆G°f) are key thermodynamic parameters for REE mineral end-members. These parameters determine the REE species solubilities, transfer mechanism and precipitation in hydrothermal fluids, fluid–rock interaction process, and mineral chemical processing [7,8,14]. However, ∆G°f values retrieved from different sources vary greatly, with the ranges typically > ±20–40 kJ mol−1 [8,11,13,15,16,17,18,19,20]. Figure 1 shows the ranges of standard-state ∆G°f for monazite–(La) and xenotime–(Er) end-members, which vary by up to 24 kJ mol−1.
Linear correlation of the ∆G°f values of minerals in an isostructural family may be a way of evaluating the internal consistency of ∆G°f values of the end-members. Sverjensky and Molling [21] pioneered an empirical linear free energy correlation for crystalline solids within the same structure families as follows:
Δ G f , MX o β MX r M 2 + = a MX Δ G n , M 2 + o + b MX
where ∆G°f,MX refers to the standard-state Gibbs free energy of formation for the solid MX. rM2+ represents the Shannon–Prewitt ionic radii [22] of M2+ in a given coordination state, and ∆G°n,M2+ represents the non-solvation contribution to the Gibbs free energy of formation of the aqueous M2+ ion. The parameters aMX, bMX, and βMX are regression parameters for the isostructural family of minerals. A list of symbols and definitions is provided in Table 1. This correlation equation is similar to the Hammett relationship for reactions in organic compounds [23]. This linear correlation has been successfully applied to other isostructural families, including carbonate, pyrochlore, zirconolite, and uranate (MUO4) minerals [24,25,26,27,28]. Wang and Xu [27] applied this correlation equation to study the metal partitioning between carbonate minerals and aqueous solutions. Zhu [29] used a similar linear correlation to estimate the surface precipitation constants for the sorption of divalent metals onto hydrous ferric oxide and calcite.
Linear correlations can also be applied to estimate the mixing properties of binary solid solutions between end-members in isostructural mineral families. This is because, for isovalent substitutions in solids, deviations from the ideal mixing phase are caused by both the differences in the ionic radii of the substituting ions and the intrinsic ionic characteristics, such as electronegativity, electron configuration, and the ion polarity [30,31,32]. This correlation provides a method to estimate the binary mixing properties for which no experimental measurements are available. Zhu [32] used a similar linear correlation to predict the binary mixing properties in the barite isostructural family:
W β ( Δ G n ,   M 2 + ο Δ G n ,   T 2 + ο ) = a Δ V + b
where W denotes the Margules parameter, ∆V denotes the volume mismatch term, and ∆G°n denotes the non-solvation contribution to the standard partial molal Gibbs free energy of formation for the aqueous ions [33]. The parameters a, b, and β are regressed from the experimental Margules parameters. It provides a method to estimate or evaluate the binary mixing properties between the monazite and xenotime end-members for those end-members for which there are no or limited experimental data.
Monazite (LREEPO4; LREE: La to Gd), xenotime (HREEPO4; Tb to Lu, plus Y), and rhabdophane (LREEPO4·0.667H2O; LREE: La to Gd) are major REE phosphates, mainly formed in hydrothermal fluids at crustal conditions (Figure 2). Each of the three solid phases has its isostructural family with a very similar REE3+ crystallographic radius decreasing from La3+ to Gd3+ for monazite and rhabdophane end-members and from Tb3+ to Lu3+ for xenotime end-members. However, even though the thermodynamic properties (e.g., ∆G°f, ∆H°f, and S°) of REE minerals have been experimentally determined (e.g., via calorimetry, solubility experiments, etc.), the reported thermodynamic properties vary greatly [8,11,13,15,16,18]. For this study, our objectives are to test if the linear relationships in Sverjensky and Molling [21] and Zhu [32] are applicable to the experimentally derived ∆G°f values and W interaction parameters of the trivalent REE phosphates (monazite, xenotime, and rhabdophane) end-members and their binaries, as well as to recommend a set of internally consistent thermodynamic databases for REE phosphate end-members and end-member binaries after the careful evaluation of their internal consistency.

2. Mathematical Formulation

2.1. Linear Free Energy Correlation

In this study, we applied the linear free energy correlation for isostructural families with divalent metals in Sverjensky and Molling [21] to the REE phosphate (monazite, xenotime, and rhabdophane) end-members, which individually share the same isostructural crystal structure with trivalent cations. In this study, we replaced the chemical formulas of MX in Equation (1) with REEPO4 or REEPO4·0.667H2O, M2+ with REE3+, and X2− with PO43− or PO43−·0.667H2O, respectively, to examine its application in trivalent isostructural families of solids. We followed the procedure in Sverjensky and Molling [21] to derive the linear correlations of the ∆G°f values of the isostructural REE phosphate families.
The non-solvation contribution to the Gibbs free energy of formation of the aqueous REE3+ ions (∆G°n,REE3+) was calculated as follows:
Δ G n , REE 3 + o = Δ G f , REE 3 + o Δ G s , REE 3 + o
where ∆G°s,REE3+ refers to the solvation contribution to the Gibbs free energy of formation of the aqueous REE3+ ions (∆G°f,REE3+). ∆G°s,REE3+ can be calculated using the following equation:
Δ G s , REE 3 + o = ω REE 3 + ( 1 ε 1 )
where ωREE3+ denotes the conventional Born solvation coefficient for the aqueous ion REE3+ and ε refers to the dielectric constant of water, which is 78.47 at 25 °C and 1 bar [37]. The value of ωREE3+ can be calculated using the following equation:
ω REE 3 + = ω REE 3 + a b s Z ω H + a b s
where ωabsH+ equals 2.254 × 10⁵ J mol−1 [38]; ωabsREE3+ refers to the absolute Born coefficient of the aqueous REE3+ ion, which can be further derived using the following equation:
ω REE 3 + a b s = ( 6.94657 × 10 5 ) Z 2 / ( r e ,   REE 3 + )
where re,REE3+ denotes the effective electrostatic radius of the aqueous REE3+ ion, which can be obtained using the following equation:
r e ,   REE 3 + = r REE 3 + + Z ( 0.94 )
where rREE3+ refers to the crystallographic radius of the REE3+ ion, which represents its Shannon–Prewitt radius (Å) [39] (Table 2). Z in Equations (5)–(7) represents the charge of the REE3+ ion, which is +3 for trivalent ions.
The above equations were used to calculate values of ∆G°n (Table 2) for the 16 trivalent aqueous REE3+ cations. To present more clearly its linear correlations for ∆G°f,REEPO4, ∆G°n,REE3+, and rREE3+, we expressed the equation as shown below and plotted the left-hand sides of Equations (8) and (9) against the aqueous cation parameter ∆G°n,REE3+ as follows:
Δ G f = a REEPO 4 Δ G n , REE 3 + o + b REEPO 4
Δ G f = Δ G f , REEPO 4 o β REEPO 4 r REE 3 +
where REEPO4 refers to the isostructural family of monazite, xenotime, and rhabdophane solids. The other parameters in the equations have been introduced in Equation (1).

2.2. Linear Correlation between Mixing Binaries

For a solid solution with isovalent substitutions, we used a regular solid-solution model for symmetrical binary. Zhu [32] defined the excess interaction parameter (W) of a symmetrical binary regular solid solution as follows:
W e x c e s s   = W e l a s t i c e x c e s s + W i o n i c e x c e s s
The W e l a s t i c e x c e s s term describes differences in the sizes of substituting ions, and the   W i o n i c e x c e s s term describes differences in the ionic bonding properties.
The effects of the differences in ionic radii have been described via elastic theory [42]. For a solid solution (C, T)α, the strain energy for one mole of a component Tα into an infinite elastic continuum of component Cα was described by Ganguly and Saxena [30] as follows:
ω T = 2 3 μ C α C C α ( V T α o V C α o ) 2 V T α o
where μ is the shear modulus of Cα, and C is defined as follows:
C C α = 3 ψ T α 3 ψ T α + 4 μ C α
where ψ denotes the effective bulk modulus of Tα in the solid solution and V° denotes the molar volume of end-member components.
Based on this principle, a correlation that considers both size/volume misfit and the ionic bonding differences in substituting ions is presented below:
W = a   Δ V + b
where W′ is the adjusted Margules parameter determined by subtracting the contribution from ionic bonding. The volume mismatch term, ∆V, is defined by Ganguly and Saxena [30] and Greenwood [42] as follows:
Δ V     ( V o T P O 4 V o C P O 4 ) 2 V o T P O 4
W’ is defined as follows:
W   W β   Δ G n , C 3 + o Δ G n , T 3 + o
where ∆G°n denotes the non-solvation contribution to the ∆G°f values for the aqueous ions [33]. β is an empirically derived parameter.
The adjustment of W to W′ in Equation (15) is performed to exclude the effect of ionic properties caused by the internal bonding characteristics during ionic substitution, and only the remaining energy change caused by volume/size mismatch is shown on the right-hand side of the Equation (13) [32]. The parameters a, b, and β for the binary solid solutions in the REE phosphate isostructural families can be obtained via linear regression.

3. Data Availability and Formatting

Values of REE3+ crystallographic radii r, ∆G°n non-solvation contributions to the ∆G°f values of the aqueous REE3+ ions, and ∆G°f values of the monazite, xenotime, and rhabdophane end-members are needed to conduct the regression of the Gibbs free energy linear correlation. ∆G°n values were derived from Equations (3)–(7), and their values are provided in Table 2.

3.1. Aqueous REE3+ Ion Parameters

Rare Earth Elements occur naturally in the trivalent form except for Eu and Ce, which also can be divalent (Eu) and tetravalent (Ce), respectively. The crystallographic radius of the REE3+ ions must be accounted for when dealing with the regression of the linear free energy correlations. The REE3+ ions in monazite, xenotime, and rhabdophane have 9-, 8-, and 9-fold coordination numbers, respectively [34,43], and their REE3+ crystallographic radii vary with the numbers of their coordination state. In this study, the REE3+ crystallographic radii (rREE3+) at different coordination numbers are derived from Shannon [22]. The ∆G°f values of the aqueous REE3+ ions are derived directly from Shock and Helgeson [38].

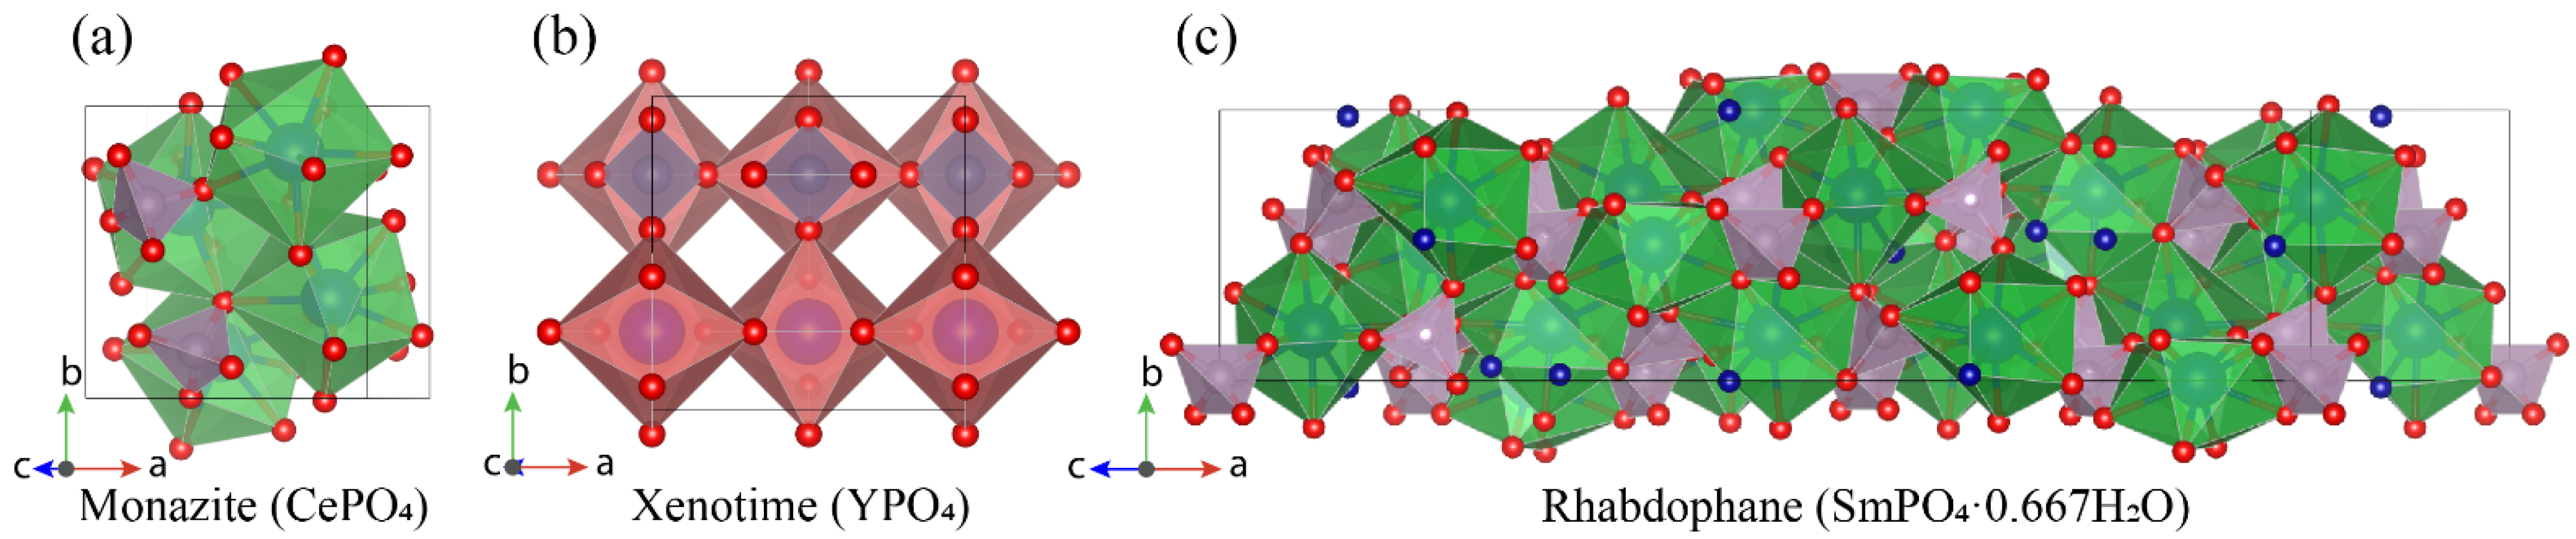
3.2. REE Phosphate (Monazite, Xenotime, and Rhabdophane) Parameters

Monazite, xenotime, and rhabdophane show slightly different crystal structures due to different atomic sizes and water contents. Monazite and xenotime end-members exhibit a monoclinic structure and a tetragonal structure, respectively [34]. Rhabdophane end-members not only exhibit a monoclinic structure [35] but also crystallize in a hexagonal structure, as reported by Mesbah et al. [43]. The molar volumes for the end-members of monazite and xenotime were calculated from the unit cell parameters, as listed in Table 2 [34,41]. The molar volumes of hypothetical end-members (e.g., monazite PmPO4 and TbPO4, xenotime GdPO4) were calculated from the correlation of the monazite and xenotime isostructural families, derived from the regressed correlations in Ni et al. [34] by adding the volume data of monazite–(Tb) from Ushakov et al. [41]. The molar volume of the hypothetical end-members will be used to calculate the Margules parameters between the LREE and HREE phosphate end-members. The calculated correlations are as follows:
V m o n a z i t e o 1 / 3 = 0.9765   r REE 3 + + 2.3934   ( R 2 = 0.9981 )
V x e n o t i m e o 1 / 3 = 1.1591   r REE 3 + + 2.3234   ( R 2 = 0.9968 )
where r is the Shannon–Prewitt crystallographic radius with 9- and 8-coordination for monazite and xenotime, respectively [22]. The correlations for these ionic radii (r) and volume term (V°1/3) are excellent (R2 > 0.995).
The ∆G°f values of the monazite and xenotime end-members for regression analysis were sourced from Migdisov et al. [8], who derived these values from the solubility data (log Ksp at 25 °C) of REE phosphates reported in Liu and Byrne [40]. We adopted the ∆G°f values of the rhabdophane end-members from Gausse et al. [9], which were calculated via the ideal formula of LREEPO4·0.667H2O. The ∆G°f values from other review studies [13,15,16] were also included in the discussion for comparison with the results obtained via the linear correlation study.

3.3. Available Margules Parameters for REE Phosphate End-Member Binaries

Currently, only a few experimental calorimetric measurements have been obtained for the Margules parameters of REE phosphate end-member binaries. These measured Margules parameters are the LaPO4 paired with NdPO4, EuPO4, and GdPO4 [44]; LaPO4 paired with EuPO4 and GdPO4 from Neumeier et al. [45], and the binary of ErPO4-YbPO4 from Strzelecki et al. [46]. The values of those Margules parameters of end-member binaries measured via calorimetric experiments differ greatly, and currently, there are only three existing end-member binaries in the literature for the monazite family [44]. Therefore, there are not enough calorimetric experimental data to build the linear correlations.
Nevertheless, a number of theoretical calculations have been conducted in the monazite and xenotime families based on experimentally measured Young’s moduli and the molar volumes of the end-members [7,47,48,49,50]. The Margules parameters for monazite from Kowalski and Li [48] were calculated from the excess thermodynamic properties and the elastic moduli for a series of monazite end-members based on the ab initio quantum chemistry. This dataset (Table 1 in Kowalski and Li [48]) is the most systematic and covers all monazite end-member binaries, and it was reviewed by Migdisov et al. [7]. Therefore, we used the result of Kowalski and Li [48] to perform the linear Margules parameter correlation. For the xenotime family, Migdisov et al. [7] reassessed the correlations between the elastic constants (Ex) and ionic radii rx in the xenotime family using available elastic constants data from the literature and generated an Exrx function for xenotime: Ex = 1320.4 (±179.6) − −1142.8 (±178.0)·rx. Furthermore, the study determined the Wx values (Table 3 in Migdisov et al. [7]) of all xenotime end-member binaries using the equation of W = E/(dV2/6V) derived by Kowalski and Li [48], where E is the average Young’s modulus and dV is the mismatch of the cell volume values (namely V°TPO4V°CPO4). Since the parameters E and V represent the average values of the Young’s modulus and molar volume of monazite and xenotime, and their values are constant, the W equation can be further simplified as follows:
W = a · d V 2
where a is a fitted constant, equivalent to E/6V in an isostructural family of minerals.

4. Results

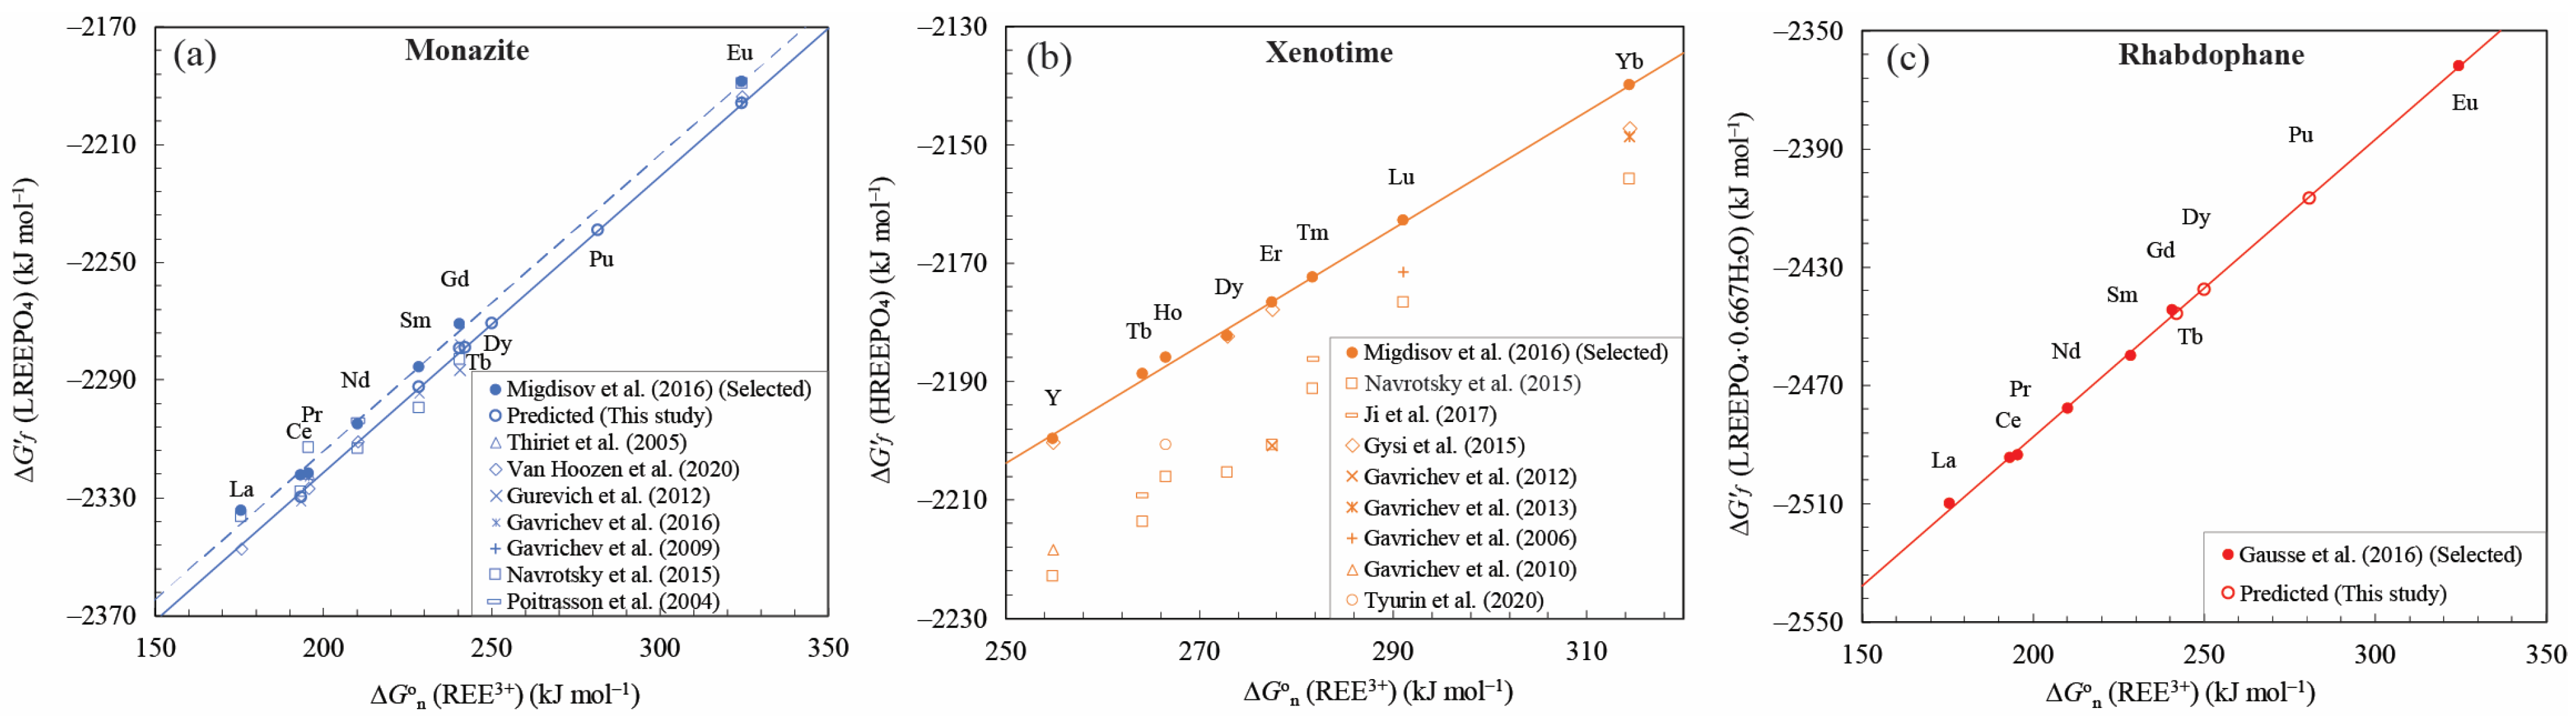
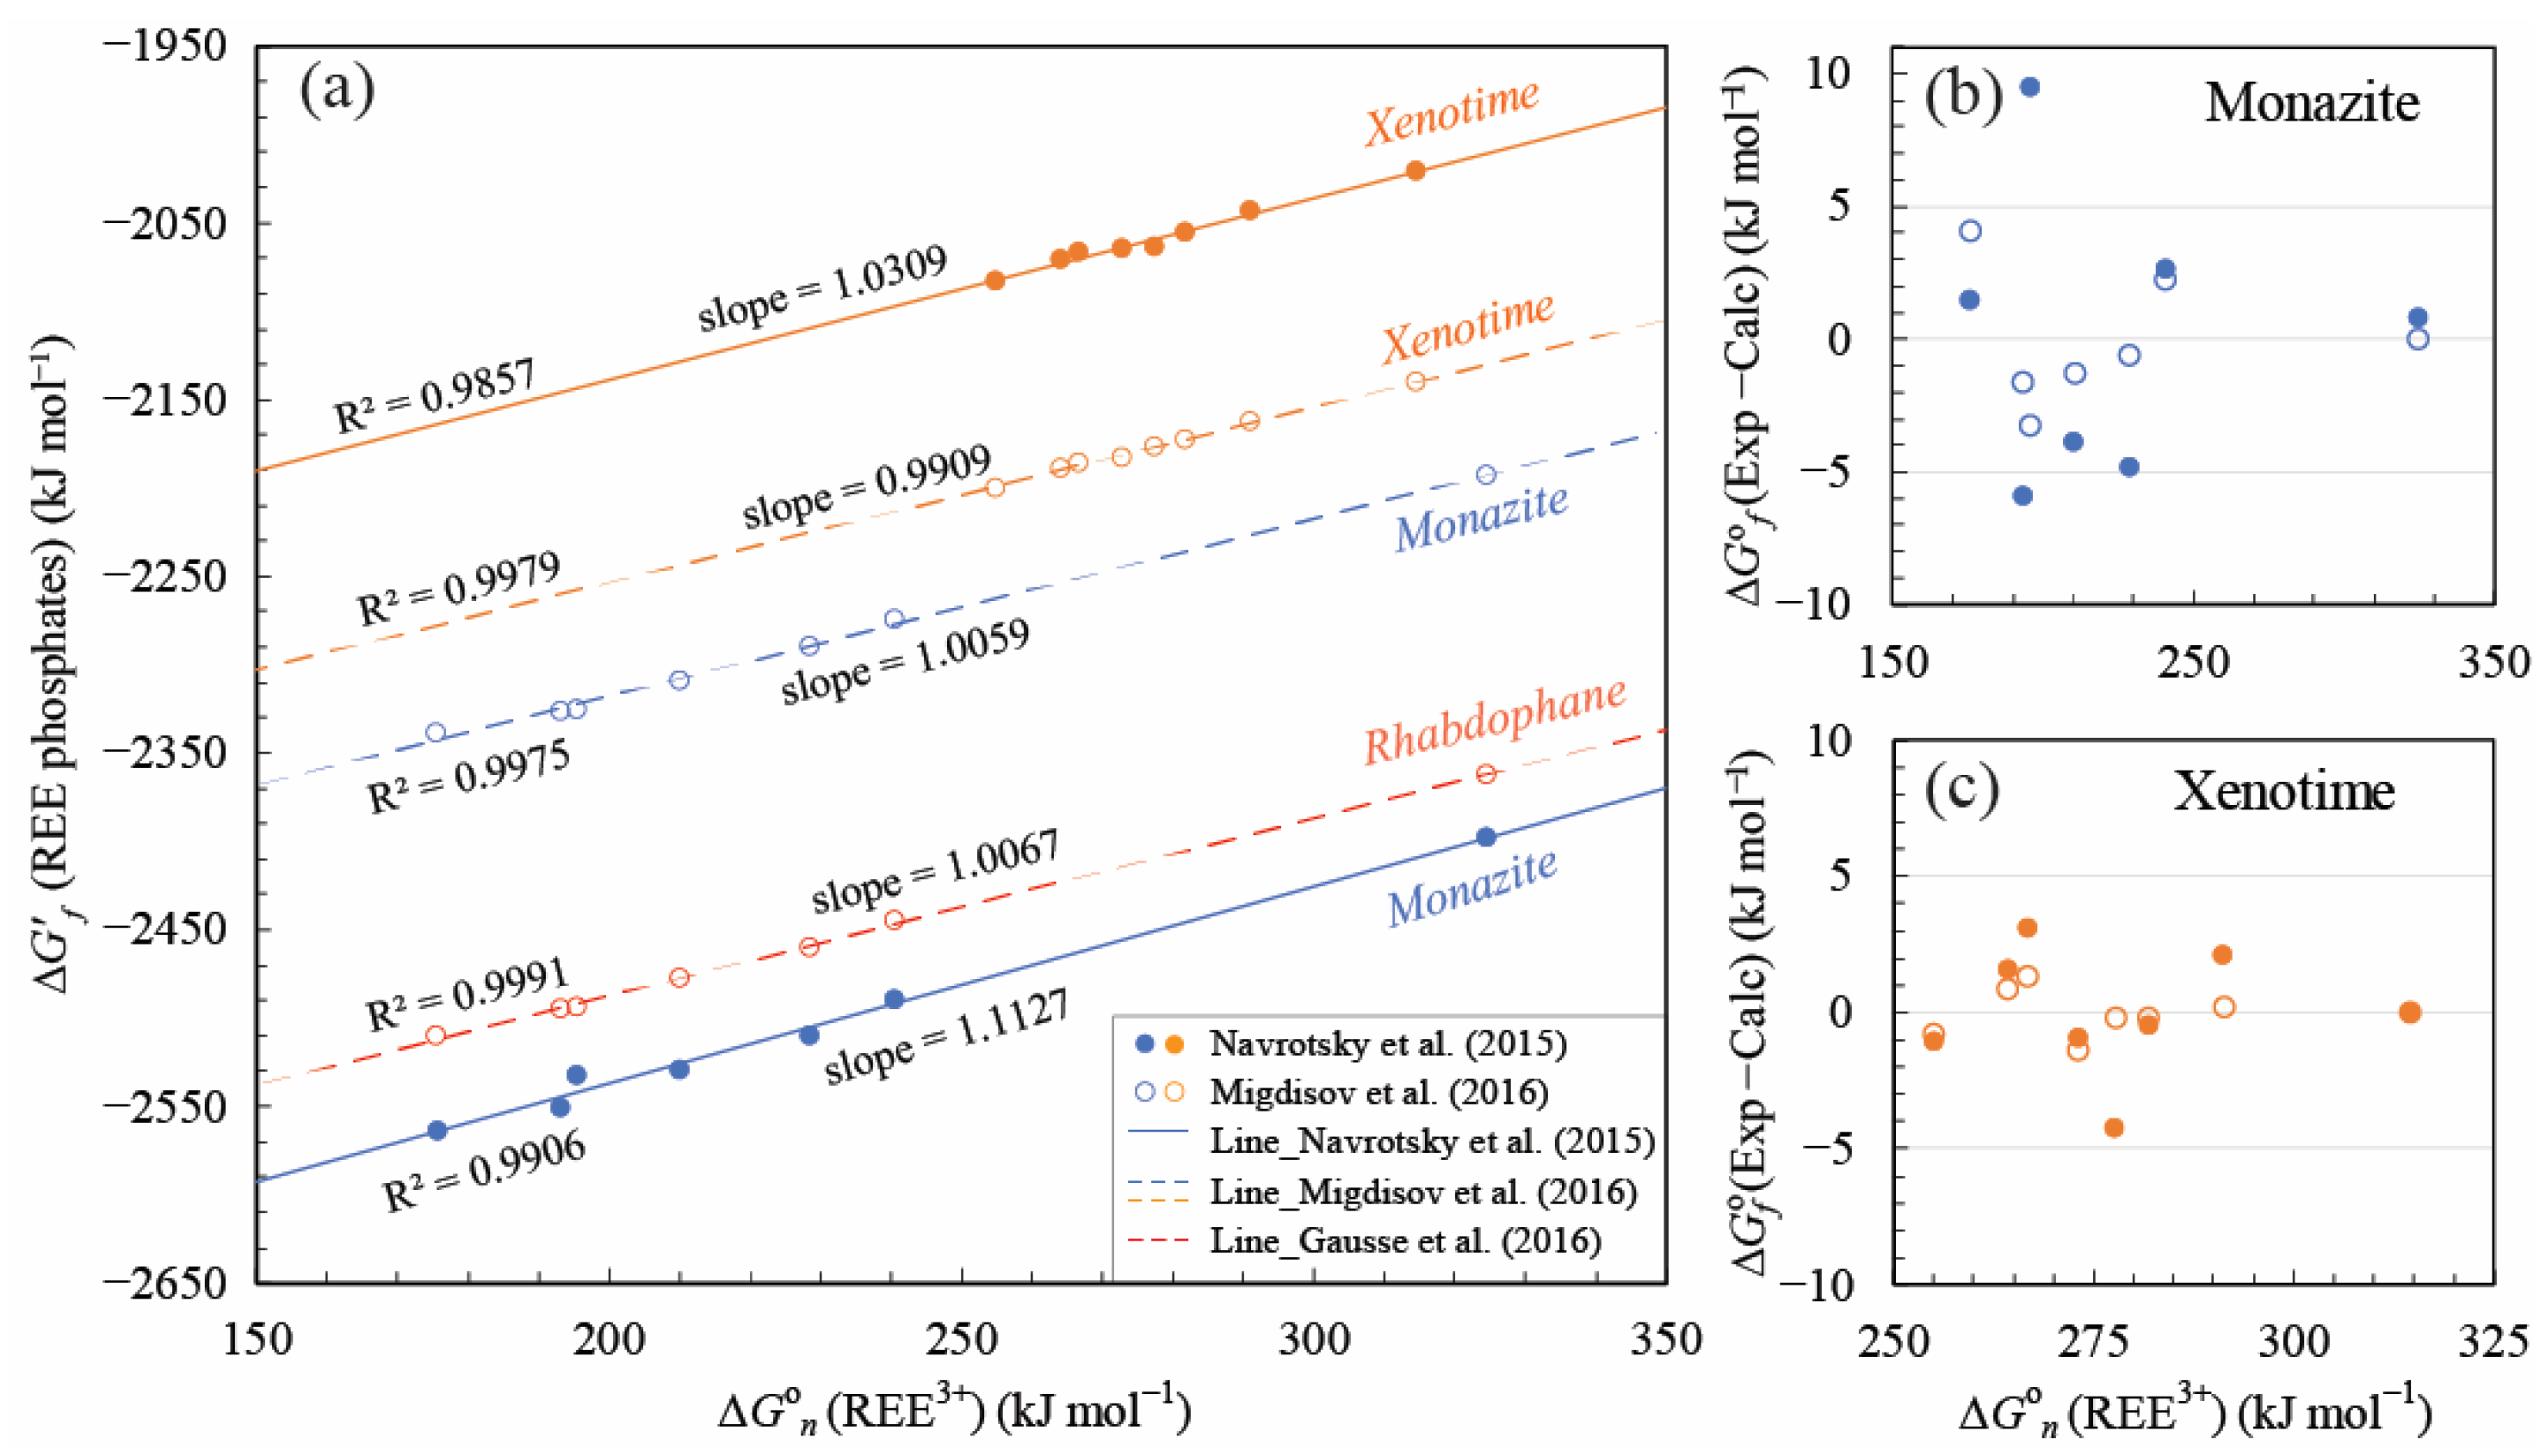
4.1. Linear Free Energy Relationships for REE Phosphates and Aqueous Ions

The free energies of the REE phosphates belonging to each isostructural family were regressed using Equation (8), together with values of REE3+ ionic radii and ∆G°n from Table 2. The regression results for the three isostructural families are summarized in Table 3 and plotted in Figure 3. The differences between the values retrieved from solubility experiments and calculated values from linear correlations are shown in Figure 4. The results show that the linear correlation lines of monazite, xenotime, and rhabdophane have R2 values of 0.995, 0.996, and 0.998, respectively, indicating the strong linear relationship for those selected thermodynamic parameters. The linear free energy relationships are expressed as follows:
Δ G f , m o n a z i t e o   399.71   r REE 3 + = 1.0059   G o n , REE 3 + 2515.31   o r i g i n a l
Δ G f , m o n a z i t e o 399.71   r REE 3 + = 1.0059   G o n , REE 3 + 2522.51   a d j u s t e d
Δ G f , x e n o t i m e o 344.08   r REE 3 + = 0.9909   G o n , REE 3 + 2451.53
Δ G f , r h a b d o p h a n e o 416.17   r REE 3 + = 1.0067   G o n , REE 3 + 2688.86
where the symbols have the meanings defined in Table 1. The ∆G°f values of monazite and rhabdophane–(Pu, Tb, and Dy) and the fictive end-members of monazite and xenotime were also calculated to study the substitution of LREE in a xenotime structural lattice and HREE in a monazite lattice because the latter are difficult to synthesize in the corresponding crystal structures of the host minerals.
The differences between the experimental and calculated values of the Gibbs free energies for the formation of the solids are shown in Figure 4. For 20 of the 22 data points plotted, the discrepancy between the calculated and experimentally derived Gibbs free energies is less than 2.0 kJ mol−1. The largest discrepancies are 4.1 kJ mol−1 for LaPO4 and 3.2 kJ mol−1 for PrPO4; these uncertainties are within those reported in calorimetric experiments. Figure 3 and the regressed coefficients listed in Table 3 indicate that the REE phosphates with the monazite, xenotime, and rhabdophane structures all have essentially the same slopes aREEPO4, implying that the parameter aREEPO4 in Equation (8) is constant for all polymorphs of the composition REEPO4 and its hydrous phases. The linear correlations for monazite and xenotime are generally parallel (Figure 3), which agrees with the correlations for different isostructural families with the same chemical formula [21,27,28]. The coefficient b in Equation (8) seems to only be related to the stoichiometry of solids [28]. These results indicate that the regressed linear correlations closely fit the experimentally derived ∆G°f values of isostructural families of monazite, xenotime, and rhabdophane.
As Figure 3a shows, the ∆G°f values retrieved for monazite based on the solubility data from Van Hoozen et al. [18] also generated a linear correlation. The latter is generally parallel to the linear correlation line derived from the data compiled by Migdisov et al. [8], which is based on the low-temperature solubility experiments conducted by Liu and Byrne [40]. The resulting y-axis intercept displays an average shift that is 7.2 kJ mol−1 lower than that derived from the regression of the data conducted by Migdisov et al. [8]. As the LREE phosphates form a more soluble hydrous phase (i.e., metastable rhabdophane) at room temperature, we recommend the correlations corrected based on the solubility data provided by Van Hoozen et al. [18]. In their study, the ∆G°f for monazite was extrapolated to 25 °C based on experiments conducted at elevated temperatures (100–250 °C) at which the monazite phase was stable and controlled solubility. Therefore, we adjusted the linear correlation in Equation (19) by subtracting 7.2 kJ mol−1 from the parameter b to obtain Equation (20) to represent the linear correlation of monazite.

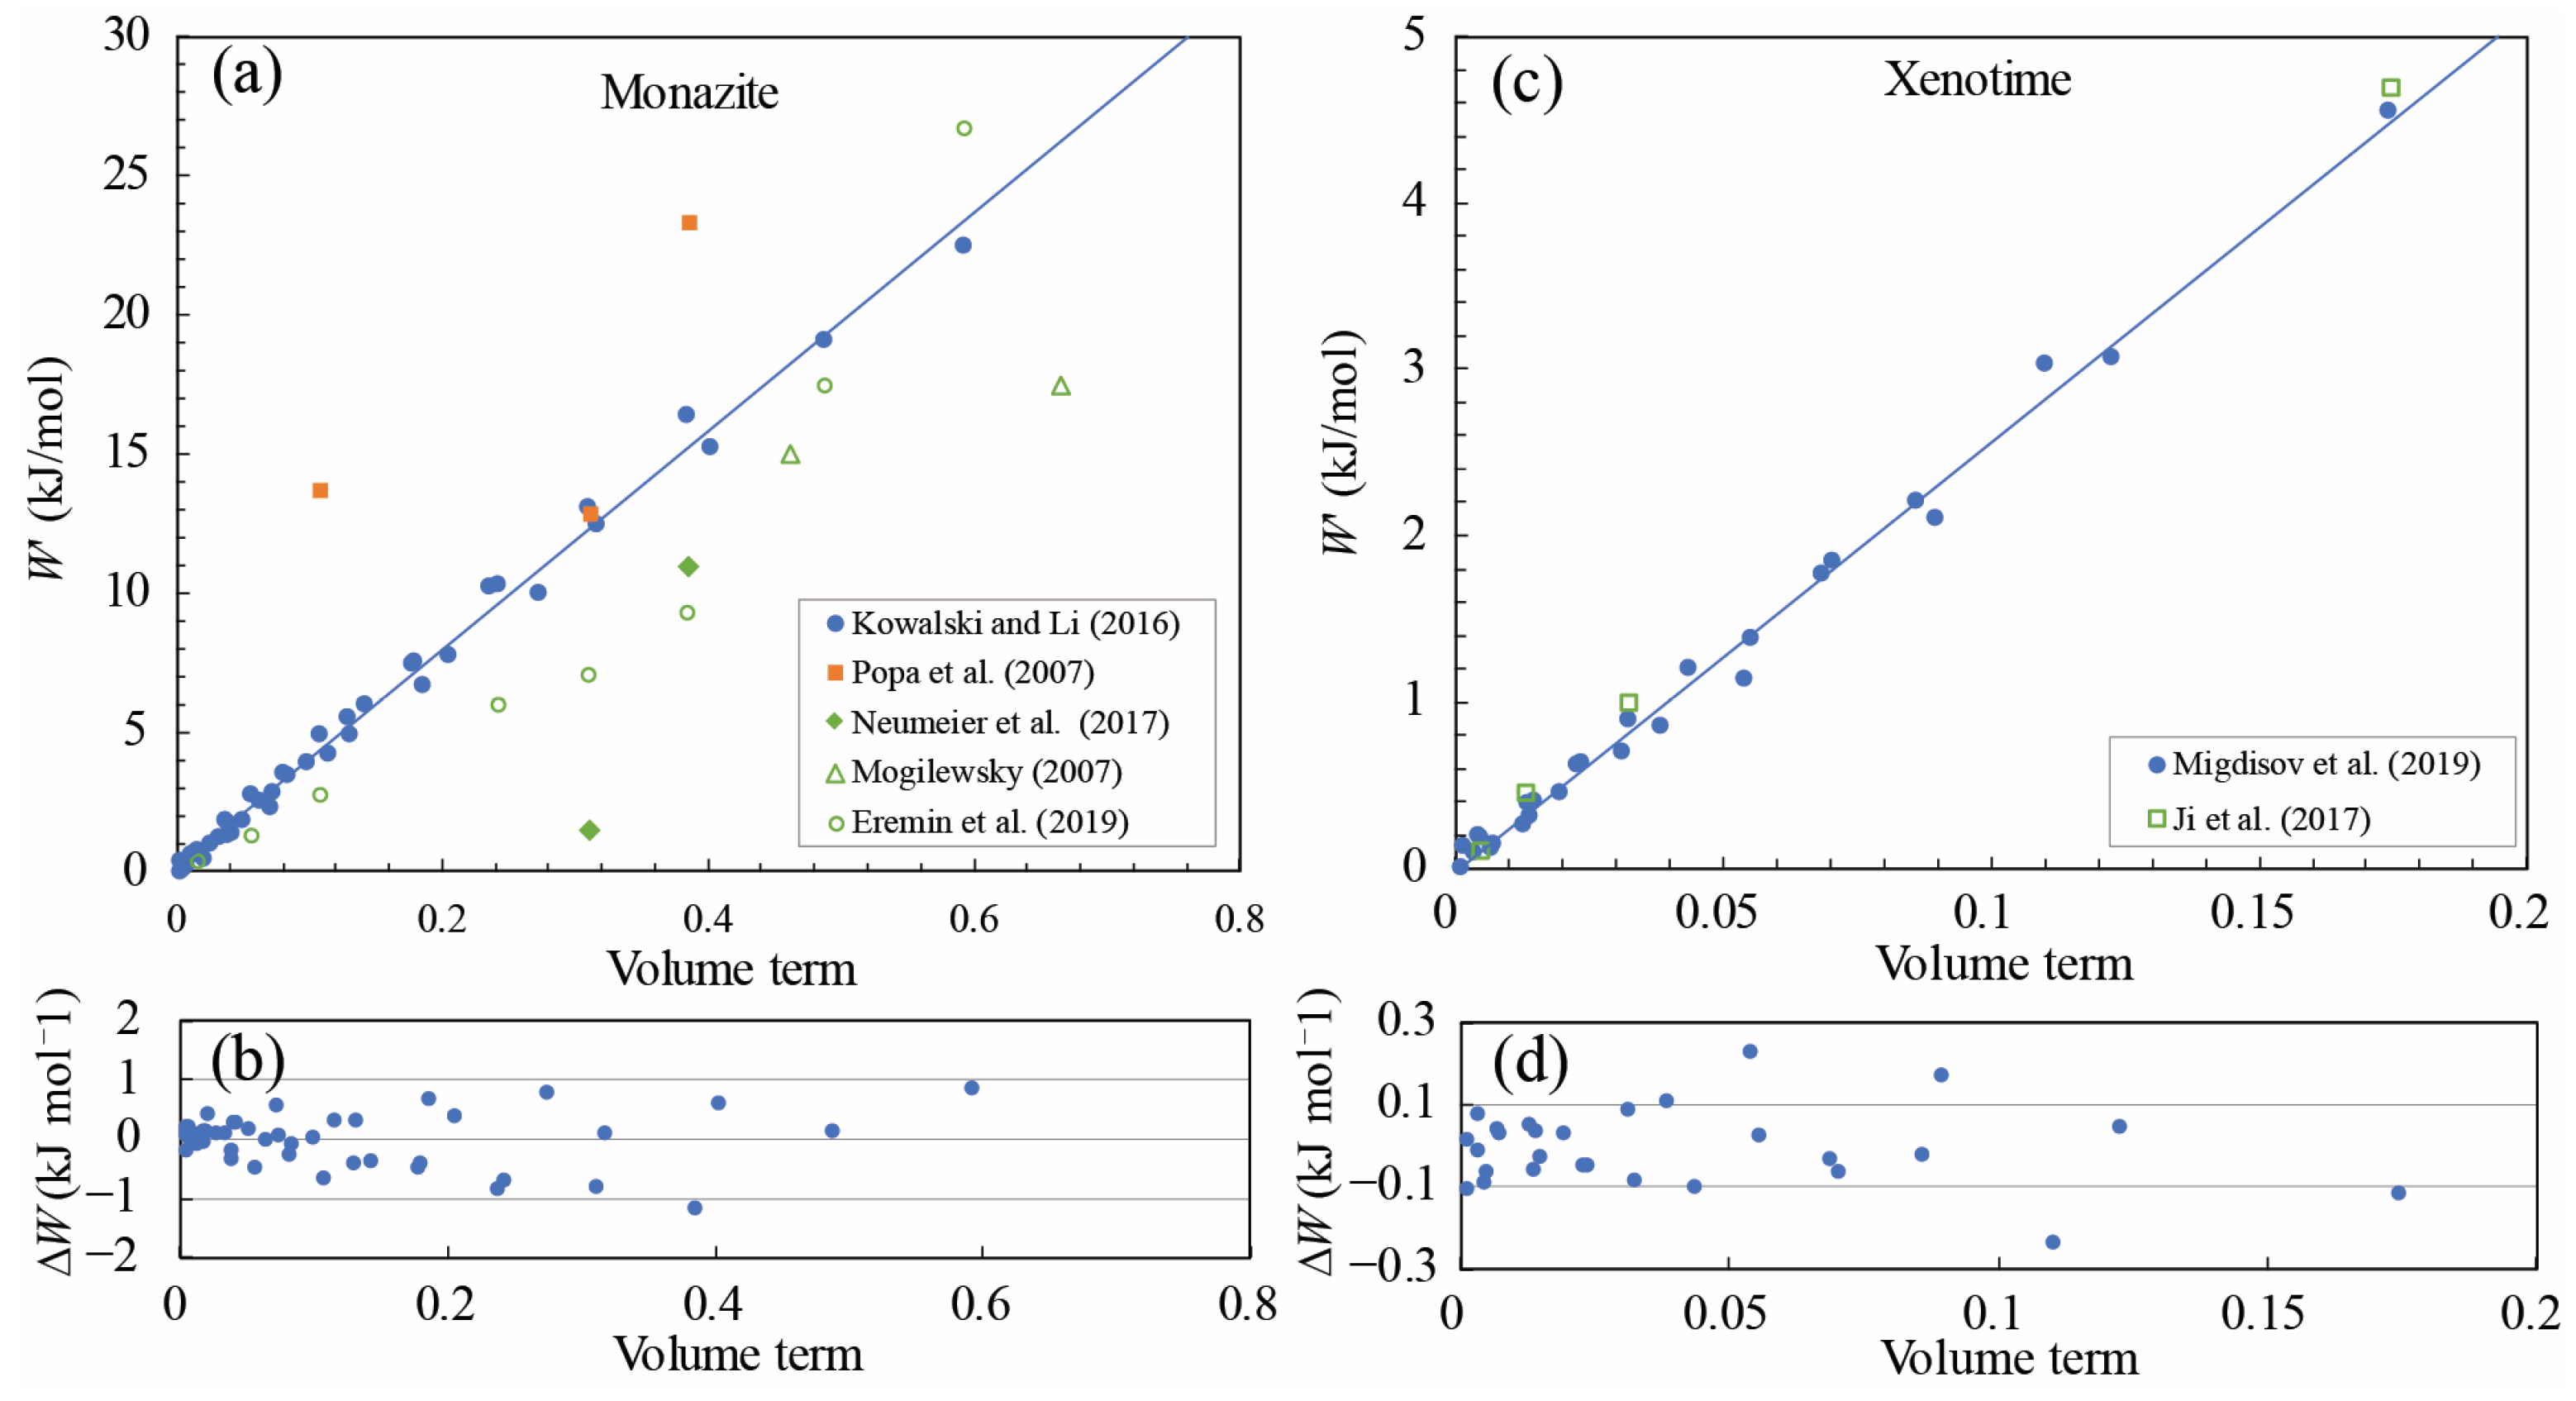
4.2. A Semi-Empirical Correlation for Margules Parameters of REE Phosphate End-Members

The parameters a, b, and β for the binary solid solutions in the monazite and xenotime isostructural families were obtained via multiple variable linear regression analysis. The W values discussed in the preceding section were used together with the ∆G°n values calculated in the first part of the mathematical formulation section. Multiple linear regression analysis following Equations (13)–(15) resulted in the following correlations. Other results for the correlation for Margules parameters can be found in Table 4.
W + 0.00204   Δ G n , C 3 + o Δ G n , T 3 + o m o n a z i t e = 39.3549   Δ V + 0.0641
W + 0.00255   Δ G n , C 3 + o Δ G n , T 3 + o x e n o t i m e = 25.4885   Δ V 0.0062
The volume mismatch term, ∆V, is expressed in Equation (14). The correlation is excellent, as R2 is > 0.99 and the intercept is close to zero (Figure 5). Theoretically, if both the ionic radii and ionicity are adequately taken into account in the regression, the intercept should be zero. This is consistent with our regression results showing that the intercepts are 0.0641 and −0.0062 for monazite and xenotime, respectively. The β values in Equations (23) and (24) are extremely small, close to zero, indicating that the contribution of ionicity properties to the whole W is very small or can even be ignored. The differences between the theoretical calculations from the literature and the results based on the correlation are within 1.0 kJ mol−1 and 0.3 kJ mol−1 for monazite and xenotime end-member binaries, respectively.
These results indicate that the W dataset (Table 5) in this study is dominated by the volume mismatch (dV) from the end-member binaries. The contribution of ∆G°n value difference, or the ionic properties, to the binary mixing interaction can be considered to be a minor factor or even be omitted.
The most common variety of monazite and xenotime mixing binary components occurring in natural systems are (CexHREE1−x)PO4 and (YxLREE1−x)PO4, respectively [61,62]. Table 5 presents a comprehensive dataset of the Margules parameters W for modeling the monazite and xenotime binary mixing solutions in natural or laboratory conditions. It is also common for REE phosphates with a monazite structure to bond certain HREE (e.g., Y) and xenotime bonding LREE (e.g., La, Ce, Pr, Nd, Sm) in a natural environment [61,63]. Therefore, in our study, we also accounted for two types of fictive phosphate end-members to model the natural occurrence. The Margules parameters W for those fictive phosphate end-member binaries are provided in Table 5.

5. Discussion

5.1. Comparisons with Previous Studies and Data Evaluation

5.1.1. Linear Correlation Calculated by Other ∆G°f Choice in the Literature

The thermodynamic properties of the monazite and xenotime end-members have been extensively investigated using multiple approaches, such as calorimetric techniques, mineral solubility, ab initio methods, etc. Navrotsky et al. [16] recommended ∆G°f values for monazite and xenotime isostructural families based on calorimetric measurements. These data also show linear correlations (Figure 6a). However, the discrepancy between the experimental ∆G°f values and correlations can reach up to 10 kJ mol−1 for monazite and up to 5 kJ mol−1 for xenotime (Figure 6b,c). In contrast to the solubility-based ∆G°f linear correlations, the linear correlations for calorimetry-based ∆G°f values are not as predictive as linear correlation based on solubility measurements.

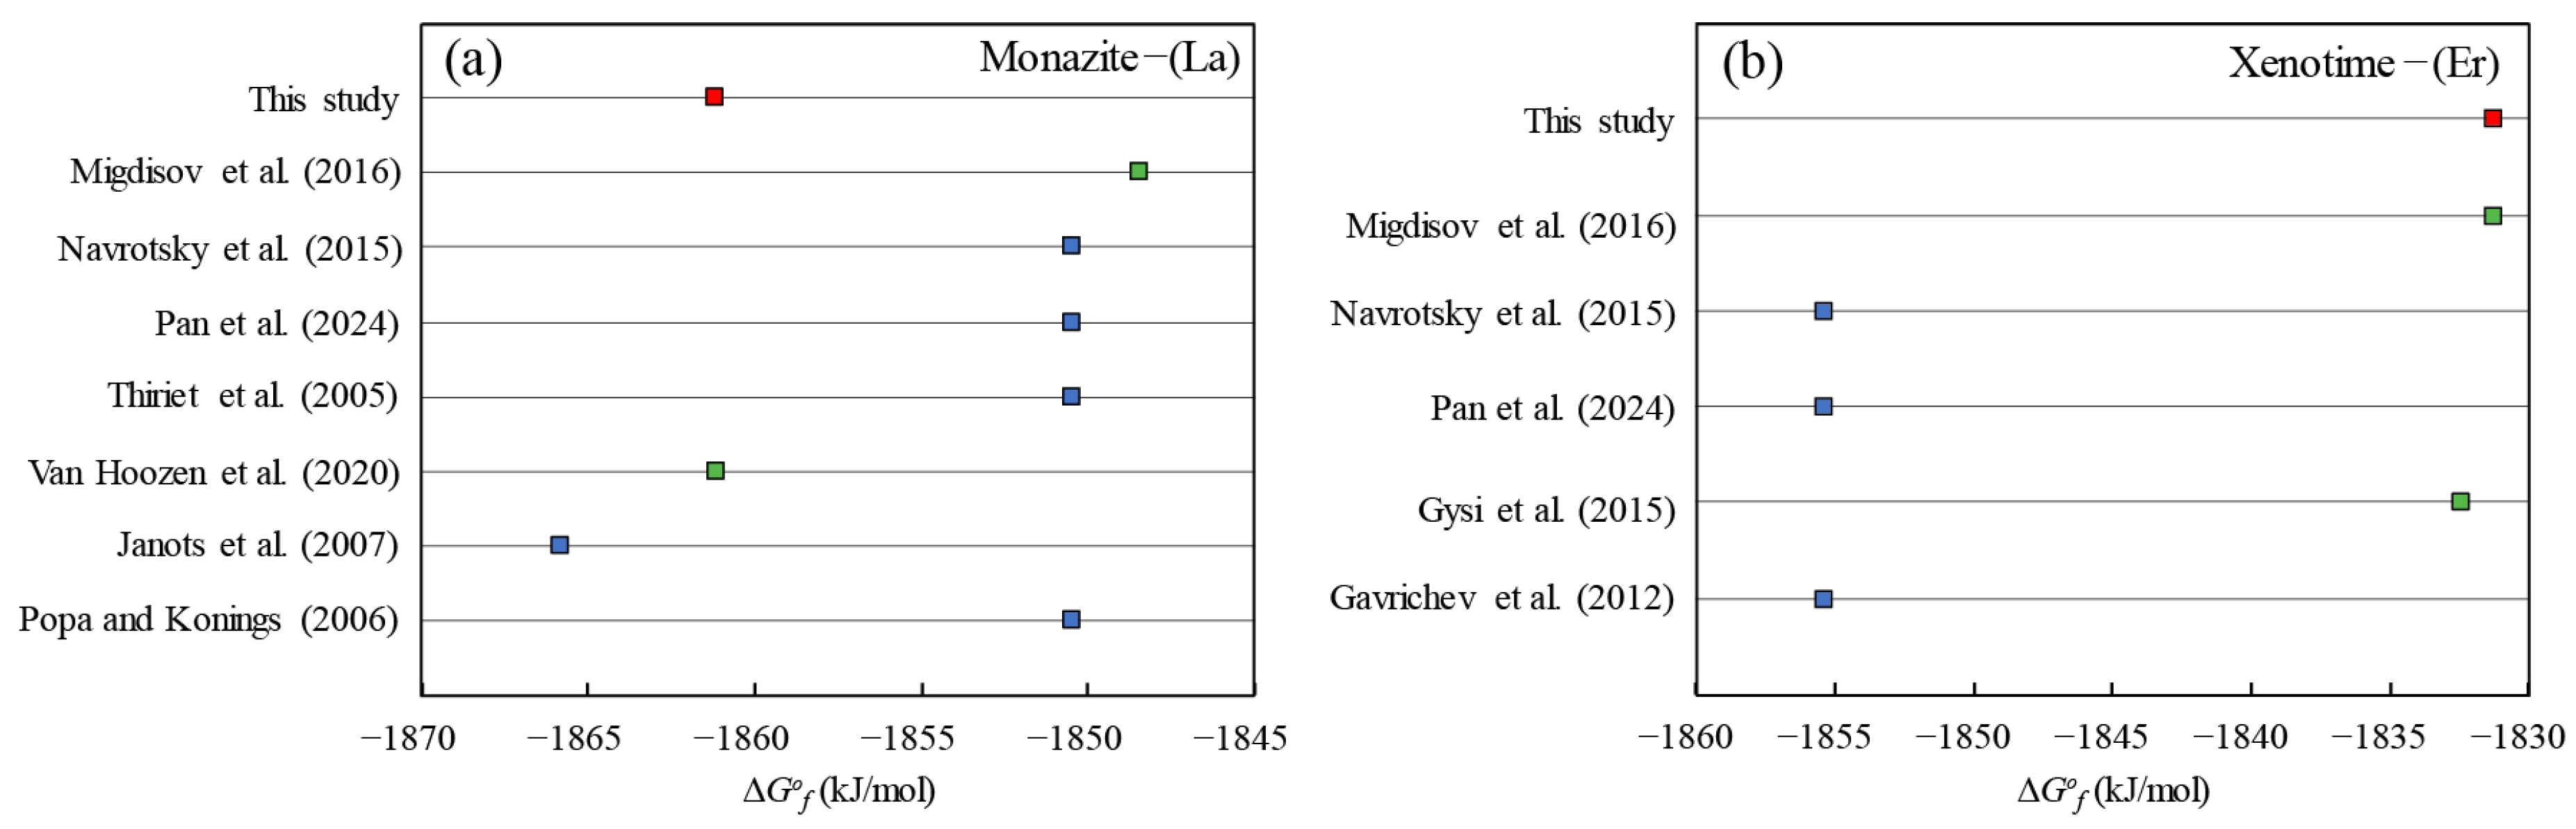
5.1.2. Comparisons of the Calculated ∆G°f Values with Other Data in the Literature

In the monazite group, the ∆G°f values used for our linear correlation calculations for monazite are sourced from Migdisov et al. [8], who derived the ∆G°f values from the solubility data reported in Liu and Byrne [40]. The LREE phosphates used in the experiments in Liu and Byrne [40] had rhabdophane components under ambient conditions. Moreover, the ∆G°f values of those LREE phosphate end-members are slightly too positive due to the higher solubility of rhabdophane, which can control the solubility of LREE phosphates at temperatures <100 °C. The ∆G°f values of monazite in Navrotsky et al. [16] were derived from the calorimetric study of Popa and Konings [15], in which the ∆H°f values were recalculated from the experimental study of Ushakov et al. [41]. Pan et al. [13] provides a set of recommended thermodynamic properties for REE phosphates and REE aqueous species, where the ∆G°f values for monazite are mainly derived from previous calorimetric studies. Van Hoozen et al. [18] provides ∆G°f values for monazite end-members at 25 °C and 1 bar by regressing solubility data derived at higher temperatures. A correction by 7.2 kJ mol−1 indicated for the regression in Figure 3a presents an option for an adjusted linear correlation that fits most of the high temperature solubility- and calorimetry-based ∆G°f values.
For xenotime, Gysi et al. [11] derived the ∆G°f values for DyPO4, YPO4, ErPO4, and YbPO4 based on hydrothermal solubility experiments. These values agree with the regression (Equation (21)) based on the data by Migdisov et al. [8] for Y, Dy, and Er but display a significant deviation for Yb (Figure 3b). The latter could be explained by a need to revise the properties of the aqueous REE3+ species instead of the mineral properties [13]. The calorimetry-based ∆G°f values from Navrotsky et al. [16] are generally parallel with the regression from Equation (21) but display discrepancies of up to 25 kJ mol−1. The ∆G°f values from Navrotsky et al. [16] were calculated from the ∆H°f values from the calorimetric data in Ushakov et al. [41], as well as the S°f (ErPO4) values from Gavrichev et al. [20] and other S°f (HREE) values from Tananaev et al. [64]. The ∆G°f values for xenotime used in the thermodynamic optimization study by Pan et al. [13] were mainly derived from the ∆H°f values from Ushakov et al. [41] and S°f (HREE) values from Gysi et al. [11], Gavrichev et al. [20], Gavrichev et al. [51], Gavrichev et al. [53], Gavrichev et al. [55], Ji et al. [58], and Tyurin et al. [59].
For rhabdophane, the ∆G°f values of rhabdophane end-members from Gausse et al. [9] are the only available data.

5.1.3. Comparisons of the Solubility Product (log Ksp) Performed in This Study using the Data in the Literature

Wang and Xu [27] found that linear correlations for Gibbs free energy of formation could be fortuitous because of the large numbers on the Y-axis. The correlations for solubility products (log Ksp), on the other hand, give a better indicator of whether the correlations are a good representation of the experimental data. For this purpose, we calculated the log Ksp values for REE phosphate (monazite, xenotime, and rhabdophane) end-members using the ∆G°f values derived from the linear correlations and the following sets of reactions:
REEPO 4 ( s ) = REE 3 + + PO 4 3
REEPO 4 0.667 H 2 O   ( s ) = REE 3 + + PO 4 3 + 0.667 H 2 O   ( a q )
K s p ( REEPO 4 / REEPO 4 0.667 H 2 O ) = Δ G r o / ( T ( K ) R Ln ( 10 ) )
where ∆G°r is the standard-state Gibbs free energy of reaction in Equations (25) or (26), T is the temperature in Kelvin, and R is the ideal gas constant, 8.314 J mol−1 K−1. The ∆G°f values for REE3+, PO43−, and H2O were taken from Shock et al. [65].
Figure 7 shows that the linear correlations still hold well for xenotime. The deviations are only 0.1 log unit.

5.2. Evaluation of Margules Parameter W and Comparisons with Previous Studies

The calculated Margules parameters W of REE phosphates and the major fictive end-member binaries are summarized in Table 5. As stated earlier, these Margules parameters were obtained by regressing a semi-empirical linear correlation of the volume mismatch term between ∆V and ∆G°n, as shown in Equations (13)−(15). The linear correlations found in this study are not new; they are similar relationships to those reported by Kowalski and Li [48] and Li et al. [49]. As different molar volumes were used in these studies, the slopes received (a in Equation (18)) are different. The W parameters used for the regression of xenotime only considered the contribution of the elastic effects [7], while our regression also considered ionic properties using the method outlined in Zhu [32]. However, the results are essentially the same, indicating that elasticity, not ionic properties, is the dominant factor. However, our W parameters are consistent with the molar volume data in Table 2.
As demonstrated previously by Glynn [66], in order to be thermodynamically stable for a solid-solution system, the interaction parameter needs to be constrained by W < 5 kJ mol−1 under ambient conditions. This is consistent with the calculated W parameter dataset for xenotime, with all W values being well below 5.0 kJ mol−1 (Table 5). This indicates the absence of any miscibility gaps for the HREE solid solutions in the xenotime group structure.
Only a few experimental calorimetric measurements have been conducted to obtain the Margules parameters W of REE phosphate end-member binaries at elevated temperatures. The Margules parameters for LaPO4 paired with NdPO4, EuPO4, and GdPO4 were measured via drop calorimetry at a temperature of 727 °C in Popa et al. [44], indicating that excess enthalpy decreases with increasing temperature. The ∆H°f values used for retrieving the Margules interaction parameters of the LaPO4 paired with EuPO4 and GdPO4 were determined via high-temperature oxide melt solution calorimetry at 700 °C [45]. The only available W value for the xenotime end-member binary measured via calorimetry experiments at up to 727 °C is the ErPO4-YbPO4 binary xenotime from Strzelecki et al. [46].

6. Conclusions and Recommendations

In summary, using the linear correlations of Gibbs free energies in isostructural families, we evaluated the internal consistency of reported Gibbs free energy values. We recommend a set of standard thermodynamic properties of monazite, xenotime, and rhabdophane at a temperature of 298.15 K and pressure of 1 bar (Table 6). To present a complete thermodynamic database that can be used to perform simulations of the minerals at elevated temperatures, we included the heat capacity and entropy in the database (Table 6), with the references presented in the table footnote.
In Table 6, for monazite, the recommended ∆G°f values for monazite–(La, Pr, and Nd) are from Van Hoozen et al. [18]. The ∆G°f values of monazite–(Ce, Sm, Eu, and Gd) were predicted from the linear correlations. The ∆G°f value for monazite–(Eu) extrapolated to room temperature from the hydrothermal solubility data by Van Hoozen et al. [18] is not used. Using the linear correlation, we predicted the ∆G°f values for fictive heavy REE end-members for the study of impurities in monazite.
For xenotime, we recommend directly using the ∆G°f values of xenotime end-members from Migdisov et al. [8] due to the excellent linear correlations and alignment with the values extrapolated to 25 °C from the solubility study by Gysi et al. [11] (Figure 3b). The ∆G°f values for xenotime–(Y) from Gysi et al. [11] are not used. These recommended ∆G°f values are significantly different from the calorimetry values. The reconciliation of these values will be addressed in future studies. For rhabdophane, there are not many measurements. We adopt the ∆G°f values from Gausse et al. [9] and predicted the ∆G°f values of rhabdophane–(Pu, Tb, and Dy).
With the recommended ∆G°f values of monazite and xenotime end-members, the recommended ΔS°f values from Navrotsky et al. [16] are used to recalculate the ΔH°f values using the Benson–Helgeson convention as follows: ΔGf = ΔHfTΔSf. The molar volume data (V°m) for monazite and xenotime are taken from Ni et al. [34]. The heat capacity function for monazite and xenotime are based on the equation below, with T in Kelvin:
C p = a + b T + c / T 2 + d / T 0.5
where a, b, c, and d are coefficients for calculating the Cp at elevated temperature. The reference for each end-member can be found in Table 6. No heat capacity functions are provided for rhabdophane in this study due to the lack of available data in the literature.
A set of Margules parameters W (Table 5) is recommended for modeling binary mixing in monazite, xenotime, and their fictive end-member-based empirical linear correlations, which were derived by refitting W parameters calculated from atomistic models. The refitting ensures the internal consistency of Margules parameters W with the free energy and volume values for the end-members and provides a means of estimating binary mixing properties that are not already calculated. The linear correlation among the theoretically calculated W parameters lends support to the linear correlations that were found empirically [33].
The recommended thermodynamic properties derived in this study (Table 6) have been incorporated into the computer program SUPCRTBL [70], which is available at https://models.earth.Indiana.edu (accessed on 13 March 2024) for calculating the thermodynamic properties of species and reactions to the temperature and pressure of interest.

Supplementary Materials

The following supporting information can be downloaded via this link: https://www.mdpi.com/article/10.3390/min14030305/s1, Table S1: Collected standard thermodynamic properties (ΔG°f) of monazite and xenotime at 25 °C and 1 bar sourced from the literature and reviewed by Pan et al. [13].

Author Contributions

R.P.: Investigation, Data curation, Formal analysis, Visualization, Writing original draft; C.Z.: Conceptualization, Methodology, Supervision, Visualization, Writing original draft, review and editing; P.L.: Writing—review and editing; L.G.: Project administration, Writing—review and editing; A.P.G.: Writing—review and editing; A.M.: Writing—review and editing. All authors have read and agreed to the published version of the manuscript.

Funding

This study is based upon work supported by the U.S. Department of Energy, Office of Science, Office of Basic Energy Sciences, Geosciences program under Award Number DE-SC0022269 to CZ.

Data Availability Statement

All data generated for this study are included in the article.

Acknowledgments

Although the work was partly sponsored by an agency of the United States Government, the views and opinions of authors expressed herein do not necessarily reflect those of the United States Government or any agency thereof. We would like to thank Mingkun Chen for helpful discussions. Constructive comments from three anonymous reviewers are gratefully acknowledged. We also thank the journal’s Editorial Office for their professional handling of our manuscript.

Conflicts of Interest

The authors declare no conflicts of interest.

References

  1. Grandell, L.; Lehtilä, A.; Kivinen, M.; Koljonen, T.; Kihlman, S.; Lauri, L.S. Role of critical metals in the future markets of clean energy technologies. Renew. Energy 2016, 95, 53–62. [Google Scholar] [CrossRef]
  2. Goodenough, K.M.; Wall, F.; Merriman, D. The rare earth elements: Demand, global resources, and challenges for resourcing future generations. Nat. Resour. Res. 2018, 27, 201–216. [Google Scholar] [CrossRef]
  3. Smith, M.P.; Henderson, P.; Zhang, P. Reaction relationships in the Bayan Obo Fe-REE-Nb deposit Inner Mongolia, China: Implications for the relative stability of rare-earth element phosphates and fluorocarbonates. Contrib. Mineral. Petrol. 1999, 134, 294–310. [Google Scholar] [CrossRef]
  4. Smith, M.P.; Moore, K.; Kavecsánszki, D.; Finch, A.A.; Kynicky, J.; Wall, F. From mantle to critical zone: A review of large and giant sized deposits of the rare earth elements. Geosci. Front. 2016, 7, 315–334. [Google Scholar] [CrossRef]
  5. Harlov, D.E.; Meighan, C.J.; Kerr, I.D.; Samson, I.M. Mineralogy, Chemistry, and Fluid-Aided Evolution of the Pea Ridge Fe Oxide-(Y+REE) Deposit, Southeast Missouri, USA. Econ. Geol. 2016, 111, 1963–1984. [Google Scholar] [CrossRef]
  6. Dushyantha, N.; Batapola, N.; Ilankoon, I.; Rohitha, S.; Premasiri, R.; Abeysinghe, B.; Ratnayake, N.; Dissanayake, K. The story of rare earth elements (REEs): Occurrences, global distribution, genesis, geology, mineralogy and global production. Ore Geol. Rev. 2020, 122, 103521. [Google Scholar] [CrossRef]
  7. Migdisov, A.; Guo, X.; Nisbet, H.; Xu, H.; Williams-Jones, A.E. Fractionation of REE, U, and Th in natural ore-forming hydrothermal systems: Thermodynamic modeling. J. Chem. Thermodyn. 2019, 128, 305–319. [Google Scholar] [CrossRef]
  8. Migdisov, A.; Williams-Jones, A.E.; Brugger, J.; Caporuscio, F.A. Hydrothermal transport, deposition, and fractionation of the REE: Experimental data and thermodynamic calculations. Chem. Geol. 2016, 439, 13–42. [Google Scholar] [CrossRef]
  9. Gausse, C.; Szenknect, S.; Qin, D.W.; Mesbah, A.; Clavier, N.; Neumeier, S.; Bosbach, D.; Dacheux, N. Determination of the Solubility of Rhabdophanes LnPO4·0.667H2O (Ln = La to Dy). Eur. J. Inorg. Chem. 2016, 2016, 4615–4630. [Google Scholar] [CrossRef]
  10. Gysi, A.P.; Harlov, D.; Miron, G.D. The solubility of monazite (CePO4), SmPO4, and GdPO4 in aqueous solutions from 100 to 250 °C. Geochim. Et Cosmochim. Acta 2018, 242, 143–164. [Google Scholar] [CrossRef]
  11. Gysi, A.P.; Williams-Jones, A.E.; Harlov, D. The solubility of xenotime-(Y) and other HREE phosphates (DyPO4, ErPO4 and YbPO4) in aqueous solutions from 100 to 250 °C and p sat. Chem. Geol. 2015, 401, 83–95. [Google Scholar] [CrossRef]
  12. Gysi, A.P.; Harlov, D. Hydrothermal solubility of TbPO4, HoPO4, TmPO4, and LuPO4 xenotime endmembers at pH of 2 and temperatures between 100 and 250 °C. Chem. Geol. 2021, 567, 120072. [Google Scholar] [CrossRef]
  13. Pan, R.; Gysi, A.P.; Miron, G.D.; Zhu, C. Optimized thermodynamic properties of REE aqueous species (REE3+ and REEOH2+) and experimental database for modeling the solubility of REE phosphate minerals (monazite, xenotime, and rhabdophane) from 25 to 300 °C. Chem. Geol. 2024, 643, 121817. [Google Scholar] [CrossRef]
  14. Zhang, B.; Liu, C.; Li, C.; Jiang, M. Separation and recovery of valuable metals from low-grade REE–Nb–Fe ore. Int. J. Miner. Process. 2016, 150, 16–23. [Google Scholar] [CrossRef]
  15. Popa, K.; Konings, R.J.M. High-temperature heat capacities of EuPO4 and SmPO4 synthetic monazites. Thermochim. Acta 2006, 445, 49–52. [Google Scholar] [CrossRef]
  16. Navrotsky, A.; Lee, W.; Mielewczyk-Gryn, A.; Ushakov, S.V.; Anderko, A.; Wu, H.; Riman, R.E. Thermodynamics of solid phases containing rare earth oxides. J. Chem. Thermodyn. 2015, 88, 126–141. [Google Scholar] [CrossRef]
  17. Thiriet, C.; Konings, R.J.M.; Javorský, P.; Magnani, N.; Wastin, F. The low temperature heat capacity of LaPO4 and GdPO4, the thermodynamic functions of the monazite-type LnPO4 series. J. Chem. Thermodyn. 2005, 37, 131–139. [Google Scholar] [CrossRef]
  18. Van Hoozen, C.J.; Gysi, A.P.; Harlov, D.E. The solubility of monazite (LaPO4, PrPO4, NdPO4, and EuPO4) endmembers in aqueous solutions from 100 to 250 °C. Geochim. Cosmochim. Acta 2020, 280, 302–316. [Google Scholar] [CrossRef]
  19. Janots, E.; Brunet, F.; Goffé, B.; Poinssot, C.; Burchard, M.; Cemič, L. Thermochemistry of monazite-(La) and dissakisite-(La): Implications for monazite and allanite stability in metapelites. Contrib. Mineral. Petrol. 2007, 154, 1–14. [Google Scholar] [CrossRef]
  20. Gavrichev, K.S.; Ryumin, M.A.; Tyurin, A.V.; Gurevich, V.M.; Khoroshilov, A.V.; Komissarova, L.N. Thermodynamic functions of erbium orthophosphate ErPO4 in the temperature range of 0–1600 K. Thermochim. Acta 2012, 535, 1–7. [Google Scholar] [CrossRef]
  21. Sverjensky, D.A.; Molling, P. A linear free energy relationship for crystalline solids and aqueous ions. Nature 1992, 356, 231–234. [Google Scholar] [CrossRef]
  22. Shannon, R.D. Revised effective ionic radii and systematic studies of interatomic distances in halides and chalcogenides. Acta Crystallogr. Sect. A Cryst. Phys. Diffr. Theor. Gen. Crystallogr. 1976, 32, 751–767. [Google Scholar] [CrossRef]
  23. Exner, O. Correlation Analysis of Chemical Data; Springer: New York, NY, USA, 1988. [Google Scholar]
  24. Xu, H.; Wang, Y. Use of linear free energy relationship to predict Gibbs free energies of formation of zirconolite phases (MZrTi2O7 and MHfTi2O7). J. Nucl. Mater. 1999, 275, 211–215. [Google Scholar] [CrossRef]
  25. Xu, H.; Wang, Y. Use of linear free energy relationship to predict Gibbs free energies of formation of pyrochlore phases (CaMTi2O7). J. Nucl. Mater. 1999, 275, 216–220. [Google Scholar] [CrossRef]
  26. Xu, H.; Wang, Y. Use of linear free energy relationship to predict Gibbs free energies of formation of MUO4 phases. Radiochim. Acta 1999, 87, 37–40. [Google Scholar] [CrossRef]
  27. Wang, Y.; Xu, H. Prediction of trace metal partitioning between minerals and aqueous solutions: A linear free energy correlation approach. Geochim. Cosmochim. Acta 2001, 65, 1529–1543. [Google Scholar] [CrossRef]
  28. Wang, Y.; Xu, H. Thermodynamic stability of actinide pyrochlore minerals in deep geologic repository environments. MRS Online Proc. Libr. (OPL) 1999, 608, 367. [Google Scholar] [CrossRef]
  29. Zhu, C. Estimation of surface precipitation constants for sorption of divalent metals onto hydrous ferric oxide and calcite. Chem. Geol. 2002, 188, 23–32. [Google Scholar] [CrossRef]
  30. Ganguly, J.; Saxena, S.K. Mixtures and Mineral Reactions; Springer Science & Business Media: Berlin/Heidelberg, Germany, 1987; Volume 19. [Google Scholar]
  31. Urusov, V. Energetic theory of miscibility gaps in mineral solid solutions. Fortschr. Miner. 1975, 52, 141–150. [Google Scholar]
  32. Zhu, C. Coprecipitation in the barite isostructural family: 1. binary mixing properties. Geochim. Cosmochim. Acta 2004, 68, 3327–3337. [Google Scholar] [CrossRef]
  33. Helgeson, H.C.; Kirkham, D.H.; Flowers, G.C. Theoretical prediction of the thermodynamic behavior of aqueous electrolytes by high pressures and temperatures; IV, Calculation of activity coefficients, osmotic coefficients, and apparent molal and standard and relative partial molal properties to 600 degrees C and 5 kb. Am. J. Sci. 1981, 281, 1249–1516. [Google Scholar]
  34. Ni, Y.; Hughes, J.M.; Mariano, A.N. Crystal chemistry of the monazite and xenotime structures. Am. Mineral. 1995, 80, 21–26. [Google Scholar] [CrossRef]
  35. Mesbah, A.; Clavier, N.; Elkaim, E.; Gausse, C.; Kacem, I.B.; Szenknect, S.; Dacheux, N. Monoclinic form of the rhabdophane compounds: REEPO4·0.667H2O. Cryst. Growth Des. 2014, 14, 5090–5098. [Google Scholar] [CrossRef]
  36. Momma, K.; Izumi, F. VESTA 3 for three-dimensional visualization of crystal, volumetric and morphology data. J. Appl. Crystallogr. 2011, 44, 1272–1276. [Google Scholar] [CrossRef]
  37. Fernández, D.; Goodwin, A.; Sengers, J.L. Measurements of the relative permittivity of liquid water at frequencies in the range of 0.1 to 10 kHz and at temperatures between 273.1 and 373.2 K at ambient pressure. Int. J. Thermophys. 1995, 16, 929–955. [Google Scholar] [CrossRef]
  38. Shock, E.L.; Helgeson, H.C. Calculation of the thermodynamic and transport properties of aqueous species at high pressures and temperatures: Correlation algorithms for ionic species and equation of state predictions to 5 kb and 1000 °C. Geochim. Cosmochim. Acta 1988, 52, 2009–2036. [Google Scholar] [CrossRef]
  39. Shannon, R.T.; Prewitt, C.T. Effective ionic radii in oxides and fluorides. Acta Crystallogr. Sect. B Struct. Crystallogr. Cryst. Chem. 1969, 25, 925–946. [Google Scholar] [CrossRef]
  40. Liu, X.; Byrne, R.H. Rare earth and yttrium phosphate solubilities in aqueous solution. Geochim. Cosmochim. Acta 1997, 61, 1625–1633. [Google Scholar] [CrossRef]
  41. Ushakov, S.V.; Helean, K.B.; Navrotsky, A.; Boatner, L.A. Thermochemistry of rare-earth orthophosphates. J. Mater. Res. 2001, 16, 2623–2633. [Google Scholar] [CrossRef]
  42. Greenwood, H.J. Some linear and non-linear problems in petrology. Geochim. Cosmochim. Acta 1979, 43, 1873–1885. [Google Scholar] [CrossRef]
  43. Mesbah, A.; Clavier, N.; Elkaim, E.; Szenknect, S.; Dacheux, N. In pursuit of the rhabdophane crystal structure: From the hydrated monoclinic LnPO4·0.667H2O to the hexagonal LnPO4 (Ln = Nd, Sm, Gd, Eu and Dy). J. Solid State Chem. 2017, 249, 221–227. [Google Scholar] [CrossRef]
  44. Popa, K.; Konings, R.J.M.; Geisler, T. High-temperature calorimetry of (La1−xLnx)PO4 solid solutions. J. Chem. Thermodyn. 2007, 39, 236–239. [Google Scholar] [CrossRef]
  45. Neumeier, S.; Kegler, P.; Arinicheva, Y.; Shelyug, A.; Kowalski, P.M.; Schreinemachers, C.; Navrotsky, A.; Bosbach, D. Thermochemistry of La1−xLnxPO4-monazites (Ln= Gd, Eu). J. Chem. Thermodyn. 2017, 105, 396–403. [Google Scholar] [CrossRef]
  46. Strzelecki, A.C.; Reece, M.; Zhao, X.; Yu, W.; Benmore, C.; Ren, Y.; Alcorn, C.; Migdisov, A.; Xu, H.; Guo, X. Crystal chemistry and thermodynamics of HREE (Er, Yb) mixing in a xenotime solid solution. ACS Earth Space Chem. 2022, 6, 1375–1389. [Google Scholar] [CrossRef]
  47. Mogilevsky, P. On the miscibility gap in monazite–xenotime systems. Phys. Chem. Miner. 2007, 34, 201–214. [Google Scholar] [CrossRef]
  48. Kowalski, P.M.; Li, Y. Relationship between the thermodynamic excess properties of mixing and the elastic moduli in the monazite-type ceramics. J. Eur. Ceram. Soc. 2016, 36, 2093–2096. [Google Scholar] [CrossRef]
  49. Li, Y.; Kowalski, P.M.; Blanca-Romero, A.; Vinograd, V.; Bosbach, D. Ab initio calculation of excess properties ofLa1−x(Ln,An)xPO4solid solutions. J. Solid State Chem. 2014, 220, 137–141. [Google Scholar] [CrossRef]
  50. Eremin, N.N.; Marchenko, E.I.; Petrov, V.G.; Mitrofanov, A.A.; Ulanova, A.S. Solid solutions of monazites and xenotimes of lanthanides and plutonium: Atomistic model of crystal structures, point defects and mixing properties. Comput. Mater. Sci. 2019, 157, 43–50. [Google Scholar] [CrossRef]
  51. Gavrichev, K.S.; Gurevich, V.M.; Ryumin, M.A.; Tyrin, A.V.; Komissarova, L.N. Low-temperature heat capacity and thermodynamic properties of PrPO4. Geochem. Int. 2016, 54, 362–368. [Google Scholar] [CrossRef]
  52. Gavrichev, K.S.; Ryumin, M.A.; Tyurin, A.V.; Gurevich, V.M.; Komissarova, L.N. The heat capacity and thermodynamic functions of EuPO4 over the temperature range 0–1600 K. Russ. J. Phys. Chem. A 2009, 83, 901–906. [Google Scholar] [CrossRef]
  53. Gavrichev, K.S.; Smirnova, N.N.; Gurevich, V.M.; Danilov, V.P.; Tyurin, A.V.; Ryumin, M.A.; Komissarova, L.N. Heat capacity and thermodynamic functions of LuPO4 in the range 0–320 K. Thermochim. Acta 2006, 448, 63–65. [Google Scholar] [CrossRef]
  54. Gavrichev, K.S.; Ryumin, M.A.; Tyurin, A.V.; Gurevich, V.M.; Komissarova, L.N. Heat Capacity and Thermodynamic Functions of Xenotime YPO4(c) at 0–1600 K. Geochem. Int. 2010, 48, 932–939. [Google Scholar] [CrossRef]
  55. Gavrichev, K.S.; Ryumin, M.A.; Tyurin, A.V.; Gurevich, V.M.; Nikiforova, G.E.; Komissarova, L.N. Heat capacity and thermodynamic functions of YbPO4 from 0 to 1800 K. Inorg. Mater. 2013, 49, 701–708. [Google Scholar] [CrossRef]
  56. Gurevich, V.M.; Ryumin, M.A.; Tyurin, A.V.; Komissarova, L.N. Heat capacity and thermodynamic properties of GdPO4 in the temperature range 0–1600 K. Geochem. Int. 2012, 50, 702–710. [Google Scholar] [CrossRef]
  57. Poitrasson, F.; Oelkers, E.; Schott, J.; Montel, J.M. Experimental determination of synthetic NdPO4 monazite end-member solubility in water from 21 °C to 300 °C: Implications for rare earth element mobility in crustal fluids. Geochim. Cosmochim. Acta 2004, 68, 2207–2221. [Google Scholar] [CrossRef]
  58. Ji, Y.; Beridze, G.; Bosbach, D.; Kowalski, P.M. Heat capacities of xenotime-type ceramics: An accurate ab initio prediction. J. Nucl. Mater. 2017, 494, 172–181. [Google Scholar] [CrossRef]
  59. Tyurin, A.V.; Ryumin, M.A.; Khoroshilov, A.V.; Gurevich, V.M.; Gavrichev, K.S. Thermodynamic functions of holmium orthophosphate HoPO4 in the range 9–1370 K. Thermochim. Acta 2020, 683, 178459. [Google Scholar] [CrossRef]
  60. Ji, Y.; Beridze, G.; Li, Y.; Kowalski, P.M. Large Scale Simulation of Nuclear Waste Materials. Energy Procedia 2017, 127, 416–424. [Google Scholar] [CrossRef]
  61. Spear, F.S.; Pyle, J.M. Apatite, monazite, and xenotime in metamorphic rocks. Rev. Mineral. Geochem. 2002, 481, 293–335. [Google Scholar] [CrossRef]
  62. Zhu, X.; O’Nions, R. Monazite chemical composition: Some implications for monazite geochronology. Contrib. Mineral. Petrol. 1999, 137, 351–363. [Google Scholar] [CrossRef]
  63. Franz, G.; Andrehs, G.; Rhede, D. Crystal chemistry of monazite and xenotime from Saxothuringian-Moldanubian metapelites, NE Bavaria, Germany. Eur. J. Mineral. 1996, 8, 1097–1118. [Google Scholar] [CrossRef]
  64. Tananaev, I.V.O.; Orlovsky, V.P.; Kurbanov, J.M.; Halikov, B.S.; Osman, S.O.; Bulgakov, V.I. Reports of the Academy of Sciences of the Tajik SSR = Dokladhoi Akademiyai fanhoi RCC Tochikiston (USSR); USSR: Moscow, Russia, 1974; Volume 42. [Google Scholar]
  65. Shock, E.L.; Sassani, D.C.; Willis, M.; Sverjensky, D.A. Inorganic species in geologic fluids: Correlations among standard molal thermodynamic properties of aqueous ions and hydroxide complexes. Geochim. Cosmochim. Acta 1997, 61, 907–950. [Google Scholar] [CrossRef] [PubMed]
  66. Glynn, P. Solid-solution solubilities and thermodynamics: Sulfates, carbonates and halides. Rev. Mineral. Geochem. 2000, 40, 481–511. [Google Scholar] [CrossRef]
  67. Gavrichev, K.S.; Ryumin, M.A.; Khoroshilov, A.V.; Nikiforova, G.E.; Tyurin, A.V.; Gurevich, V.M.; Starykh, R.V. Thermodynamic properties and phase transitions of tetragonal modification of terbium orthophosphate. Phys. Chem. 2013, 4, 186–197. [Google Scholar]
  68. Gysi, A.P.; Harlov, D.; Filho, D.C.; Williams-Jones, A.E. Experimental determination of the high temperature heat capacity of a natural xenotime-(Y) solid solution and synthetic DyPO4 and ErPO4 endmembers. Thermochim. Acta 2016, 627–629, 61–67. [Google Scholar] [CrossRef]
  69. Nikiforova, G.E.; Ryumin, M.A.; Gavrichev, K.S.; Gurevich, V.M. High-temperature thermodynamic properties of LuPO4. Inorg. Mater. 2012, 48, 841–844. [Google Scholar] [CrossRef]
  70. Zimmer, K.; Zhang, Y.; Lu, P.; Chen, Y.; Zhang, G.; Dalkilic, M.; Zhu, C. SUPCRTBL: A revised and extended thermodynamic dataset and software package of SUPCRT92. Comput. Geosci. 2016, 90, 97–111. [Google Scholar] [CrossRef]
Figure 1. The ranges of ∆G°f values for (a) monazite–(La) and (b) xenotime–(Er) end-members reported in the literature [8,11,13,15,16,17,18,19,20]. Data retrieved or compiled from calorimetric experiments are plotted as blue symbols, and data retrieved from mineral solubility experiments are plotted as green symbols.
Minerals 14 00305 g001
Figure 2. Representative REE phosphate mineral structures of isostructural families of (a) monazite –(Ce), (b) xenotime–(Y), and (c) rhabdophane–(Sm). Crystal structure data of monazite and xenotime are derived from Ni et al. [34], and the data of rhabdophane are derived from Mesbah et al. [35]. The virtualizations of the crystal structures of the three minerals were performed using the program VESTA [36].
Minerals 14 00305 g002
Figure 3. Graphical representations of linear correlations of isostructural (a) monazite, (b) xenotime, and (c) rhabdophane mineral families and comparisons with other experimental studies [8,9,11,15,16,17,18,20,51,52,53,54,55,56,57,58,59], as shown in Table S1. In (a), the dashed line represents the linear correlation line based on the regression of the data sourced from Migdisov et al. [8], and the solid line represents a modified parallel line by subtracting 7.2 kJ mol−1 for its y-axis intercept to fit the solubility data provided by Van Hoozen et al. [19].
Minerals 14 00305 g003
Figure 4. Residuals between the experimentally measured [8,40] and calculated values of ∆G°f of crystalline solids from Equation (8) for the three isostructural (a) monazite, (b) xenotime, and (c) rhabdophane families.
Minerals 14 00305 g004
Figure 5. Linear correlations between the modified Margules parameters W with a term of volume mismatch (∆V) for binary mixing solutions in the (a) monazite and (c) xenotime isostructural families and comparisons with other experimental studies [7,44,45,47,48,50,60]. Residuals between the regressed and theoretically calculated (b) monazite and (d) xenotime binary excess properties.
Minerals 14 00305 g005
Figure 6. (a) Graphical representation of linear correlations of isostructural monazite and xenotime groups using the ∆G°f data of monazite and xenotime end-members from Navrotsky et al. [16] and Migdisov et al. [8], Gausse et al. [9]. (b,c) Residuals between the experimentally measured and recalculated ∆G°f values of (b) monazite and (c) xenotime based on the calculation of linear correlations.
Minerals 14 00305 g006
Figure 7. Linear correlation for solubility products for xenotime end-members with REE aqueous ion properties. Experimental data are taken from Liu and Byrne [40].
Minerals 14 00305 g007
Table 1. List of symbols and definitions.
SymbolDefinition
G°fGibbs free energy of formation
G°nNon-solvation contribution to the Gibbs free energy of formation
G°sSolvation contribution to the Gibbs free energy of formation
G’fAdjusted Gibbs free energy of formation (∆G°f,REEPO4β rREE3+)
ΔS°fEntropy of formation from the elements
S°Absolute entropy
ΔHfEnthalpy of formation from the elements
CpHeat capacity
V°Molar volume
V Defined volume mismatch term in this study
dVMismatch of the cell volume values under the definition of Young’s moduli
RGas constant (8.314 J mol−1 K−1)
KEquilibrium constant
KspSolubility constants
W’Adjusted Margules parameter
WMargules parameter
ωBorn coefficient of an ion
ωabsAbsolute Born coefficient of an ion
rREE3+Crystallographic radius of the aqueous REE3+ ion
ZCharge number of an ion
αAnion part of a mineral, such as PO4
ψEffective bulk modulus
MXChemical formula of a solid
T3+Trace cation of REEPO4 with charge of 3+
C3+Carrier cation of REEPO4 with charge of 3+
REERare Earth Elements
LREELight Rare Earth Elements
HREEHeavy Rare Earth Elements
Table 2. Ionic radii and thermodynamic data for REE aqueous cations and phosphates.
REEr(REE3+)r(REE3+)V° (cm3 mol−1)G°s (kJ mol−1)G°f (kJ mol−1)G°n (kJ mol−1)G°f (kJ mol−1) 2G°f (kJ mol−1) 3
Å (CN9) 1Å (CN8) 1REEPO4(s)REE3+(aq)REE3+(aq)REE3+(aq)REEPO4(s)REEPO4·0.667H2O(s)
La1.2161.16046.03−861.74−686.18175.56−1848.53−2004.00
Ce1.1961.14345.16−869.35−676.13193.22−1844.48−1997.00
Pr1.1791.12644.45−875.89−680.32195.57−1850.50−2003.00
Nd1.1631.10943.86−882.09−671.95210.14−1840.30−1994.00
Pm1.1441.09343.26−889.51−661.07228.44
Sm1.1321.07942.81−894.24−665.67228.57−1833.45−1989.00
Eu1.1201.06642.40−899.00−574.46324.54−1741.10−1896.00
Gd1.1071.05342.01−904.19−663.58240.60−1828.50−1984.00
Tb1.0951.04041.53 4−909.00−667.35241.65
Dy1.0831.027 −913.85−664.00249.85
Tb1.0951.04043.90−931.47−667.35264.12−1831.07
Dy1.0831.02743.35−936.87−664.00272.87−1829.10
Y1.0751.01943.14−940.21−685.34254.87−1849.12
Ho1.0721.01542.90−941.89−675.30266.59−1836.79
Er1.0621.00442.37−946.52−669.02277.50−1831.26
Tm1.0520.99442.00−950.75−669.02281.73−1830.52
Yb1.0420.98541.64−954.58−640.15314.43−1801.02
Lu1.0320.97741.22−958.00−666.93291.07−1826.71
1 CN: Coordination numbers: 9 for monazite–(La-Dy) and 8 for xenotime–(Tb-Lu, and Y). 2 Monazite–(La to Gd) and xenotime–(Tb to Lu) ∆G°f values are derived from Migdisov et al. [8], which were in turn derived from the solubility data of Liu and Byrne [40]. 3 Rhabdophane–(La to Gd) ∆G°f values are derived from Gausse et al. [9]. 4 Molar volume (V°) of monazite TbPO4 is derived from Ushakov et al. [41]. Note that all V°, ∆G°s, ∆G°n, and ∆G°f data included here are actual figures, meaning that those data are directly measured or calculated by 9 C. N. for monazite–(La-Dy) and 8 C. N. for xenotime–(Tb-Lu, and Y). The references of the data sources in this table have been introduced in Section 3 if they are not mentioned here.
Table 3. Summary of regression parameters for linear free energy correlation.
REE Phosphate Lsostructural TypeParameters
ab (kJ mol−1)β (kJ Å−1)R2
Monazite1.0059 (0.0398)−2515.31 (63.23)399.71 (48.33)0.9975
Xenotime0.9909 (0.0325)−2451.53 (35.58)344.08 (27.89)0.9979
Rhabdophane1.0067 (0.0240)−2688.86 (38.02)416.17 (29.06)0.9991
Parameters from Equations (8) and (9) for isostructural solids involving trivalent cations. Uncertainties of 2σ are given in parentheses for each regression parameter. All values refer to 25 °C and 1 bar.
Table 4. Summary of regression parameters for linear Margules parameter correlation.
REE Phosphate Lsostructural TypeParameters
a (kJ V°−1)b (kJ mol−1)βR2
Monazite39.3549 (0.5659)0.0641 (0.0958)−0.0020 (0.0017)0.9939
Xenotime25.4885 (0.5589)−0.0062 (0.0269)−0.0025 (0.0007)0.9931
Parameters from Equations (13) and (15) for isostructural solids involving trivalent cations. Standard errors are given in parentheses. All values refer to 25 °C and 1 bar.
Table 5. Calculated Margules interaction parameters W in kJ/mol (upper of diagonal) for the monazite and xenotime solid solutions.
MonaziteCation La Ce Pr Nd PmSm Eu GdTb DyY1
W (kJ/mol) 0.762.324.367.149.7012.615.319.423.626.4La
0.521.613.415.217.409.4612.716.018.3Ce
0.411.412.604.235.738.2811.012.9Pr
0.431.122.283.335.327.509.02Nd
0.250.951.562.984.645.83Pm
0.420.691.692.963.89Sm
0.040.661.582.28Eu
0.330.931.41Gd
0.260.49Tb
0.06Dy
Y
XenotimeCation TbDyYHoErTmYbLu
W (kJ/mol) 0.190.460.591.442.233.254.50Tb
0.130.100.581.121.892.85Dy
−0.090.260.701.372.21Y
0.190.521.091.80Ho
0.090.410.85Er
0.160.39Tm
0.04Yb
Lu
XenotimeCation LaCePrNdPmSmEuGd
FictiveW (kJ/mol) 22.917.412.88.865.893.741.981.08Y1
1 W parameters for fictive REE phosphate end-members, as marked in italic.
Table 6. Recommended standard thermodynamic properties of monazite, xenotime, and rhabdophane at a temperature of 298.15 K and pressure of 1 bar, as well as the heat capacity function, with T in Kelvin.
ΔG°fΔH°fΔS°f [16]S° [16]V°m [34]Cp = a + bT + c/T2 + d/T0.5
kJ mol−1kJ mol−1J mol−1 K−1J mol−1 K−1J mol−1 bar−1ab*100cdReference
Monazite
LaPO4−1861.2−1980.46−400.0108.346.03121.133.0116−2,562,500-[15]
CePO4−1851.7−1971.33−401.3120.045.16125.212.7894−2,408,500-[15]
PrPO4−1855.6−1975.55−402.3123.244.45124.503.0374−2,449,500-[15]
NdPO4−1846.2−1965.76−401.0122.943.86132.962.2541−3,100,900-[15]
SmPO4−1840.7−1959.52−398.7122.542.81133.132.3468−3,068,700-[15]
EuPO4−1748.3−1871.17−412.1117.242.40137.561.7693−2,785,400-[15]
GdPO4−1835.7−1953.47−395.0124.642.01133.241.2793−3,097,200-[15]
TbPO4−1841.7---41.53 1----This study
DyPO4−1838.3---41.10 2----This study
(YPO4)−1859.7---40.82 2----This study
(HoPO4)−1849.6---40.71 2----This study
(ErPO4)−1843.1---40.37 2----This study
(TmPO4)−1843.0---40.03 2----This study
(YbPO4)−1813.8---39.68 2----This study
(LuPO4)−1859.7---39.34 2----This study
Xenotime
(LaPO4)−1857.1---49.35 2----This study
(CePO4)−1846.4---48.56 2----This study
(PrPO4)−1849.8---47.77 2----This study
(NdPO4−1840.6---47.00 2----This study
(SmPO4)−1832.7---45.66 2----This study
(EuPO4)−1741.6---45.08 2----This study
(GdPO4)−1829.1---44.51 2----This study
TbPO4−1831.1−1946.3−386.6138.143.90116.44.55−2,190,000-[67]
DyPO4−1829.1−1945.0−388.6138.143.35185.50.00−3,261,000−751.900[68]
YPO4−1849.1−1964.4−386.8108.843.14131.31.992−3,563,700-[54]
HoPO4−1836.8−1951.4−384.4142.342.90124.42.658−2,690,000-[59]
ErPO4−1831.3−1952.8−407.7116.642.37205.5−0.076−859,073−1651.88[20]
TmPO4−1830.5−1945.9−387.1138.142.00128.81.904−3,090,000-[12]
YbPO4−1801.0−1913.5−377.1133.941.64198.00.448−991,250−1506.38[55]
LuPO4−1826.7−1941.6−385.2117.241.22130.71.85−3,330,000-[53,69]
Rhabdophane
LaPO4·0.667H2O−2004.0−2151.3−494.0170.0-----[9]
CePO4·0.667H2O−1997.0−2147.3−504.0175.0-----[9]
PrPO4·0.667H2O−2003.0−2144.0−473.0210.0-----[9]
NdPO4·0.667H2O−1994.0−2142.8−499.0180.0-----[9]
SmPO4·0.667H2O−1989.0−2137.8−499.0177.0-----[9]
EuPO4·0.667H2O−1896.0−2056.4−538.0149.0-----[9]
GdPO4·0.667H2O−1984.0−2130.7−492.0182.0-----[9]
TbPO4·0.667H2O−1989.9--------This study
DyPO4·0.667H2O−1986.6--------This study
1 Vm of monazite TbPO4 is calculated from Ushakov et al. [41]. 2 Vm of monazite DyPO4 and other monazite fictive end-members are calculated from Equation (16); Vm of xenotime fictive end-members are calculated from Equation (17). Please note that in the ΔG°f and V°m columns, the data in regular font and red color are retrieved from experiments, and the data in italic font are calculated in this study. The REE phosphates in parentheses are fictive end-members. The references for the ΔG°f values retrieved from experiments can be found in the text.
Disclaimer/Publisher’s Note: The statements, opinions and data contained in all publications are solely those of the individual author(s) and contributor(s) and not of MDPI and/or the editor(s). MDPI and/or the editor(s) disclaim responsibility for any injury to people or property resulting from any ideas, methods, instructions or products referred to in the content.

