Article

The Effect of Diagenetic Minerals on the Petrophysical Properties of Sandstone Reservoir: A Case Study of the Upper Shallow Marine Sandstones in the Central Bredasdorp Basin, Offshore South Africa

1
Department of Geology, Faculty of Science and Agriculture, University of Fort Hare, Alice 5700, South Africa
2
Department of Earth Sciences, Faculty of Science, University of the Western Cape, Bellville 7535, South Africa
*
Author to whom correspondence should be addressed.
Minerals 2024, 14(4), 396; https://doi.org/10.3390/min14040396
Submission received: 6 March 2024 / Revised: 31 March 2024 / Accepted: 8 April 2024 / Published: 11 April 2024
(This article belongs to the Section Mineral Exploration Methods and Applications)

Abstract

:
The upper shallow marine sandstone reservoirs of the Barremian-to-Valanginian formation are the most porous and permeable sandstone reservoirs in the Bredasdorp Basin and an important target for oil and gas exploration. There is a paucity of information on the reservoir characterization and effect of diagenetic mineral studies focusing on the upper shallow marine sandstone reservoirs in the central Bredasdorp Basin; thus, there is a need to investigate the effect of diagenetic minerals and to characterize these reservoirs due to their high porosity and permeability. Datasets, including a suite of geophysical wireline logs, routine core analysis, geological well completion reports, description reports, and core samples, were utilized. A total of 642 core porosity measures, core water saturation, and core permeability data were used for calibration with the log-derived parameters, ranging in depth from 3615 m to 4259 m. Rock samples were prepared for diagenetic mineral analyses, such as thin sections and Scanning electron microscopy, for each well to investigate the presence of diagenetic minerals in the selected reservoir units. The petrophysical analyses showed the results of porosity, volume of clay, water saturation, and permeability, ranging from 9% to 27%, 8.6% to 19.8%, 18.9% to 30.4%, and 0.096 mD to 151.8 mD, respectively, indicating a poor-to-good reservoir quality. Mineralogical analyses revealed that micrite calcite, quartz cement, quartz overgrowth, and authigenic pore-filling and grain-coating clay minerals (illite–smectite and illite) negatively affected intergranular porosity. Porosity-versus-permeability cross plot showed good correlation of 0.86 for ZN1 and 0.83 for ZN3 reservoirs, suggesting that although porosity is the main drive of permeability, there were other geological factors at play, such as diagenetic minerals and compaction.

1. Introduction

Petrophysical properties such as porosity and permeability must be considered when evaluating the quality of sandstone reservoirs [1]. These properties are affected by diagenesis [2]. Diagenetic minerals are all minerals that formed post-deposition of sediments but before their disintegration by weathering or alteration by metamorphism [3]. Their origin is linked to chemical and mineralogical changes in sediments [4]. These changes frequently lead to the modification of pore spaces, making diagenetic minerals a crucial factor in affecting reservoir rock properties [5]. Understanding diagenetic minerals such as glauconite, smectite, illite, siliceous, and carbonate cement is essential in assessing the quality of the reservoir. The effect of diagenetic minerals on reservoir properties has long been acknowledged [2,6,7,8,9,10,11,12]. IIlite occurs as pore-lining and pore-filling cement, reducing size and closing pore throats, and consequently affecting the reservoir quality [13]. Smectite may bridge the gap between adjacent detrital grains and reduce the pore throat connectivity. Depending on the timing of the calcite cement, it can either resist the compaction of sandstone if formed early or may fill pores, replace grains, and reduce porosity and permeability if formed late [14]. Glauconite typically exists in two forms, either as rounded pellets or glauconitic, altered mica flakes [15].
A widely accepted reservoir characterization approach of petrophysical and petrographic analysis is crucial for an effective and reliable reservoir description [16]. Reservoir quality is one of the main geological factors to consider for hydrocarbon accumulation’s probability of success (POS) in the sedimentary basin. A detailed study of wireline logs and core samples from the reservoir rock is vital to understanding what diagenetic changes have occurred and what factors control the reservoir quality [17].
Clay minerals in sandstone formations cause problems in interpreting the wireline logs, especially in resistivity data and porosity logs [18]. A small amount of clay mineral can have a considerable effect; therefore, it is vital to address this problem to enhance hydrocarbon recovery and risk mitigation.
What makes the upper shallow marine sandstone reservoirs suitable for this study is that they are the most highly porous and permeable rocks in the Bredasdorp Basin, consisting of the main gas reservoirs of the Cretaceous age [19]. Many studies on reservoir characterization and diagenesis undertaken by the South African National Oil Company (PETROSA) and other petroleum companies in the central Bredasdorp Basin remain unpublished internal reports. The published work in the Bredasdorp Basin dealing with the classification and impact of diagenesis on the reservoir properties focused on the basin’s southern part [8,20]. The characterization of the younger reservoirs in the Cretaceous age, ranging from the Valangianian to Albian age in the Bredasdorp Basin, was conducted by the authors of [21].
The gap still exists in understanding the petrophysical properties and the diagenetic factors that affect the reservoir quality of the upper shallow marine sandstone reservoirs in the central Bredasdorp Basin. This study aims to employ conventional core analysis data, wireline logs, thin section analysis, and scanning electron microscopy (SEM) to investigate the effect of diagenetic minerals on the petrophysical properties of sandstone reservoirs to bridge the gap between our understanding of diagenetic minerals and their effect on reservoir quality in the area.

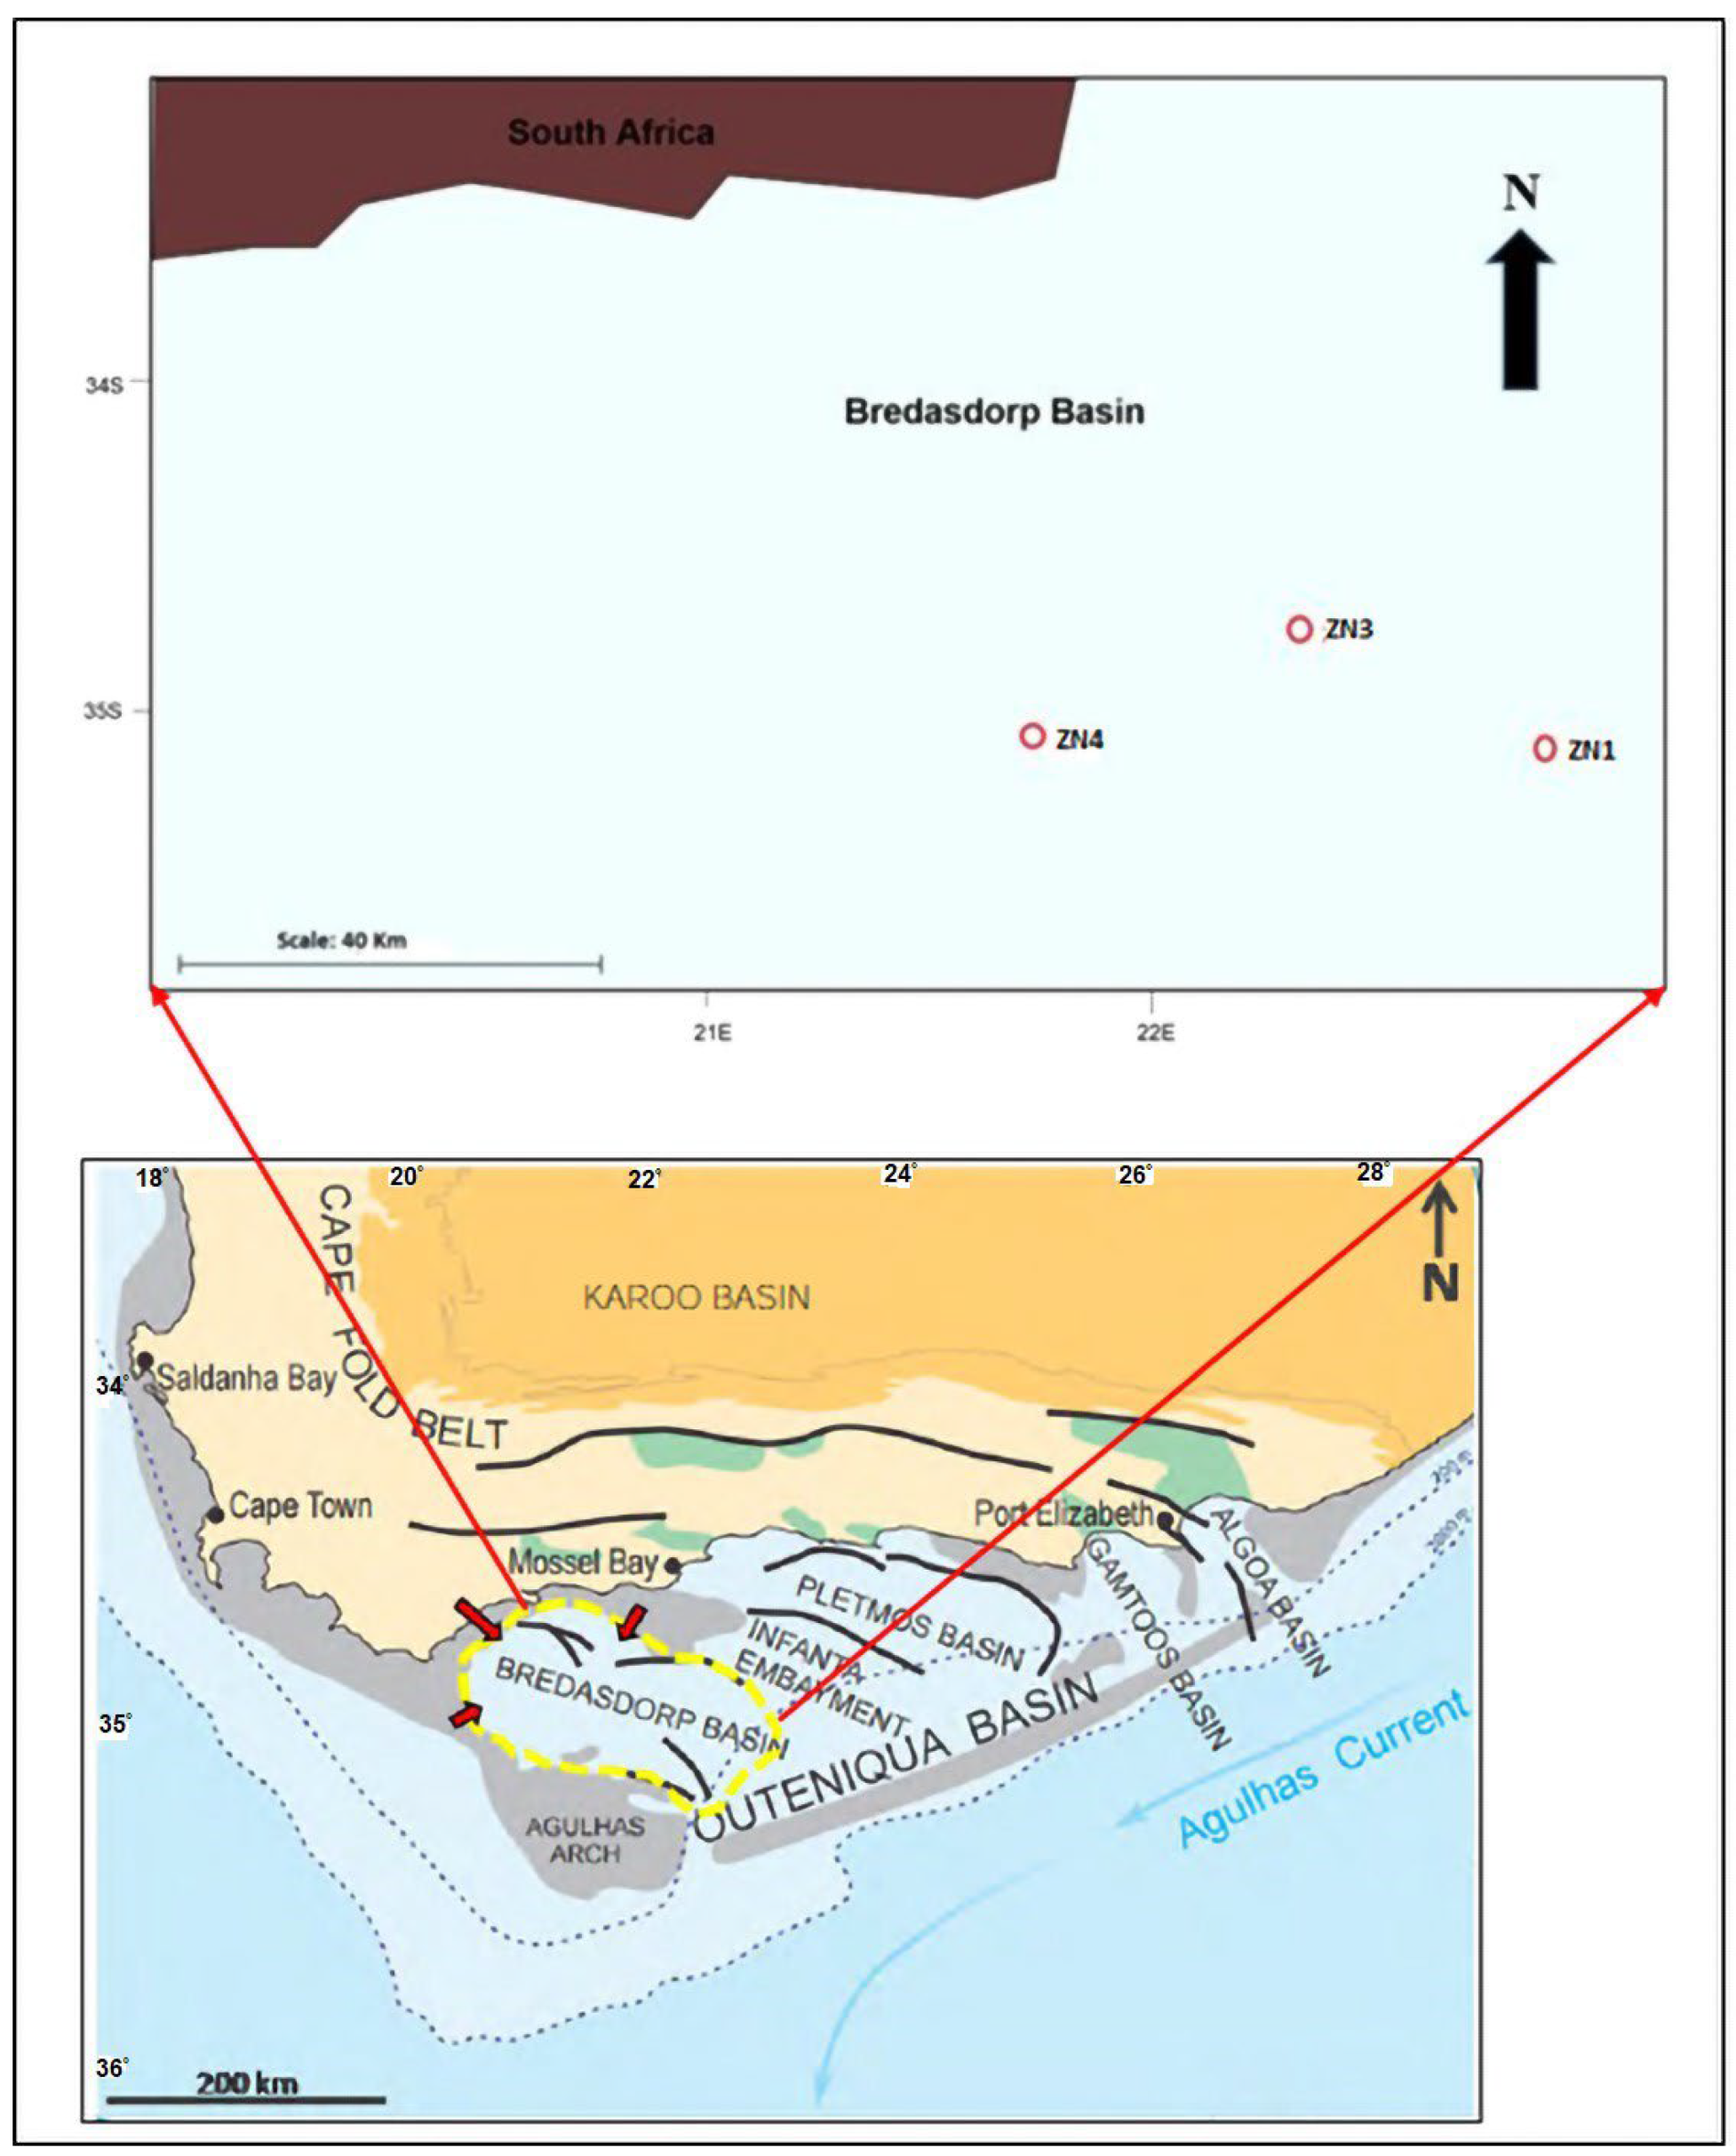
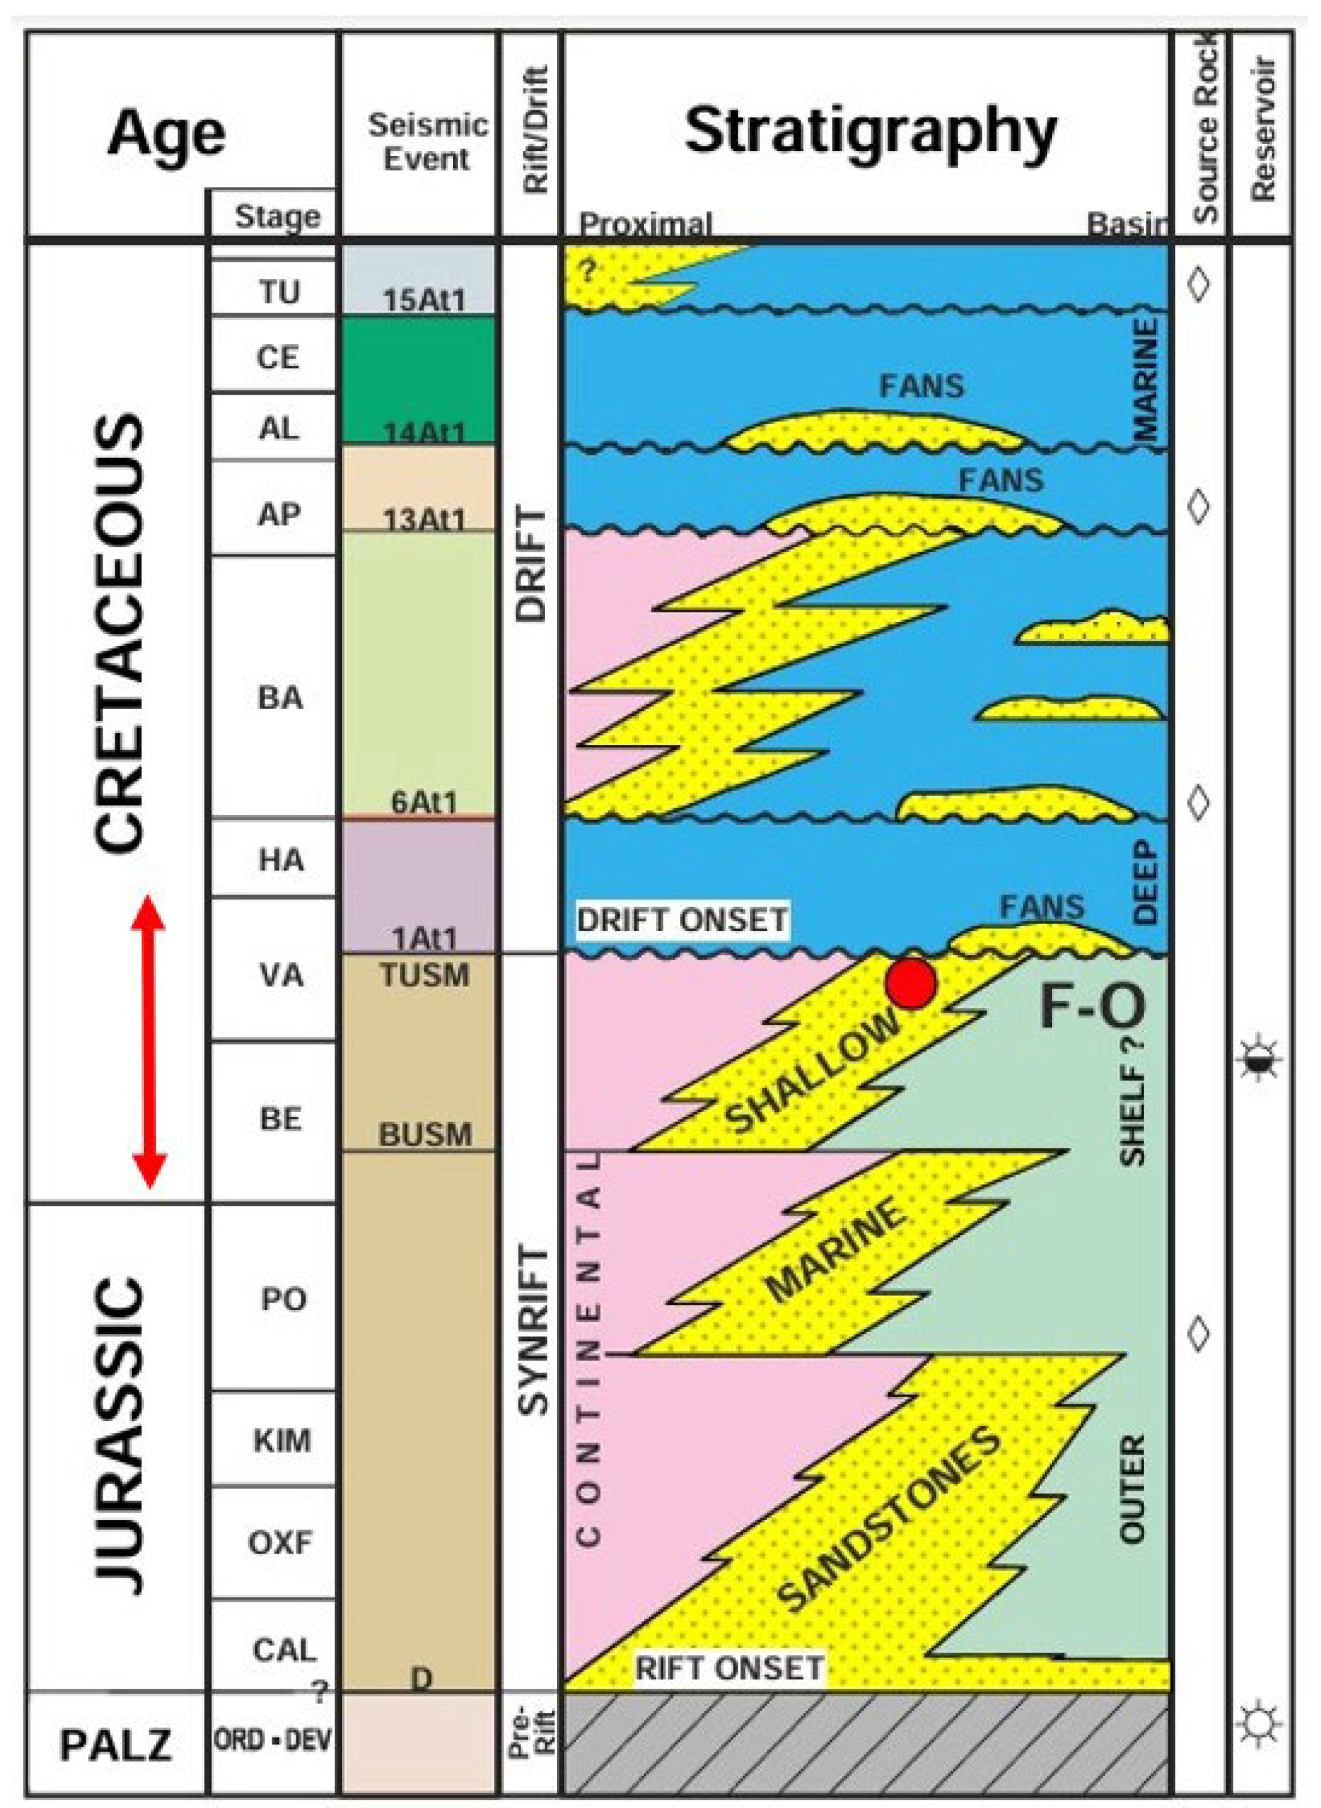
2. Location of the Study Area and the Geological Background

The Bredasdorp Basin covers roughly 18,000 km2 along the southern shelf of South Africa, Southwest of Mosselbay. Three wells (ZN1, ZN3, and ZN4) intersecting the upper shallow marine sandstones were selected for this study (Figure 1).
The Bredasdorp Basin has long been studied for general geology, stratigraphy, tectonic history, and depositional environment and includes those summarized in [22,23,24,25,26,27]. Also, refs. [27,28,29] conducted a study focusing on the geology, depositional environment, and economic potential of the upper shallow marine sandstone reservoirs. The glauconitic sandstone interval mainly consists of blocky or recurrent upward coarsening units [22]. These reservoir sandstones are rich in quartz, variably glauconite, and poor in lithics [22].
The deposition of the shallow marine sandstones is marked by the initial rifting, characterized by the development of horst and graben tectonics in an extensional stress regime [22].
Lithostratigraphic study of rift sediment conducted along the northeastern flank of the basin showed that differential subsidence of the basement floor heavily influenced sedimentation rates from horizon D to 1At1 (Figure 2). The basement consists of black slates of the Devonian Bokkeveld Group and the qualities of the Ordovician–Silurian. Four lithogenic units of the rift sequence have been identified in the gas field area, namely (1) a lower fluvial interval, (2) a lower shallow marine interval, (3) an upper fluvial interval, and (4) an upper shallow marine interval. The sandstones of the upper shallow marine are regarded as the best gas field reservoirs with high porosity and permeability [29]. The 1At1 unconformity (Figure 2) marks the termination of the active rift sedimentation. Also, it records a significant uplift and truncation of the underlying deposits along the basin margins during the late Valanginian.

3. Materials and Methods

Datasets including a suite of geophysical wireline logs (Gamma Ray, Resistivity, and Porosity logs), routine core analysis (porosity and permeability), geological well completion reports, description reports, and core samples were available for the studied wells (ZN1, ZN3, and ZN4) and were provided for this study by the Petroleum Agency of South Africa (PASA), Cape Town, South Africa. Geoactive Interactive Petrophysics (IP 4.7) software was used to interpret wireline logs. Firstly, a database was created, and wireline logs (LAS format) were loaded into the software to be displayed as log curves. Environmental correction and log splicing were performed where there was a lack of continuous logs. The well logs were used to identify the upper shallow marine sandstone reservoirs intersected by the studied wells. A total of 642 core porosity, core water saturation, and core permeability data were obtained from the routine core analysis, report ranging in depth from 3615 m to 4259 m. Additionally, 74 core plugs were used to measure core porosity and core permeability using the Vinci Technology POROPERM equipment (sourced from Nanterre, France) measured at room temperature conditions.

3.1. Petrophysical Evaluation

3.1.1. Volume of Clay Determination

The minimum and maximum gamma ray values were used to calculate the volume of clay as shown in Equation (1):
VCL = (GRlog − GRmin)/(GRmax − GRmin)
where
VCL = volume of clay;
GRlog = gamma ray reading of the formation;
GRmin = gamma ray (clay-free zone);
GRmax = gamma ray (100% clay zone).

3.1.2. Wireline Log and Core-Derived Porosity Determination

A continuous effective porosity log was calculated from density (RHOB), neutron (NPHI), and sonic (DT) logs using Geosctive Interactive Petrophysics (IP 4.7) software’s interpretation module.
Core porosity was measured on the 74 core plugs from the three examined wells utilizing Vinci Technologies helium porosimeter equipment sourced from Nanterre, France. Helium porosimeter gas expansion equipment is dedicated to determining the grain volume of the core sample. The principle is based on the Boyle–Mariotte law. An XLS (excel file) report template is provided, ready to calculate grain volume and pore volume based on the input of sample’s diameter, length, weight and pressure read at the manometer.
The pore volume was measured using the helium porosimeter relying on Boyle’s law:
P1V2 = P2V2
The helium porosimeter consisted of two chambers. Chamber one was filled with helium, which gave us P1 and V1. After that, chamber two was also filled with helium, and Boyle’s law became
P1V1 = P2(V1 + V2)
Considering the core plug that we put inside chamber 2, Boyle’s law then becomes
P1V1 = P2(V1 + V2 − Vm)
Vm is the matrix volume. Vm was determined from the equation since V1 and V2 are constants, and P1 and P2 were read off the helium porosimeter. Pore volume was calculated from Vm, knowing the bulk volume of the core plug. The formula can be expressed as follows:
Vp = Vb − Vm
Lastly, porosity was calculated by dividing the pore volume by bulk volume, expressed as
Φ = VpVb
During the experiment, it was assumed that the temperature stayed steady during a series of experiments. The experiments were conducted thrice on each core plug to maximize the reliability of the results, and the average values were considered as the correct measurement.

3.1.3. Water Saturation Determination

Water saturation is the ratio of water volume to pore volume [30]. The determination of the water saturation (Sw) of the uninvaded zone entails a water resistivity (Rw) value at the formation temperature determined via the deep resistivity and porosity logs in a water-bearing zone using the following equation:
Rw = (∅(m)Ro)/a
Rw = water resistivity at formation temperature;
∅ = total porosity in the water zone;
Ro = deep resistivity values in the water zone;
a = tortuosity factor;
m = cementation exponent, which uses 2 for the sandstone.
Water saturation was then calculated using the method from [31], and the Indonesian model developed by Poupon and Leveaux [32] for shaly sand reservoirs [33] discussed the equation in detail and its suitability for these reservoirs. Core water saturation data were retrieved from the conventional core analysis report.

3.1.4. Permeability Determination

A continuous permeability log curve was calculated using the regression equations obtained from the core porosity-versus-core permeability cross plots.
The following equations were used:
KZN1 = 10(−4.66982 + 40.3964 × core porosity)
KZN3 = 10(−2.07995 + 24.0872 × core porosity)
KZN4 = 10(−2.75675 + 27.9181 × core porosity)

3.2. Core Description

Core samples retrieved from the reservoirs were visually examined at PASA core laboratory and integrated with core description reports, also provided by PASA. The studied reservoirs were categorized based on texture, grain size, and sorting of the sediments.

3.3. Mineralogy Analyses

Twelve rock samples were prepared for thin section, and six rock samples for SEM analyses to thoroughly investigate the presence of diagenetic minerals in the reservoir units. For SEM analysis, the samples were cut, polished, and coated with gold for about 15 min before analysis. The thin sections were necessary for an optical microscopic study to determine mineral composition, rock textures, cement, and grains’ shape and size. Additionally, SEM and EDX helped with identifying the morphological and elemental compositions of the clay minerals. The scanning electron microscope (SEM) analyses were conducted using JCM-6000 Plus Neoscope Benchtop SEM manufactured by Thermo Fisher Scientific based in Waltham, Massachusets, United States. This equipment complements both optical microscopes and traditional SEMs and can be configured for advanced analytical applications. The instrument is equipped with the electron optics of an SEM, with up to 60,000× magnification. A sample of rock was placed inside the JCM-6000 Plus for imaging. Both low- and high-vacuum modes were used to obtain the best possible results. This analysis helped to identify the morphology and the nature of the clay minerals between the rock grains. The detailed structure of the clay minerals was not identified through thin section analysis; hence, it was vital to conduct SEM analysis. Full-featured energy-dispersive spectroscopy (EDS) with silicon drift detectors (SDDs) technology was optically available for analytical applications. EDS detected the major and minor chemical elements within the rock sample to help identify the mineral types and chemical compositions.

4. Results

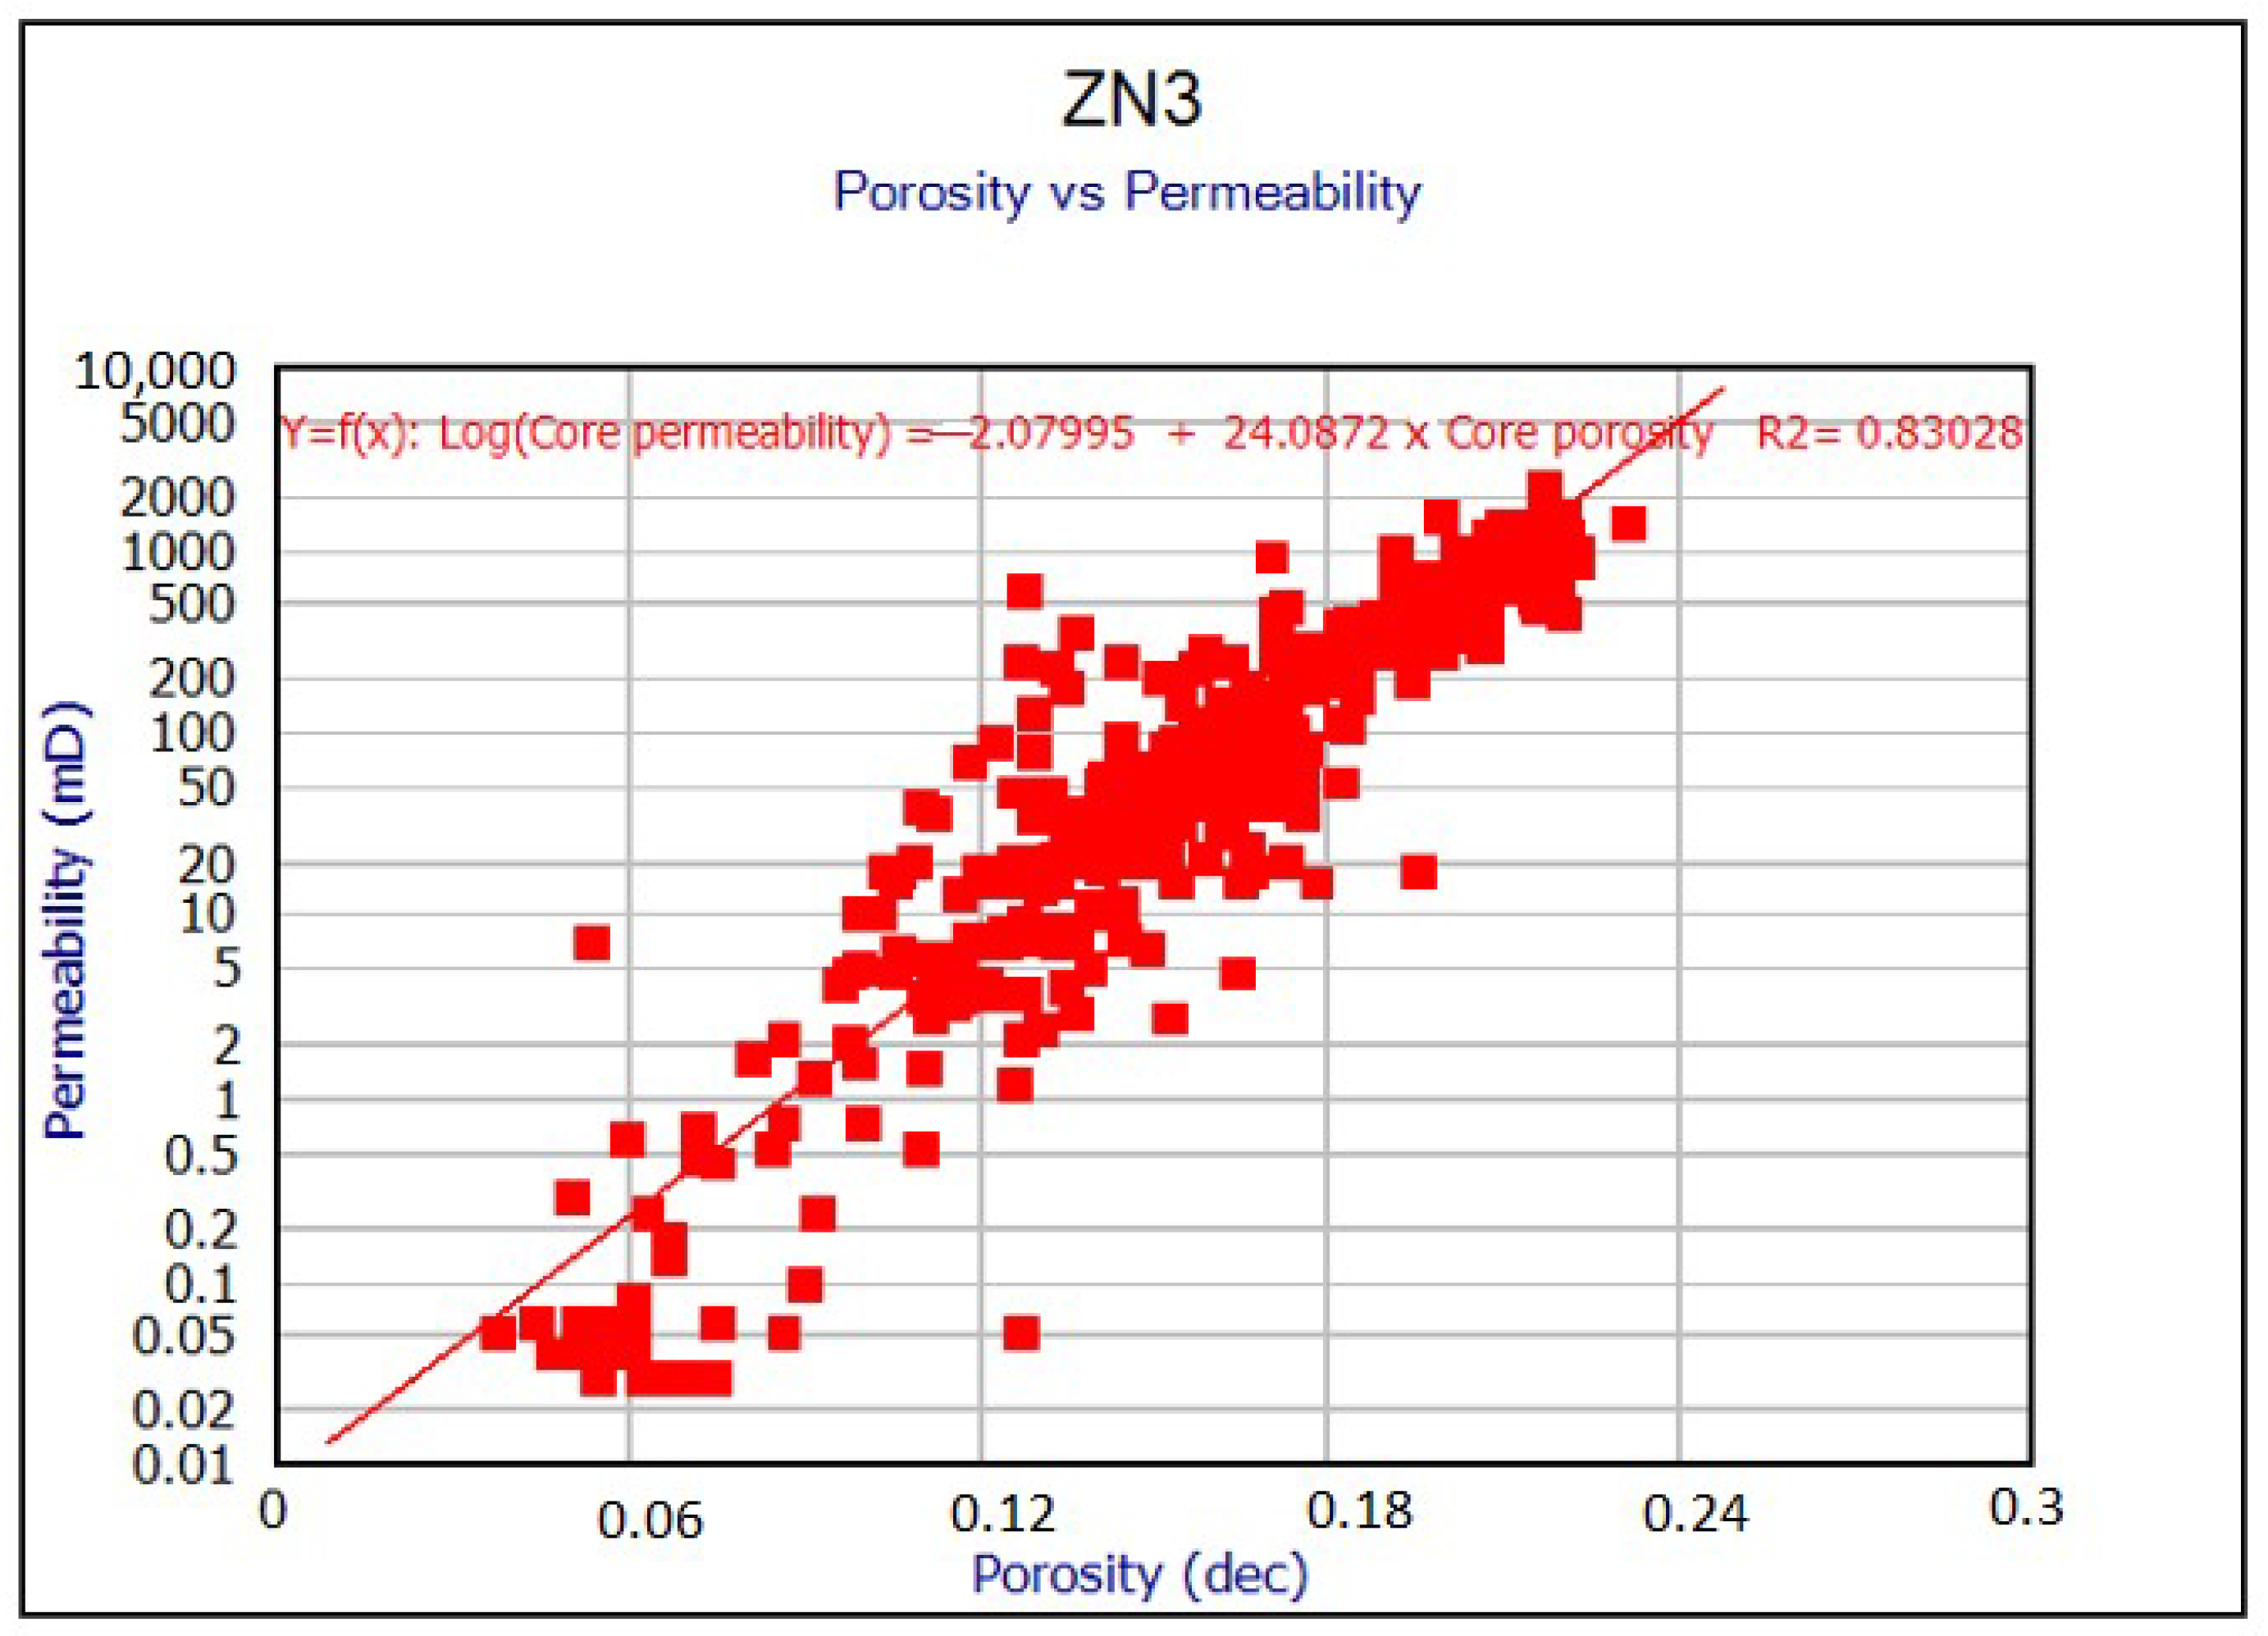
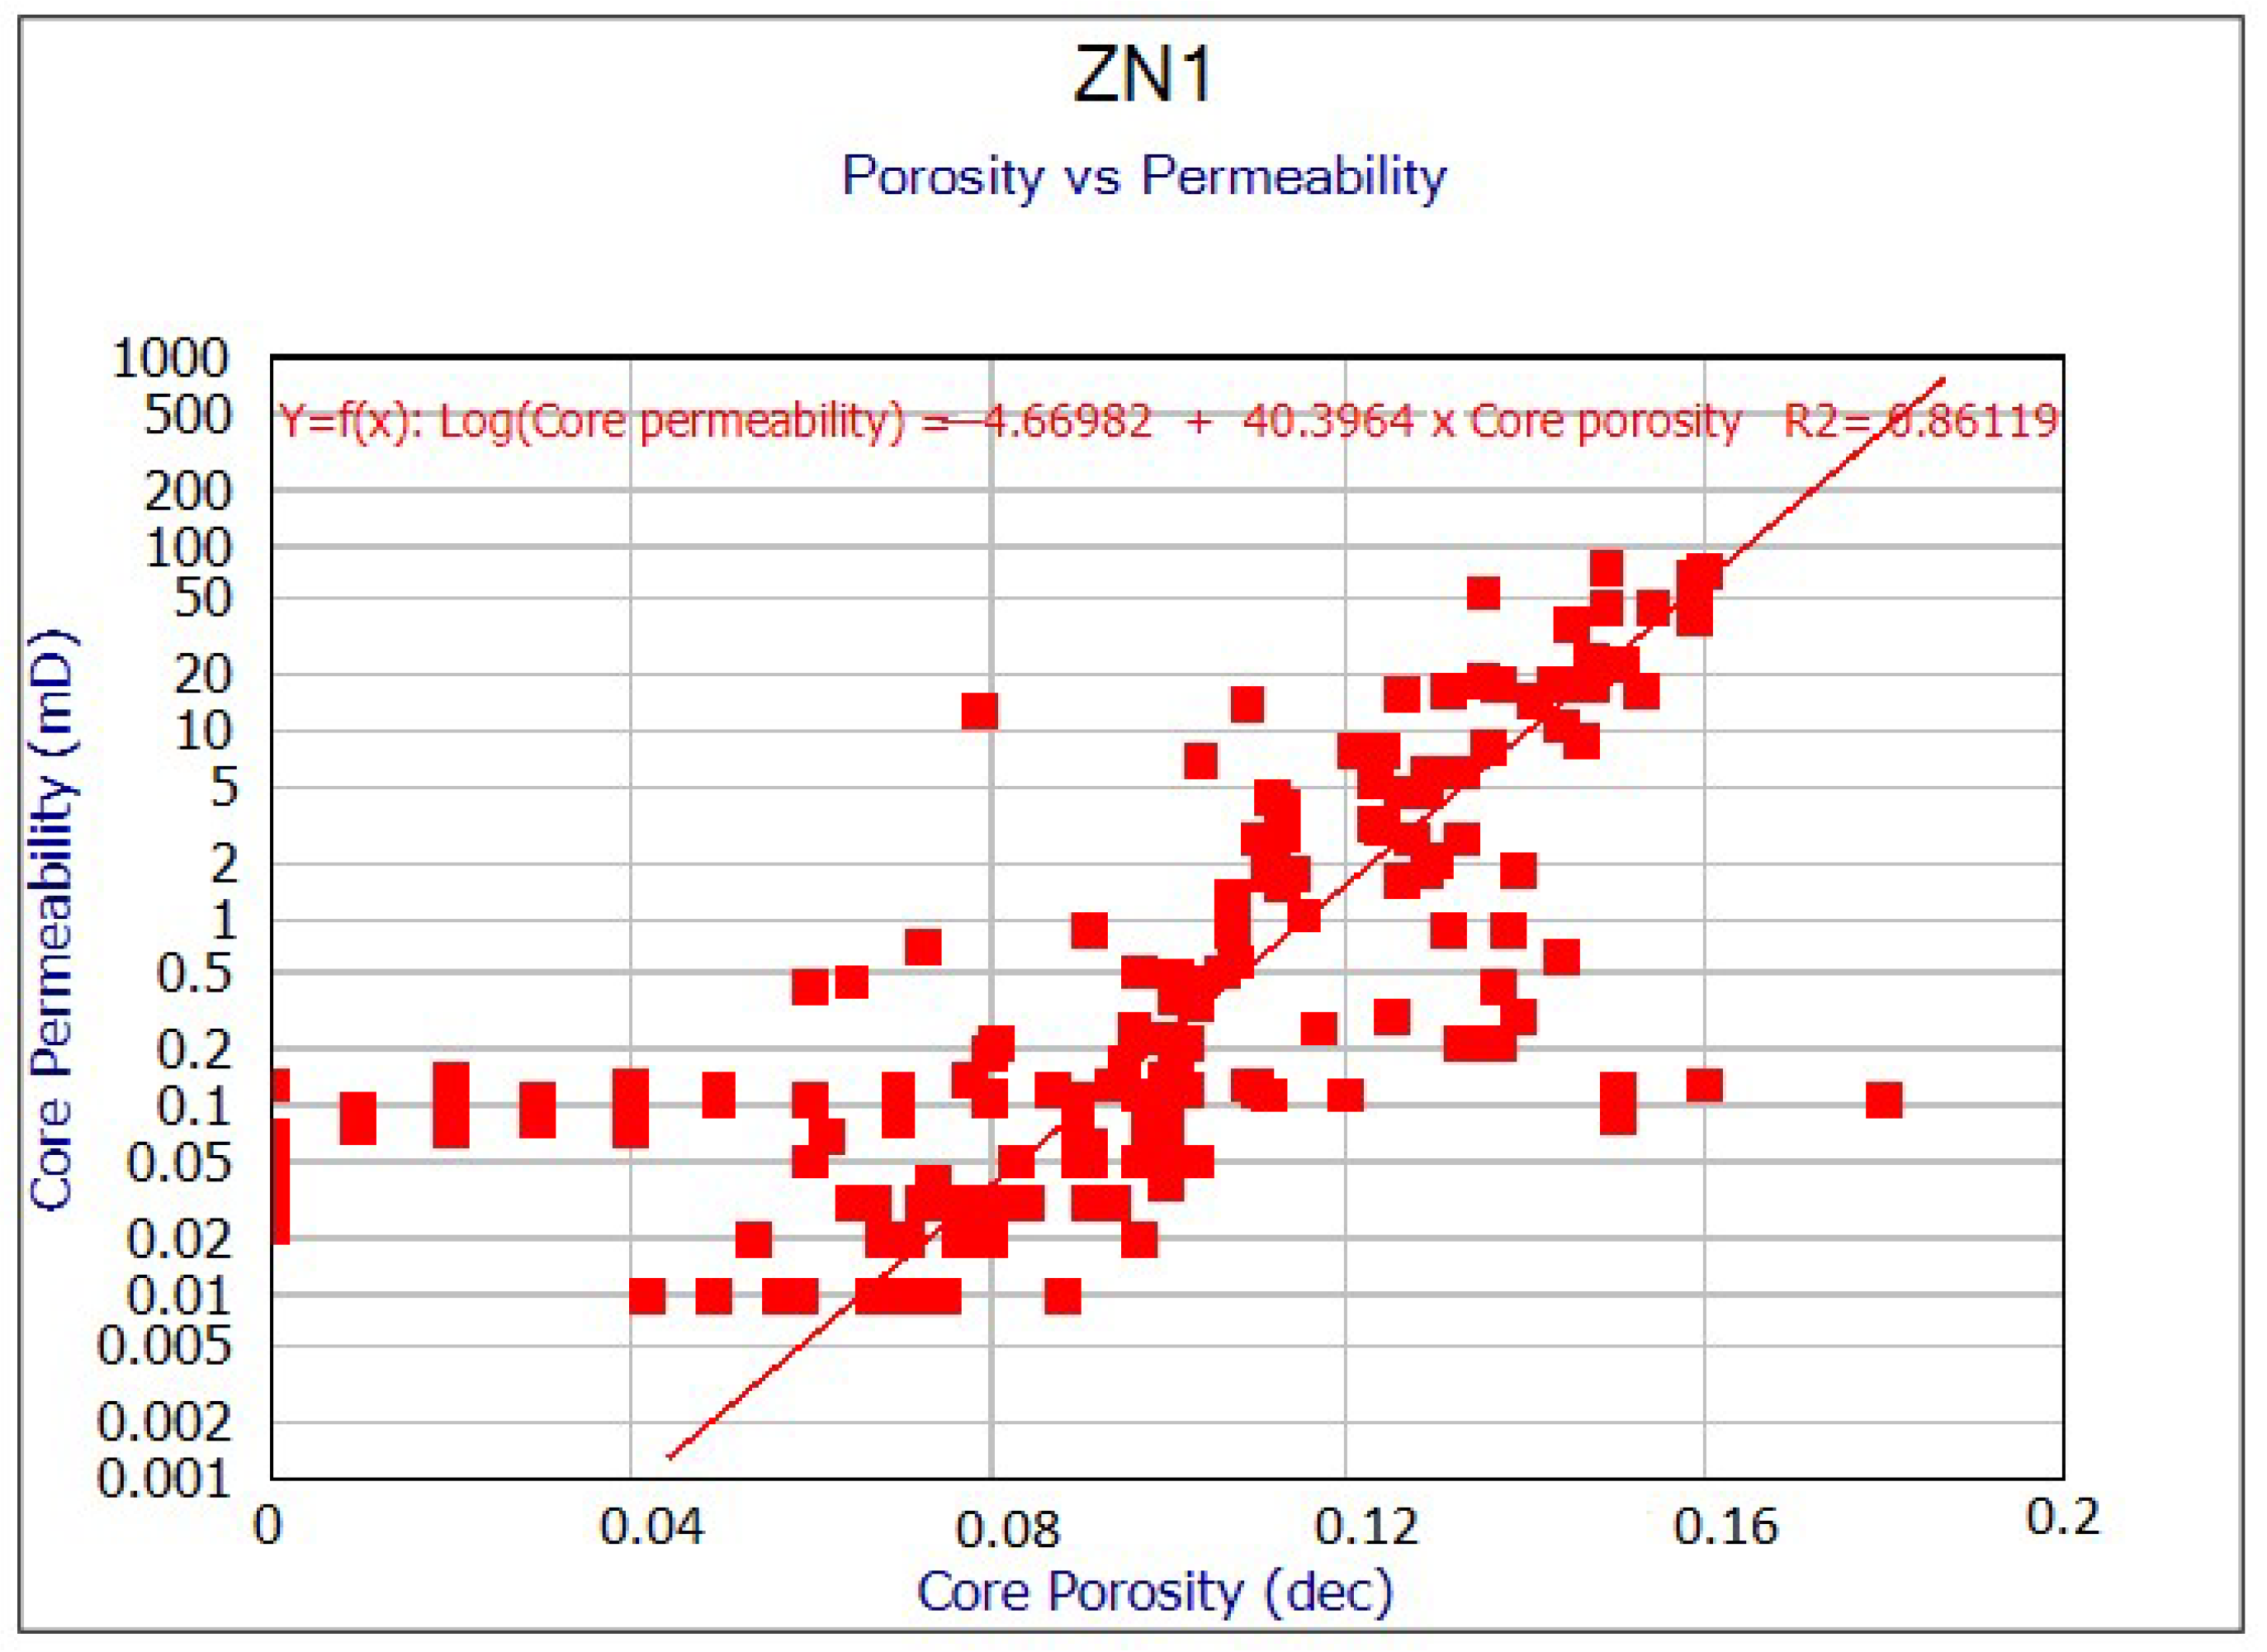
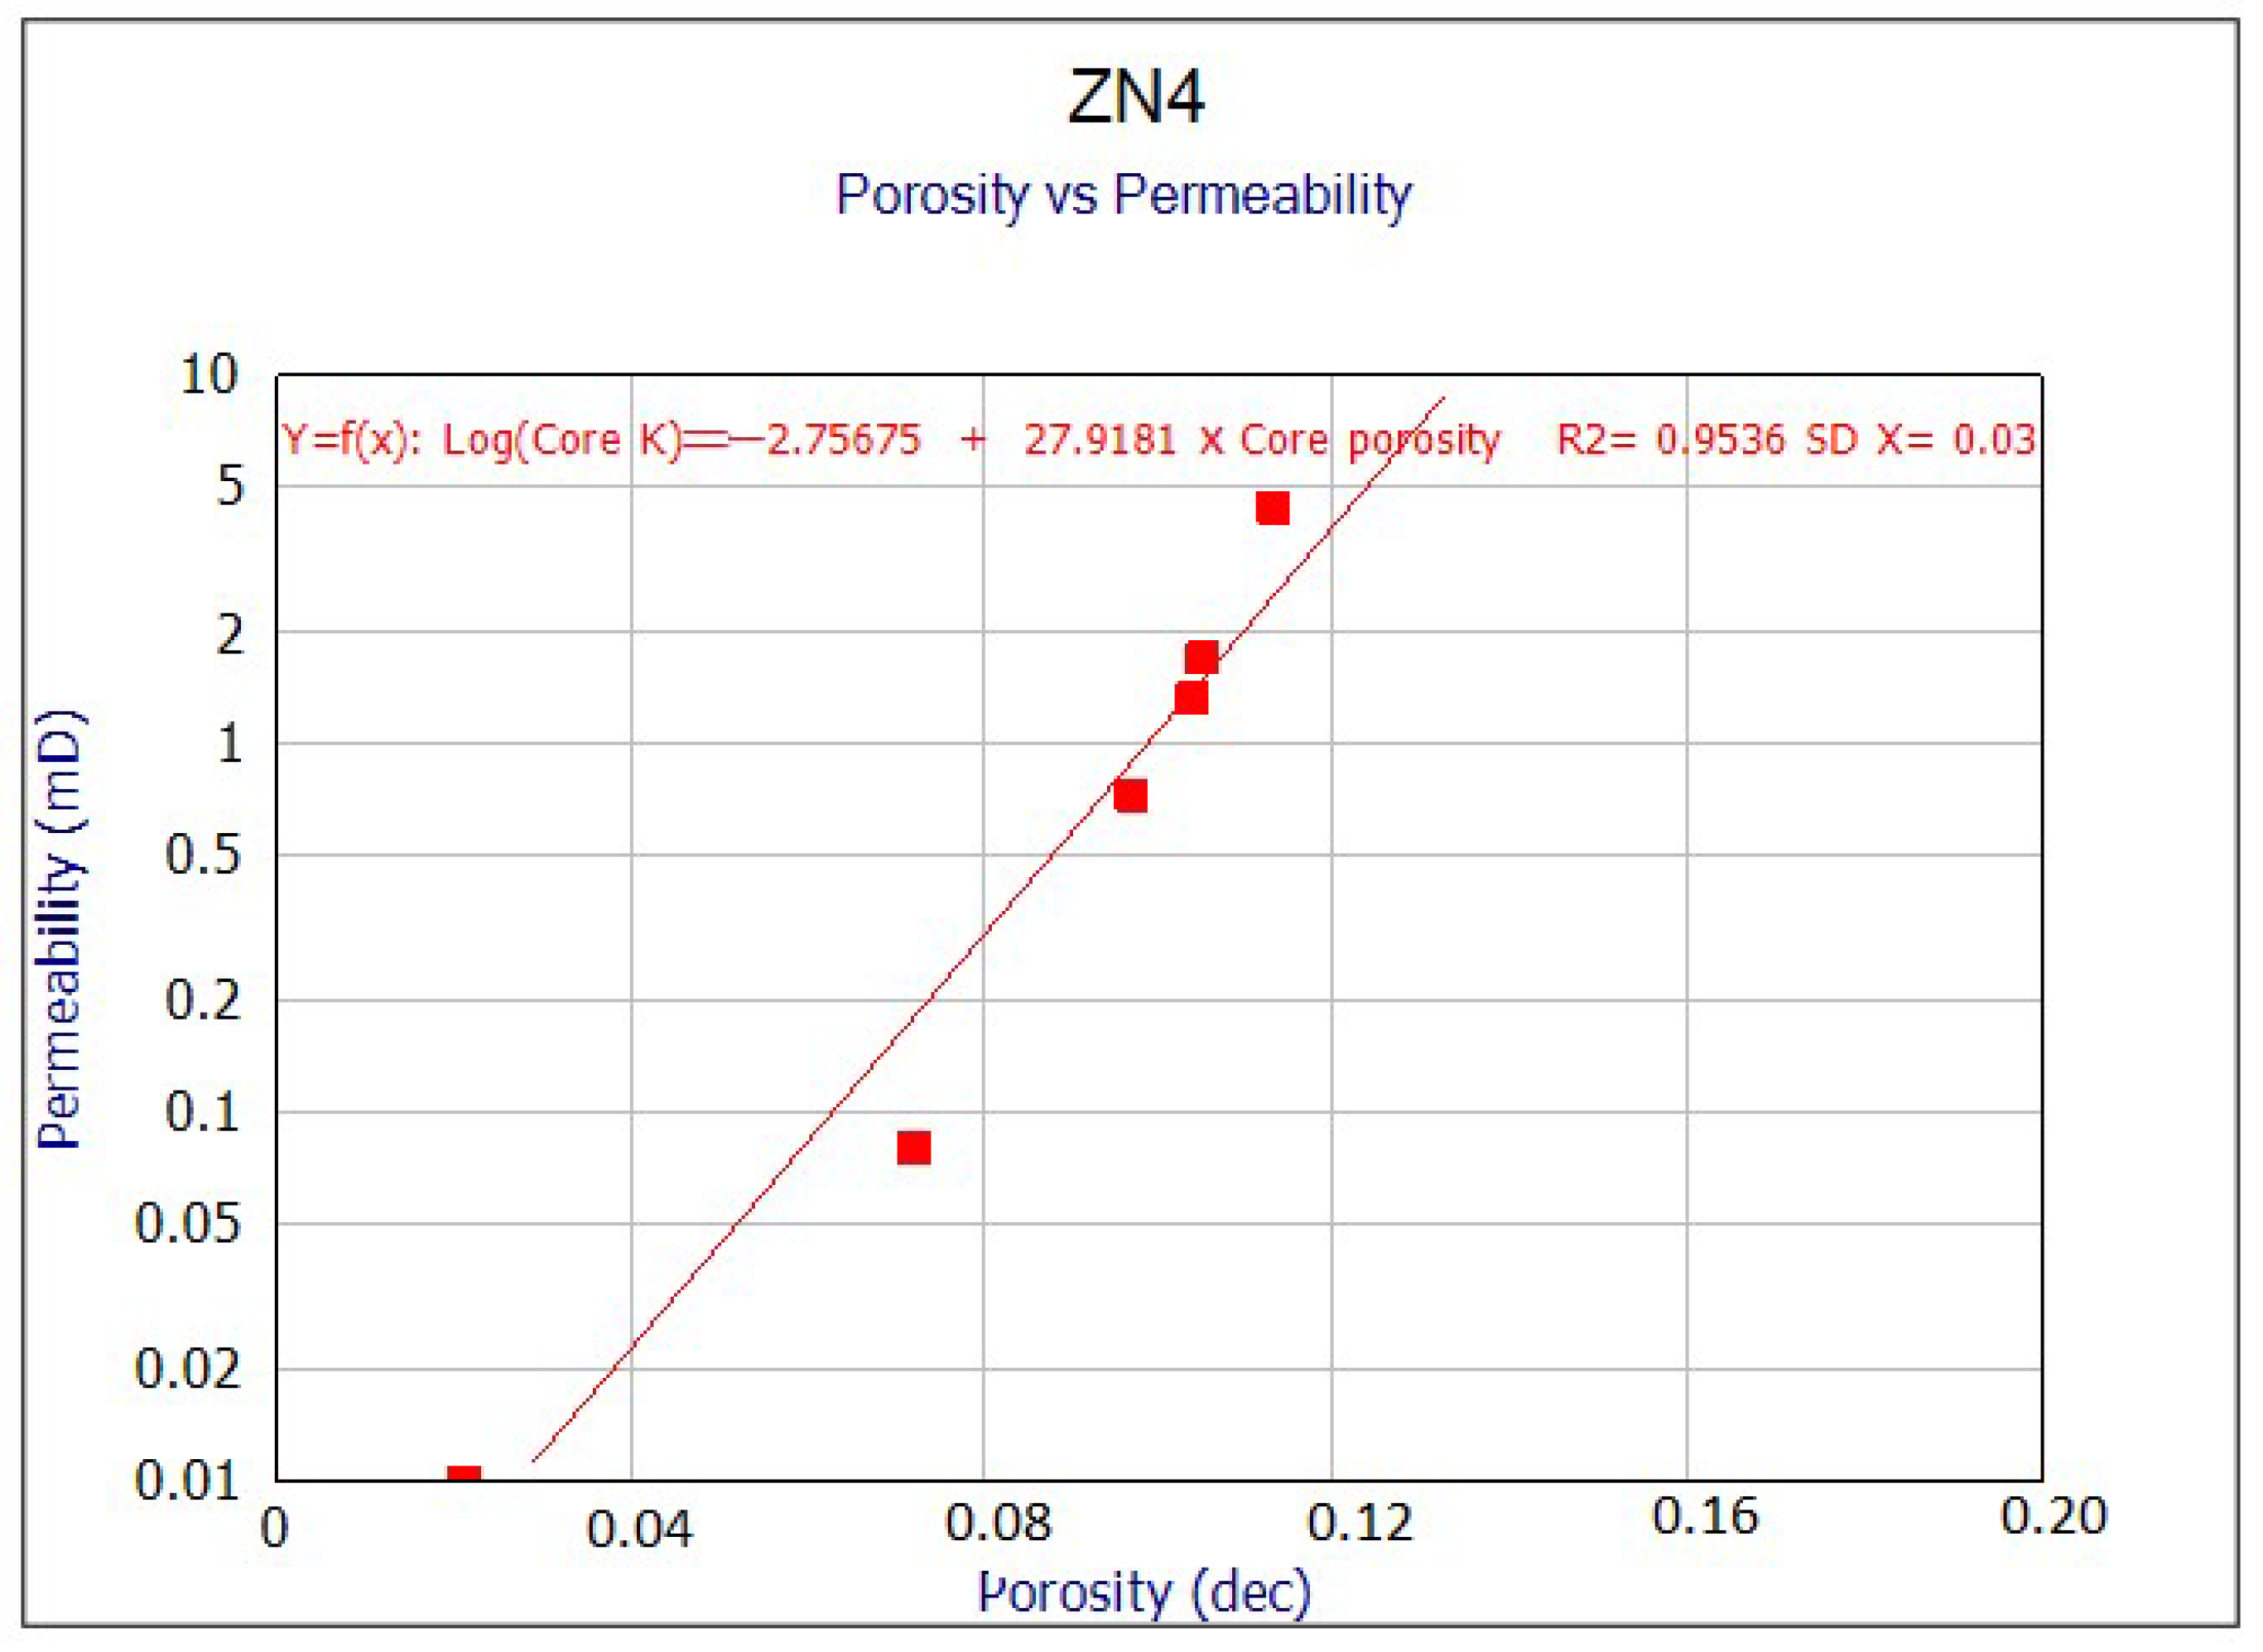
4.1. Relationship between Core Porosity and Core Permeability

The major control of permeability in the sandstone reservoirs is porosity because the larger the pore spaces between the grains, the more extensive the fluid flow pathways. In nearly every case, a plot of permeability (introduced on a logarithmic scale) against porosity (in direct scale) for a formation results in a clear pattern with a degree of scatter that is associated with other geological controls impacting the permeability [34]. The porosity/permeability (POROPERM) cross plot is plotted for a clearly defined lithology or reservoir zone for better results. The POROPERM was plotted for all three wells using core data in this study. The regression coefficients (R2) obtained from the plots were used to determine the strength of the relationship between porosity and permeability. ZN1, ZN3, and ZN4 POROPERM plots (Figure 3, Figure 4 and Figure 5) show regression coefficients of 0.86, 0.83, and 0.95, respectively. The regression values of 0.86 and 0.83 indicate a good relationship between porosity and permeability. The regression of 0.95 cannot be entirely relied on since most of the core data were negligible, and only six values were considered. The regression coefficient showed that porosity was not the only geological factor influencing permeability. There were other geological factors to consider, such as diagenetic factors.

4.2. Petrophysical Analysis

The reservoirs were extensively evaluated for their petrophysical properties using wireline logs and core data to assess their quality. The numerical average results of the calculated petrophysical parameters are shown in Table 1.

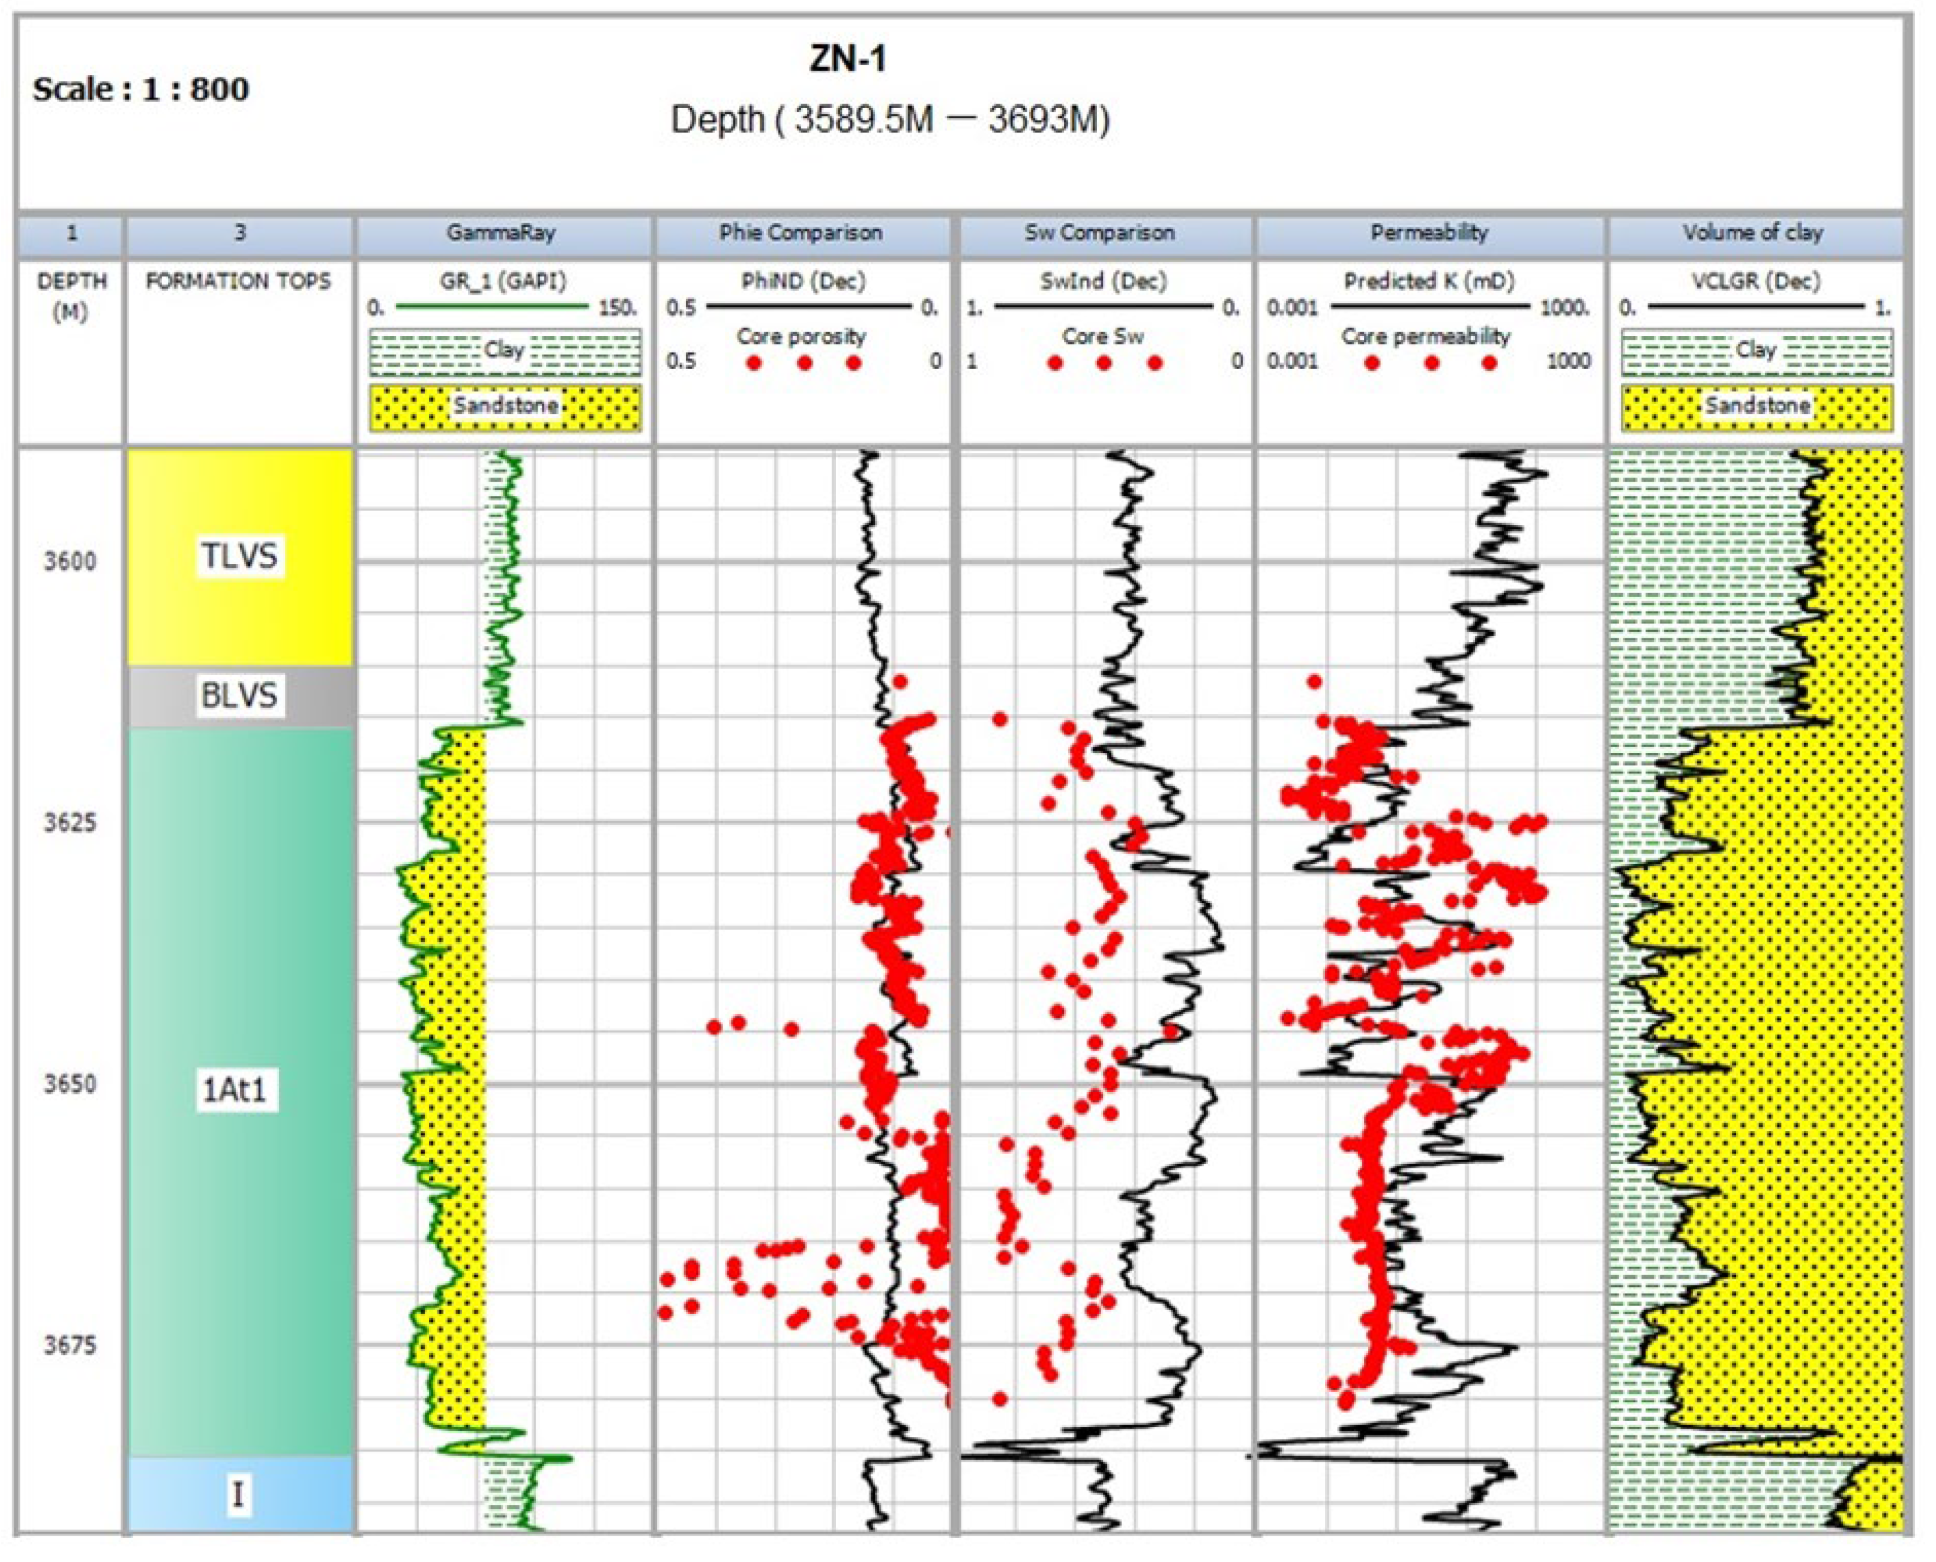
4.2.1. Well ZN1 Interpretation

The reservoir interval in well ZN1 extends from 3615.5 m to 3685.4 m with a maximum thickness of 108.7 m (Figure 6). Core porosity measurements ranged between 7.4 and 12% (avg. 10.8%). There was a good calibration between the core and calculated porosities except in a few places towards the lower part of the reservoir (Figure 6). The average water saturation, volume of clay, and permeability values were 25.5%, 23.3%, and 0.096 mD, respectively. A poor calibration (with discrepancies of more than 20%) exists between core water saturation and log-derived water saturation throughout the studied interval.

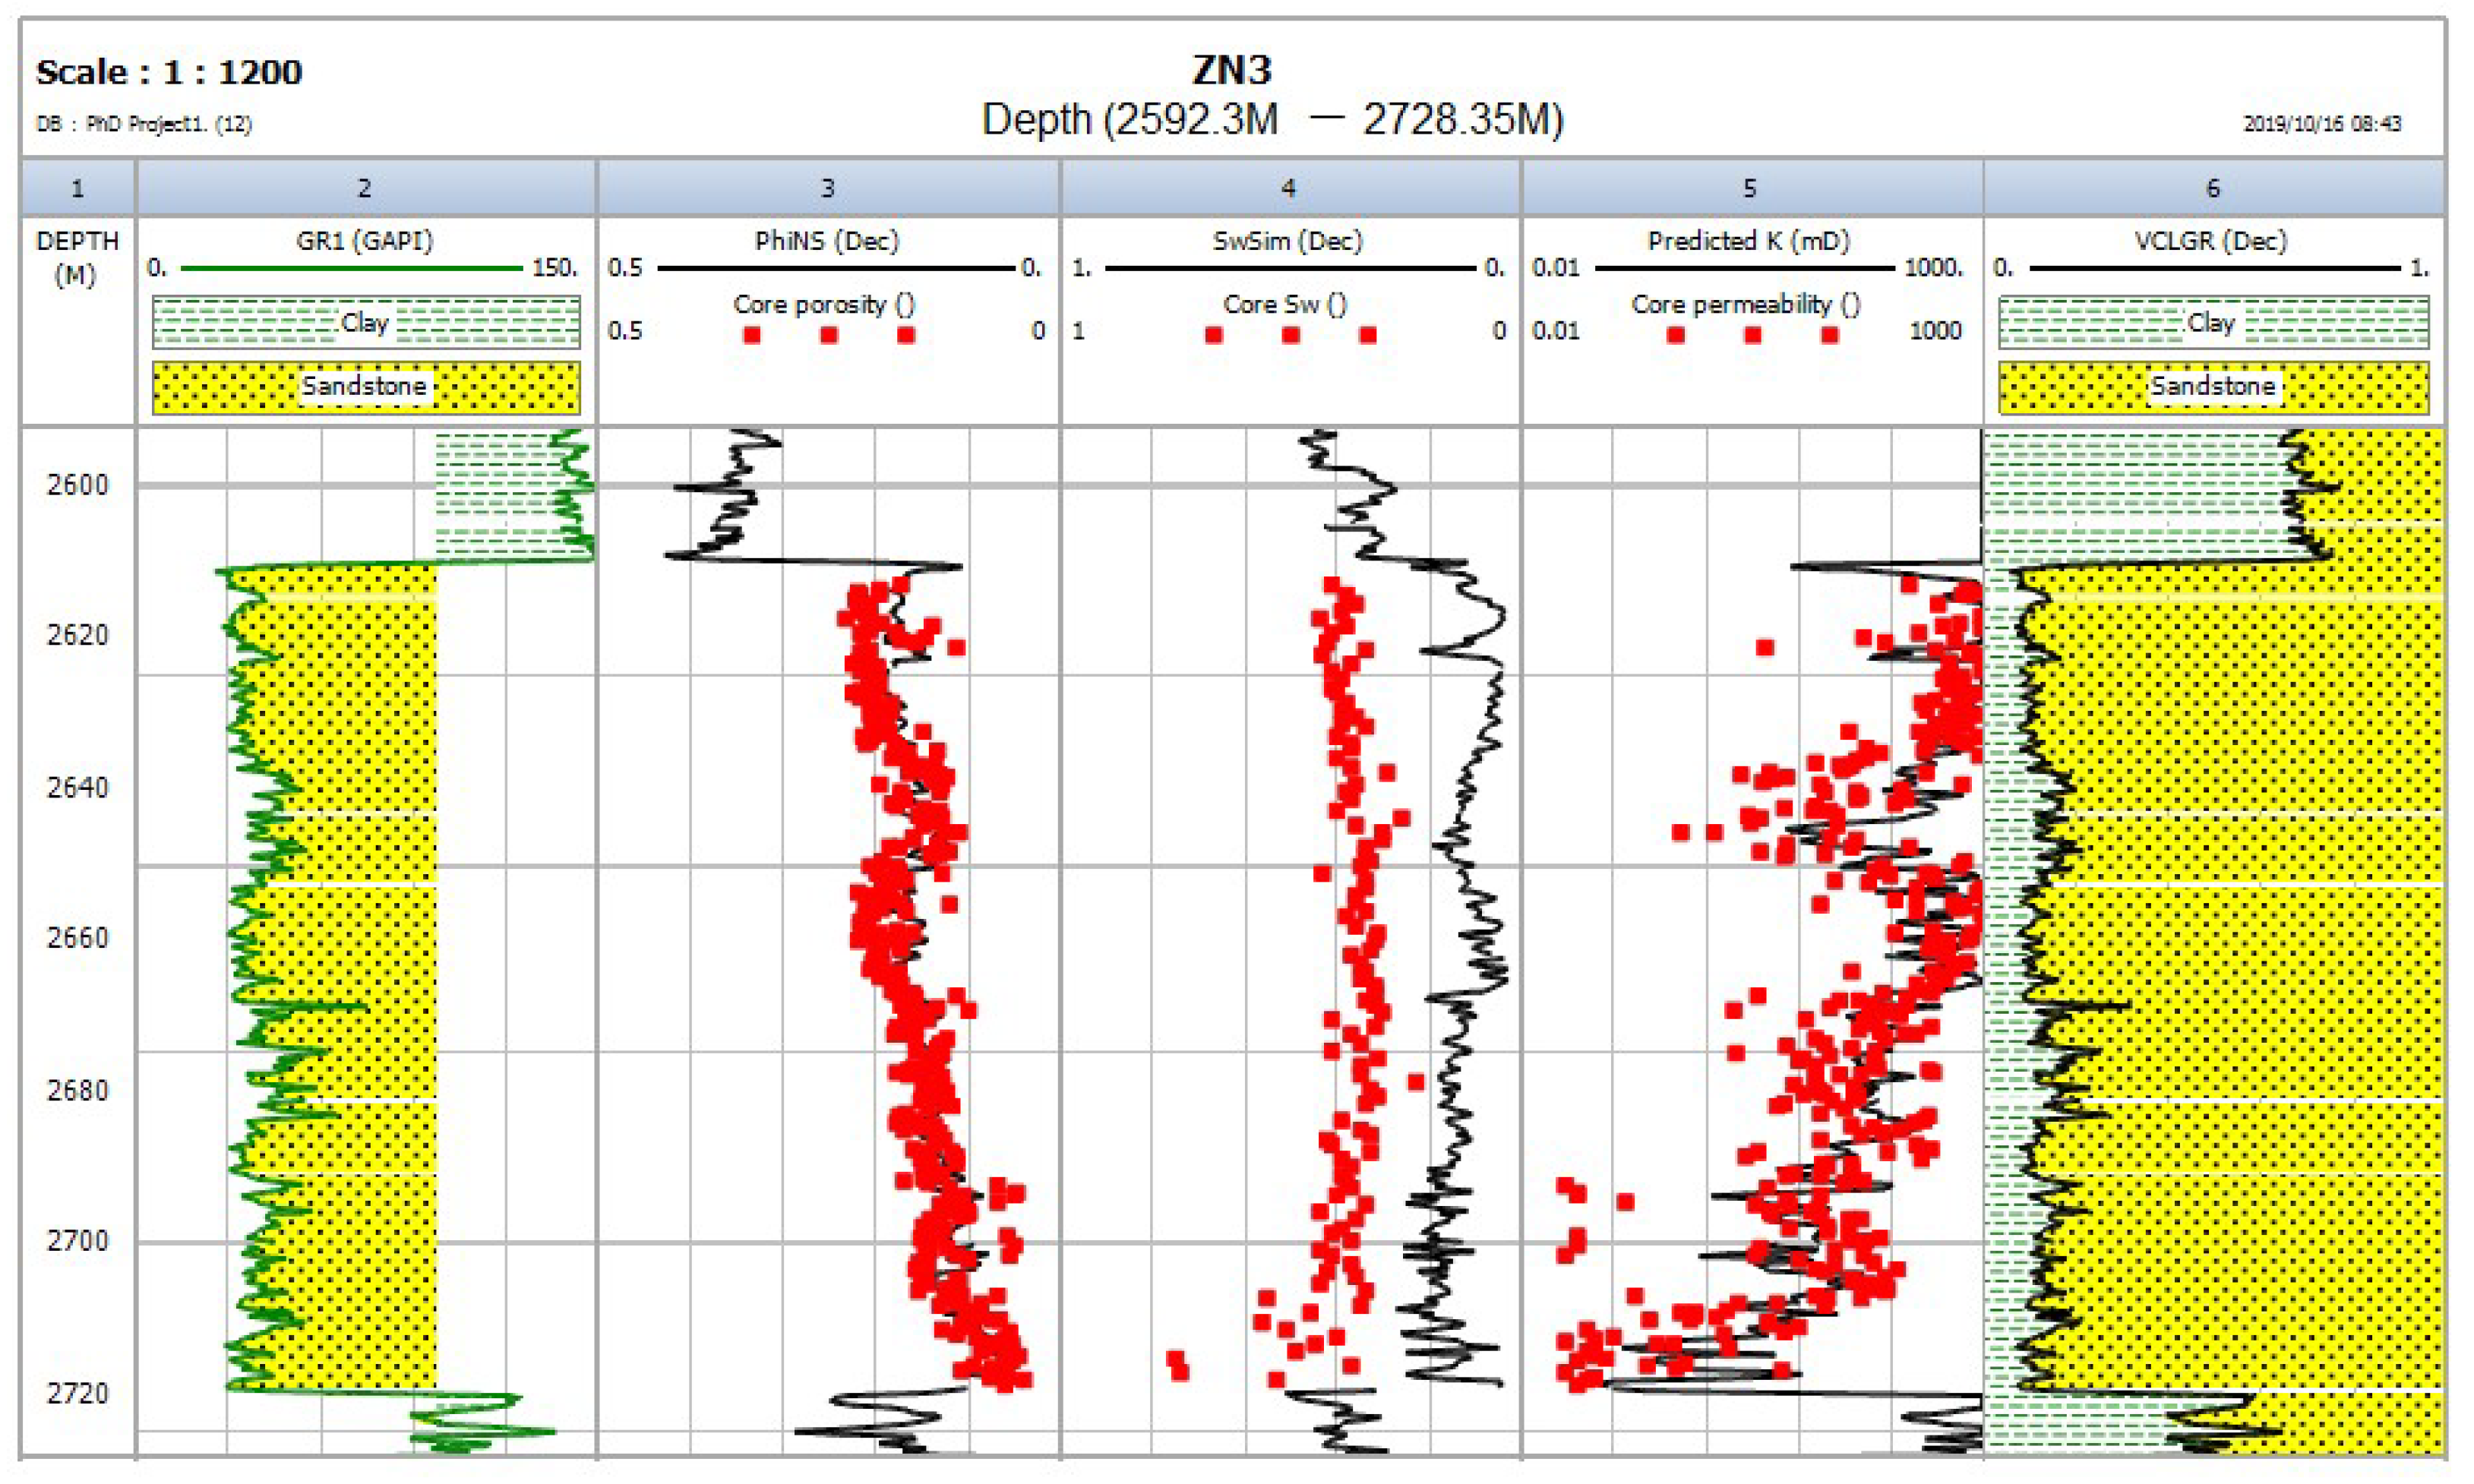
4.2.2. Well ZN3 Interpretation

The reservoir interval in well ZN3 (Figure 7) extends from 2610.3 m to 2720.4 m with a maximum thickness of 110.1 m and an average clay volume of 17.4%. Core porosity measurement ranged between 11.7% and 22.9% and recorded an average porosity of 16.6%. The calibration between the core and calculated porosity (Figure 4) showed an excellent relationship. The average water saturation and permeability values were estimated to be 12.5% and 151.8 mD. Similar to ZN1, poor calibration prevails between core and log-derived water saturation.

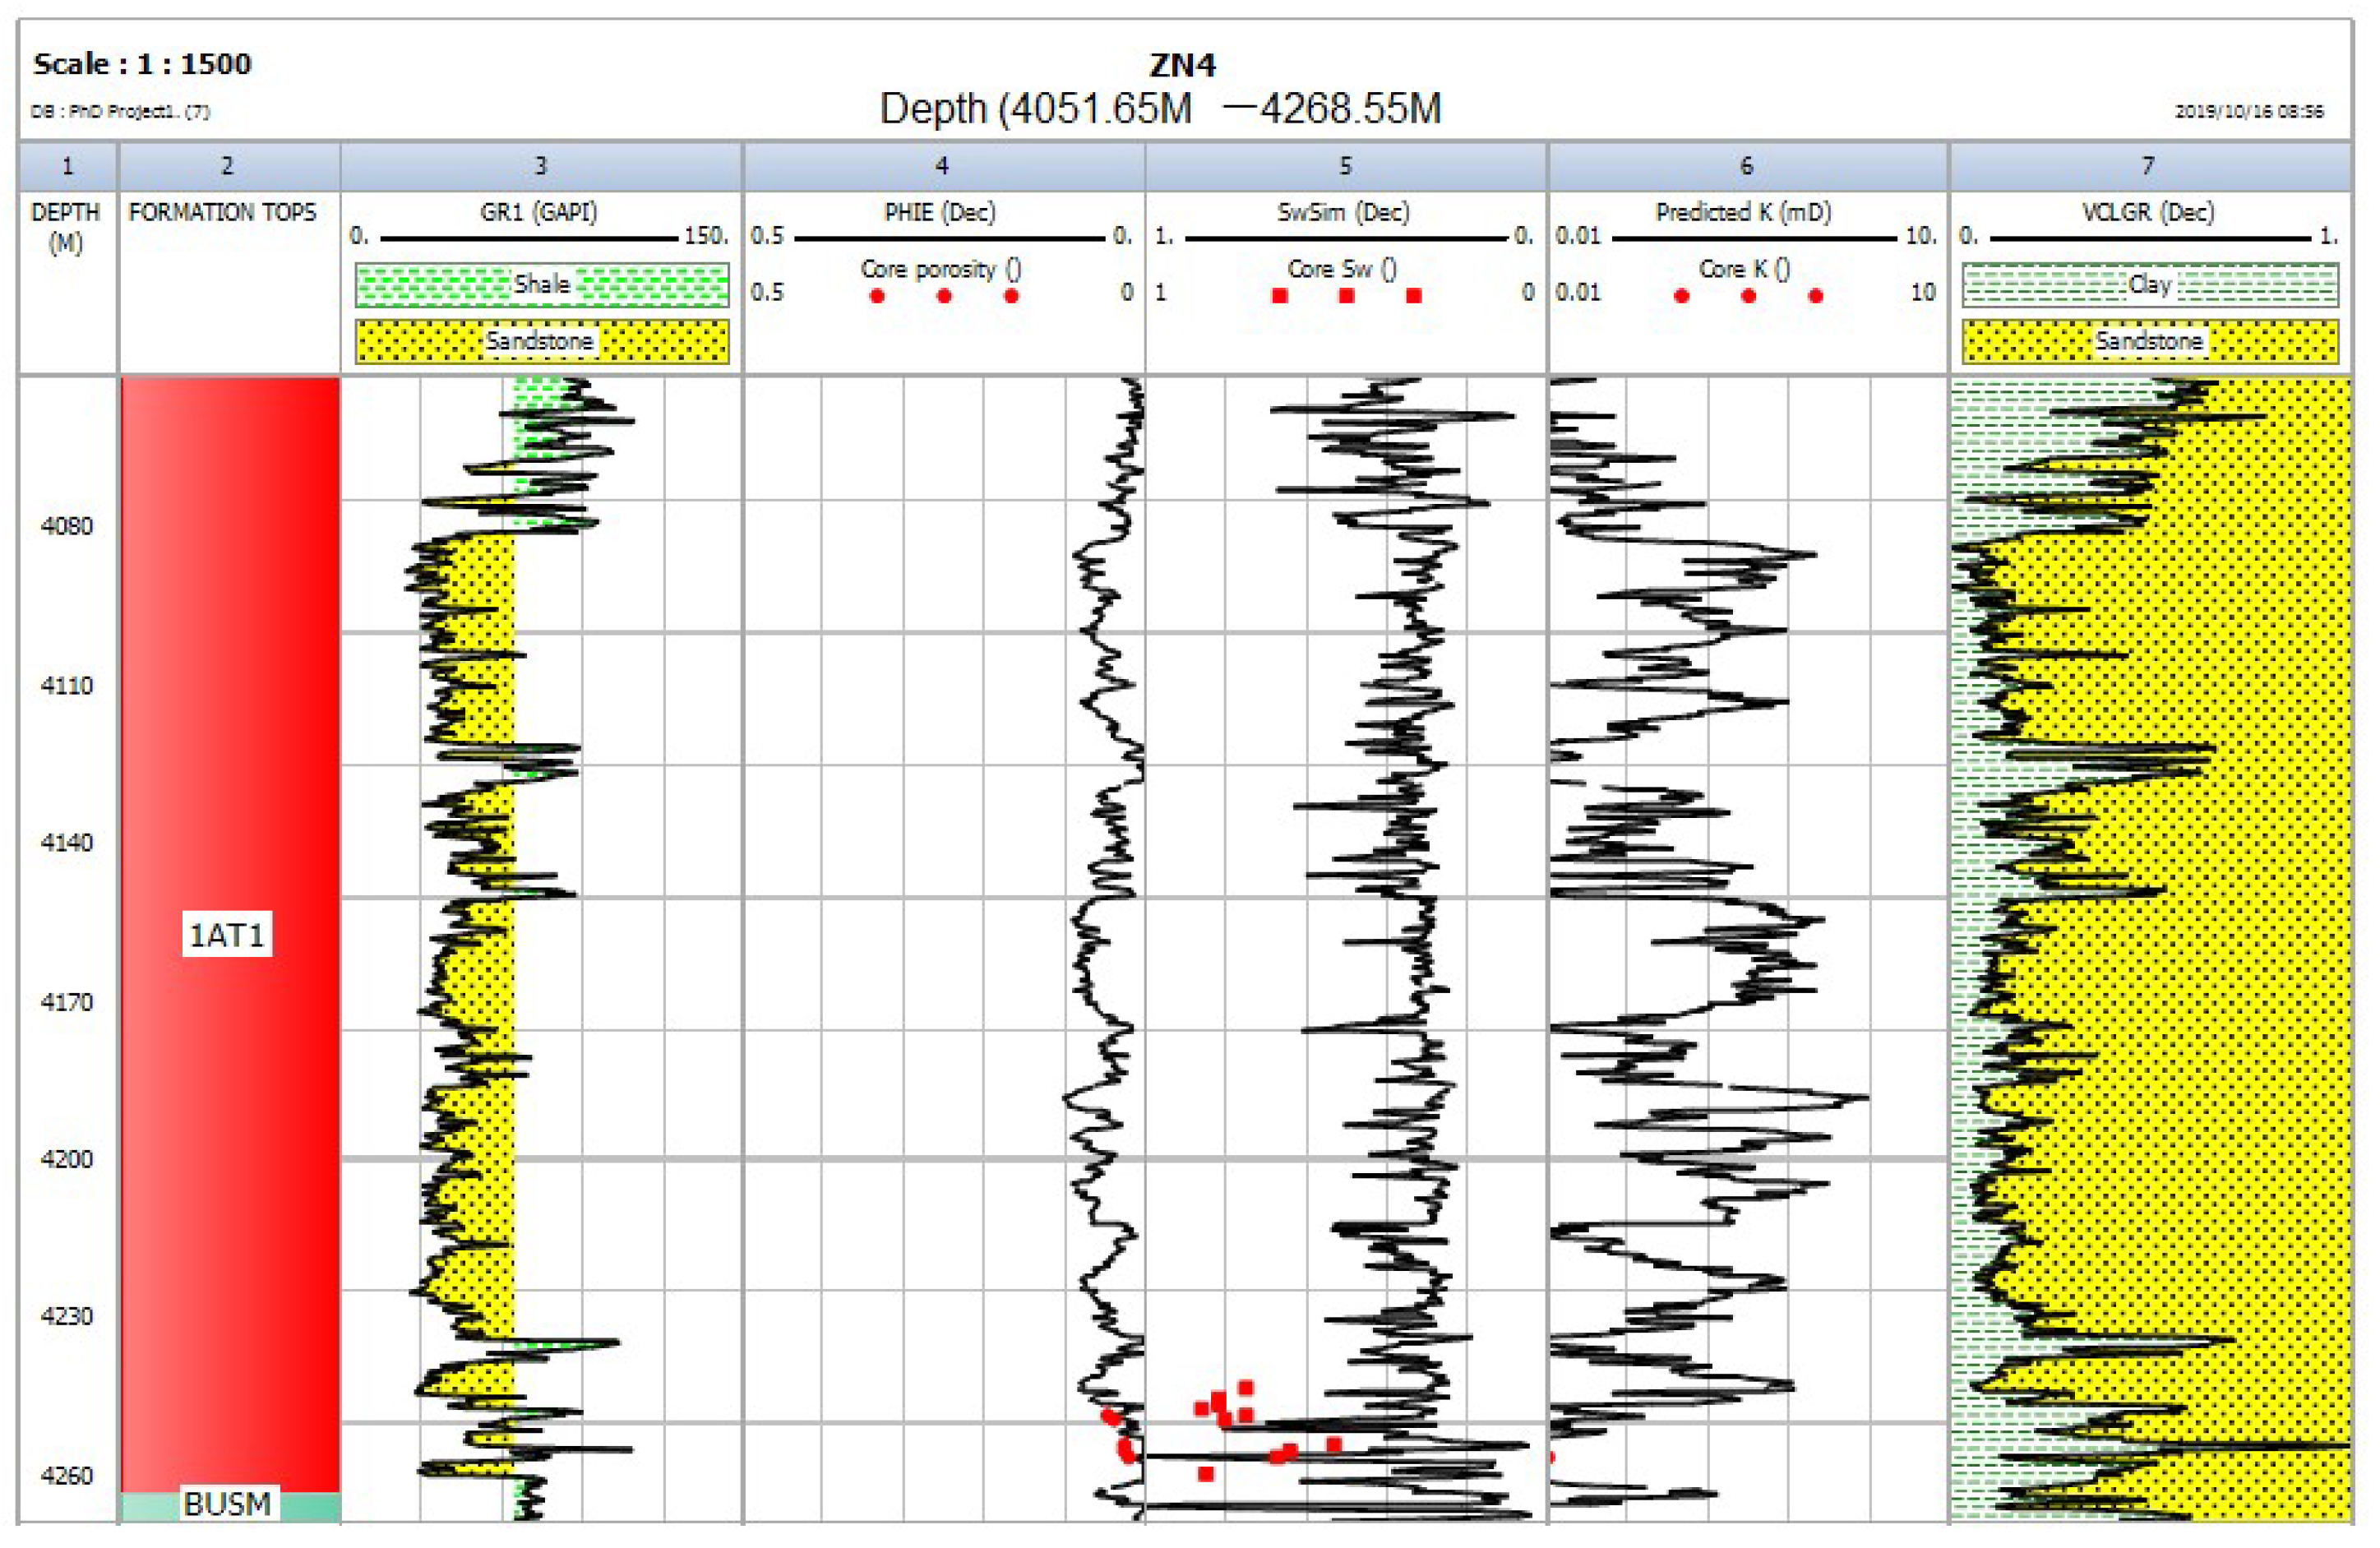
4.2.3. Well ZN4 Interpretation

The reservoir interval in well ZN4 (Figure 8) extends from 4081 m to 4246.7 m with a maximum thickness of 167.7 m. Core porosity ranged between 2.19% and 12.7%, with an average poor porosity of 9%. The calibration between the core and calculated porosity (Figure 5) could not be clearly determined because of the minimal core data. The average water saturation and permeability values were estimated to be 25.5% and 0.093 mD, respectively. The calibration between core water saturation and calculated water saturation displayed a poor relationship. The calibration between the calculated permeability log and the core permeability could not be established because the few measurements that were conducted showed negligible values.

4.3. Mineralogical Analyses

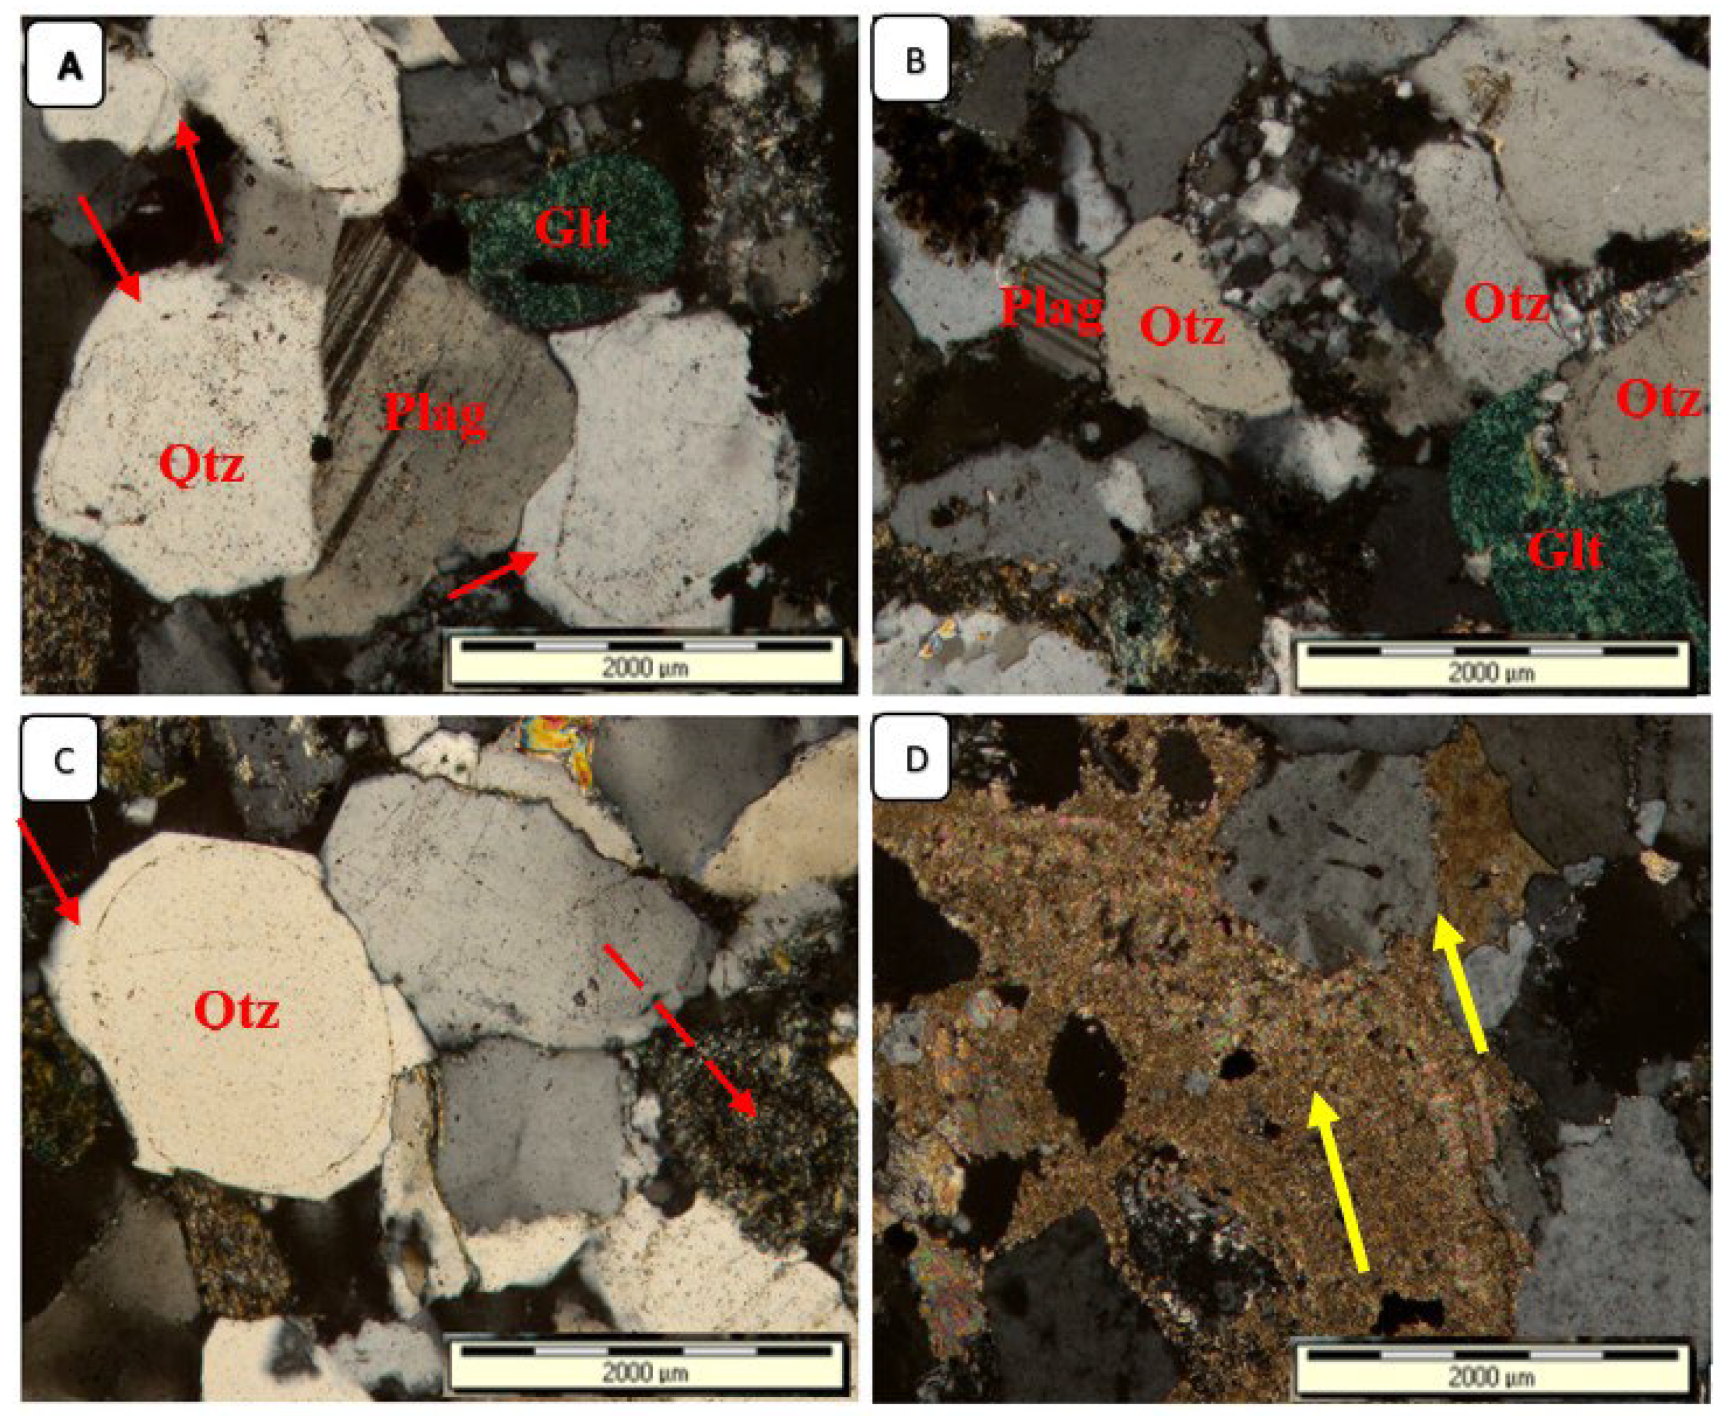
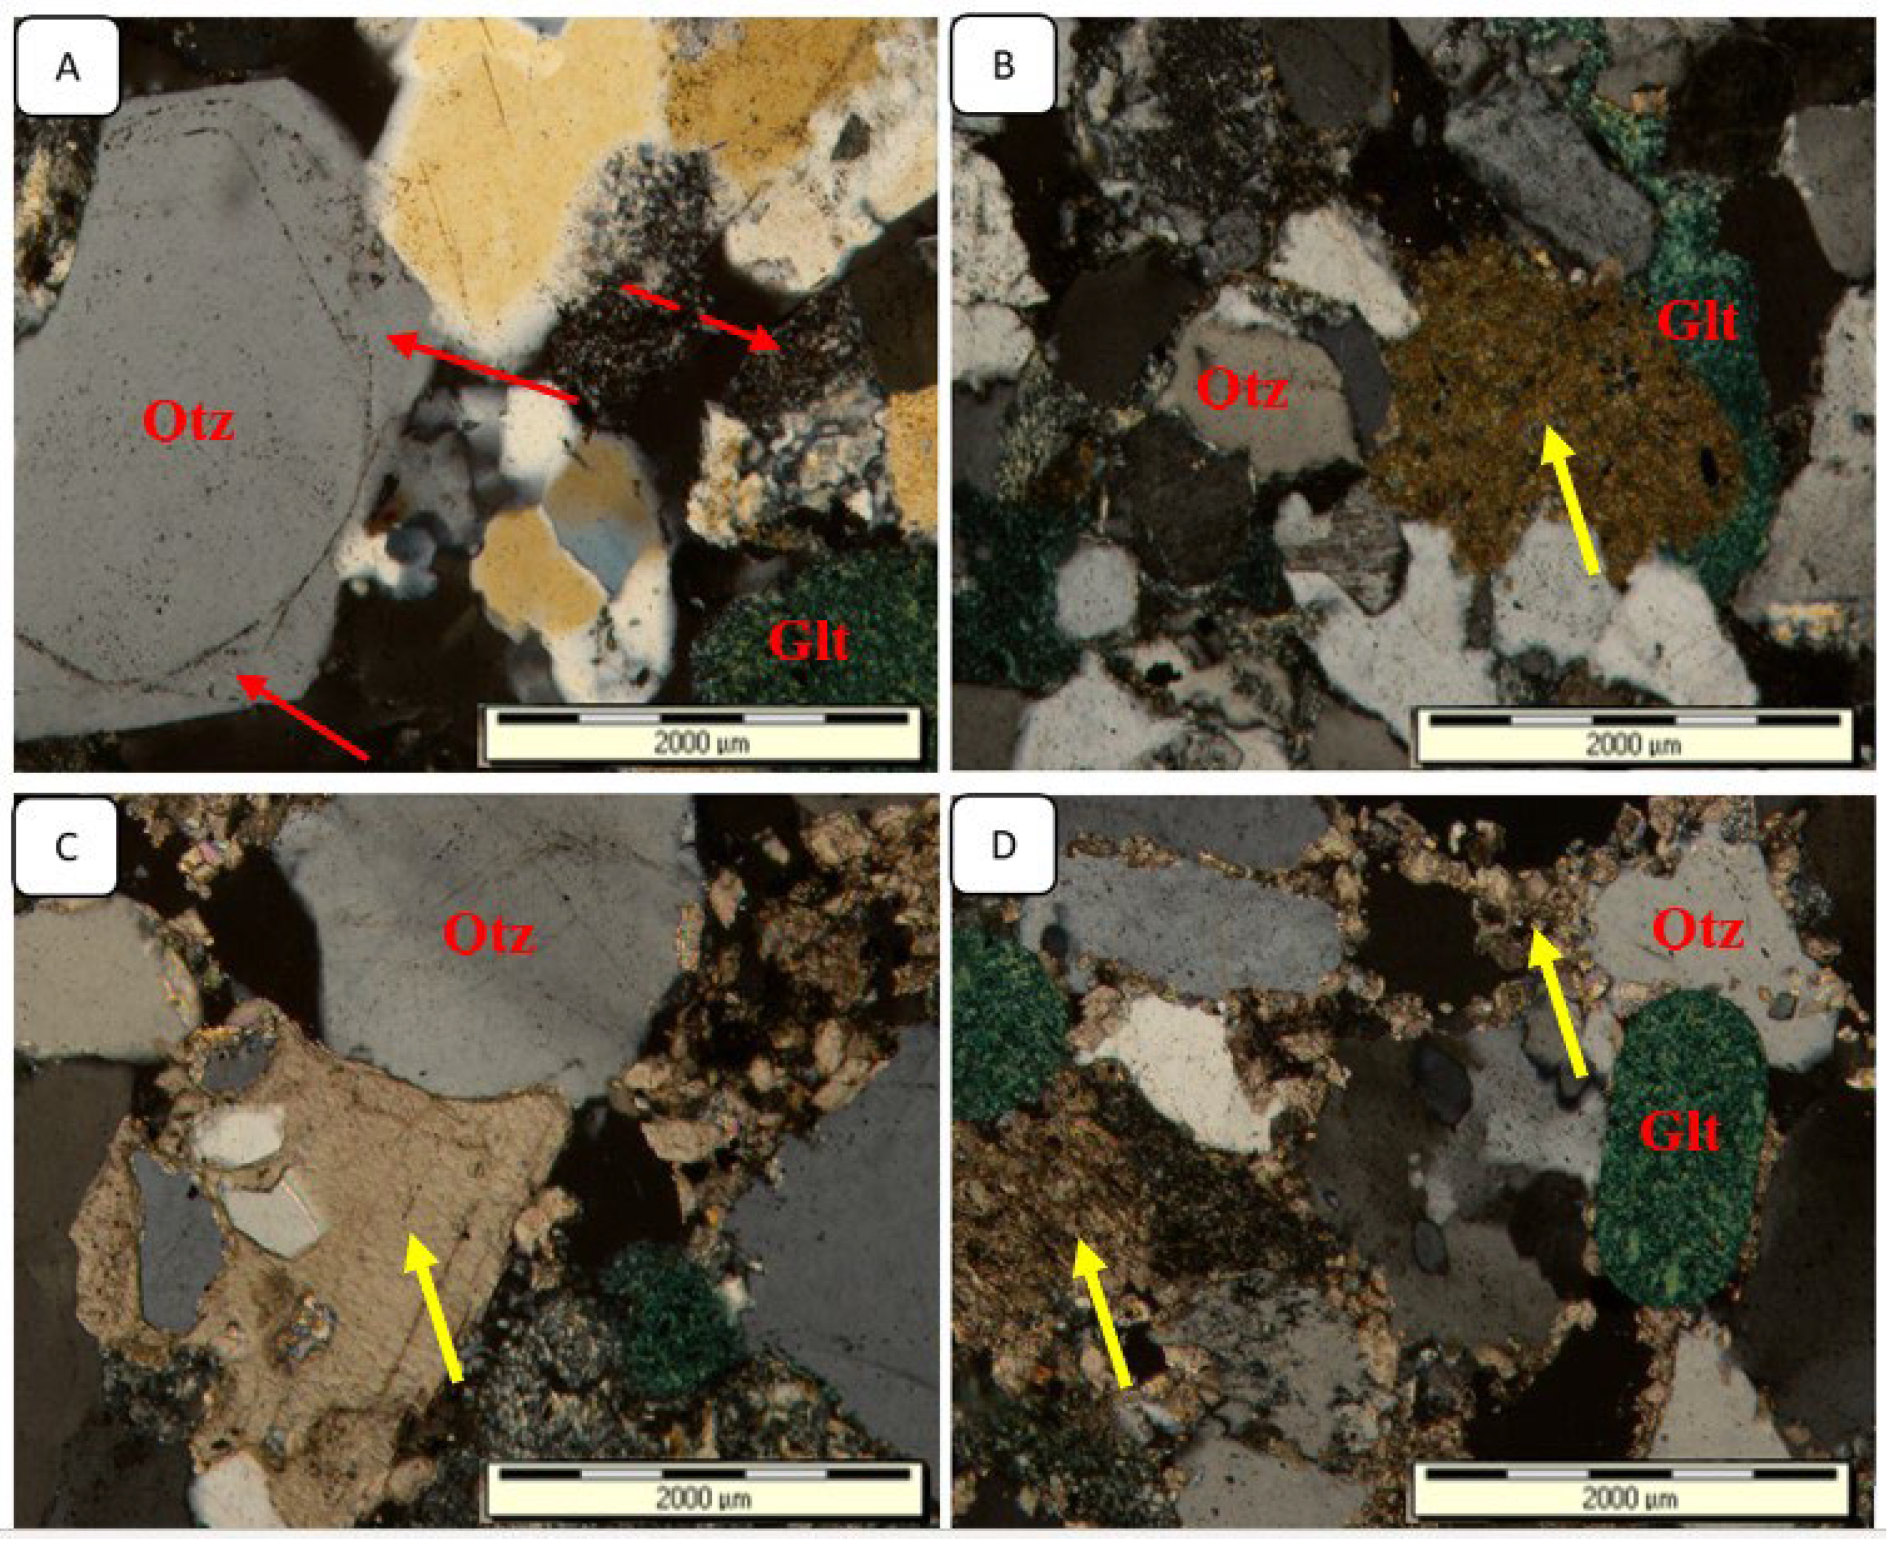
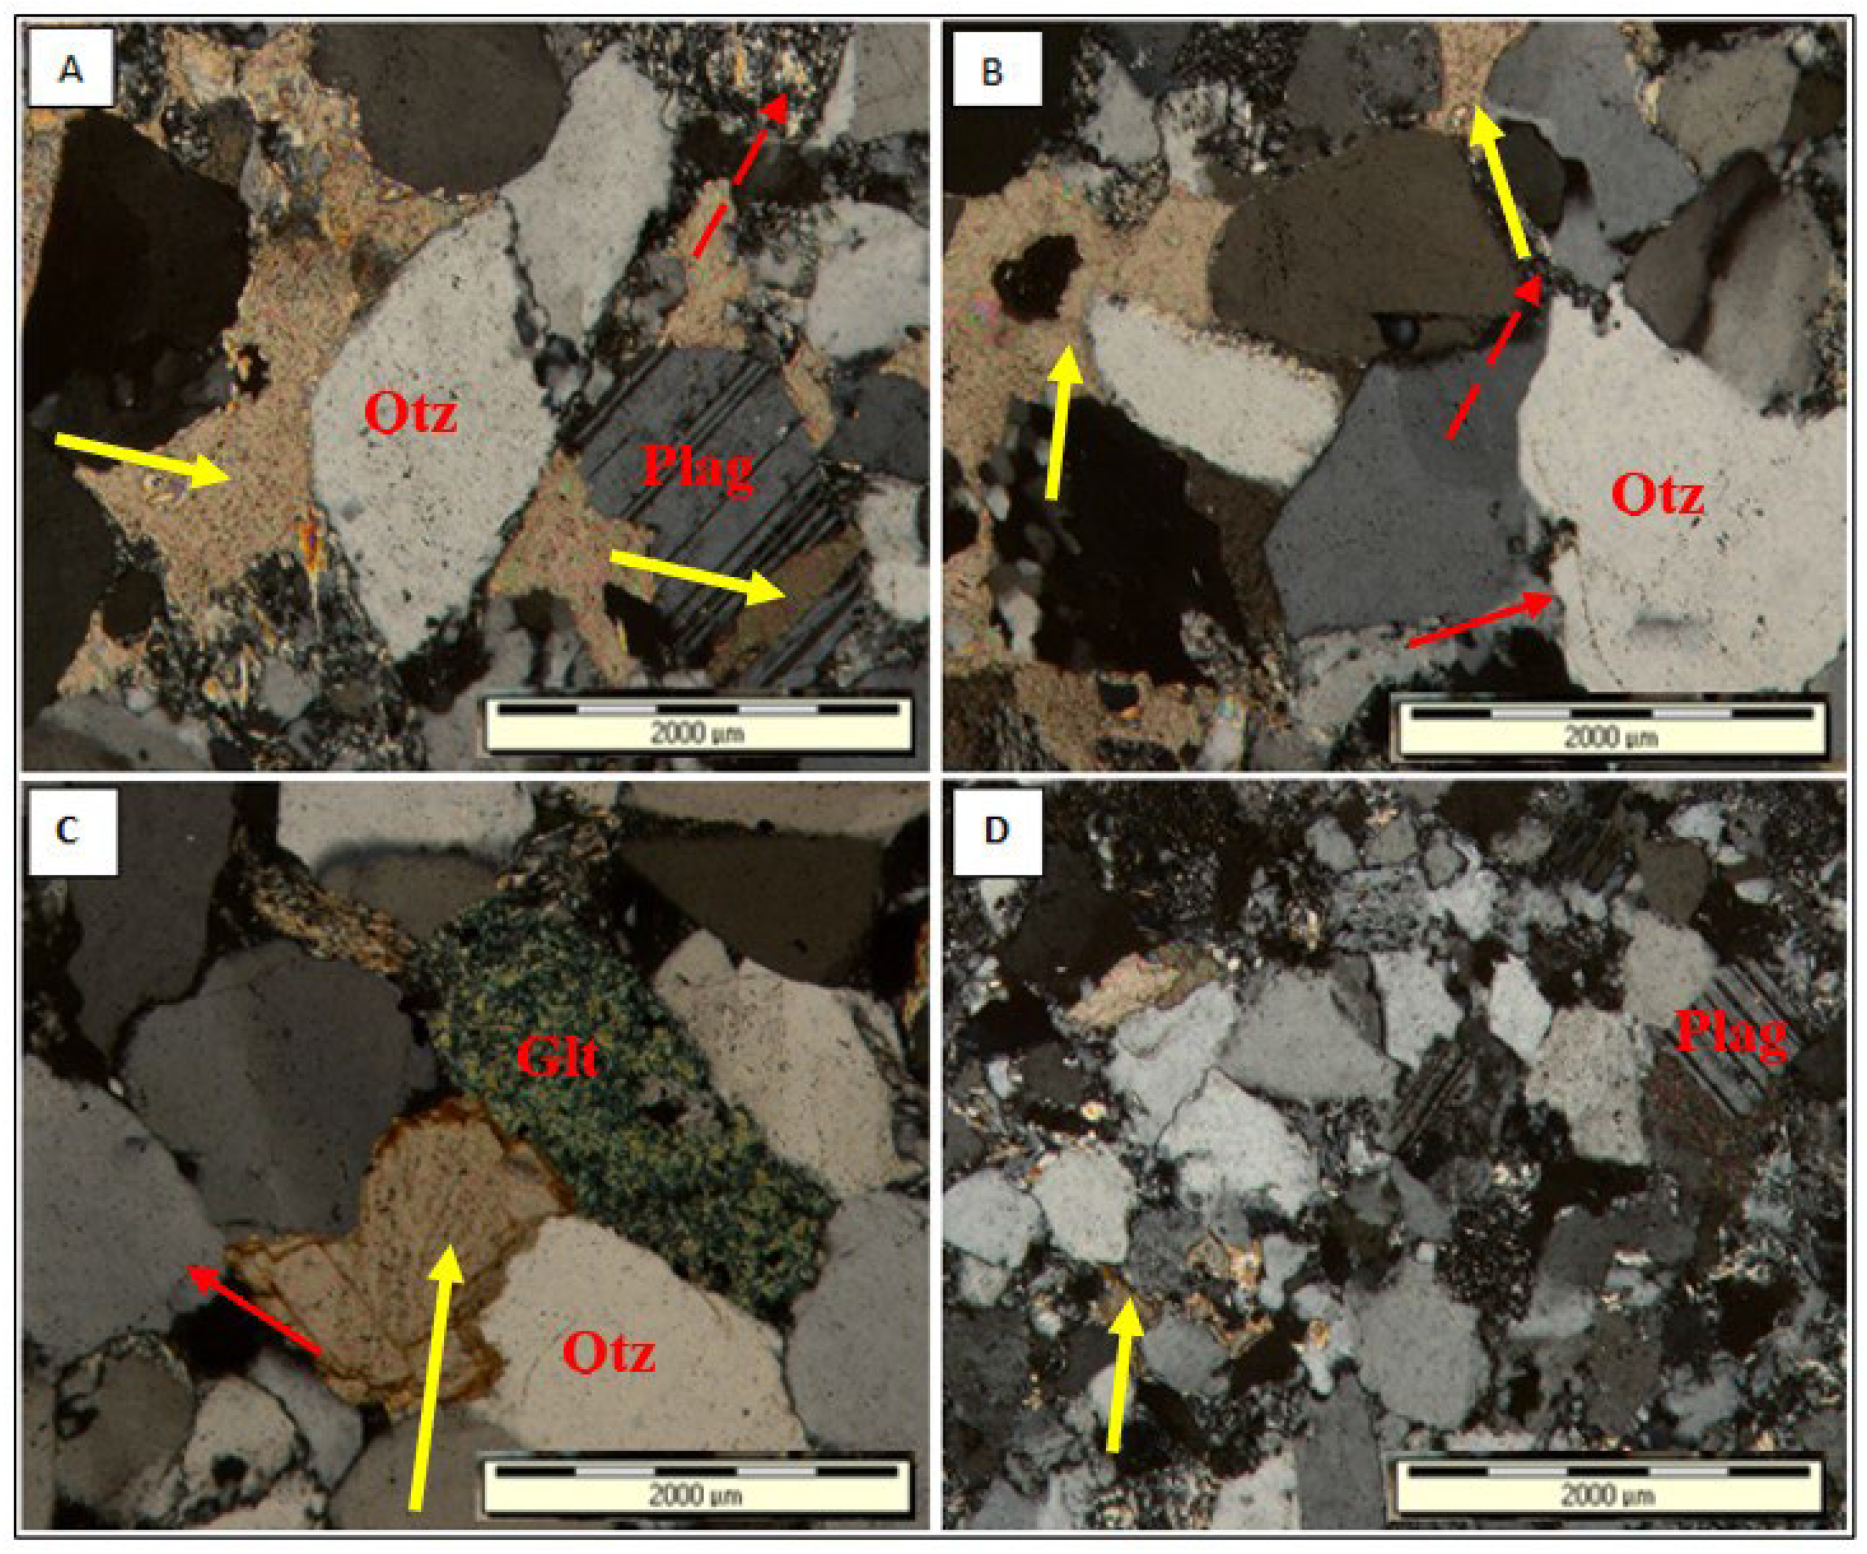
4.3.1. Detrital Minerals

The characteristics of the upper shallow marine sandstone reservoirs intersected by the three studied wells can be described as follows:
Well ZN1 reservoir: The sandstones are generally mature uniform sandstones that are fine to medium-grained, occasionally coarse, well to very well sorted, slightly carbonaceous, and siliceous in places. The main detrital mineral is quartz, other accessories include minor feldspar, shale, and chert clasts and shell fragments. The remaining grains are the monocrystalline quartz grains.
Well ZN3 reservoir: Seven cores were cut back to back between 2613 m and 2741 m. The interval between 2613 m and 2710 m is composed of glauconitic quartz sandstone, which becomes fossiliferous with depth. Claystone predominates intervals below 2720 m. The rest of the interval mainly comprises glauconite and an altered detrital K-felspar. Individual grains are rounded in shape.
Well ZN4 reservoir: The main sandstone interval ranging from 4081 m to 4233 m is clean, tightly packed, generally moderately sorted, and medium-grained. These sandstones are highly lithic quartz sandstone, feldspathic, and slightly carbonaceous and micaceous. The sandstones below 4233 m are interbedded. These sandstones are siltier, argillaceous, finer-grained, and less well sorted than those identified above. Additionally, they are highly lithic with sedimentary, metamorphic, and rare volcanic clasts, very feldspathic and micaceous.

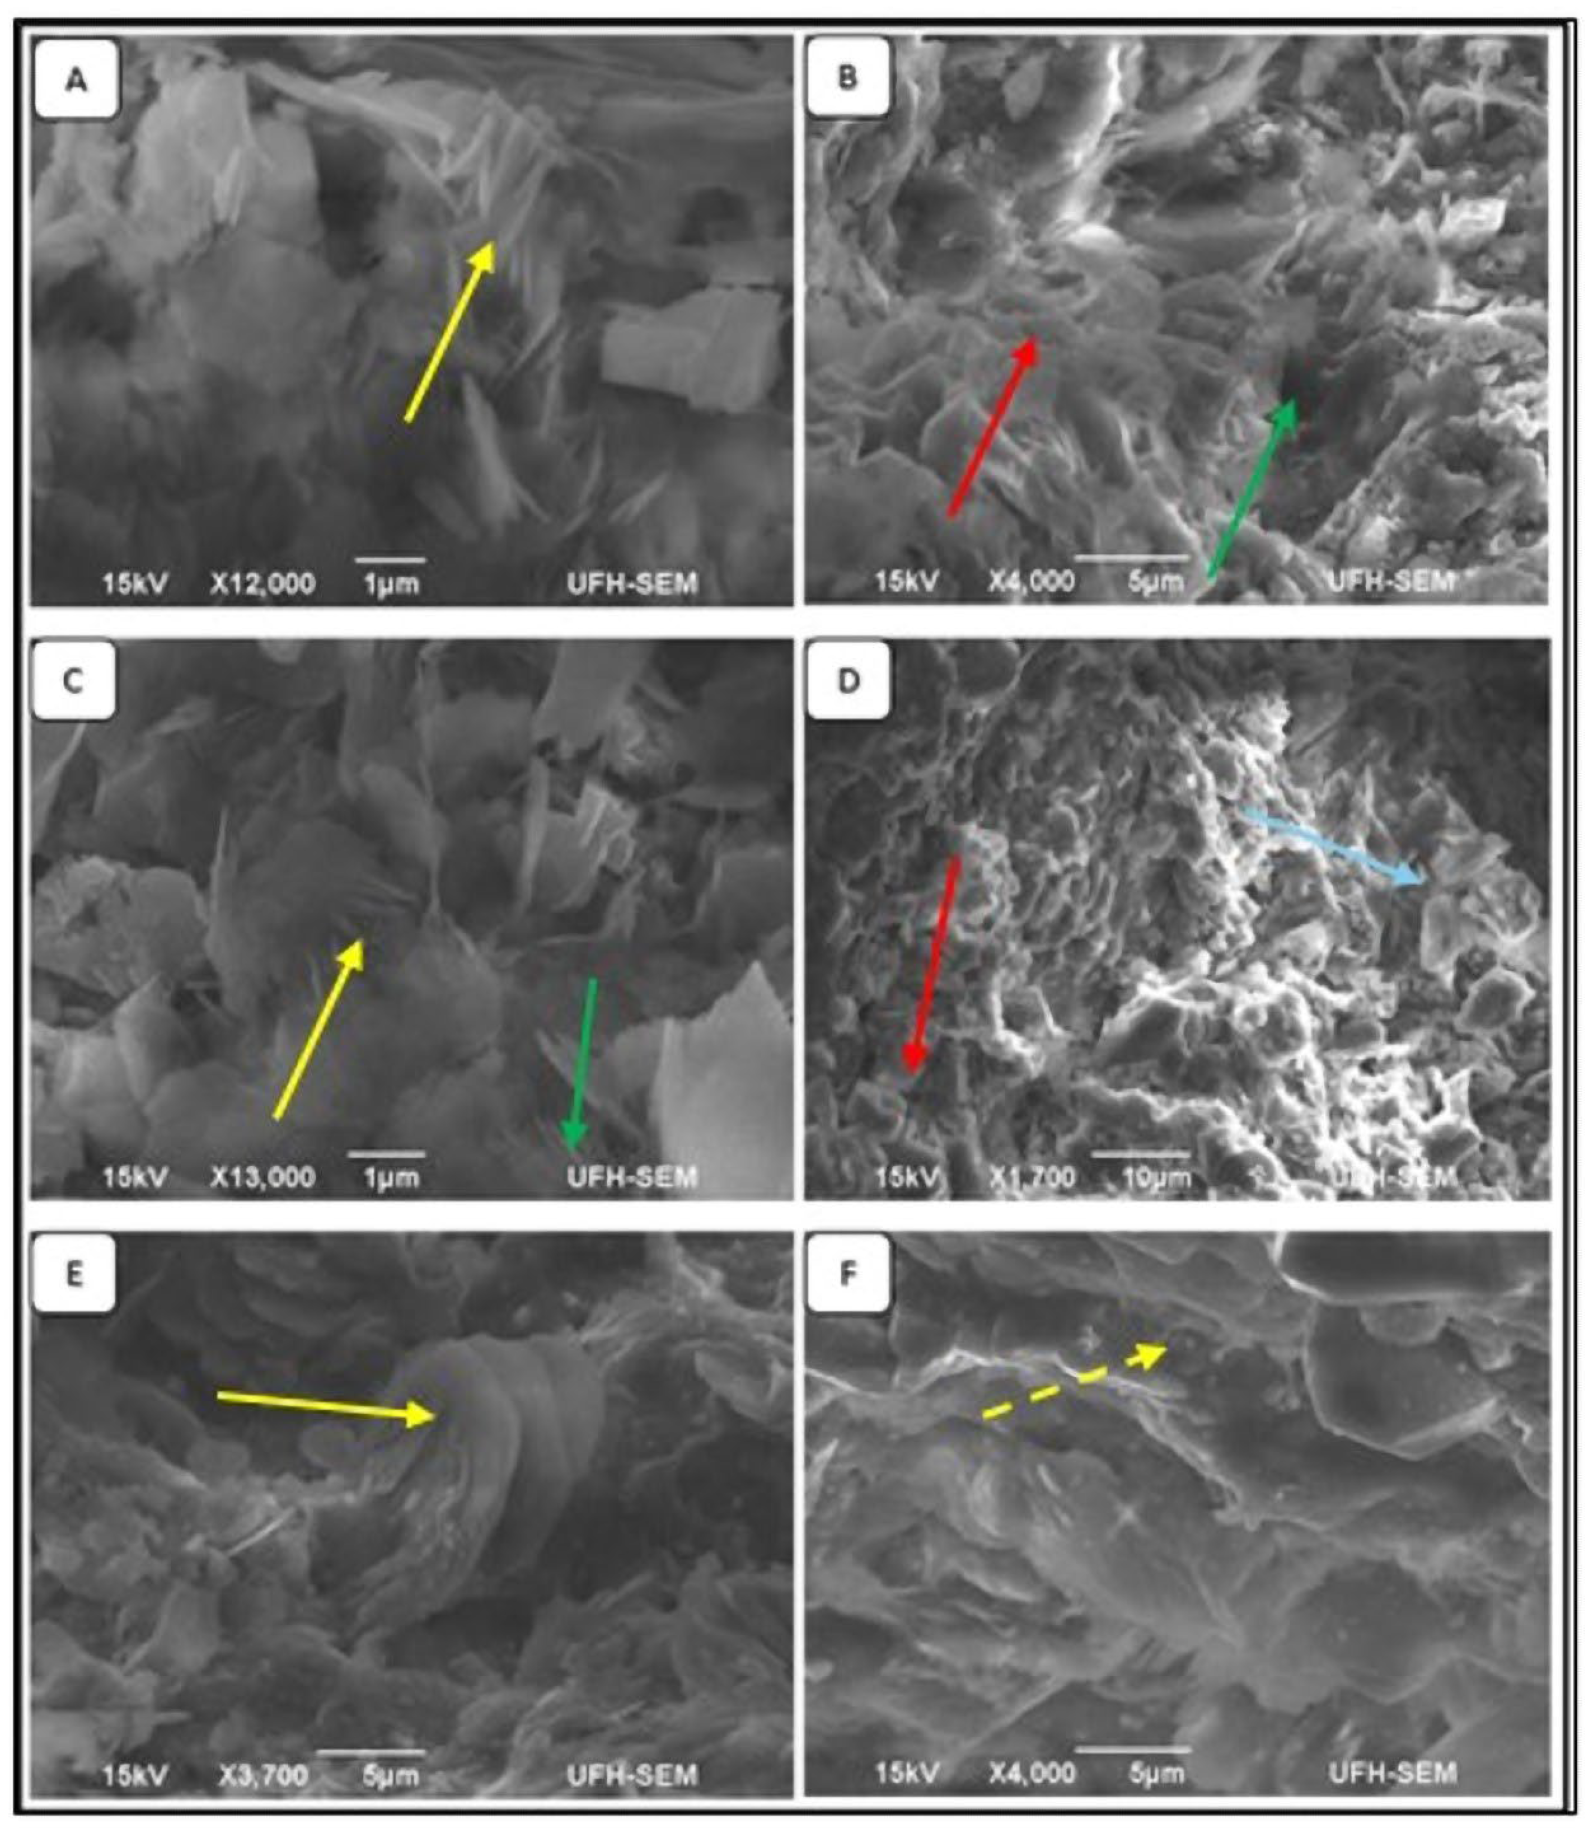
4.3.2. Diagenetic Minerals

Well ZN1 reservoir: Diagenetic minerals are dominated by glauconite, illite, and calcite. Glauconite and quartz cements are the most abundant authigenic clay content. Figure 9 shows a highly porous glauconitic sandstone with monocrystalline quartz grains, plagioclase, clay matrix, and quartz overgrowths. The arrangement of grains displayed a sutured contact.
The pore spaces are indicated by the dark grey colour, which was caused by the mounting medium used during the thin section preparation.
Well ZN3 reservoir: Thin section analyses identified quartz, glauconite, feldspar (partially dissolved), quartz overgrowth, clay matrix, and calcite cement filling pore spaces (Figure 10).
Well ZN4 reservoir: Diagenetic minerals are dominated by calcite cements, quartz overgrowth, and glauconite. Thin sections in Figure 8 show calcite cements filling pore spaces and subsequently destroying intergranular pores (Figure 11A). Partial replacement of quartz grain by calcite cement, quartz cement (overgrowth), and calcite cement was present around quartz grains (Figure 11B). Authigenic glauconite, clay matrix, and quartz overgrowth were all present (Figure 11C). Figure 11D shows tightly packed angular- quartz grains and plagioclase with calcite cement in places.

4.4. Clay Mineral Cementation

Clay minerals are also a common cementing material in the upper shallow marine sandstones. These minerals behave as pore-filling and pore-lining cements. Smectite and illite have been identified as the most common authigenic clay minerals in these sandstones. The formation of illite can be attributed to the alteration of smectite. Generally, smectite will recrystallize into illite [35].

Smectite and Illite Clays

SEM images (Figure 12) show that smectite occurred as thin flakes coating mostly detrital quartz grains (Figure 12D,F). The presence of illite is observed in Figure 12A–C, where it grows from the surface of smectite or forms mixed illite–smectite interlayers. Illite was formed by the transformation of smectite to illite through illitization to fill the pore spaces (Figure 12A,C). The EDX graph (Figure 13) confirmed the presence of smectite thin flakes with the mineral mainly composed of silica, aluminium, and magnesium.

4.5. Cement of Sandstone

Several minerals occur as the cement in sandstones. The most abundant mineral cement observed in the upper shallow marine sandstone are quartz cement, carbonate minerals (calcite cements), authigenic clay minerals, and rare feldspar as overgrowth cement.
Quartz cement: The observations from thin section analysis revealed the abundance of silica minerals. Clay minerals and feldspar are the two common silicate minerals present in abundance, and thin section results reveal that the dissolution of clay and feldspar is accompanied by quartz cement in places. The cement occurs in these sandstones as fine pore-filling quartz or as syntaxial overgrowth (Figure 9, Figure 10 and Figure 11).
Calcite cement: Calcite cementation is one of the types of cement identified in the upper shallow marine sandstone reservoirs. It occurs mostly as pore-filling micrite calcite cement and replacement mineral of clay matrix and detrital grains. Micrite calcite cement filled the pore spaces locally between the framework grains and clay matrix and passively replaced clay matrix and feldspar grains (Figure 10 and Figure 11). Micrite calcite cement filled pore spaces and prevented quartz overgrowth. It is also suspected that some sparite calcite filled the secondary pores created by feldspar and clay matrix dissolution.
Feldspar cement: Feldspar cement occurred mostly as feldspar overgrowth around detrital K-feldspar in places (Figure 10). The feldspar overgrowth is syntaxial and therefore has an optical property of continuity inside detrital feldspar grains.

5. Discussion

Generally, the upper shallow marine sandstone reservoirs in the Bredasdorp Basin contain relatively high intergranular porosity and permeability. Different diagenetic alterations have greatly affected the reservoir quality of the upper shallow marine sandstones. The major diagenetic processes that affected the studied reservoirs are mechanical compaction, cementation (quartz and feldspar overgrowth and calcite), glauconite, authigenic clays (illite and smectite), and dissolution of feldspar. The ZN4 reservoir quality at 4259 m (Figure 11D) experienced mechanical compaction, and as a result, the arrangement of grains changed from contact to sutured, resulting in the reduction in primary intergranular porosity and pore throats. The evidence of sutured grain contact indicates that pressure dissolution and chemical compaction took place in the deep burial realm and can be considered as a potential silica source for quartz overgrowth, which occupies the pore spaces in some places and affects the reservoir quality. This phenomenon was also observed on the southern side of the Bredasdorp Basin [20]. The primary porosity was also significantly reduced throughout the reservoir by calcite cementation, authigenic clay, smectite, and illite. Calcite occurs as a pore-filling and grain replacement mineral in ZN1 at 2746 m and in ZN3 at 2637 m, 2644.5 m, and 2656 m. The authigenic pore-filling minerals did not significantly affect the rock’s porosity since it only occurred locally in well ZN1 reservoir. However, in well ZN4 reservoir, it significantly destroyed the porosity and permeability of the rock. In ZN4, pore filling and grain replacement occur in all the studied samples. The most abundant clay mineral observed from the SEM images (Figure 12) was smectite. It occurs as grain-coating rims and pore lining. Smectite may present irreducible water saturation entrapment since it is the traditional source of clay-bound water. The fibrous illite appears as a pore-filling mineral and bridges the gap between the adjacent detrital grains, consequently reducing pore connectivity. Quartz overgrowth was observed throughout the samples. It coats the detrital quartz grains and reduces the size of the pore space and connectivity of pore throats. The primary intergranular porosity decreased with burial depth because of the rearrangement of grains. This cement usually forms early in the shallow marine diagenetic environment and the early diagenetic stage. It occurs as either pore-filling, syntaxial overgrowth, or isopachous ring around the detrital quartz grain.
The ZN3 reservoir appears to be of good quality, with an estimated average porosity of 16.1% and an average permeability of 151.8 mD. The porosity decreases with increasing burial depth as the sandstone becomes more calcareous in well ZN3 reservoir. Thus, it leads to the bottom 10 m containing an average porosity of 9%. The reservoir quality in well ZN4 is very poor at a depth of about 4200 m due to the destruction of intergranular porosity by extensive quartz, calcite, and illite cementation, coupled with compaction, hence the low porosity of 8.7% and very low permeability of 0.093 mD.
Only microporosity through areas of authigenic illite is preserved, though isolated grain dissolution porosity is present in a few places. Some authigenic illite clay minerals are formed from the recrystallization of fine smectite matrix and alteration of feldspar [8]. Diagenetic calcite often cements shallow marine sandstones [36] due to the dissolution and reprecipitation of calcium shell fragments [36] as non-Ferron calcite. A broader range of carbonate cement develops in marine sandstones via the reaction between detrital aluminosilicate minerals and the organic matter breakdown products [37]. Micrite calcite is the most abundant cement in the studied reservoirs, especially in wells ZN3 and ZN4.
The water saturation results showed that the log-derived water saturation is lower than that of a laboratory-measured (core) water saturation. Disagreements between core and wireline-derived water saturation estimates in clastic sandstone rocks have historically been due to core handling and preservation. This is because core water saturation is measured at the surface after hydrocarbon has bled out as the core is retrieved. In contrast, the log-derived measurements use in situ cores with no loss of hydrocarbons. e Authors of [38] also observed this discrepancy. The presence of glauconite can also be speculated as one of the reasons. The authors of [15] conducted an extensive study on the effect of glauconite on petrophysical properties of the upper shallow marine sandstone reservoirs in the southern North Sea field and found that glauconite tends to contain water in its intercrystalline spaces, especially in core samples extracted offshore, regardless of its matrix distribution. The study further found that the effect of glauconite is mainly an increase in the water saturation retained in the intercrystalline spaces, which explains the difference between core and log-derived water saturation. In this study, we also cannot rule out the effect of clay-bound diagenetic smectite on water saturation. However, it is worth noting that our study did not consider quantitative XRD analysis or environmental scanning electron microscope (ESEM), which may otherwise provide a different take on this disagreement.

6. Conclusions

The petrophysical analyses showed the results of porosity, volume of clay, water saturation, and permeability, ranging from 9% to 27%, 8.6% to19.8%, 18.9 to 30.4%, and 0.096 mD to151.8 mD, respectively, showing a poor-to-good reservoir quality. The major diagenetic processes that affected the studied reservoirs are mechanical compaction, cementation (quartz and feldspar overgrowth and calcite), glauconite, authigenic clays (illite and smectite), and dissolution. These factors played a major role in significantly reducing primary porosity. Calcite mostly occurred as pore-filling micrite calcite cement and a replacement mineral of detrital grains. It filled the pore spaces and prevented quartz overgrowth in places. It was also suspected that some sparite calcite filled the secondary pores created by feldspar-and-clay matrix dissolution, reducing porosity and permeability. The most abundant clay mineral observed from the SEM images was smectite. It occurred as grain-coating rims and pore lining. Fibrous illite appeared as a pore-filling mineral and bridged the gap between the adjacent detrital grains, consequently reducing pore connectivity. Quartz overgrowth was observed in all the samples. It coated the detrital quartz grains and reduced the size of the pore space and connectivity of pore throats.

Author Contributions

M.M. conceptualized the study within the framework of his PhD research project. M.O. supervised the PhD research. M.M. wrote the paper with contributions from M.O. and K.L. In addition, K.L. helped with mineralogy analyses interpretation, editing, and reviewing the manuscript. All authors have read and agreed to the published version of the manuscript.

Funding

This research received no external funding.

Data Availability Statement

The data presented in this study are available on request from the corresponding author. The data are not publicly available due to the confidentiality agreement signed between the authors and the Petroleum Agency of South Africa..

Acknowledgments

The Petroleum Agency of South Africa (PASA) is greatly recognized for providing the data. Geoactive is also greatly appreciated for providing Interactive Petrophysics (IP) software support.

Conflicts of Interest

The authors declare no conflicts of interest.

References

  1. Dutton, S.P.; Loucks, R.G. Diagenetic controls on evolution of porosity and permeability in lower Tertiary Wilcox sandstones from shallow to ultradeep (200–6700 m) burial, Gulf of Mexico Basin, USA. Mar. Pet. Geol. 2010, 27, 69–81. [Google Scholar] [CrossRef]
  2. Gier, S.; Worden, R.H.; Johns, W.D.; Kurzweil, H. Diagenesis and reservoir quality of Miocene sandstones in the Vienna Basin, Austria. Mar. Pet. Geol. 2008, 25, 681–695. [Google Scholar] [CrossRef]
  3. Stein, J.; Craw, D.; Pope, J. Initial sedimentation and subsequent diagenesis in the Eastern Southland Lignite Basin, southern New Zealand. N. Z. J. Geol. Geophys. 2011, 54, 167–180. [Google Scholar] [CrossRef]
  4. Wan, Q.; Fan, A.P.; Yang, R.C.; Lenhardt, N. Diagenetic mineralogy and its effect on the reservoir properties of the sandstones of the Permian of S120 block (Sulige gas field), Ordos Basin, NW China. J. Palaeogeogr. 2022, 11, 360–386. [Google Scholar] [CrossRef]
  5. Bjorlykke, K. Diagenesis. In Development in Sedimentology; Chilingarian, G.V., Wolf, K.H., Eds.; Elsevier: Amsterdam, The Netherlands, 1988; Volume 41, pp. 555–588. [Google Scholar]
  6. Risha, M.; Tsegab, H.; Rahmani, O.; Douraghi, J. The Impact of Clay Minerals on the Porosity Distribution of Clastic Reservoirs: A Case Study from the Labuan Island, Malaysia. Appl. Sci. 2023, 13, 3427. [Google Scholar] [CrossRef]
  7. Lundergard, P.D. Sandstone porosity loss; A “big picture” view of the importance of compaction. J. Sediment. Res. 1992, 62, 250–260. [Google Scholar] [CrossRef]
  8. Baiyegunhi, T.L.; Liu, K.; Gwavava, O.; Baiyegunhi, C. Impact of Diagenesis on the Reservoir Properties of the Cretaceous Sandstones in the Southern Bredasdorp Basin, Offshore South Africa. Minerals 2020, 10, 757. [Google Scholar] [CrossRef]
  9. Benson, D.I. Porosity reduction through ductile grain deformation: An experimental assessment. GCAGS 1981, 31, 235–237. [Google Scholar]
  10. Pittman, E.D.; Larese, R.E. The importance of ductile deformation of lithic fragments in arenites: Evidence from experimental compaction. In Proceedings of the Abstracts of the 12th International Sedimentology Conference, Canberra, Australia, 24–30 August 1986; p. 243. [Google Scholar]
  11. Kurkjy, K.A.; Smith, J.C.; Trevena, A.S. Losses of permeability and porosity in lithic sands assessed with compaction experiments. Am. Assoc. Pet. Geol. Bull. 1987, 71, 579. [Google Scholar]
  12. Worden, R.H.; Burley, S.D. Sandstone diagenesis from sand to stone. In Sandstone Diagenesis: Recent and Ancient; Burley, S.D., Worden, R.H., Eds.; International Association of Sedimentologists: Gent, Belgium, 2003; Volume 4, pp. 3–44. [Google Scholar] [CrossRef]
  13. Sun, X.L.; Lin, C.Y.; Zhang, X.G.; Lin, J.L.; Zhao, Z.X.; Huang, D.W.; Duan, D.P. Characteristics and distribution of clay minerals and their effects on reservoir quality: Huagang Formation in the Xihu Sag, East China Sea Basin. Aust. J. Earth Sci. 2019, 66, 1163–1174. [Google Scholar] [CrossRef]
  14. Feng, W.; Rong, C.; Jingchun, T. Diagenesis and diagenetic facies of the Chang 4+ 5 tight sandstone reservoirs in Longdong area, Ordos Basin. Oil Gas Geol. 2014, 35, 199–206. [Google Scholar]
  15. Thomas, W.H.; Ringen, J.K.; Rasch, S.O. Effect of glauconite on petrophysical properties as revealed by core analysis. In Proceedings of the International Symposium of the Society of Core Analysts, Pau, France, 21–24 September 2003. [Google Scholar]
  16. Opuwari, M.; Ubong, M.O.; Jamjam, S.; Magoba, M. The Impact of Detrital Minerals on Reservoir Flow Zones in the Northeastern Bredasdorp Basin, South Africa, Using Core Data. Minerals 2022, 12, 1009. [Google Scholar] [CrossRef]
  17. Opuwari, M.; Magoba, M.; Dominick, N.; Waldmann, N. Delineation of sandstone reservoir flow zones in the central Bredasdorp basin, South Africa, using core samples. Nat. Resour. Res. 2021, 30, 3385–3406. [Google Scholar] [CrossRef]
  18. Akhir, N.A.M.; Gaafar, G.R.; Saaid, I.M. Quantification of Clay Mineral and Log Response Toward Reservoir Rock Properties. In ICIPEG 2014: Proceedings of the International Conference on Integrated Petroleum Engineering and Geosciences; Springer: Singapore, 2015; pp. 221–231. [Google Scholar]
  19. Petroleum Agency of South Africa. Petroleum Exploration Information and Opportunities; Petroleum Agency SA Brochure; Petroleum Agency of South Africa: Cape Town, South Africa, 2004; p. 16. [Google Scholar]
  20. Baiyegunhi, T.L.; Liu, K.; Gwavava, O.; Baiyegunhi, C. Classification and Diagenetic Characteristics of the Cretaceous Sandstones in the Southern Bredasdorp Basin, Offshore South Africa. Acta Geol. Sin. Engl. Ed. 2021, 95, 1695–1713. [Google Scholar] [CrossRef]
  21. Masindi, R.; Trivedi, K.B.; Opuwari, M. An integrated approach of reservoir characterization of Y gas field in Central Bredasdorp Basin, South Africa. J. Pet. Explor. Prod. Technol. 2022, 12, 2361–2379. [Google Scholar] [CrossRef]
  22. McMillan, I.K.; Brink, G.J.; Broad, D.S.; Maier, J.J. Late Mesozoic sedimentary basins off The South Coast of South Africa. In Sedimentary Basins of the World; Elsevier: Amsterdam, The Netherlands, 1997; Volume 3, pp. 319–376. [Google Scholar] [CrossRef]
  23. Du Toit, S.R. The Mesozoic history of the Agulhas Bank in terms of the plate tectonic theory. Geokongress 77. GSSA 1979, 6, 197–203. [Google Scholar]
  24. Leith, M.J.; Rowsel, D.M. Burial history and temperature-depth conditions for hydrocarbon generation and migration on the Agulhas Bank, South Africa. Geokongress. GSSA 1979, 6, 205–217. [Google Scholar]
  25. McLachlan, I.R.; Brenner, P.W.; McMillan, I.K. The stratigraphy and micropaleontology of the Cretaceous Benton Formation and the PB-A/1 well, near Knysna. Cape Province Trans. GSSA Abstr. 1976, 79, 60–63. [Google Scholar]
  26. Dingle, R.V.; Siesser, W.G.; Newton, A.R. Mesozoic and Tertiary Geology of Southern Africa. In A Global Approach to Geology; Taylor and Francis: Milton Park, UK, 1983. [Google Scholar]
  27. Mudaly, K.; Turner, J.; Escorcia, F.; Higgs, R. F-O gas field, Offshore South Africa—From Integrated approach to field development. In Proceedings of the AAPG Annual Conference and Exhibition, Cape Town, South Africa, 26–29 October 2009. [Google Scholar]
  28. Higgs, R. Cretaceous ‘USM’ Reservoir, FO Gas Field, Offshore South Africa: Sedimentological factors affecting economic viability. In Proceedings of the AAPG International Conference and Exhibition, Cape Town, South Africa, 26–29 October 2008. [Google Scholar]
  29. Roux, J. Potential outlined in southern Outeniqua Basin off S. Africa. Oil Gas J. 1997, 95. Available online: https://www.ogj.com/home/article/17242138/potential-outlined-in-southern-outeniqua-basin-off-s-africa (accessed on 15 January 2024).
  30. Crain Petrophysical Handbook. Available online: www.spec2000.net/14-swbasics.htm (accessed on 5 June 2019).
  31. Simandoux, P. Dielectric measurements on porous media, application to the measurements of water saturation: The study of the behaviour of argillaceous formations. Rev. L’institut Fr. Pet. 1963, 18, 93–215. [Google Scholar]
  32. Poupon, A.; Leveaux, J. Evaluation of water saturation in shaly formations. In SPWLA Annual Logging Symposium; SPWLA: Houston, TX, USA, 1971; p. 2. [Google Scholar]
  33. Magoba, M.; Opuwari, M. Petrophysical interpretation and fluid substitution modelling of the upper shallow marine sandstone reservoirs in the Bredasdorp Basin, offshore South Africa. J. Pet. Exp. Pro. Tec. 2019, 10, 783–803. [Google Scholar] [CrossRef]
  34. Glover, P.; Petrophysics, M. Course Notes; University of the Aberdeen: Aberdeen, UK, 2009. [Google Scholar]
  35. Wilkinson, M. The concretions of the Bearreraig Sandstone Formation. Geometry and geochemistry. Sedimentology 1991, 38, 899–912. [Google Scholar] [CrossRef]
  36. Hendry, J.P.; Trewin, N.H.; Fallick, A.E. Low-Mg calcite marine cement in Cretaceous turbidites. origin, spatial distribution and relationship to seawater chemistry. Sedimentology 1996, 43, 877–900. [Google Scholar] [CrossRef]
  37. Hein, J.R.; O’neil, J.R.; Jones, M.G. Origin of authigenic carbonates in sediment from the deep Bering Sea. Sedimentology 1979, 26, 681–705. [Google Scholar] [CrossRef]
  38. Everett, B.; Holgate, D.; Everett, J.; Rops, E. The Log-Derived SW Compared to Surface Measurement of Core SW: How they are Reconciled. In Proceedings of the SPWLA 61st Annual Logging Symposium, Online, 26 June–29 July 2020; OnePetro: Richardson, TX, USA, 2020. [Google Scholar]
Figure 1. Maps showing the location of the Bredasdorp Basin [19] of South Africa (bottom) and the location of the three studied wells (top).
Minerals 14 00396 g001
Figure 2. Simplified chronostratigraphy of the Bredasdorp Basin (modified after [28]). The red double arrow in the image indicates the study area interval.
Minerals 14 00396 g002
Figure 3. Porosity vs. permeability cross plot of ZN1 reservoir.
Minerals 14 00396 g003
Figure 4. Porosity vs. permeability cross plot of ZN3 reservoir.
Minerals 14 00396 g004
Figure 5. Porosity vs. permeability cross plot of ZN4 reservoir.
Minerals 14 00396 g005
Figure 6. The identified reservoir from the gamma ray log (track 3) and the reservoir results of well ZN1 showing porosity, water saturation, permeability, and clay volume in tracks 3, 4, 5, 6, and 7, respectively.
Minerals 14 00396 g006
Figure 7. The identified reservoir from the gamma ray log (track 3) and the reservoir results of well ZN3 showing porosity, water saturation, permeability, and clay volume in tracks 3, 4, 5, 6, and 7, respectively.
Minerals 14 00396 g007
Figure 8. The identified reservoir from the gamma ray log (track 3) and the reservoir results of well ZN4 showing porosity, water saturation, permeability, and clay volume in tracks 3, 4, 5, 6, and 7, respectively.
Minerals 14 00396 g008
Figure 9. Thin-section photomicrographs of well ZN1 sandstone showing (A) quartz and plagioclase grains, quartz overgrowth (red arrow), clay matrix, and authigenic glauconite pellet (Glt,) at 2728 m; (B) quartz (Qtz) and plagioclase (plag) grain, glauconite surrounded by finer granular quartz cement, clay matrix, and glauconite at 2730.5 m; (C) detrital quartz and quartz overgrowth (red arrow), feldspar overgrowth in places and clay matrix (dashed red arrow) at 2743 m; (D) micrite calcite cement (yellow arrow) and calcite replacement of feldspar grain (yellow arrow) at 2746 m.
Minerals 14 00396 g009
Figure 10. Thin-section photomicrographs of well ZN3 sandstone showing (A) mono- and poly-quartz and feldspar grains, recrystallized clay matrix (dashed red arrow) and quartz overgrowth (red arrow) at 2615 m; (B) detrital quartz grains, authigenic glauconite (Glt, green colour), calcite cement (middle), and clay matrix between and around detrital grains at 2637 m; (C) calcite replacement of quartz grains (yellow arrow) and micrite calcite cement around detrital grains and filling pore spaces (yellow arrow) at 2644.5 m; (D) quartz grains (Qtz), micrite calcite cement, calcite partial replacement of quartz grain (yellow arrow), glauconite pellet (Glt, green), and angular quartz grains at 2656 m.
Minerals 14 00396 g010
Figure 11. Thin-section photomicrographs of well ZN4 sandstones showing (A) undulose extinction of quartz (Qtz) grains of metamorphic source, plagioclase (plag) grain calcite replacement (yellow arrow), calcite cement, and pseudomorphic clay matrix (red dotted arrow) at 4254 m; (B) replacement calcite (yellow arrow) and recrystallized clay matrix occupying pore spaces (dashed red arrow) between detrital grains and quartz overgrowth (red arrow) at 4254; (C) quartz overgrowth (red arrow) and replacement calcite (yellow arrow) between quartz grains alongside glauconite at 4257 m; (D) a tightly packed quartz and plagioclase grains with clay matrix distributed between the detrital grains, and partially calcite replacement (yellow arrow) at 4259.5 m.
Minerals 14 00396 g011
Figure 12. SEM images of (A) smectite transformed to illite (fibrous flakes or needles, yellow arrow), and also shows that clay cement reduced the porosity (illite fills into pores); (B) recrystallized smectite cement (middle left and centre, red arrow) and intercrystalline pores (green arrow); (C) smectite recrystallized to illite (fibrous needles/flakes) (yellow arrow) and also shows that illite blocked micro-pore space (green arrow); (D) recrystallized smectite with quartz grains (red arrow) (the rose-shaped recrystallized minerals are possibly chlorite (middle right, blue arrow)); (E) a visibly large flake of smectite (yellow arrow; (F) authigenic quartz grains and illite growth on smectite flakes (dotted yellow arrow).
Minerals 14 00396 g012
Figure 13. SEM photomicrograph showing recrystallized smectite (point 1, on the left) and EDS graph showing elemental composition of smectite at point 1 (right).
Minerals 14 00396 g013
Table 1. Petrophysical parameters of the identified reservoirs in ZN1, ZN3, and ZN4 wells (gross thickness, porosity (Φ), water saturation (Sw), volume of clay (Vcl) and permeability (K)).
Well NameReservoir NameTop Depth (m)Bottom Depth (m)Gross Thickness (m)Φ (%)Sw
(%)
Vcl (%)K
(mD)
ZN11AT13615.53685.169.910.825.523.30.096
ZN31AT12610.32720.4110.116.612.517.4151.8
ZN41AT140814246.7165.78.730.48.60.093
Disclaimer/Publisher’s Note: The statements, opinions and data contained in all publications are solely those of the individual author(s) and contributor(s) and not of MDPI and/or the editor(s). MDPI and/or the editor(s) disclaim responsibility for any injury to people or property resulting from any ideas, methods, instructions or products referred to in the content.

