1. Introduction
The Bayan Obo deposit, situated in Inner Mongolia, is renowned for hosting the largest deposit of light rare earth elements (REEs) and globally contributes to approximately one third of the world’s REE resources [
1,
2]. This site also possesses substantial reserves of niobium, scandium, iron, fluorine, phosphorus, thorium, and other minerals [
3,
4]. Furthermore, more than 180 mineral species, including 18 newly discovered minerals, have been identified in the Bayan Obo deposit [
5,
6].
The Bayan Obo deposit has undergone multiple phases of structural deformation, alteration, metasomatism, reactivation, and reprecipitation throughout its long geological history [
7], resulting in extreme complexity. Despite decades of research and exploitation, many problems remain unresolved and controversial [
8,
9,
10,
11,
12,
13,
14,
15,
16]. However, recent extensive geological, mineralogical petrologic, and geochemical evidence suggests that its formation is closely related to the genesis of mid-Proterozoic mantle-derived magmatic carbonatite [
17,
18,
19,
20,
21]. The notion that igneous carbonatite acts as the parent rock for the mineralization of rare earth elements, niobium, and iron has become a widely accepted view among most scholars [
17,
18,
22,
23,
24,
25,
26,
27,
28].
Compared to the extensive geological, geochemical, and geochronological surveys and research, geophysical exploration, especially detailed investigations at great depths in the Bayan Obo mining area, has not been widely carried out [
29], resulting in an unclear understanding of the structures that reside deep underground in the entire mining area or specific localities [
7,
30,
31]. In recent years, to investigate key elements such as deep ore bodies, dolomites, and structures, researchers at multiple domestic institutions have successively carried out a vast number of geophysical surveys, including gravity, magnetic, electromagnetic, ambient noise tomography, and controlled-source seismic surveys [
32,
33,
34,
35], in the Bayan Obo mining area. These efforts, utilizing different physical property parameters, have yielded structural characteristics within certain depths underground in the mining area and provided new insights into the strata, structures, and ore bodies from different perspectives, greatly advancing the research on the Bayan Obo deposit.
This manuscript is part of the aforementioned geophysical work, utilizing the time-domain controlled-source electromagnetic method (CSEM) to conduct exploration between the Main and the Eastern deposits. The aim of this study is to understand the electrical characteristics and spatial distribution of mineralized carbonatites and to further reveal the connection between the Main ore body and the Eastern ore body at depth.
2. Geologic Setting and Physical Characteristics
2.1. Geologic Setting
The Bayan Obo iron niobium rare earth deposit is located on the northern edge of the North China Craton, approximately 150 km north of the city of Baotou, Inner Mongolia. Its tectonic position is near the Paleozoic Central Asian Orogenic Belt (CAOB) [
36,
37]. It is hosted by sedimentary rocks of the Bayan Obo Group [
38,
39]. The Bayan Obo deposit, which occupies an area of approximately 48 km
2, accounts for 70% of the world’s rare earth resources. Its formation is closely related to the long rift–magma evolutionary process and the resulting large-scale carbonate magma activity.
The Bayan Obo area primarily contains the Bayan Obo Group, with only sporadic exposure of the ancient Yu and early Proterozoic strata. The region northeast of the mining area predominantly contains post-Paleozoic strata. The Bayan Obo Group is further divided into 18 lithological formations, designated H1 to H18 from bottom to top, i.e., the Dulahala Formation (H1–H3), Jianshan Formation (H4–H5), Halahuoqite Formation (H6–H8), Bilute Formation (H9–H10), Baiyinbaolage Formation (H11–H13), and Hujiertu Formation (H14–H18). Within the mining area, the lower Bayan Obo Formation (H1–H9) forms the major strata, with dolomite H8 hosting the primary rare earth minerals in the form of fluorocarbons and phosphates (such as monazite). Dolomite H8 is exclusively found within the Bayan Obo mining area, extending for 16 km in a ribbon-like formation from east to west and covering nearly 3 km in width from north to south, and it trends southward [
38,
39,
40,
41,
42]. From an east-to-west perspective, the mine can be divided into five sections: the Eastern contact zone, Eastern mine, Main mine, West mine, and North mine [
29,
43]. The primary mining area of the mine comprises the Eastern and Main mines.
2.2. Physical Characteristics
Distinguishing the electrical parameters of rocks is essential for electromagnetic exploration and serves as a critical foundation for inversion interpretation. The resistivity, polarizability, density, and susceptibility of more than 4000 rock samples, including drill core and surface samples, were tested [
32,
33,
34]. The physical properties of the primary rocks were obtained, and the resistivity and polarizability results are shown in
Table 1. These results demonstrate that magnetite has the lowest resistivity in the area, followed by slate, low-grade magnetite, sandstone, granite, and dolomite. Notably, the resistivity of dolomite is associated with the degree of pyritization, whereby a higher degree of mineralization corresponds to a lower resistivity [
34]. The change in polarizability is relatively straightforward, with only higher-grade magnetite demonstrating higher polarizability compared to generally lower values in other rocks.
3. Data Acquisition and Inversion
3.1. Data Acquisition
The time-domain (TD) CSEM method was used to investigate subsurface profiles between the Main and Eastern mines. It utilizes a long grounded wire as the source to transmit a bipolar square-wave current and then observes the secondary induced electromagnetic field within a certain offset distance from the source [
44,
45,
46,
47,
48]. It is common to observe the vertical induced voltage (Vz(t)) by loop coils or magnetic rods.
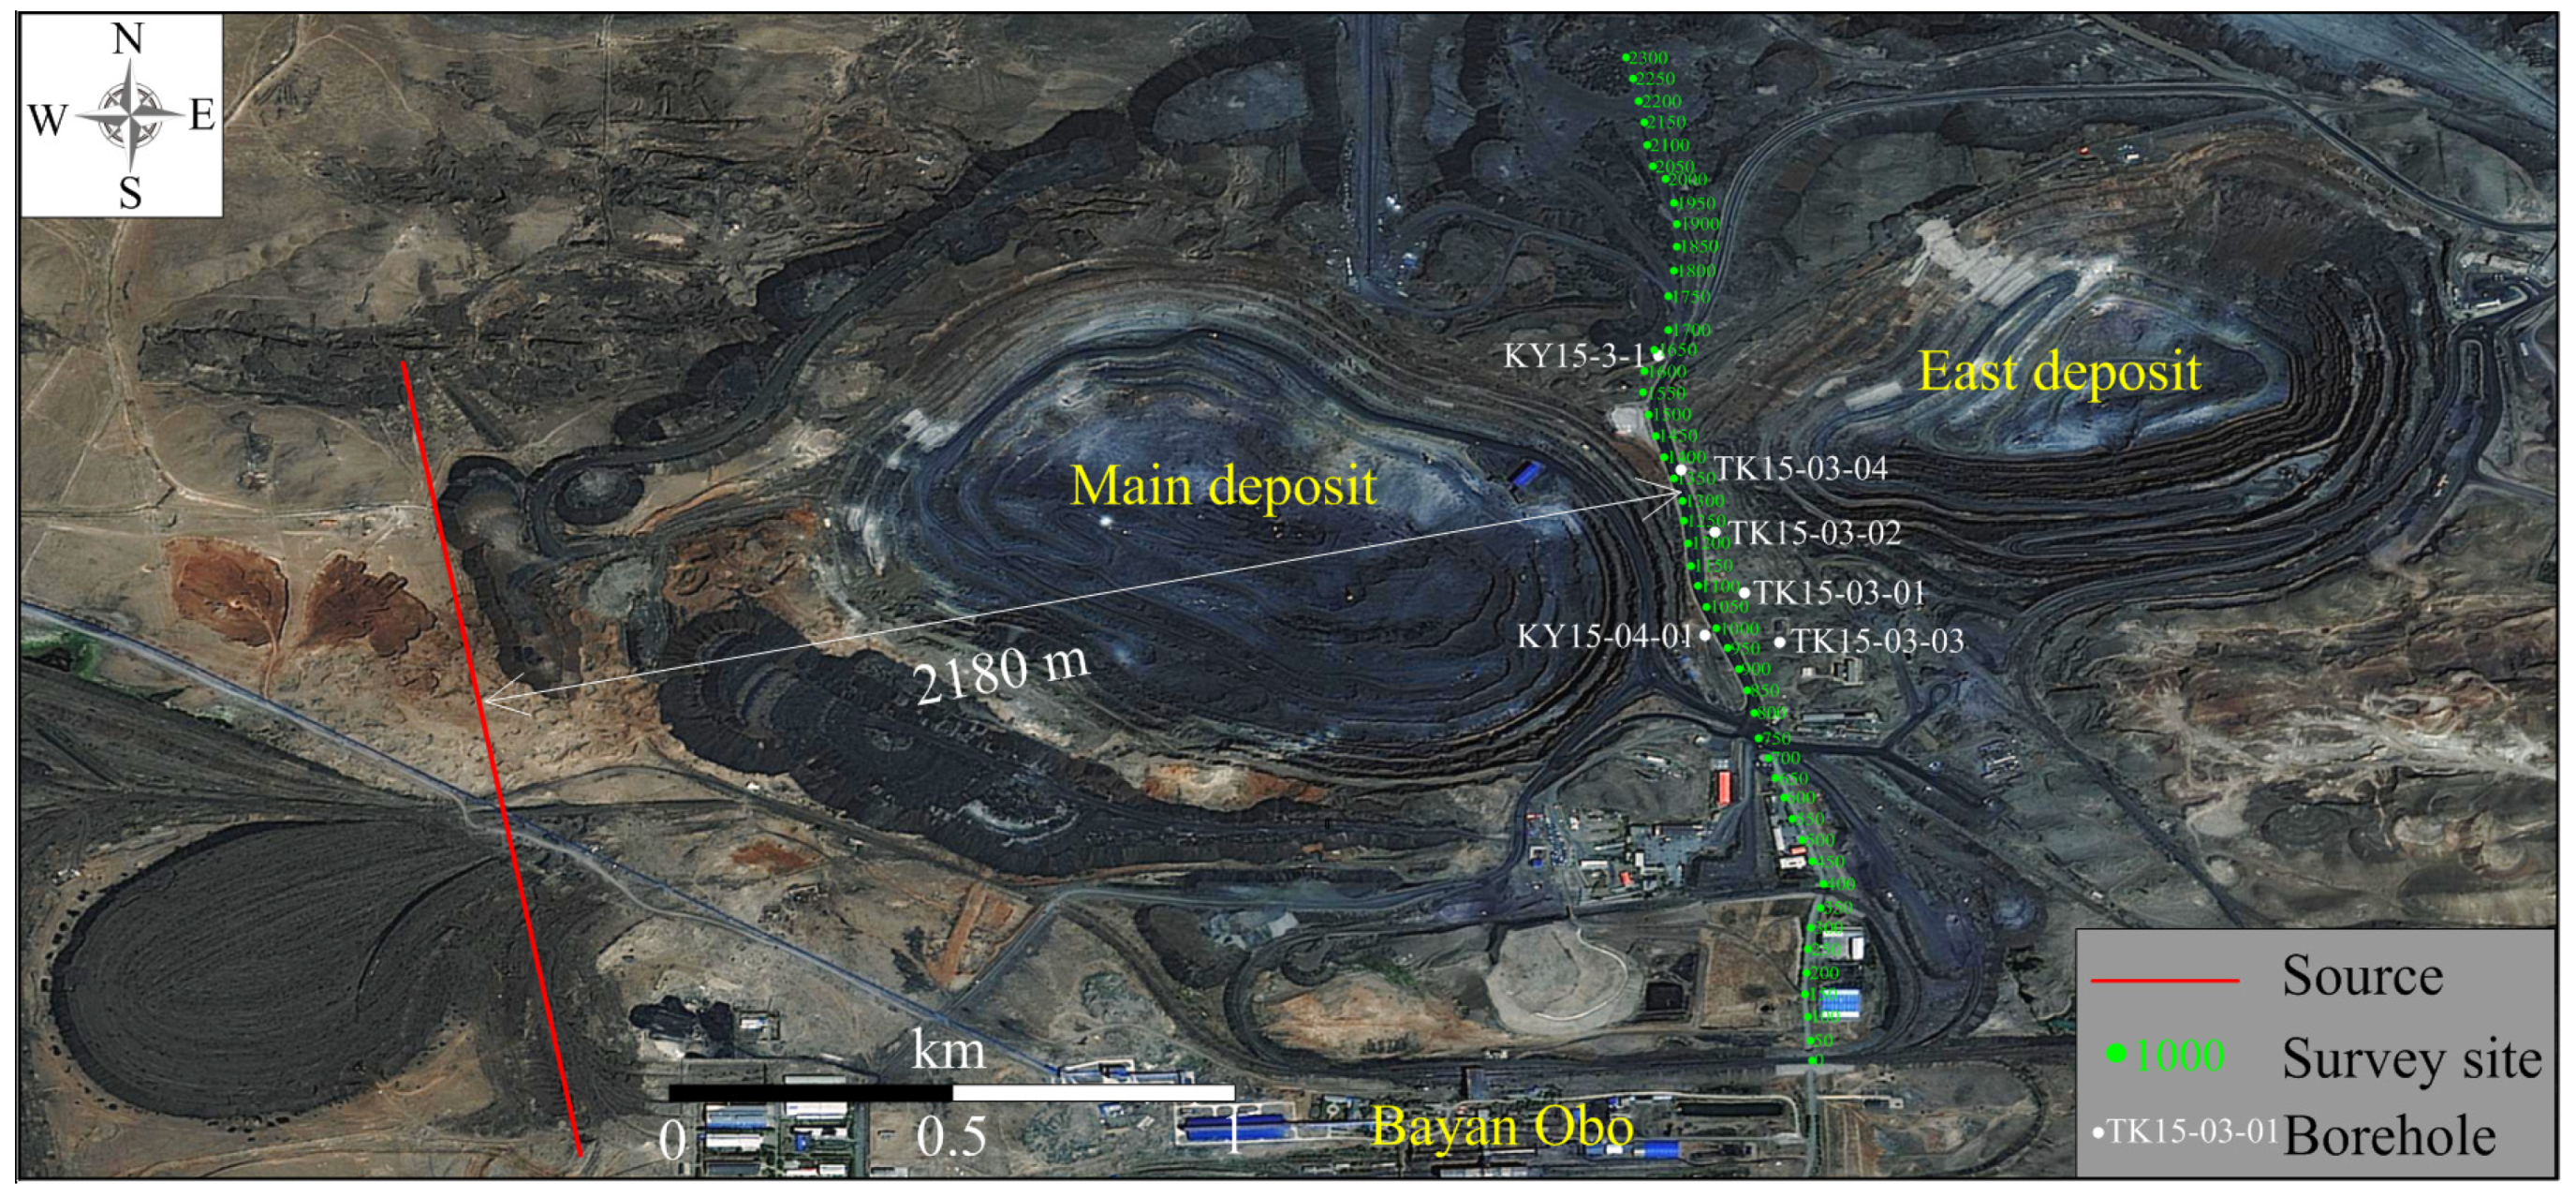
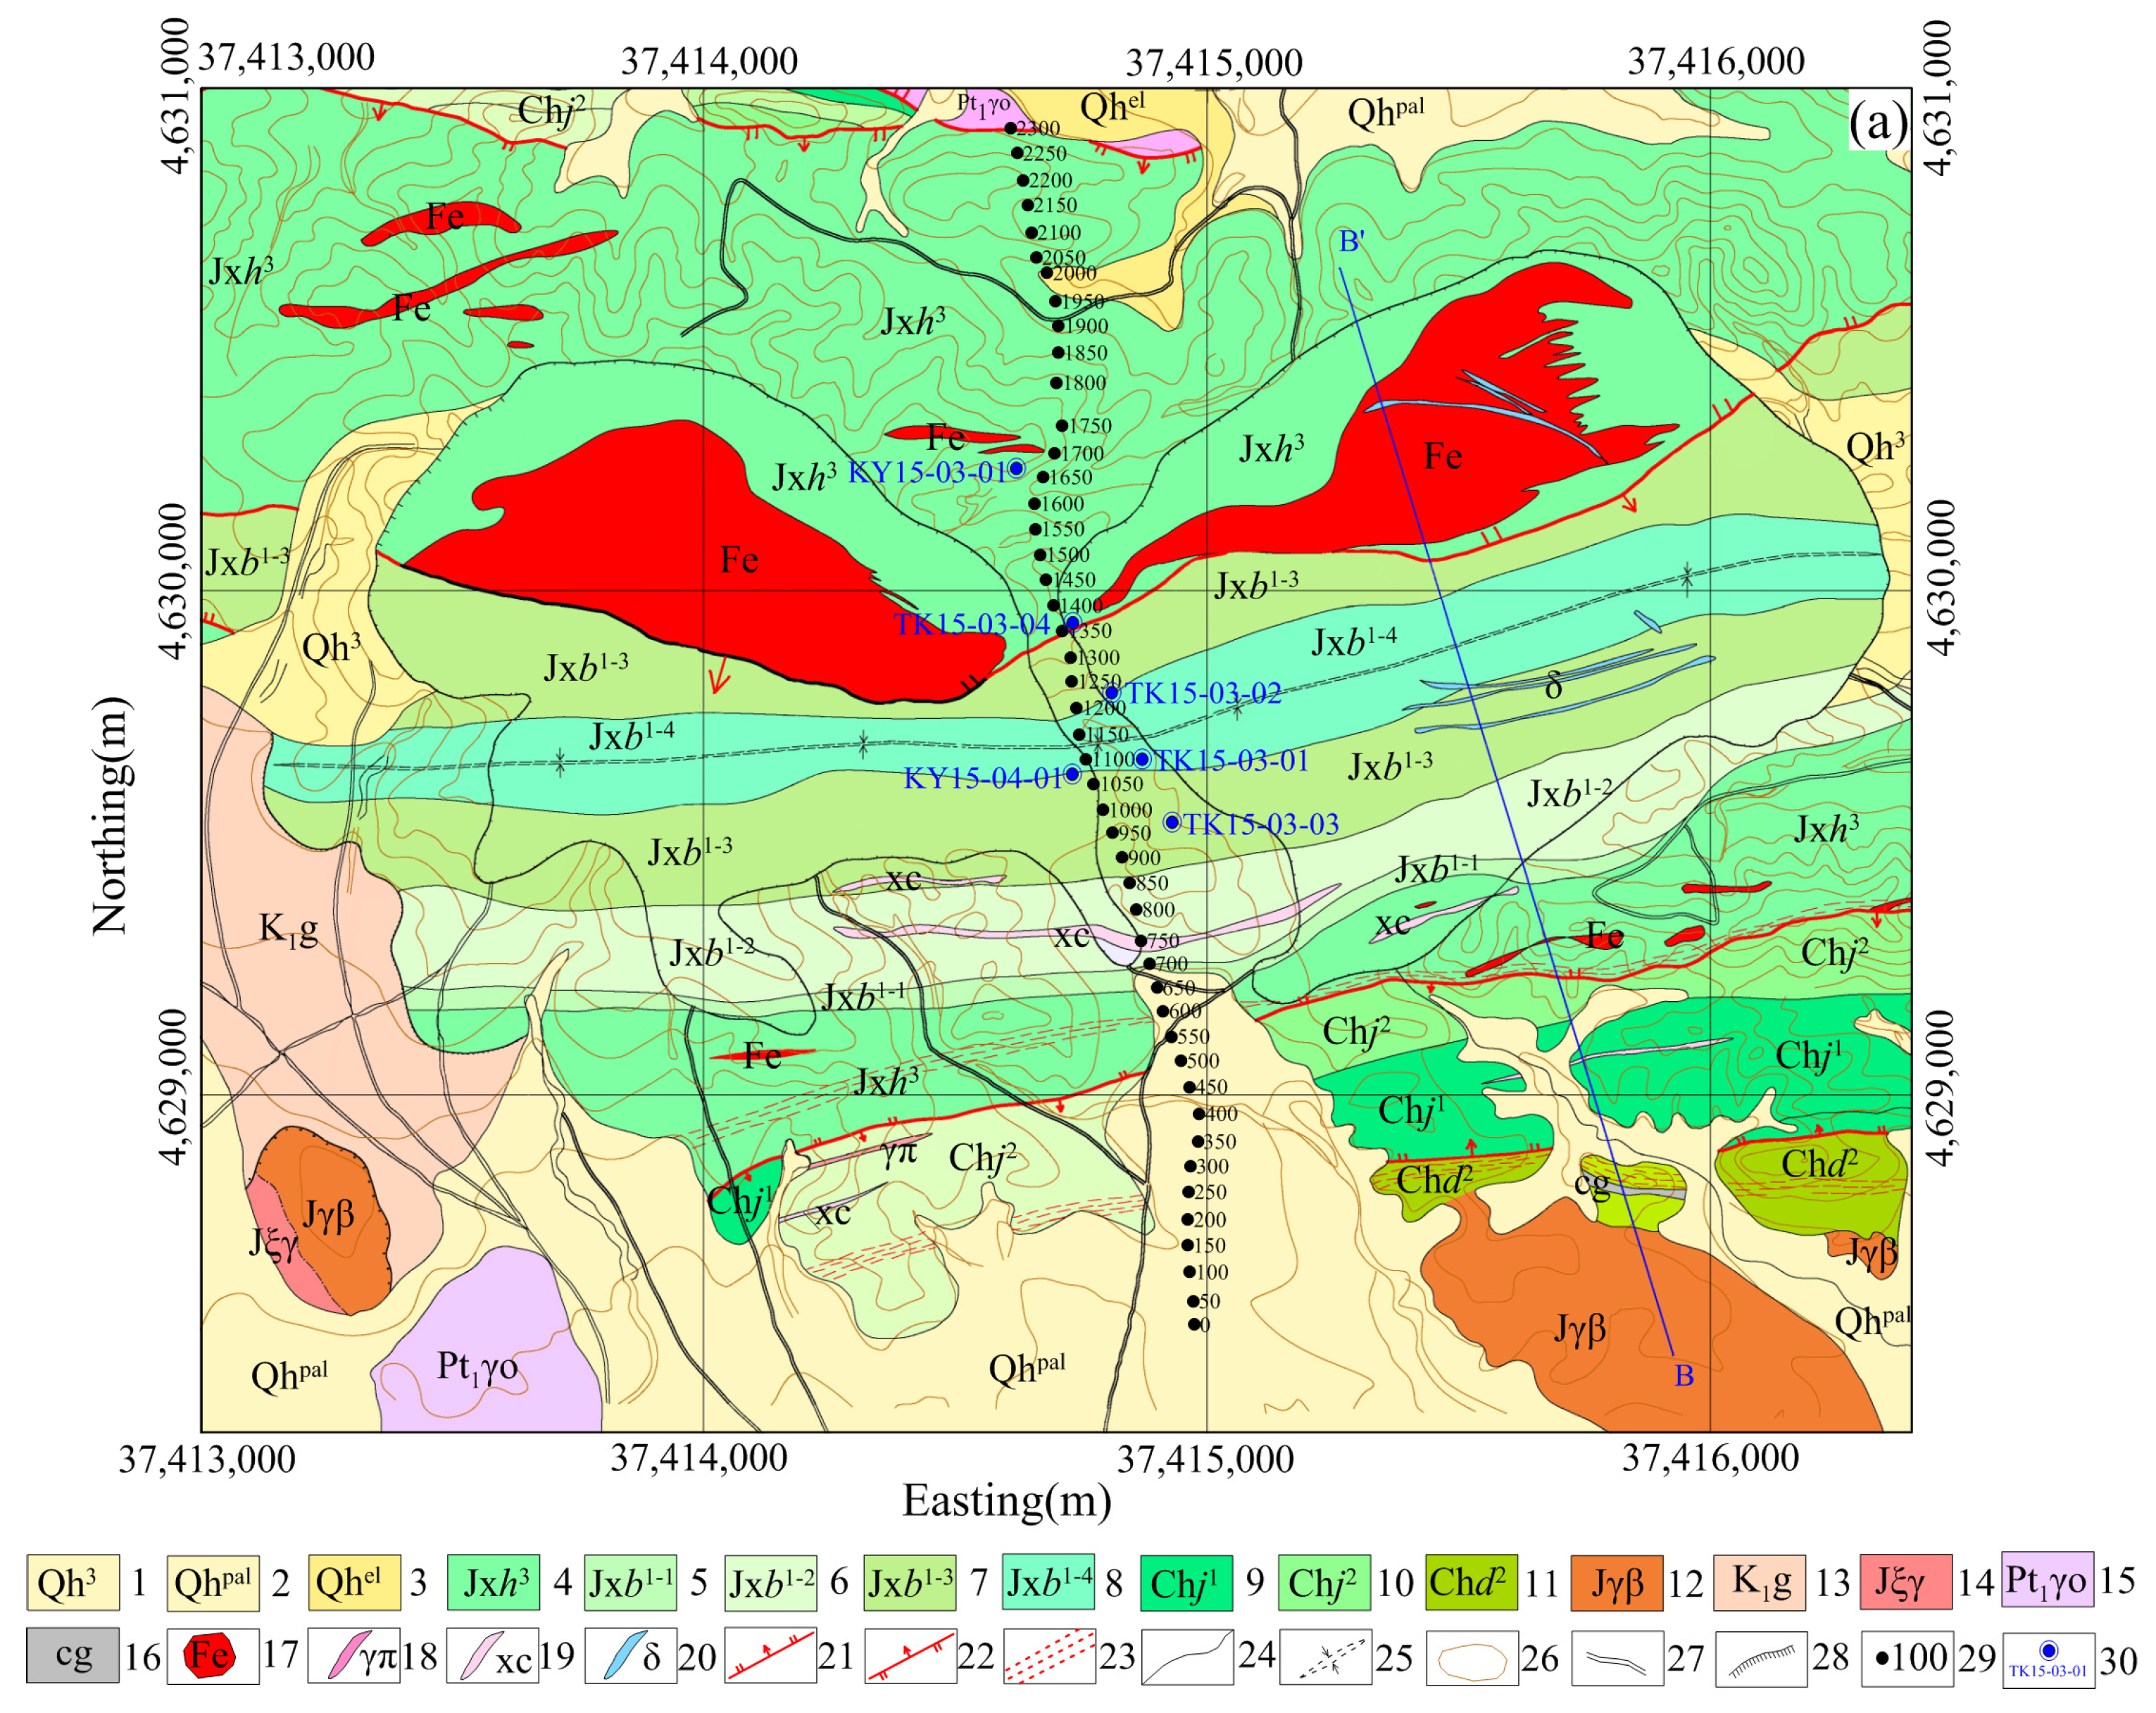
Figure 1 shows the layout of the survey line and source utilized for detection. The survey line extends 2.3 km along Highway 5 between the Main and Eastern mines in a north-to-south direction, with a measuring point distance of 50 m. The source for the CSEM is located close to the west side of the Main mine, with a length of 1910 m and a vertical distance of approximately 2180 m from the survey line. Multiple research boreholes with great depths have been drilled on both sides of Highway 5 and include the sites TK15-03-03 (1441.0 m), KY15-04-01 (1927.0 m), TK15-03-01 (1010.1 m), TK15-03-02 (829.0 m), TK15-03-04 (803.0 m), and KY15-03-01 (1762.75 m). The strata shown by these boreholes serve as crucial evidence for verifying and evaluating subsequent inversion results.
The instrument used in this study consisted of the Tx-40 transmitter, which was developed by the Institute of Geology and Geophysics, Chinese Academy of Sciences, Beijing, China [
49], and the V8
TM multifunction receiver produced by Phoenix Geophysics, Toronto, Canada. The Tx-40 transmitter had a maximum power output of 40 kW and a maximum current transmission capability of 50 A. A magnetic rods sensor with an effective receiving area of 10,000 m
2 was used to measure the vertically induced voltage. The base frequency of the transmitting current was set to 2.5 Hz, with an observation delay time window ranging from 0.95 to 95 ms. Due to the high ground resistance in this area, the intensity of the transmitted current reached a maximum of only 30 A.
3.2. Raw Data
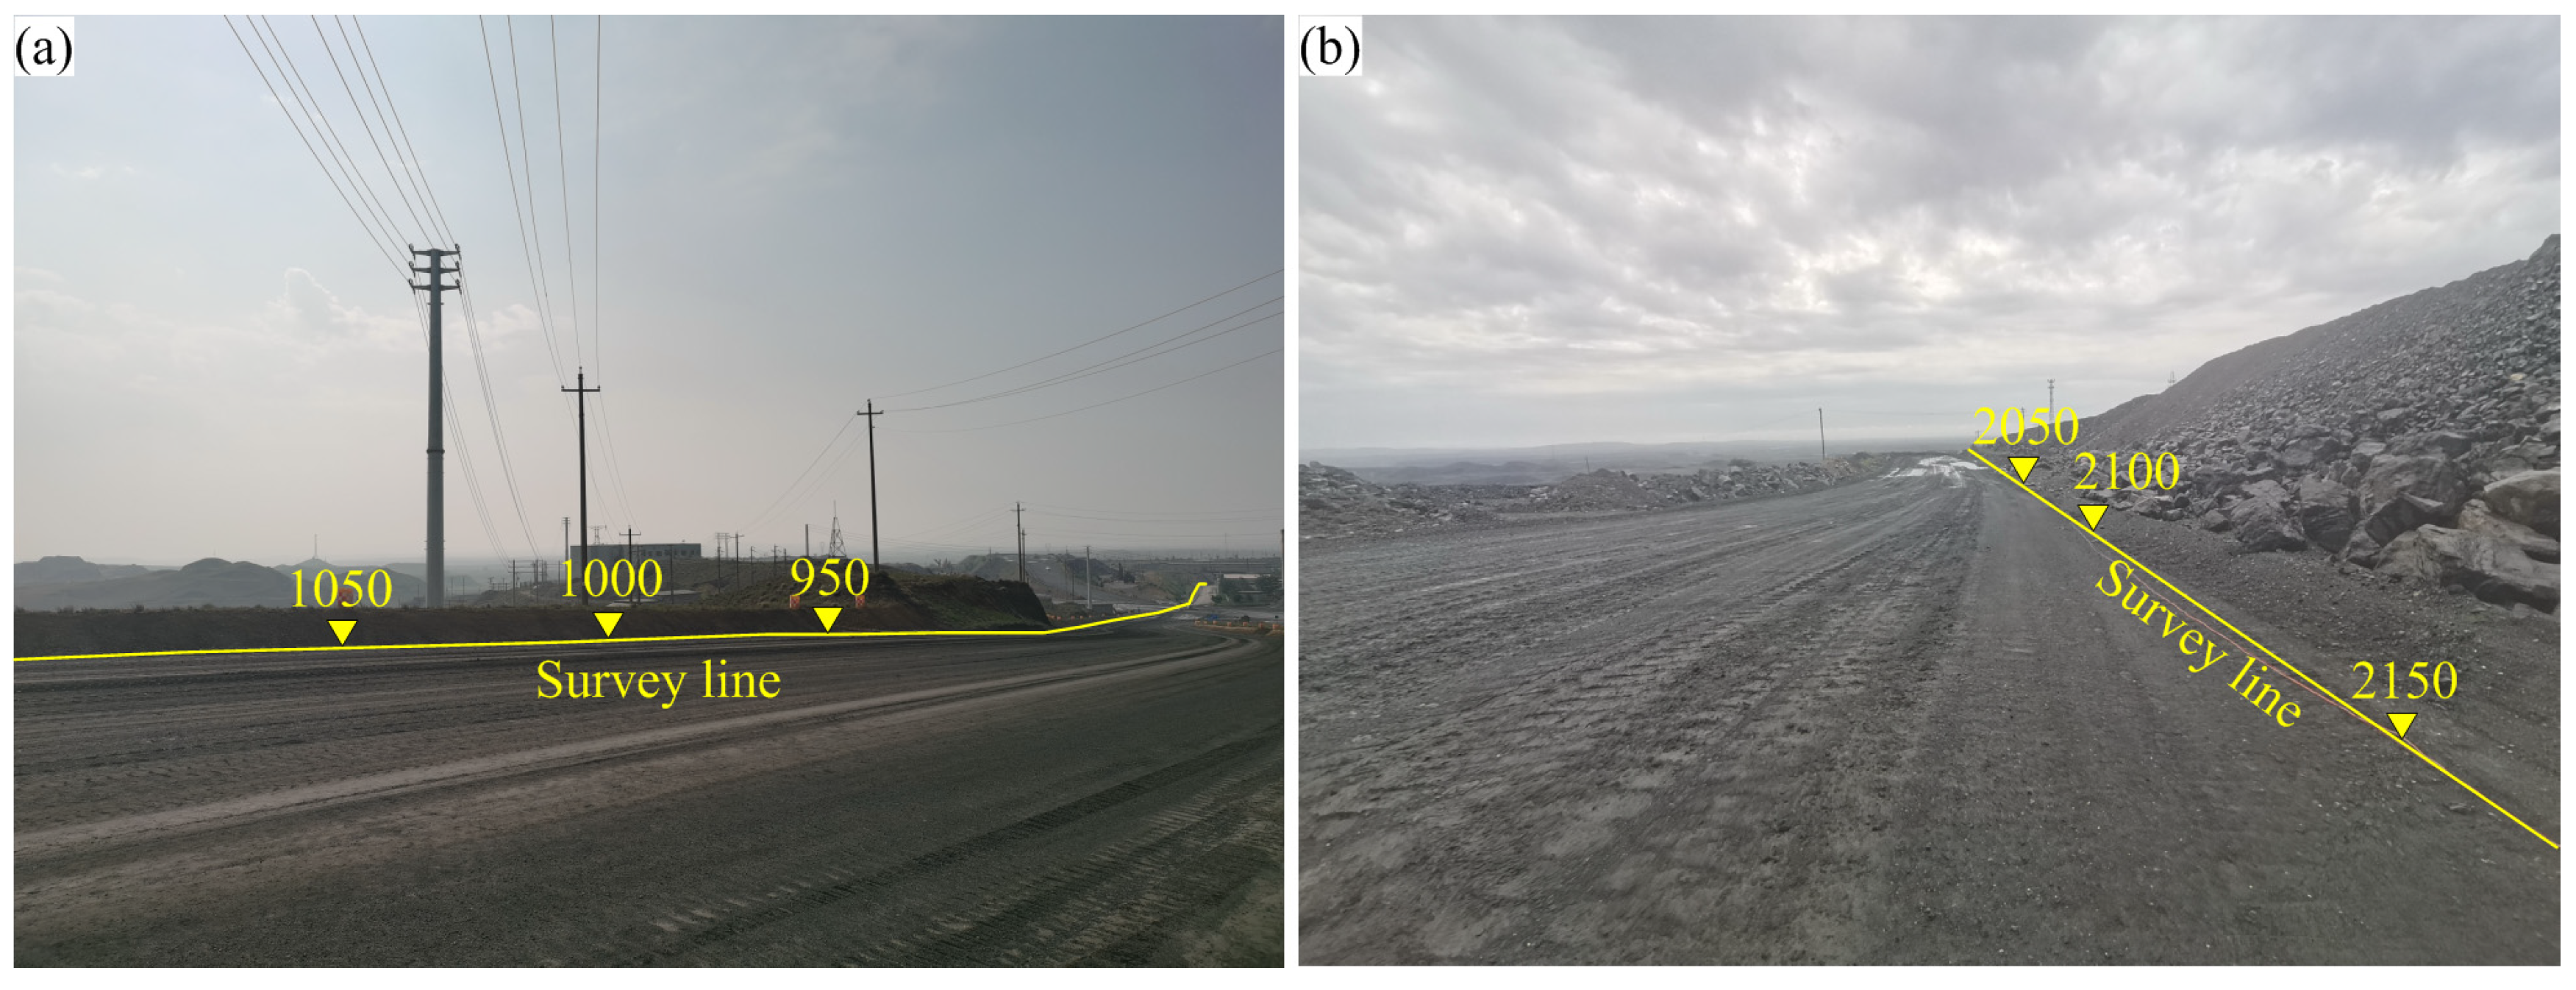
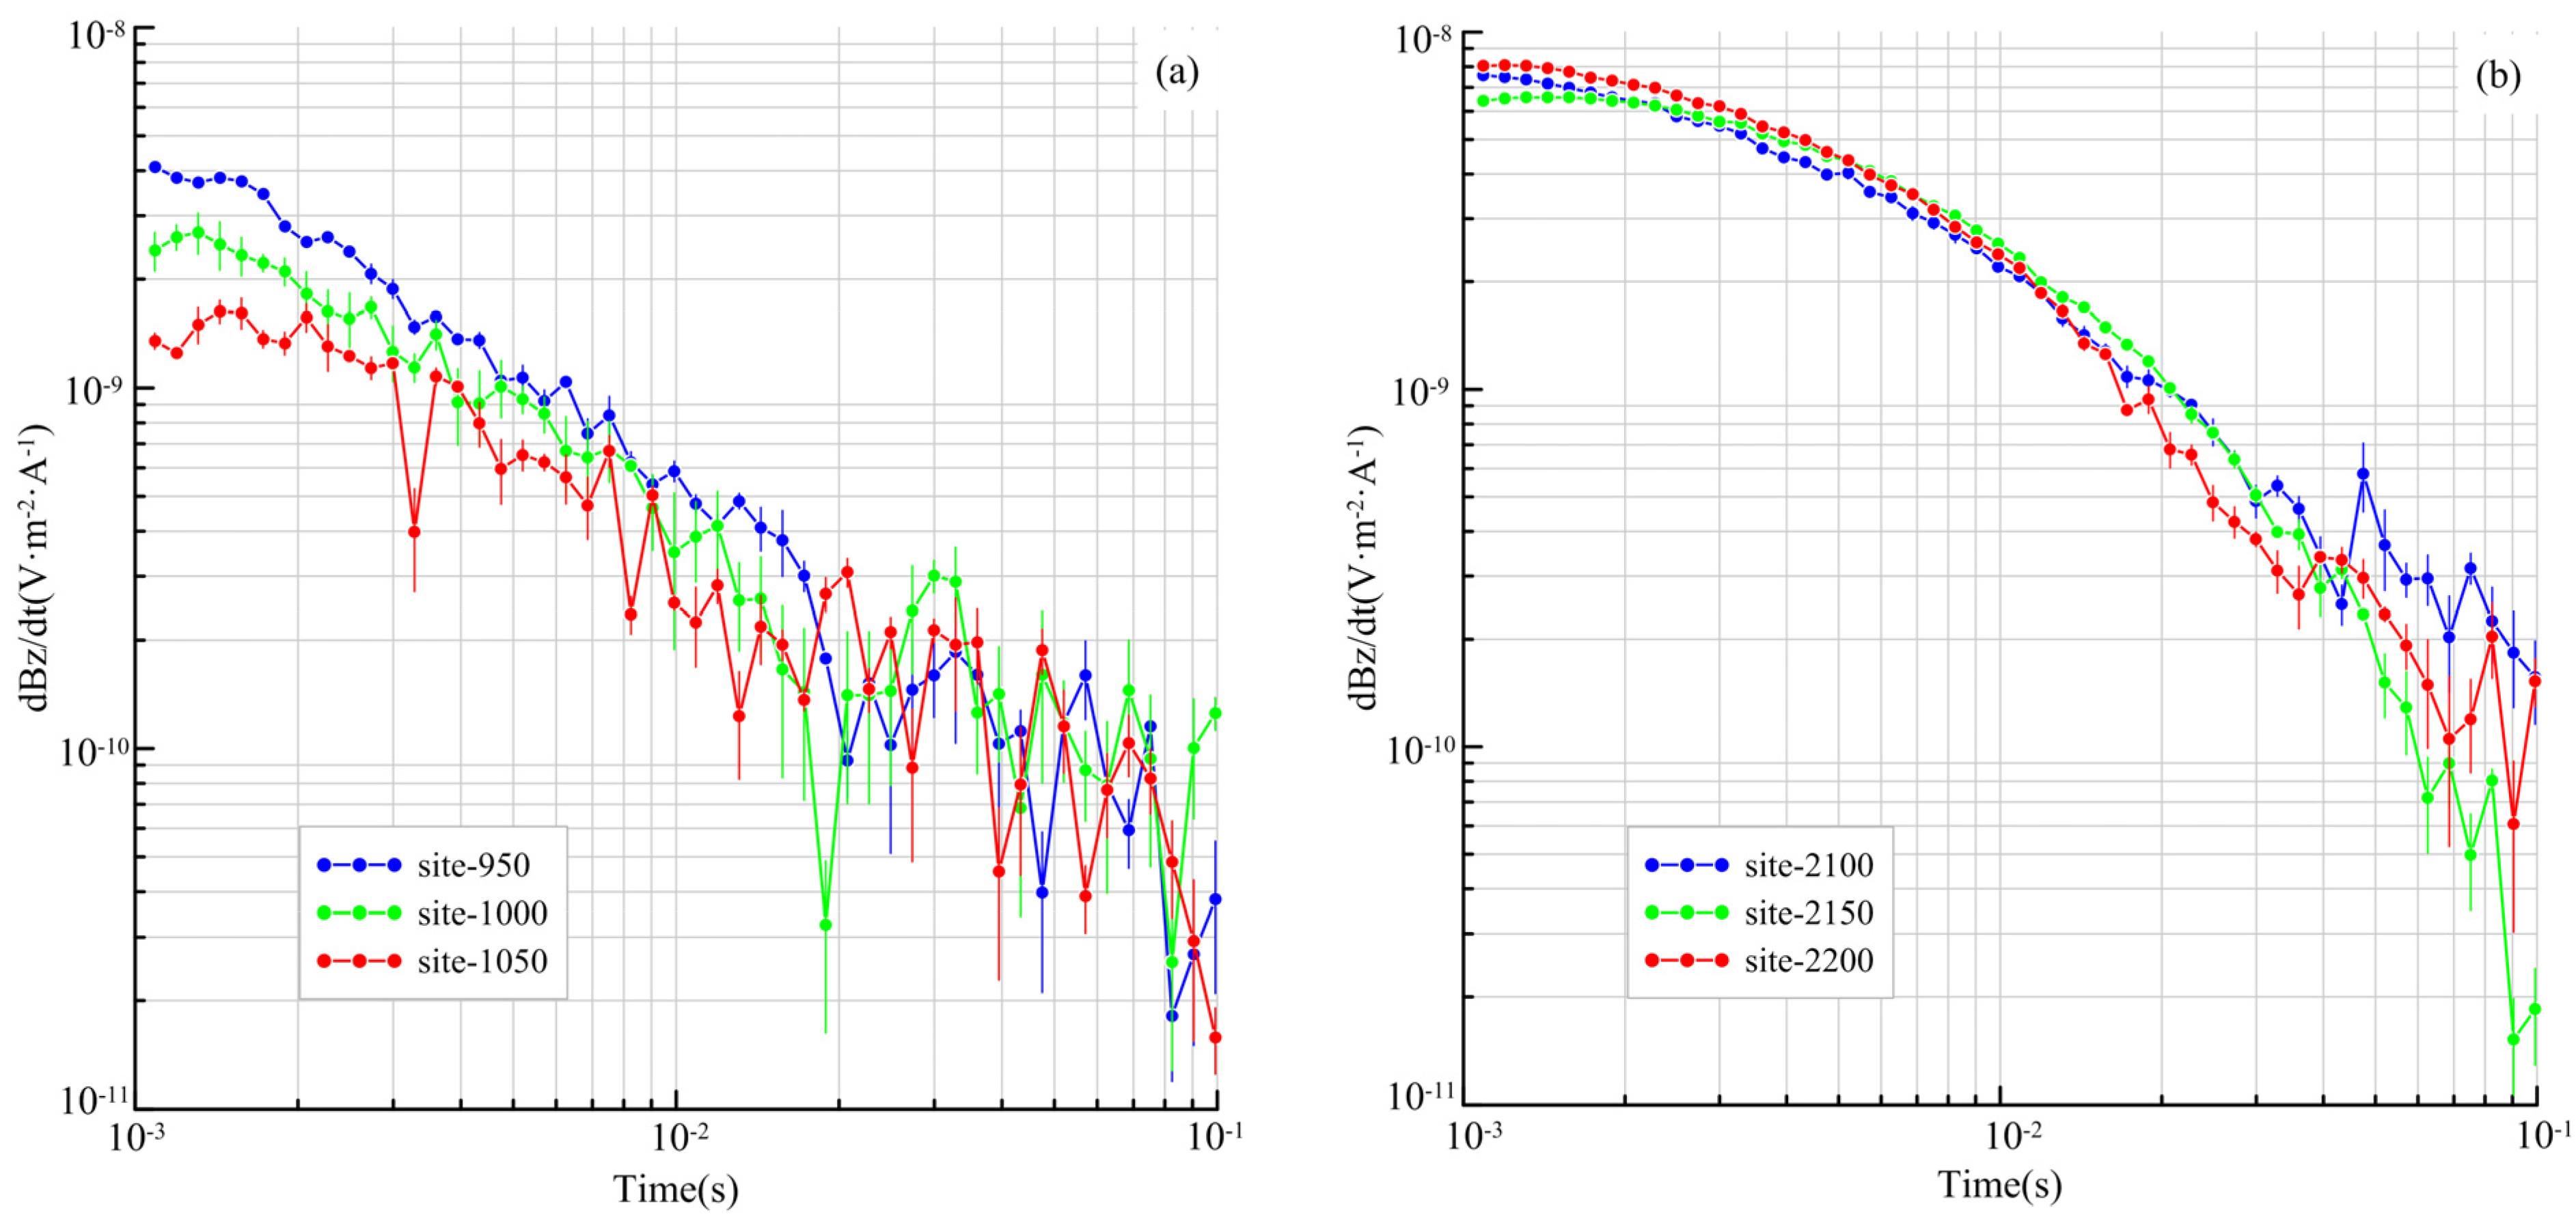
The Bayan Obo mining area experiences significant electromagnetic interference originating from various sources, such as electrified equipment, transmission lines, mining and transportation equipment, and wind turbines located outside the mining area. This high level of electromagnetic background noise adversely affects the observed data. Among the noise sources, the 10 kV power lines running through the middle of the survey line are the most noticeable, as shown in
Figure 2a. The data from the neighboring measuring points are presented in
Figure 3a. Obviously, the observed data are severely affected throughout the entire period. Fortunately, except for the interference area of the power line, no significant noise sources near the other measurement points are observed, as shown in
Figure 2b. The measured signal shows only a slight degree of perturbation in the late time windows where the signal-to-noise ratio (SNR) is generally low (
Figure 3b).
3.3. Data Processing
As previously mentioned, the observed signals are subject to interference, resulting in a low SNR. Thus, prior to inversion, denoising is necessary to ensure that the attenuation pattern of the signal conforms to the normal behavior of the secondary induced electromagnetic field. In this study, we used the wavelet threshold and singular value decomposition algorithm [
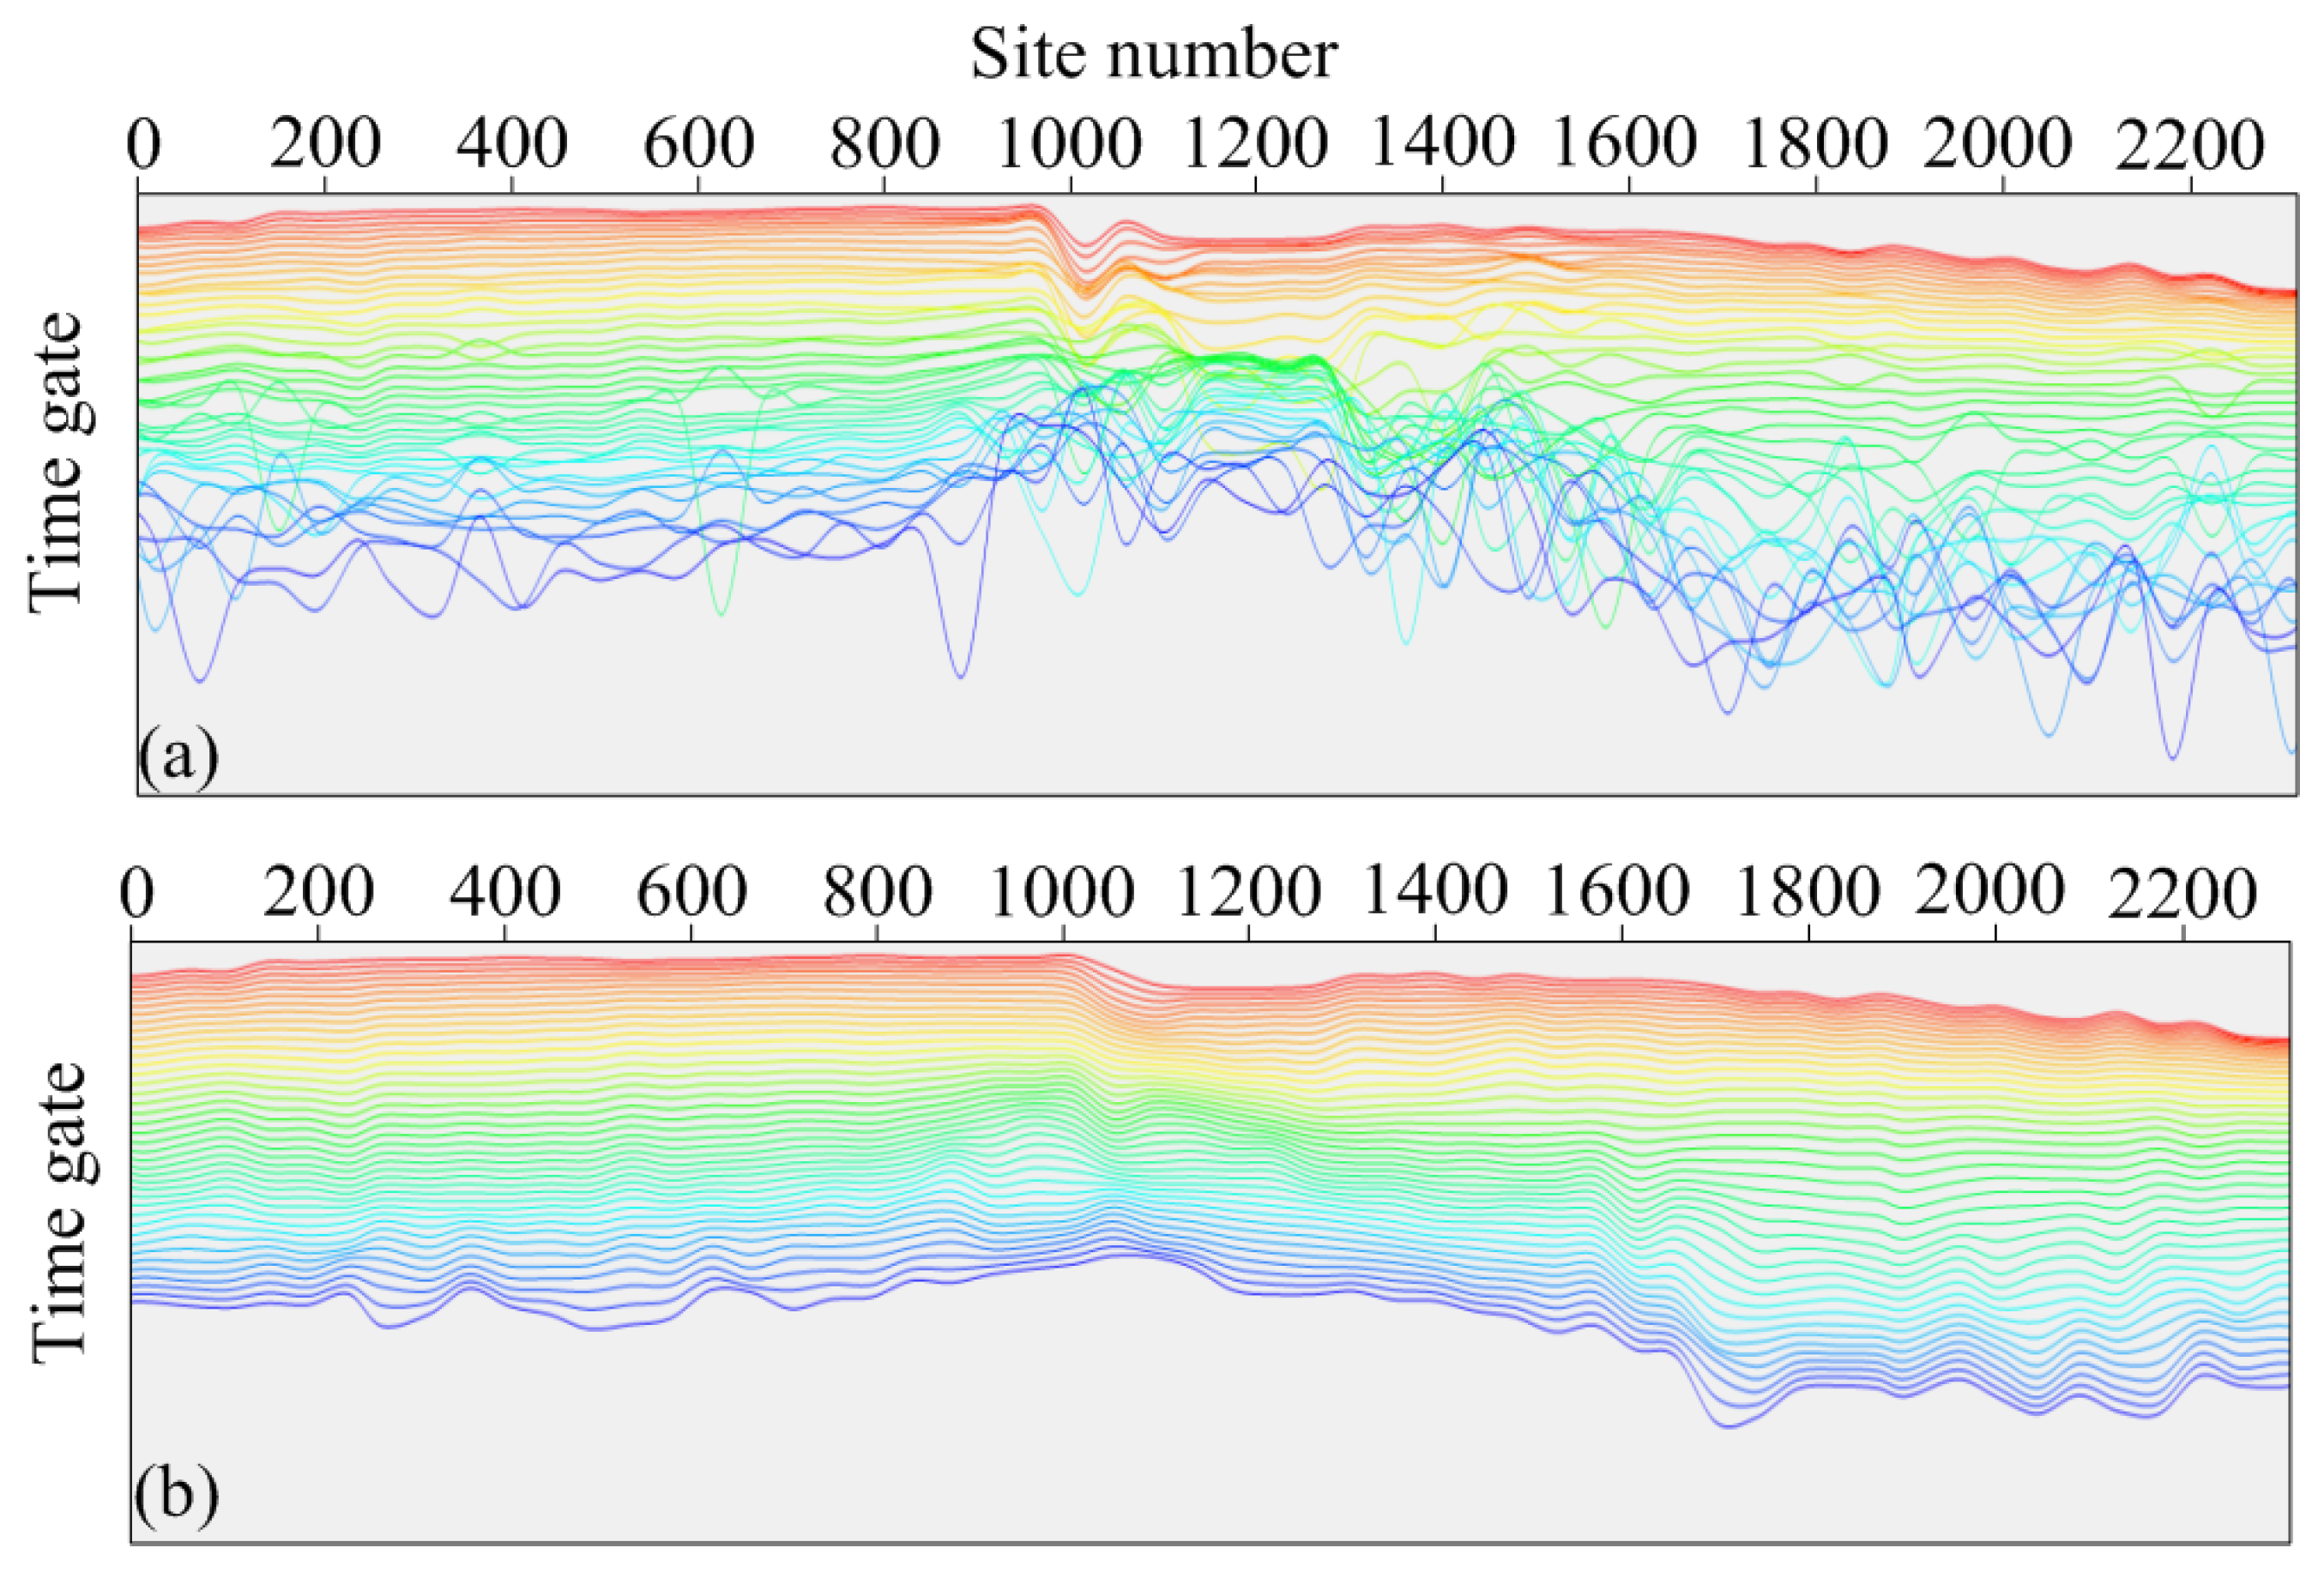
50] to denoise the data from all observation points. As shown in
Figure 4a,b, the multiple-channel curves before and after denoising show a substantial improvement in the attenuation pattern of the transient signal; thus, the obtained denoised data are suitable for further analysis and inversion.
3.4. Data Inversion
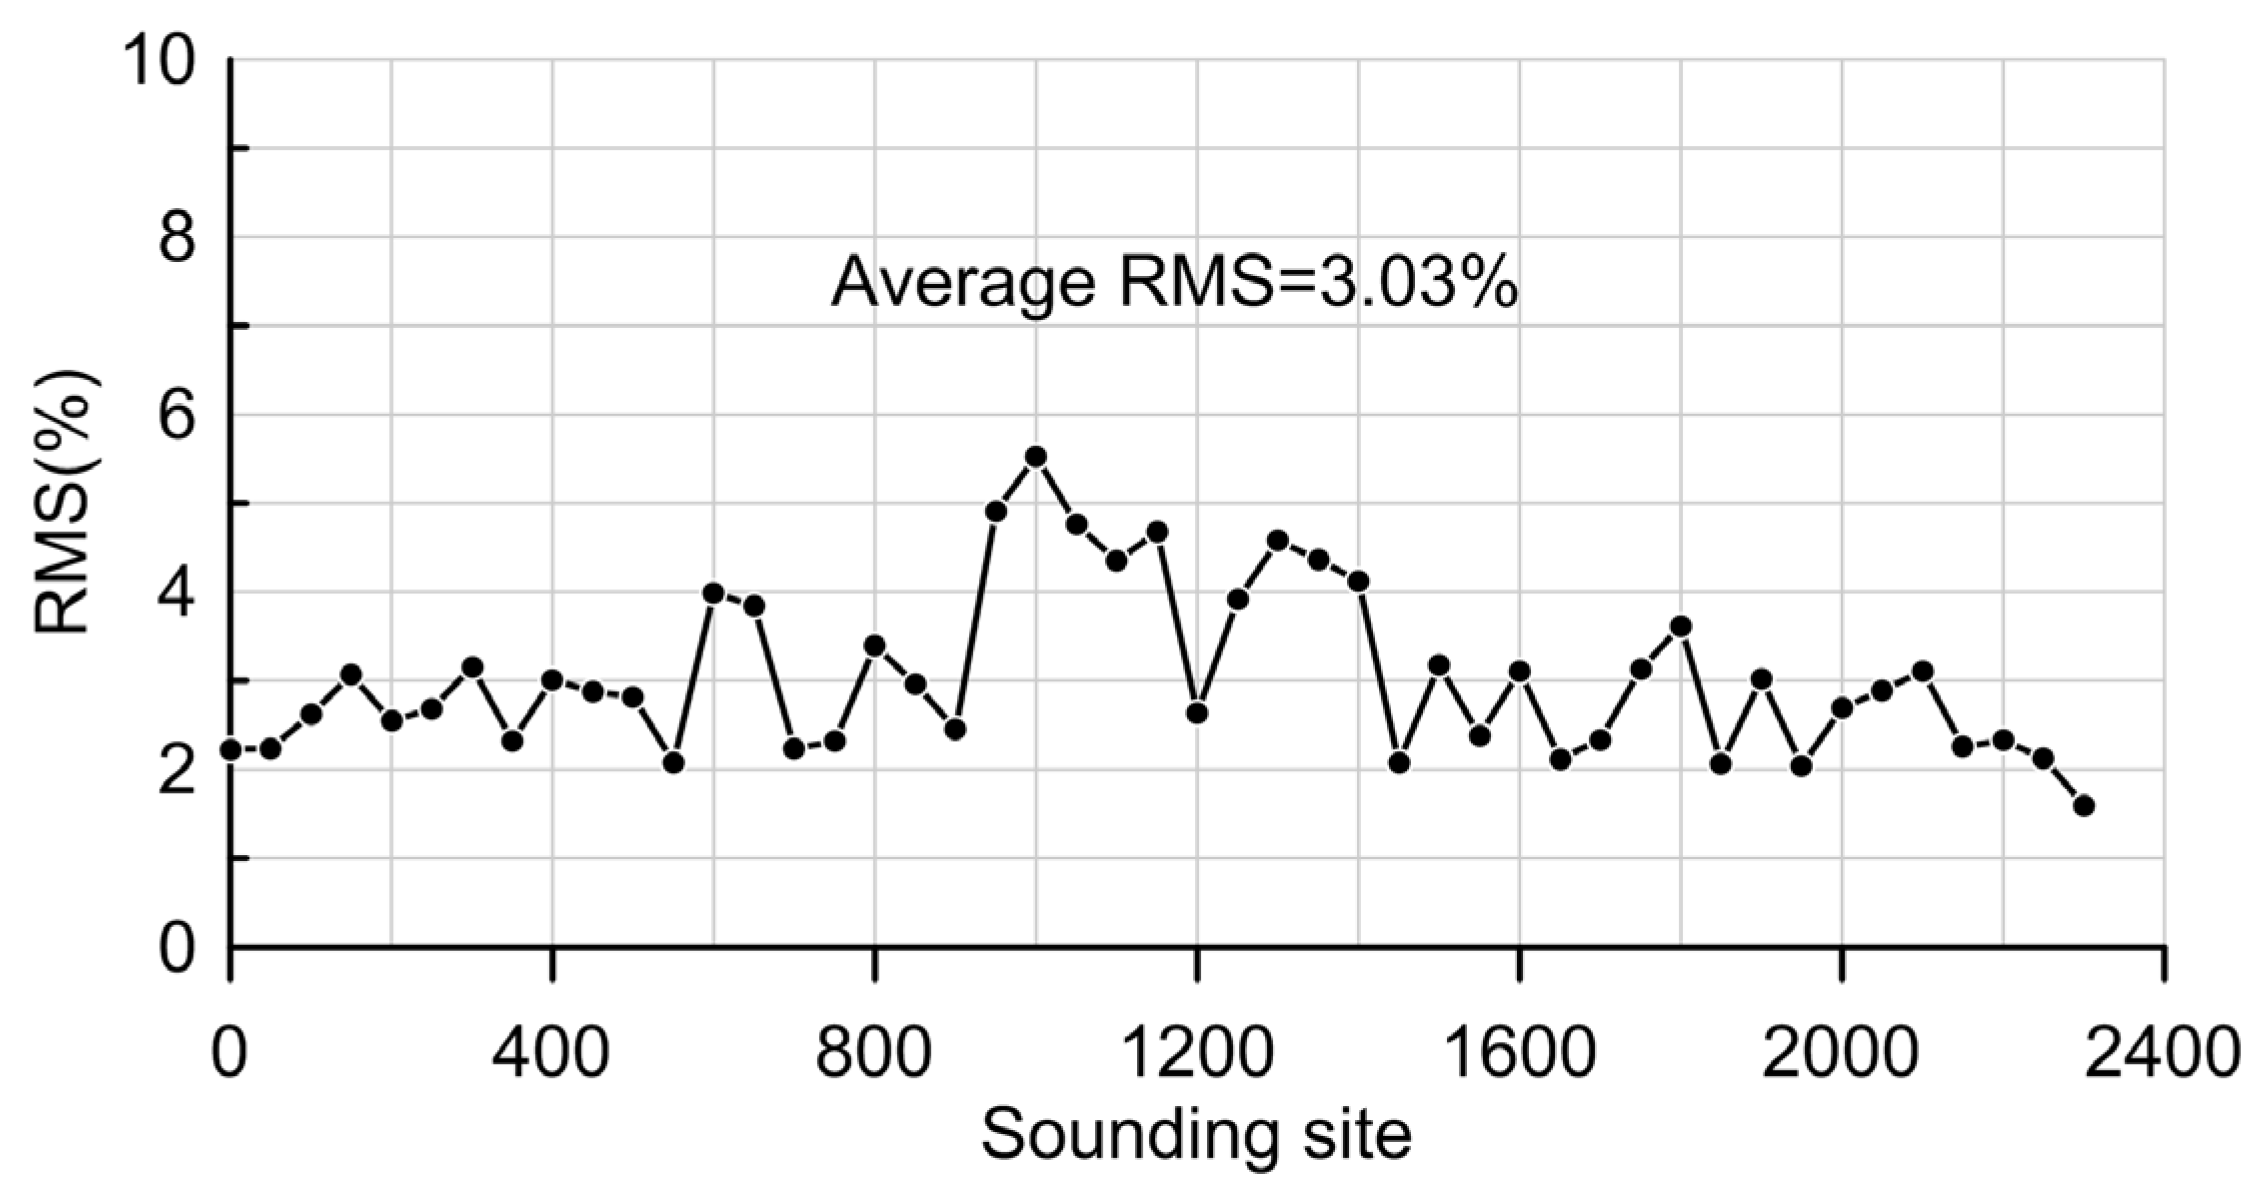
A one-dimensional (1D) inversion approach was used to process the data. The adaptive regularization inversion algorithm (ARIA) [
51] was utilized for all sounding sites, with the same inversion settings. The main parameters included the minimum gradient model constraint, where both the vertical and horizontal constraint factors are set to 1, an initial model of a uniform half space with a resistivity of 100 Ω·m, a maximum model depth of 2740 m and division into 39 layers, a layer thickness increasing by a factor of 1.1 from the previous layer, and an inversion resistivity range of 0.1 to 10,000 Ω·m. After multiple tests, we believe that the fitting residual (RMS) no longer decreases when the number of iterations is greater than or equal to 14. Therefore, we set the number of iterations to 15. The RMS for all sounding sites after 15 iterations is shown in
Figure 5.
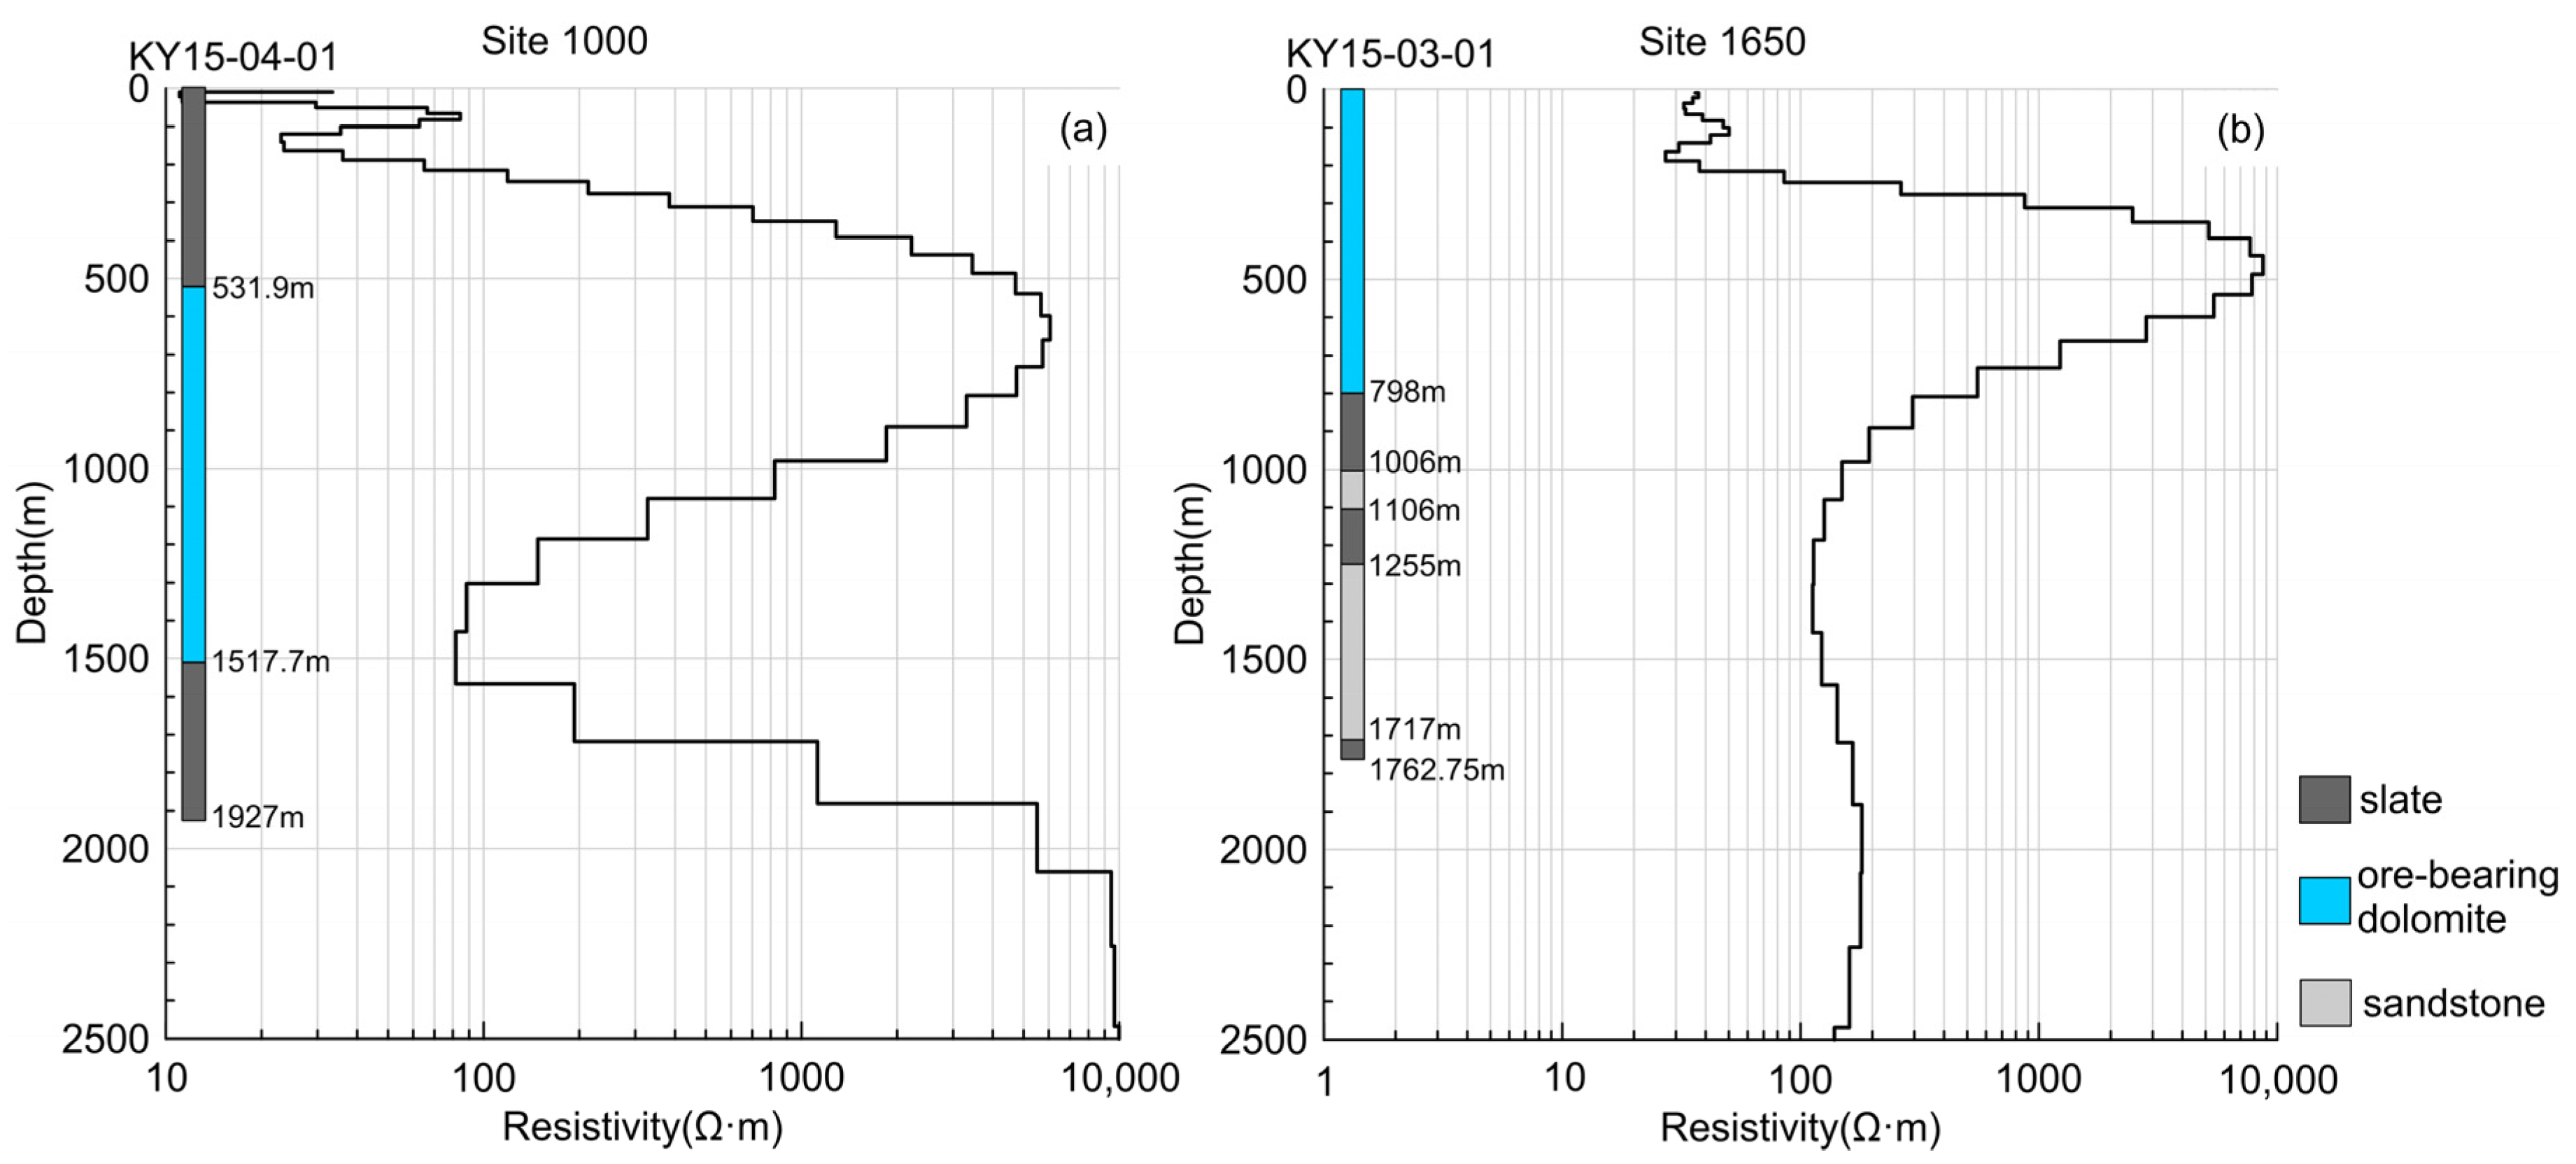
We first conducted an analysis of inversion results obtained from measuring points located near two boreholes: KY15-04-01 and KY15-03-01. Specifically, we compared these results with the formation properties revealed by drilling.
Figure 6 shows the inversion of sites 1000 and 1650, which are near the aforementioned boreholes. Our results indicated that the inversions at both positions exhibited the same trend of formation resistivity. At site 1000, the resistivity of the formation shifted from shallow and deep to low–high–low–high. This shift effectively corresponded with the distribution of slate–dolomite–slate strata that have been exposed by boreholes at depths of up to 2000 m. At site 1650, the resistivity shifted from low–high–low, but in comparison to site 1000, the shallow low-resistivity layer was thinner. This result was consistent with the drillings showing that the shallow part was dolomite; our conjecture was that the deep low resistivity was related to the wide Kuangou fault [
30]. However, it should be noted that the situation with the slate is quite complex. Based on the existing geological information [
7], there are many classifications of slate in the survey area, including carbonaceous slate, siliceous slate, micaceous slate, and mineralized slate. Actual tests have shown that their resistivity ranges vary greatly, with some presenting low resistivity (such as carbonaceous slate and mineralized slate), while others present medium to high resistivity (such as siliceous slate and micaceous slate) [
34]. Therefore, the slate corresponding to the shallow and the deep parts should be of different types, which is why they exhibit different resistivity characteristics. Additionally, since dolomite, mineralized dolomite, and magnetite are all parent rocks of rare earth elements, we consider them as a whole, making them the target of our detection. Thus, the dolomite displayed in the borehole columnar section in the figure actually includes dolomite, mineralized dolomite, and magnetite. As a result, there is also a wide range of variability in their resistivity.
4. Discussion
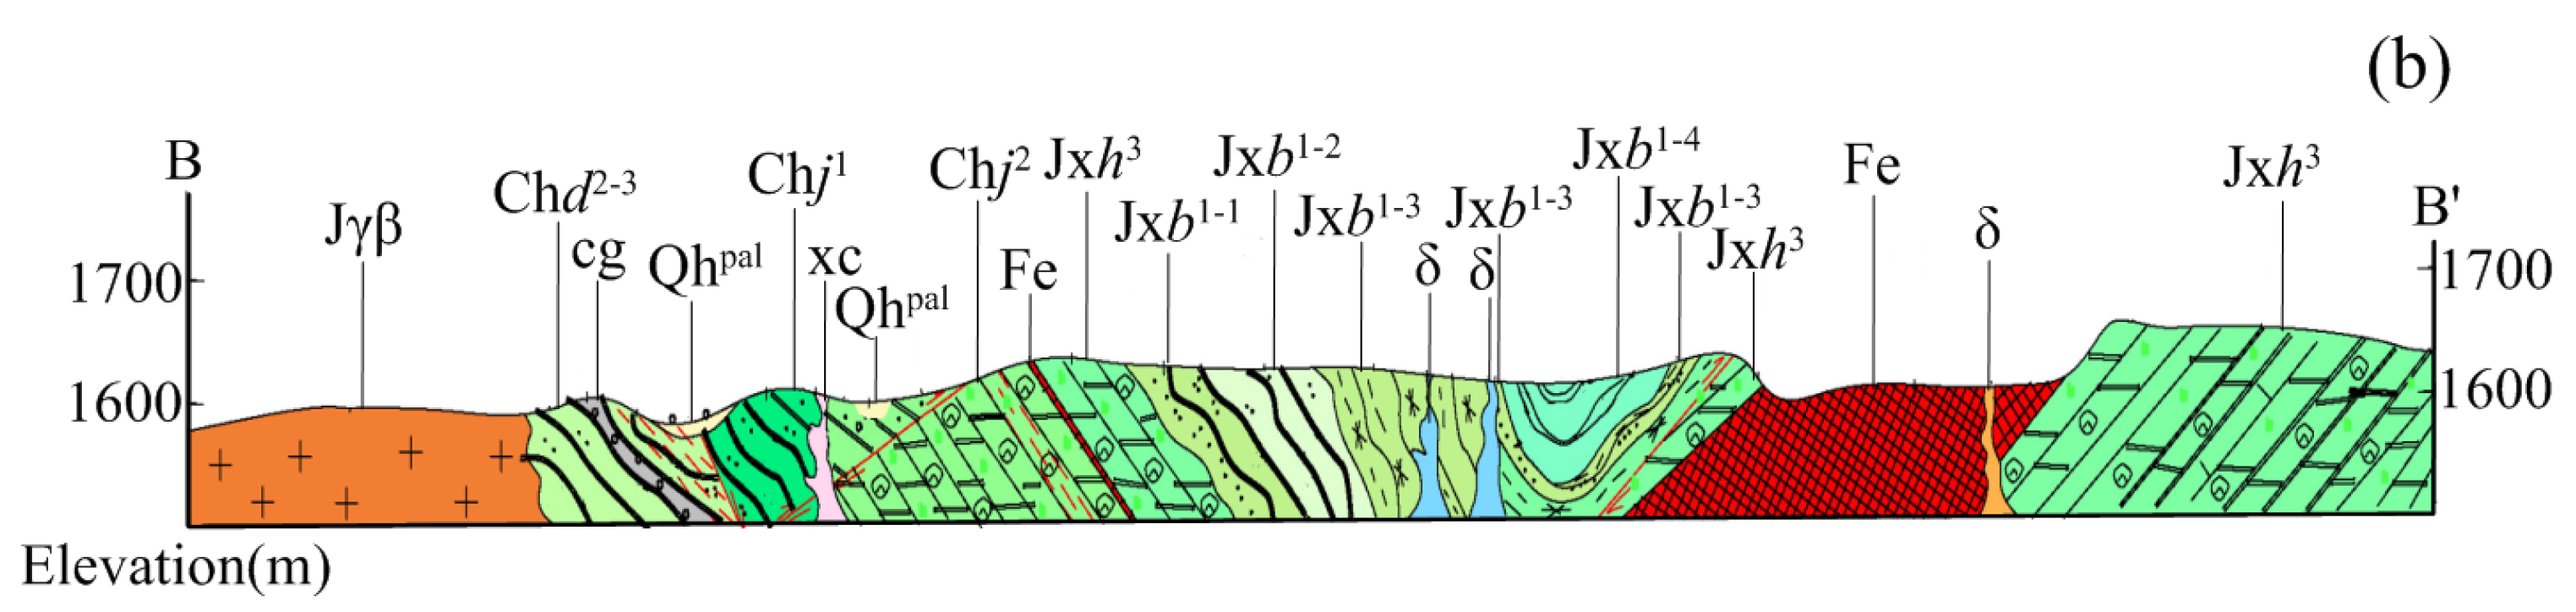
The geological map presented in
Figure 7 shows a significant change in strata from north to south in the Bayan Obo mining region, with the survey line intersecting nearly 11 sections with distinct lithologies. Additionally, except for the Quaternary strata, the dips of the remaining strata are very steep. This complex stratigraphic distribution causes significant challenges in data processing and interpretation via electromagnetic methods.
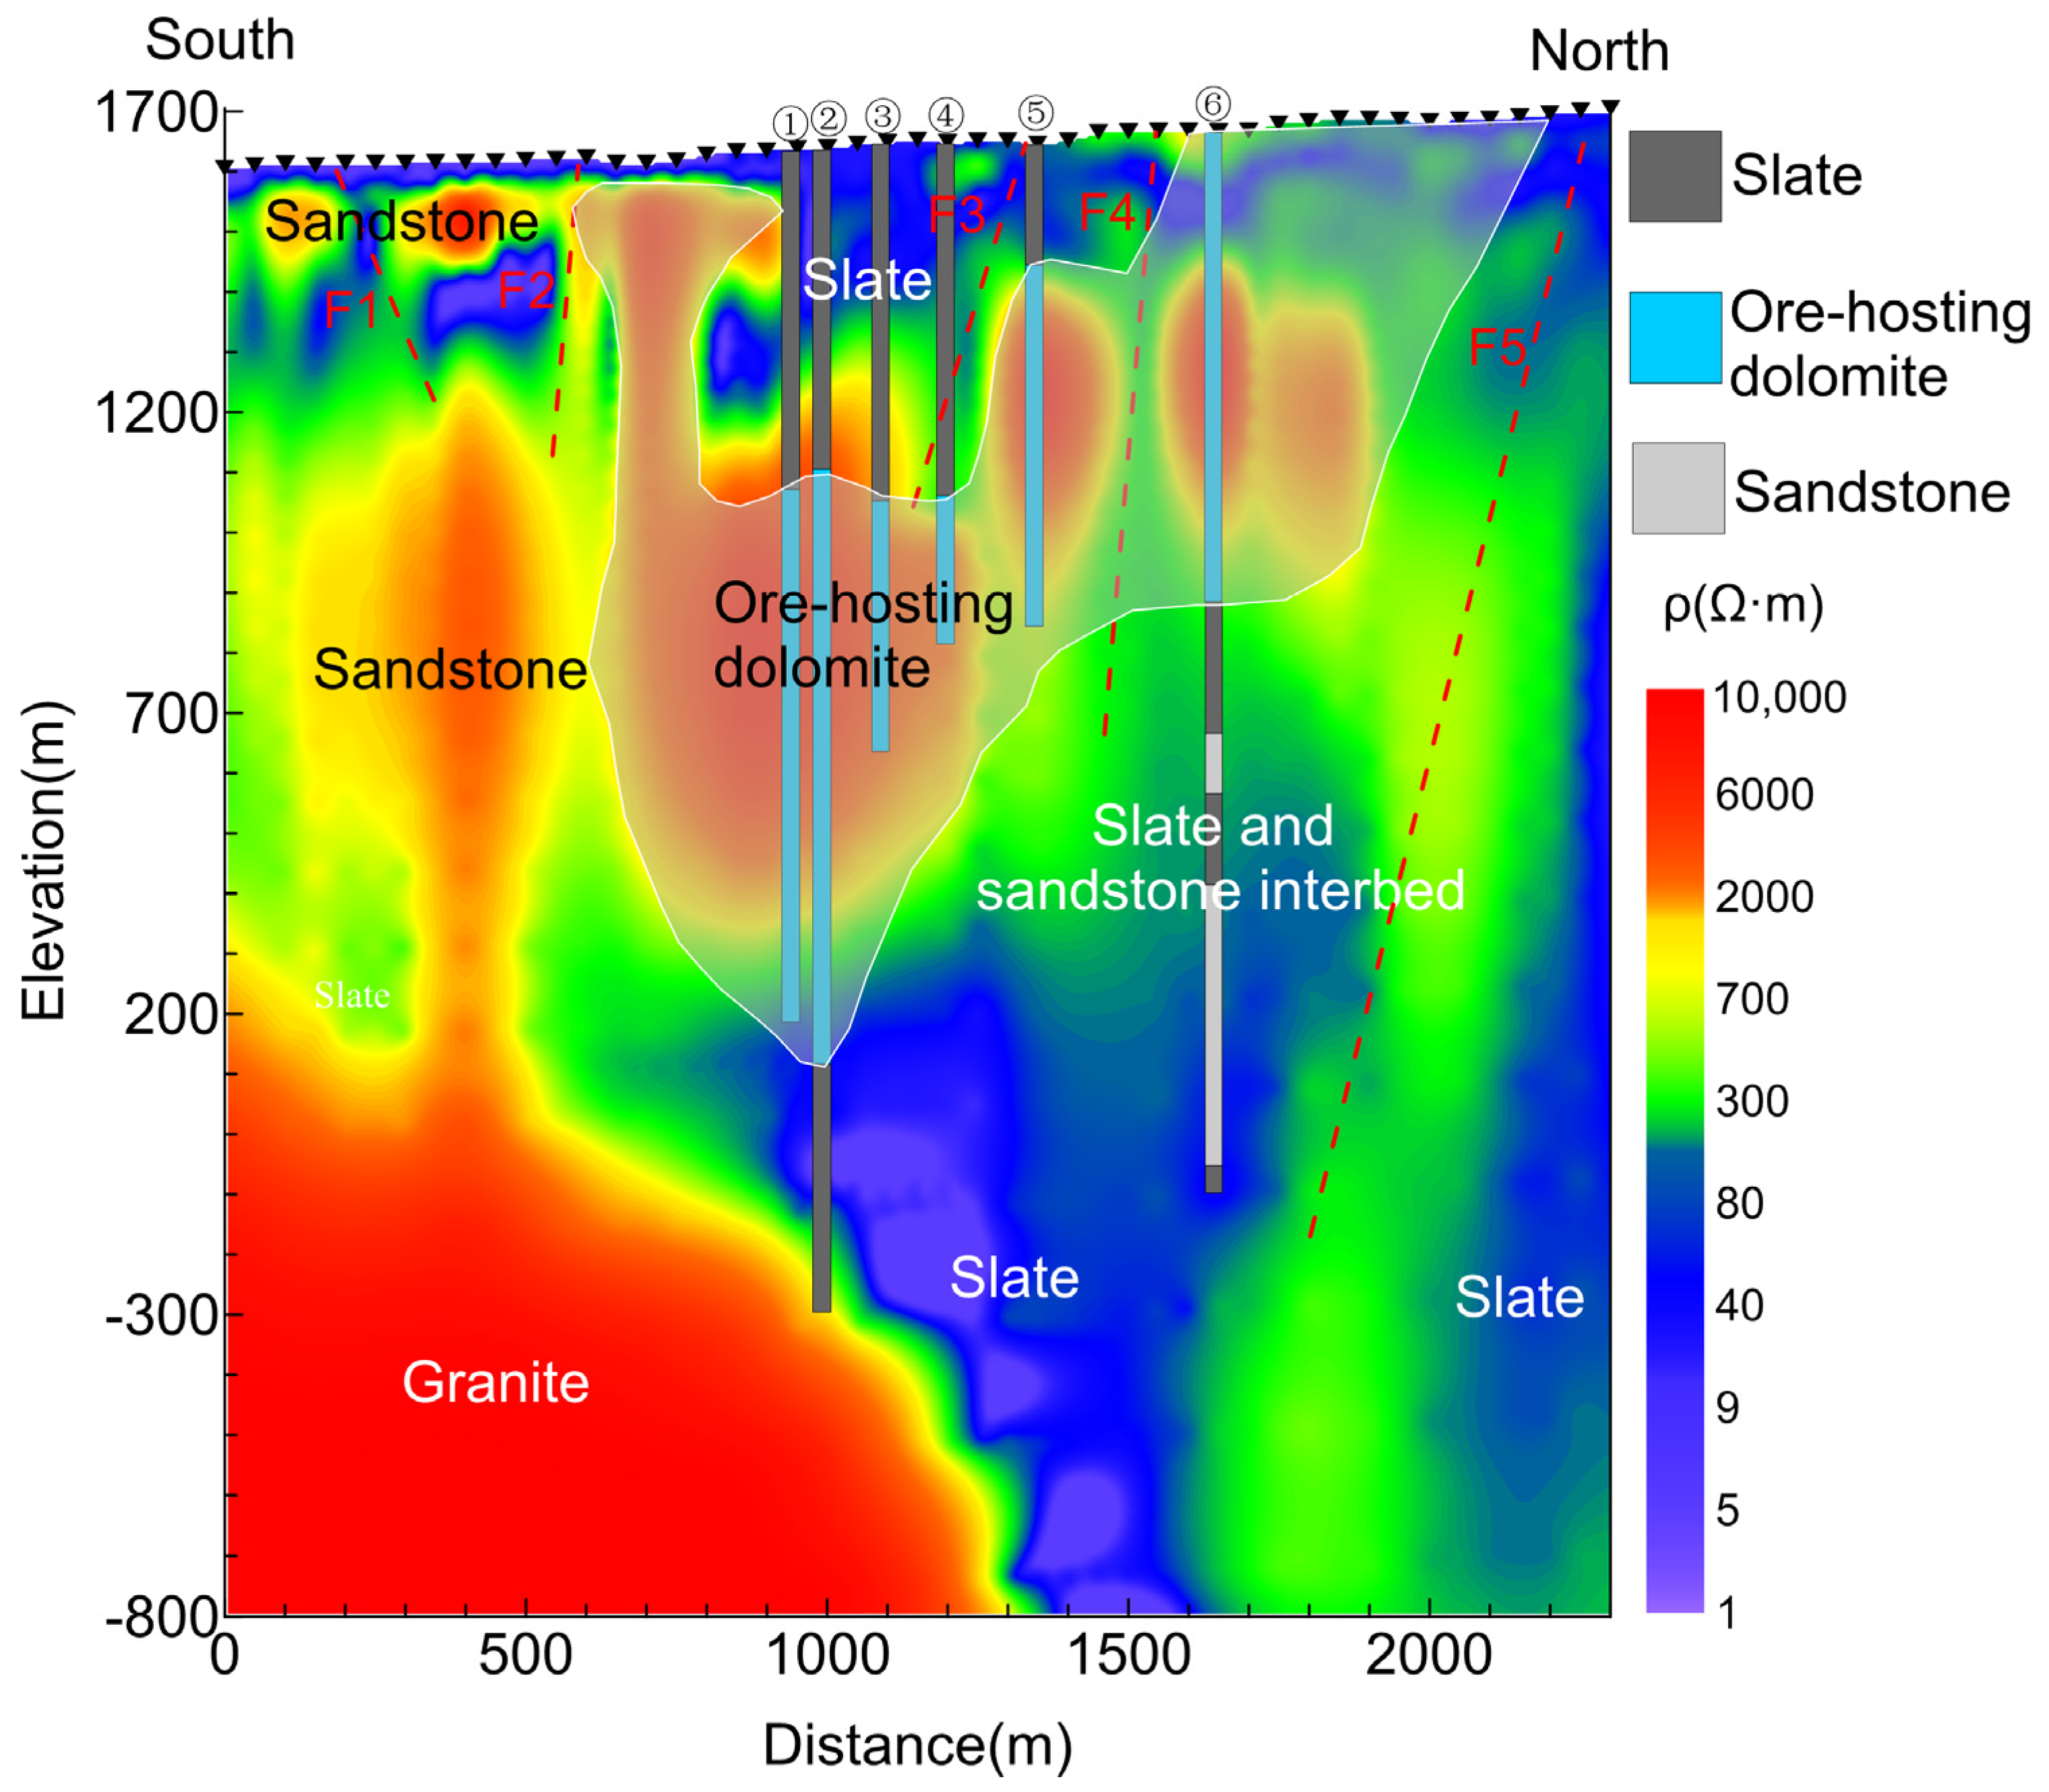
Based on the positional relationship between the measurement sites and the area in which the strata are distributed, the lithologies of anomalous strata with varying resistivity ranges in the profile can be inferred (
Figure 8). The low resistivity values of the shallow surface in the survey area correspond mainly to slate and Quaternary sedimentary strata, and the resistivity of the deep rock gradually increases to form a relatively continuous high-resistivity zone with a horizontal upward trend. The southern end of the survey line is characterized by high resistivity, which indicates the presence of sandstone, whereas the central and northern segments of the line correspond to dolomite. The bands of low resistivity that are segmented by high-resistivity bands are attributed to the broken zones caused by the structure of the fractures. Faults F1–F5 are observed. Among these faults, F1 dips northward with a relatively shallow cutting depth and has previously been considered the southern flank of the Bayan Anticline [
39]. F2–F5 dip southward, and the farther north the fault is, the greater the cutting depth, with F5 being the so-called Kuangou Fault [
38].
The high-resistivity anomaly between elevations of 200 m and 1200 m is generally greater in the north and lower in the south, indicating that the dolomite dips southward, which is consistent with the existing understanding [
32]. Therefore, the mineralized dolomite is located on the southern side of the Kuangou Fault (F5), and its outcrop range and attitude are mainly controlled by nearly east–west-striking faults on both sides. The results of this survey show that the depth of the southern extension of the mineralized dolomite should not exceed 1500 m. Moreover, according to the range and attitude of the mineralized dolomite in the detection results, we suggest that the main and eastern ore bodies were originally connected, but later, multiple tectonic activities caused them to shift and dislocate in situ.
At greater depths, the resistivities of the northern and southern sections of the survey line differ drastically. The deep part of the southern section is highly resistive; we surmise this part to be granite because the southern and eastern parts of the mining area are intruded by a large expanse of late Paleozoic granite. The overall low resistivity of the northern section of the survey line, combined with drilling results, leads us to speculate that they are primarily composed of slate and sandstone, which are situated below the Kuangou Fault (F5) and correspond to the Jiashan Formation that intrudes on the northern side of the mining area.
Based on the overall electrical structural characteristics of the profile, it is difficult to identify any obvious anticlinal folding structures. Overall, the mineralized dolomite presents a slab-like body dipping from north to south, controlled by nearly east–west-striking faults distributed along the top and bottom contacts with surrounding rocks. Although it is now widely believed that the Bayan Obo mineralized dolomite is a product of igneous carbonatite, many scholars are also pursuing magmatic channels for the upwelling of mantle-derived materials [
32]. However, multiple phases of tectonic activity have significantly altered the shape, attitude, and position of the dolomite, and traces of the original magmatic activity have long since disappeared. The results of this survey also did not reveal any distinct magmatic channels, suggesting that the mineralized dolomite appears to “float” above the sandstone, slate (in the north), and granite (in the south).
Despite this, we must still recognize that the lithological variations in the Bayan Obo area are extremely complex, particularly in terms of lateral changes (as shown in
Figure 7). Coupled with the complex effects of topography and intense noise interference, the pure one-dimensional inversion interpretation inherently has unavoidable limitations and errors. Subsequent efforts should integrate the lithology revealed by boreholes, resistivity test results, and topography, among other factors, to carry out three-dimensional forward modeling and analysis. Moreover, a suitable three-dimensional inversion algorithm should be employed to process the actual measurement data.
5. Conclusions
We conducted a time-domain CSEM survey in the region between the Bayan Obo main and eastern mines. By analyzing the inverted resistivity structure alongside geological and drilling data, our conclusions are as follows:
(1) In the Bayan Obo mining area, there is a relatively clear resistivity difference between the main rock types, and electromagnetic methods can be used to effectively delineate the distribution characteristics of subsurface rocks, with mineralized dolomite exhibiting overall high to moderately high resistivity.
(2) The mineralized dolomite overall dips from north to south, with a maximum extension depth not exceeding 1500 m, and its outcrop range is controlled by nearly east–west-striking faults distributed along the top and bottom contacts with surrounding rocks. The main and eastern ore bodies are connected at depth, but multiple phases of tectonic activity have significantly altered the morphology and position of the ore bodies. The electrical structure does not show any obvious anticlinal structures, further negating the traditional view of syncline control in ore formation in the Bayan Obo deposit.
(3) Although the mineralized dolomite is an igneous carbonatite related to magmatic activity, multiple phases of tectonic and granitic intrusion events have erased traces of the original magmatic activity, causing the dolomite to “float” above the sandstone, slate, and granite.
Author Contributions
Conceptualization, W.C.; methodology, W.C. and W.S.; software, W.C.; validation, Y.Z. and W.S.; data acquisition, W.C., W.S., J.S., P.L. and Y.Z.; writing—original draft preparation, W.C. All authors have read and agreed to the published version of the manuscript.
Funding
This research was funded by the Strategic Priority Research Program of the Chinese Academy of Sciences (XDA0430204), the National Natural Science Foundation of China (92262303, 42274192), the Youth Innovation Promotion Association CAS (2023070), and the Joint Funds of State Key Laboratory of Baiyunobo Rare Earth Resource Researches and Comprehensive Utilization (GZ-2023-1-LH-003). And the authors would like to thank the two anonymous reviewers for constructive and detailed comments.
Data Availability Statement
Data associated with this research are available and can be obtained by contacting the corresponding author.
Acknowledgments
We appreciate the editors and reviewers for their valuable comments that greatly improved the paper.
Conflicts of Interest
The authors declare no conflicts of interest.
References
- Summaries, M.C. Mineral Commodity Summaries; U.S. Geological Survey: Reston, VA, USA, 2021.
- Weng, Z.H.; Jowitt, S.M.; Mudd, G.M.; Haque, N. A detailed assessment of global rare earth element resources: Opportunities and challenges. Econ. Geol. 2015, 110, 1925–1952. [Google Scholar] [CrossRef]
- Fan, H.R.; Yang, K.F.; Hu, F.F.; Liu, S.; Wang, K.Y. The giant Bayan Obo REE-Nb-Fe deposit, China: Controversy and ore genesis. Geosci. Front. 2016, 7, 335–344. [Google Scholar] [CrossRef]
- Xie, Y.L.; Hou, Z.Q.; Goldfarb, R.J.; Guo, X.; Wang, L. Rare earth element deposits in China. Rev. Econ. Geol. 2016, 18, 115–136. [Google Scholar]
- Wang, P.; Li, G.W. New minerals found in China (1958–2012). Earth Sci. Front. 2014, 21, 40–51. [Google Scholar]
- Xue, Y.; Sun, N.; Li, G.; Hao, J.; Liu, P.; Song, W.; Li, X.; Shen, J.; Yang, L.; Wang, Z.; et al. Bayanoboite-(Y), IMA 2023-084. Mineral. Mag. 2024, 88, 1–7. [Google Scholar]
- Li, Y.K.; Ke, C.H.; She, H.Q.; Wang, D.H.; Xu, C.; Wang, A.J.; Li, R.P.; Peng, Z.D.; Zhu, Z.Y.; Yang, K.F.; et al. Geology and mineralization of the Bayan Obo supergiant carbonatite-type REE-Nb-Fe deposit in Inner Mongolia, China: A review. China Geol. 2023, 6, 716–750. [Google Scholar]
- Meng, Q.C. Genetic characteristics of carbonate rock deposit in Bayan Obo. Geol. Explor. 1981, 3, 10–17. [Google Scholar]
- Drew, L.J.; Meng, Q.R.; Sun, W.J. The Bayan Obo Iron Rare-Earth Niobium Deposits, Inner-Mongolia, China. Lithos 1990, 26, 43–65. [Google Scholar] [CrossRef]
- Zhang, Z.Q.; Tang, S.; Wang, J.; Yuan, Z.X.; Bai, G. New data of the formation ages for the Bayan Obo REE deposit. Acta Geosci. Sin. 1994, 29, 85–94. [Google Scholar]
- LeBas, M.J.; Spiro, B.; Yang, X.M. Oxygen, carbon and strontium isotope study of the carbonatitic dolomite host of the Bayan Obo Fe-Nb-REE deposit, Inner Mongolia, N China. Mineral. Mag. 1997, 61, 531–541. [Google Scholar] [CrossRef]
- Smith, M.P.; Henderson, P.; Campbell, L.S. Fractionation of the REE during hydrothermal processes: Constraints from the Bayan Obo Fe-REE-Nb deposit, Inner Mongolia, China. Geochim. Cosmochim. Acta 2000, 64, 3141–3160. [Google Scholar] [CrossRef]
- Yang, X.M.; Le Bas, M.J. Chemical compositions of carbonate minerals from Bayan Obo, Inner Mongolia, China: Implications for petrogenesis. Lithos 2004, 72, 97–116. [Google Scholar] [CrossRef]
- Fan, H.R.; Hu, F.F.; Yang, K.F.; Wang, K.Y. Fluid unmixing/immiscibility as an ore-forming process in the giant REE–Nb–Fe deposit, Inner Mongolian, China: Evidence from fluid inclusions. J. Geochem. Explor. 2006, 89, 104–107. [Google Scholar] [CrossRef]
- Fan, H.R.; Hu, F.F.; Yang, K.F.; Pirajno, F.; Liu, X.; Wang, K.Y. Integrated U-Pb and Sm-Nd geochronology for a REE-rich carbonatite dyke at the giant Bayan Obo REE deposit, Northern China. Ore Geol. Rev. 2014, 63, 510–519. [Google Scholar] [CrossRef]
- Song, W.L.; Xu, C.; Smith, M.P.; Chakhmouradian, A.R.; Brenna, M.; Kynicky, J.; Chen, W.; Yang, Y.H.; Deng, V.M.; Tang, H.Y. Genesis of the world’s largest rare earth element deposit, Bayan Obo, China: Protracted mineralization evolution over~1 b.y. Geology 2018, 46, 323–326. [Google Scholar] [CrossRef]
- Yang, K.F.; Fan, H.R.; Pirajno, F.; Li, X.C. The Bayan Obo (China) giant REE accumulation conundrum elucidated by intense magmatic differentiation of carbonatite. Geology 2019, 47, 1198–1202. [Google Scholar] [CrossRef]
- Wei, C.W.; Deng, M.; Xu, C.; Chakhmouradian, A.R.; Smith, M.P.; Kynicky, J.; Song, W.L.; Chen, W.; Fu, B. Mineralization of the Bayan Obo Rare Earth Element Deposit by Recrystallization and Decarbonation. Econ. Geol. 2022, 117, 1327–1338. [Google Scholar] [CrossRef]
- Shen, J.F.; Yan, G.Y.; Zhang, M.M.; Wang, Z.J.; Xu, K.X.; Meng, W.X. REE enrichment process in the Bayan Obo Fe-REE-Nb deposit: Genetic and mineralogical evidence. Earth Sci. Front. 2023, 30, 370–383. [Google Scholar]
- Meng, Q.R. The genesis of the host rock dolomite of the Bayan Obo iron ore deposit and the analysis of its sedimentary environment. Geol. Rev. 1982, 24, 481–489. [Google Scholar]
- Yang, Z.Y.; Drew, L.J. On the hot-water sedimentary origin of dolomite-host rock of Bayan Obo deposit, Inner Mongolia, China. Contrib. Geol. Miner. Resour. Res. 1994, 9, 39–48. [Google Scholar]
- Chao, E.C.T.; Back, J.M.; Minkin, J.A.; Tatsumoto, M.; Wang, J.W.; Conrad, J.E.; McKee, E.H.; Hou, Z.L.; Meng, Q.R.; Huang, S.G. Sedimentary Carbonate-Hosted Giant Bayan Obo REE-Fe-Nb ore Deposit of Inner Mongolia, China; a Cornerstone Example for Giant Polymetallic ore Deposits of Hydrothermal Origin; Bulletin; U.S. G.P.O.: Washington, DC, USA, 1997.
- Le Bas, M.J.; Yang, X.M.; Taylor, R.N.; Spiro, B.; Milton, J.A.; Zhang, P.S. New evidence from a calcite-dolomite carbonatite dyke for the magmatic origin of the massive Bayan Obo ore-bearing dolomite marble, Inner Mongolia, China. Mineral. Petrol. 2007, 90, 223–248. [Google Scholar] [CrossRef]
- Lai, X.D.; Yang, X.Y.; Sun, W.D. Geochemical constraints on genesis of dolomite marble in the Bayan Obo REE-Nb-Fe deposit, Inner Mongolia: Implications for REE mineralization. J. Asian Earth Sci. 2012, 57, 90–102. [Google Scholar] [CrossRef]
- Smith, M.P.; Campbell, L.S.; Kynicky, J. A review of the genesis of the world class Bayan Obo Fe-REE-Nb deposits, Inner Mongolia, China: Multistage processes and outstanding questions. Ore Geol. Rev. 2015, 64, 459–476. [Google Scholar] [CrossRef]
- Chen, W.; Liu, H.Y.; Lu, J.; Jiang, S.Y.; Simonetti, A.; Xu, C.; Zhang, W. The formation of the ore-bearing dolomite marble from the giant Bayan Obo REE-Nb-Fe deposit, Inner Mongolia: Insights from micron-scale geochemical data. Miner. Depos. 2020, 55, 131–146. [Google Scholar] [CrossRef]
- Ni, P.; Zhou, J.; Chi, Z.; Pan, J.Y.; Li, S.N.; Ding, J.Y.; Han, L. Carbonatite dyke and related REE mineralization in the Bayan Obo REE ore field, North China: Evidence from geochemistry, C-O isotopes and Rb-Sr dating. J. Geochem. Explor. 2020, 215, 106560. [Google Scholar] [CrossRef]
- Ling, M.X.; Liu, Y.L.; Williams, I.S.; Teng, F.Z.; Yang, X.Y.; Ding, X.; Wei, G.J.; Xie, L.H.; Deng, W.F.; Sun, W.D. Formation of the world’s largest REE deposit through protracted fluxing of carbonatite by subduction-derived fluids. Sci. Rep. 2013, 3, 1776. [Google Scholar] [CrossRef]
- Liu, Y.; Sun, C.Z.; Cheng, S.P. Exploration and Research History of Bayan Obo Iron Niobium Rare Earth Deposit; Geological Press: Beijing, China, 2019. [Google Scholar]
- Ke, C.H.; Sun, S.; Zhao, Y.G.; Li, Y.K.; Xu, Z.Y.; Hao, M.Z.; Li, R.P.; Zhang, L. Ore-controlling structure and deep prospecting of the Bayan Obo large-sized REE-Nb-Fe ore deposit, Inner Mongolia. Geol. Bull. China 2021, 40, 95–109. [Google Scholar]
- Li, Y.K.; Wang, A.J.; Wang, Y.J. Deep structure Reflection seismic detection in Bayan Obo Ore concentration area, Inner Mongolia. Acta Geol. Sin. 2013, 87, 1–2. [Google Scholar]
- Fan, H.R.; Xu, Y.; Yang, K.F.; Zhang, J.E.; Li, X.C.; Zhang, L.L.; She, H.D.; Liu, S.L.; Xu, X.W.; Huang, S.; et al. Intrusive style, three-dimensional morphology of carbonatite and REE potential resources in the Bayan Obo giant deposit, Inner Mongolia. Acta Petrol. Sin. 2022, 38, 2901–2919. [Google Scholar]
- Xue, G.; Lv, P.; Chen, W.; Li, X.; Xu, Y.; Wu, X.; Wang, J.; Zhao, Y.; Li, X. Determining the location of the Bayan Obo rare earth elements mineralization body by the transfer learning method. Geophysics 2024, 89, WB57–WB66. [Google Scholar] [CrossRef]
- Zhang, L.; Fan, H.; Wang, J.; Zhao, L.; Yang, K.; Xu, Y.; Zhao, Y.; Xu, X.; Hao, M.; Yang, Z.; et al. Physical property characterization of rocks in the Bayan Obo REE-Nb-Fe deposit, China. Geophysics 2024, 89, B147–B160. [Google Scholar] [CrossRef]
- Zhu, D.; Wang, J.; He, L.; Chen, W.; Yang, K.; Li, X.; Xue, G.; Fan, H.; Xu, Y.; Zhang, L.; et al. Constraints and insights into the tectonics of the Bayan Obo deposit from the shallow velocity structure. Geophysics 2024, 89, WB1–WB12. [Google Scholar] [CrossRef]
- Tian, P.; Yang, X.; Yuan, W. Formation and preservation of the Bayan Obo Fe-REE-Nb deposit, Inner Mongolia: Insights from evidences of petrogenesis, geochemistry and apatite fission track dating. Solid Earth Sci. 2021, 6, 228–245. [Google Scholar] [CrossRef]
- Xiao, W.J.; Windley, B.F.; Hao, J.; Zhai, M.G. Accretion leading to collision and the Permian Solonker suture, Inner Mongolia, China: Termination of the central Asian orogenic belt. Tectonics 2003, 22, 1069. [Google Scholar] [CrossRef]
- Bai, G.; Yuan, Z. Geological Characteristics and Genesis of Bayan Obo Deposit; Geological Publishing House: Beijing, China, 1996. [Google Scholar]
- Institute of Geochemistry, Chinese Academy of Sciences. Geochemistry of the Bayan Obo Deposit; Science Press: Beijing, China, 1988. [Google Scholar]
- Yang, K.F.; Fan, H.R.; Santosh, M.; Hu, F.F.; Wang, K.Y. Mesoproterozoic carbonatitic magmatism in the Bayan Obo deposit, Inner Mongolia, North China: Constraints for the mechanism of super accumulation of rare earth elements. Ore Geol. Rev. 2011, 40, 122–131. [Google Scholar] [CrossRef]
- Liu, S.; Ding, L.; Fan, H.R.; Yang, K.F.; Tang, Y.W.; She, H.D.; Hao, M.Z. Hydrothermal genesis of Nb mineralization in the giant Bayan Obo REE-Nb-Fe deposit (China): Implicated by petrography and geochemistry of Nb-bearing minerals. Precambrian Res. 2020, 348, 105864. [Google Scholar] [CrossRef]
- Kuebler, C.; Simonetti, A.; Chen, W.; Simonetti, S.S. Boron isotopic investigation of the Bayan Obo carbonatite complex: Insights into the source of mantle carbon and hydrothermal alteration. Chem. Geol. 2020, 557, 119859. [Google Scholar] [CrossRef]
- Hao, M.Z.; Zhao, Y.G.; Zhang, S.; Yang, J.J.; Wang, K.Y. Study on the variation of the main ore body form and deep prospecting direction of the giant Bayan Obo Nb-Fe-REE iron ore deposit. Geol. Surv. Res. 2018, 41, 167–175. [Google Scholar]
- Strack, K.M. Exploration with Deep Transient Electromagnetics; Elsevier: Amsterdam, The Netherlands, 1992. [Google Scholar]
- Di, Q.Y.; Xue, G.Q.; Yin, C.C.; Li, X. New methods of controlled-source electromagnetic detection in China. Sci. China-Earth Sci. 2020, 63, 1268–1277. [Google Scholar] [CrossRef]
- Xue, G.Q.; Chen, W.Y.; Wu, X. Theory and Application of Grounded-Wire Source Short-Offset Transient Electromagnetic Method; Science Press: Beijing, China, 2022. (In Chinese) [Google Scholar]
- Xue, G.Q.; Chen, W.Y.; Zhou, N.N.; Li, H. Short-offset TEM technique with a grounded wire source for deep sounding. Chin. J. Geophys. 2013, 56, 255–261. [Google Scholar]
- Xue, G.; Chen, W.; Wu, X.; Yan, S.; Guo, W. A Near-Source Electromagnetic Method for Deep Ore Explorations. Minerals 2022, 12, 1208. [Google Scholar] [CrossRef]
- Xue, G.Q.; Wu, X.; Chen, W.Y. Research of the Short-Offset TEM (SOTEM) system. Chin. J. Geophys. 2023, 66, 3514–3523. [Google Scholar]
- Lv, P.F.; Wu, X.; Zhao, Y.; Chang, J.H. Noise removal for semi-airborne data using wavelet threshold and singular value decomposition. J. Appl. Geophys. 2022, 201, 104622. [Google Scholar] [CrossRef]
- Chen, W.Y.; Xue, G.Q. Data processing software SOTEMsoft for electric source short-offset transient electromagnetic. J. Earth Sci. Environ. 2021, 43, 1050–1056. [Google Scholar]
| Disclaimer/Publisher’s Note: The statements, opinions and data contained in all publications are solely those of the individual author(s) and contributor(s) and not of MDPI and/or the editor(s). MDPI and/or the editor(s) disclaim responsibility for any injury to people or property resulting from any ideas, methods, instructions or products referred to in the content. |
© 2024 by the authors. Licensee MDPI, Basel, Switzerland. This article is an open access article distributed under the terms and conditions of the Creative Commons Attribution (CC BY) license (https://creativecommons.org/licenses/by/4.0/).


 ,
, 


